Article

Effect of Nitric and Oxalic Acid Addition on Hard Anodizing of AlCu4Mg1 in Sulphuric Acid

1
Lockwitzgrund 123a, D-01731 Kreischa, Germany
2
Materials and Surface Engineering Group, Chemnitz University of Technology, D-09107 Chemnitz, Germany
*
Author to whom correspondence should be addressed.
Metals 2018, 8(2), 139; https://doi.org/10.3390/met8020139
Submission received: 15 December 2017 / Revised: 7 February 2018 / Accepted: 13 February 2018 / Published: 17 February 2018

Abstract

:
The anodic oxidation process is an established means for the improvement of the wear and corrosion resistance of high-strength aluminum alloys. For high-strength aluminum-copper alloys of the 2000 series, both the current efficiency of the anodic oxidation process and the hardness of the oxide coatings are significantly reduced in comparison to unalloyed substrates. With regard to this challenge, recent investigations have indicated a beneficial effect of nitric acid addition to the commonly used sulphuric acid electrolytes both in terms of coating properties and process efficiency. The present work investigates the anodic oxidation of the AlCu4Mg1 alloy in a sulphuric acid electrolyte with additions of nitric acid as well as oxalic acid as a reference in a full-factorial design of experiments (DOE). The effect of the electrolyte composition on process efficiency, coating thickness and hardness is established by using response functions. A mechanism for the participation of the nitric acid additive during the oxide formation is proposed. The statistical significance of the results is assessed by an analysis of variance (ANOVA). Eventually, scratch testing is applied in order to evaluate the failure mechanisms and the abrasion resistance of the obtained conversion coatings.

1. Introduction

The anodic oxidation process is a suitable means for the surface refinement of aluminum and its alloys. The formation of an oxide ceramic coating under anodic polarization in an acidic electrolyte leads to an increased corrosion and wear resistance, enhances haptic-visual properties and depending on the process regime, provides certain other surface property alterations like electrical insulation. Anodic oxide coatings with a particularly low porosity and therefore high hardness and abrasion resistance can be achieved by anodizing in sulfuric acid electrolytes at low temperatures beneath 5 °C due to the reduced chemical dissolution of the oxide. However, the so-called “hard anodizing” process itself is costly and demands the input of substantial amounts of electrical energy for both the process itself and the temperature control of the electrolyte. Another means of reducing the coating porosity lies in the addition of organics to the commonly used sulphuric acid electrolyte. Giovanardi et al. [1] proved that organic additions, e.g., glycolic acid, oxalic acid and glycerol, limit the chemical dissolution of the pore walls by adsorbing at the oxide-solution interface. Although the current efficiency of the process as well as the coatings’ hardness and wear resistance are improved [2], the overall energy consumption is often in the same way increasing, since the mentioned additives increase the process voltage and thus thwart the alleged efficiency improvement [3].
A second challenge for the production of functional oxide coatings arises from the substrate influence. Being conversion coatings, the properties of the alumina coatings produced by anodizing are inevitably affected by the substrate alloy. While improving the material strength, alloying elements like copper have a detrimental effect on the aluminum oxide formation. From the thermodynamic view, the oxidation of aluminum atoms is significantly preferred to the oxidation of fine dispersed copper atoms due to the more negative Gibbs free energy per equivalent for the formation of aluminum oxide [4]. This leads to copper enrichment at the substrate coating interface [4]. Hashimoto et al. describe the formation of the θ’-phase (Al2Cu) within the copper-enriched layer [5]. These nanoscale copper-rich phases are oxidized at technologically relevant anodic potentials of more than 4 V [6]. Because of the semiconductive properties of copper oxide, this process is accompanied by oxygen evolution [4,5,6]. As electrical charge is consumed during this side reaction, the current efficiency of oxide growth is significantly reduced. Moreover, additional voids can be observed along the pore channels as the enrichment, oxidation and oxygen evolution process repeats in regular time intervals. Apart from this, the oxidation of intermetallic phases in the substrate alloy leads to micron scale defects in the conversion coating. Ma et al. [7] differentiate between copper-rich phases which are preferentially dissolved leaving voids and iron-rich phases which hinder the conversion process leaving highly porous volumes and voids in the coating. Because of the increased porosity, anodic oxide coatings on aluminum-copper alloys exhibit lower hardness and abrasion resistance.
Recent investigations indicate a beneficial effect of the addition of nitric acid to a sulphuric acid electrolyte on the performance of the conversion coatings produced on the popular alloy AlCu4Mg1 (EN-AW 2024) [3]. In the same time, the process voltage of the hard-anodizing process is decreased, which leads to a lower energy consumption for the oxide production. The current study focuses on two major aspects: (1) determination of the effect of the nitric acid addition on the characteristics of both the hard-anodizing process and the produced coatings in dependence of the nitric acid concentration in the sulphuric acid electrolyte; (2) investigation into the mechanism behind the effects of nitric acid. Therefore, alongside the determination of the thickness, hardness and scratch-resistance of the produced coatings, as well as the quantification of the current efficiency and the energy consumption of the hard-anodizing process, the microstructure and composition of the produced coatings is investigated. Thus, it shall be clarified whether or not nitric acid is a suitable additive to improve the anodic oxidation especially of copper-alloyed aluminum substrates.

2. Materials and Methods

2.1. Anodizing Process

The alloy EN AW-2024 T3 (nominal composition is given in Table 1) served as substrate material for the anodic oxidation. It was supplied as sheet metal (Q-Lab, Westlake, OH, USA) and was used with dimensions of 50 mm × 25 mm × 1.5 mm. The samples were etched in 3 wt % sodium hydroxide at 50 °C for 5 min and pickled in 1:1 nitric acid at room temperature for 30 s. After each step, the samples were rinsed under deionized water. The anodic oxidation was carried out in 20 vol % sulphuric acid (corresponds to approx. 3.75 mol/L, Merck, Darmstadt, Germany) with additions of 0.4 mol/L and 0.8 mol/L nitric acid and 0.2 mol/L oxalic acid (as oxalic acid dihydrate, Merck). The electrolyte, which had a volume of 2 L, was maintained at a temperature of 5 ± 2 °C (being typical of hard-anodizing) throughout the process with a thermostat. The electrolyte was constantly stirred with a rod agitator (300 rpm). A pe1028 power station (Plating Electronic, Sexau, Germany) served as the power source. Current and voltage signals were logged internally with a sampling rate of one sample per second. The anodizing process was carried out in galvanostatic mode with a current density of 3 A/dm2. The process was terminated after 45 min.

2.2. Coating and Process Characterization

The effects of the nitric and oxalic acid addition were considered with regard to several process and coating properties. The electrical energy consumption during the anodizing process Wel was calculated by integrating the product of current density and voltage over the process time. The thickness s of the produced coatings was obtained by eddy current measurement (Fischerscope MMS, Fischer, Sindelfingen, Germany). The values were validated on cross sections of the coatings. The mass of the anodized samples was determined before and after dissolution of the alumina in chromic/phosphoric acid (35 mL/L phosphoric acid + 20 g/L chromium(VI)oxide) at 60 °C for 4 h using a X1003S balance (Mettler Toledo, Gießen, Germany). The said solution dissolves alumina and does not attack aluminum. Preliminary tests also showed no attack on the used AlCu4Mg1 alloy. The specific mass m was obtained by dividing the coating mass (which is equal to the mass loss after dissolution) by the surface area. According to Faraday´s law, the specific mass of alumina produced in a galvanostatic process carried out at 3 A/dm2 for 45 min amounts to 1426.6 mg/dm2 theoretically. The current efficiency η was calculated by dividing the mass loss obtained from the exposition in chromic/phosphoric acid by the theoretical coating mass. In the same way, the energy efficiency ε was calculated by dividing the electrical energy consumption during the process by the actual oxide mass, which gives a measure of how much energy is required for the formation of a certain coating mass ([ε] = J/mg). Under the assumption that the theoretical alumina density ρ (3.95 g/cm3) is valid for the anodic alumina produced under the described conditions, the porosity p of the coatings was calculated by applying the following formula using the specific coating mass m and the coating thickness s:
p = 1 m s · ρ
The hardness of the coatings was obtained from instrumented indentation tests at different locations of the coatings’ cross sections with a Berkovich indenter (UNAT, Asmec, Dresden, Germany). A load of 5 mN was applied (load time 10 s, hold time 5 s, unload time 4 s). The distance between each indent and the substrate/coating interface was registered. The resulting hardness profiles were approximated by an exponential function, which represents the decline of the hardness H with increasing distance d from the substrate.
H = H 0 · ( H * ) d
The lowest deviation between the experimental results and Equation (2) were obtained for a parameter H0 = 4400 N/mm2 over the complete set of data. The value H* represents the hardness decline. For a value H* = 1, there is no hardness decline at all. With decreasing H*, the hardness decline gets more pronounced. With the distance d in microns, H* was in a range of approx. 0.96 to 0.99 for the present set of samples. The hardness of the coatings in a distance of 20 µm to the substrate was considered as a reference value in the DOE exploitation.

2.3. DOE-Set Up and Exploitation

A full factorial design was used to assess the effects of the additives on the coating and process characteristics. The steps for the nitric acid concentration were 0 mol/L, 0.4 mol/L and 0.8 mol/L, while the oxalic acid concentration was 0 or 0.2 mol/L. The full factorial design thus included 12 different electrolytes. For each of the electrolytes, three samples were produced independently and all the properties were determined for these samples, with the exception of the hardness, which was measured on the cross section of only two samples for each of the electrolytes with approx. 20 indents across the coating cross section. The values obtained for each of the process and coating properties were used as input values for a model, which was quadratic with regard to the nitric acid concentration and linear with regard to the oxalic acid concentration. A preliminary consideration of the statistical significance of the parameter effects on the properties showed no statistical significance for the interaction of the oxalic and nitric acid additives. Interaction terms have therefore not been considered and the response function for a generic property g (e.g., coating thickness s, energy efficiency ε, hardness H20) with the coefficients ai (i = 1, 2, 3, 4) and the concentrations of oxalic and nitric acid was chosen as follows:
g = a 1 + a 2 · c o x a l i c + a 3 · c n i t r i c 2 + a 4 · c n i t r i c
The coefficients were determined by least-square fitting of the model to the obtained results for each parameter. Thus, a quantitative relation of each property and the additive concentration was obtained. The quality of the model was checked for each of the parameters by comparing the model predictions gpred with the measured properties gmeas ( g ¯ m e a s being the mean measured value) via the following function:
R 2 = 1 ( g m e a s g p r e d ) 2 ( g m e a s g ¯ m e a s ) 2

2.4. Microstructure Characterisation

Metallographic cross sections were prepared by grinding on SiC paper and polishing with diamond suspension accomplished by a finish using a silicon oxide polishing suspension. Before the scanning electron microscopy (SEM) investigations, the cross-sections were cleaned thoroughly, dried at 60 °C for at least 4 h and carbon coated in order to avoid sample charging. The microstructure was investigated by SEM (LEO 1455VP, Zeiss, Jena, Germany). Both secondary electron (SE, topography contrast) and backscattered electron (BSD, element contrast) detectors were applied. For the quantitative analysis of the submicron and micron scale porosity, BSD pictures were assembled in order to get a representative impression of the coating microstructure over a length of more than 300 microns. The porosity was calculated via the grey-scale of pixels, whereby pixels with a grey-scale lower than a suitable threshold value were counted and the sum was put in relation with the total number of pixels.

2.5. Scratch Testing and Profilometry

Scratch tests were performed with a Revetest-RST scratch tester (CSM Instruments, Peseux, Switzerland) using a Rockwell diamond cone indenter (radius 200 μm) in order to evaluate the coatings’ adhesion and the two-body abrasion resistance of the coatings. The sample was moved relative to the indenter with a speed of 2.5 mm/min. A prescan and a postscan were conducted at a small normal load of 0.9 N in order to calculate the remaining scratch depth. During scratch testing, the tangential force and the acoustic emission were recorded. For the quantification of the adhesive failure, the normal load was linearly increased within a scratch length of 10 mm from 1 to 100 N. This procedure will be referred to as “progressive scratch testing”. The first occurrence of adhesive failure was determined by the help of the remaining scratch depth and by optical examination of the scratch. The force, at which the coating failed, meaning the breakthrough to the substrate, will be referred to as the critical force Fc. For the quantification of the abrasion resistance, scratch tests with a length of 5 mm were conducted at a constant normal load of 10 N. This procedure will be referred to as “constant scratch testing”. The cross-section profile of each constant scratch was recorded at three positions using tactile measurement (T8000, Jenoptik, Jena, Germany). The software Turbo Wave was applied for the levelling of the profile and the calculation of the cross-section area. The scratch energy density WR was calculated using the mean value of the tangential force Ft the mean value of the cross section area A and the scratch length l according to Equation (5).
W R = F t · l A · l
Two progressive scratch tests and three constant scratch tests were performed on each of two anodized samples per anodizing condition.

3. Results

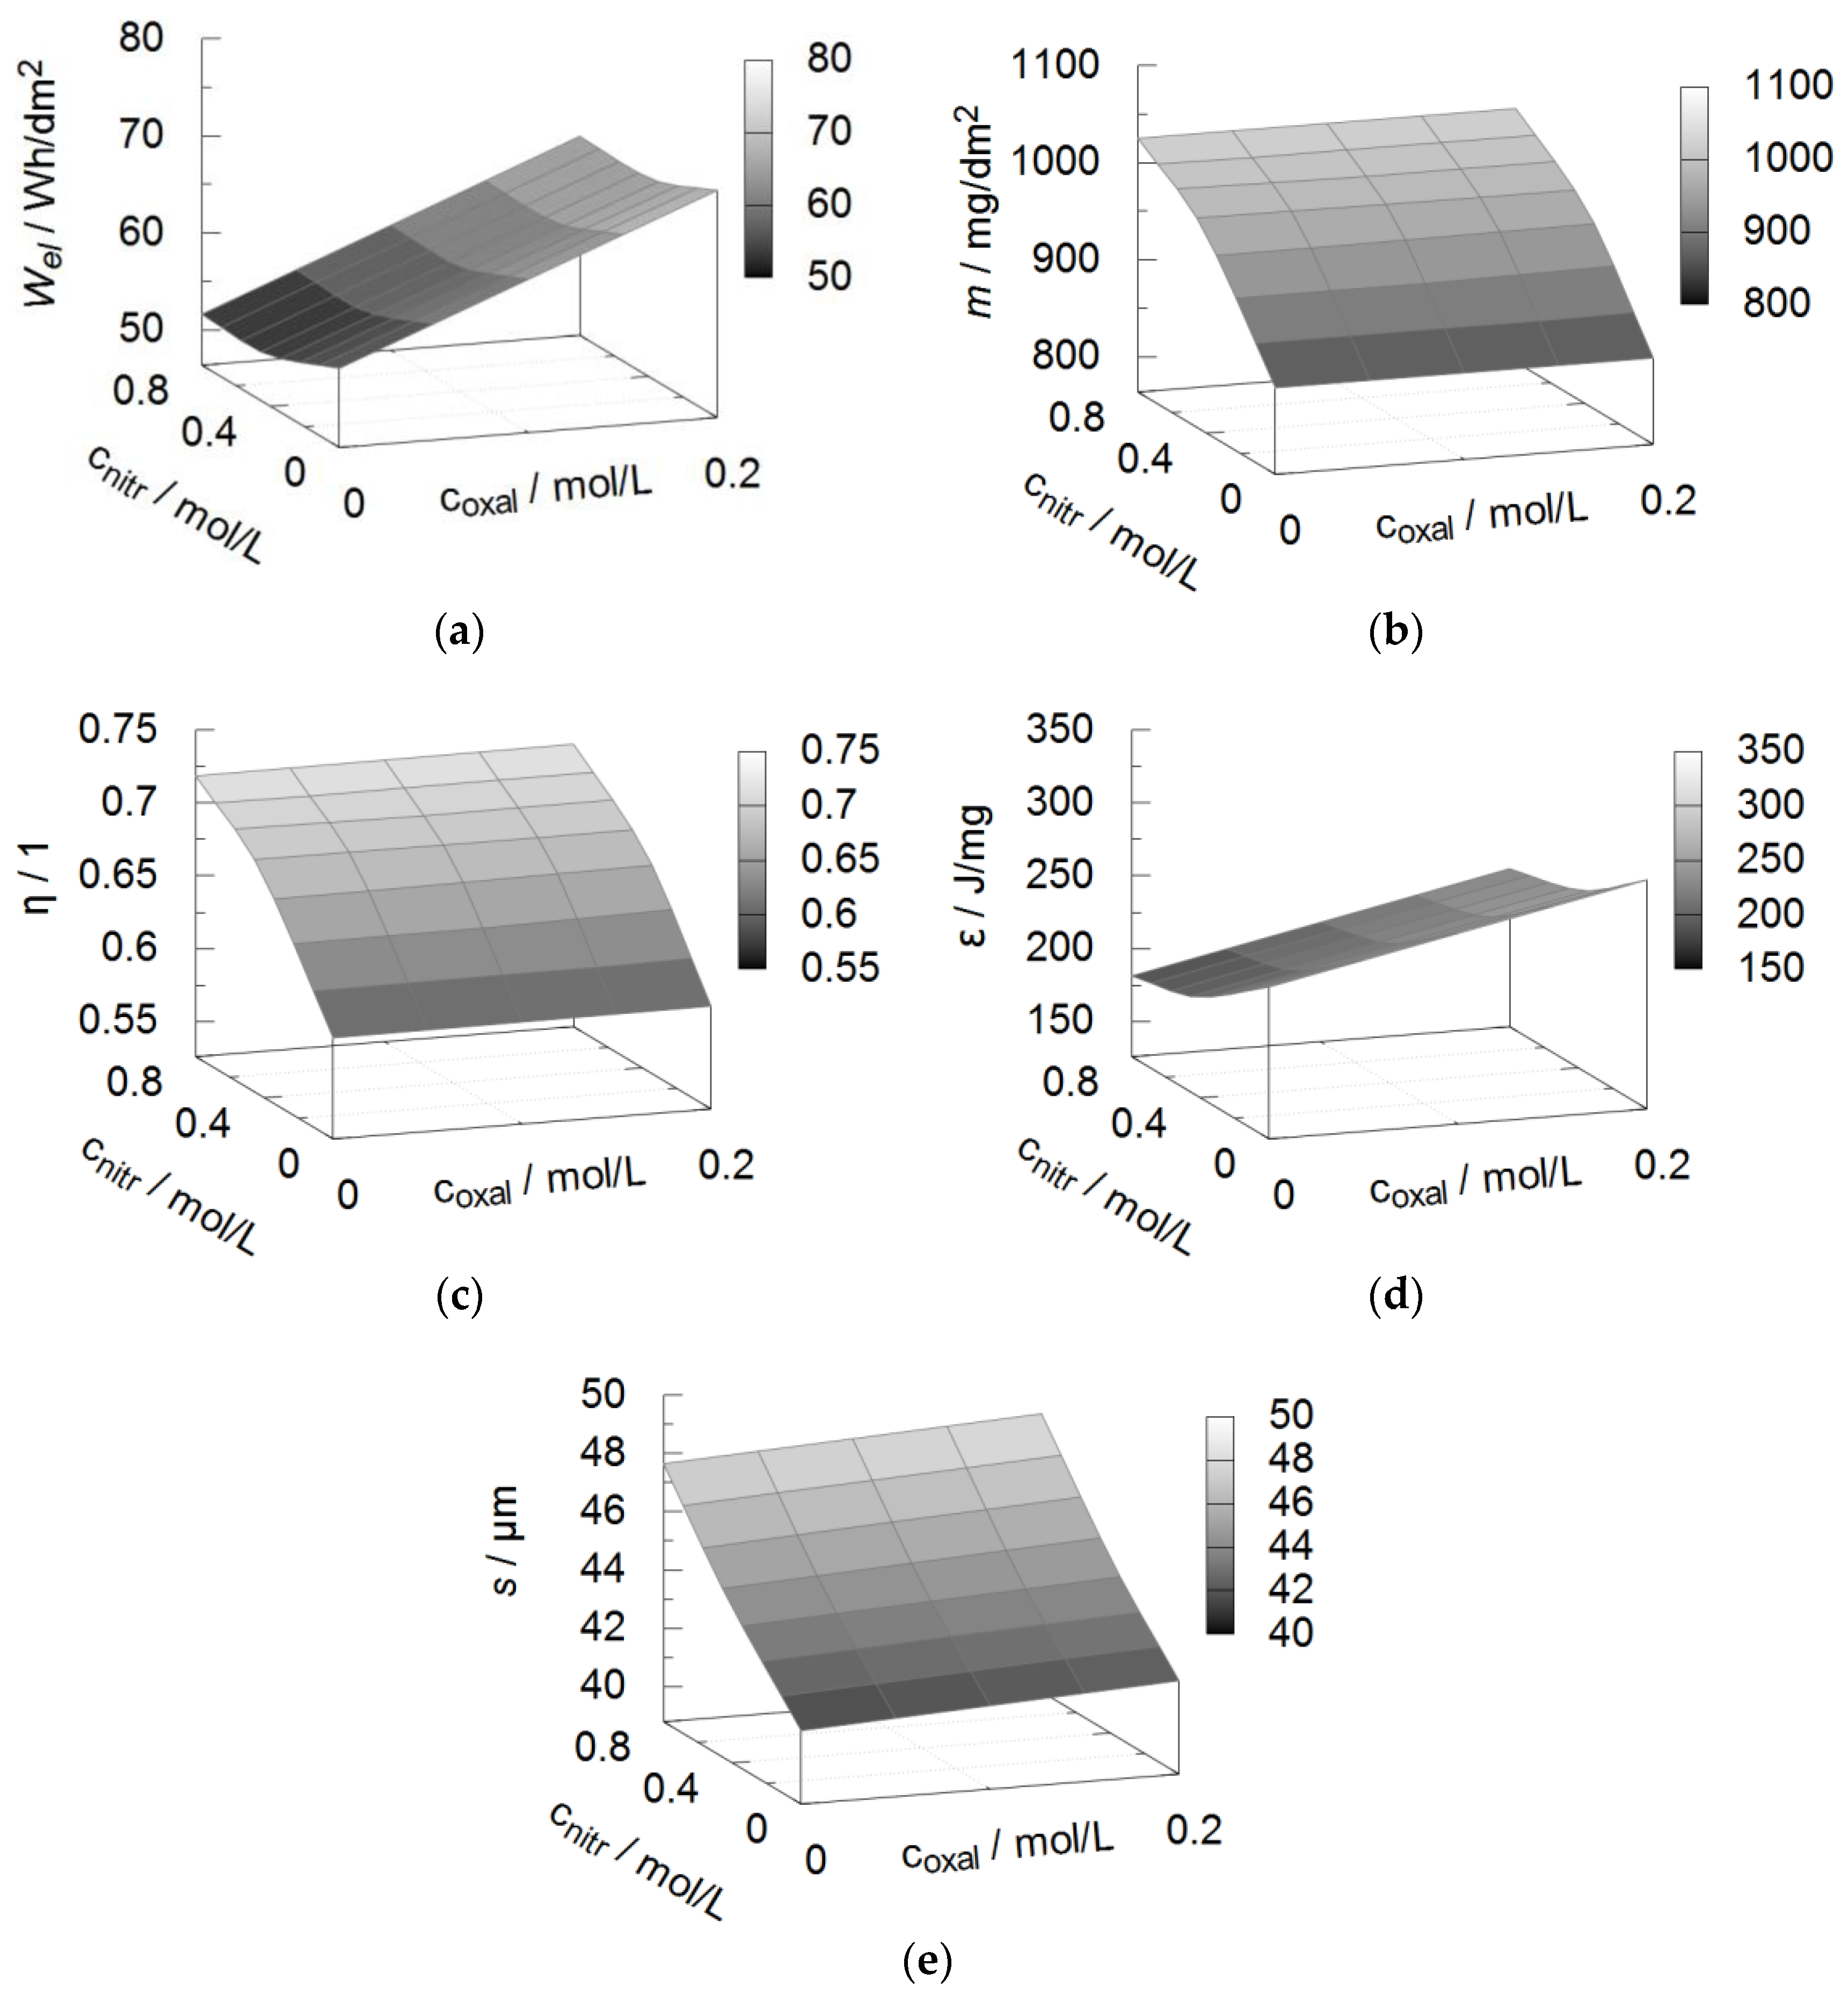
3.1. Energy Efficiency

The voltage transients for the anodic oxidation process in the sulphuric acid electrolyte with different amounts of the oxalic and nitric acid additives differ significantly. In Figure 1, four representative voltage transients and the associated standard deviations are shown for the galvanostatic process (3 A/dm2). In principal, each of the curves shows the typical voltage evolution during a galvanostatic anodizing process. The process initiation includes a steep voltage increase within the first seconds, which is attributed to the barrier layer formation and a subsequent decline of the voltage, and marks the beginning of the pore formation. Afterwards, the voltage grows at a slower rate throughout the process, which is attributed to the thickening of the porous part of the oxide coating. As can be seen in the diagram, the voltage amounts to about 23 V for the base electrolyte without additives after the process initiation. The oxalic acid additive does not affect the voltage level after the process initiation to a technologically relevant amount. However, the nitric acid additive leads to a significantly lower voltage in the first minutes of the process. With increasing process time, the voltage remains almost constant for the electrolyte without additives, while both additives lead to a significant growth of the voltage. For oxalic acid, the slope of the voltage curve is especially steep at a process time of around 25 min, while the nitric acid additive leads to a more or less constant voltage growth throughout the process. A higher amount of nitric acid addition leads to a further decrease of the voltage level after the process initiation, while the slope of the voltage in the further course of the process gets more pronounced. Therefore, the overall electrical energy consumption during the process is, of course, affected. In the sulphuric acid electrolyte without additives, the electrical energy turnover of the anodic oxidation process itself amounts to approx. 54.5 ± 0.7 Wh/dm2. The addition of oxalic acid leads to an increase of Wel to 73 ± 6 Wh/dm2. In contrast, the addition of 0.4 mol/L and 0.8 mol/L nitric acid decrease the electrical energy consumption slightly to values of 52.2 ± 1.1 Wh/dm2 and 51.6 ± 0.6 Wh/dm2, respectively. All the values are summarized in Table 2.
The fit of the quadratic response function to the results leads to the coefficients shown in Table 3. Consequently, the graph represented in Figure 2a depicts the influence of the additives on the electrical energy consumption. The deviation of the predicted values obtained from the response function and the measured results is shown in Figure 3a. It is clearly visible that the oxalic acid addition has the biggest influence on the electrical energy consumption. The slight decrease of Wel by nitric acid occurs independently of the oxalic acid addition. The response function represents the measured values well, except for the highest values obtained at an oxalic and nitric acid concentration of 0.2 mol/L and 0 mol/L, respectively, which are underestimated by the model. As can be seen in Figure 2, the voltage curve for this electrolyte shows a comparatively big standard deviation, which directly propagates into the values for the electrical energy consumption. To evaluate the efficiency of the anodic oxidation, the coating mass is considered. Referring to the results shown in Table 2 and to the graphical representation in Figure 2b, it becomes clear that the addition of oxalic acid has no effect on the mass of the produced oxide coatings. Meanwhile, the addition of nitric acid leads to an increase of the produced oxide mass. The experimental results are well represented by the response function (Figure 3b).
On the basis of this finding, two different routes shall be further pursued. The first route addresses the anodic oxidation process, namely its current and energy efficiency. The second route addresses the coating properties, namely the thickness, porosity, hardness and coating adhesion. With regard to the process, the obtained values of the oxide mass allow the calculation of the current efficiency η, i.e., how much of the overall charge turnover actually contributes to oxide formation, and the energy efficiency ε, i.e., how much energy is used for the formation of a certain amount of oxide. Since all the samples were produced in galvanostatic mode with a process time of 45 min and therefore with a constant charge turnover, the increase of the oxide mass by the addition of nitric acid into the electrolyte is directly reflected by an increased current efficiency (Table 2), while the oxalic acid additive does not affect neither of them (Figure 2c). The correlation between the values predicted by the response function and the experimental results is high (Figure 3c). In contrast, the energy efficiency ε increases significantly by the addition of oxalic acid, since the electrical energy consumption is increased without any change of the oxide mass (Figure 2d). That means, that more energy is needed for the production of a certain amount of oxide. The addition of nitric acid, meanwhile, decreases the energy efficiency, because the oxide mass is increased and the electrical energy consumption decreases at the same time. Consequently, less energy is needed for the production of a certain amount of oxide. The correlation between the predicted energy effiency and the measured values is compromised by the same error as the electrical energy consumption, so that especially the values for the electrolyte comprising only the oxalic acid additive are underestimated (Figure 3d). The coating thickness is hardly affected by the addition of oxalic acid, while it increases by approx. 10% after the addition of 0.8 mol/L nitric acid to the sulphuric acid electrolyte (Figure 2e). In the considered parameter range, the response function allows the prediction of the coating thickness with high accuracy (Figure 3e). Related to the results obtained in the base electrolyte without any additives, the increase of the coating thickness with increasing nitric acid concentration is stronger than the increase of the oxide mass. Under the assumption of a constant density of the amorphous alumina, this indicates an increasing coating porosity.

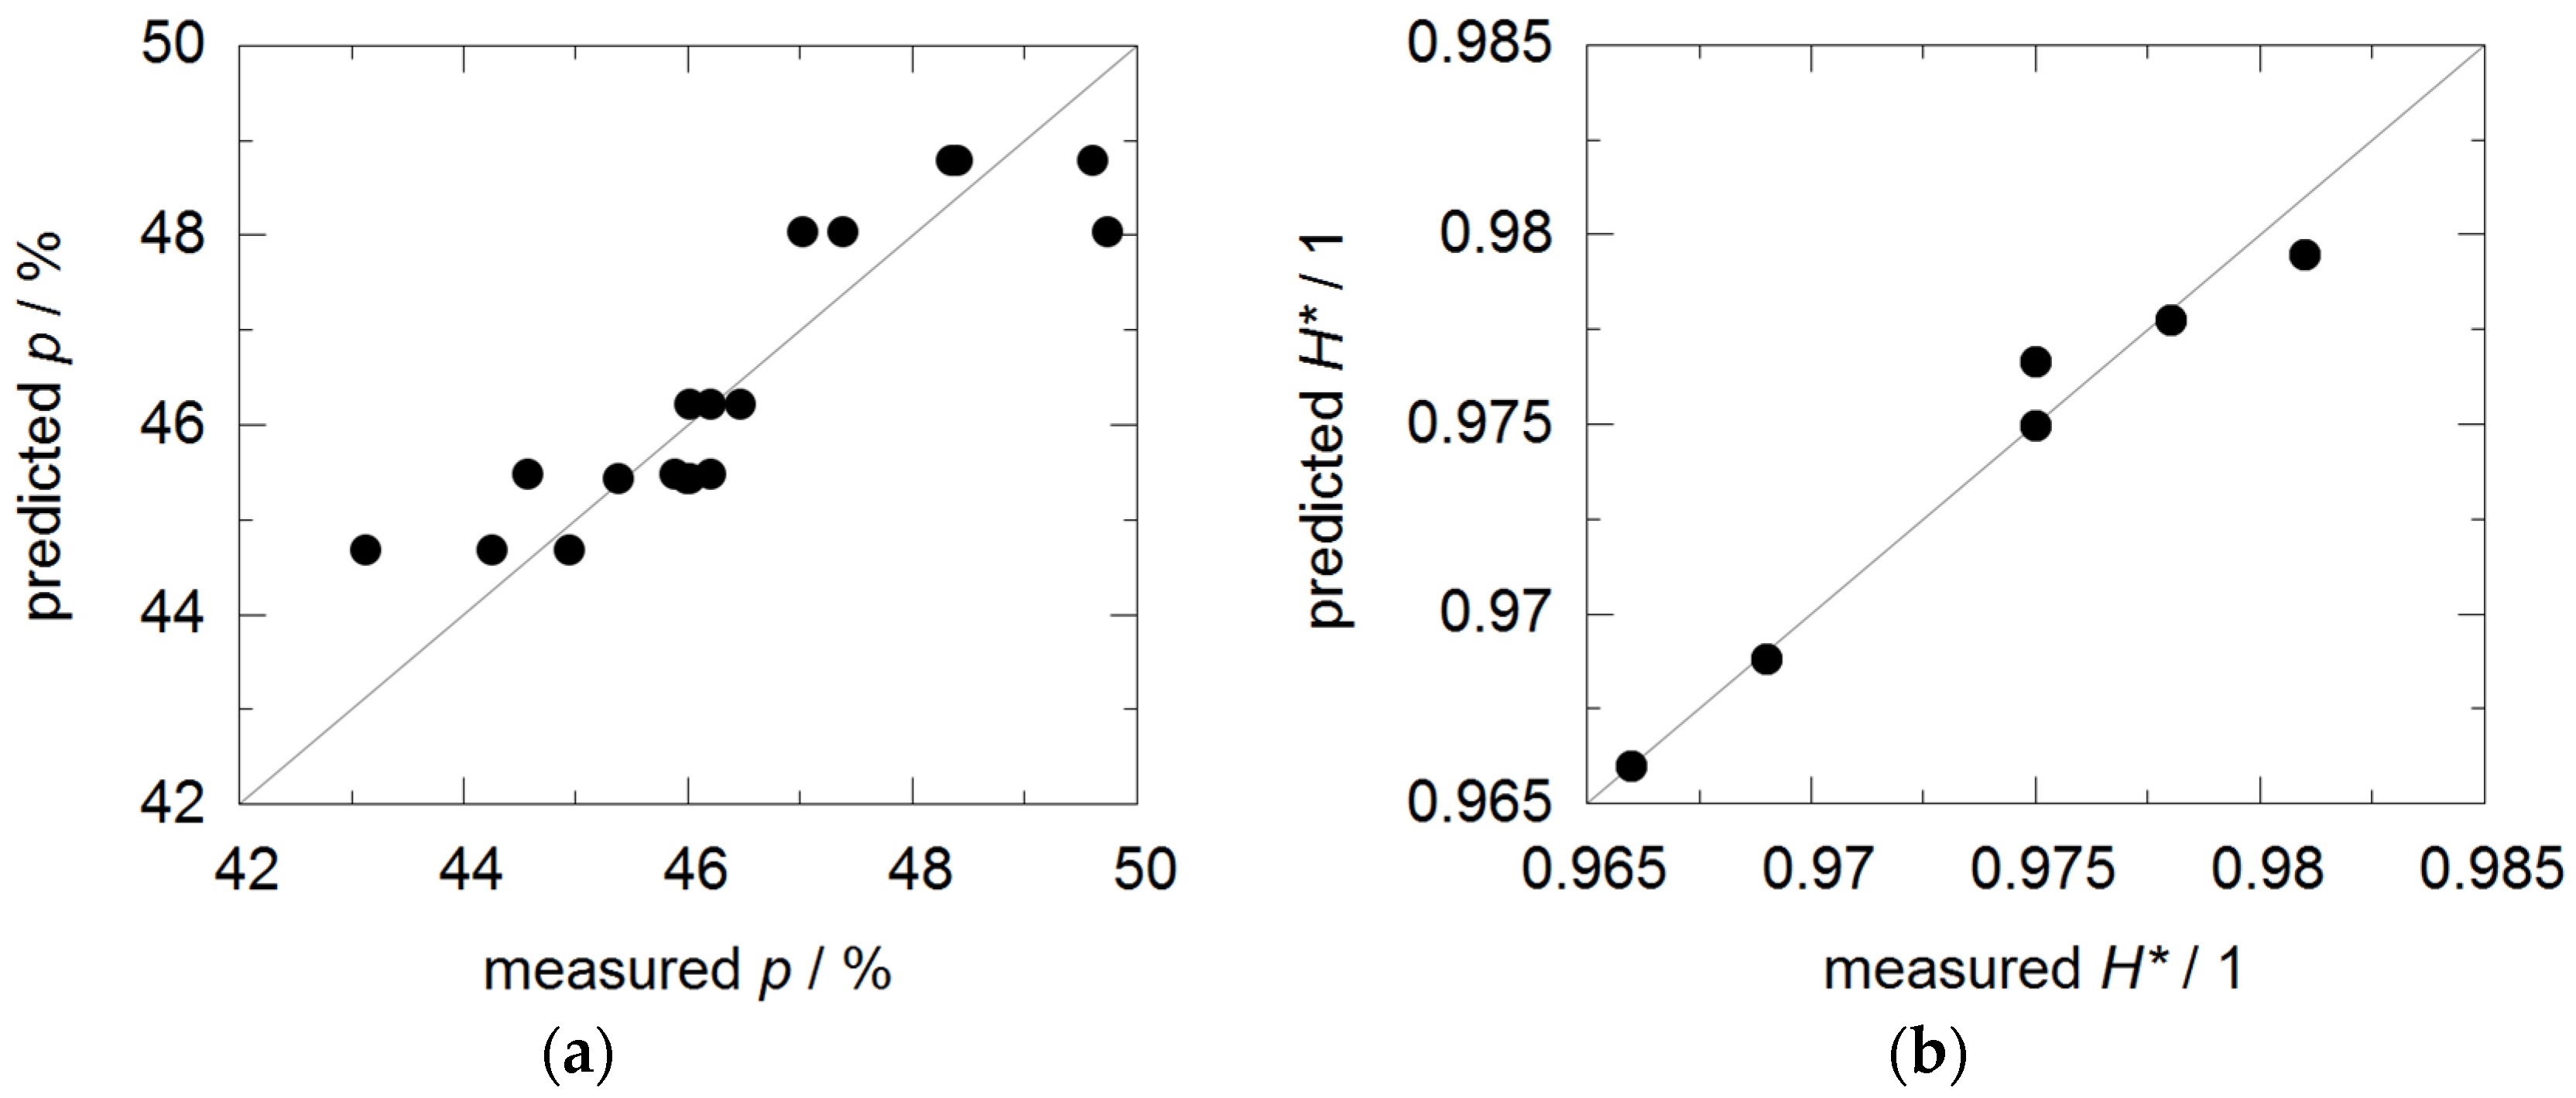
3.2. Coating Porosity and Hardness

The overall coating porosity shows a minimum at a nitric acid concentration of approx. 0.4 mol/L according to the response function as represented in Figure 4a and Table 4. The coefficients of the quadratic response function are summarized in Table 5. At a constant nitric acid concentration, the porosity always slightly increases with the addition of oxalic acid. For the porosity, low values (45% and smaller) tend to be overestimated by the model while the higher values (around 50%) are underestimated (Figure 5a). As an additional measure for the compactness of the coatings, the hardness is considered. Generally, the size of the hardness indents is in the micrometer range and is thus in a greater order of magnitude compared to the pore channels and the periodically occurring voids. As can be seen from Figure 4c and Table 4, an increasing nitric acid concentration leads to a stronger increase of the hardness H20 and the hardness decline H* in comparison with the oxalic acid addition. The maximum hardness H20 can be observed for the combined addition of 0.4 mol/L nitric acid and 0.2 mol/L oxalic acid. The further increase of the nitric acid concentration to 0.8 mol/L at an oxalic acid concentration of 0.2 mol/L leads to a reduced hardness H20. A similar behavior can be observed for the hardness decline H*, however, the decrease of the hardness for the highest nitric acid concentration is pronounced more significantly by the hardness decline. For the nitric acid concentration, the found effect on the hardness is in accordance with the estimation of the porosity, which showed a decreasing porosity for the addition of 0.4 mol/L nitric acid and again an increase for the addition of 0.8 mol/L nitric acid. However, at a constant nitric acid concentration, the porosity always increases by the addition of oxalic acid. For 0.0 mol/L and 0.4 mol/L nitric acid, this means that both porosity and hardness are increasing simultaneously. This phenomenon will be discussed later under the consideration of the coating microstructure.
The micron scale porosity of the coatings was examined by electron microscopy using the BSD detector. As can be seen from Figure 6a, the anodic oxide coatings from the base electrolyte contain plenty of spheroidal voids with diameters of less than 5 μm and some irregularly formed voids with dimensions of more than 10 μm. From grey-scale analysis, an average micron scale porosity of 3.4 ± 0.8% was obtained. With the addition of 0.4 mol/L and 0.8 mol/L nitric acid, a similar amount of cracks occurs at large voids (represented by Figure 6b). Hence, the microscale porosity increases to 4.6 ± 1.3% and 4.6 ± 0.8% respectively. With the addition of 0.2 mol/L oxalic acid, the number and volume content of the cracks generally increases for all nitric acid concentrations. The micron scale porosity ranges from 5.8 ± 1.6% for the single addition of 0.2 mol/L oxalic acid (Figure 6c) to 8.4 ± 0.7% for 0.8 mol/L nitric acid and 0.2 mol/L oxalic acid (Figure 6d) respectively. The roughness of the substrate–coating interface close to large voids seems to increase with increasing nitric acid and in particular with increasing oxalic acid concentrations. For the highest additive concentration, several large voids are connected by crack networks (Figure 6d).

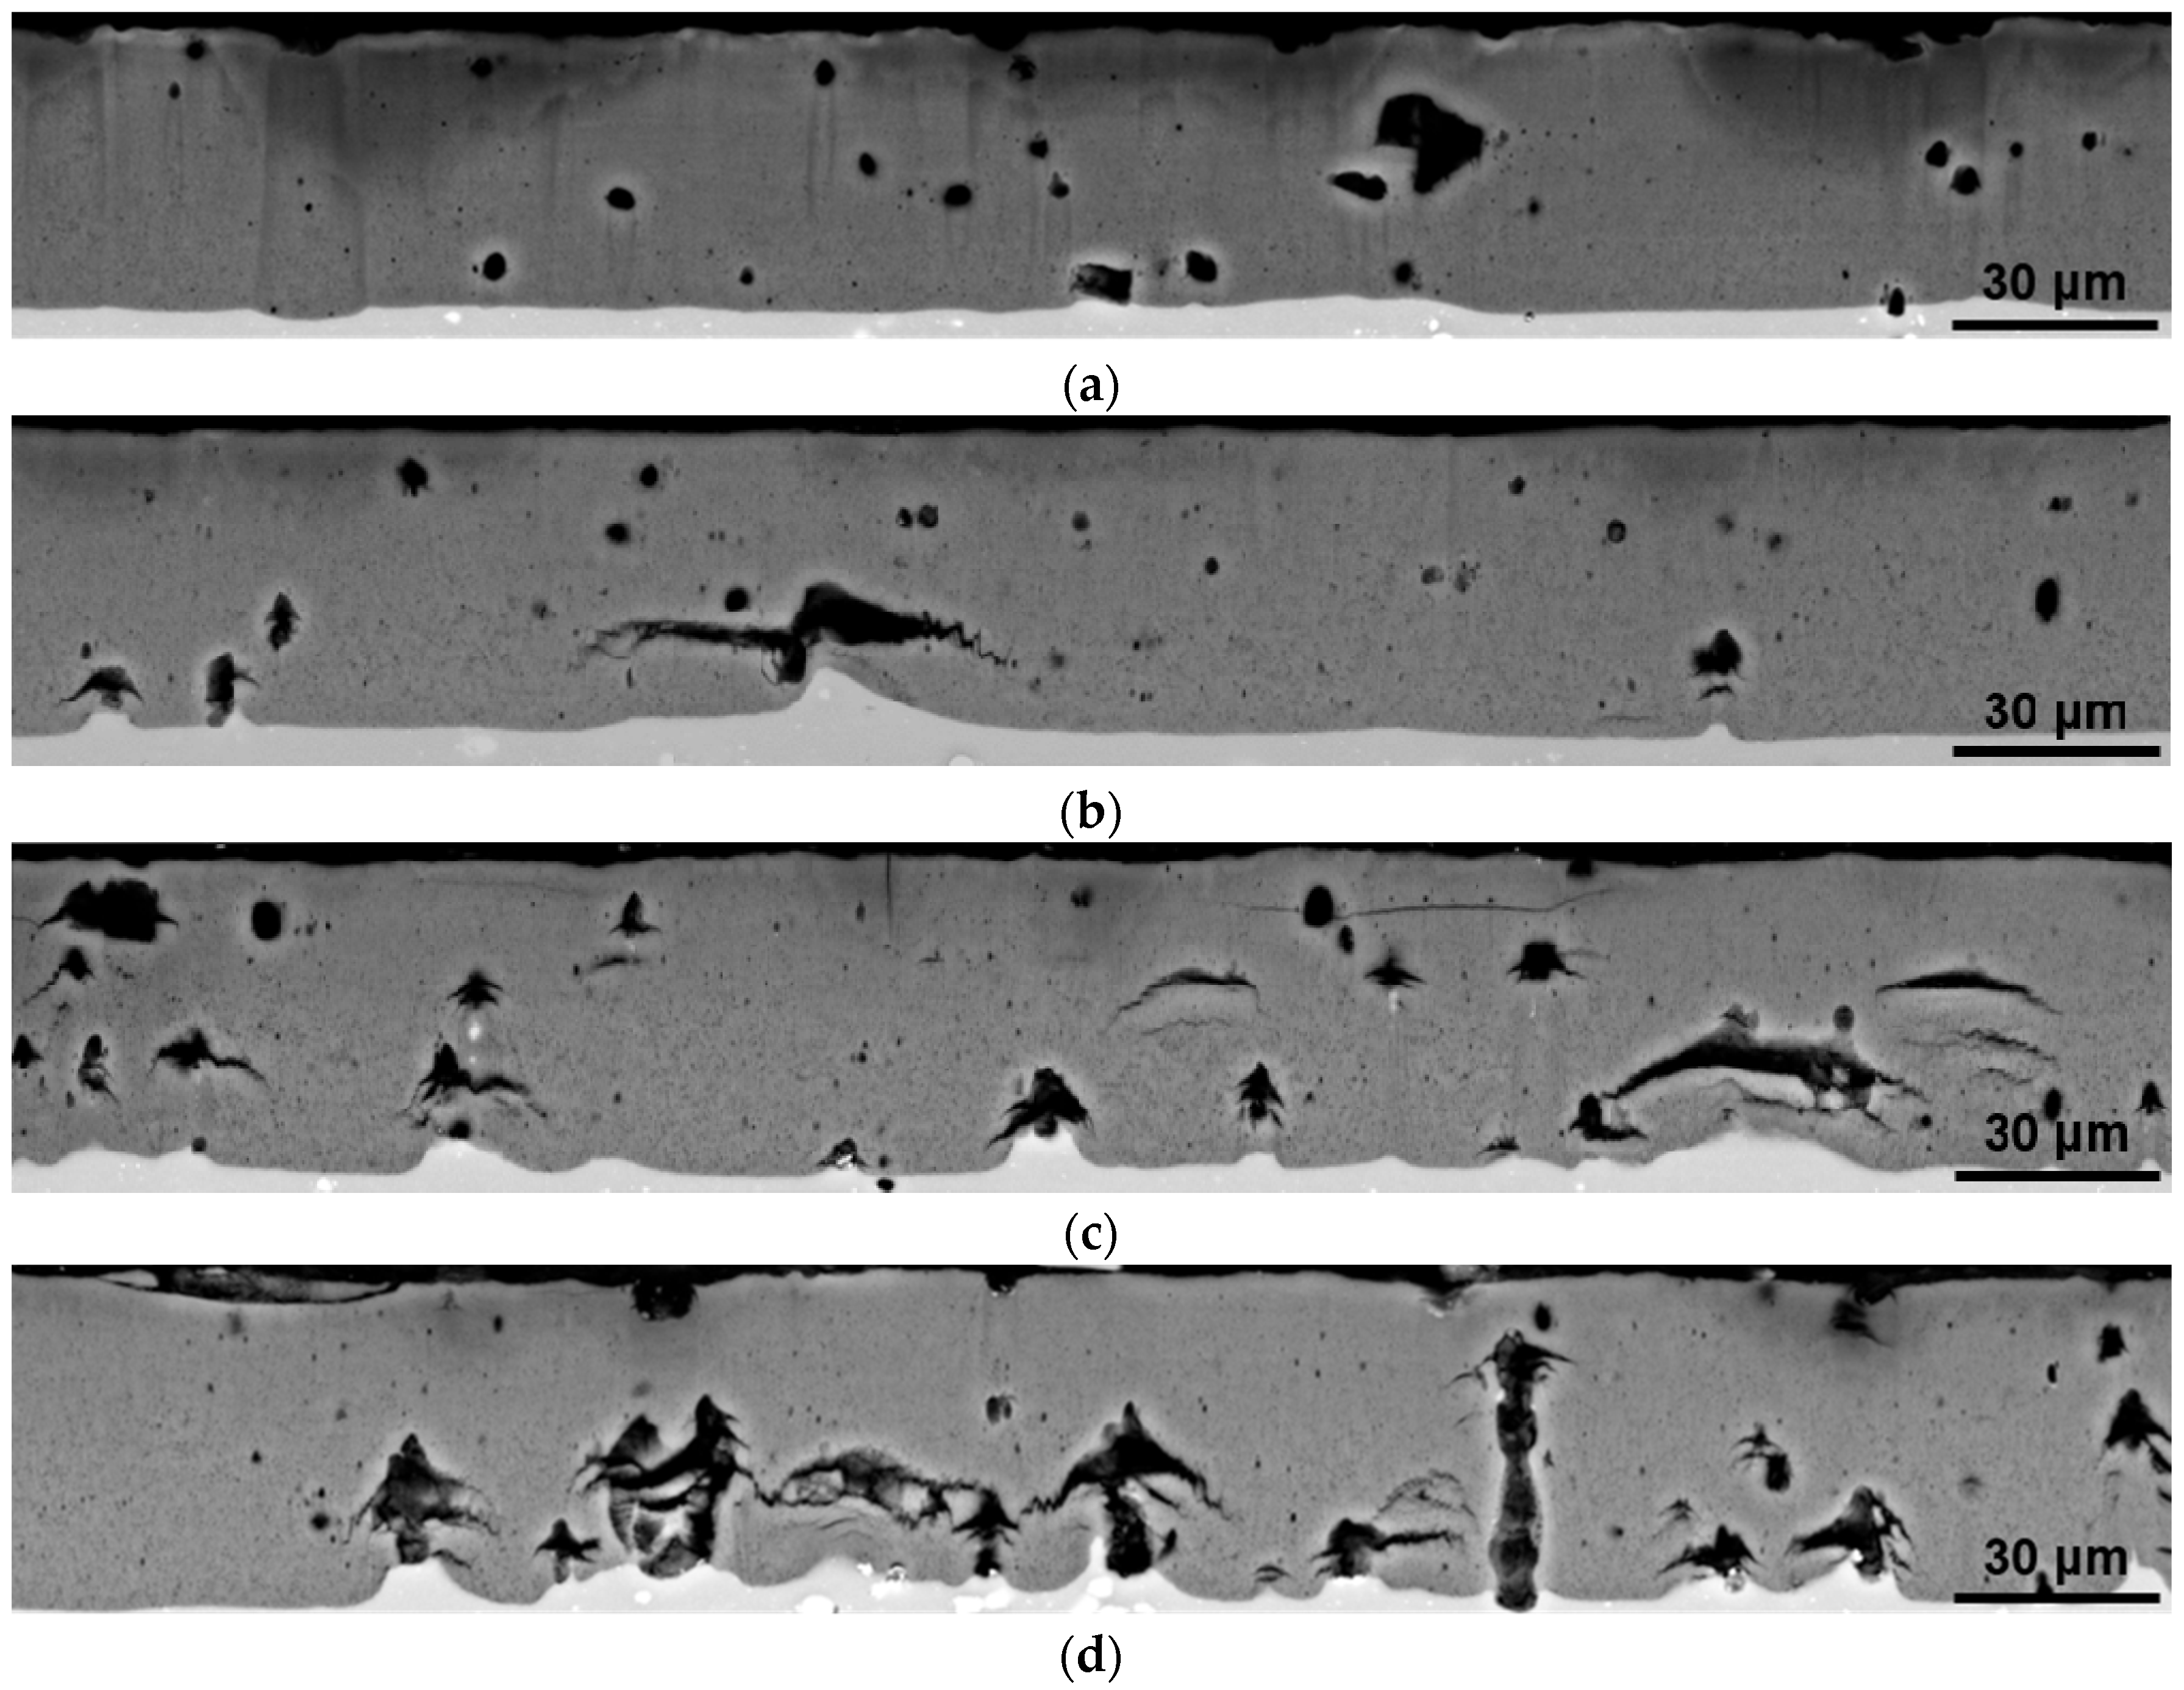
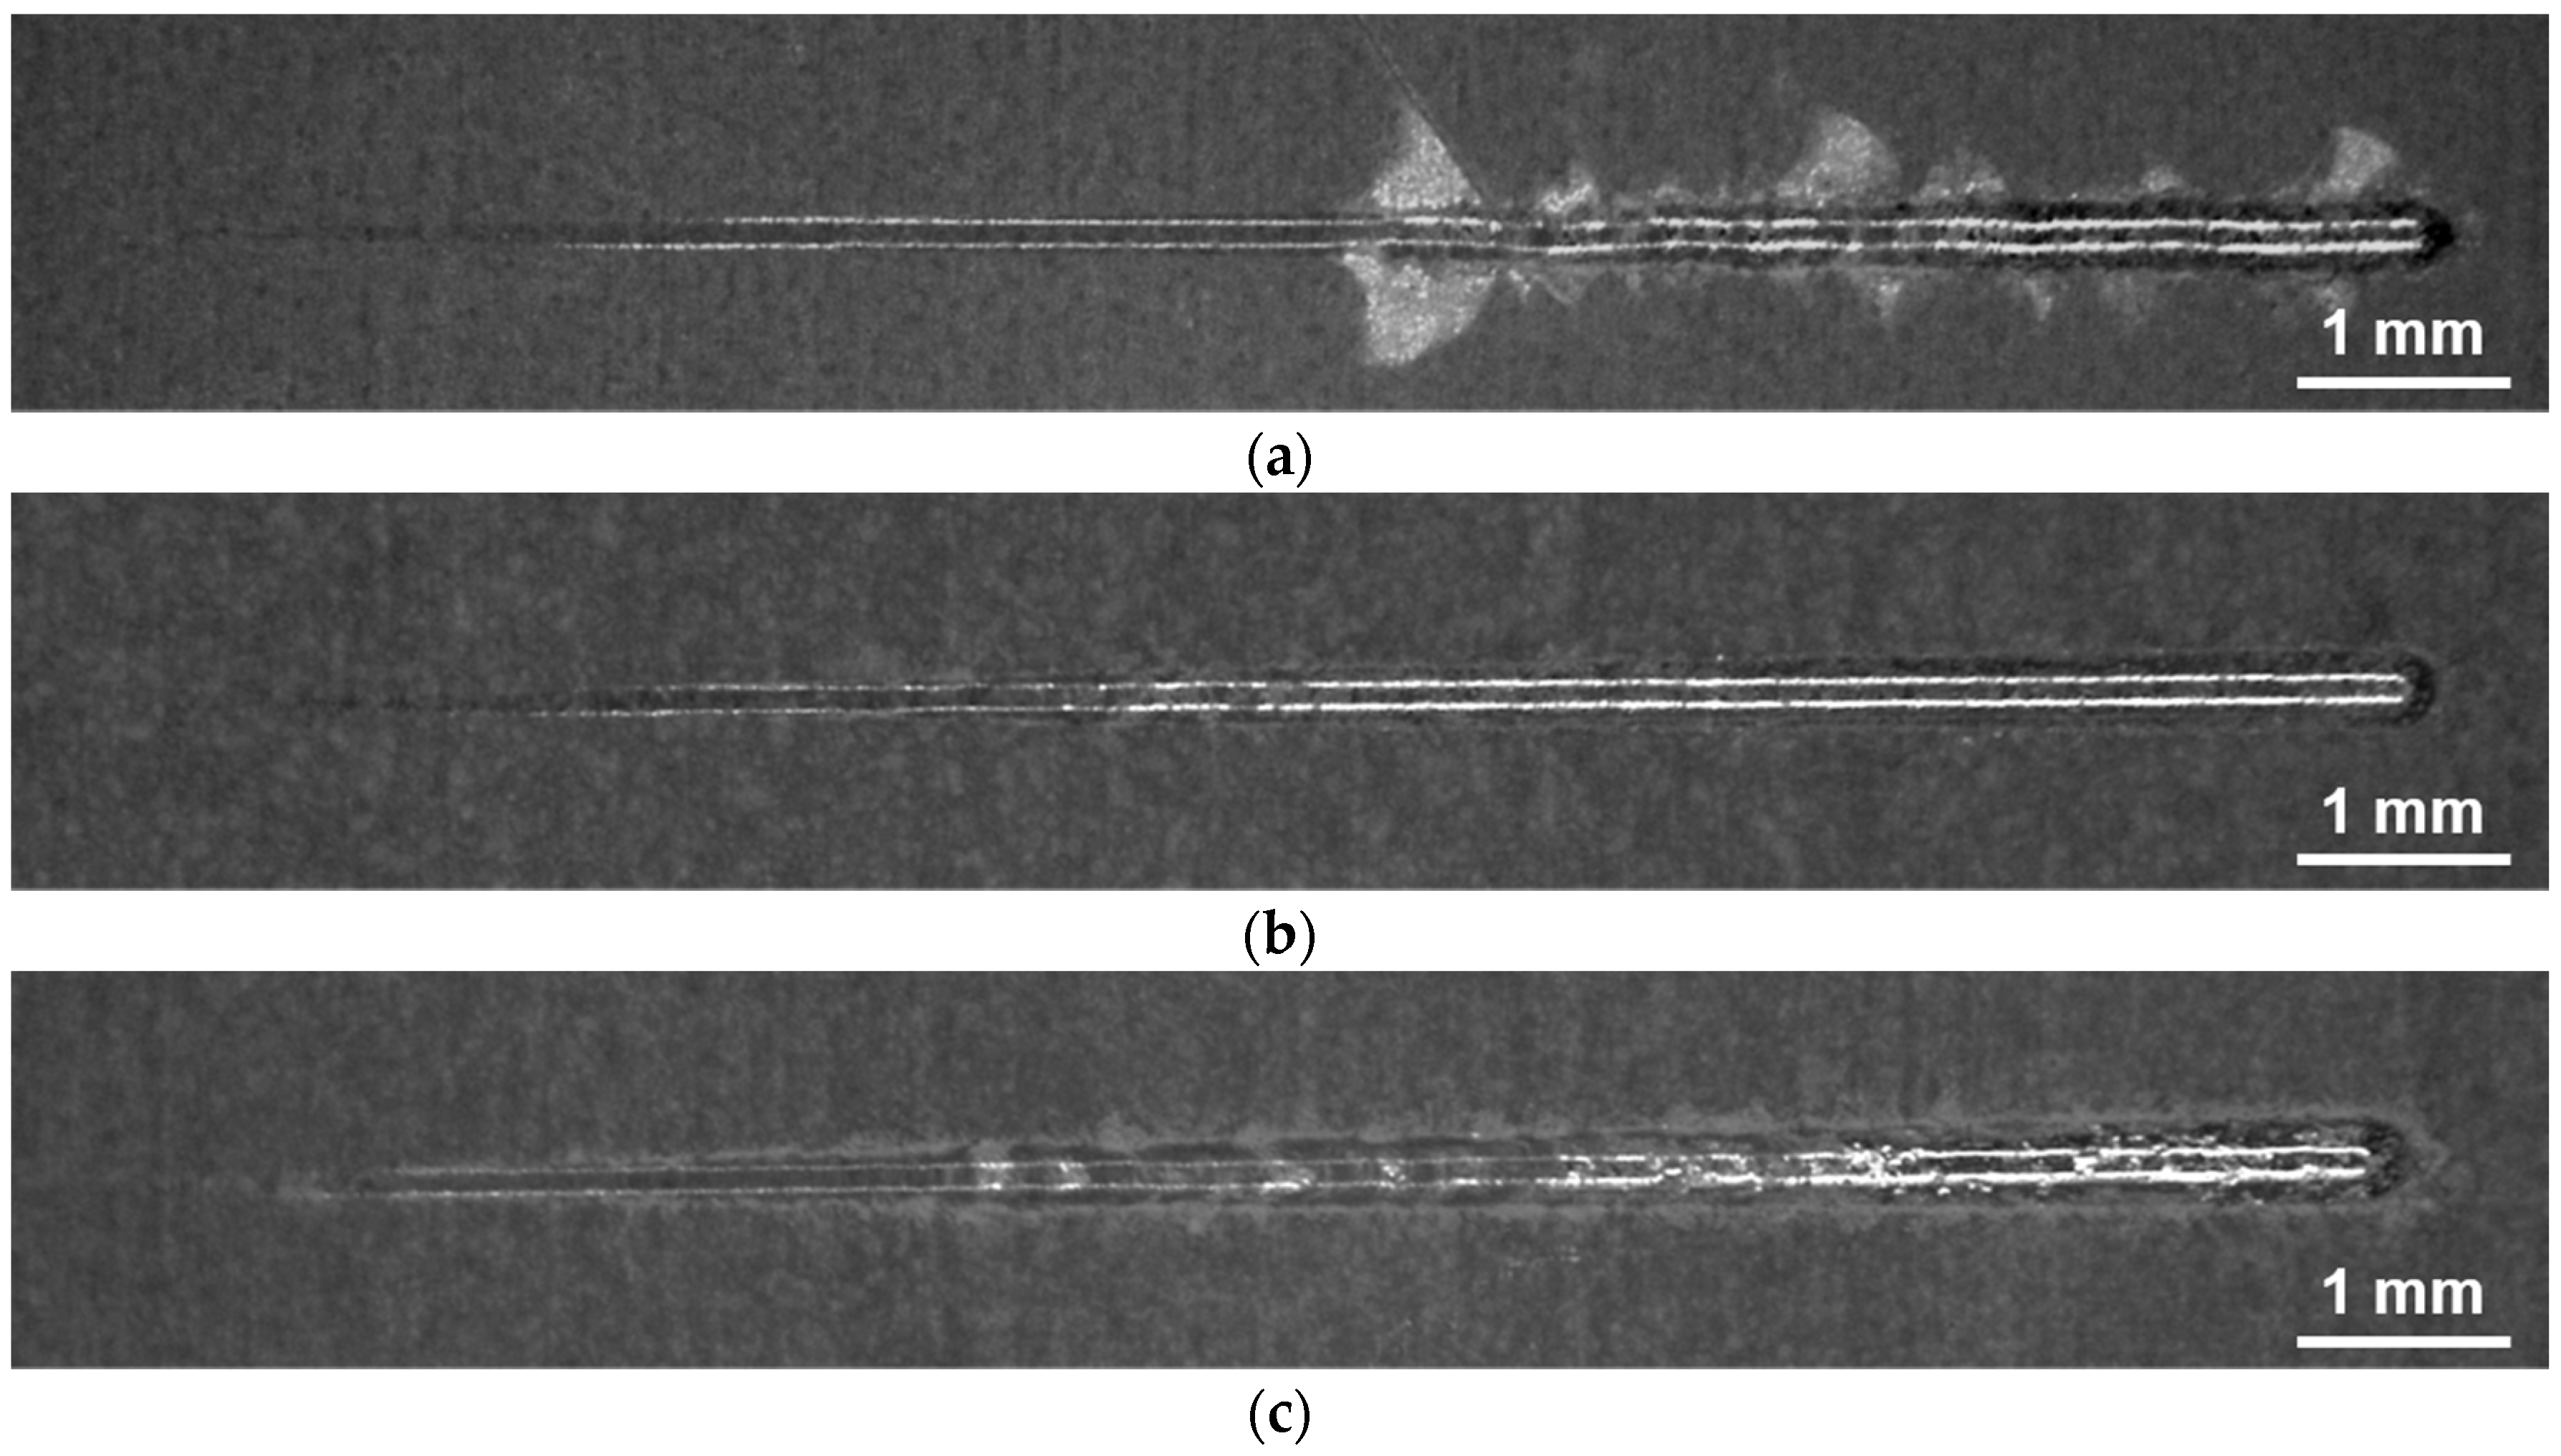
3.3. Coating Adhesion and Abrasion Resistance

In order to evaluate the influence of large micron scale pores and cracks on coating adhesion and coating failure, progressive scratch tests with increasing normal load from 1 to 100 N were performed. Because of the brittleness of the oxide conversion coatings, periodically occurring cracks perpendicular to the scratch direction were already observed from the beginning. As can be seen from the light microscope image Figure 7a, the conversion coatings obtained from the base electrolyte typically chip off after a critical normal force is reached, whereby adhesive failure of oxide plates reaches beyond the scratch. In this case, the critical force of 48.7 ± 2.9 N for the first occurrence of adhesive failure can be determined clearly by both the optical investigation of the scratch and the sudden increase of the remaining scratch depth. A similar failure behavior applies to the single addition of 0.4 mol/L nitric acid, however, the adhesive failure is already observed at a slightly smaller normal force of 45.0 ± 4 N as can be seen from Table 6. For the single addition of 0.2 mol/L oxalic acid, both with and without nitric acid, no spallation of large oxide plates can be observed (Figure 7b). For this reason, it is more difficult to obtain the critical normal force from the optical investigation of the scratch. However, with the aid of the remaining scratch depth curve, a further decrease of the critical normal force to 42.0 ± 5 N and 33.3 ± 2.0 N, respectively, can be derived. For the highest nitric acid concentration of 0.8 mol/L both with and without oxalic acid, the failure mode appears to be very gradually as the remaining scratch depth increases steadily without abrupt increases. The exposure of the bare metallic substrate already occasionally appears at small normal forces due to the abrasive wear of the entire oxide thickness. Hence, a critical normal force for adhesive failure cannot be defined for these samples.
As can be seen from Table 6, the scratch energy density of anodic conversion coatings can be slightly improved through the addition of 0.4 mol/L nitric acid to the base electrolyte. However, this is not due to the reduction of the worn material volume as the cross-section area of the scratches even slightly increases, but due to the slightly increased tangential force. A further increase of the nitric acid concentration impairs the scratch energy density of the coatings considerably. This is due to the significant increase of the worn material volume. Except from the highest nitric acid concentration of 0.8 mol/L, the further addition of 0.2 mol/L oxalic acid to the electrolyte leads to increased cross-section areas and therefore to lower values of the scratch energy density.

4. Discussion

It was shown that both oxalic and nitric acid additions are suitable to improve coating properties. However, solely the addition of nitric acid offers the unique opportunity to enhance the thickness and hardness of anodic oxide coatings and to reduce the electrical energy consumption, simultaneously. This can be attributed to the different effect mechanisms of the additives. It is known that organic additives like oxalates from oxalic acid inhibit the chemical dissolution of alumina at the pore walls in the outer region of anodic conversion coatings [1]. This results in conversion coatings with a higher density and a smaller hardness gradient described by a higher value of the hardness decline H* in Table 4. Whereas the extended pores of anodic coatings from the base electrolyte allow an easier electrolyte penetration, the accessibility of coatings from electrolytes with oxalic acid addition decreases significantly with increasing coating thickness. Therefore, the electrical resistance increases and a more pronounced rise of the process voltage can be observed for the latter coatings. In contrast to this, the addition of nitric acid allows the reduction of the voltage from the beginning of the process. As already described above, the presence of copper oxide at the interface allows for local oxygen evolution and therefore leads to a reduced current efficiency of oxide growth. One explanation for the beneficial effect of nitric acid may be the accelerated chemical dissolution of the copper oxide at the substrate–electrolyte interface. Aqueous solutions of nitric acid are commonly used to remove the copper enriched black surface layer on copper-rich aluminum alloys after pickling.
When discussing the correlation between the anodizing parameters, porosity, hardness and scratch resistance, it is important to subdivide the porosity in different categories according to their origin: pore channels proceeding orthogonal to the substrate surface, periodically occurring voids along the pore channels due to copper-enrichment and oxygen evolution and microscale voids due to the dissolution of intermetallic phases. Obviously, the chemical dissolution of the pore walls is not substantially reduced by the addition of oxalic acid as the hardness parameters H20 and H* are only slightly enhanced. A reason for this could be the generally low dissolution rate of anodic alumina in 20-vol % sulfuric acid solution at 5 °C. At higher electrolyte temperatures, a stronger effect of the oxalic acid addition has to be expected. In contrast to this, nitric acid addition is suitable to enhance the hardness parameters H20 and H* significantly. Again, this effect can be explained by the accelerated chemical dissolution of copper oxide at the substrate–coating interface. According to this argumentation, the reduction of the oxygen evolution does not only improve the energy efficiency (as already described) but also reduces the amount and volume content of the periodically occurring voids along the pore channels. These results correspond to the results of Morgenstern et al. [8], who recently discovered that thickness and hardness of anodic oxide coatings are improved when the alloying element copper is not homogeneously dispersed in solid solution or in the form of atomic clusters, but concentrated in S-phase (Al2CuMg) precipitates. In this case, the precipitates preferentially dissolve and the detrimental effect of copper is reduced.
The characteristic micron scale voids are developed through the dissolution of micron scale intermetallic phases. Theoretically, the S-phase should completely dissolve during a long-time solution annealing treatment in order to enable the maximum effect of the subsequent age hardening process. Practically, the duration of the solution annealing treatment is limited due to high energy costs and the danger of grain coarsening. For this reason, some S-phase precipitates do not completely dissolve but reshape to a spheroidal form. As already reported in [8,9], these precipitates leave spheroidal voids within the conversion coatings due to their preferential dissolution in the sulphuric acid electrolyte. Because of their limited size of up to 5 μm in diameter and their round shape, they do not act as sharp notches and might stop rather than initiate cracks within the oxide coating. On the other hand, primary phases, e.g., iron- or silicon-rich phases, are precipitated during the solidification of the molten alloy. They are virtually insoluble in the solid aluminum matrix. These precipitates exhibit dimensions of more than 10 μm and an irregular, sharp-edged shape. During anodizing, they convert more slowly than the surrounding aluminum matrix and leave highly porous volumes and flaws within the coating according to [7]. These flaws also exhibit a size of more than 10 μm and sharp edges. Therefore, they might rather act as crack initiation sites. As shown in Figure 6, the susceptibility to cracking increases with increasing nitric acid concentration and especially with the addition of oxalic acid. One reason for this could be the embrittlement of the coatings due to the incorporation of additional elements from the electrolyte. Shih et al. [10] proposed that the enhanced hardness of anodic oxide coatings obtained from a sulphuric acid electrolyte after nitric acid addition results from a higher sulfur content within the oxide. Another explanation could be the influence of nitric acid and oxalic acid on the conversion behavior of the iron-rich intermetallic phases. As can be seen from Figure 6, the roughness of the substrate–coating interface increases in the same order as the number and volume of cracks. The interface roughness results from the different conversion rates of the intermetallic phases and the aluminum matrix. Consequently, it can be argued that the presence of oxalic acid especially inhibits the conversion of the iron-rich phase. Following this argumentation, tensile stresses evolve in the porous oxide ahead of the iron-rich phases as the conversion of the surrounding aluminum matrix is connected with volume expansion. In conjunction with the notch effect of the large, sharp-edged voids, this could finally induce cracking.
The large voids and cracks are significantly larger than the hardness indents. Consequently, the instrumented nanoindentation measurements can only be performed around large pores within more compact oxide volumes so that these voids do not affect the measured hardness values. This is the reason why oxalic acid addition results in both an increasing general porosity and increasing hardness parameters according to Table 4. However, as scratch testing is a more integral characterization method, large voids and cracks influence the coating failure mode and the scratch resistance considerably, as can be seen quantitatively from Table 6 and qualitatively from Figure 7. With an increasing number of large pores and cracks, the failure mode changes from the brittle spallation of oxide plates towards the more gradual coating failure after the abrasion of the entire coating thickness. This is understandable, because compact oxide materials are not able to relieve internal stresses and therefore fail suddenly after reaching a critical stress level. On the other hand, if cracks are already present within the coating, the crack network propagates under normal pressure. Consequently, the indenter can easily remove material volumes, which are completely separated from the surrounding material by the crack network and the oxide coatings are worn more gradually at lower critical normal forces. The scratch energy density is influenced by both the hardness of compact oxide volumes and the micron scale porosity. On the one hand, it is to be expected that the scratch resistance increases with increasing coating hardness. On the other hand, the presence of large pores and cracks deteriorates the abrasion resistance, as already discussed. The optimum scratch energy density can be observed for coatings after the single addition of 0.4 mol/L nitric acid to the base electrolyte as these coatings exhibit both an increased hardness and a comparatively low micron scale porosity.

5. Conclusions

The present work investigates the influences of the single and combined addition of nitric acid and oxalic acid to a sulphuric acid electrolyte on the anodic oxidation behavior of the AlCu4Mg1 alloy. It was shown that—unlike conventional organic additives—the addition of nitric acid to a sulphuric acid electrolyte enables both the enhancement of coating properties, e.g., hardness by 23%, thickness by 14%, and the reduction of the electrical energy consumption by 5%, simultaneously.
In contrast to this, oxalic acid addition reduces the hardness gradient and slightly increases the hardness of the outer coating regions. Unfortunately, oxalic acid addition is connected with a significant increase in process voltage and therefore an increased energy consumption. The results also suggest that oxalic acid addition decelerates the dissolution of large iron-rich intermetallic phases. This gives rise to internal stresses and causes cracks within the conversion coating.
For the combined addition of nitric and oxalic acid the maximum hardness increase of 36% compared with the base electrolyte and the smallest hardness gradient (represented by the highest values of the hardness H20 and the hardness decline H*) can be achieved. However, the coatings’ resistance against the abrasion of a hard counter body (represented by the scratch energy density) generally decreases with increasing additive concentration. Furthermore, the failure mode changes from sudden spallation of oxide plates towards the gradual abrasion of the coating.
By exploiting the different effects of oxalic and nitric acid, the process and coating properties can be optimized with regard to different specifications (e.g., maximum hardness or minimum energy consumption). It is expected that especially the addition of nitric acid is also suitable in order to improve the properties of anodic conversion coatings obtained at ambient temperature, as well. This is the subject of further research.

Acknowledgments

The authors gratefully acknowledge funding by the German Research Foundation (Deutsche Forschungsgemeinschaft, DFG) within the framework of SFB 692 (SFB692B2). The support of Dagmar Dietrich, Dagobert Spieler, Elke Benedix, Christel Pönitz, Paul Clauß and Frank Simchen (all from the Institute of Materials Science and Engineering) is gratefully acknowledged.

Author Contributions

Maximilian Sieber designed and performed most of the anodizing experiments, compiled the response functions, conducted the analysis of variance and wrote the corresponding sections of the paper. Roy Morgenstern performed the scanning electron microscopy investigations, supervised the nanoindentation and scratch tests, analyzed the corresponding results and wrote the corresponding sections of the paper as well as the discussion and conclusion chapters. Ingolf Scharf gave advice to Maximilian Sieber regarding the experimental design, analyzed and discussed the results with Roy Morgenstern and revised the manuscript. Thomas Lampke coordinated the research project. He gave advice to Maximilian Sieber and Roy Morgenstern regarding the focus of the manuscript, the experimental design and appropriate methods. Furthermore, he discussed the results with the other authors and revised the manuscript.

Conflicts of Interest

The authors declare no conflicts of interest. The founding sponsors had no role in the design of the study; in the collection, analyses, or interpretation of data; in the writing of the manuscript, and in the decision to publish the results.

References

  1. Giovanardi, R.; Fontanesi, C.; Dallabarba, W. Adsorption of organic compounds at the aluminium oxide/aqueous solution interface during the aluminium anodizing process. Electrochim. Acta 2011, 56, 3128–3138. [Google Scholar] [CrossRef]
  2. Bensalah, W.; Elleuch, K.; Feki, M.; Wery, M.; Ayedi, H.F. Mechanical and Abrasive Wear Properties of Anodic Oxide Layers Formed on Aluminium. J. Mater. Sci. Technol. 2009, 25, 508–512. [Google Scholar]
  3. Sieber, M.; Morgenstern, R.; Lampke, T. Anodic oxidation of the AlCu4Mg1 aluminium alloy with dynamic current control. Surf. Coat. Technol. 2016, 302, 515–522. [Google Scholar] [CrossRef]
  4. Thompson, G.E.; Habazaki, H.; Shimizu, K.; Sakairi, M.; Skeldon, P.; Zhou, X.; Wood, G.C. Anodizing of aluminium alloys. Aircr. Eng. Aerosp. Technol. 1999, 71, 228–238. [Google Scholar] [CrossRef]
  5. Hashimoto, T.; Zhou, X.; Skeldon, P.; Thompson, G.E. Structure of the Copper–Enriched Layer Introduced by Anodic Oxidation of Copper-Containing Aluminium Alloy. Electrochim. Acta 2015, 179, 394–401. [Google Scholar] [CrossRef]
  6. Curioni, M.; Roeth, F.; Garcia-Vergara, S.J.; Hashimoto, T.; Skeldon, P.; Thompson, G.E.; Ferguson, J. Enrichment, incorporation and oxidation of copper during anodizing of aluminium-copper alloys. Surf. Interface Anal. 2010, 42, 234–240. [Google Scholar] [CrossRef]
  7. Ma, Y.; Zhou, X.; Thompson, G.E.; Curioni, M.; Zhong, X.; Koroleva, E.; Skeldon, P.; Thomson, P.; Fowles, M. Discontinuities in the porous anodic film formed on AA2099-T8 aluminium alloy. Corros. Sci. 2011, 53, 4141–4151. [Google Scholar] [CrossRef]
  8. Morgenstern, R.; Dietrich, D.; Sieber, M.; Lampke, T. Influence of the heat treatment condition of alloy AlCu4Mg1 on the microstructure and properties of anodic oxide layers. IOP Conf. Ser. Mater. Sci. 2017, 181, 012043. [Google Scholar] [CrossRef]
  9. Morgenstern, R.; Nickel, D.; Dietrich, D.; Scharf, I.; Lampke, T. Anodic Oxidation of AMCs: Influence of Process Parameters on Coating Formation. Mater. Sci. Forum 2015, 825–826, 636–644. [Google Scholar] [CrossRef]
  10. Shih, H.-H.; Tzou, S.-L. Study of anodic oxidation of aluminum in mixed acid using a pulsed current. Surf. Coat. Technol. 2000, 124, 278–285. [Google Scholar] [CrossRef]
Figure 1. Voltage curves for the galvanostatic anodic oxidation process (current density: 3 A/dm2) in the sulphuric acid base electrolyte with and without various additions. The thin lines represent the 66% confidence intervals, i.e., the standard deviation.
Metals 08 00139 g001
Figure 2. Effect of the addition of oxalic and nitric acid on the coating and process properties as predicted by the response function, (a) electrical energy consumption Wel, (b) oxide mass m, (c) current efficiency η, (d) energy efficiency ε, (e) coating thickness s.
Metals 08 00139 g002
Figure 3. Comparison between values predicted by the response function and measured values for (a) electrical energy consumption Wel, (b) oxide mass m, (c) current eciency η, (d) energy efficiency ε, (e) coating thickness s.
Metals 08 00139 g003
Figure 4. Effect of the addition of oxalic and nitric acid on the coating and process properties as predicted by the response function, (a) porosity p, (b) hardness decline H*, (c) hardness in a distance of 20 microns from the substrate/oxide interface.
Metals 08 00139 g004
Figure 5. Comparison between values predicted by the response function and measured values for (a) porosity p, (b) hardness coefficient H*, (c) hardness in a distance of 20 microns from the substrate/oxide interface.
Metals 08 00139 g005aMetals 08 00139 g005b
Figure 6. Backscattered electron detector (BSD) images showing the micron scale porosity of anodic oxide coatings obtained from the following electrolytes: (a) 20 vol % H2SO4, (b) 20 vol % H2SO4 + 0.8 mol/L HNO3, (c) 20 vol % H2SO4 + 0.2 mol/L C2H2O4, (d) 20 vol % H2SO4 + 0.2 mol/L C2H2O4 + 0.8 mol/L HNO3.
Metals 08 00139 g006
Figure 7. Light microscope images of coating failure after progressive scratch test: (a) 20 vol % H2SO4, (b) 20 vol % H2SO4 + 0.2 mol/L C2H2O4, (c) 20 vol % H2SO4 + 0.8 mol/L HNO3.
Metals 08 00139 g007
Table 1. Chemical composition of alloy EN AW-2024.
ElementAlCuMgMnSiFeCrZnTi
wt %balance3.9–4.91.2–1.80.3–0.9≤0.5≤0.5≤0.1≤0.25≤0.15
Table 2. Results for the considered process and coating properties for all the combinations of additions of oxalic and nitric acid to the sulphuric acid base electrolyte.
PropertySymbolUnitOxalic/Nitric Acid Addition in mol/L
0/00/0.40/0.80.2/00.2/0.40.2/0.8
Coating thicknesssµm42 ± 544 ± 248 ± 242 ± 345 ± 348 ± 3
Specific massmmg/dm²855 ± 16964 ± 51025 ± 4850 ± 10971 ± 91026 ± 14
El. energy ConsumptionWelWh/dm²54.5 ± 0.652.2 ± 0.951.6 ± 0.573 ± 565.6 ± 1.067 ± 5
Current eff.η%59.9 ± 1.267.6 ± 0.471.9 ± 2.759.6 ± 0.768.0 ± 0.672.0 ± 1.0
Energy eff.εJ/mg230 ± 7195 ± 3181 ± 2311 ± 22243 ± 6234 ± 14
Table 3. Coefficients of the response function for representation of the properties in dependence of the oxalic and nitric acid addition to the sulphuric acid base electrolyte.
PropertySymbolUnita1a2a3a4R2
Coating thicknesssµm4032.360.96
Specific massmmg/dm²900−0.7−1804000.98
El. energy consumptionWelWh/dm²50809−110.87
Current efficiencyη%0.60.006−0.120.250.98
Energy efficiencyεJ/mg23027070−1200.86
Table 4. Results for porosity-related coating properties for all the combinations of additions of oxalic and nitric acid to the sulphuric acid base electrolyte.
PropertySymbolUnitOxalic/Nitric Acid Addition in mol/L
0/00/0.40/0.80.2/00.2/0.40.2/0.8
Porosityp%48.0 ± 1.244.1 ± 0.845.6 ± 0.748.8 ± 0.645.8 ± 0.346.2 ± 0.2
HardnessH20N/mm²220026002700230030002800
Hardness declineH* 0.9660.9750.9750.9690.9810.978
Table 5. Coefficients of the response function for representation of the properties in dependence of the oxalic and nitric acid addition to the sulphuric acid base electrolyte.
PropertySymbolUnita1a2a3a4R2
Porosityp%50413−140.81
HardnessH20N/mm²2200900−140017000.94
Hardness declineH* 10.014−0.040.040.97
Table 6. Survey of scratch properties for all the combinations of additions of oxalic and nitric acid to the sulphuric acid base electrolyte.
PropertySym-BolUnitOxalic/Nitric Acid Addition in mol/L
0/00/0.40/0.80.2/00.2/0.40.2/0.8
Critical normal forceFcN48.7 ± 2.945.0 ± 4-33.3 ± 2.042.0 ± 5-
Scratch energy densityWRJ/mm³1.6 ± 0.21.7 ± 0.20.9 ± 0.41.3 ± 0.11.6 ± 0.21.0 ± 0.3
Tangential forceFtN0.4 ± 0.00.5 ± 0.01.4 ± 0.20.5 ± 0.00.5 ± 0.00.9 ± 0.1
Cross-section areaAμm²270 ± 40309 ± 241800 ± 700347 ± 24350 ± 501100 ± 500

