Review

Review of the Soft Sparking Issues in Plasma Electrolytic Oxidation

1
Department of Chemical Engineering, National Taiwan University of Science and Technology, Keelung Road 43, Section 4, Taipei 10607, Taiwan
2
Department of Mechanical Engineering, National Taiwan University of Science and Technology, Keelung Road 43, Section 4, Taipei 10607, Taiwan
*
Author to whom correspondence should be addressed.
Metals 2018, 8(2), 105; https://doi.org/10.3390/met8020105
Submission received: 14 December 2017 / Revised: 27 January 2018 / Accepted: 29 January 2018 / Published: 1 February 2018
(This article belongs to the Special Issue Plasma Electrolytic Oxidation)

Abstract

:
A dense inner layer is highly valued among the surface coatings created through plasma electrolytic oxidation (PEO) treatment, because the PEO coating has been troubled by inherent porosity since its conception. To produce the favored structure, a proven technique is to prompt a soft sparking transition, which involves a sudden decrease in light and acoustic emissions, and a drop in anodic voltage under controlled current mode. Typically these phenomena occur in an electrolyte of sodium silicate and potassium hydroxide, when an Al-based sample is oxidized with an AC or DC (alternating or direct current) pulse current preset with the cathodic current exceeding the anodic counterpart. The dense inner layer feature is pronounced if a sufficient amount of oxide has been amassed on the surface before the transition begins. Tremendous efforts have been devoted to understand soft sparking at the metal–oxide–electrolyte interface. Studies on aluminum alloys reveal that the dense inner layer requires plasma softening to avoid discharge damages while maintaining a sufficient growth rate, a porous top layer to retain heat for sintering the amassed oxide, and proper timing to initiate the transition and end the surface processing after transition. Despite our understanding, efforts to replicate this structural feature in Mg- and Ti-based alloys have not been very successful. The soft sparking phenomena can be reproduced, but the acquired structures are inferior to those on aluminum alloys. An analogous quality of the dense inner layer is only achieved on Mg- and Ti-based alloys with aluminate anion in the electrolytic solution and a suitable cathodic current. These facts point out that the current soft sparking knowledge on Mg- and Ti-based alloys is insufficient. The superior inner layer on the two alloys still relies on rectification and densification of aluminum oxide.

Graphical Abstract

1. Introduction

Plasma electrolytic oxidation (PEO) is a surface coating technology that goes beyond anodizing in metal protection. Technically, PEO and anodizing share the same root, that is, both treatments oxidize the surface electrochemically to protect the valve metals and their alloys, such as Al, Mg, Ti, Be, Bi, Hf, Nb, Sb, Ta, U, W, and Zr. The name valve metal refers to the electrolytic rectification properties of the barrier layers grown on these metal surfaces. Electrolytic rectification is when the metal/oxide interface is polarized positively in the presence of water; the resistance is substantial, accompanied by a small leakage current. When the interface is polarized negatively, the electricity flows (forward current) with low resistance [1,2,3]. As a result, under the controlled current mode, when the positive and negative currents are equal in magnitude, the anodic voltage is much higher than the cathodic voltage because of rectification. We generally observe anodic dielectric breakdowns in PEO, not cathodic ones.
Anodizing is usually performed in acidic solutions; the cell voltage ranges from 3–5 V up to the voltage before sparking. On the other hand, PEO is operated at an electrolytic cell voltage exceeding the dielectric breakdown limit by a few hundred volts. Numerous luminescent sparks move across the surface, establish a vapor plasma envelope, and oxidize the surface. In this manner, PEO exploits the arcing phenomenon to grow and consolidate the oxide layer, consequently strengthening its adhesion to the metallic substrate [4,5]. Due to the marked attribute of electric discharges, PEO processing is also referred to as micro arc oxidation, spark anodizing, micro plasma oxidation, anodic spark deposition, anodic plasma chemical treatment, and micro arc discharge oxidation. Still, the initial period of PEO treatment has to go through anodizing to develop the barrier layer, then reach the point where dielectric breakdowns begin.
Aluminum, magnesium, and titanium alloys are lightweight metals of industrial importance, especially in the transportation sector. The harsh service conditions of these metals demand some kind of protection. Protections based on natural oxide are conventionally performed through anodizing [5,6,7], chromate conversion coating [8,9,10,11], or their variants. For instance, for body painting in the aviation industry, chromate conversion coating is regarded as the standard surface passivation technology for the aluminum aircraft fuselage. Although most of its formulations are proprietary and diverse, the chemistry of a chromate conversion coating is basically the same and largely understood; it involves not only the reduction of hexavalent chromium ion into trivalent Cr hydroxide but also the oxidation of a fraction of the underlying aluminum (the main element) and copper (the principal alloying element) of the substrate [8,9,10,11]. In other words, a resilient coating can be achieved by oxidizing a fraction of metal surface. However, the search is on for a replacement, since Cr6+ chemicals have been identified as carcinogens. To safeguard public health, the European Chemical Agency has banned the use of hexavalent chromium chemicals, starting in 2017 [12]. Long before the ban of hexavalent chromium was enforced, tremendous efforts were devoted to finding substitutes for chromate conversion coating and other chromic acid anodizing techniques that require the strong oxidation potential of hexavalent chromium. Many surface treatment methods have been put forward. PEO is viewed as a promising technique.
A favorable quality of PEO coating is its strong adhesion to the substrate, originating from the oxygen species diffusing through the oxide layer and reacting with the underlying metal. Unlike the chromate conversion coating, being driven by the high oxidation potential of Cr6+, the metal oxidation of PEO is driven by the steep electric field, estimated at 107–108 V·m−1. Hence, PEO processing does not involve harmful chemicals to the environment; it is chromium-free. The electrolytic solutions of PEO comprise ordinary chemicals, such as sodium and potassium silicates, phosphates, and aluminates. Their pH values are generally higher than 10, regulated by sodium or potassium hydroxides. These alkaline solutions are less detrimental to the environment than the acidic solutions of anodization, implying fewer disposal problems. Moreover, the surface pretreatment of PEO is also simpler compared with anodization. Hence, PEO is a green coating technique.
Despite the superior wear resistance and improved corrosion resistance, PEO has a few drawbacks that limit its widespread commercialization. Its operation consumes too much electricity and energy. To maintain the micro arc state, high voltage and current (400–700 V and 8–10 A·dm−2), are required for Al-based alloys, somewhat lower than for Mg- and Ti-based alloys [13,14]. Only a fraction of the consumed electricity is directed to metal oxidation. Other parallel events require electricity and energy, such as the ionization of plasma, water evaporation, water electrolysis, joule heating, and excess gas evolution [15,16]. Accordingly, PEO is mostly applied to samples with a small area (less than 0.5 m2) so that the power consumption is controlled at a reasonable level. Treatment of large workpieces is restricted to high value-added items in the defense and aviation industry.
The second drawback concerns the inherent porosity, which may reach 20% if not controlled properly [17]. The iconic sparks of PEO work both ways: densifying the grown oxide, as well as generating the pores within. Electric discharges channel through the vapor envelope and the oxide layer in the time scale ranging from fractions to several tens of milliseconds, often in a cascade. These discharges leave behind pores and other structural damage. At the same time, discharges also provide thermal energy to melt and densify the coating. The temperature of the ordinary sparks may reach 16,000 ± 3500 K in the core, and ~3500 K in the peripheral region [18,19,20,21,22]. These high-temperature events are short-lived; they are quenched right away by cooling in water. The steep temperature gradient produces residual stresses, which could give rise to fissures in the coating [23,24]. However, cooling is required; otherwise, the electrolytic system runs out of control due to overheating.
Despite these shortcomings, PEO found its way into the Russian industries of ship-building and repairing approximately 110 years ago [25]. Back then, Surface oxidations of the Al-alloy workpieces were empirically performed with an imposed voltage over 200 V, with many unsettled questions on its mechanism and its electricity control. Fortunately, research from the past 40 years has made tremendous progress in exploring the PEO fundamentals, largely due to the efforts of European and Russian researchers. These achievements have been summarized in several reviews [4,26,27,28,29,30]. It is worth mentioning that plasma electrolytic oxidation belongs to a branch of electrolytic plasma technology, including many surface treatments with the metal sample as a cathode or anode surrounded by a gas envelope accompanied by luminous discharges. The electrolytic plasma technology has applications in both cleaning and coating the metal surfaces. Excellent reviews can also be found in the scientific literature, which discusses the broad scope of electrolytic plasma processing [31,32,33,34].
In this review, we focus our attention on soft sparking issues of the Al-, Mg-, Ti-based metals, since this phenomenon uniquely generates a dense inner layer without porosity. Our review indicates that most investigations are performed with Al-based alloys, which mold the current knowledge on soft sparking. Nonetheless, attempts to reproduce soft sparking transitions on Mg- and Ti-based alloys do not reproduce the same quality of dense inner layer, although the electrolytic solution contains aluminate and the operation conditions fulfill the soft sparking requirements. This conclusion suggests that the current knowledge on Mg and Ti metals is incomplete. Understanding the rectification and densification of Mg- and Ti-oxides ought to enable us to create dense inner layers without aluminum oxide.

2. Observations and Factors in Soft Sparking

2.1. Transition Phenomena

Soft sparking (or soft regime) denotes an abrupt transition in the micro arc state of a seemingly routine PEO. It is manifested through declines in light and acoustic emission intensities, when the imposed cathodic (negative) electricity is higher than its anodic (positive) counterpart. If operated in a constant current mode, the transition emerges as a sudden drop in the anodic cell voltage, which otherwise increases progressively. We utilize these phenomena to recognize soft sparking on the aluminum alloys and anticipate a coating with dense oxide firmly adhering to the metallic substrate. In the meantime, we ought to admit our lack of knowledge on its underlying physics and chemistry. Lack of understanding is made evident when we search for equivalents in Mg- and Ti-based alloys, using the knowledge gained from aluminum. Soft regimes of Mg and Ti do not seem to follow the same criteria specified for aluminum; they depend on the coating constituent as well. Even if the phenomenological criteria are met satisfactorily, the operation may not produce the desired microstructure. Our discussion of soft sparking begins with Al-based alloys and their beneficial effects, and then extends to its analogs on Mg- and Ti-based alloys.

2.2. Microstructure Features

The resultant coatings after soft sparking are commonly described as a porous layer of pancake-like melt on top and a dense inner layer of sizable thickness near the metallic substrate. Figure 1a shows such morphological features in a coating ~100 µm thick on the sample of 6061 alloy, similar to the PEO coating with soft sparking in [35]. The cross-sectional image indicates that the dense inner layer is ~60 µm thick, and the thickness of the porous layer is ~40 µm. The border is essentially fuzzy between these two zones with and without pores; hence, some researchers may divide the coating into three zones instead of two. Nonetheless, the dense inner layer is a remarkable quality, in contrast to those PEO coatings without soft sparking. A typical image of ~47 µm thick coating without soft sparking is shown in Figure 1b. Note the microstructural difference near this metal–oxide interface; the interfacial oxide layer has scattered pores just like the rest of the coating.
It is the dense inner layer that inspires researchers, since the dense oxide well protects its underlying metal from corrosion and moisture penetration, especially valuable for those applications requiring high reliability. Furthermore, the dense layer near the metal substrate is enriched in α-alumina [35,36,37,38]. It is widely known that the α-alumina phase has superior mechanical strength and resists mechanical scratches. Yet its formation is not straightforward; it usually nucleates and grows at the expense of other transition aluminum oxides of lower specific gravity. We presume that soft sparking creates an environment beneath the porous layer that allows the transition alumina to undergo densification and phase transformation into α-phase. The benefits of a dense layer with α-alumina may be difficult to reproduce on the Mg- and Ti-based metals, since each metal oxide nucleates, transforms, and sinters differently. One example has been given in the PEO study on the titanium metal surface. When using galvanostatic mode with various cathodic components, Aliasghari and co-workers [39] observed similar plunges in cell voltage and in acoustic and optical emissions, but no visible densification effect on its PEO coatings was produced.

2.3. Plasma Softening

To bring forth soft sparking transitions on the surface of Al-based alloys, common practice involves an electrolytic solution of sodium silicate (typical ~2–10 g·dm−3 Na2SiO3) and potassium hydroxide (~1–2 g·dm−3 KOH), operated in a galvanostatic mode with the cathodic current that exceeds the anodic current by 20–35% in charge quantity. A trait of this solution recipe is the aluminum oxide of coating originates from metal oxidation, not from the solution species. Equally important is that the surface has to accumulate a substantial thickness of oxide; the subsequent transition yields the dense microstructure in thick coating. The transition involves an anodic voltage drop of ~30–40% in magnitude. The voltage may fluctuate more significantly than usual during the transition [40,41]. In the electrolytic solution of Na2SiO3 and KOH, the color of the electric arcs changes from yellowish to white, and is visible to the naked eye [35,40]. After the voltage drop, the anodic voltage slowly rises again or stays at a steady value [40]. If the voltage drop is more than 50%, the anodic voltage may descend to a very low value, directly leading to plasma extinguishment. When the surface plasma is extinguished, metal oxidation ceases as well. If further oxide growth is desired, we must avoid a voltage drop exceeding 50%.
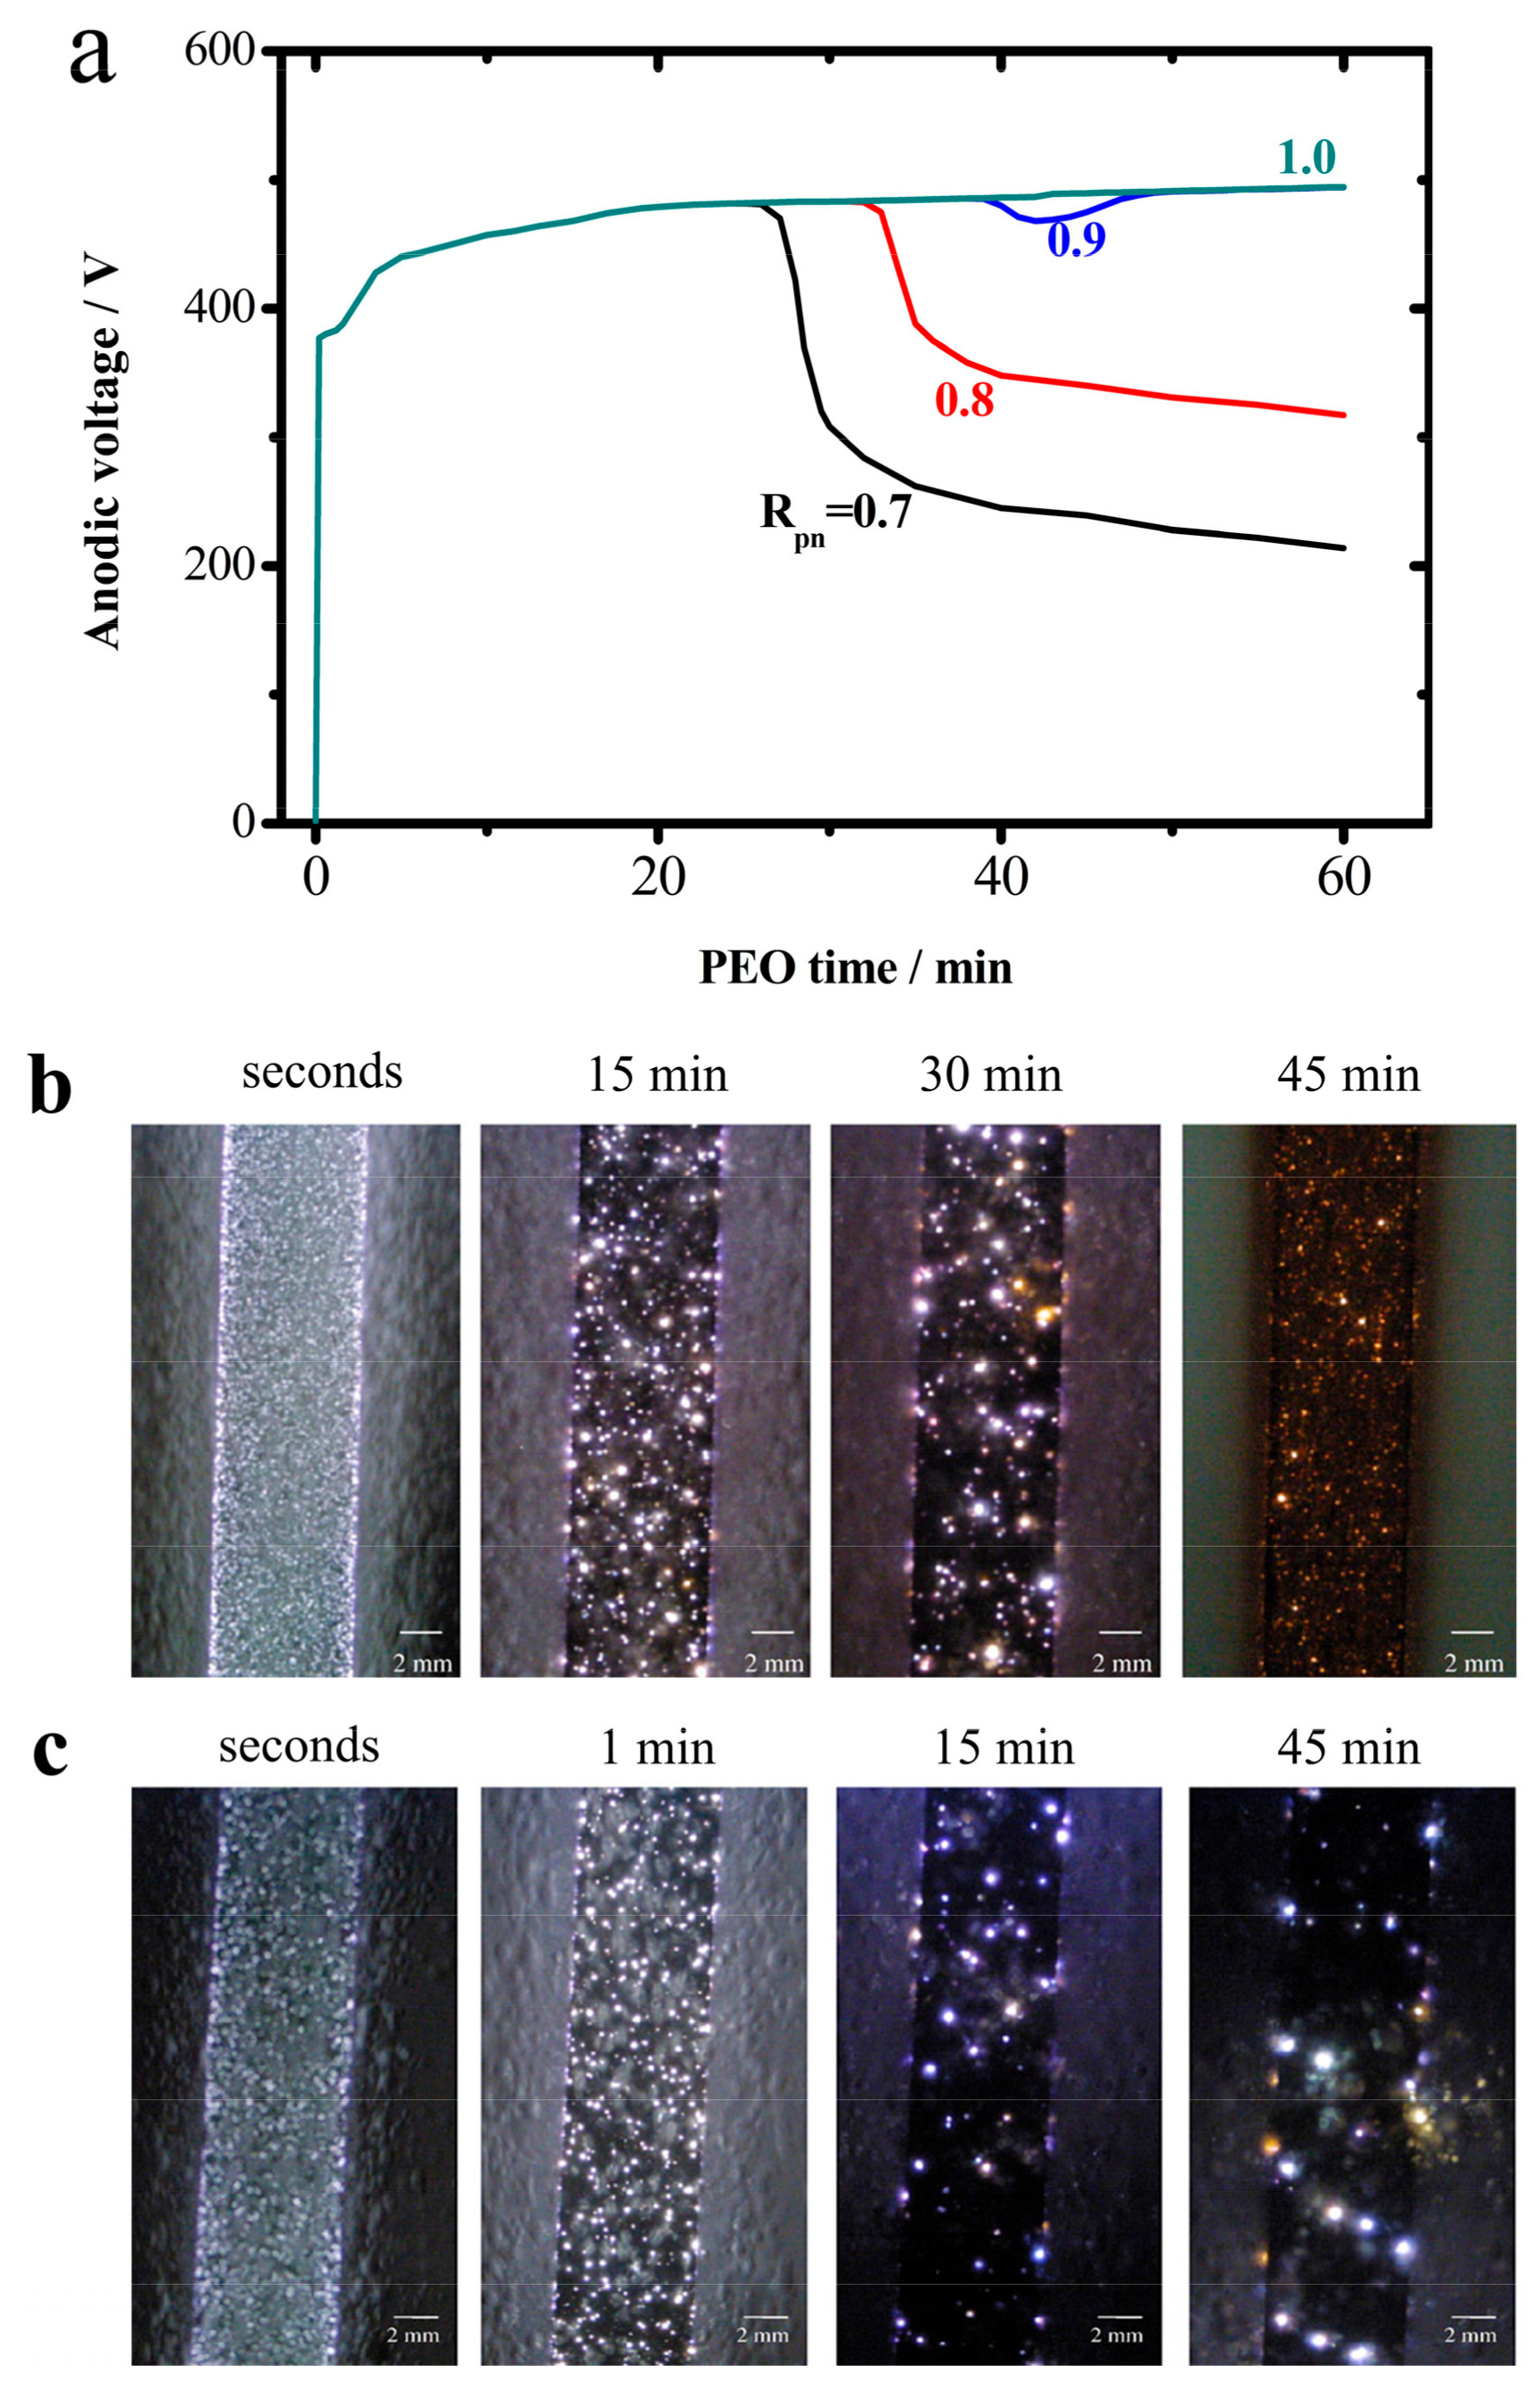
Figure 2a presents four anodic voltage versus time curves, operated with Rpn = 0.7, 0.8, 0.9, 1.0, in the surface oxidations of 1050A aluminum alloy [40]. Rpn is defined as Qp/Qn, the ratio of positive over negative charge quantity. On Al-based alloys, the transition phenomena are related to Rpn, pronounced at sufficient negative current settings, Rpn = 0.7–0.85; insignificant or none at 0.9, 1.0. The transition occurs at an earlier moment with a less Rpn value. However, if the Rpn value is too low, the plasma could extinguish prematurely.
Mecuson and co-workers [35] have captured the arcing differences between two surfaces of 2214 aluminum alloy with and without soft sparking. A time-series graph is illustrated in Figure 2b with soft sparking. Another time-series graph in Figure 2c is without soft sparking. Figure 2b shows how the arc intensity and number density vary with processing time at Rpn = 0.89. Within the first 30 min, the three images of Figure 2b display a typical evolution of arc population; the initial surface of hazy glow with tiny arcs evolves into a surface of distinct and size-growing light spots. Around 40 min, the acoustic emission intensity decreases and the surface darkens, signaling the occurrence of a transition. The drastic reduction in light intensity forced the authors to take the last image in Figure 2b, at 45 min, with camera integration time 200 times higher than that of the three images before 45 min. In contrast, the images of Figure 2c with Rpn = 1.57 display the conventional variation in arc population without changing the integration time. These arcs continue growing in size and dwindling in number without a sharp transition [35]. If two images of the same PEO time, 15 min, are compared, we note that the spot sizes are bigger and brighter for Rpn = 1.57, although the number of light spots is higher for Rpn = 0.89. Comparison of the two series points out that the light emission of Rpn = 0.89 is less intense, its plasma is softer, even though the electric discharges of Rpn = 0.89 generally exceed that of Rpn = 1.57 in number.

2.4. The Cathodic Current Sets the Tone

A vital precondition to enter the soft regime is that the imposed electricity must have a cathodic component. For Al-based alloys, the cathodic component in the processing parameters has to exceed the anodic component, expressed as either the current ratio or the charge quantity ratio. The cathodic electricity uniquely improves the coating quality, even if its share is not high enough to produce soft sparking. This improvement was recognized around the turn of the 21st century or earlier, before the phrase soft sparking was devised. Enhancement of the cathodic electricity is counter-intuitive. After all, the metal surface oxidizes when being polarized positively, not negatively. A question naturally arises: “Why does a cathodic component improve the PEO coating quality?”
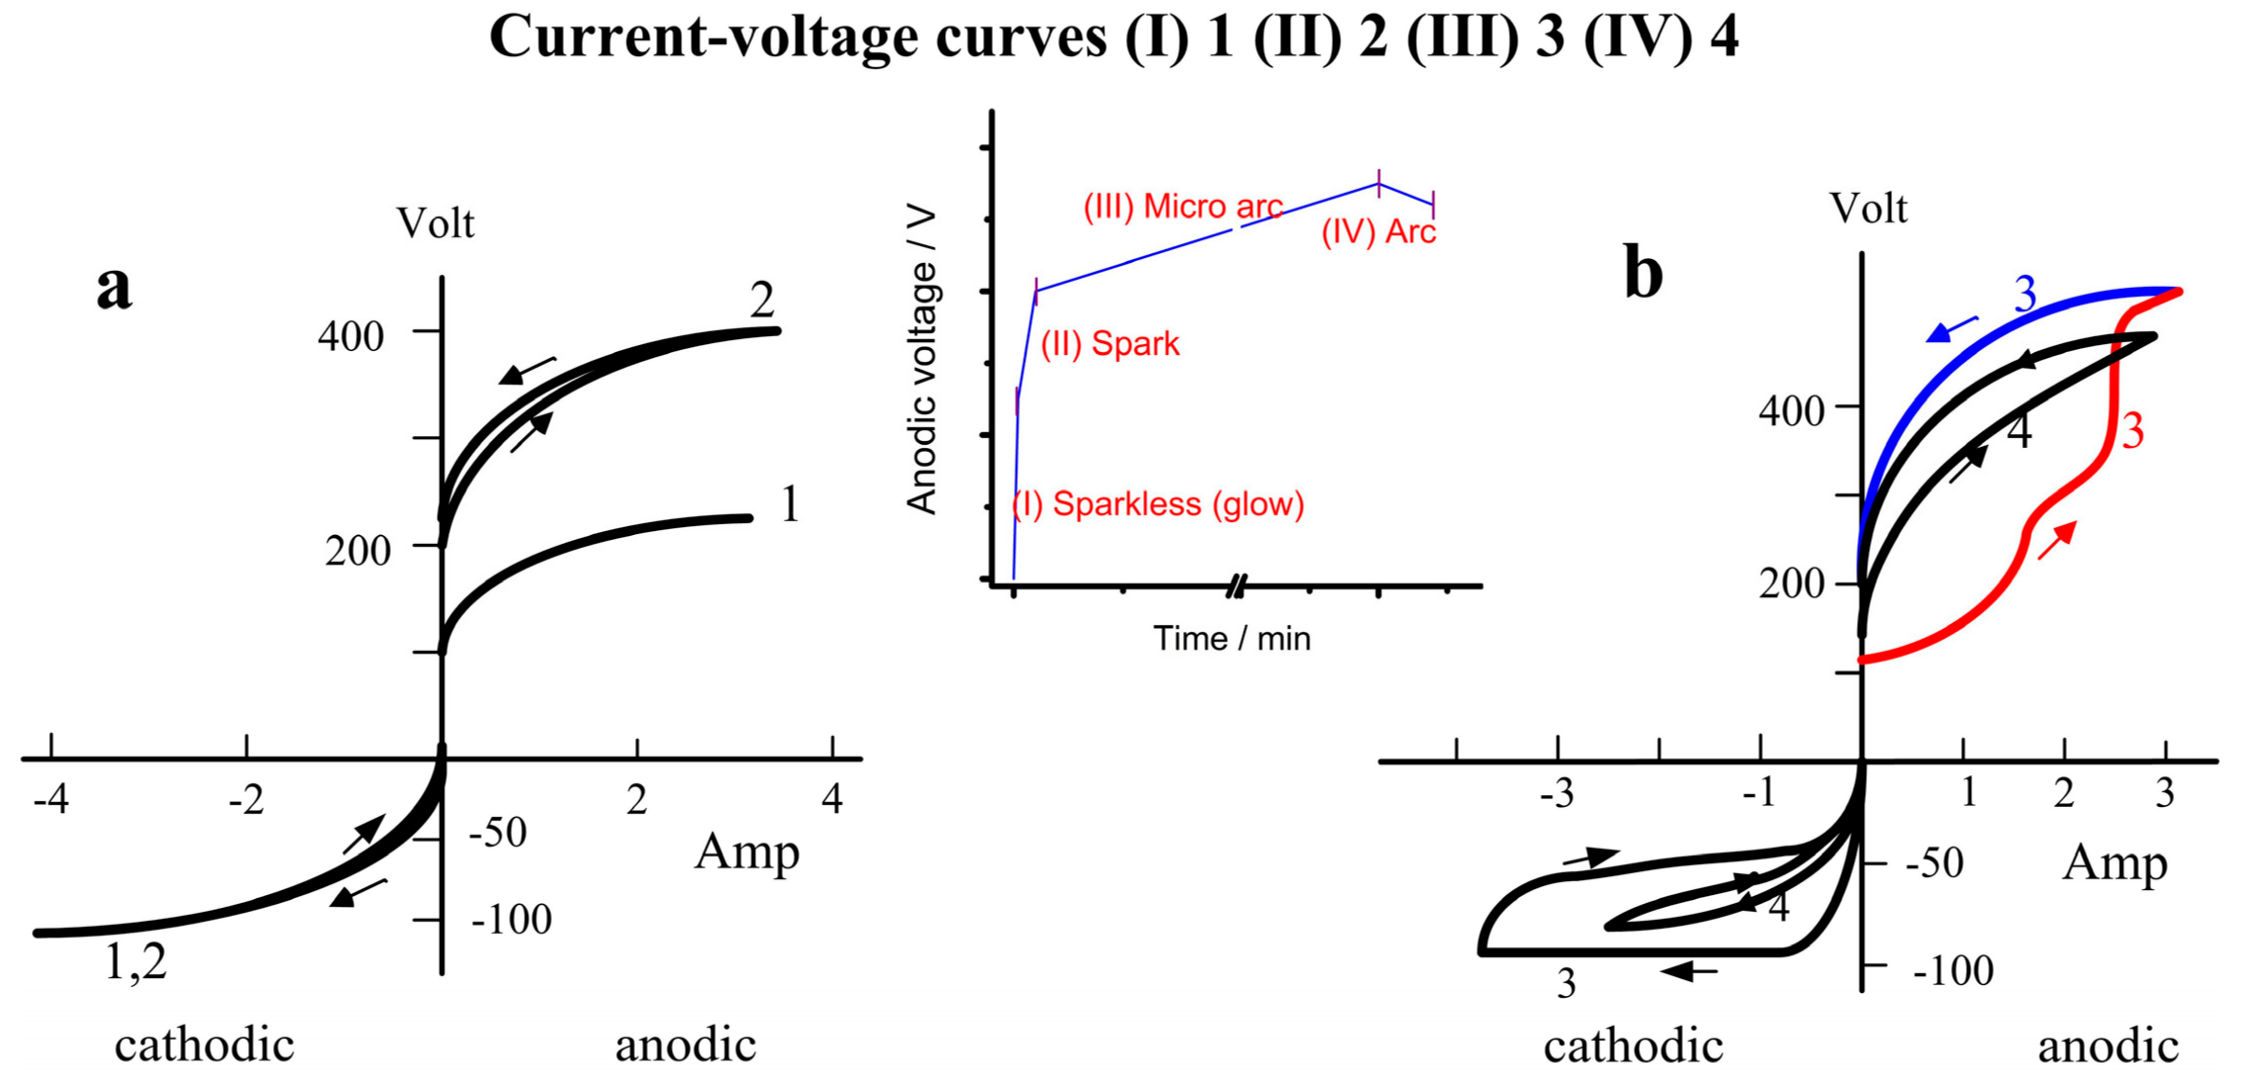
Researchers noted a thicker, harder oxide layer of superior uniformity could be grown on Al-based alloys using a current with a cathodic component, before they recognized the transition phenomenon [37,42,43,44,45]. Timoshenko and Magurova (T&M) [46] were perhaps the first to summarize and interpret the influences of the cathodic current. T&M’s summary, in the year 2000, is more enlightening than the other two works that stressed the significance of cathodic component of AC and PEO industrialization [47,48]. They gained insights from the current–voltage curves (CVCs) with an AC power source, and pointed out the influences that were common to many Al alloys. Figure 3 presents four symbolic CVCs at the four coating stages, which are denoted as (I) sparkless, (II) spark, (III) micro-arc, (IV) arc stages. Definitions of the four stages are illustrated in an inset. Figure 3a shows CVC-1 and CVC-2, which belong to the sparkless and spark stages. Figure 3b presents CVC-3 and CVC-4 of the micro-arc and arc stages, respectively.
Since the Schottky barrier builds up quickly at the interface, the positive voltage is higher than the negative voltage right from the start (Figure 3a). The grown oxide is an n-type semiconductor that rectifies electricity even before sparking [49]. We shall pay more attention to hysteresis of the CVCs in the micro-arc stage, since most of the coating is grown in this stage.
(1)
Sparkless (glow) stage, CVC-1. The sample glows in this stage, up to the spark voltage ~255 V; its oxide growth is similar to that of anodizing. No hysteresis is observed in CVC. The oxide thin film could be incomplete, or, even if complete, have a large number of defects. This period is very brief.
(2)
Spark stage, CVC-2. In this stage, small sparks emerge, migrate, and distribute on the metal surface homogeneously. The anodic voltage rises to ~400 V. The voltage difference between the positive and the negative polarization can be attributed to the Schottky barrier and the gas envelope of the spark. A small hysteresis exists in both anodic and cathodic CVCs.
(3)
Micro-arc stage, CVC-3. The sparks increase in size and intensity, and migrate to the metal surface. The anodic voltage rises slowly to ~550–570 V. Hysteresis in the current–voltage plot is most significant during the micro-arc stage. The micro-arc stage could last 45–60 min. If thickness is not the primary goal (<70–80 µm), the operation could end in this stage.
(4)
Arc stage, CVC-4. The arc size further increases. A portion of the coating is destroyed. The anodic voltage could drop a little, down to ~500–520 V. A coating of good quality ought to avoid entering the arc stage since those strong electric discharges could damage the oxide coating. Such damage is difficult to repair.
Without much experimental evidence, T&M [46] gave an interesting discussion on CVCs at the metal–oxide–electrolyte interface. They highlighted the large increase in hysteresis from (II) spark to (III) micro-arc stage. In the spark stage, the negative and positive space-charge zones had formed at the metal–oxide interface. The (II)–(III) advance was viewed as the point when the space-charge region shifted deep into the oxide, since the oxide had grown thicker and the interface resistivity increased as a whole. In the anodic half of CVC-3, as the system just switched from cathodic to anodic current, the cathodic current provided negative charges to the oxide and narrowed the space-charge layer; therefore, the system conductivity increased so that the voltage (in red) did not increase as expected. When the system reached the highest point of the CVC, the system had stayed in the anodic state for quite a while, and the charge carriers had been removed due to oxidation and the space-charge layer was widened again, so that the system resistivity increased. That was why the system returned a higher voltage (in blue) and generated a large hysteresis. The voltage difference, between the blue and red curves, was the aftermath of an earlier cathodic excursion that refreshed the coating in the anodic period with less dielectric breakdowns and lower voltage, at least in the rising curve (in red).
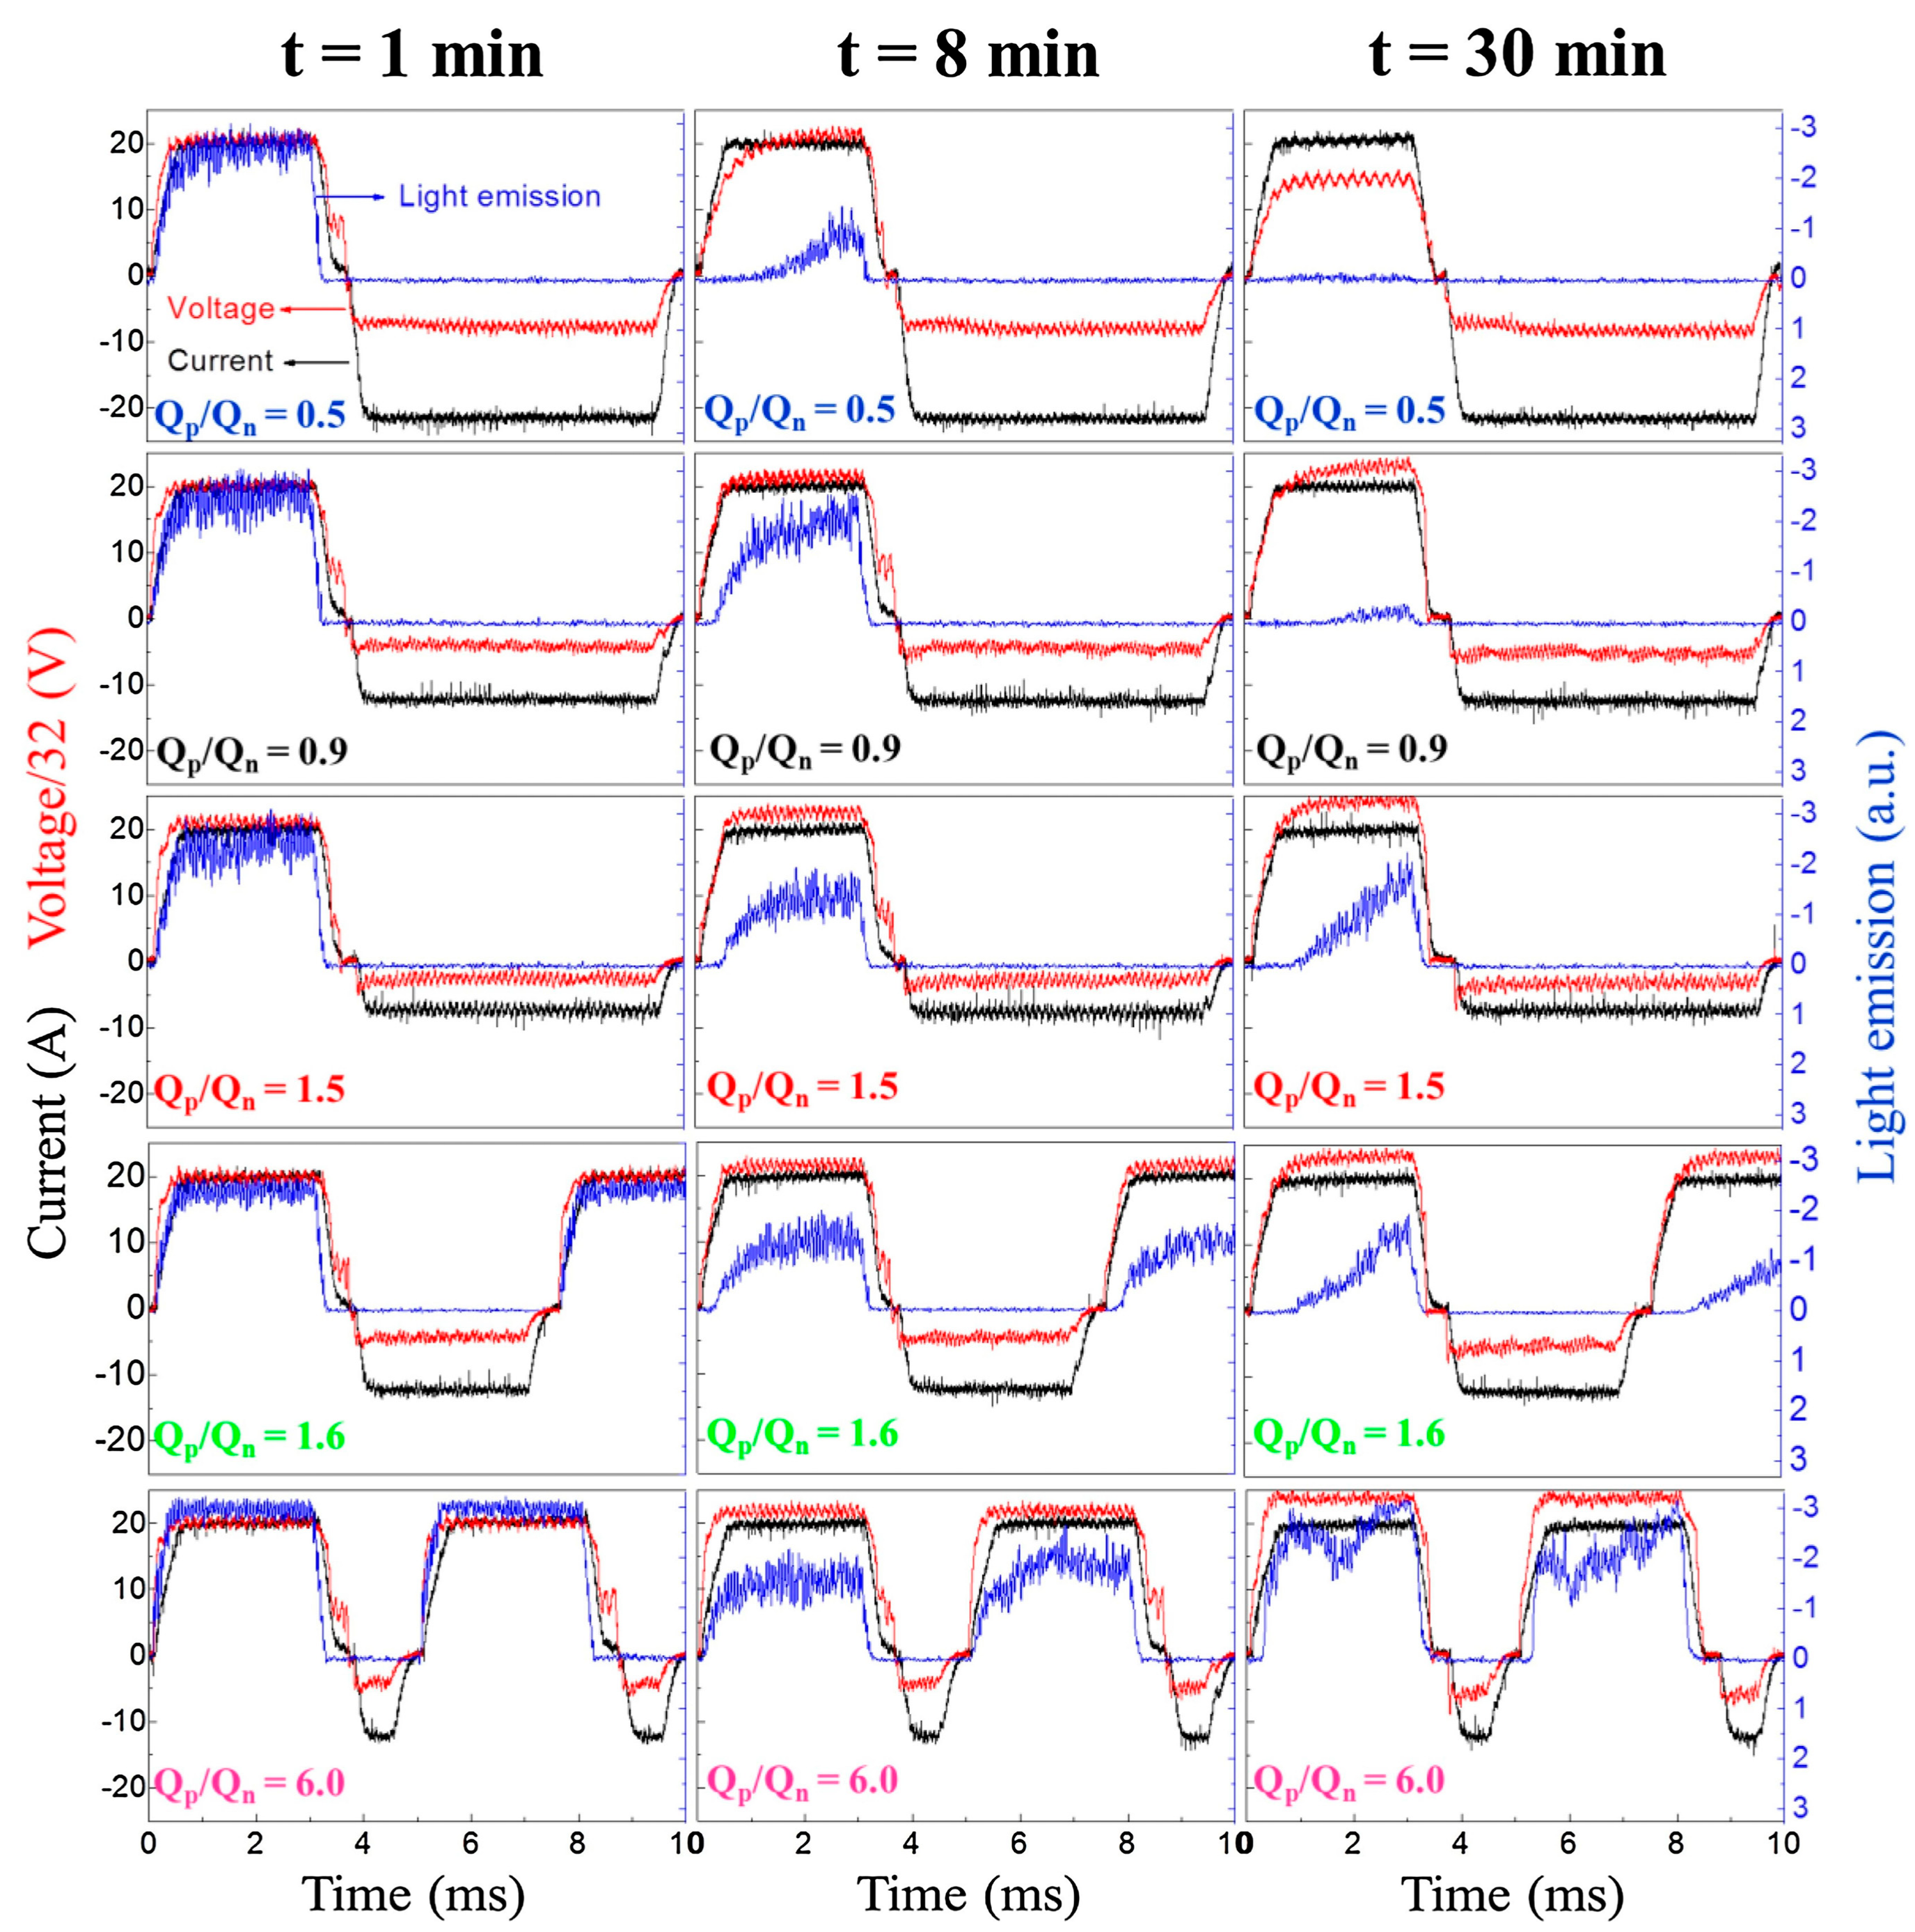
Using a pulse bipolar power, instead of AC, Martin and co-workers [50] recently substantiated many T&M inferences and filled in extra data on the substrate of 2214 aluminum alloy in a prototype solution. They further proved that setting a lower Rpn ratio, expressed in Qp/Qn in Figure 4, delayed the microdischarge appearances in the anodic period and reduced the plasma intensity. Their data on voltage, current, and light emission in the consecutive pulses are plotted in Figure 4. The reported voltage data verify the T&M conclusions that the preceding cathodic pulse diminishes the voltage of its subsequent anodic pulse. In other words, hysteresis in voltage manifests itself in a different form. The “supposed symmetric” trapezoid of anodic voltage pulse recedes in the front, because the preceding cathodic excursion diminishes the resistance of oxide coating. The rear half of the anodic voltage trapezoid resumes the ordinary shape, since the coating receives sufficient positive charges and recovers its high resistance. This voltage influence amplifies with PEO time since the coating thickness continues increasing. The voltage influence also increases with a decreasing Rpn ratio because more residual charges (negative) remain in the oxide coating.
Also plotted in Figure 4 is light emission, which stands for the microdischarge activity. Pronounced intensity spikes are found in the anodic polarization, not in the cathodic polarization. This observation is consistent with the general perception that microdischarges occur during anodic polarization, but rarely in cathodic polarization. Even more importantly, Figure 4 shows that the light emission is strongly affected by the Rpn ratio [50]. If the light emissions at 30 min are compared, Rpn = 0.5, 0.9, 1.5, 1.6, 6.0, the microdischarge activity is evidently suppressed at a low Rpn ratio. The light emission of Rpn = 0.9 lingers near the end of the anodic pulse, while that of Rpn = 0.5 essentially vanishes. Indeed, the cathodic component of Rpn = 0.5 was large enough to enter a “seemingly” soft regime, since its anodic voltage dropped and light emission diminished at ~8 min. Nonetheless, the authors reported that the coating of Rpn = 0.5 did not have the expected thickness and the dense inner layer. The oxide coating of Rpn = 0.5 was thin and uneven. The cathodic quantity of Rpn = 0.5 was more than sufficient; the negative current had etched away the oxide coating grown in electrochemical oxidation. Hence, the share of cathodic component ought to be restricted to allow sufficient oxide to grow and accumulate before transition at the metal surface to bring forth a genuine soft sparking.
Martin and co-workers showed that, even if the Rpn ratio was not low enough to produce the soft sparking phenomena, the cathodic component is still capable of lessening and delaying the microdischarge activities with Rpn = 0.9 and 1.5, Figure 4. Hence the cathodic component helped to avoid the damaging high-spike discharges when the coating was thick. This effect is known as “plasma softening,” which is critical to the closing stage of PEO operation. In the early period of oxide coating, electric discharges of tiny size provide energy to activate the reactions associated with growth. The number of discharges is huge, but low in individual intensity. As the oxide is thickening, discharge events grow strong and dwindle in number, developing into cascades of destructive discharges. The cathodic current plays a key role in curbing these breakdowns. Thus, a proper Rpn ratio is crucial; a proper cathodic component prompts the soft sparking transition at the right time.
The above discussion reveals the oxide coating develops seemingly alike, essentially different rectification properties when the imposed current has a different Rpn ratio. Since rectification of the metal–oxide–electrolyte interface is regulated through the space-charge zones of metal–oxide and oxide–electrolyte, it is of interest to ask “what are the carriers driven by the cathodic current to affect the rectification properties?”
On the electrolytic solution side, when the interface is polarized positively, it attracts anions. When polarized negatively, the coating attracts cations. Even though cations do not contribute directly to the oxide growth, they indirectly affect the interface resistance and capacitance. Rogov and Shayapov [51] showed that the rectification (valve) effects were pronounced for Na+ and K+ ions, less for Li+ and Et4N+, and worst for Ca2+. A large hysteresis was observed on CVCs of Na+ and K+, but not Et4N+ and Ca2+ during the micro-arc stage. Hysteresis and the accompanying threshold voltages were associated with cation mass transfer in the porous coating and their hydration energy values. Therefore, plasma softening due to the cathodic current works well in the electrolytic solutions of Na+ and K+, less effectively in the solution of Li+, and not at all in the solution of Ca2+.
In the literature reports discussing the dielectric properties of valve metal oxide (fully dense, without porosity), not PEO oxide, proton was suggested as the carrier responsible for electrolytic rectification [2,3]. In the PEO oxide, there must be a charge carrier driven by the electric current to narrow or expand the space-charge region. When the dense inner layer has been established on the metallic substrate, the influences of Na+ or K+ move outward and the charge carrier of dense oxide plays a more important role in rectification. This charge carrier has been suggested to be proton (H+), which is small enough to interstitially associate with the oxygen anion of crystal lattice [52]. Proton generation could be in the double layer through aluminates, suggested by T&M in the form of aluminum hydroxide [46], or demonstrated through intentional acidification by Rogov [52]. Rogov and co-authors have proposed a comprehensive mechanism in which the proton carrier plays the major role of oxide partial reduction, conductivity enhancement, and charge retention during cathodic polarization, and effecting delayed oxidation in the following anodic polarization [52]. Accordingly, the anodic voltage drop of soft sparking transition is considered: as the conductivity of the whole coating comes to a critical point where protons are attracted and accumulated, its content reaches a certain level, as does the conductivity of the metal–oxide–electrolyte interface.

2.5. Plasma State in Electron Temperature

Evidently, if we are able to evaluate the plasma state with accuracy, the softening signals shall be detected before the soft sparking transition occurs, since the sparking must be softened before transition. Optical emission spectroscopy (OES) is the most promising tool for that purpose. Researchers have employed OES in monitoring the electrolytic plasma on Al alloys. The following spectral lines are commonly analyzed; 309 nm (Al I), 396 nm (Al I), 656 nm (Hα) 486 nm (Hβ), 589 nm (Na I), 777 nm (O I) [17,53,54,55]. Under the assumption of local thermodynamic equilibrium, the intensity ratio (Jma/Jnb) of two spectral lines of the same atom can be used to extract the (plasma) electron temperature Te of a specific location, using Equation (1). Jma, Jnb denote the integral intensities of two spectral line ma and nb transitions, respectively.
J m a J n b = g m A m a λ m a λ n b g n A n b exp ( E n E m k B T e ) ,
where λma, λnb are the spectral line wavelength; Ama, Anb are the spontaneous probabilities of ma,nb transitions. Em, gm denote respectively the energy and the statistical weight of the upper level m, while En, gn are defined on the upper level n. kB is the Boltzmann constant. Various electron temperatures can be computed with a different choice of element. It is generally accepted that the Al emission lines ought to be employed in analyzing PEO of Al alloys.
Many issues affect the analysis and interpretation of the OES signals. If a treatment cycle lasts for a long period of time without soft sparking, for instance 5 h, a decrease is noted in electron temperature, starting ~8000 K, and winding down ~3000 K at the end. Meanwhile, the spectral features shift from the early lines of aluminum toward those lines originating from the electrolytic solution (for instance, Na+, K+) [56]. Most OES measurements are focused on an area that covers more than one discharge event, even when the signals are collected with an optical fiber. Therefore, most of the OES data denote the collective behavior of surface plasma, not individual discharge. Typically, the so-reported Te values, estimated with Equation (1), fall in the range of 4000–5000 K [56,57]. Discharge events could occur in a repeated cascade at the sites of deep pores [22]; a phenomenon should be avoided. It is difficult to correlate discharge events with the local structure of coating, since the causality relation is often uncertain [17].
The optical signals of plasma are constantly fluctuating throughout the coating process since microdischarges are short-lived in nature. These fluctuations are translated into electron temperature spikes of ~10−3 s duration over a wide amplitude range. Hussain and co-workers [57,58] managed to divide these spikes into three categories, A, B, and C, which were classified according to their specific sites in oxide coating. The spikes of B type were the strongest, originating from the metal–oxide interface. The C-type spikes were weak in amplitude, occurring at the oxide–electrolyte interface. The amplitude of A-type spikes was in between, taking place within the oxide coating. Spikes of A- and C-types established the baselines of the Te-versus-time plots, while the B-type spikes were the main sources of Te peak. However, whether the strong spike in Te corresponds to the strong discharge event was questioned in another study [59].
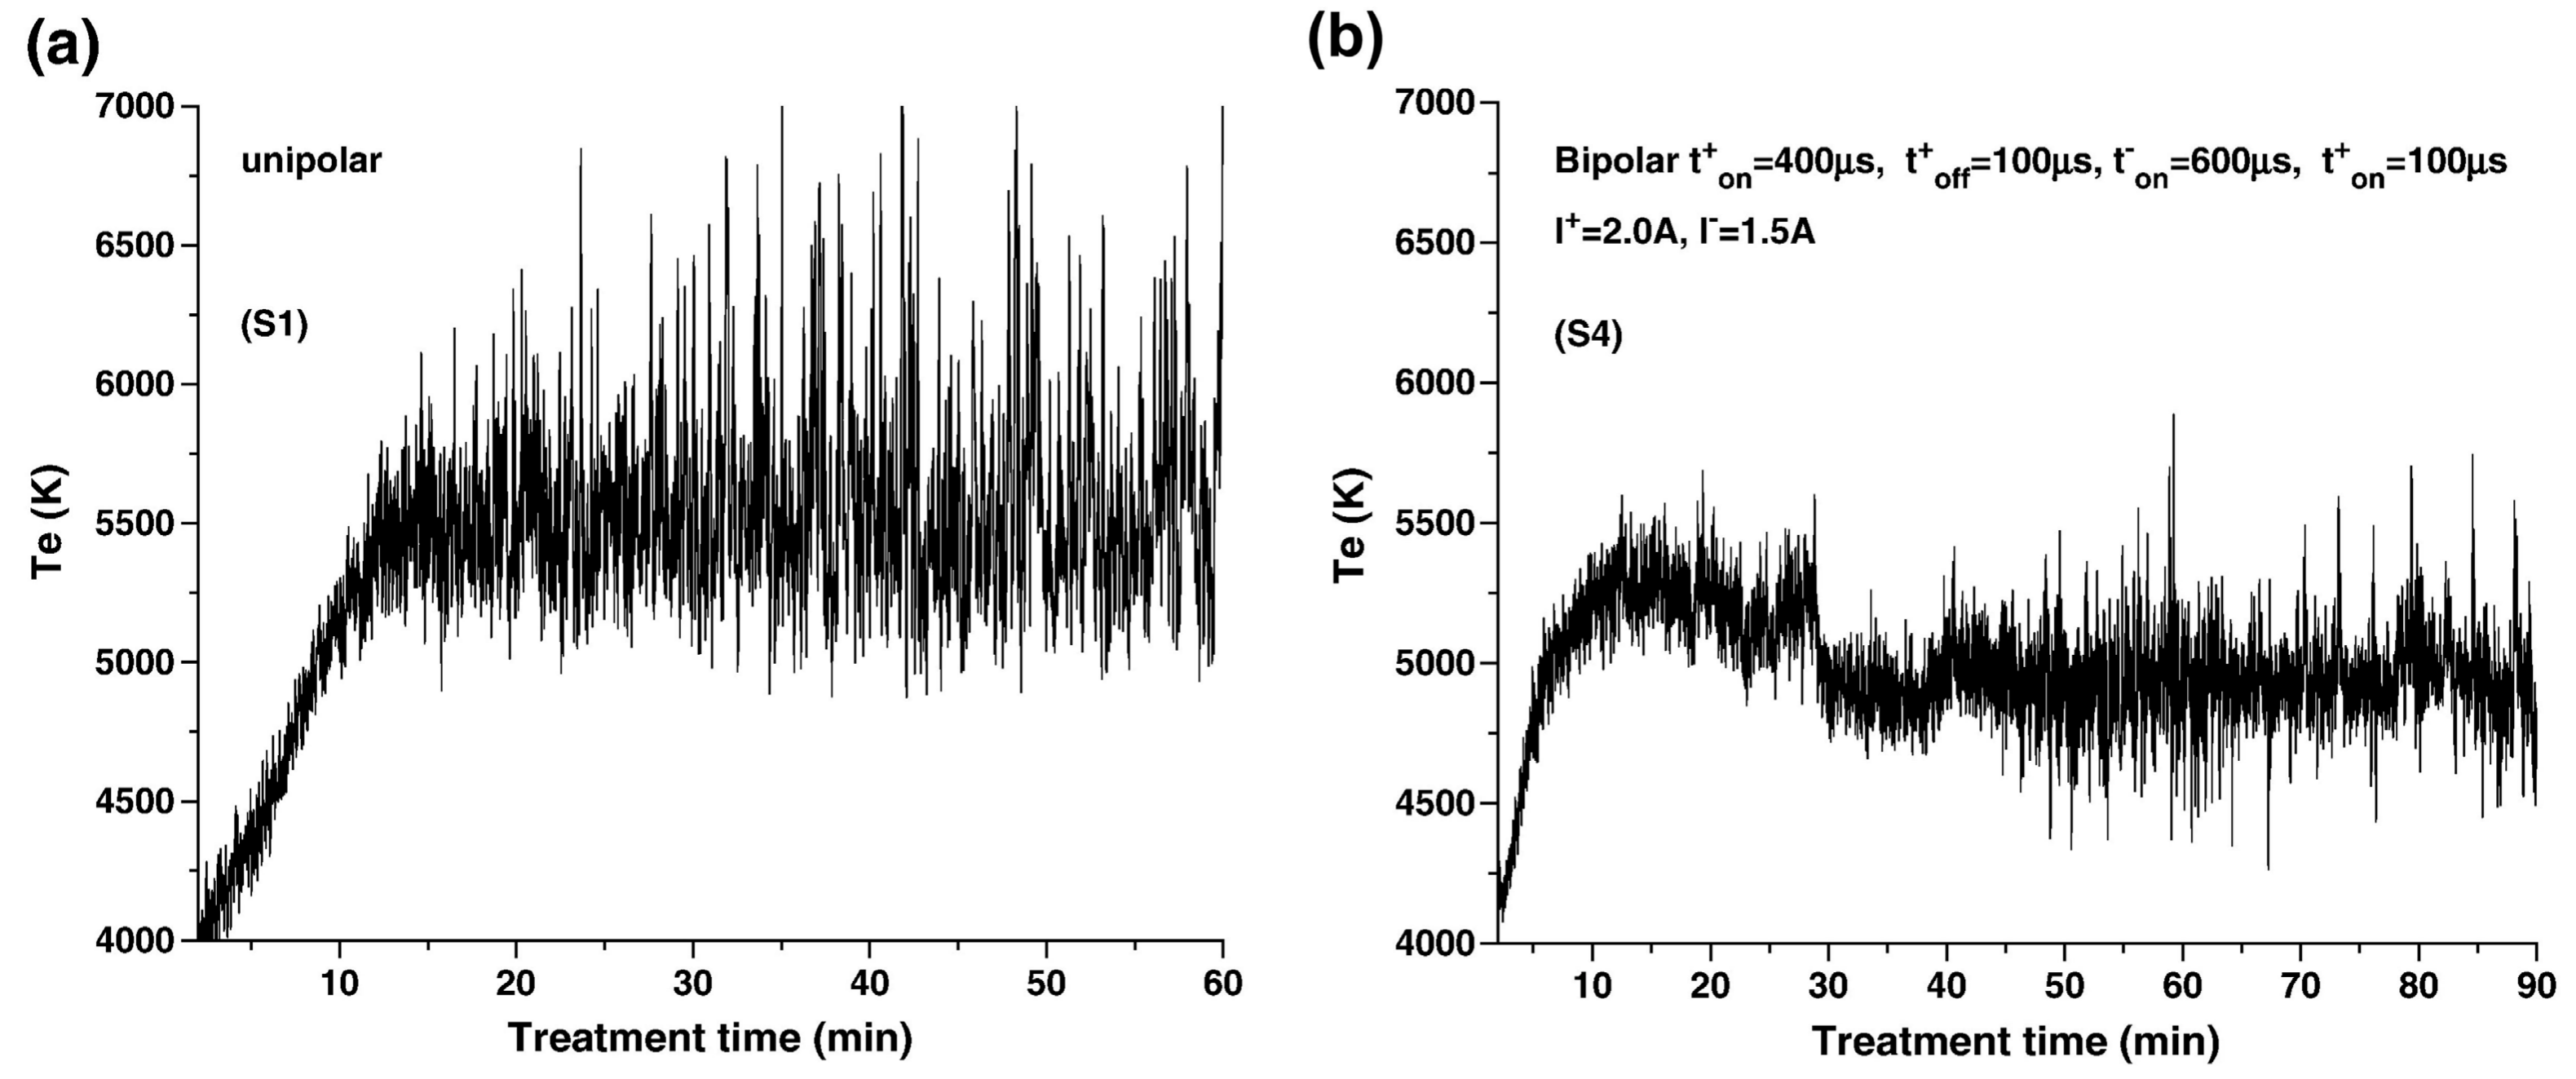
Hussain et al. argued that the value of Te did not depend on the number of each type of discharges, because the effect of discharge population density was cancelled out by the intensity ratio of Equation (1). The background of electron temperature was established by numerous spikes of A- and C-types. The B-type discharge occurred less frequently than A- and C-types, resulting in a high spike of Te [57]. Consequently, the Te versus time profile provided a track record of the plasma state, including the background noise and the high-temperature spikes. Hussain and co-authors demonstrated the practicality of this concept through comparing the Te profile of a unipolar current (without cathodic component) with those of bipolar currents (with cathodic components) [60]. The track record of a unipolar current PEO, on a substrate of 1100 alloy, showed many B-type spikes of large amplitude, which were consistent with the porous microstructure of its coating. Figure 5a indicates that Te of the unipolar current mode reaches a baseline around 5500 K after 12 min, while its B-type spikes can be as high as 7000 K. In contrast, the Te of the bipolar current mode, as shown in Figure 5b with Rpn = 8/9, has a baseline shift that exhibits an early plateau around 5250 K at 12 min and drops to the next plateau around 4800 K at 30 min. We presume there was a soft sparking transition at 12 min, or later at ~30 min. Clearly, the B-type spikes of Figure 5b are less frequent, and their amplitude does not exceed 6000 K. The microstructure of the resultant coating with Rpn = 8/9 shows a favored bi-layer feature and a dense inner layer with a top porous layer, analogous to Figure 1a.
When the oxide layer has been established on the metal substrate, the signals from PEO constantly vary due to chaotic bursts of physical and chemical events. It is difficult to decide when to terminate, or when and how to intervene the oxidation processing. On these issues, researchers are fully aware of the critical need for a tool to quantify the plasma state in an aqueous electrolyte. Optical, electrical, and acoustic signals have been studied for that purpose [54,61,62,63,64,65]. Current OES technique has achieved more success than the other two, and is on its way to being an in situ diagnostic tool [66,67,68,69]. The technique is still plagued with deficiencies. The collected signal clearly contains local information on discharges. Can the local information be extracted? What is the connection between plasma temperature and pore structure? What is the scale of B-type spike that shall convert into a coating defect? We think the OES technique provides an excellent opportunity to quantify the plasma softening and connect to the coating microstructure. Other techniques, suggested in the past, are either too difficult to perform or too crude in scale. For example, one suggestion is counting the number and measuring the size of pancakes on surface, because a strong discharge leads to a large pancake [35]. The other problem is that the coating microstructure depends on many factors, more so than the plasma state. For example, researchers revealed that that PEO of the titanium surface experienced a soft sparking transition, and a sudden change in plasma, but failed to produce the desired microstructure improvement [39].

2.6. Amassed Oxide and Energy Consumption

In addition to a cathodic component in excess, we need a sufficient amount of oxide to be accumulated on the Al surface before the sparking transition enters a favorable state to sinter the porous oxide into a dense inner oxide. Electrolytic oxidation of aluminum generally yields γ-alumina grains of nanometer size, which are the product of the dehydration of aluminum hydroxide precipitates. Synthesized in low-temperature conditions, γ-alumina is the kinetically favored phase, and is sufficiently stable below ~700–800 °C. Hence, the anodized coating is dominated by γ-Al2O3. When the temperature is raised up to ~1000 °C, the γ–α phase transformation takes place irreversibly. Its transformation rate is influenced by impurities, grain size, and heating rate. The transformation is accompanied by a progressive increase in crystal density, from 3.67 to 3.987 g·cm−3. Therefore, if densification is not involved, the γ–α transformation yields porosity [70,71,72,73].
A small amount of α-Al2O3 usually exists when the PEO coating has grown to ~50 µm or more, without any deliberate effort. Researchers have shown keen interest in raising the α-Al2O3 content of the coating [74], since α-Al2O3 provides hardness, stability, and wear resistance. In the bi-layer structure of Figure 1a, the dense inner layer has been found to contain more α-Al2O3 than usual after soft sparking [55]. A plausible explanation for more α-Al2O3 is that a thick coating retains thermal heat and allows α-Al2O3 to nucleate and grow at the expense of γ-Al2O3 [75]. If this is true, the porous top layer is not redundant; it assists with preserving the heat, which is constantly dissipating in a water-cooled electrolytic cell. Viewing the heat preservation issue from another angle, raising the α-Al2O3 content is expected to be more difficult if researchers attempt work on scanning PEO [76,77]. Under the operation conditions of scanning PEO, the heat is easily dissipated since the heat source (plasma) is moving and restricted in its coverage area.
Matikyna and co-workers [78,79] performed an intriguing experiment to verify the amassed-oxide requisite. Instead of growing γ-Al2O3 and prompting the transition in one PEO run, they divided the coating operation into two discrete steps. The first step was anodizing to deposit γ-Al2O3 on a high-purity aluminum substrate. The second step was to perform PEO such that the porous oxide was densified and phase-transformed with an electric current of Rpn < 1. The substrate could be anodized with sulfuric acid, phosphoric acid, or oxalic acid, and then re-anodized in an ammonia pentaborate solution. PEO was performed with a controlled AC current of 55 A·dm−2 (rms), with Rpn = 0.77 in a typical solution of sodium silicate and potassium hydroxide. The pre-anodized films of various thicknesses were PEO treated for 10 min. The authors showed that the soft sparking transition occurred right after PEO began, or ~1 min later, signaled by an anodic voltage drop from ~320 V to ~200 V, if the pre-anodized film was thicker than 20 µm. Their transitions were also accompanied by a decrease in acoustic and light emissions. The samples of pre-anodized film less than 20 µm did not exhibit the features of soft sparking. Their work confirms that a sufficient amassed oxide is the requisite of soft sparking transition, and shows that substantial densification occurs after the voltage drop.
Nonetheless, judging from their cross-sectional SEM images, the level of densification after PEO appears less ideal compared with the microstructures of conventional soft sparking. A substantial number of pores are visible in the relatively dense layer [79]. We suspect that either 10 min of PEO did not store enough heat to complete the sintering, or the pre-anodized film was too porous to achieve a full densification because the sintered density is affected by the porosity of the green state. In short, the precursor concept of anodized oxide works, but the quality of the resultant coating appears inferior.
One advantage of the two-step oxidation is that it consumes less electric energy than the one-step procedure does, since the anodizing step involves a much lower voltage and current than those of PEO. The first anodizing step acquires a 10–30-fold reduction in power consumption to build up the necessary oxide. Matikyna and co-workers estimated that, for a ~100 µm thick coating, PEO with a pre-anodized porous film might save 57% in energy consumption of the entire process [80,81,82]. The PEO of a pre-anodized film also reduces the PEO time with a controlled voltage mode, achieving 100 µm coating in 25 min, instead of 1–2 h in conventional soft sparking, if the anodizing time is not counted. To the best of our knowledge, the energy-saving percentage of this scheme is much higher than the other two proposed schemes, namely, solid particle inclusion [13] and a reduction of the gap between anode and cathode [14].

2.7. Coating Growth and Uniformity

Due to its inherent porosity, the coating thickness is not proportional to its oxide mass grown in PEO. According to Gebarowski and Pietrzyk [40], the growth rate of PEO, expressed in oxide weight, is not a strong function of Rpn and time. The growth rates in mass are nearly the same for Rpn = 0.8, 0.9, 1.0, though the growth rate of Rpn = 0.7 is somewhat lower since the cathodic component has an etching effect. Thus, we consider that the cathodic component, at Rpn = 0.7, has been set higher than is required for soft sparking on Al-alloys. When the cathodic electricity does more than neutralizing the positive charges, it reduces and decomposes the oxide coating. The authors also mentioned that the coating contained an area of non-uniform thickness for Rpn = 0.7. On the other hand, in terms of thickness, the growth rate significantly varies with Rpn and time. The growth rate reaches its maximum around 45 min, then decreases. The significant decrease in thickness, plus the same rate of mass increase, suggests that sintering occurs between 45 and 60 min. We conclude that densification occurs mainly after the soft sparking transition.
A slightly different trend was reported by Mecuson and co-workers [35,54], who compared the coating thickness versus time for two PEO treatments, one with Rpn = 1.57 (without soft sparking), the other with Rpn = 0.89 (with soft sparking), as shown in Figure 6c. Similarly, the coating thickness suddenly increased around 45 min for the operation with Rpn = 0.89, then returned the regular growth. We note that one thing is different between the two works of Mecuson and Gebarowski. The experimental data of Mecuson show that the sudden increase in thickness coincides with the soft sparking transition (Figure 6c), while those of Gebarowski indicate a sudden increase in the thickness lag behind transition. The soft sparking transition occurs at 28 min for Rpn = 0.7, and 35 min for Rpn = 0.8, as shown in Figure 2a, while the thickness growth peaks around 45 min for all four Rpn values in Figure 6b [40].
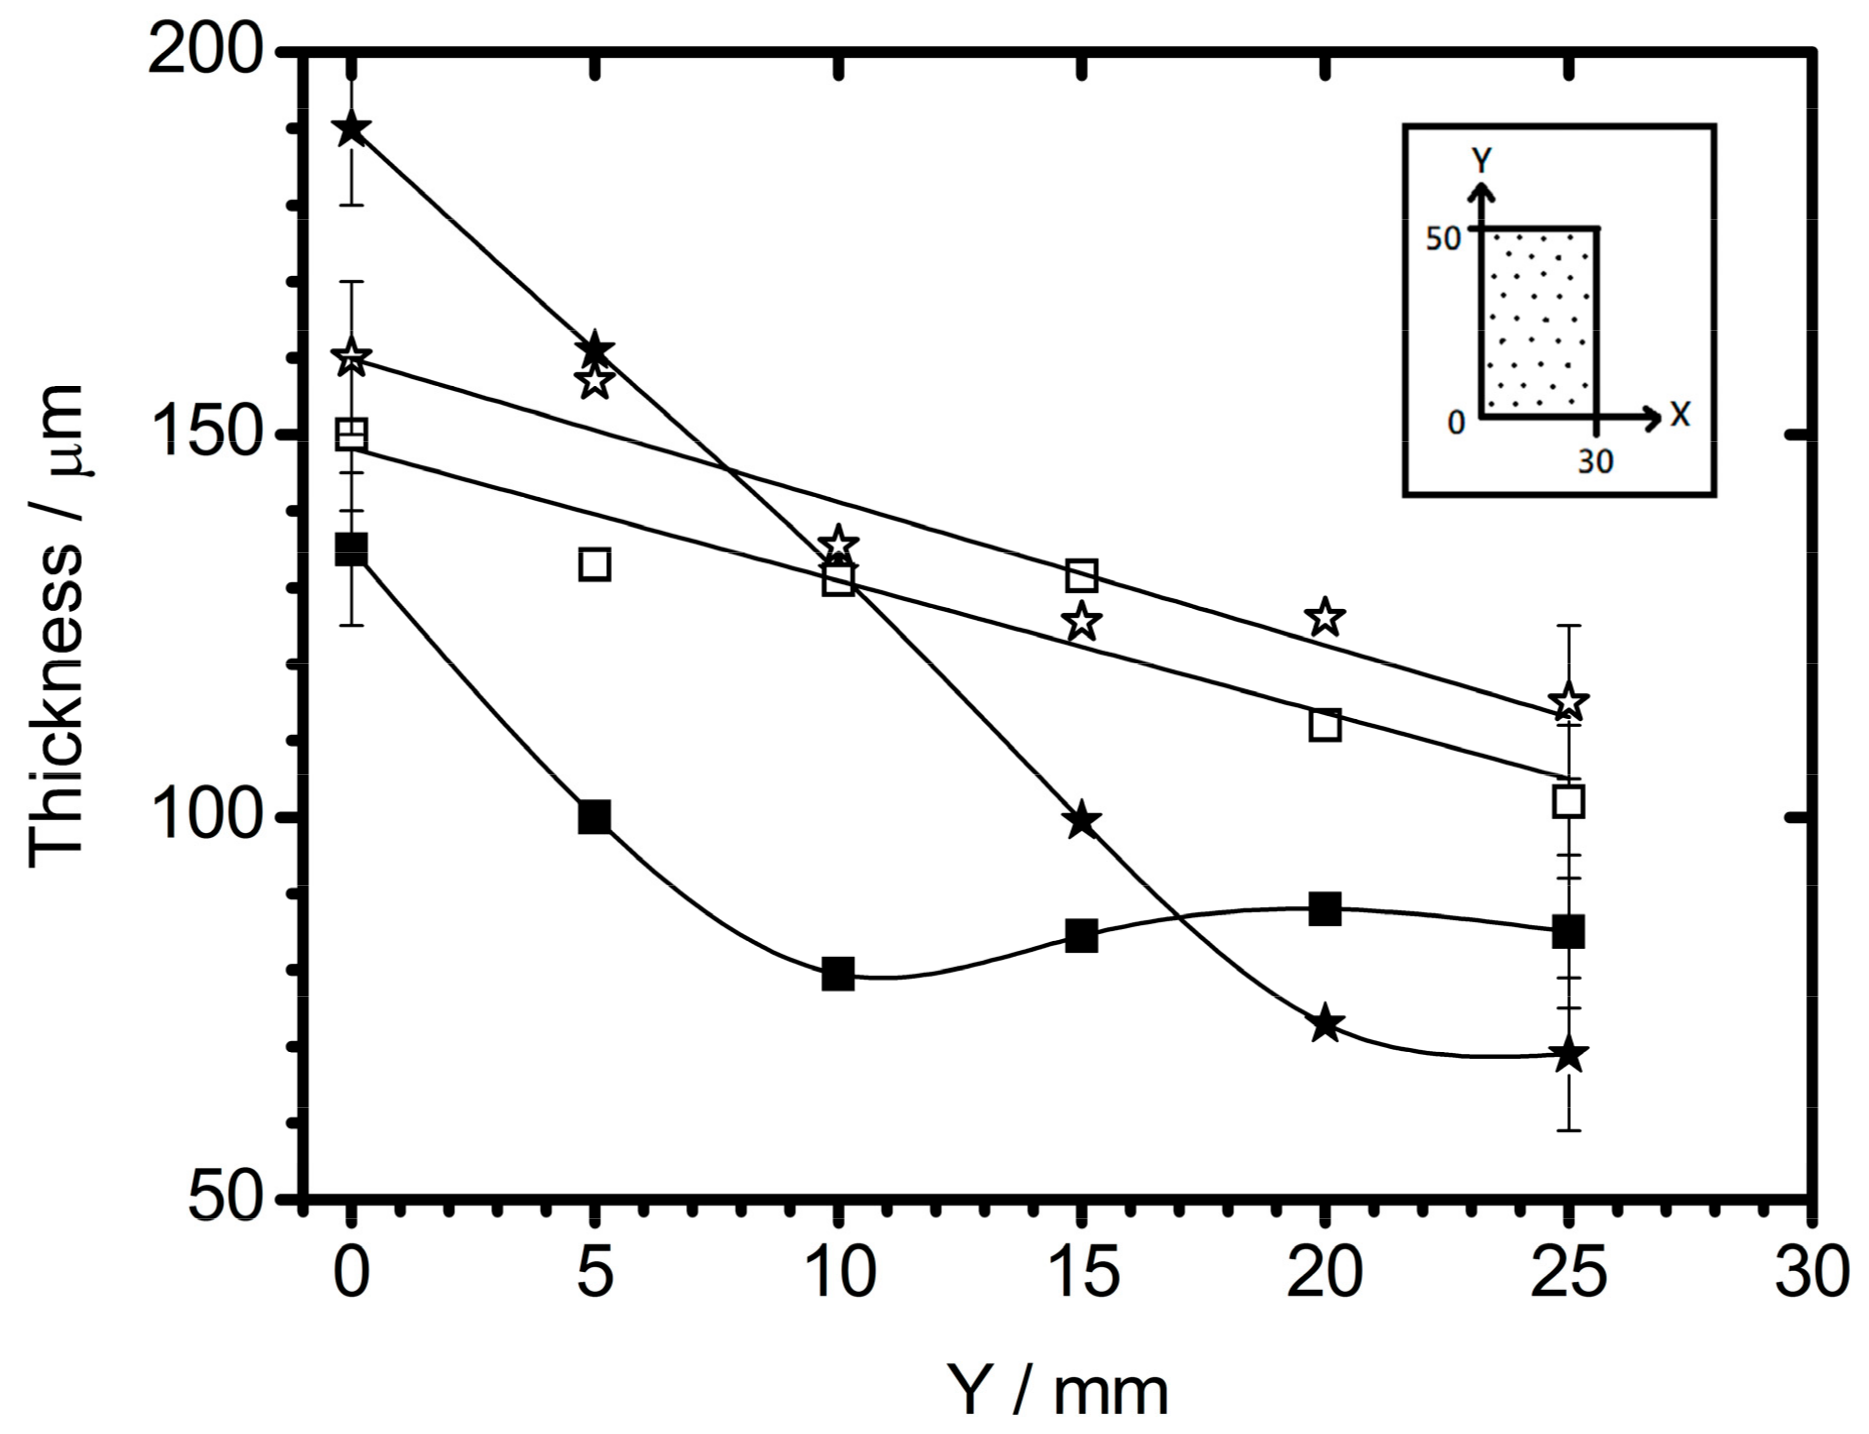
Thickness measurements could contain a number of errors. One source of experimental error is the plasma uniformity. Most of the samples are in the shape of a flat plate. The coating thickness is usually thinner at the center, and thicker around the edge of the sample [36,83]. The edge of higher thickness is attributed to more frequent discharge events around the perimeter of the sample. The trend of more frequent discharge around the edge remains similar before and after soft sparking, even though the overall intensity diminishes after soft sparking. Variations in coating thickness with respect to position have been well documented and compared between two PEOs, with and without soft sparking, by Melhem and co-workers [83], as illustrated in Figure 7. The thickness data along the vertical positions of central line, indicated in the inset, are plotted for Rpn = 0.89 (soft sparking) and 1.57 (without). The coating with soft sparking shows less thickness variation than the coating of conventional arcing. The thickness variation of PEO with soft sparking is hardly affected by the difference in the electrode gap, except that the coating of a large gap is slightly thicker. However, the influence of the electrode gap is substantial for the coating of conventional arcing; the thickness difference between the center and edge is much larger with a sizeable electrode gap.

3. Mg- and Ti-Based Alloys

3.1. Soft Sparking on Mg-Based Alloys

The understanding of soft sparking on aluminum ought to help us to find its analog on Mg-based alloys. The knowledge does assist; yet, it appears the best microstructures of Mg soft sparking rely on the physical chemistry of Al oxide, not Mg oxide. Our discussion begins with the high chemical activity of magnesium. Most coating studies aim to improve the corrosion resistance of Mg-based alloys because these alloys corrode severely under ambient conditions. Direct oxidation of the alloy surface does not give much protection, since magnesium oxide is quite reactive too. Hence, the PEO process is normally performed in an electrolyte containing anions of silicates and/or phosphates, less frequently in the electrolytes of fluorites and aluminates [84]. The resultant coatings consist of two or more oxide phases, mixtures of MgO, and one or two of the following oxides, including MgSiO3, Mg2SiO4, Mg3(PO4)2, MgF2, MgAl2O4. The coating of mixed oxides gives substantial protection. Nonetheless, the phase complexity of the coating implies that the transition process of soft sparking is not straightforward.
Compared with PEO treatments of Al-based alloys, electrolytic oxidation of Mg-based metals involves a lower voltage, 300–400 V, or lower current density, and less operation time, since their growth rates are higher. Researchers have reproduced the transition phenomena of soft sparking on Mg-based alloys, including sudden decreases in light and acoustic emissions, and a voltage drop under constant current [85,86]. The resultant coatings comprise a porous top layer and an inner layer of lower porosity. Nonetheless, the residual pores of the inner layer do exist, and the coating microstructure is inferior compared with the Al counterparts. Our research team [85] has reproduced soft sparking on the high-purity Mg substrate in a solution of K2ZrF6, NaOH, and Na6P6O18, under a pulse bipolar current with controlled density 4.3 A·dm−2 (positive), duty 10%, 500 Hz, and Rpn = 0.86. The transition occurred at 21 min. The coating microstructure after transition is shown in Figure 8a. The microstructure is improved compared with those without soft sparking, but still contains several cracks and pores. The thick coating (Figure 8a) consists of three crystals, Mg2Zr5O12, ZrO2, and MgO.
Arrabal and co-authors [86] produced soft sparking transitions on a number of Mg-based alloys, specifically 99.9% Mg, AZ31, AZ61, AZ91D, ZC71, ZE41, and WE43-T6. Their PEO experiments were performed with 50 Hz AC current of square waveform and Rpn = 0.83, persisting at a current density 65 A·dm−2 (rms) for 15 min in an electrolytic solution of Na2SiO3 and Na2P2O7. The transitions took place at 5–7 min, depending on the substrate type. The coating microstructure on AZ91D is shown in Figure 8b, again with considerable cracks and pores. The coatings on other alloy substrates differ very little in terms of microstructure; some are worse. In that report, the authors also demonstrated that the delays in microdischarge during anodic polarization are due to preceding cathodic current, similar to Figure 4 on the Al-based alloy. Therefore, the effects of plasma softening due to the cathodic component were replicated on Mg-based alloys as well. Evidently, densification of the inner layer on the Mg-alloy surface had not been completed. Pore removal through sintering may require more time. The PEO time of our work [85] was 40 min, much longer than that of Arrabal [86]; both appear insufficient for full densification.
The outcome of soft sparking is inferior on Mg-based alloys, in comparison with the results on Al-based alloys. It seems that the soft sparking transition is not equally effective toward Mg-alloys. One huge difference is the coating composition; the dense inner layers on Al-alloys comprise γ- and α-Al2O3, yet those coatings on Mg-alloys are complex in composition. Unfortunately, the coating composition has not always been documented in detail. Still we can make a crude yet rational guess based on the anions of its electrolytic solution. For example, the coating may contain magnesium silicates if the solution contains silicate anions. Likewise, the coating contains alumina or magnesium aluminate if the solution contains aluminate anion. Surveying the PEO literature on Mg-based alloys, we come to an intriguing conclusion that the strategy of softened plasma works best on the coating on Mg-alloys when the electrolytic solution contains a substantial amount of aluminate, commonly NaAlO2. In that electrolytic solution, a cathodic current enables a dense inner layer on Mg-based metals, similar to PEO coatings on Al-based alloys. If the electrolytic solution does not contain aluminate, the influence of the cathodic current seems ineffective. In other words, the presence of rectifying aluminum oxide in the coating is critical to achieving a dense inner layer on Mg-based alloys with cathodic current.
The research group of Hussain has demonstrated more than once the dense inner layer feature in the electrolytic solution of sodium aluminate on Mg-based alloys. One example of their PEO works is on AJ62 in the electrolytic solutions of 10 g·dm−3 NaAlO2 and 1 g·dm−3 KOH [87,88]. Two coatings out of the four prepared with Rpn = 0.74 and 0.63 (bipolar) showed excellent microstructural features, superior to those of Rpn = 1.0 (bipolar) and unipolar current (anodic only). The authors emphasized the plasma softening effects on eliminating the strong B-type discharges under the operations with Rpn < 1 without mentioning whether the operation entered the soft regime or not. Perhaps whether it enters the soft regime is an irrelevant question. We believe the MgAl2O4 constituent of the resultant coating plays a vital role, equally significant as the action of cathodic electricity. Their works on the AM60B alloy stressed the previous findings again. In the solution containing 3 G·dm−3 NaAlO2, 7 g·dm−3 K2P2O7, and 1 g·dm−3 KOH, the PEO coating with dense inner layer was reported to strengthen the corrosion resistance. The cathodic current of the pulse bipolar current repaired the defects of a foregoing unipolar current treatment in a hybrid current mode that accomplished the optimal corrosion resistance [89,90]. Liang and co-workers [91] had reported the NaAlO2 effect, prior to the more systematic studies of Hussain, on reducing the number and the size of micropores and increasing the MgAl2O4 content of the coating on AM50B. Their results were published in 2005. Liang did not seem to be aware that this effect relied on both the aluminate content of electrolyte and the cathodic current. Liang stressed the NaAlO2 effect only.
When the electrolytic solutions of PEO do not contain aluminate, the cathodic component of the power source seems to lose its meaning too. Notably, several reports of the Dietzel group applied the unipolar DC pulsed current with a relatively long rest period, ton:toff = 2 ms:20 (or 18) ms, and obtained fine coatings containing magnesium silicates or phosphates in the electrolytic solutions of Na2SiO3 or Na3PO4 [92,93,94,95]. Their coatings, without Al oxide, were quite dense and thick, without the help of a cathodic component.
Other research groups carried out PEO processing on Mg-based alloys, in the solutions without aluminate, with a cathodic component less than the anodic component [96,97]. The resultant coatings had pores at various densification levels, less when a negative current was adopted. They stressed that avoiding a high cathodic component was critical in PEO treatment of Mg alloys, since hydrogen liberation at the interface of oxide/substrate was detrimental to the coating integrity [96,97]. It is widely known that magnesium exhibits a strong affinity to hydrogen, and the negative current of PEO generates hydrogen via water electrolysis.

3.2. Soft Sparking on Ti-Based Alloys

Many PEO treatments of Ti-based alloys are targeted at biomedical applications, where the coating prefers porosity so that cells have sufficient room to duplicate or bifurcate through tissue engineering [98,99,100,101]. In particular, calcium phosphate coatings on titanium implants have been extensively studied and their compositions are carefully tuned for biocompatibility [102,103,104,105,106,107]. Hence, only a few reports discuss how to eliminate pores of the coating on the Ti surface. Yao and co-workers noted that, on a Ti-6Al-4V alloy, a coating with a dense inner layer could be prepared using a pulse bipolar current in a NaAlO2-Na3PO4 electrolytic solution without soft sparking phenomena [108]. When the solution contained Na3PO4 or K4ZrF6-Na3PO4 (without NaAlO2), or the pulsed current was unipolar (no cathodic component, even with NaAlO2), the coatings were porous. The research group further demonstrated that increasing the cathodic component of the bipolar current in the NaAlO2-Na3PO4 solution enhanced the Al2TiO5 content of the coating; consequently the residual discharge channels decreased in number, and the thickness and the density of the coating increased [109]. A similar study had been conducted on Ti-6Al-4V, and reached a similar but slightly different result. PEO treatment, in the solutions of NaAlO2 and K4P2O7, produced a thick-and-dense coating with Rpn = 1 (bipolar), a thin-and-dense coating with Rpn = 0.75 (bipolar), and a thick-and-porous coating with a unipolar current [110].
On the other hand, as mentioned earlier, Aliasghari reported that Ti-based alloy coatings, in a solution of silicate and phosphate without aluminate involvement, were loaded with many pores even when soft sparking phenomena appeared [39]. Therefore, we conclude that, up to now, the microstructure feature of the dense inner layer on Ti-based alloys depends on the same key factors as Al-alloys, that is, AlO2- anions in solution (Al oxides in the oxide coating) and a cathodic component in bipolar current. This dependence suggests the findings of quality dense structure originate from the same mechanism on Al-based alloys. A new approach remains to be discovered for generating a dense inner layer in the coatings on Ti-based alloys without aluminum oxides.

4. Conclusions

In PEO treatment of Al-based alloys, soft sparking marks a rectification property transition at the metal–oxide–electrolyte interface where the plasma state reaches a critical point and manifests itself as a sudden decrease in intensity. When the transition occurs with sufficient oxide thickness to preserve thermal energy, the diminished plasma state still creates a dense inner layer in the coating of γ-alumina and mullite; meanwhile, α-Al2O3 has a better opportunity to nucleate and grow more than the common coatings.
Rectification properties of the interface regulate the space-charge conditions within and next to the oxide coating, and consequently control the electric current flow, along with the surface plasma state. As oxidation proceeds, the dielectric oxide layer thickens and the individual microdischarges become stronger as the breakdown strength increases under polarization. Therefore, often at later operation stages, the discharge events are so acute that they damage the oxide coating. Addition of cathodic component attracts protons into the coating and reduces the coating resistance, which softens the discharge event and plasma intensity. Before the transition of soft sparking, the lingering influence of the foregoing cathodic pulse can be recuperated by its following anodic pulse. When the anodic pulse is insufficient to erase the remaining influence of cathodic pulse, the transition occurs with negative charge accumulation and the sparking activity diminishes to a new state. If the Rpn ratio is properly set and sufficient oxide has been amassed before transition sets in, the sparking activity shall not extinguish entirely; the softened plasma allows densification to continue and more α-Al2O3 to nucleate. Therefore, the quality of the dense inner layer structure relies on the cathodic current as much as the electrolytic rectification of the coating oxide.
The coatings on Mg-based alloys generally consist of two or more oxide crystals. Researchers are capable of reproducing soft sparking phenomenal however, the benefits on coating microstructure and corrosion resistance are not pronounced if no aluminum oxide is included. A similar dense inner layer can be achieved on Mg-based alloys if the electrolytic solution contains NaAlO2 and the electric current has a cathodic component. A combination like this suggests that researchers essentially resorted to the rectifying aluminum oxide on Mg-based metals in replicating soft sparking and its associated dense inner layer. On Ti-based alloys, again, we do not find a dense inner layer feature except for the coating being oxidized in the electrolytic solution of NaAlO2 with a cathodic current. Our review concludes that, on Mg- and Ti-based alloys, soft sparking phenomena can result in a mediocre inner layer without aluminum oxide. So far, the superior microstructural feature on Mg- and Ti-based alloys is only accomplished by means of the soft sparking mechanism of Al-alloys.

Acknowledgments

The authors thank the Ministry of Science and Technology of Taiwan for financial support through the project MOST 106-2221-E011-119-MY3.

Author Contributions

Dah-Shyang Tsai analyzed and summarized the latest progress on soft sparking issues of plasma electrolytic oxidation, and wrote the manuscript. Chen-Chia Chou participated the discussion and provided his perspectives on microstructure.

Conflicts of Interest

The authors declare no conflict of interest.

References

  1. Lohrengel, M.M. Thin anodic oxide layers on aluminum and other valve metals. Mater. Sci. Eng. 1993, R11, 243–294. [Google Scholar] [CrossRef]
  2. Dyer, C.K. Electrolytic rectification and cathodic charge reversibility of some valve metals. Electrocompon. Sci. Technol. 1974, 1, 121–127. [Google Scholar] [CrossRef]
  3. Middelhoek, A. The mechanism of electrolytic rectification. J. Electrochem. Soc. 1964, 111, 379–380. [Google Scholar] [CrossRef]
  4. Blawert, C.; Dietzel, W.; Ghali, E.; Song, G. Anodizing treatments for magnesium alloys and their effect on corrosion resistance in various environments. Adv. Eng. Mater. 2006, 8, 511–533. [Google Scholar] [CrossRef]
  5. Diggle, J.W.; Downie, T.C.; Goulding, C.W. Anodic oxide films on aluminum. Chem. Rev. 1969, 69, 365–405. [Google Scholar] [CrossRef]
  6. Paez, M.A.; Bustos, O.; Thompson, G.E.; Skeldon, P.; Shimizu, K.; Wood, G.C. Porous anodic film formation on an Al-3.5 wt % Cu alloy. J. Electrochem. Soc. 2000, 147, 1015–1020. [Google Scholar] [CrossRef]
  7. Dickey, J.R.; Davidson, J.L.; Tzeng, Y. Improved dielectric properties for anodic aluminum oxide films by soft/hard two-step electrolytic anodization. J. Electrochem. Soc. 1989, 136, 1772–1777. [Google Scholar] [CrossRef]
  8. Sunderland, R.J. Analysis of chromate conversion coatings on aluminum. Jpn. J. Appl. Phys. 1974, 13, 347–350. [Google Scholar] [CrossRef]
  9. Waldrop, J.R.; Kendig, M.W. Nucleation of chromate conversion coating on aluminum 2024-T3 investigated by atomic force microscopy. J. Electrochem. Soc. 1998, 145, L11–L13. [Google Scholar] [CrossRef]
  10. Xia, L.; McCreery, R.L. Chemistry of a chromate conversion coating on aluminum alloy AA 2024-T3 probed by vibrational spectroscopy. J. Electrochem. Soc. 1998, 145, 3083–3089. [Google Scholar] [CrossRef]
  11. Hagans, P.L.; Haas, C.M. Chromate conversion coatings. In Surface Engineering ASM Handbook; Cotell, C.M., Sprague, J.A., Schmidt, F.A., Jr., Eds.; ASM International: Cleveland, OH, USA, 1994; Volume 5, pp. 405–411. ISBN 978-0-87170-384-2. [Google Scholar]
  12. ECHA Annex XVII to REACH—Conditions of Restriction; Entry 47–Chromium VI Compounds. Available online: https://echa.europa.eu/documents/10162/1f775bd4-b1b0-4847-937f-d6a37e2c0c98 (accessed on 24 November 2015).
  13. Matykina, E.; Arrabal, R.; Skeldon, P.; Thompson, G.E. Optimization of the plasma electrolytic oxidation process efficiency on aluminum. Surf. Interface Anal. 2010, 42, 221–226. [Google Scholar] [CrossRef]
  14. Zhang, X.M.; Tian, X.B.; Yang, S.Q.; Gong, C.Z.; Fu, R.K.Y.; Chu, P.K. Low energy-consumption plasma electrolytic oxidation based on grid cathode. Rev. Sci. Instrum. 2010, 81, 103504. [Google Scholar] [CrossRef] [PubMed]
  15. Snizhko, L.O.; Yerokhin, A.L.; Pilkington, A.; Gurevina, N.L.; Misnyankin, D.O.; Leyland, A.; Matthews, A. Anodic process in plasma electrolytic oxidation of aluminum in alkaline solutions. Electrochim. Acta 2004, 49, 2085–2095. [Google Scholar] [CrossRef]
  16. Troughton, S.C.; Nomine, A.; Nomine, A.V.; Henrion, G.; Clyne, T.W. Synchronised electrical monitoring and high speed video of bubble growth associated with individual discharges during plasma electrolytic oxidation. Appl. Surf. Sci. 2015, 359, 405–411. [Google Scholar] [CrossRef]
  17. Curran, J.A.; Clyne, T.W. Porosity in plasma electrolytic oxidation coatings. Acta Mater. 2006, 54, 1985–1993. [Google Scholar] [CrossRef]
  18. Dunleavy, C.S.; Golosnoy, I.O.; Curran, J.A.; Clyne, T.W. Characterization of discharge events during plasma electrolytic oxidation. Surf. Coat. Technol. 2009, 203, 3410–3419. [Google Scholar] [CrossRef]
  19. Dunleavy, C.S.; Curran, J.A.; Clyne, T.W. Self-similar scaling of discharge events through PEO coatings on aluminum. Surf. Coat. Technol. 2011, 206, 1051–1061. [Google Scholar] [CrossRef]
  20. Mia, T.; Jiang, B.; Liu, Z.; Fan, L. Plasma formation mechanism of microarc oxidation. Electrochim. Acta 2014, 123, 369–377. [Google Scholar] [CrossRef]
  21. Nomine, A.; Troughton, S.C.; Nomine, A.V.; Henrion, G.; Clyne, T.W. High speed video evidence for localized discharge cascades during plasma electrolytic oxidation. Surf. Coat. Technol. 2015, 269, 125–130. [Google Scholar] [CrossRef]
  22. Troughton, S.C.; Nomine, A.; Dean, J.; Clyne, T.W. Effect of individual discharge cascades on the microstructure of plasma electrolytic oxidation. Appl. Surf. Sci. 2016, 389, 260–269. [Google Scholar] [CrossRef]
  23. Dean, J.; Gu, T.; Clyne, T.W. Evaluation of residual stress levels in plasma electrolytic oxidation coatings using a curvature method. Surf. Coat. Technol. 2015, 269, 47–53. [Google Scholar] [CrossRef]
  24. Khan, R.H.U.; Yerokhin, A.; Matthews, A. Structural characteristics and residual stresses in oxide films produced on Ti by pulsed unipolar plasma electrolytic oxidation. Philos. Mag. 2008, 88, 795–807. [Google Scholar] [CrossRef]
  25. Gordienko, P.S.; Korkosh, S.V.; Kharchenko, U.V.; Panin, E.S.; Dostovalov, V.A.; Bulanova, S.B. Micro-arc oxidation of metals and alloys in electrolytes with energy control within the breakdown zones. Pac. Sci. Rev. 2008, 10, 307–312. [Google Scholar]
  26. Jiang, B.L.; Wang, Y.M. Plasma electrolytic oxidation treatment of aluminum and titanium alloys. In Surface Engineering of Light Alloys; Dong, H., Ed.; Woodhead Publishing Limited, CRC Press: New York, NY, USA, 2010; Chapter 5; pp. 110–153. ISBN 978-1-84569-537-8. [Google Scholar]
  27. Hussein, R.O.; Northwood, D.O. Production of anti-corrosion coatings on light alloys (Al, Mg, Ti) by plasma electrolytic oxidation (PEO). In Developments in Corrosion Protection; Aliofkhazraei, M., Ed.; InTech: London, UK, 2014; Chapter 11; pp. 201–239. ISBN 978-953-51-1223-5. [Google Scholar]
  28. Malyshev, V.N. Modification of friction knots work surfaces on the basis of micro arc oxidation method. Int. J. Sci. Res. Sci. Eng. Technol. 2016, 2, 464–480. [Google Scholar]
  29. Narayanan, T.S.N.S.; Park, I.S.; Lee, M.H. Strategies to improve the corrosion resistance of micro arc oxidation coated magnesium alloys for degradable implants: Prospects and challenges. Prog. Mater. Sci. 2014, 60, 1–71. [Google Scholar] [CrossRef]
  30. Lu, X.; Mohedano, M.; Blawert, C.; Matykina, E.; Arrabal, R.; Kainer, K.U.; Zheludkevich, M.L. Plasma electrolytic oxidation coatings with particle additions—A review. Surf. Coat. Technol. 2016, 307, 1165–1182. [Google Scholar] [CrossRef]
  31. Parfenov, E.V.; Yerokhin, A.; Nevyantseva, R.R.; Gorbatkov, M.V.; Liang, C.-J.; Matthews, A. Towards smart electrolytic plasma technologies. Surf. Coat. Technol. 2015, 269, 2–22. [Google Scholar] [CrossRef]
  32. Gupta, P.; Tenhundfeld, G.; Daigle, E.O.; Ryabkov, D. Electrolytic plasma technology: Science and engineering—An overview. Surf. Coat. Technol. 2007, 201, 8746–8760. [Google Scholar] [CrossRef]
  33. Yerokhin, A.L.; Nie, X.; Leyland, A.; Matthews, A.; Dowey, S.J. Plasma electrolysis for surface engineering. Surf. Coat. Technol. 1999, 122, 73–93. [Google Scholar] [CrossRef]
  34. Schultze, J.W.; Lohrengel, M.M. Stability, reactivity and breakdown of passive films. Problems of recent and future research. Electrochim. Acta 2000, 45, 2499–2513. [Google Scholar] [CrossRef]
  35. Jaspard-Mecuson, F.; Czerwiec, T.; Henrion, G.; Belmonte, T.; Dujardin, L.; Viola, A.; Beauvir, J. Tailored aluminum oxide layers by bipolar current adjustment in the plasma electrolytic oxidation process. Surf. Coat. Technol. 2007, 201, 8677–8682. [Google Scholar] [CrossRef]
  36. Martin, J.; Melhem, A.; Shchedrina, I.; Duchanoy, T.; Nominé, A.; Henrion, G.; Czerwiec, T.; Belmonte, T. Effects of electrical parameters on plasma electrolytic oxidation of aluminum. Surf. Coat. Technol. 2013, 221, 70–76. [Google Scholar] [CrossRef]
  37. Xin, S.; Song, L.; Zhao, R.; Hu, X. Influence of cathodic current on composition, structure and properties of Al2O3 coatings on aluminum alloy prepared by micro-arc oxidation process. Thin Solid Films 2006, 515, 326–332. [Google Scholar] [CrossRef]
  38. Sah, S.P.; Tsuji, E.; Aoki, Y.; Habazaki, H. Cathodic pulse breakdown of anodic films on aluminum in alkaline silicate electrolyte. Corros. Sci. 2012, 55, 90–96. [Google Scholar] [CrossRef]
  39. Aliasghari, S.; Skeldon, P.; Thompson, G.E. Plasma electrolytic oxidation of titanium in a phosphate/silicate electrolyte and tribological performance of the coatings. Appl. Surf. Sci. 2014, 316, 463–476. [Google Scholar] [CrossRef]
  40. Gebarowski, W.; Pietrzyk, S. Influence of the cathodic pulse on the formation and morphology of oxide coatings on aluminum produced by plasma electrolytic oxidation. Arch. Metall. Mater. 2013, 58, 241–245. [Google Scholar] [CrossRef]
  41. Gebarowski, W.; Pietrzyk, S. Growth characteristics of the oxide layer on aluminum in the process of plasma electrolytic oxidation. Arch. Metall. Mater. 2014, 59, 407–411. [Google Scholar] [CrossRef]
  42. Samir, H.A.; Qian, H.C. Effects of cathodic component of current on porosity and hardness characteristics of micro plasma oxidation coatings on aluminum alloy. Trans. Nonferrous Met. Soc. China 2005, 15, 113–118. [Google Scholar]
  43. Xue, W.; Deng, Z.; Chen, R.; Zhang, T. Growth regularity of ceramic coatings formed by micro arc oxidation on Al-Cu-Mg alloy. Thin Solid Films 2000, 372, 114–117. [Google Scholar] [CrossRef]
  44. Xue, W.; Deng, Z.; Lai, Y.; Chen, R. Analysis of phase distribution for ceramic coatings formed by microarc oxidation on aluminum alloy. J. Am. Ceram. Soc. 1998, 81, 1365–1368. [Google Scholar] [CrossRef]
  45. Malyshev, V.N.; Markov, G.A.; Fedorov, V.A.; Petrosyants, A.A.; Terleeva, G.P. Features of the structure and properties of coatings applied by the method of micro arc oxidation. Chem. Pet. Eng. 1984, 20, 41–43. [Google Scholar] [CrossRef]
  46. Timoshenko, A.V.; Magurova, Y.V. Application of oxide coatings to metals in electrolytic solutions by microplasma methods. Rev. Metal. (Madrid) 2000, 36, 323–330. [Google Scholar] [CrossRef]
  47. Rakoch, A.G.; Bardin, I.V.; Kovalev, V.L.; Avanesyan, T.G. Microarc oxidation of light constructional alloys: Part 1. Main notions on the microarc oxidation of light constructional alloys. Russ. J. Nonferrous Metal. 2013, 54, 341–344. [Google Scholar] [CrossRef]
  48. Rakoch, A.G.; Bardin, I.V.; Kovalev, V.L.; Avanesyan, T.G.; Seferyan, A.G. Microarc oxidation of light constructional alloys: Part 2. Influence of the current waveform on the growth kinetics of microarc coatings on the surface of light construction alloys in alkali (pH ≤ 12.5) electrolytes. Russ. J. Nonferrous Metal. 2013, 54, 345–348. [Google Scholar] [CrossRef]
  49. Duan, H.; Li, Y.; Xie, Y.; Chen, S. Transient voltage-current characteristics: New insights into PEO process of aluminum alloy. Int. J. Electrochem. Sci. 2012, 7, 7619–7630. [Google Scholar]
  50. Martin, J.; Nomine, A.; Brochard, F.; Briancon, J.-L.; Noel, C.; Belmonte, T.; Czerwiec, T.; Henrion, G. Delays in micro-discharges appearance during PEO of Al: Evidence of a mechanism of charge accumulation at the oxide-electrolyte interface. Appl. Surf. Sci. 2017, 410, 29–41. [Google Scholar] [CrossRef]
  51. Rogov, A.B.; Shayapov, V.R. The role of cathodic current in PEO of aluminum: Influence of cationic electrolyte composition on the transient current-voltage curves and the discharges optical emission spectra. Appl. Surf. Sci. 2017, 394, 323–332. [Google Scholar] [CrossRef]
  52. Rogov, A.B.; Yerokhin, A.; Matthews, A. The role of cathodic current in PEO of aluminum: Phenomenological concepts of the soft sparking mode. Langmuir 2017, 33, 11059–11069. [Google Scholar] [CrossRef] [PubMed]
  53. Jovovic, J.; Stojadinovic, S.; Sisovic, N.M.; Konjevic, N. Spectroscopic study of plasma during electrolytic oxidation of magnesium and aluminum alloys. J. Quant. Spectrosc. Radiat. Trans. 2012, 113, 1928–1937. [Google Scholar] [CrossRef]
  54. Mecuson, F.; Czerwiec, T.; Belmonte, T.; Dujardin, L.; Viola, A.; Henrion, G. Diagnostics of an electrolytic micro arc process for aluminum alloy oxidation. Surf. Coat. Technol. 2005, 200, 804–808. [Google Scholar] [CrossRef]
  55. Rogov, A.B.; Shayapov, V.R. Correlations between the optical emission spectra and microstructure of microplasma coatings on aluminum 2024 alloy. Appl. Surf. Sci. 2012, 258, 4871–4876. [Google Scholar] [CrossRef]
  56. Sarvan, M.; Radic-Peric, J.; Kasalica, B.; Belca, I.; Stojadinovic, S.; Peric, M. Investigation of long-duration plasma electrolytic oxidation of aluminum by means of optical spectroscopy. Surf. Coat. Technol. 2014, 254, 270–276. [Google Scholar] [CrossRef]
  57. Hussein, R.O.; Nie, X.; Northwood, D.O.; Yerokhin, A.L.; Matthews, A. Spectroscopic study of electrolytic plasma and discharge behavior during the PEO process. J. Phys. D Appl. Phys. 2010, 43, 105203. [Google Scholar] [CrossRef]
  58. Liu, R.; Wu, J.; Xue, W.; Qu, Y.; Yang, C.; Wang, B.; Wu, X. Discharge behaviors during plasma electrolytic oxidation on aluminum alloy. Mater. Chem. Phys. 2014, 148, 284–292. [Google Scholar] [CrossRef]
  59. Yang, X.; Chen, L.; Qu, Y.; Liu, R.; Wei, K.; Xue, W. Optical emission spectroscopy of plasma electrolytic oxidation process on 7075 aluminum alloy. Surf. Coat. Technol. 2017, 324, 18–25. [Google Scholar] [CrossRef]
  60. Hussein, R.O.; Nie, X.; Northwood, D.O. Influence of process parameters on electrolytic plasma discharging behavior aluminum oxide coating microstructure. Surf. Coat. Technol. 2010, 205, 1659–1667. [Google Scholar] [CrossRef]
  61. Gao, Y.; Yerokhin, A.; Parfenov, E.; Matthews, A. Application of voltage pulse transient analysis during plasma electrolytic oxidation for assessment of characteristics and corrosion behavior of Ca- and P-containing coatings on magnesium. Electrochim. Acta 2014, 149, 218–230. [Google Scholar] [CrossRef]
  62. Fatkullin, A.R.; Parfenov, E.V.; Yerokhin, A.; Lazarev, D.M.; Matthews, A. Effect of positive and negative pulse voltages on surface properties and equivalent circuit of the plasma electrolytic oxidation process. Surf. Coat. Technol. 2015, 284, 427–437. [Google Scholar] [CrossRef]
  63. Fatkullin, A.R.; Parfenov, E.V.; Yerokhin, A. Equivalent circuit modelling for pulsed bipolar plasma electrolytic oxidation process. Int. J. Inform. Electron. Eng. 2015, 5, 63–67. [Google Scholar] [CrossRef]
  64. Boinet, M.; Verdier, S.; Maximovitch, S.; Dalard, F. Plasma electrolytic oxidation of AM60 magnesium alloy: Monitoring by acoustic emission technique. Surf. Coat. Technol. 2005, 199, 141–149. [Google Scholar] [CrossRef]
  65. Caire, J.-P.; Dalard, F.; Minko, W.S.; Boinet, M. Modeling of the plasma electrolytic oxidizing of aluminum and magnesium alloys. ECS Trans. 2007, 2, 1–21. [Google Scholar] [CrossRef]
  66. Wang, L.; Chen, L.; Yan, Z.; Fu, W. Optical emission spectroscopy studies of discharge mechanism and plasma characteristics during plasma electrolytic oxidation of magnesium in different electrolytes. Surf. Coat. Technol. 2010, 205, 1651–1658. [Google Scholar] [CrossRef]
  67. Kasalica, B.; Radic-Peric, J.; Peric, M.; Petkovic-Benazzouz, M.; Belca, I.; Sarvan, M. The mechanism of evolution of microdischarges at the beginning of the PEO process on aluminum. Surf. Coat. Technol. 2016, 298, 24–32. [Google Scholar] [CrossRef]
  68. Yao, Z.; Xia, Q.; Wei, H.; Li, D.; Sun, Q.; Jiang, Z. Study on coating growth characteristics during the electrolytic oxidation of a magnesium-lithium alloy by optical emission spectroscopy analysis. RSC Adv. 2015, 5, 68806–68814. [Google Scholar] [CrossRef]
  69. Yao, Z.; Xia, Q.; Ju, P.; Wang, J.; Su, P.; Li, D.; Jiang, Z. Investigation of absorptance and emissivity of thermal control coatings on Mg-Li alloys and OES analysis during PEO process. Sci. Rep. 2016, 6, 29563. [Google Scholar] [CrossRef] [PubMed]
  70. Lamouri, S.; Hamidouche, M.; Bouaouadja, N.; Belhouchet, H.; Garnier, V.; Fantozzi, G.; Trelkat, J.F. Control of the γ-alumina to α-alumina phase transformation for an optimized alumina densification. Boletín De La Sociedad Española De Cerámica Y Vidrio 2017, 56, 47–54. [Google Scholar] [CrossRef]
  71. Yalamac, E.; Trapani, A.; Alkurt, S. Sintering and microstructural investigation of gamma-alpha alumina powders. Eng. Sci. Technol. 2014, 17, 2–7. [Google Scholar] [CrossRef]
  72. Boumaza, A.; Favaro, L.; Ledion, J.; Sattonnay, G.; Brubach, J.B.; Berthet, P.; Huntz, A.M.; Roy, P.; Tetot, R. Transition alumina phases induced by heat treatment of boehmite: An X-ray diffraction and infrared spectroscopy study. J. Solid State Chem. 2009, 192, 1171–1176. [Google Scholar] [CrossRef]
  73. Tsai, D.S.; Hsieh, C.C. Controlled gelation and sintering of monolithic gels prepared from γ-alumina fume powder. J. Am. Ceram. Soc. 1991, 74, 830–836. [Google Scholar] [CrossRef]
  74. Wang, J.H.; Du, M.H.; Han, F.Z.; Yang, J. Effects of the ratio of anodic and cathodic currents on the characteristics of micro-arc oxidation ceramic coatings on Al alloys. Appl. Surf. Sci. 2014, 292, 658–664. [Google Scholar] [CrossRef]
  75. Yerokhin, A.L.; Snizhko, L.O.; Gurevina, N.L.; Leyland, A.; Pilkington, A.; Matthews, A. Discharge characterization in plasma electrolytic oxidation of aluminum. J. Phys. D Appl. Phys. 2003, 36, 2110–2120. [Google Scholar] [CrossRef]
  76. Xia, L.; Han, J.; Domblesky, J.P.; Yang, Z.; Li, W. Study of scanning micro arc oxidation and coating development. J. Mater. Eng. Perform. 2017, 26, 5323–5332. [Google Scholar] [CrossRef]
  77. Xia, L.; Han, J.; Domblesky, J.P.; Yang, Z.; Li, W. Investigation of the scanning microarc oxidation. Adv. Mater. Sci. Eng. 2017, 2017, 2416821. [Google Scholar] [CrossRef]
  78. Matykina, E.; Arrabal, R.; Skeldon, P.; Thompson, G.E.; Belenguer, P. AC PEO of aluminium with porous alumina precursor films. Surf. Coat. Technol. 2010, 205, 1668–1678. [Google Scholar] [CrossRef]
  79. Matykina, E.; Arrabal, R.; Mohamed, A.; Skeldon, P.; Thompson, G.E. Plasma electrolytic oxidation of pre-anodized aluminum. Corros. Sci. 2009, 51, 2897–2905. [Google Scholar] [CrossRef]
  80. Matykina, E.; Arrabal, R.; Pardo, A.; Mohedano, M.; Mingo, B.; Rodriguez, I.; Gonzalez, J. Energy-efficient PEO process of aluminum alloys. Mater. Lett. 2014, 127, 13–16. [Google Scholar] [CrossRef]
  81. Matykina, E.; Arrabal, R.; Mohedano, M.; Mingo, B.; Gonzalez, J.; Pardo, A.; Merino, M.C. Recent advances in energy efficient PEO processing of aluminum alloys. Trans. Nonferrous Met. Soc. China 2017, 27, 1439–1454. [Google Scholar] [CrossRef]
  82. Mohedano, M.; Matykina, E.; Arrabal, R.; Mingo, B.; Zheludkevich, M.L. PEO of rheocast A356 Al alloy: Energy efficiency and corrosion properties. Surf. Interface Anal. 2016, 48, 953–959. [Google Scholar] [CrossRef]
  83. Melhem, A.; Henrion, G.; Czerwiec, T.; Briançon, J.L.; Duchanoy, T.; Brochard, F.; Belmonte, T. Changes induced by process parameters in oxide layers grown by the PEO process on Al alloys. Surf. Coat. Technol. 2011, 205, S133–S136. [Google Scholar] [CrossRef]
  84. Darband, G.B.; Aliofkhazraei, M.; Hamghalam, P.; Valizade, N. Plasma electrolytic oxidation of magnesium and its alloys: Mechanism, properties and applications. J. Magnes. Alloys 2017, 5, 74–132. [Google Scholar] [CrossRef]
  85. Tjiang, F.; Ye, L.W.; Huang, Y.J.; Chou, C.C.; Tsai, D.S. Effect of processing parameters on soft regime behavior of plasma electrolytic oxidation of magnesium. Ceram. Int. 2017, 43, S567–S572. [Google Scholar] [CrossRef]
  86. Arrabal, R.; Matykina, E.; Hashimoto, T.; Skeldon, P.; Thompson, G.E. Characterization of AC PEO coatings on magnesium alloys. Surf. Coat. Technol. 2009, 203, 2207–2220. [Google Scholar] [CrossRef]
  87. Hussein, R.O.; Zhang, P.; Nie, X.; Xia, Y.; Northwood, D.O. The effect of current mode and discharge type on the corrosion resistance of plasma electrolytic oxidation coated magnesium alloy AJ62. Surf. Coat. Technol. 2011, 206, 1990–1997. [Google Scholar] [CrossRef]
  88. Hussein, R.O.; Nie, X.; Northwood, D.O. An investigation of ceramic coating growth mechanisms in plasma electrolytic oxidation processing. Electrochim. Acta 2013, 112, 111–119. [Google Scholar] [CrossRef]
  89. Hussein, R.O.; Northwood, D.O.; Nie, X. The influence of pulse timing and current mode on the microstructure and corrosion behavior of a plasma electrolytic oxidation (PEO) coated AM60B magnesium alloy. J. Alloys Compd. 2014, 541, 41–48. [Google Scholar] [CrossRef]
  90. Hussein, R.O.; Northwood, D.O.; Sue, J.F.; Nie, X. A study of the interactive effects of hybrid current modes on the tribological properties of a plasma electrolytic oxidation coated AM60B Mg-alloy. Surf. Coat. Technol. 2013, 215, 421–430. [Google Scholar] [CrossRef]
  91. Liang, J.; Guo, B.; Tian, J.; Liu, H.; Zhou, J.; Liu, W.; Xu, T. Effects of NaAlO2 on structure and corrosion resistance of microarc oxidation coatings formed on AM50B magnesium alloy in phosphate-KOH electrolyte. Surf. Coat. Technol. 2005, 199, 121–126. [Google Scholar] [CrossRef]
  92. Liang, J.; Srinivasan, P.B.; Blawert, C.; Dietzel, W. Influence of chlorine ion concentration on the electrochemical corrosion behavior of plasma electrolytic oxidation coated AM50 magnesium alloy. Electrochim. Acta 2010, 55, 6802–6811. [Google Scholar] [CrossRef]
  93. Srinivasan, P.B.; Liang, J.; Blawert, C.; Stormer, M.; Dietzel, W. Effect of current density on the microstructure and corrosion behavior of plasma electrolytic oxidation treated AM50 magnesium alloy. Appl. Surf. Sci. 2009, 255, 4212–4218. [Google Scholar] [CrossRef]
  94. Liang, J.; Srinivasan, P.B.; Blawert, C.; Stormer, M.; Dietzel, W. Electrochemical corrosion behavior of plasma electrolytic oxidation coatings on AM50 magnesium alloy formed in silicate and phosphate based electrolytes. Electrochim. Acta 2009, 54, 3842–3850. [Google Scholar] [CrossRef]
  95. Srinivasan, P.B.; Liang, J.; Balajeee, R.G.; Blawert, C.; Stormer, M.; Dietzel, W. Effect of pulse frequency on the microstructure, phase composition and corrosion performance of a phosphate- based plasma electrolytic oxidation coated AM50 magnesium alloy. Appl. Surf. Sci. 2010, 256, 3928–3935. [Google Scholar] [CrossRef]
  96. Gao, Y.; Yerokhin, A.; Matthews, A. Effect of current mode on PEO treatment of magnesium in Ca- and P-containing electrolyte and resulting coatings. Appl. Surf. Sci. 2014, 316, 558–567. [Google Scholar] [CrossRef]
  97. Pan, Y.K.; Chen, C.Z.; Wang, D.G.; Zhao, T.G. Improvement of corrosion and biological properties of micro arc oxidized coatings on Mg-Zn-Zr alloy by optimizing negative power density parameters. Colloids Surf. B Biointerfaces 2014, 113, 421–428. [Google Scholar] [CrossRef] [PubMed]
  98. Krzakala, A.; Kazek-Kesik, A.; Simka, W. Application of plasma electrolytic oxidation to bioactive surface formation on titanium and its alloys. RSC Adv. 2013, 3, 19725–19743. [Google Scholar] [CrossRef]
  99. Nyan, M.; Tsutsumi, Y.; Oya, K.; Doi, H.; Nomura, N.; Kasugai, H.; Hanawa, T. Synthesis of novel oxide layers on titanium by combination of sputter deposition and micro-arc oxidation techniques. De. Mater. J. 2011, 30, 754–761. [Google Scholar] [CrossRef]
  100. Matykina, E.; Arrabal, R.; Mingo, B.; Mohedano, M.; Pardo, A.; Merino, M.C. In vitro corrosion performance of PEO coated Ti and Ti6Al4V used for dental and orthopedic implants. Surf. Coat. Technol. 2016, 307, 1255–1264. [Google Scholar] [CrossRef]
  101. Terleeva, O.P.; Slonova, A.I.; Mironov, I.V.; Rogov, A.B.; Sharkeev, Y.P. Microplasma synthesis of biocompatible coatings with additions of magnesium, silicon and silver on pure titanium from homogeneous electrolytes. Surf. Coat. Technol. 2016, 307, 1265–1273. [Google Scholar] [CrossRef]
  102. Rokosz, K.; Hryniewicz, T.; Gaiaschi, S.; Chapon, P.; Raaen, S.; Pietrzak, K.; Malorny, W. Characterization of calcium and phosphorus enriched porous coatings on CP titanium grade 2 fabricated by plasma electrolytic oxidation. Metals 2017, 7, 354. [Google Scholar] [CrossRef]
  103. Rokosz, K.; Hryniewicz, T.; Raaen, S. Development of plasma electrolytic oxidation for improved Ti6Al4V biomaterial surface properties. Int. J. Manuf. Technol. 2016, 85, 2425–2437. [Google Scholar] [CrossRef]
  104. Yeung, W.K.; Sukhorukova, I.V.; Shtansky, D.V.; Levashov, E.A.; Zhitnyak, I.Y.; Gloushankova, N.A.; Kiryukhantsev-Korneev, P.V.; Petrzhik, M.I.; Matthews, A.; Yerokhin, A. Characteristics and in vitro response of thin hydroxyapatite titania films produced by plasma electrolytic oxidation of Ti alloys in electrolytes with particle additions. RSC Adv. 2016, 6, 12688–12698. [Google Scholar] [CrossRef] [PubMed]
  105. Song, W.H.; Jun, Y.K.; Han, Y.; Hong, S.H. Biomimetic apatite coatings on micro-arc oxidized titania. Biomaterials 2004, 25, 3341–3349. [Google Scholar] [CrossRef] [PubMed]
  106. Kazek-Kesik, A.; Dercz, G.; Suchanek, K.; Kalemba-Rec, I.; Piotrowski, J.; Simka, W. Biofunctionalization Ti-13Nb-13Zr alloy surface by plasma electrolytic oxidation, Part I. Surf. Coat. Technol. 2015, 276, 59–69. [Google Scholar] [CrossRef]
  107. Kazek-Kesik, A.; Krok-Borkowicz, M.; Jakobik-Kolon, A.; Pamula, E.; Simka, W. Biofunctionalization Ti-13Nb-13Zr alloy surface by plasma electrolytic oxidation, Part II. Surf. Coat. Technol. 2015, 276, 23–30. [Google Scholar] [CrossRef]
  108. Yao, Z.; Jiang, Y.; Jia, F.; Jiang, Z.; Wang, F. Growth characteristics of plasma electrolytic oxidation ceramic coating on Ti-6Al-4V alloy. Appl. Surf. Sci. 2008, 254, 4084–4091. [Google Scholar] [CrossRef]
  109. Yao, Z.; Liu, Y.; Xu, Y.; Jiang, Z.; Wang, F. Effect of cathode pulse at high frequency on structure and composition of Al2TiO5 ceramic coatings on Ti alloy by plasma electrolytic oxidation. Mater. Chem. Phys. 2011, 126, 227–231. [Google Scholar] [CrossRef]
  110. Hussein, R.O.; Nie, X.; Northwood, D.O. A spectroscopic and microstructural study of oxide coatings produced on a Ti-6Al-4V alloy by plasma electrolytic oxidation. Mater. Chem. Phys. 2012, 134, 484–492. [Google Scholar] [CrossRef]
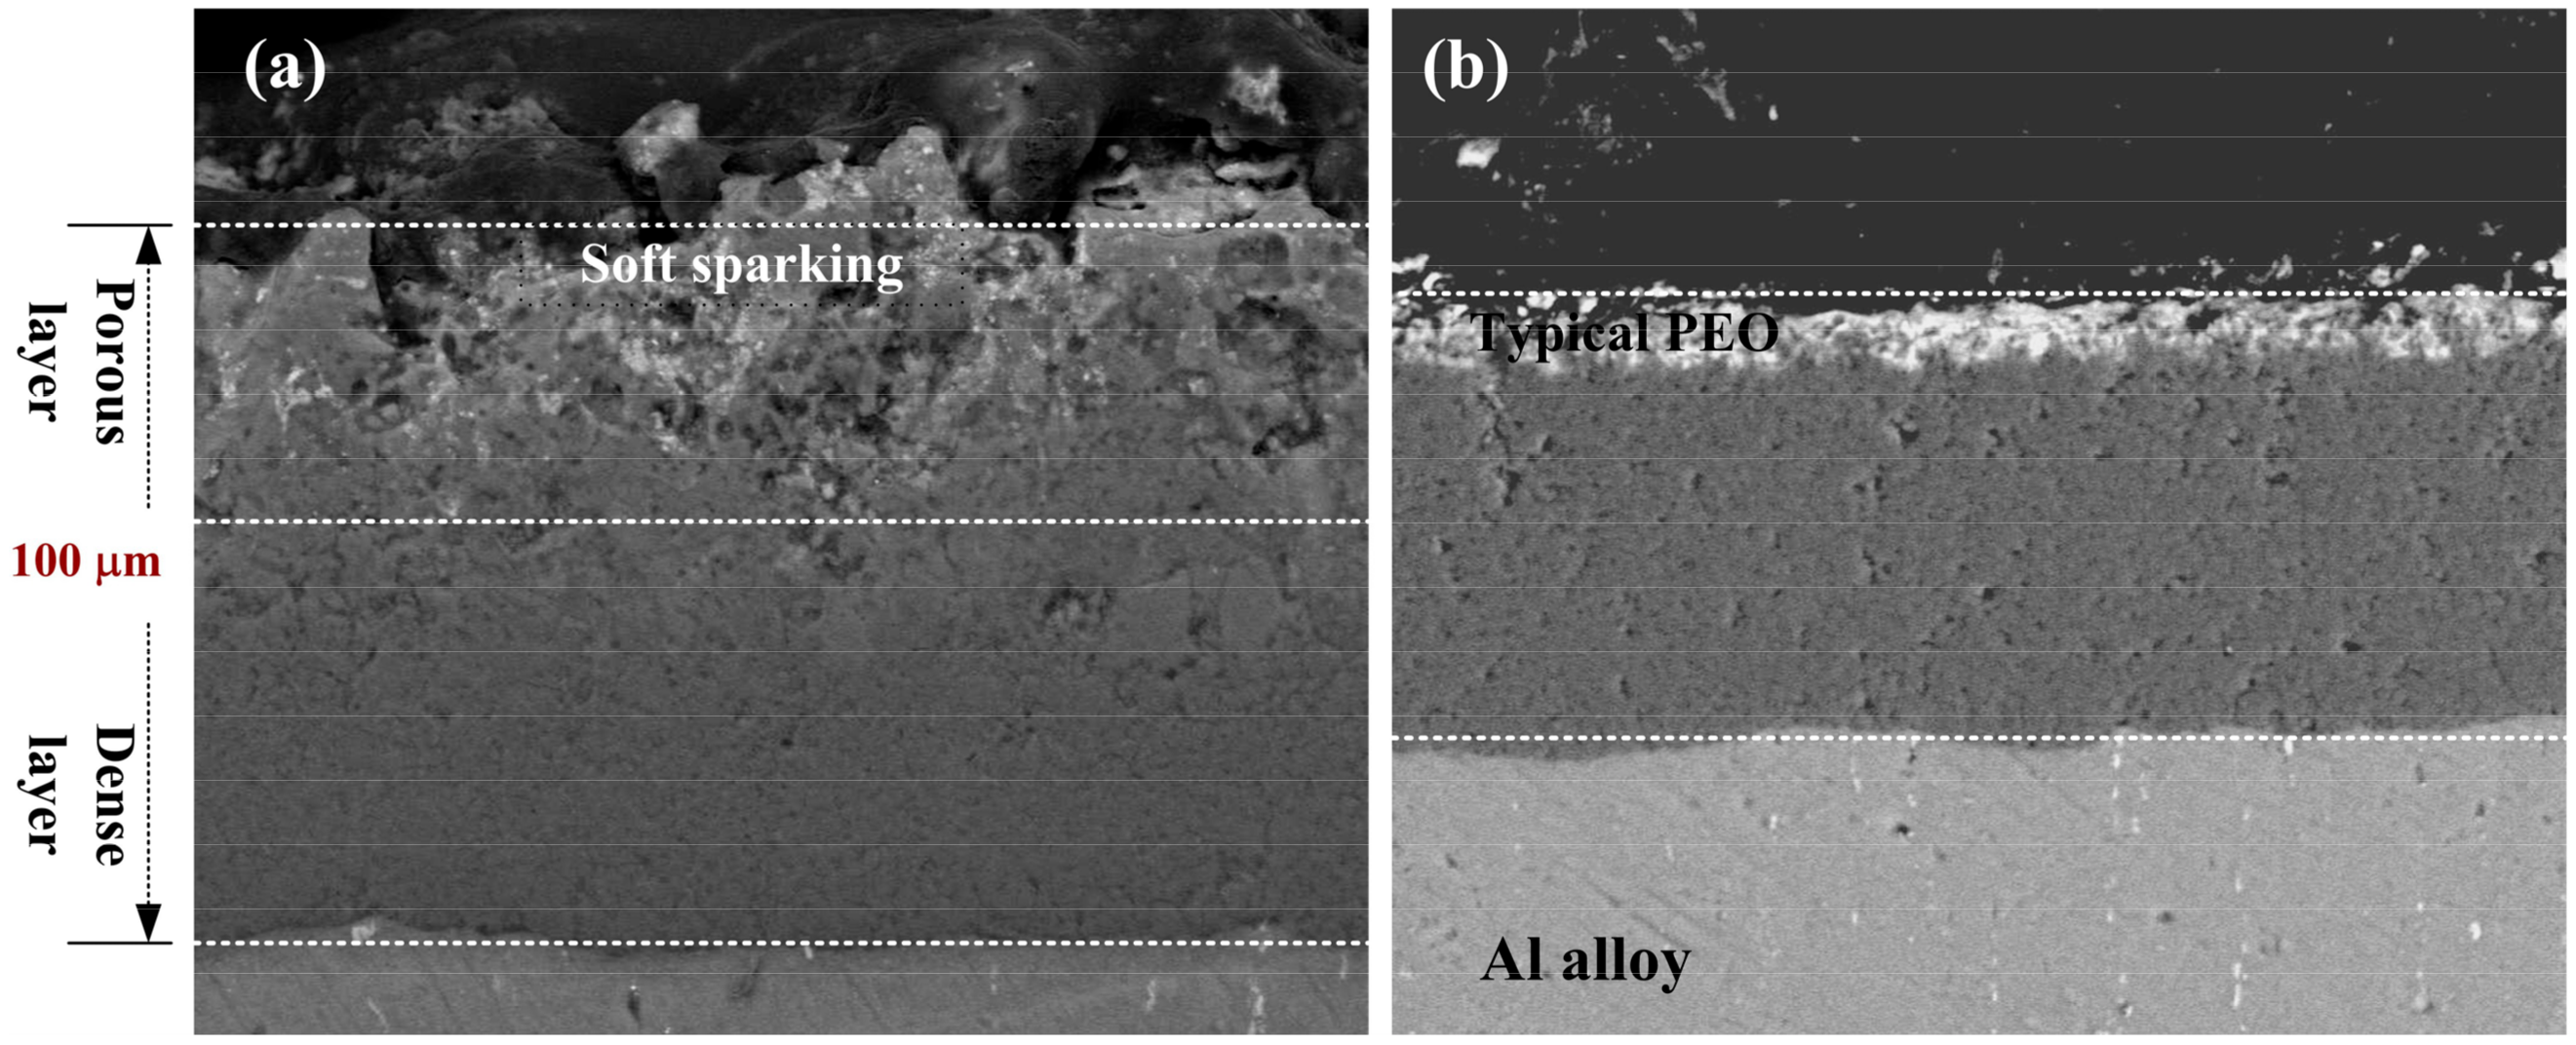
Figure 1. Morphological difference between two PEO coatings with and without soft sparking. The aluminum alloy surfaces were treated with PEO in a prototype solution. The coating (a) with soft sparking is thick, ~100 µm, in which the dense inner (compact) layer consists of alumina; the porous layer comprises silicates, alumina, or mullite. The coating (b) without soft sparking is ~47 µm in thickness.
Metals 08 00105 g001
Figure 2. Soft sparking transitions in anodic voltage and light emission. A voltage–time graph shows (a) two pronounced anodic voltage drops out of four PEO operations with Rpn = 0.7, 0.8, 0.9, 1.0 in a prototype solution [40]. (b) A time-series of photos show the plasma state changed suddenly between 35 and 45 min with Rpn = 0.89. In contrast, (c) another series of photos show the regular plasma state persisted throughout 45 min with Rpn = 1.57 [35].
Metals 08 00105 g002
Figure 3. CVCs of the four stages in PEO with a cathodic component. The current-voltage curves of (a) I sparkless and II spark stages are marked as curves 1 and 2; respectively. Those of (b) III micro-arc and IV arc stages are marked as curves 3 and 4 [46]. The voltage-time diagram of four stages, shown as the inset, is based on the PEO treatment on 2024 alloy.
Metals 08 00105 g003
Figure 4. Influences of cathodic electricity decrease with increasing Rpn (Qp/Qn), and increase with increasing time. Five PEOs have been operated with Qp/Qn = 0.5, 0.9, 1.5, 1.6, 6.0 using a bipolar pulse current, with the voltages, currents, light emissions measured at 1, 8, 30 min. The preceding cathodic pulse delays the microdischarge activity of its following anodic pulse [50].
Metals 08 00105 g004
Figure 5. Comparison between two electron temperature (Te) profiles without and with cathodic electricity. Coating operations have been performed on the samples of 1100 alloy. (a) The profile of Te is plotted versus time for PEO with a unipolar current (without cathodic current involved). (b) The profile of Te is plotted for PEO with a bipolar current (with cathodic current) at Rpn = 8/9. Note that Te of unipolar current is generally higher in the baseline and fluctuates with larger amplitude, compared with that of the bipolar current [60].
Metals 08 00105 g005
Figure 6. Oxide (a) mass gain and (b) growth rate of PEO with Rpn = 1.0, 0.9. 0.8, 0.7 at controlled current 10 A·dm−2, the voltage–time curves of which are plotted in Figure 2a [40]. (c) Thickness of two PEO coatings with Rpn = 0.89 (red) and 1.57 (black) at controlled current 38 A·dm−2 [35].
Metals 08 00105 g006
Figure 7. Coating thickness distribution of a rectangular disk sample [83]. Coating thickness is plotted versus position parameter Y, along the center line at X = 15 mm for two electrode gaps, 8.5 mm (■/□) and 118.5 mm (★/☆). Data points of soft sparking (Rpn = 0.89) are marked with open symbols, those of conventional arcing (Rpn = 1.57) are marked with close symbols. PEO time is 40 min with 100 Hz bipolar pulsed current at anodic current density 92 A·dm−2.
Metals 08 00105 g007
Figure 8. Microstructure features of the PEO coatings on Mg and AZ91D alloy with soft sparking. Cross-sectional images are shown for (a) the coating was oxidized on a high purity Mg substrate with Rpn = 0.86 in an electrolytic solution of K2ZrF6, NaOH and Na6P6O18 for 40 min [85]; and (b) the coating was oxidized on AZ91D substrates with Rpn = 0.83 in an electrolytic solution of Na2SiO3 and Na2P2O7 for 15 min [86]. Note the pores and fissures near the metal–oxide interface.
Metals 08 00105 g008