Article

Forming and Oxidation Behavior During Forging with Consideration of Carbon Content of Steel

1
Institute for Machine Tools and Production Processes, Professorship Virtual Production Engineering, Chemnitz University of Technology, Reichenhainer Str. 70, 09126 Chemnitz, Germany
2
Institute of Metal Forming, TU Bergakademie Freiberg, Bernhard-von-Cotta-Str. 4, 09599 Freiberg, Germany
3
Institute of Forming Technology and Machines, Leibniz University Hannover, An der Universität 2, 30823 Garbsen, Germany
*
Author to whom correspondence should be addressed.
Metals 2018, 8(12), 996; https://doi.org/10.3390/met8120996
Submission received: 23 October 2018 / Revised: 9 November 2018 / Accepted: 20 November 2018 / Published: 27 November 2018

Abstract

:
Developments in technology rely increasingly on the numerical simulation of single process steps up to whole process chains using commercially available or user-written software systems, mostly based on the finite element method (FEM). However, detailed simulations require realistic models. These models consider the relevant material-specific parameters and coefficients for the basic material, surface phenomena, and dies, as well as machine kinematics. This knowledge exists to some extent for certain materials, but not in general for groups of steel that depend on alloying elements. Nevertheless, the basic material and its behavior before, during, and after hot deformation must be understood when designing and describing die-forging processes by experimental and numerical simulations. This is why a new mathematical approach has been formulated for forming behavior and recrystallization kinetics, taking into account the carbon content of the base material, the initial microstructure, and the reheating mode. Furthermore, there have been no studies investigating the influence of varying a single chemical element, such as the carbon content, with regard to the oxidation behavior, including the internal structure (e.g., pores) at high temperatures. In this context the majority of studies were performed with steel grade C45 (material no. 1.0503), which was chosen as base material for the experiments conducted. To identify the effects of the alloying element carbon on the material and oxidation behavior, steel grades C15 (material no. 1.0401) and C60 (material no. 1.0601) were also investigated. The investigations revealed a dependence of the material behavior (microstructure and surface) on the alloying system. Based on the experimental results, the mathematical models formulated were parameterized and implemented in the FE-software Simufact Forming (Simufact Engineering GmbH, Hamburg, Germany) by means of user subroutines. Furthermore, a correlation between the thickness of the oxide scale layer and friction was determined in ring compression tests and accounted for in the software code. Finally, real forging tests were carried out under laboratory conditions, with all three investigated steels for calibration of the materials as well as the FE models.

1. Introduction

In order to simulate closed process chains, besides the influencing variables for the process description, the strongly inhomogeneous material properties within a process step and the different material states along a process chain must be taken into account for the material characterization. It is therefore indispensable for the experimental simulation to be focused on the aim of the investigated technologies, and the complex interaction between the material and forming machine during the individual process stages. Furthermore, the influence on subsequent process steps has to be considered. It must also be ensured that the experimental simulation describes the analyzed process with sufficient accuracy with regard to strain rate, forming temperature, friction, reheating mode, microstructure, etc., in order to implement these data in the numerical systems. In addition to the material characterization of the base material, the description of surface modifications as a result of the forming temperature is becoming increasingly important, because these phenomena influence the final product quality, process efficiency, and the material flow based on friction. The influence of alloying elements on high-temperature oxidation behavior as well as the hardening and softening processes before, during, and after the forming process were investigated in principle for single steel grades, but not for a group of steels.
A study by Kawalla et al. compared the oxidation behavior of different steels (S355, Ultra Low Carbon steel, Si steel) with regard to the loss of mass due to oxidation [1]. The oxidation was slightly lower for the ULC steel (<0.01% carbon content) compared to steel S355 (<0.24% carbon content). One reason can be seen in the lower C content in combination with the further alloying elements in the interstitial-free (IF) steel (e.g., Ti, Nb). Depending on the C content, carbon gas products (CO and CO2) are formed, which lead to non-uniform scale properties, lower bonding strengths of oxide scale to the steel matrix, and cracks within the oxide layer. These cracks further increase the oxidation rate because oxygen can react directly with the iron/base material. Non-opened pores with carbon gas products can decrease the oxidation rate due to the fact that the pores can be healed. Steel grades containing Si alloys exhibit reduced oxidation at lower temperatures due to the reaction-inhibiting layer Fayalite. This silicon oxide has a higher enthalpy of formation than iron oxide, and so the oxidation rate decreases as result of the development of spinels in the interface of steel/scale like chromium or aluminium. At temperatures above 1100 °C, the oxidation rate increases strongly compared to S355 and IF steel. This is caused by the differing content of the alloying element Si (<0.5% Si in S355 and ULC steel, and >2.5% Si in Si steel) among others [1].
It should be considered, that the alloying elements carbon, silicon, and aluminum influence the microstructure (carbon increases the grain size; aluminum exhibits the grain growth up to 1100 °C; and silicon influences the phase stability) of the base material, and thus also influence the oxidation. In combination with further elements, the oxidation and microstructure kinetics can be accelerated or decelerated [2,3].
Especially in the case of iron oxide scale development, the focus of the investigations so far has been on the influence of surface properties and the correlation of oxidized surfaces with friction. Surface defects (waves, grooves, etc.) increase the relative surface in general, and the amount of oxide increases [4]. During hot forming, the roughness is slight (e.g., with hot strip Ra ≈ 2 μm) [1,5]. Based on investigations into steels with different chromium and nickel contents, Giggins et al. concluded that a rougher surface increases the oxidation rate and promotes carburization [6]. For carbon steel, Eubanks et al. determined that the increase in roughness reduces the oxide layer thickness and changes the volume fractions of the three iron oxides formed, i.e., increasing roughness decreases the proportion of wustite, while magnetite acquires a significantly and haematite a slightly higher volume fraction [7]. The influence of the oxide layer thickness and scale composition on friction has to date been modeled only phenomenologically or analytically in excerpts, and mostly for one material and not for material groups (such as carbon steels). In the experiments from other research groups, oxide scale formation was controlled by defining holding times and oxidation temperatures in specially adjusted atmospheres to investigate its influence on friction and wear. As a result, a very thin scale layer, which is softer and more ductile than a thick oxide layer, has a lower coefficient of friction [8,9,10,11,12,13]. Thicker layers fail faster and impair friction conditions, because the oxide breaks up and an alternating contact between oxide scale fragments and the non-oxidized metal matrix occurs. An additional result of the investigation was that a small proportion of magnetite can reduce the friction [11]. The oxide layer also influences the thermal behavior of the material because iron oxides are comparable with ceramics. Hence, heat transfer to the environment and to the forming tools is exhibited.
The softening processes are diffusion processes, and depend on time and/or temperature. The flow stress depends not only on the strain rate and the forming temperature, but also on the material state (chemical composition, initial microstructure, solution state, and phase contents) [14,15]. However, to date, there are no models to describe forming behavior with consideration of the heating mode, grain size, etc., for a whole material group. All experimentally generated data represent only one material state. In studies by Schacht et al., the influence of carbon content on self-diffusion was investigated; it was found that the diffusion rate increases with increasing carbon content. Thus, the different conversion behavior and the structure development during cooling can be justified. However, the chemical composition of the materials is not only different in terms of carbon content [16]. Some material software can calculate material behavior from the chemical composition, but without a consideration of microstructure.

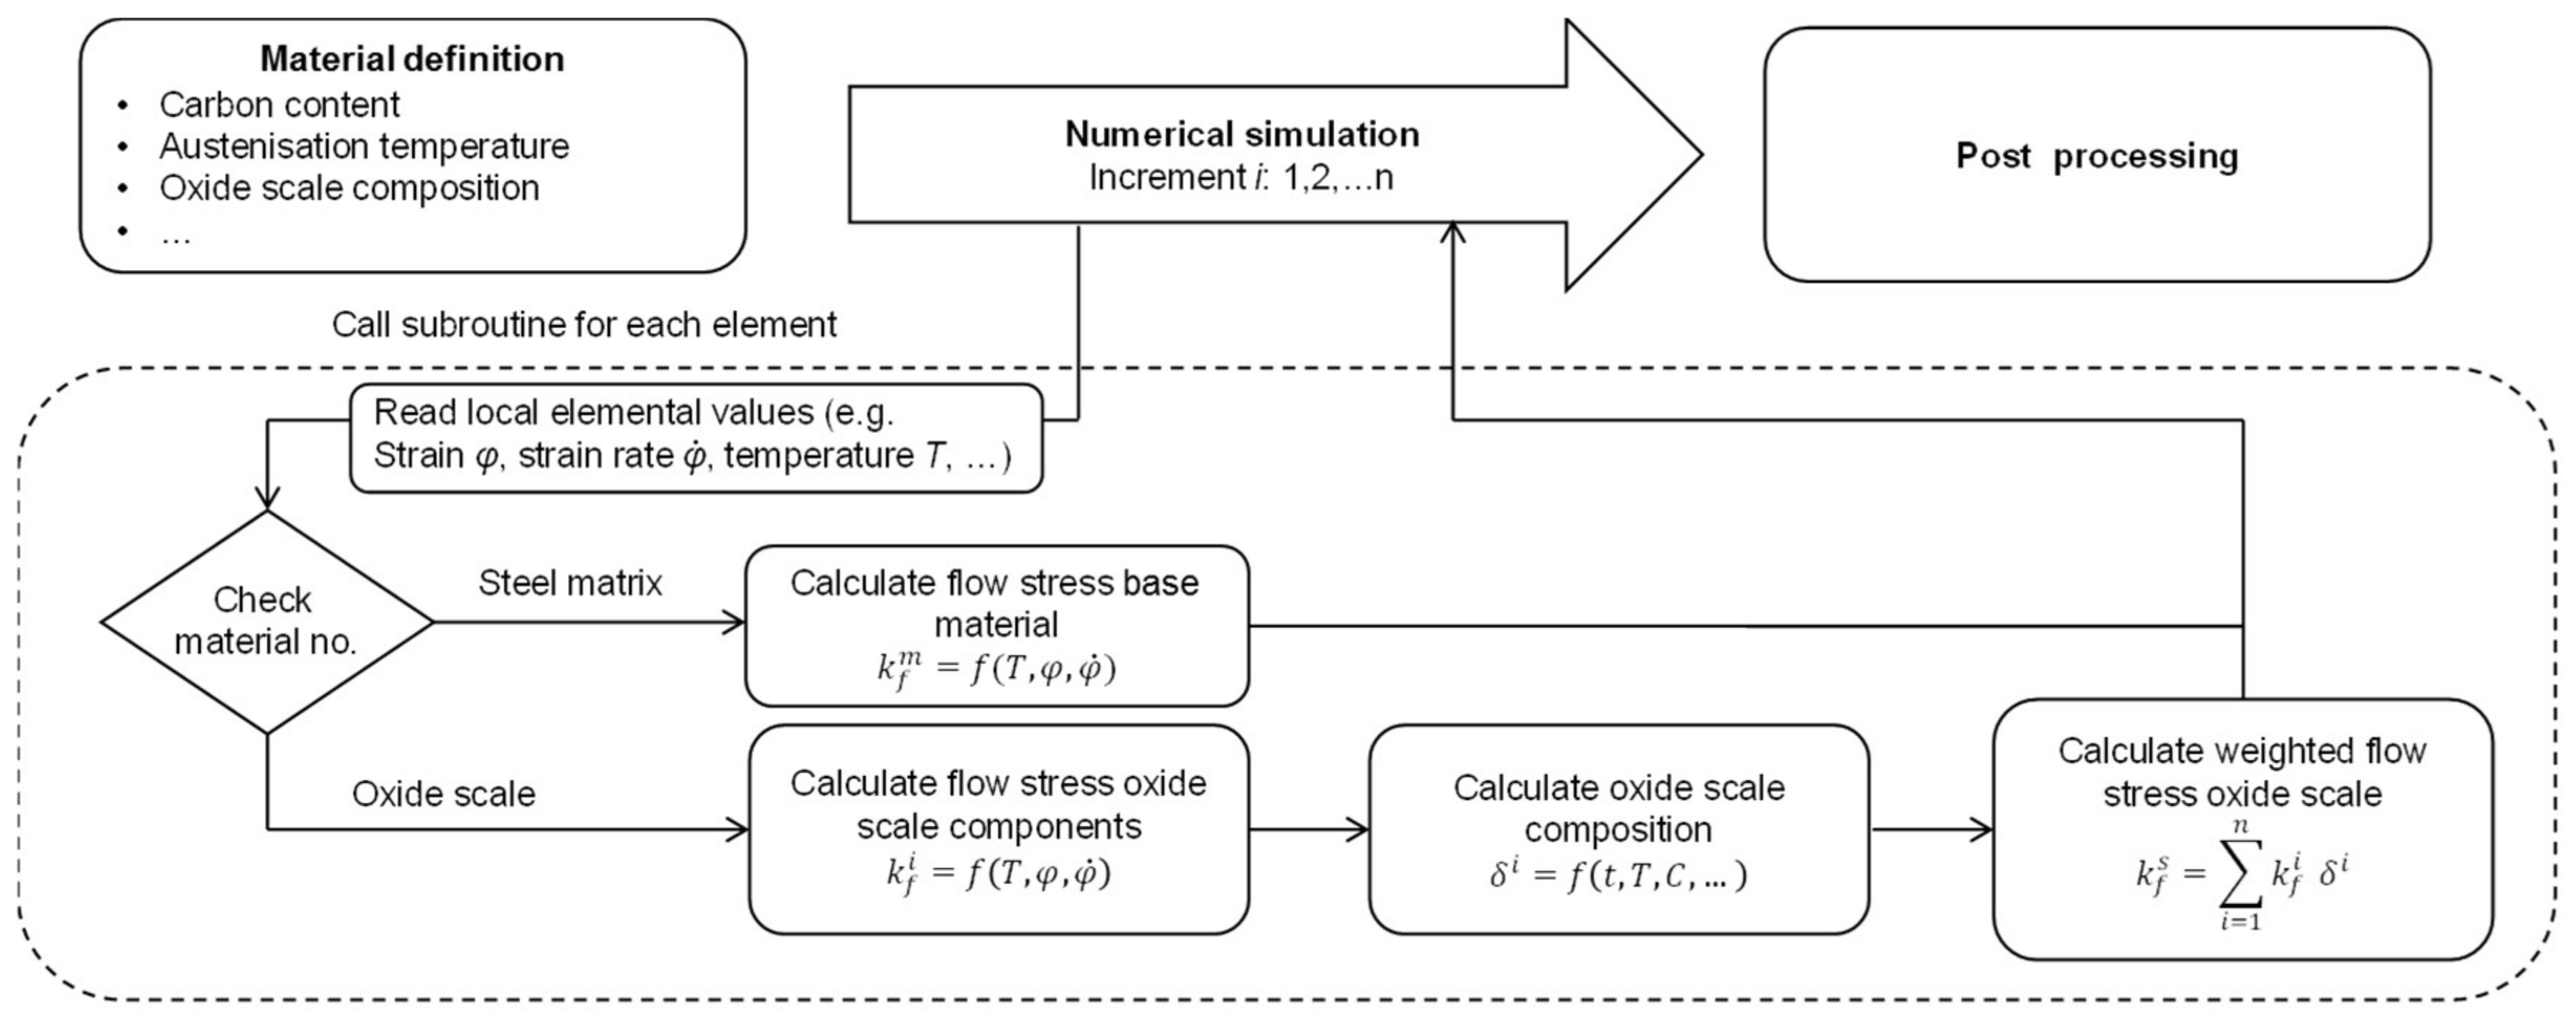
2. Finite Element Model

2.1. Material Data

The basis for all investigations was three steels, which differed only with regard to their carbon content (Table 1). These three laboratory melts were forged for all experiments, they were then rolled as rods, and finally soft annealed (700 °C for several hours).

2.2. Forming Behavior

Determining the flow stress was carried out depending on the initial austenite grain size, the strain rate, the plastic strain, and the forming temperature in the Multi-Directional Simulator MDS 830 from Bähr (Bähr Thermoanalyse GmbH now TA Instruments, Hüllhorst, Germany). The cylindrical compression samples were reheated with 1K/s to 900–1200 °C, and homogenized for 40 min, before the forming temperatures 800 to 1200 °C were adjusted within 10 min. In compliance with previous studies of Papaefthymiou et al., the lower heating rate (comparable to the heating behavior in a radiation furnace before the investigated forging tests) was adjusted [17]. Hence, all alloying elements were in solution/equilibrium and the initial microstructure was coarser but homogenous. The subsequent deformation was carried out with a plastic strain of up to 1.2 with a strain rate of 1–20 s−1. To minimize the friction between tool and sample, graphite was applied as a lubricant to the tools, which consisted of Al2O3. The results of the compression tests were evaluated with the aid of the AUK software from ITA technology & software (ITA Ltd., Ostrava, Czech Republic) which took into account the necessary friction according to Pöhlandt, and temperature correction of flow curves to account for the temperature increase as a result of internal friction during deformation [18,19].
The new flow curve function σ for flow curve modeling divided the calculated flow curve (based on force-displacement-curve) into two areas – I < σmax > II, whereby a transition function δHS was additionally integrated, as shown in Equation (1). This approach took the influence of the carbon content into account. The famous Hensel–Spittel formulation as flow curve model was used for each separated area for modeling the identified flow curves. This whole new model is described in detail in [20]. The model accounted for the influence of the austenitization temperature, strain rate, and forming temperature. The first approach HSa shown in Equation (2), with six adaptation coefficients (Table 2), for the first curve section described the shape, which showed the hardening (beginning of the flow curve); the second approach HSb shown in Equation (3), with five adaptation coefficients (Table 3), analyzed the flow curve section where primarily softening (recovery or recrystallization) processes were in equilibrium. The transition function δHS was determined using Equation (4) with five model coefficients (Table 4). The calculation of the flow stresses was as follows:
σ = ( 1 δ H S )   H S a + δ H S   H S b
with
H S a = A a   C [ % ] m C 1   ϑ γ m a   e m a 1   ϑ   φ m a 2   ϑ γ m a φ C [ % ] m C 2   φ ˙ m a 3
  H S b = A b   C [ % ] m C 3   e m b 1   ϑ   φ m b 2   φ ˙ m b 3
δ H S = 0.5 + 1 π tan 1 [   w 1   ϑ w 2 ( φ   φ k ϑ γ w γ φ ˙ w 4   ) ]
The model was adapted for all investigated conditions and for all steels, to consider the influence of carbon content. The influence of the carbon content on flow stress was modeled using the Hensel–Spittel approach. A comparison between modeled and experimentally determined flow curves showed a maximum deviation of 20 MPa.

2.3. Recrystallization Kinetics

In order to describe the recrystallization behavior, continuous and discontinuous compression tests as well as microstructural investigations were carried out. The forming experiments were performed on the Multi-Directional Simulator MDS-830 Bähr (Bähr Thermoanalyse GmbH now TA Instruments, Hüllhorst, Germany). The evaluation of the compression tests made it possible to model the softening kinetics for the three steels, whereby the conditions of the investigations for all alloys were as follows: Strain rates of 0.1, 1, 10, and 30 s−1; plastic strains for the first deformation of 0.3, 0.5, and 0.6; homogenization/austenitization temperatures of 1000 °C, 1100 °C, and 1200 °C; forming temperatures 100 °C and 200 °C below the austenitization temperature. The analysis was carried out with the temperature and strain rate correction to minimize experimental influences.
Modeling of the softening processes (recovery + recrystallization) was carried out for all experimental results. The behavior of the alloys was subdivided into: Dynamic (DRX), metadynamic (MDRX), and static recrystallization (SRX). These phenomena were modeled using the Avrami approach according to Equations (5)–(7) [19]. An overview of the material-specific material constants obtained is given in Table 5, Table 6 and Table 7.
  • DRX:
X D R X = 1 e x p [ l n ( 2 ) · ( φ ( d 4 · D 0 d 5 · ( φ ˙ · e Q D R X R   T ) d 6 ) ( d 1 · D 0 d 2 · ( φ ˙ · e Q D R X R   T ) d 3 ) ( d 4 · D 0 d 5 · ( φ ˙ · e Q D R X R   T ) d 6 ) ) n d ]
  • MDRX:
X M D R X = 1 e x p [ l n ( 2 ) · ( t p m 1 · φ ˙ m 2 · T a · e Q M D R X R   T ) n m ]
  • SRX:
X S R X = 1 e x p [ l n ( 2 ) · ( t p s 1 · φ s 2 · φ ˙ s 3 · T a · e Q S R X R   T ) n s ]

2.4. Oxidation Behavior

Depending on the carbon concentration in the steel, this alloying element has an influence on the formation of the scale layers and their structures. The rolled, partially annealed, and milled sheet samples, with l = 150 mm × w = 20 mm × t = 4 mm and an average roughness of Ra ≈ 0.5 μm, were inductive reheated with 20 K/s in the Biaxial Test Apparatus BTA 840 from Bähr (Bähr Thermoanalyse GmbH now TA Instruments, Hüllhorst, Germany). A defined time–temperature regime was investigated. After reaching the oxidation temperature (900–1250 °C), a holding process of various durations (20–120 s) was set for oxidation. Oxygen was actively supplied via nozzles near the sample surface. After the oxidation time, the samples were cooled under vacuum as quickly as possible. To protect the scale layer from external influences and damage, all samples were covered with epoxy resin at room temperature. Light micrography was used to measure the thickness, mean pore size, and total pore volume of the layers, so that the correlation between oxidation morphology, carbon content, oxidation temperature, and oxidation time could be determined [21].
In general, it was identified that, with increasing temperature and/or time, the layers thickness increased as a result of the diffusion process. There were correlations between the carbon content and the resulting scale thickness. In addition, it was determined that the oxidation rate decreased with increasing carbon content. Based on these results, a regression analysis was carried out for the three alloys using the combined Arrhenius approach, as shown in Equation (8). The model coefficients are given in Table 8.
d o x i = k p 0   ×   e x p ( Q p R   ×   T ) 2   ×   k l 0   ×   e x p ( Q l R   ×   T ) + ( k p 0   ×   e x p ( Q p R   ×   T ) 2   ×   k l 0   ×   e x p ( Q l R   ×   T ) ) 2 + k p 0   ×   e x p ( Q p R   ×   T )   ×   t o x i
The parameters were identified by the least-squares method for each carbon content with a high coefficient of determination. From this, a model for the parabolic activation energy taking into account the carbon content was derived, shown in Equation (9).
Q p = 294458 ×   C [ % ] 2 +   165174   ×   C [ % ]   +   114389
The linear coefficients showed no significant carbon dependency, because the linear term described primarily the oxidation of short durations. The start of layer development was not investigated due to the longer reheating times during forging operations. Therefore these three coefficients can be fixed constants.

3. Numerical and Experimental Simulation of Die Forging Processes

3.1. FE Model

The numerical model was developed using the FE software Simufact.Forming v14.1, which is based on the implicit MSC Marc solver. This was particularly suitable due to the robust remeshing algorithms for the simulation of bulk forming processes. The different material properties of the steels and the oxide layer, which in turn consisted of the three iron oxides–wustite, haematite, and magnetite–were taken into account in the simulation model by using a multi-material approach. The user subroutines for this were programmed in Fortran. The principle structure and data flow between solver and subroutine are shown in Figure 1. Within the subroutine, the current local flow stress of each integration point of an element was calculated and passed to the solver based on the current local process conditions (plastic strain, strain rate, temperature, carbon content, and the oxide scale composition). The subroutines were accessed for each iteration in a calculation increment.
To assign the different mechanical properties, the preprocessor assigned a specific material ID to each element, which was also transferred to the subroutine. During the calculation, all transferred data between solver and subroutine were linked to the specific element ID, the correct assignment between the data calculated in the subroutine, and the solver. Input data, such as carbon content of the steel, austenitizing temperature, and volume fraction of iron oxides were entered in a graphical user interface (GUI) and transmitted from the solver to subroutines. Due to the very small dimensions of the scale layer–with thicknesses in the range of 30–200 μm–compared to the steel matrix, a specific FE mesh design was necessary. In a mesh sensitivity analysis, the number of elements (1–10) over the thickness of the whole oxide layer was varied, as well as the ratio of element edge lengths in the oxide layer and matrix material. The discretization was performed using fully integrated isoparametric quad elements. The sensitivity study revealed that at least 4–5 elements should be used over the layer thickness to obtain reliable results and numerical stability. The plastic behavior of the thin oxide scale layer was calculated by means of a smeared continuum approach. Based on this assumption, a material with non-uniform and varying properties can be described as a homogeneous continuum. Therefore, a separate flow stress based on the implemented material models as well as the local element variables, such as the current temperature and strain given by the solver, was calculated for each component of the oxide scale.
The calculated individual flow stress (kf,oxides) together with the specific volume fraction (δoxides) of the iron oxides were used to calculate a weighted total flow stress. The calculation was done according to Equation (10):
k f = k f , w u s t i t e   ×   δ w u s t i t e + k f , m a g n e t i t e   ×   δ m a g n e t i t e + k f , h e m a t i t e   ×   ( 1 δ w u s t i t e δ m a g n e t i t e )
The determination of the flow curves of the individual iron oxides was based on Hensel–Spittel approach 8 taking into account the forming temperature and the strain rate [22].
However, additional boundary conditions were necessary for the thermo-mechanical simulation. Based on the studies of Tominaga et al. [23] and Sun [24], an oxide composition with 64% wustite, 30% magnetite, and 6% haematite was determined for an oxidation temperature of 1000 °C for the first numerical investigations [22]. Other previous studies have shown that the heat transfer coefficient for undamaged scale coatings is lower by a factor of 10–15 than for steel [25,26], whereby the heat loss to the tools is decreased. The contact between the steel matrix and the inner side of the oxide layer was defined as a “glued contact”. The nodes of the inner side of the oxide layer were fixed to the surface mesh, whereby a separation was not possible.

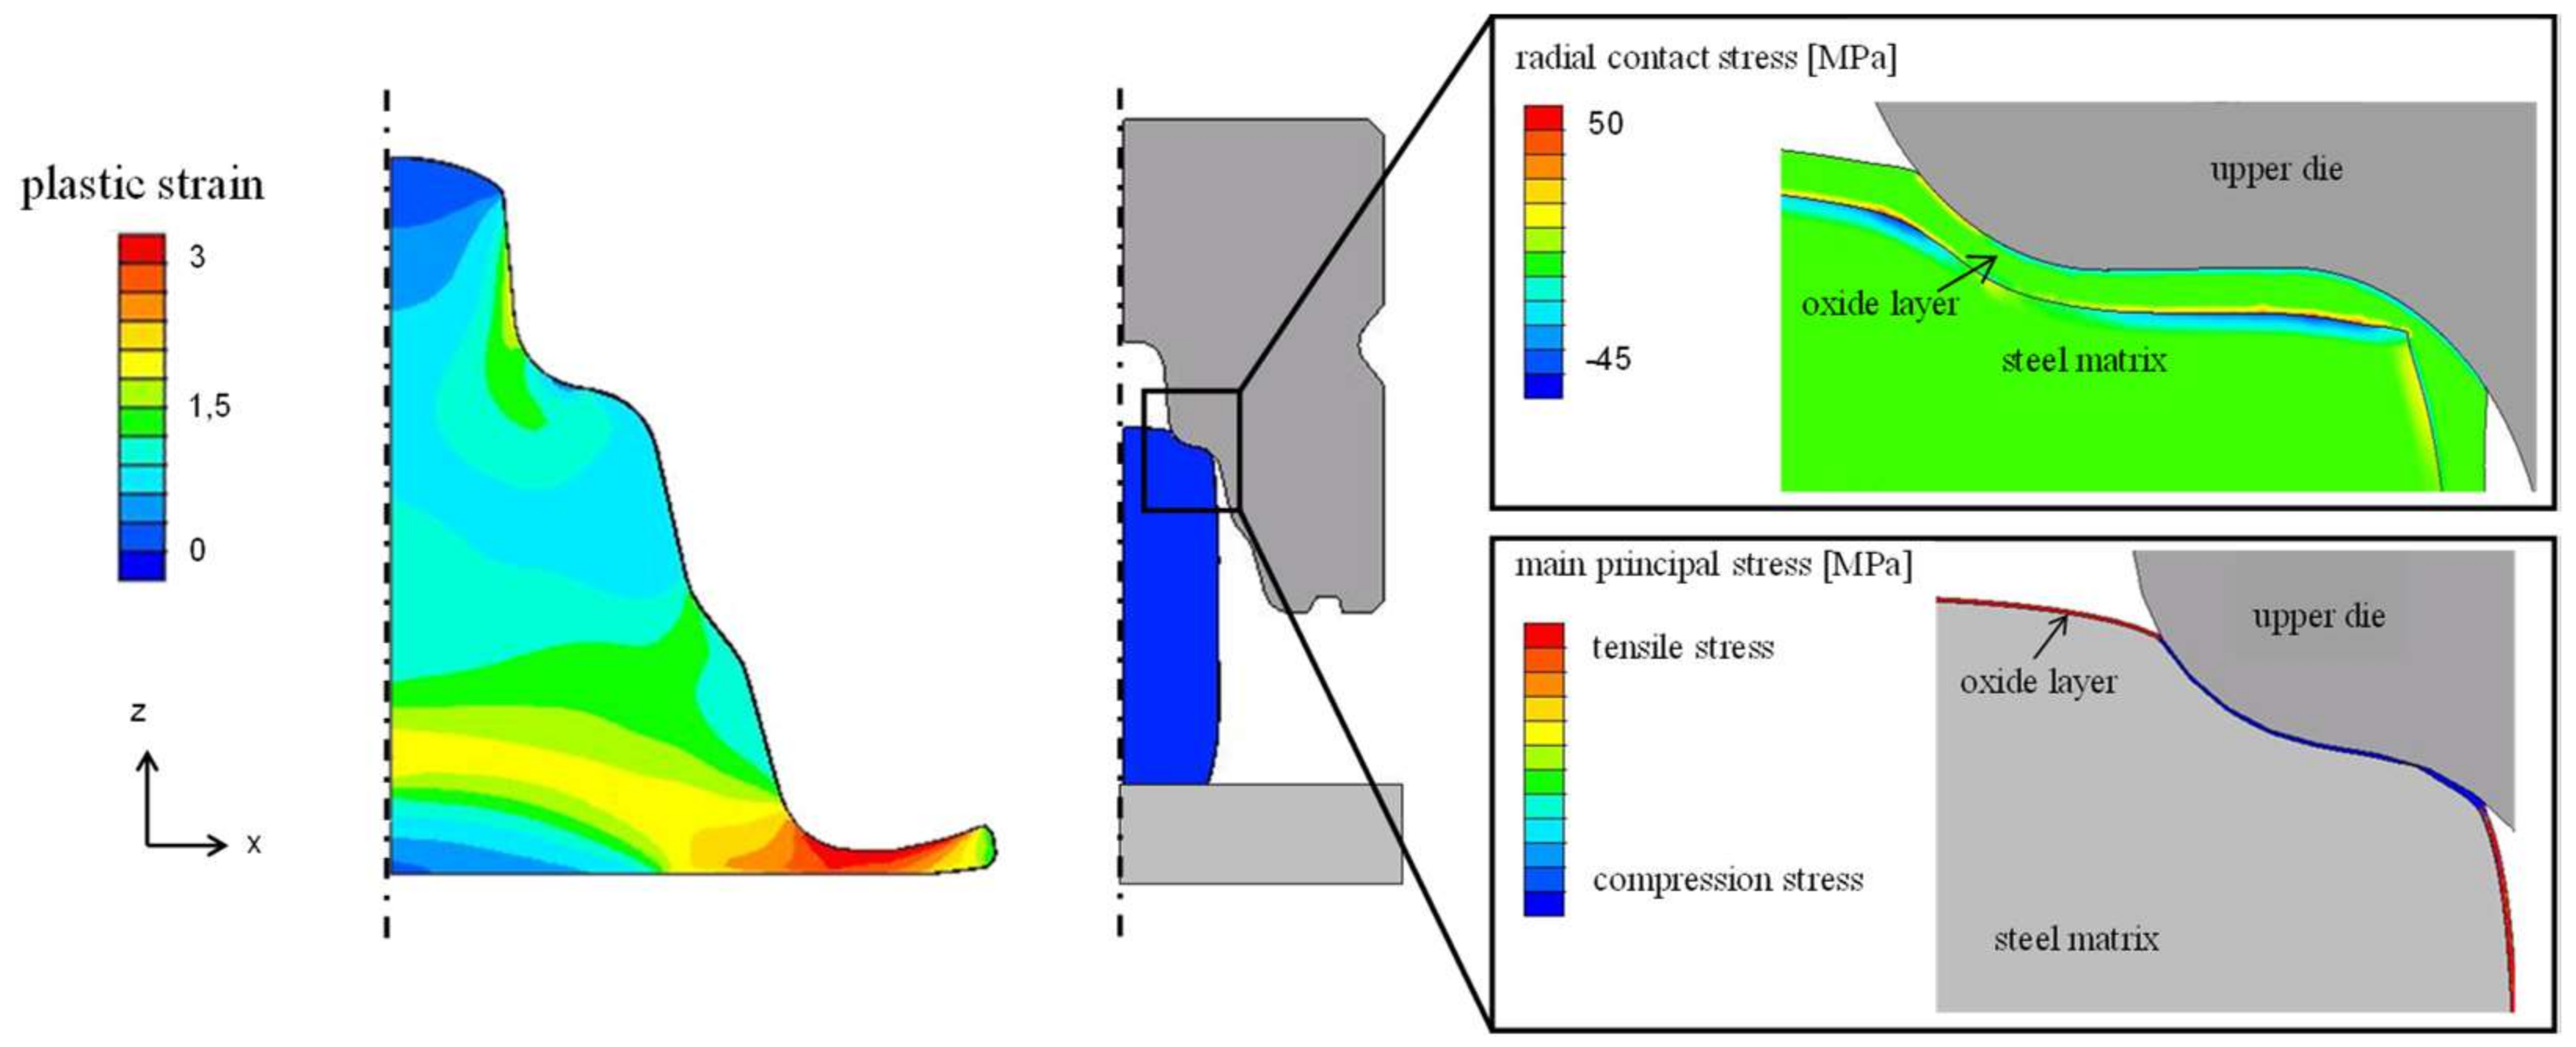
3.2. Simulation of Ring Compression Tests

The numerical model and the subroutines were validated and calibrated using ring-compression tests, where defined oxidized samples were used. The initial oxide scale layer thickness, which was needed as a boundary condition in the FE model, was determined by the metallographic images of real samples. Additionally, a correlation to the oxide growth model was made. In this case, the layer thicknesses were measured at different positions over the sample and averaged. At an oxidation time of 30 s, a layers thickness of 50 μm for an oxidation temperature of 1000 °C, or 30 μm for an oxidation temperature of 900 °C, was determined for all three analyzed steel grades (Figure 2).
A comparison of experimentally measured and numerically calculated force–displacement curves is given in Figure 2c for all tested steel grades. After the beginning of the compression test, the curves showed a good qualitative agreement. The deviation was 50% between simulation and reality, up to a stroke of 0.4 mm, and then increased the accuracy of the results to a deviation less than 1%. This was due to the fact that in the reality condition, the oxide was more a non-porous solid sample as well as in the simulation. It was therefore concluded that the assumed numerical boundary conditions could be applied. At the beginning, small deviations between the experimental and numerical forces were noted. This could be caused by having no machine reaction in the numerical simulation. Furthermore, in complex forging processes, the brittle oxide scale could undergo rupture, and at the beginning of the process the pores of the real oxide were compressed. Damage to the oxide layer is not currently considered. The influence of different thicknesses is shown in Figure 2a,b. Furthermore, in Figure 2b, the calculated force–displacement curves were compared for the same process conditions but with and without consideration of an oxide layer. It can be seen that the oxide scale layer led to lower forces under the same process conditions.
Table 9 summarizes the experimentally determined and numerically calculated internal diameters and heights of the deformed specimens after the ring-compression test. The results showed a good agreement.

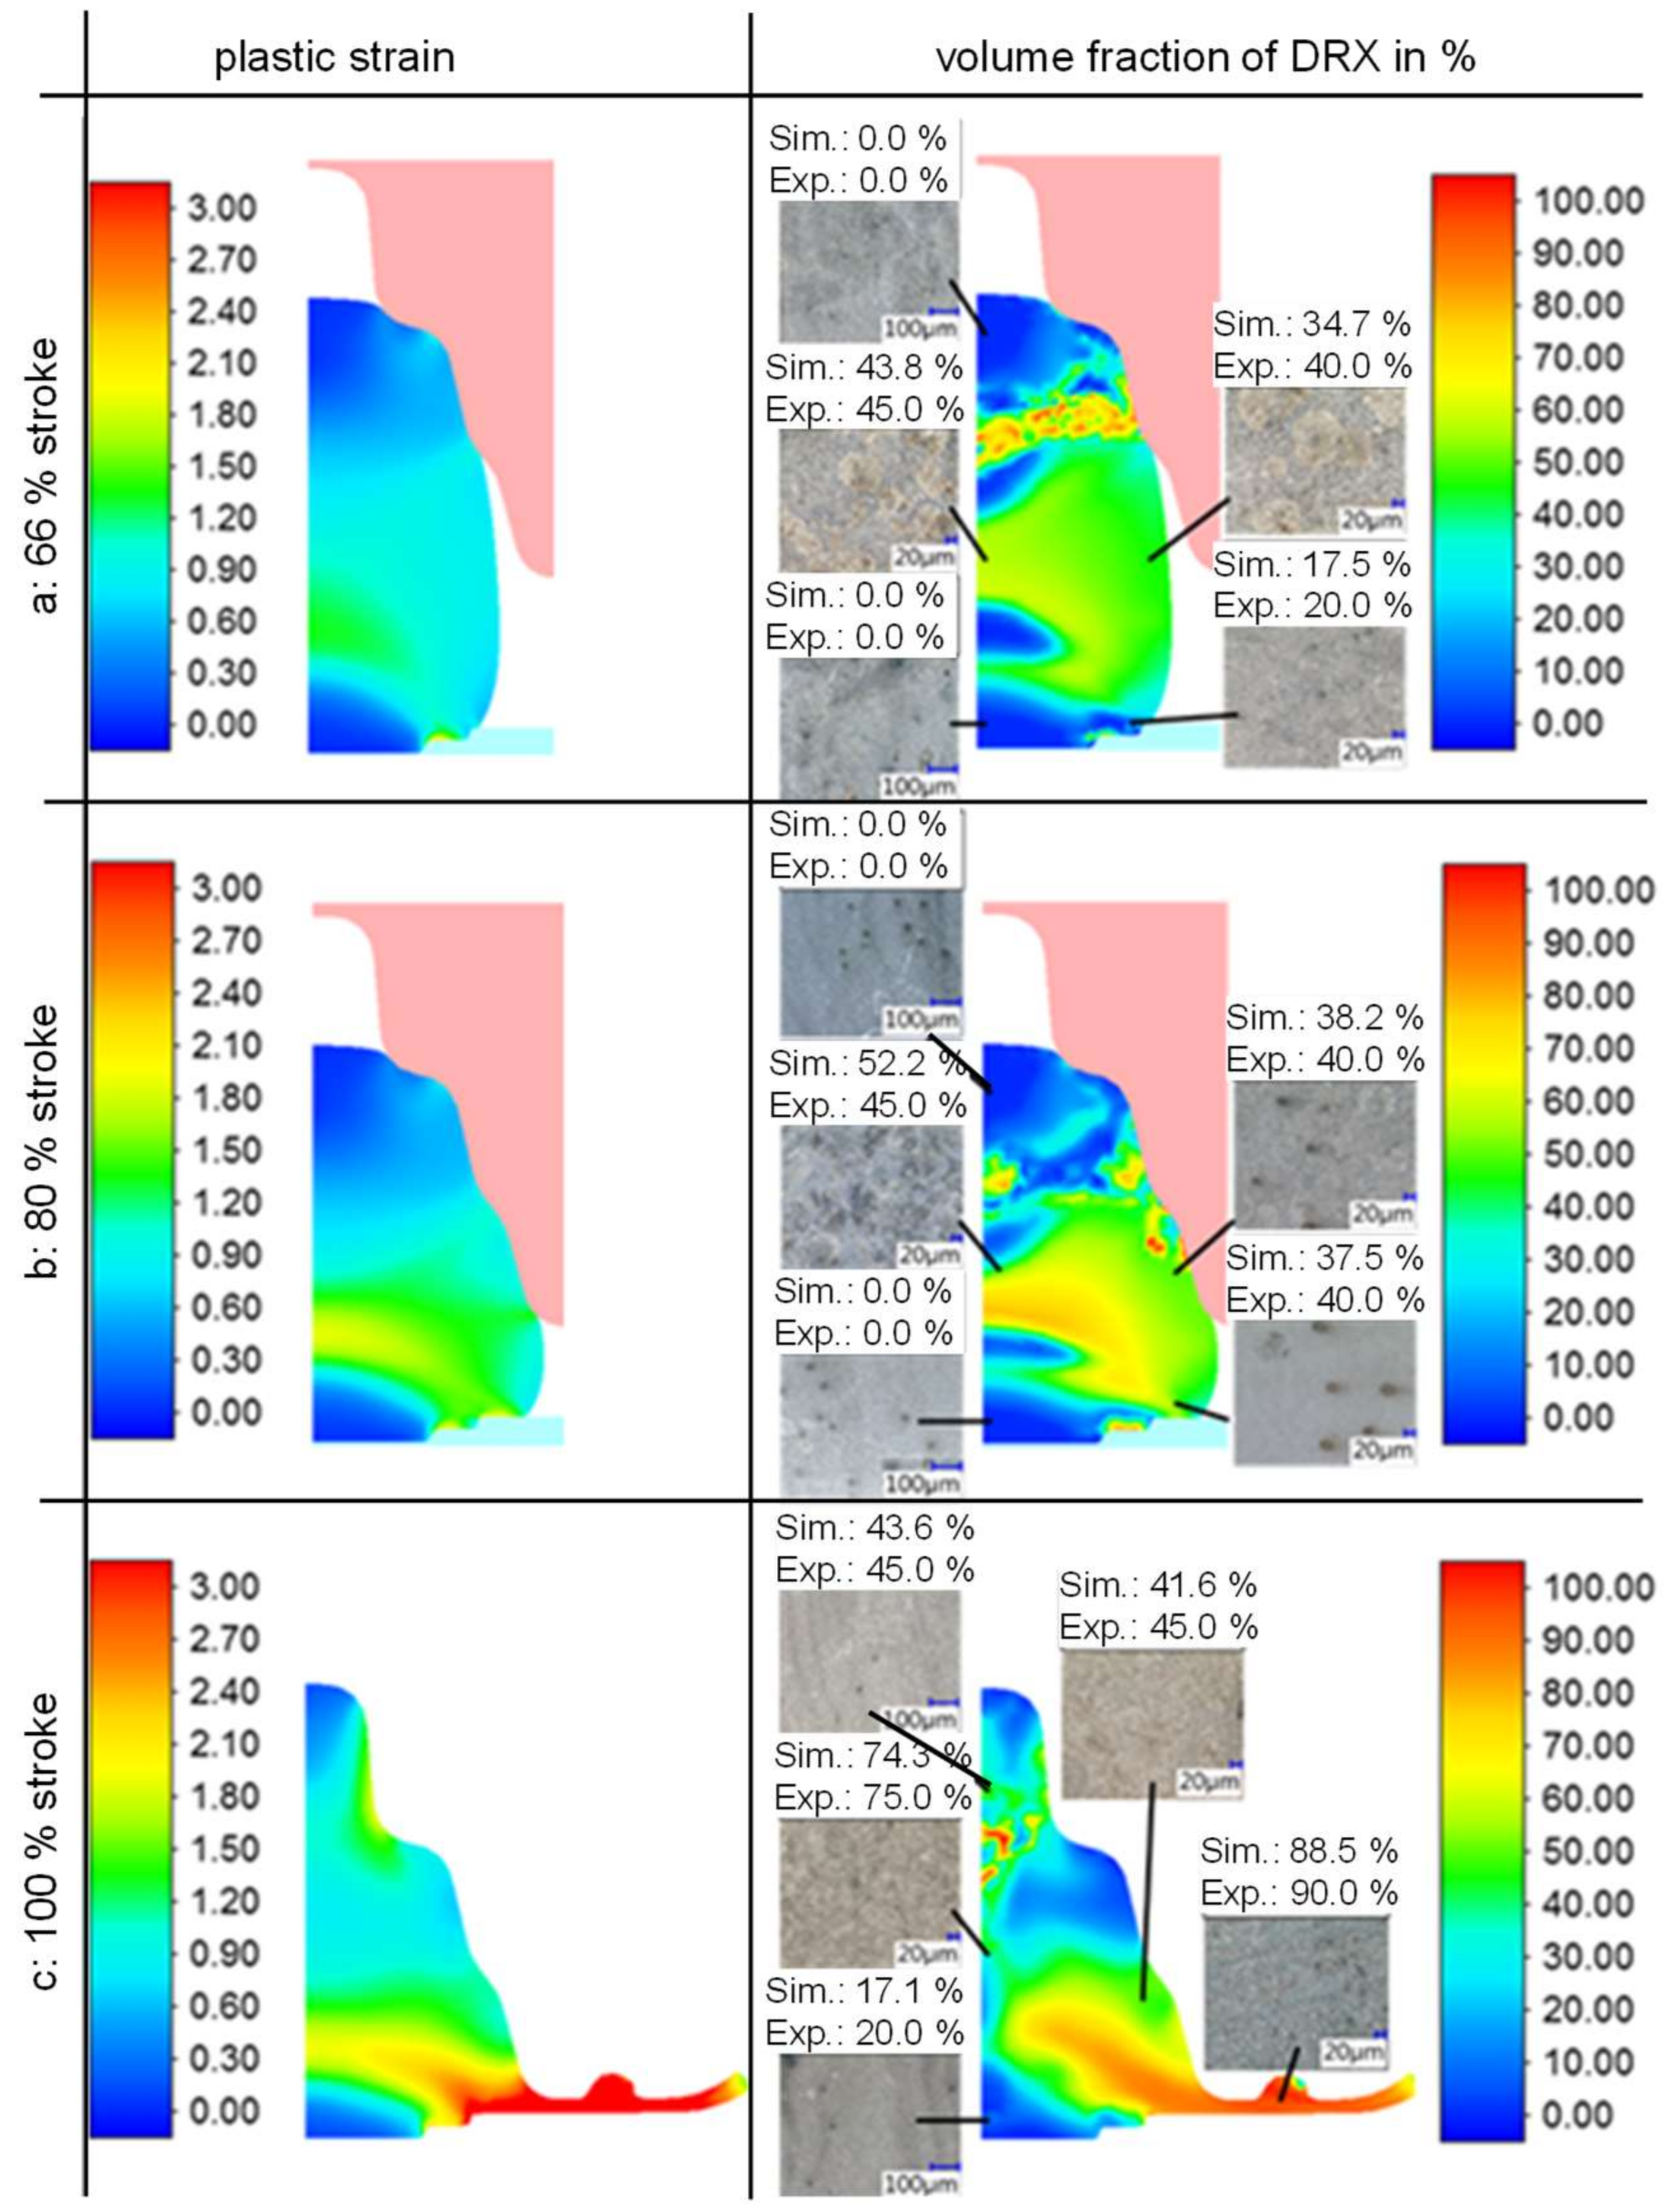
3.3. Simulation of Laboratory Die Forging

The developed model, which was validated by the ring-compression tests, needed to be examined for robustness and functionality on a laboratory scale. A sensorized die was developed to generate additional information during the forming process in the contact area/forming gap between material and die. At first, the FE model was tested by considering steel C15 with a temperature of 1000 °C. Based on experimental investigations, a layer thickness of 100 μm was assumed. The composition was determined analogously to the procedure described above. The starting temperature of the tools, modeled as thermally conductive rigid bodies, was 250 °C. Figure 3 shows the calculated plastic strain at 95% stroke for C15. Additionally, the contact stress between the oxide layer and the steel matrix, as well as the maximum main principal stress, are shown at 50% of stroke.
The results at a stroke of 50% showed locally high radial friction stress differences or stress differences perpendicular to the z-axis between the surface nodes of the steel matrix and the oxide, in the area between the oxide layer and the steel matrix. These could be due to the loads on the scale layer being too high and the bonding strength of the scale layer being overloaded, resulting in damage/cracks perpendicular to the layer thickness and sliding of the oxide layer over the metal surface. Furthermore, during forming, high positive main stresses/tensile stresses occurred in the scale outside the area of contact with the tool. In these critical areas, the crack growth began. Compressive stresses were observed only in the area of the oxide in direct contact with the tool. The high stress differences in the oxide layer during the forging process, especially the tensile stresses in the non-contact areas, led to failures by delamination of the scale or formation of cracks. The damage behavior of the oxide layer was then investigated experimentally and numerically in further investigations. Thus, after the functionality of the material and FE models was proven, the simulation with C45 and C60 was made. These results were comparable to the previous calculations. The differences between the three alloys was only the initial layers thickness, however the volume of the oxide layers in comparison to the base material was lower, explaining why the results were almost equal. For consideration of the alloying influence to the oxide forming behavior, the maximum plastic strain/damage criteria was necessary depending on the layers thickness.
Another focus was on the prediction of microstructural development during forging. All the above model coefficients for DRX, MDRX and SRX were prepared and implemented in MatILDA (Material Information Link and Database Service), which has a direct interface to the FE software Simufact.Forming. Therefore, by defining the initial grain size, a comprehensive material simulation involving the local forming temperatures, strain rates, and plastic strain with respect to recrystallization behavior was used. An example of these simulations, which exist for all three steels, is shown in Figure 4 for steel C60, which had the fastest/most intense recrystallization kinetic of the three investigated material. Furthermore, on the base of the higher carbon amount was the preparation of the microstructure, especially the grain boundaries, most suitable. Furthermore, the microstructure simulation was compared with the experimental results, as can also be seen in Figure 4. For the microstructural analysis, the samples were quenched in water after forging with different strokes: 66%, 80%, and 100%. The microstructures were examined at the marked positions for all steels and for the different forged specimens.
The comparison of experimentally measured and numerically calculated results for all three steels showed a good qualitative agreement.

4. Conclusions

By using three alloys as laboratory melts, which differ only in carbon content, the influence of this alloying element on the forming, recrystallization, and oxidation behavior was investigated, modeled, and implemented in a FE software. In general, the influence of carbon was detectable and was taken into account by modifying the existing approaches. The carbon content significantly influenced the diffusion rate, which made it easier to proceed with microstructural and oxidation processes. The “new” models for describing the carbon influence on forming and oxidation behavior as well as the microstructure evolution were implemented as user subroutines (for the material behavior was only the carbon necessary and must be entered) in the FE software Simufact.Forming, and validated by ring-compression tests as well as by die forging experiments under laboratory conditions for all three steels.

Author Contributions

M.U., G.K., and R.K. designed and realized the experiments; G.K. and M.G. identified the model coefficients; H.W. and B.-A.B. wrote the subroutines for the FEM; H.W., M.G and B.A. made the numerical simulation of the scale and microstructure behavior during forging; M.G. wrote the paper.

Funding

This research was funded by German Research Foundation (DFG) grant number 316273316.

Acknowledgements

The authors thank the German Research Foundation (DFG) for the financial support of the project “General modelling of material behavior and surface modifications for FEM analysis of the die forging of carbon steels” (BO3616/10-1, GR4872/1-1, UL471/1-1).

Conflicts of Interest

The authors declare no conflict of interest.

References

  1. Kawalla, R.; Steinert, F. Untersuchung des Einflusses von Prozessparametern in der Fertigstrasse auf die Tertiärzunderausbildung. Materialwiss. Werkstofftech. 2007, 38, 36–42. (In German) [Google Scholar] [CrossRef]
  2. Suarez, L.; Schneider, J.; Houbaert, Y. High-Temperature Oxidation of Fe-Si Alloys in the Temperature Range 900–1250 °C. Defect Diffus. Forum 2008, 273–276, 661–666. [Google Scholar]
  3. Yuan, Q.; Xu, G.; Zhou, M.; He, B. The Effect of the Si Content on the Morphology and Amount of Fe2SiO4 in Low Carbon Steels. Metals 2016, 6, 94. [Google Scholar] [CrossRef]
  4. Uran, S.; Veal, B.; Grimsditch, M.; Pearson, J.; Berger, A. Effect of Surface Roughness on Oxidation: Changes in Scale Thickness, Composition, and Residual Stress. Oxid. Met. 2000, 54, 73–85. [Google Scholar] [CrossRef]
  5. Sun, W.; Tieu, A.K.; Jiang, Z.; Lu, C. High temperature oxide scale characteristics of low carbon steel in hot rolling. J. Mater. Process. Technol. 2004, 155–156, 105–113. [Google Scholar] [CrossRef]
  6. Giggins, C.S.; Pettit, F.S. Corrosion of metals and alloys in mixed gas environments at elevated temperatures. Oxid. Met. 1980, 14, 363–413. [Google Scholar] [CrossRef]
  7. Eubanks, A.G.; Moore, D.G.; Pennington, W.A. Effect of Surface Roughness on the Oxidation Rate of Iron. J. Electrochem. Soc. 1962, 109, 382–389. [Google Scholar] [CrossRef]
  8. Barnes, D.J.; Wilson, J.E.; Stott, F.H.; Wood, G.C. The influence of oxide films on the friction and wear of Fe-5% Cr alloy in controlled environments. Wear 1977, 45, 161–176. [Google Scholar] [CrossRef]
  9. Fernández, L.A.; Houbart, Y. Hot rolling of high-silicon steel: Scale growth and its plastic deformation. In Proceedings of the Conference WMM, Cardiff, UK, 17–19 May 2014; pp. 55–74. [Google Scholar]
  10. Hinslex, C.F.; Male, A.T.; Rowe, G.W. Frictional properties of metal oxides at high temperatures. Wear 1968, 11, 233–238. [Google Scholar] [CrossRef]
  11. Kong, H.; Yoon, E.-S.; Kwon, K. Self-formation of protective oxide films at dry sliding mild steel surfaces under a medium vacuum. Wear 1995, 181–183, 325–333. [Google Scholar] [CrossRef]
  12. Krzyzanowski, M.; Beynon, J.H.; Farrugia, D.C.J. Oxide Scale Behavior in High Temperature Metal Processing; Wiley-VCH Verlag: Weinheim, Germany, 2010. [Google Scholar]
  13. Vergne, C.; Boher, C.; Gras, R.; Levaillant, C. Influence of oxides on friction in hot rolling: Experimental investigations and tribological modelling. Wear 2006, 260, 957–975. [Google Scholar] [CrossRef]
  14. Hensger, K.-E.; Klimanek, P.; Böhme, D. Beitrag zur metallkundlichen Interpretation von Warmfließkurven. Neue Hütte 1983, 28, 15–20. (In German) [Google Scholar]
  15. Graf, M.; Kawalla, R. Approaches for a Fast Analysis System for Hot Rolling Processes. Steel Res. Int. 2014, 85, 1364–1368. [Google Scholar] [CrossRef]
  16. Schacht, K.; Prahl, U.; Bleck, W. Material Models and their Capability for Process and Material Properties Design in Different Forming Processes. Mater. Sci. Forum 2016, 854, 174–182. [Google Scholar] [CrossRef] [Green Version]
  17. Papaefthymiou, S.; Goulas, C.; Castro Cerda, F.M.; Geerlofs, N.; Petrov, R. The Effect of Heating Rate on the Microstructure of a Soft-Annealed Medium Carbon Steel. Steel Res. Int. 2017, 88, 1700158. [Google Scholar] [CrossRef]
  18. Pohlandt, K. Werkstoffe und Werkstoffprüfung für die Kaltmassivumformung; Expert-Verlag: Renningen-Malmsheim, Germany, 2001. (In German) [Google Scholar]
  19. Ullmann, M.; Kawalla, R.; Schmidtchen, M. Dynamic Recrystallization Behaviour of Twin Roll Cast AZ31 Strips during Hot Deformation. Key Eng. Mater. 2014, 622–623, 569–574. [Google Scholar] [CrossRef]
  20. Korpala, G. Einfluss der chemischen Zusammensetzung auf die mechanischen Eigenschaften von unlegiertem bainitischen Stahl mit Restaustenit. Ph.D. Thesis, TU Bergakademie Freiberg, Freiberg, Germany, June 2017. [Google Scholar]
  21. Korpala, G.; Ullmann, M.; Graf, M.; Wester, H.; Bouguecha, A.; Awiszus, B.; Behrens, B.-A.; Kawalla, R. Modelling the Influence of Carbon Content on Material Behavior during Forging. AIP Conf. Proc. 2017, 1896. [Google Scholar] [CrossRef]
  22. Behrens, B.-A.; Chugreev, A.; Awiszus, B.; Graf, M.; Kawalla, R.; Ullmann, M.; Korpala, G.; Wester, H. Sensitivity Analysis of Oxide Scale Influence on General Carbon Steels during Hot Forging. Metals 2018, 8, 140. [Google Scholar] [CrossRef]
  23. Tominaga, J.; Wakimoto, K.; Mori, T.; Murakami, M.; Yoshimura, T. Manufacture of wire rods with good descaling property. Trans. Iron Steel Inst. Jpn. 1982, 22, 646–656. [Google Scholar] [CrossRef]
  24. Sun, W. A Study on the Characteristics of Oxide Scale in Hot Rolling of Steel. Ph.D. Thesis, University of Wollongong, Wollongong, Australia, 2005. [Google Scholar]
  25. Krzyzanowski, M.; Beyon, J.H. Oxide Behaviour in hot rolling. In Metal Forming Science and Practice; Lenard, J., Ed.; Elsevier: Amsterdam, The Netherlands, 2002; pp. 259–295. [Google Scholar]
  26. Frolish, M.F.; Krzyzanowski, M.; Beyon, J.H. Oxide scale behaviour on aluminium and steel under hot working conditions. J. Mater. Process. Technol. 2006, 177, 36–40. [Google Scholar] [CrossRef]
Figure 1. Information flow in the user-defined subroutine.
Metals 08 00996 g001
Figure 2. Comparison between simulation and experiment and the sensitivity analysis of the ring-compression test for determining the influence of (a) temperature and scale thickness for C15 (higher forming temperature increase oxide thickness), (b) oxide thickness of C15 at different temperatures (oxide scale correlate with friction and radiation), and (c) carbon content at 1000 °C for C15 and C60 on forming forces.
Metals 08 00996 g002
Figure 3. Simulation of the oxide behavior during die forging.
Metals 08 00996 g003
Figure 4. Comparison of simulated and measured microstructure evolution (after quenching) for different forming strokes/gravure fillings. (a) 66% stroke (80 mm ram movement, 50 mm height reduction); (b) 80% stroke(92 mm ram movement, 62 mm height reduction); (c) 100% stroke (106 mm ram movement, 76 mm height reduction).
Metals 08 00996 g004
Table 1. Real chemical composition as weight fraction of the test melts via optical emission spectrometry (rest: Fe).
SteelCSiMnPSCrMoNiCuAl
C150.1600.2100.4200.001<0.0010.1000.0450.0870.1080.017
C450.4900.2000.4200.0040.0010.1000.0340.0810.0960.021
C600.6300.2000.420<0.001<0.0010.1000.0350.0760.1000.017
Table 2. Model coefficients of HSa function.
A a m C 1 m a m a 1 m a 2 m a φ m C 2 m a 3
32750.036620.036420.002700.41618−0.04210−0.080040.07959
Table 3. Model coefficients of HSb function.
A b m C 3 m b 1 m b 2 m b 3
894−0.013670.002760.002360.17777
Table 4. Model coefficients of δHS function.
w 1 w 2 w 4 w γ φ k
1.835010.000150.133250.177760.15951
Table 5. Model coefficients for dynamic recrystallization.
Steel n d d 1 d 2 d 3 d 4 d 5 d 6 Q D R X
C15 2 0.002735 0.017 0.265 0.00017 0.02117 0.256 245000
C45 2 0.002796 0.017 0.265 0.00018 0.02117 0.256 239500
C60 2 0.002867 0.017 0.265 0.00019 0.02117 0.256 233000
Table 6. Model coefficients for metadynamic recrystallization.
Steelnmm1m2QMDRX
C151.155.55 × 10−7−0.84147700
C451.295.76 × 10−7−0.81141400
C601.345.87 × 10−7−0.78135900
Table 7. Model coefficients for static recrystallization.
Steel n s s 1 s 2 s 3 Q S R X
C15 0.48 3.16 × 10⁻¹⁴ 4.5 0.53 231000
C45 0.49 7.15 × 10⁻¹⁵ 4.2 0.50 245000
C60 0.51 1.76 × 10⁻¹⁵ 3.9 0.47 258000
Table 8. Model coefficients for the Arrhenius approach for investigated alloys.
Steelkp0 [µm²/s]Qp [J/mol]kl0 [µm/s]Ql [J/mol]
C1587946121325399.855 × 10143444340.966
C4552180831290899.852 × 10143509880.918
C606773431074885.600 × 10143224810.792
Table 9. Comparison of measured and simulated geometries of the ring-compression samples under different conditions.
Initial State for FEMSteel GradExperimentSimulationDeviation
Inner ø
in mm
Height in
mm
Inner ø in
mm
Height in
mm
Inner ø in
%
Height in
%
Oxidation
temperature: 1000 °C
Oxide thickness: 50 µm
C153.701.613.911.635.11.2
C453.751.673.861.702.91.8
C603.801.683.771.66−0.8−1.2
Oxidation
temperature: 900 °C
Oxide thickness: 30 µm
C153.651.593.741.592.51.9
C453.711.824.001.827.8−1.1
C603.801.673.811.680.30.6

