The Effect of Different Arc Currents on the Microstructure and Tribological Behaviors of Cu Particle Composite Coating Synthesized on GCr15 Steel by PTA Surface Alloying

Abstract
:1. Introduction
2. Experimental Procedures
2.1. Material Preparation
2.2. Microstructure and Microhardness Measurements
2.3. Wear Test
3. Results and Discussion
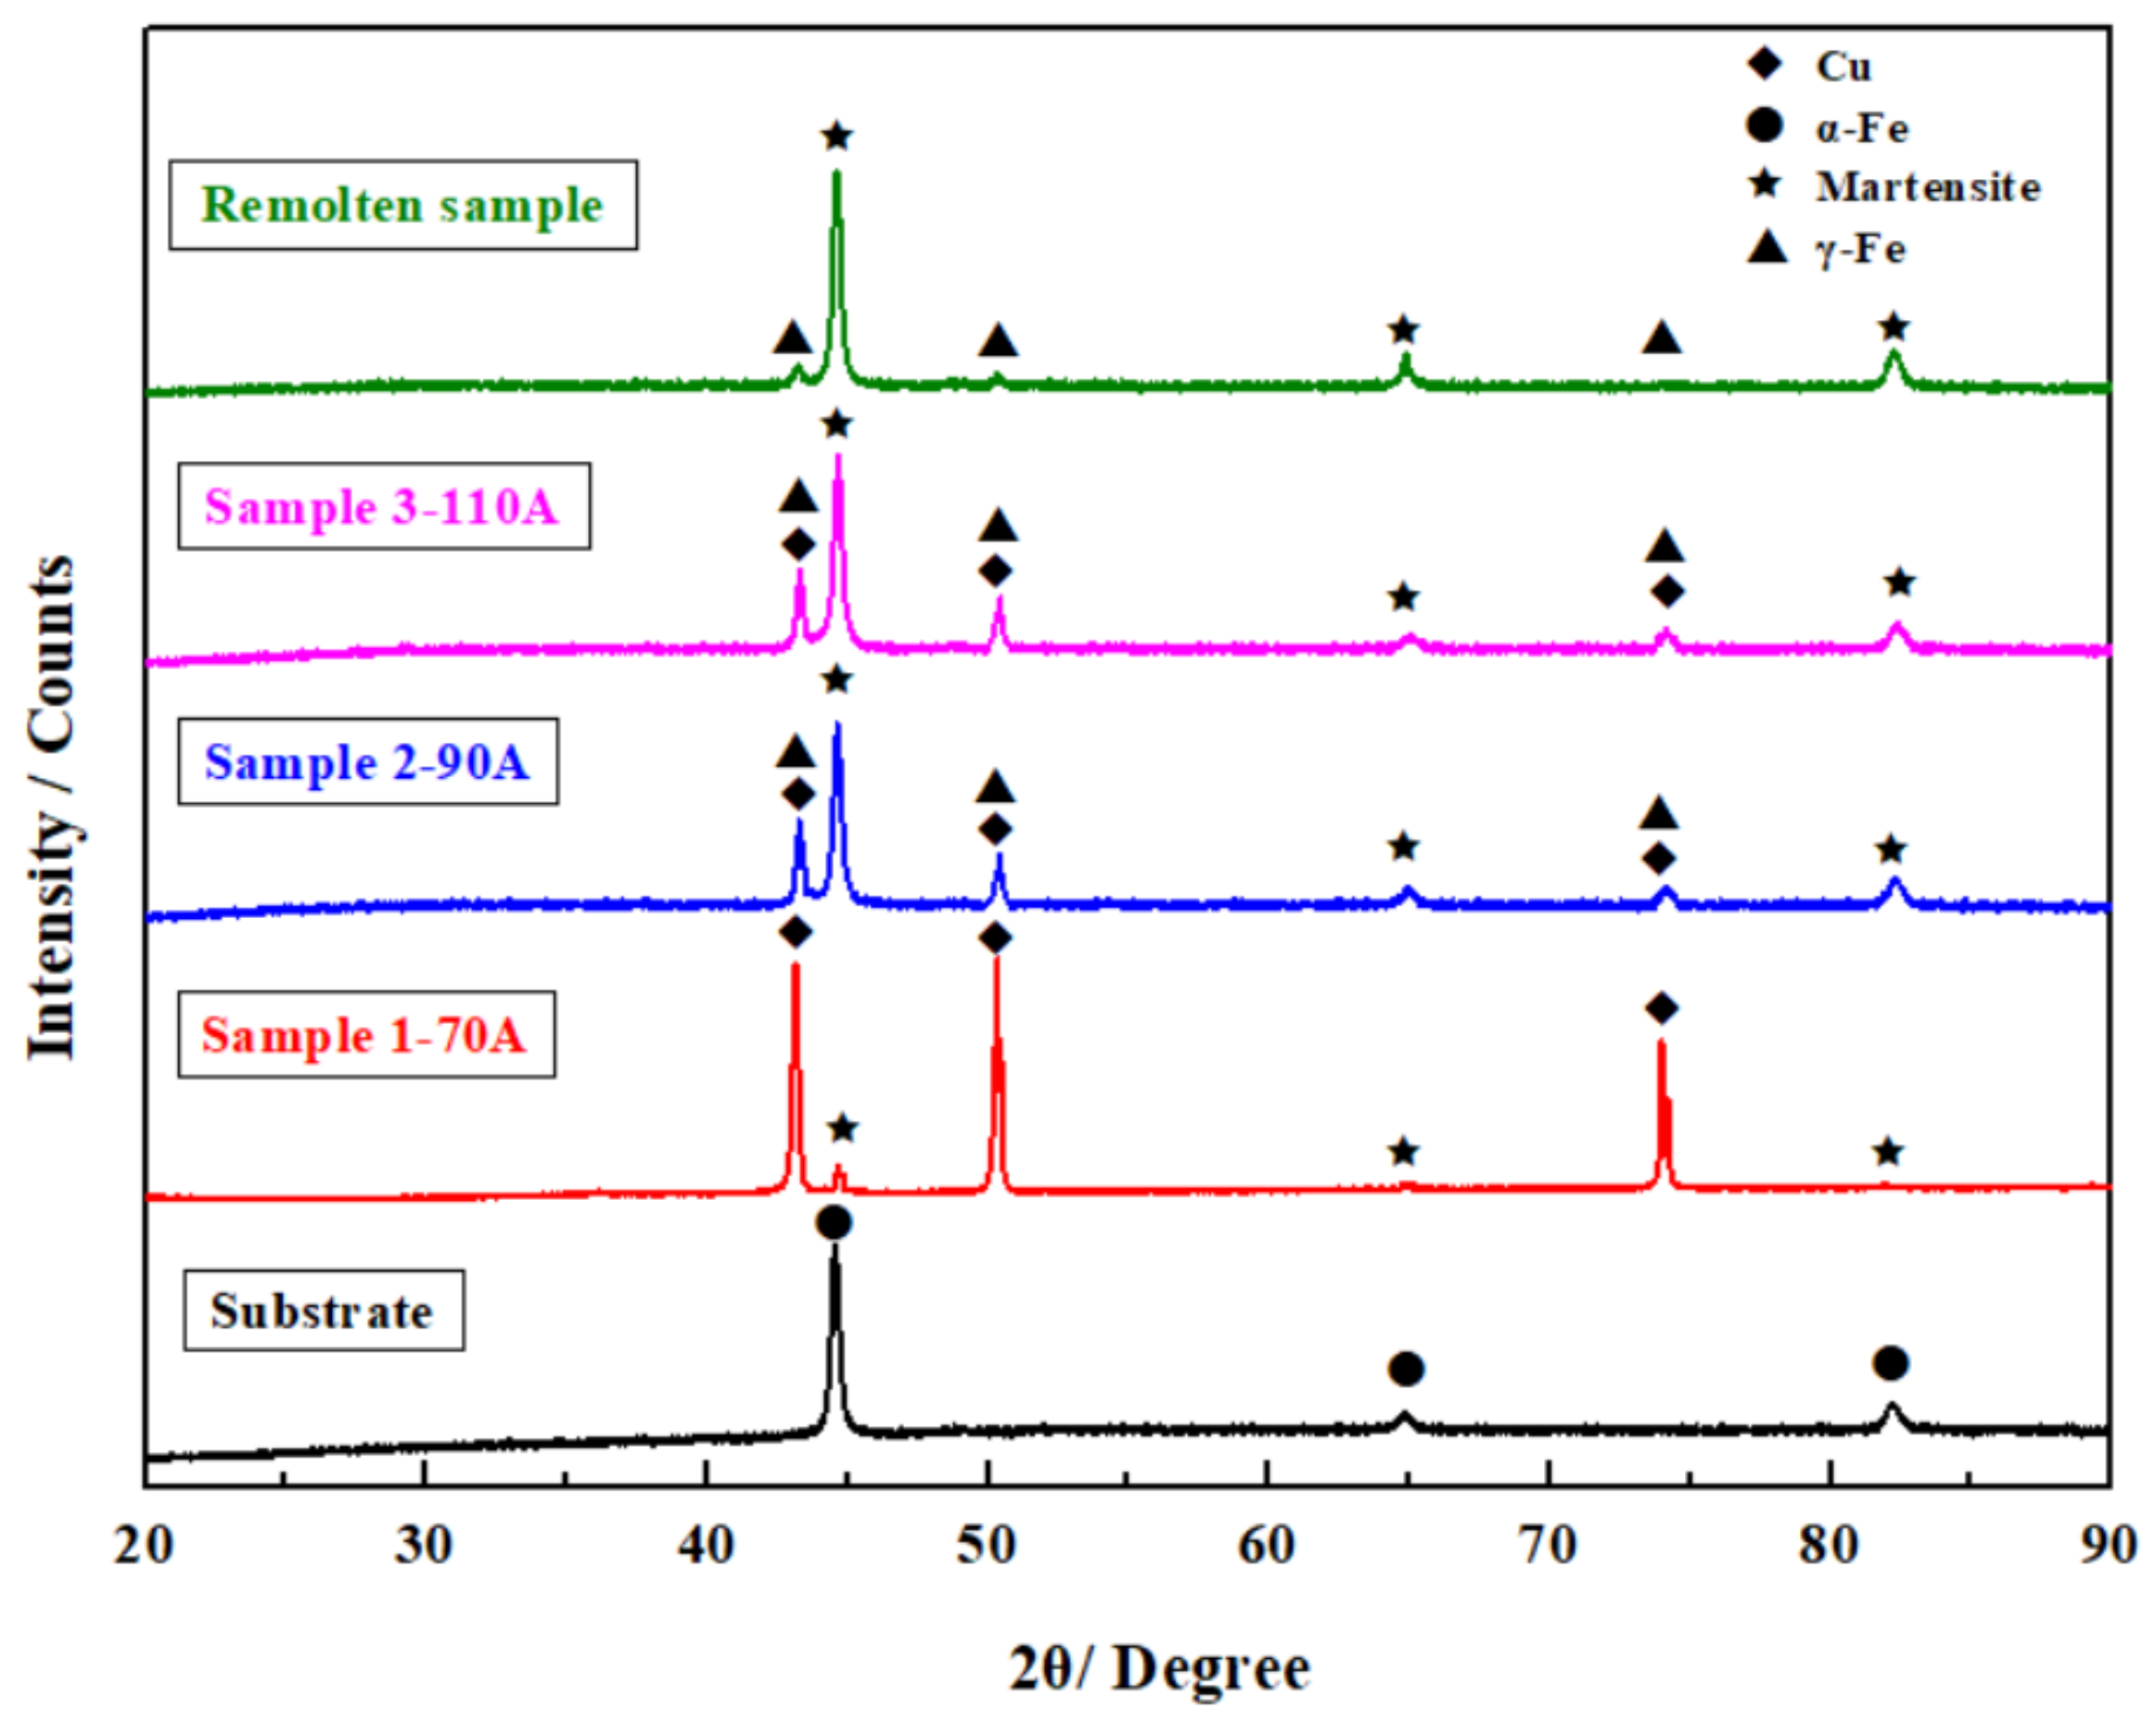
3.1. Microstructure
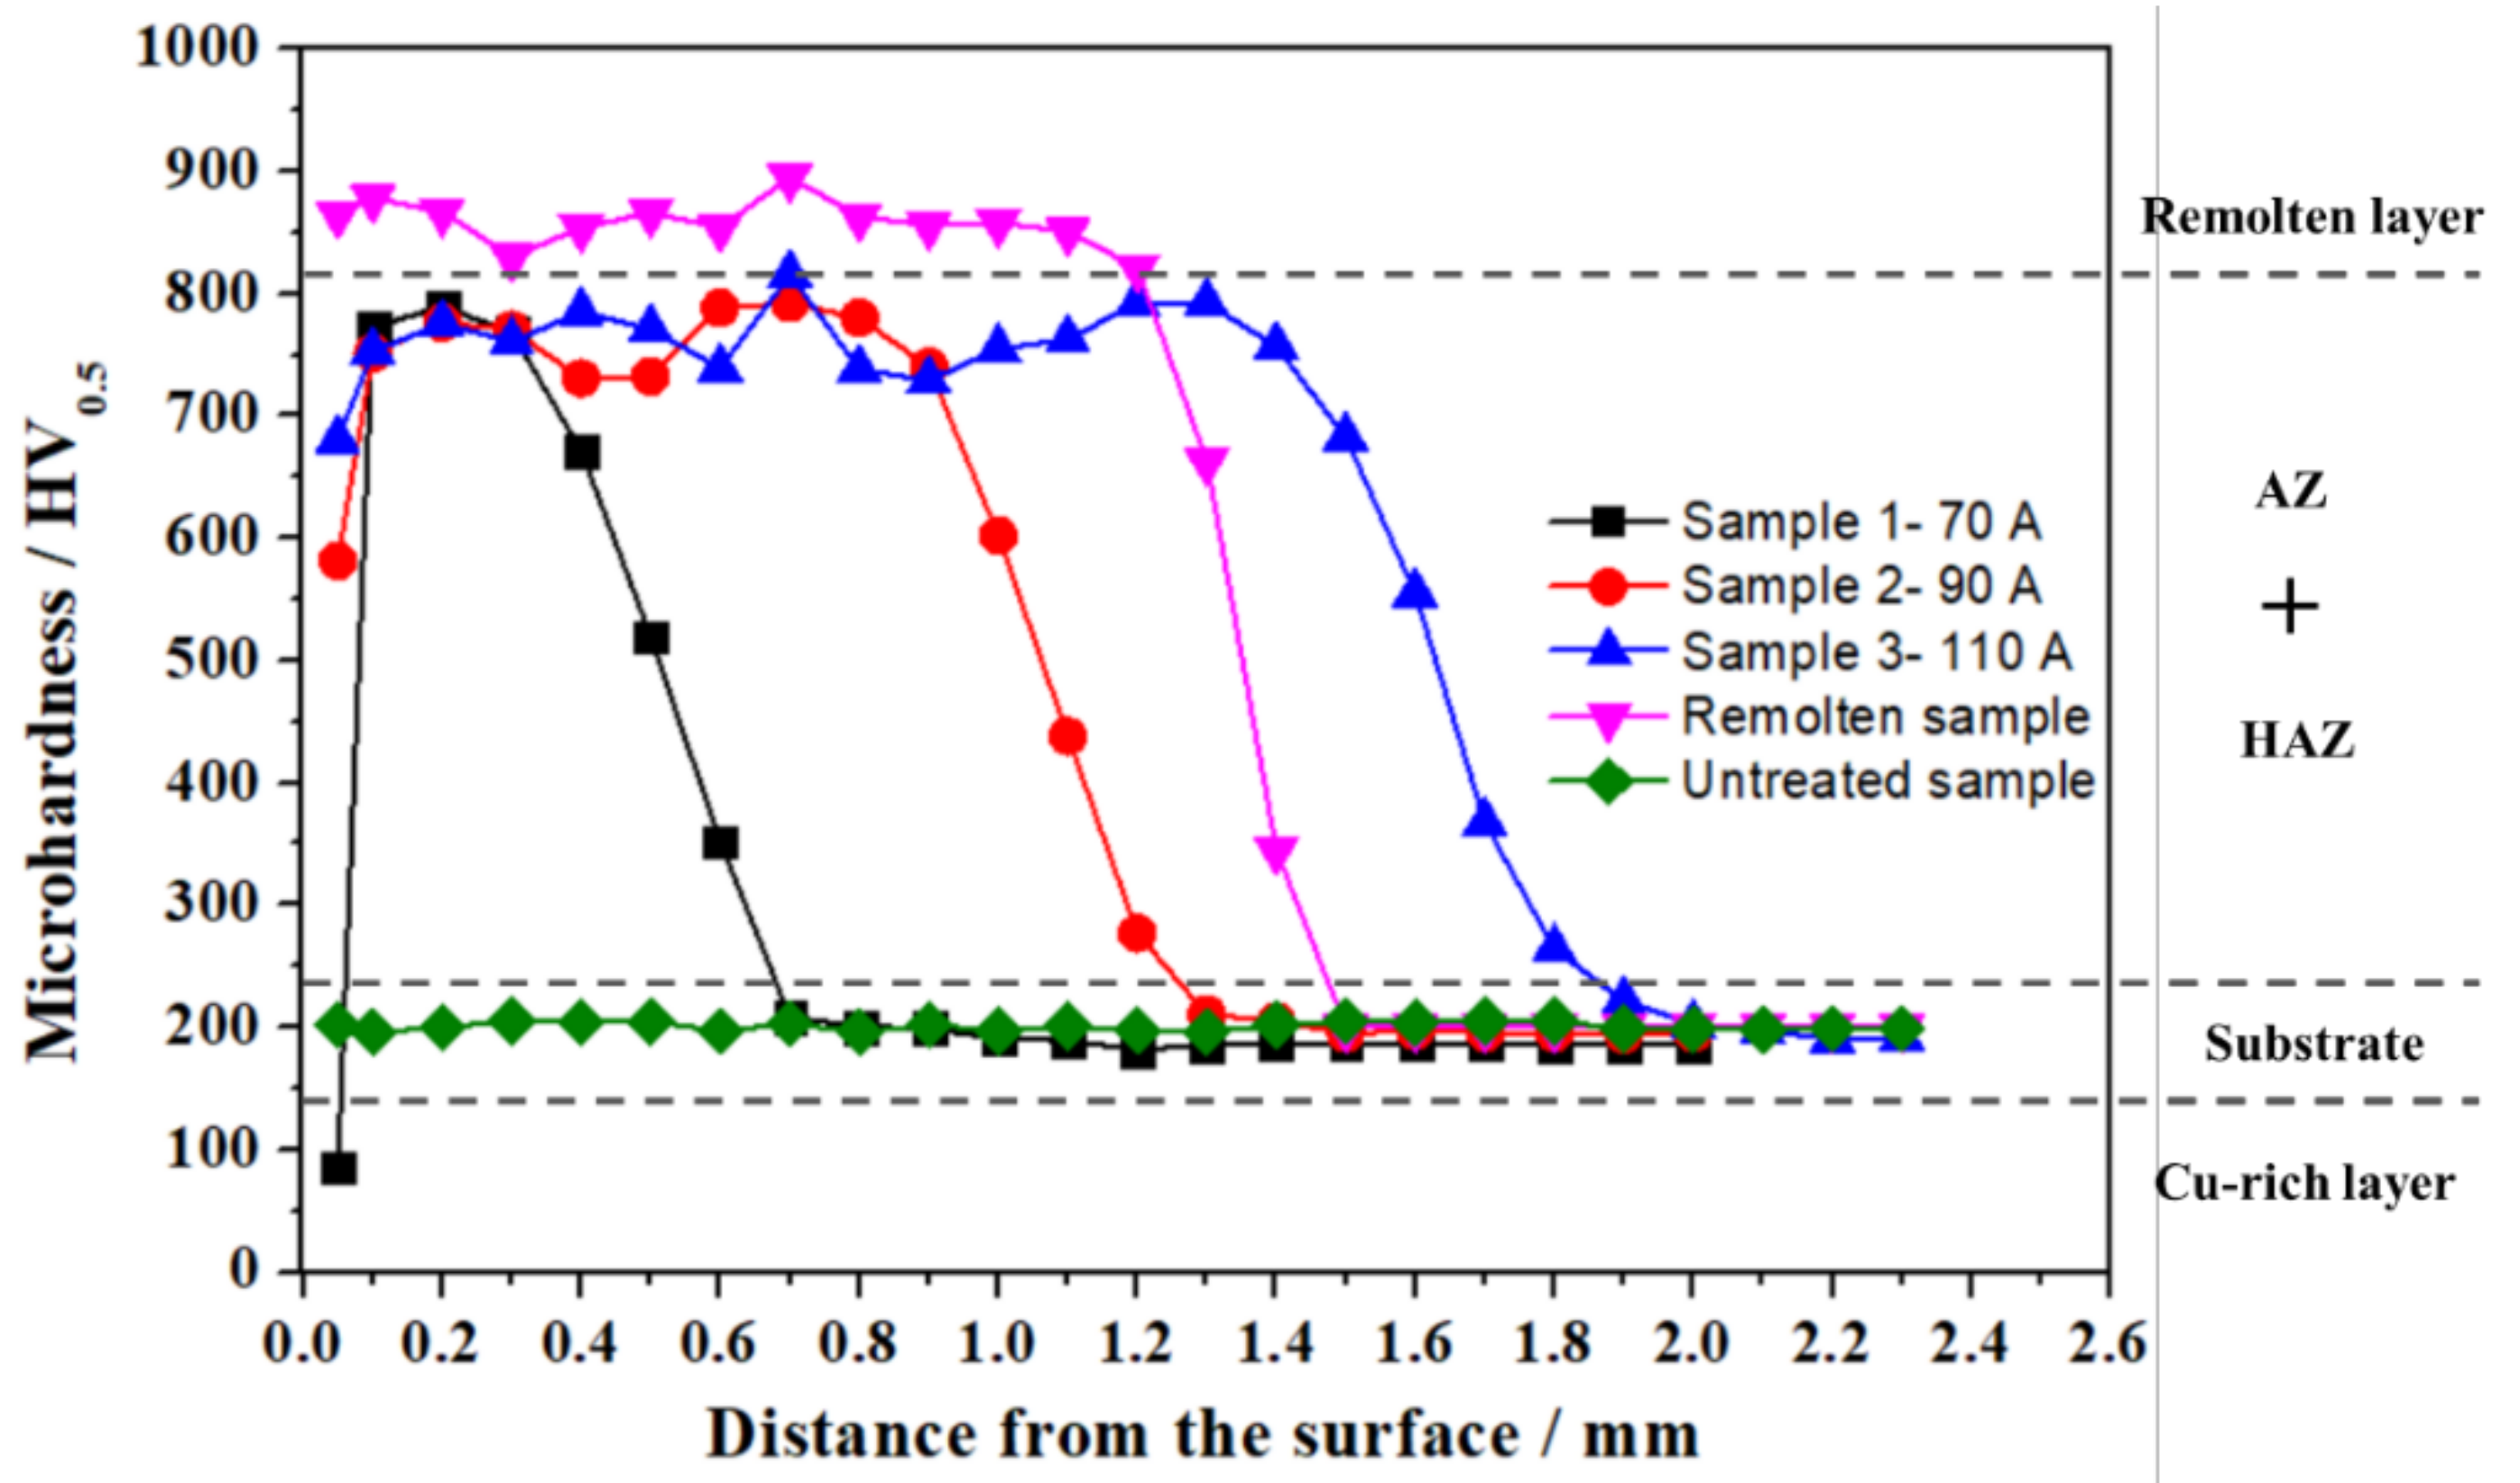
3.2. Microhardness
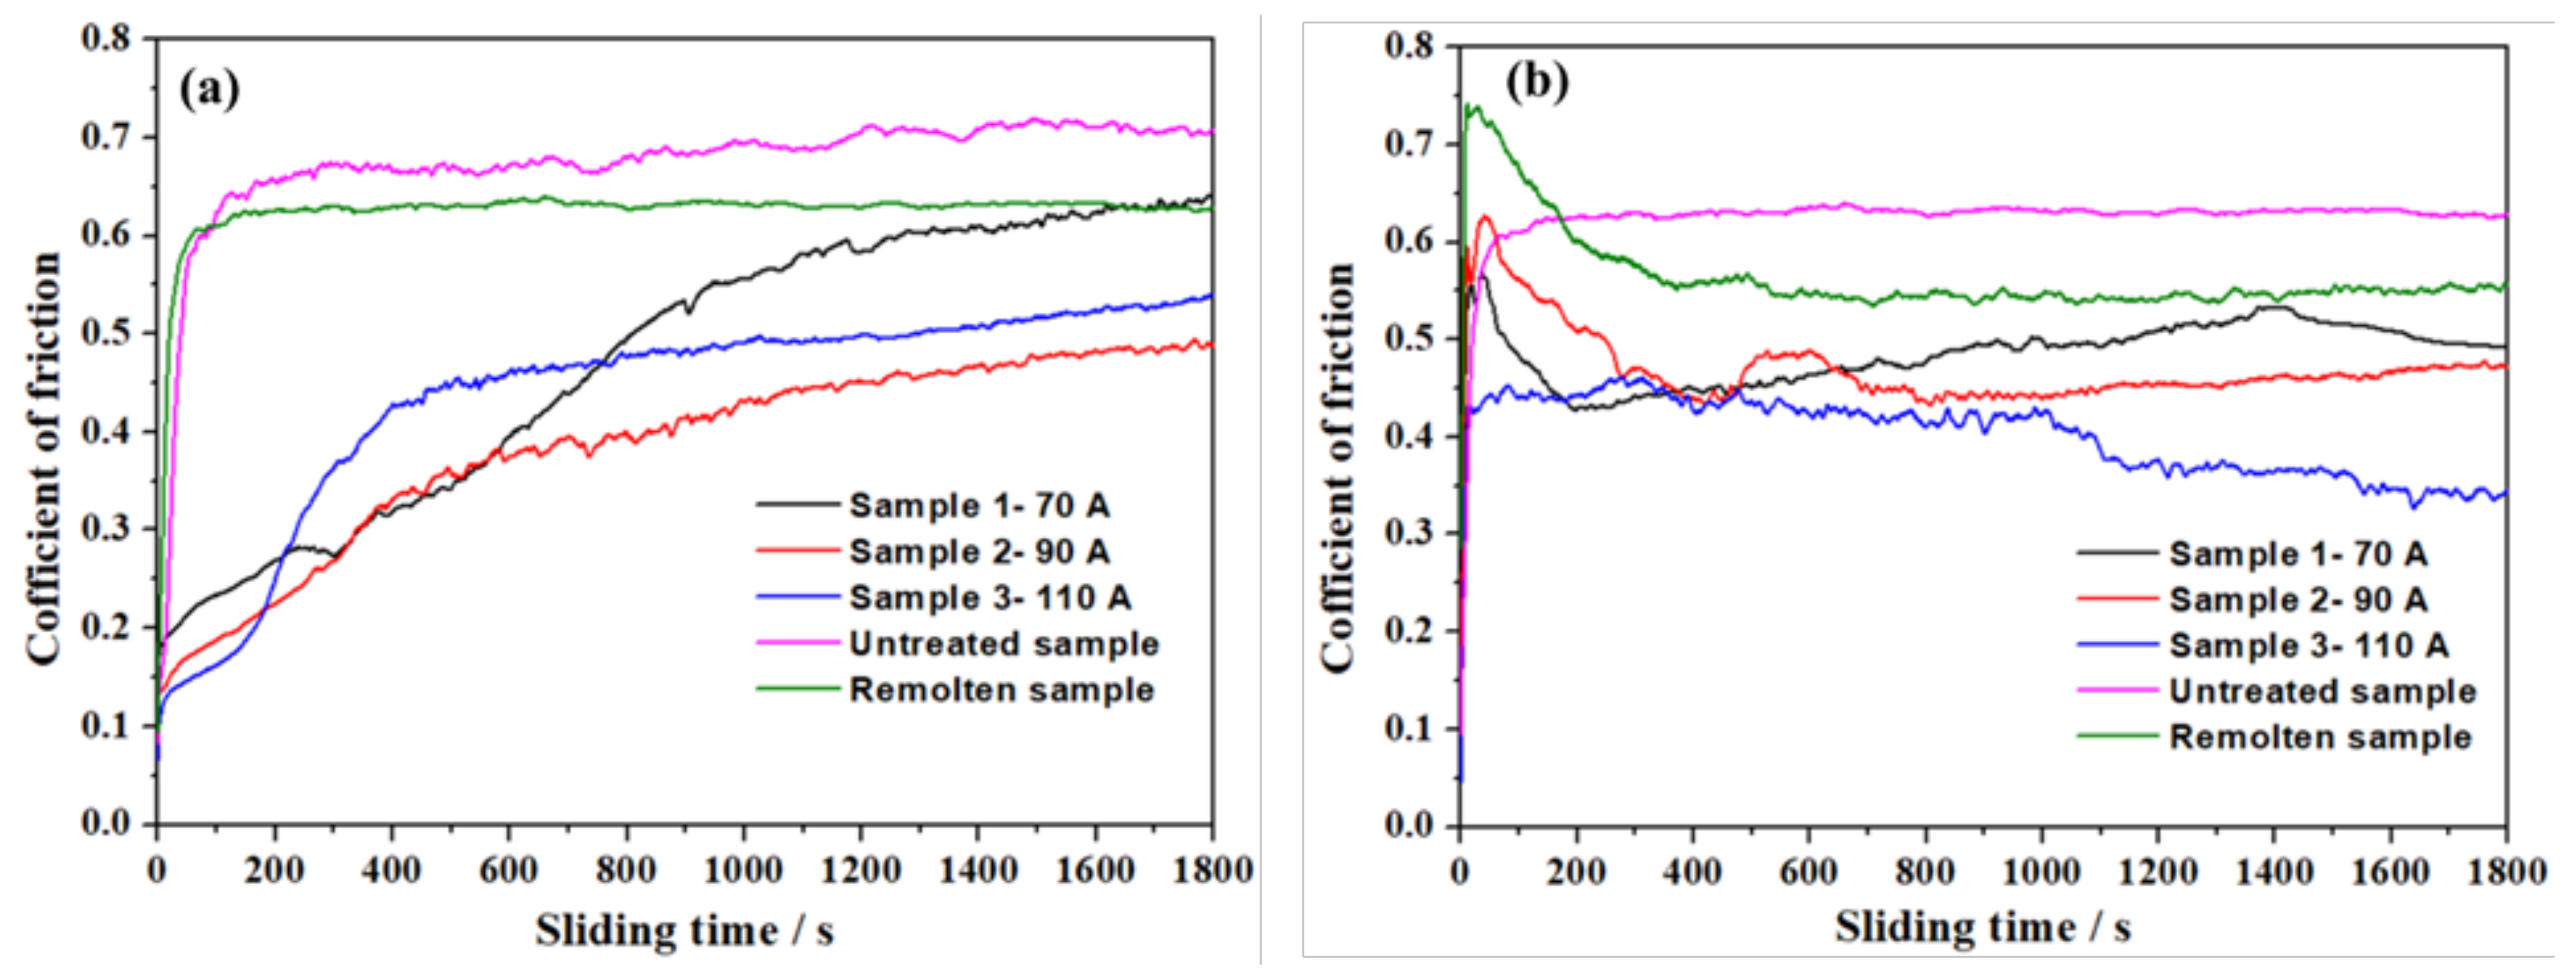
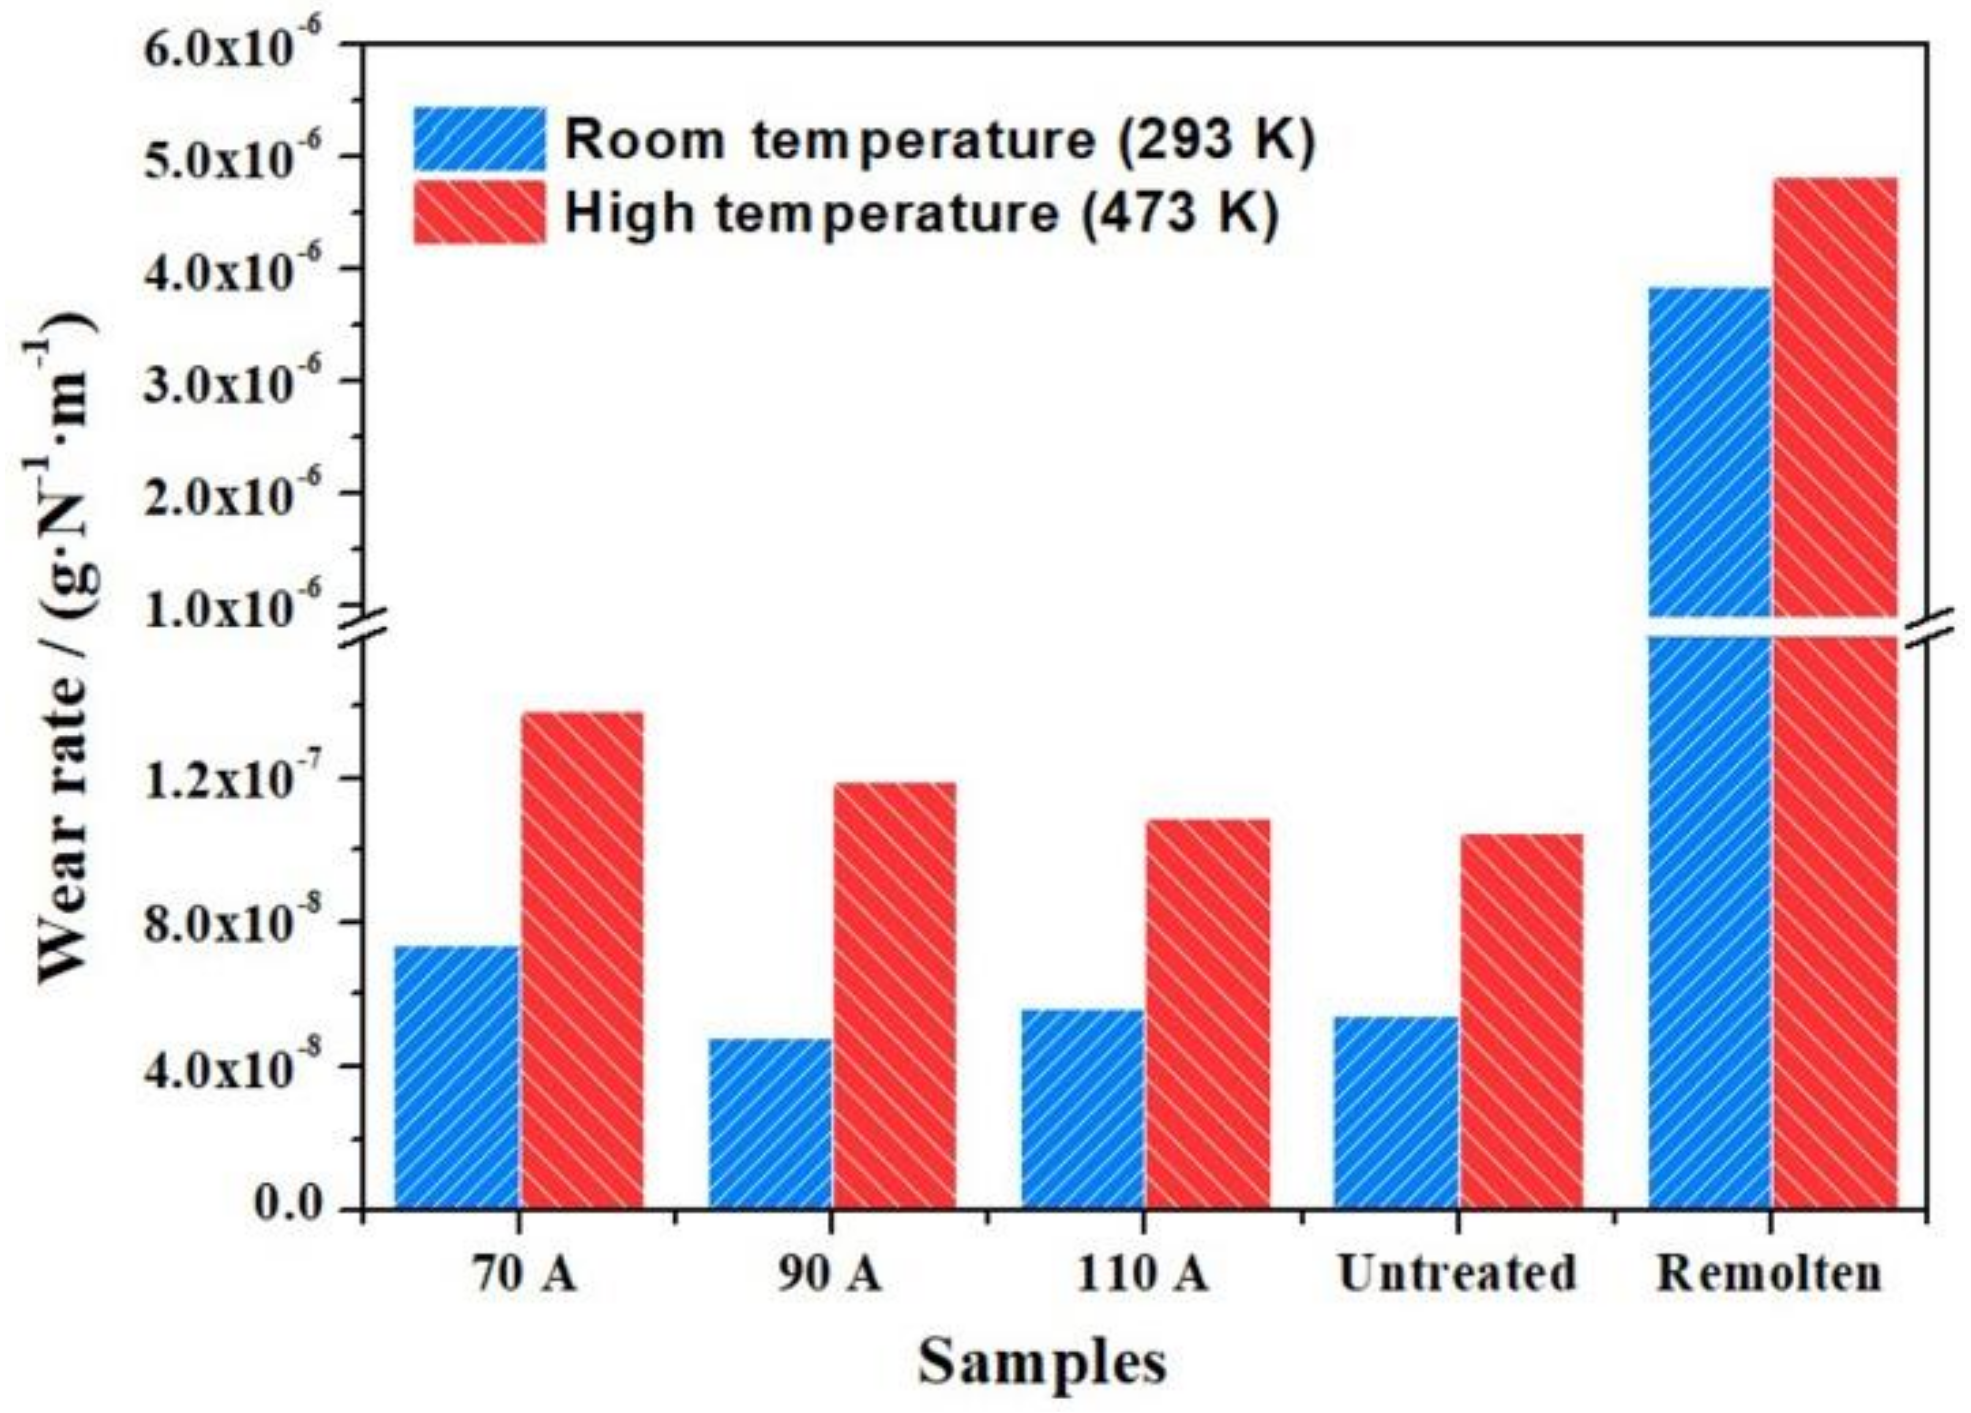
3.3. Friction Coefficient and Wear Rates
3.4. Worn Surface Analysis and Wear Mechanisms
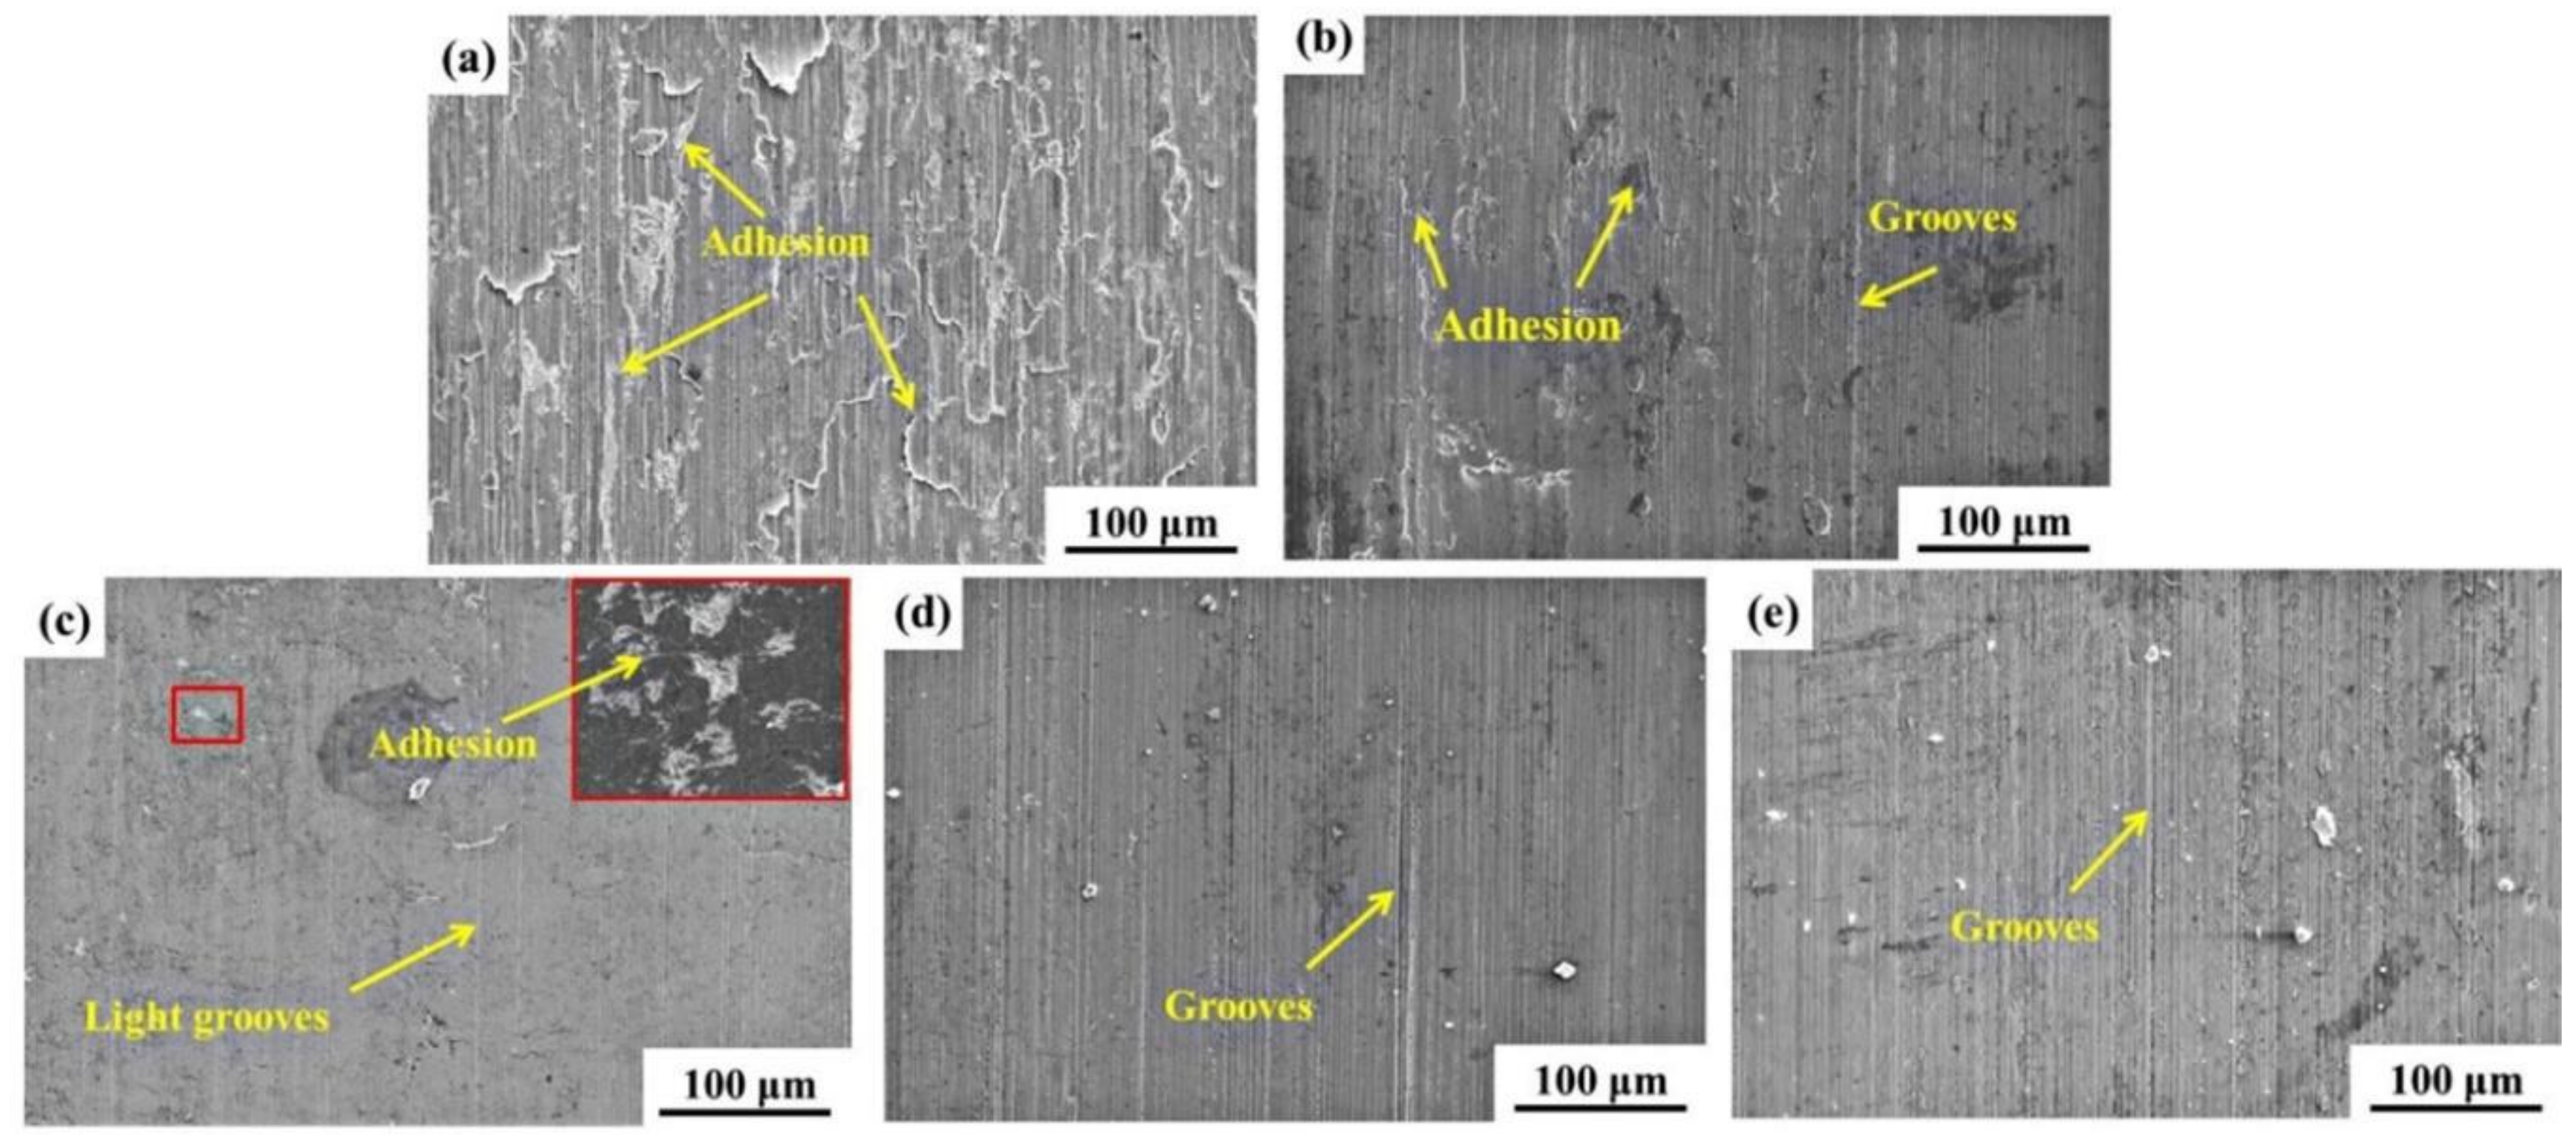
3.4.1. Worn Surfaces at Room Temperature
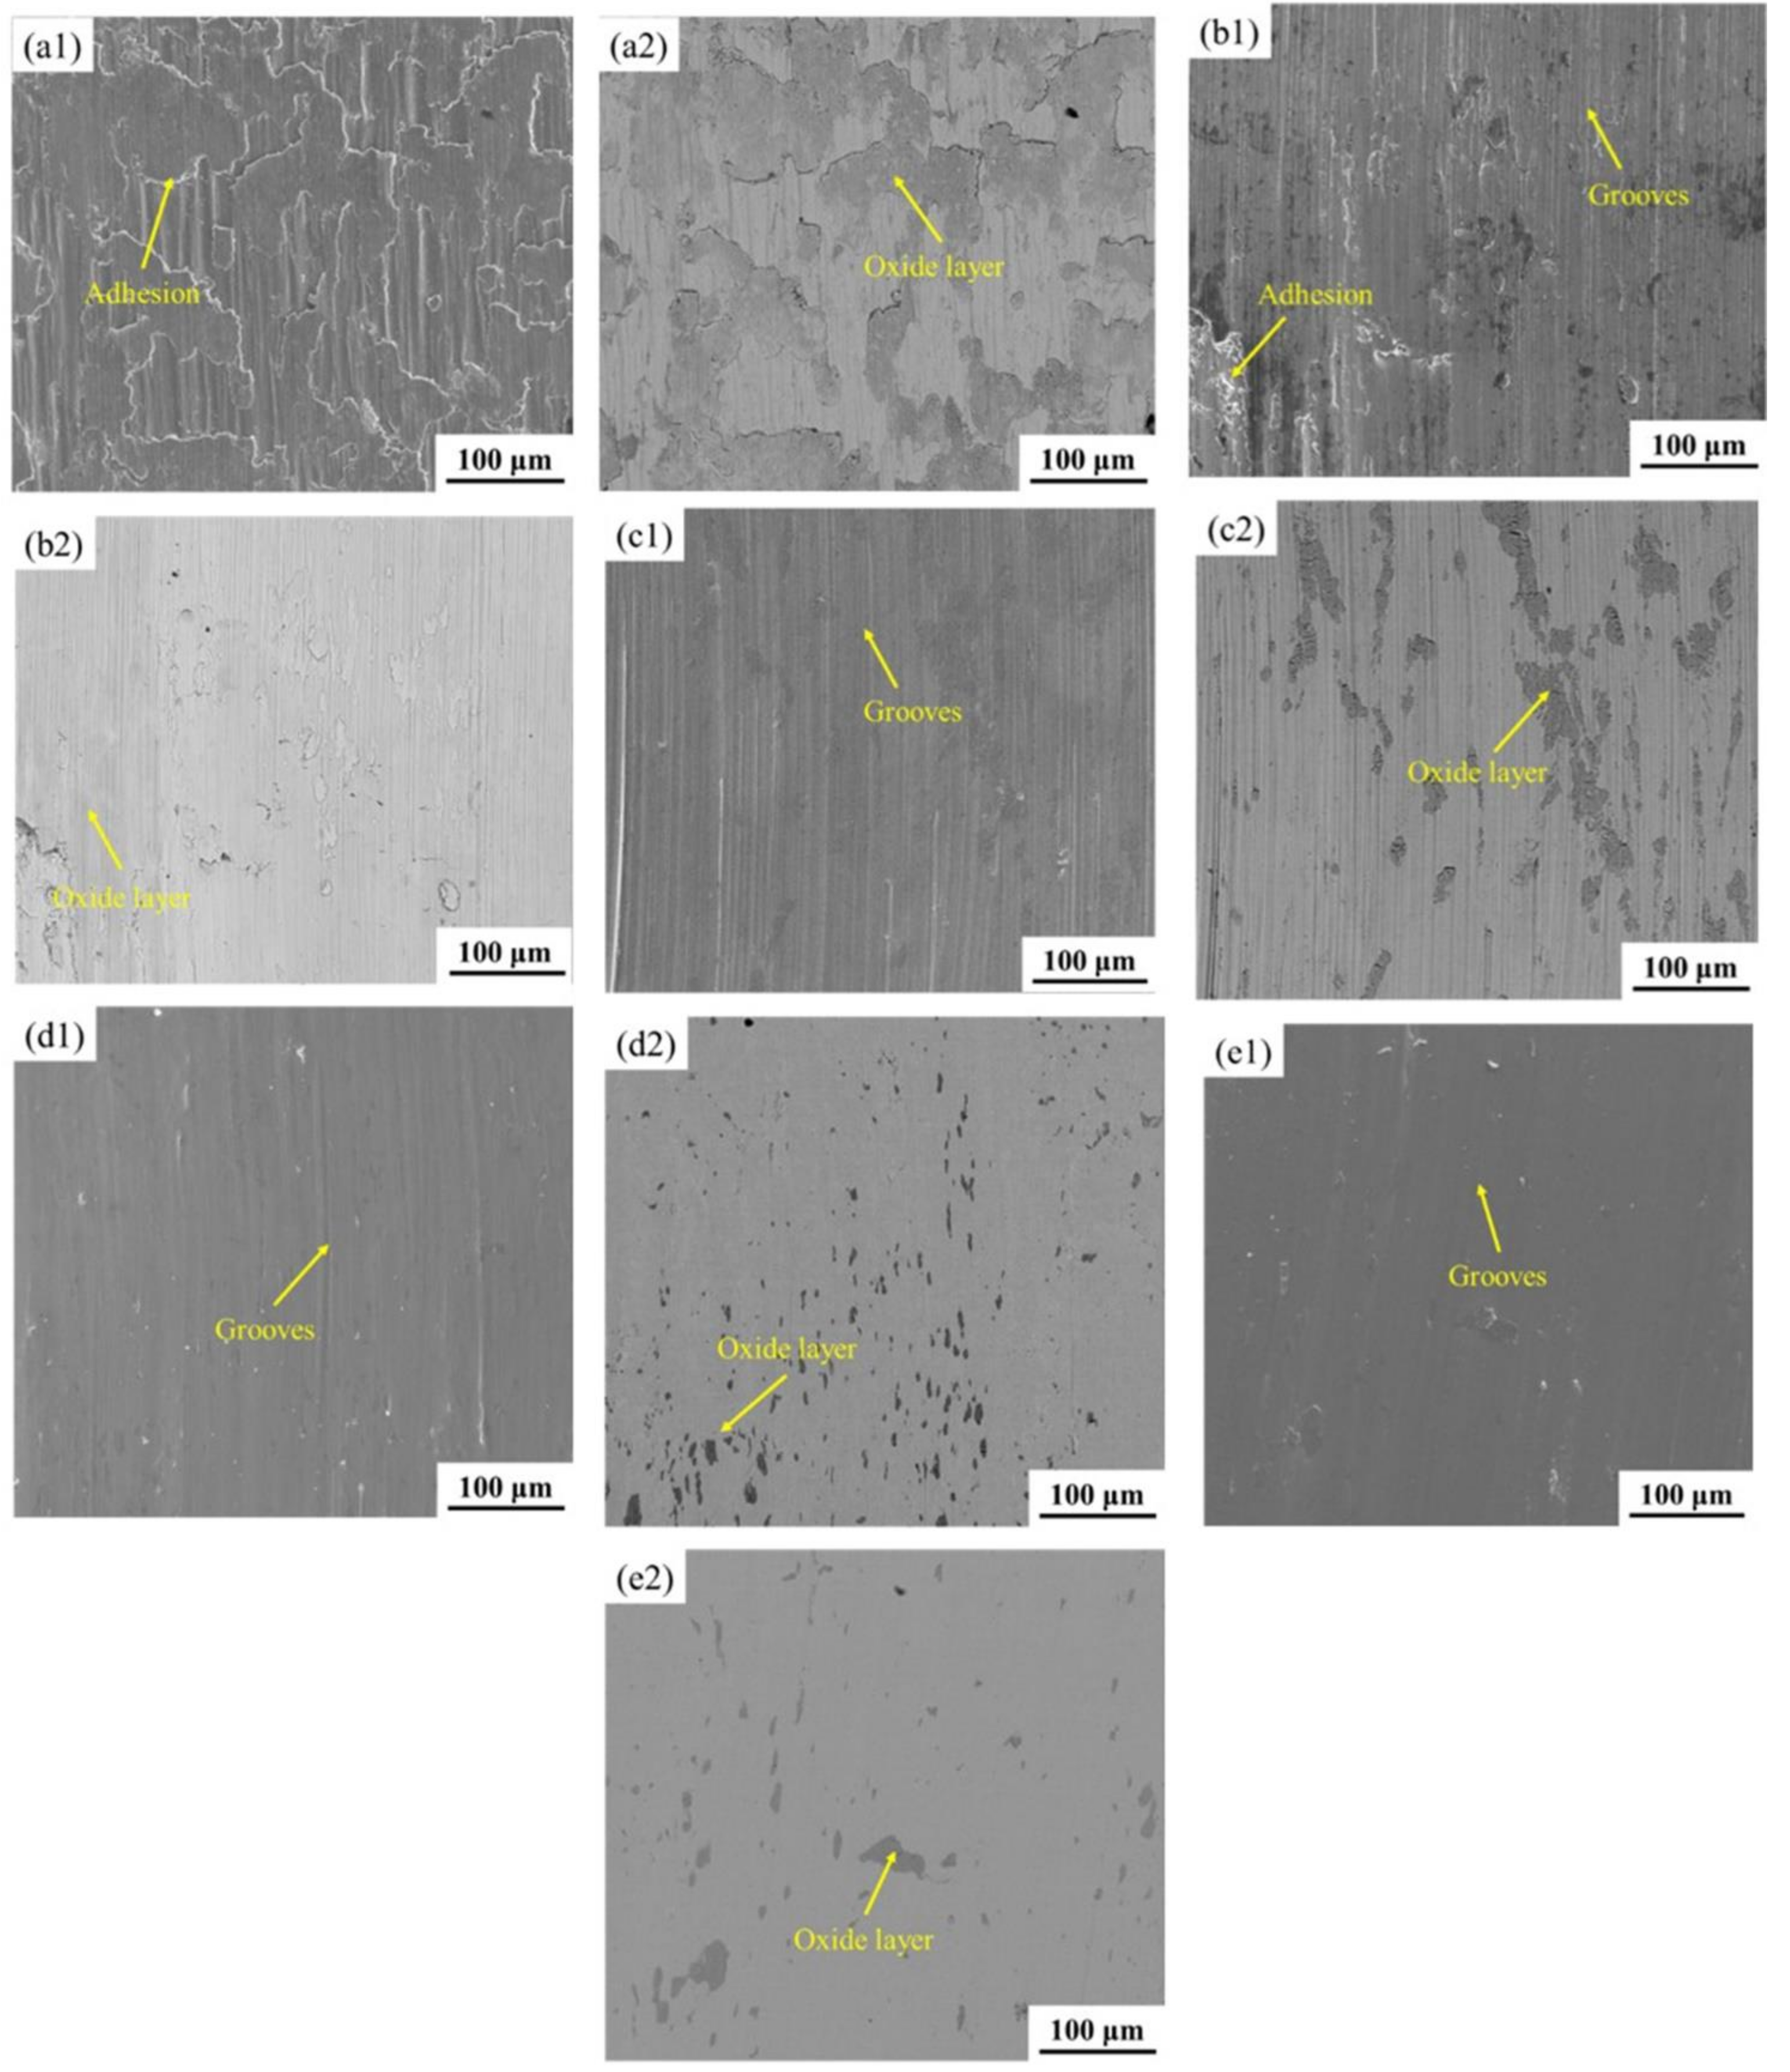
3.4.2. Worn Surfaces at High Temperature
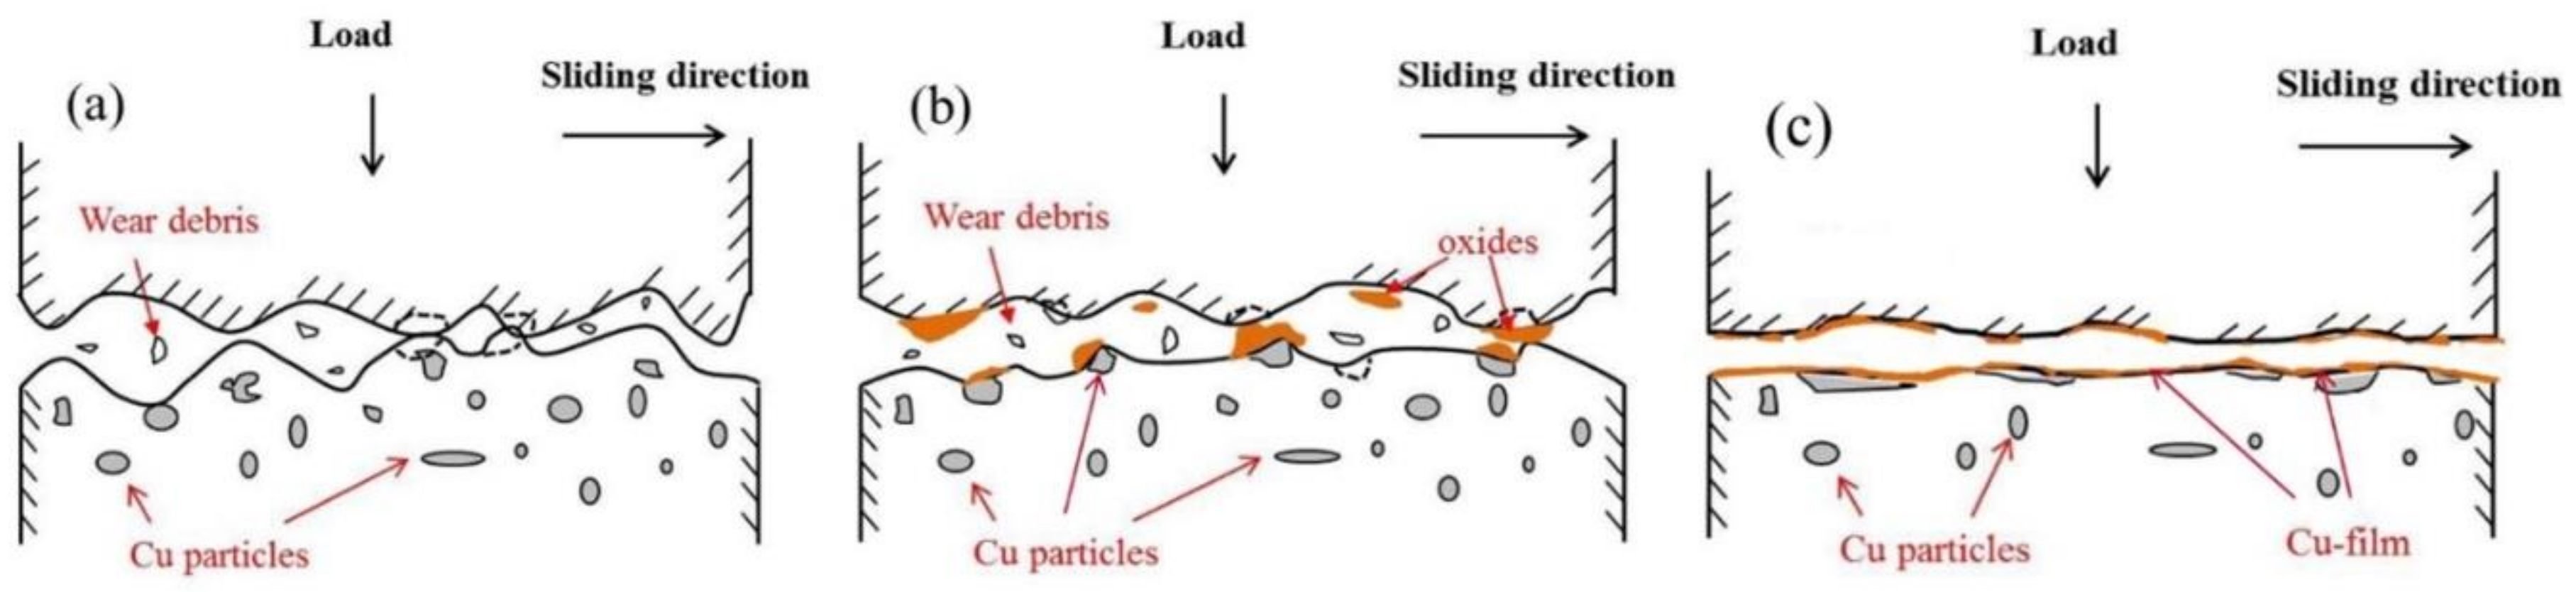
3.4.3. Wear Mechanism
4. Conclusions
- (1)
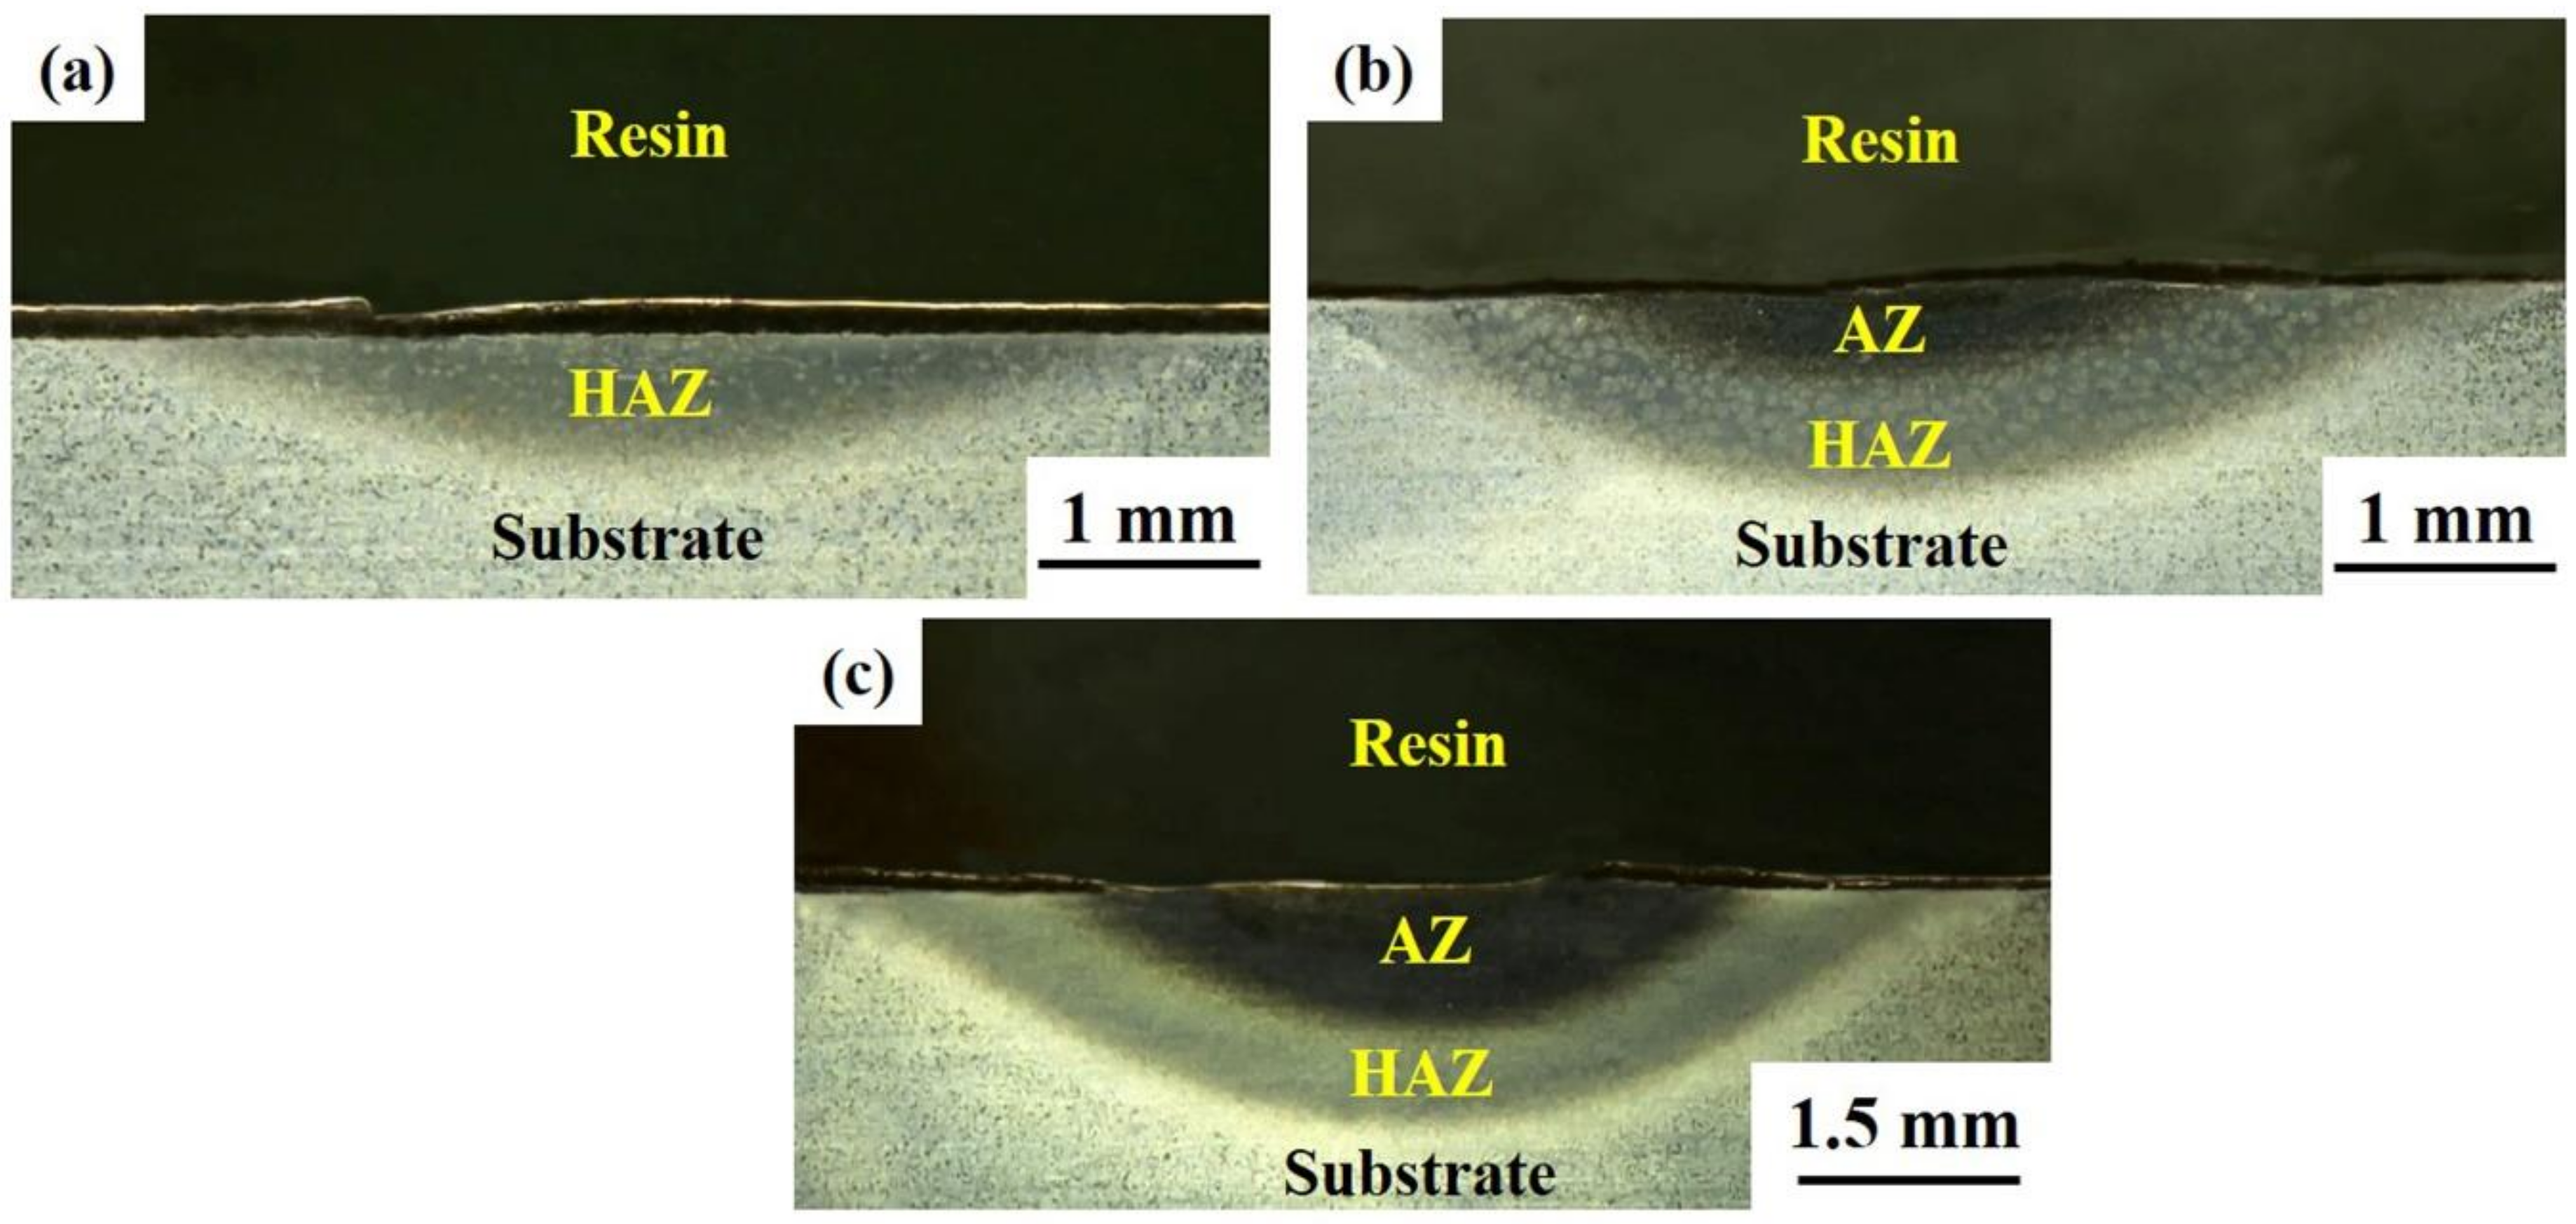
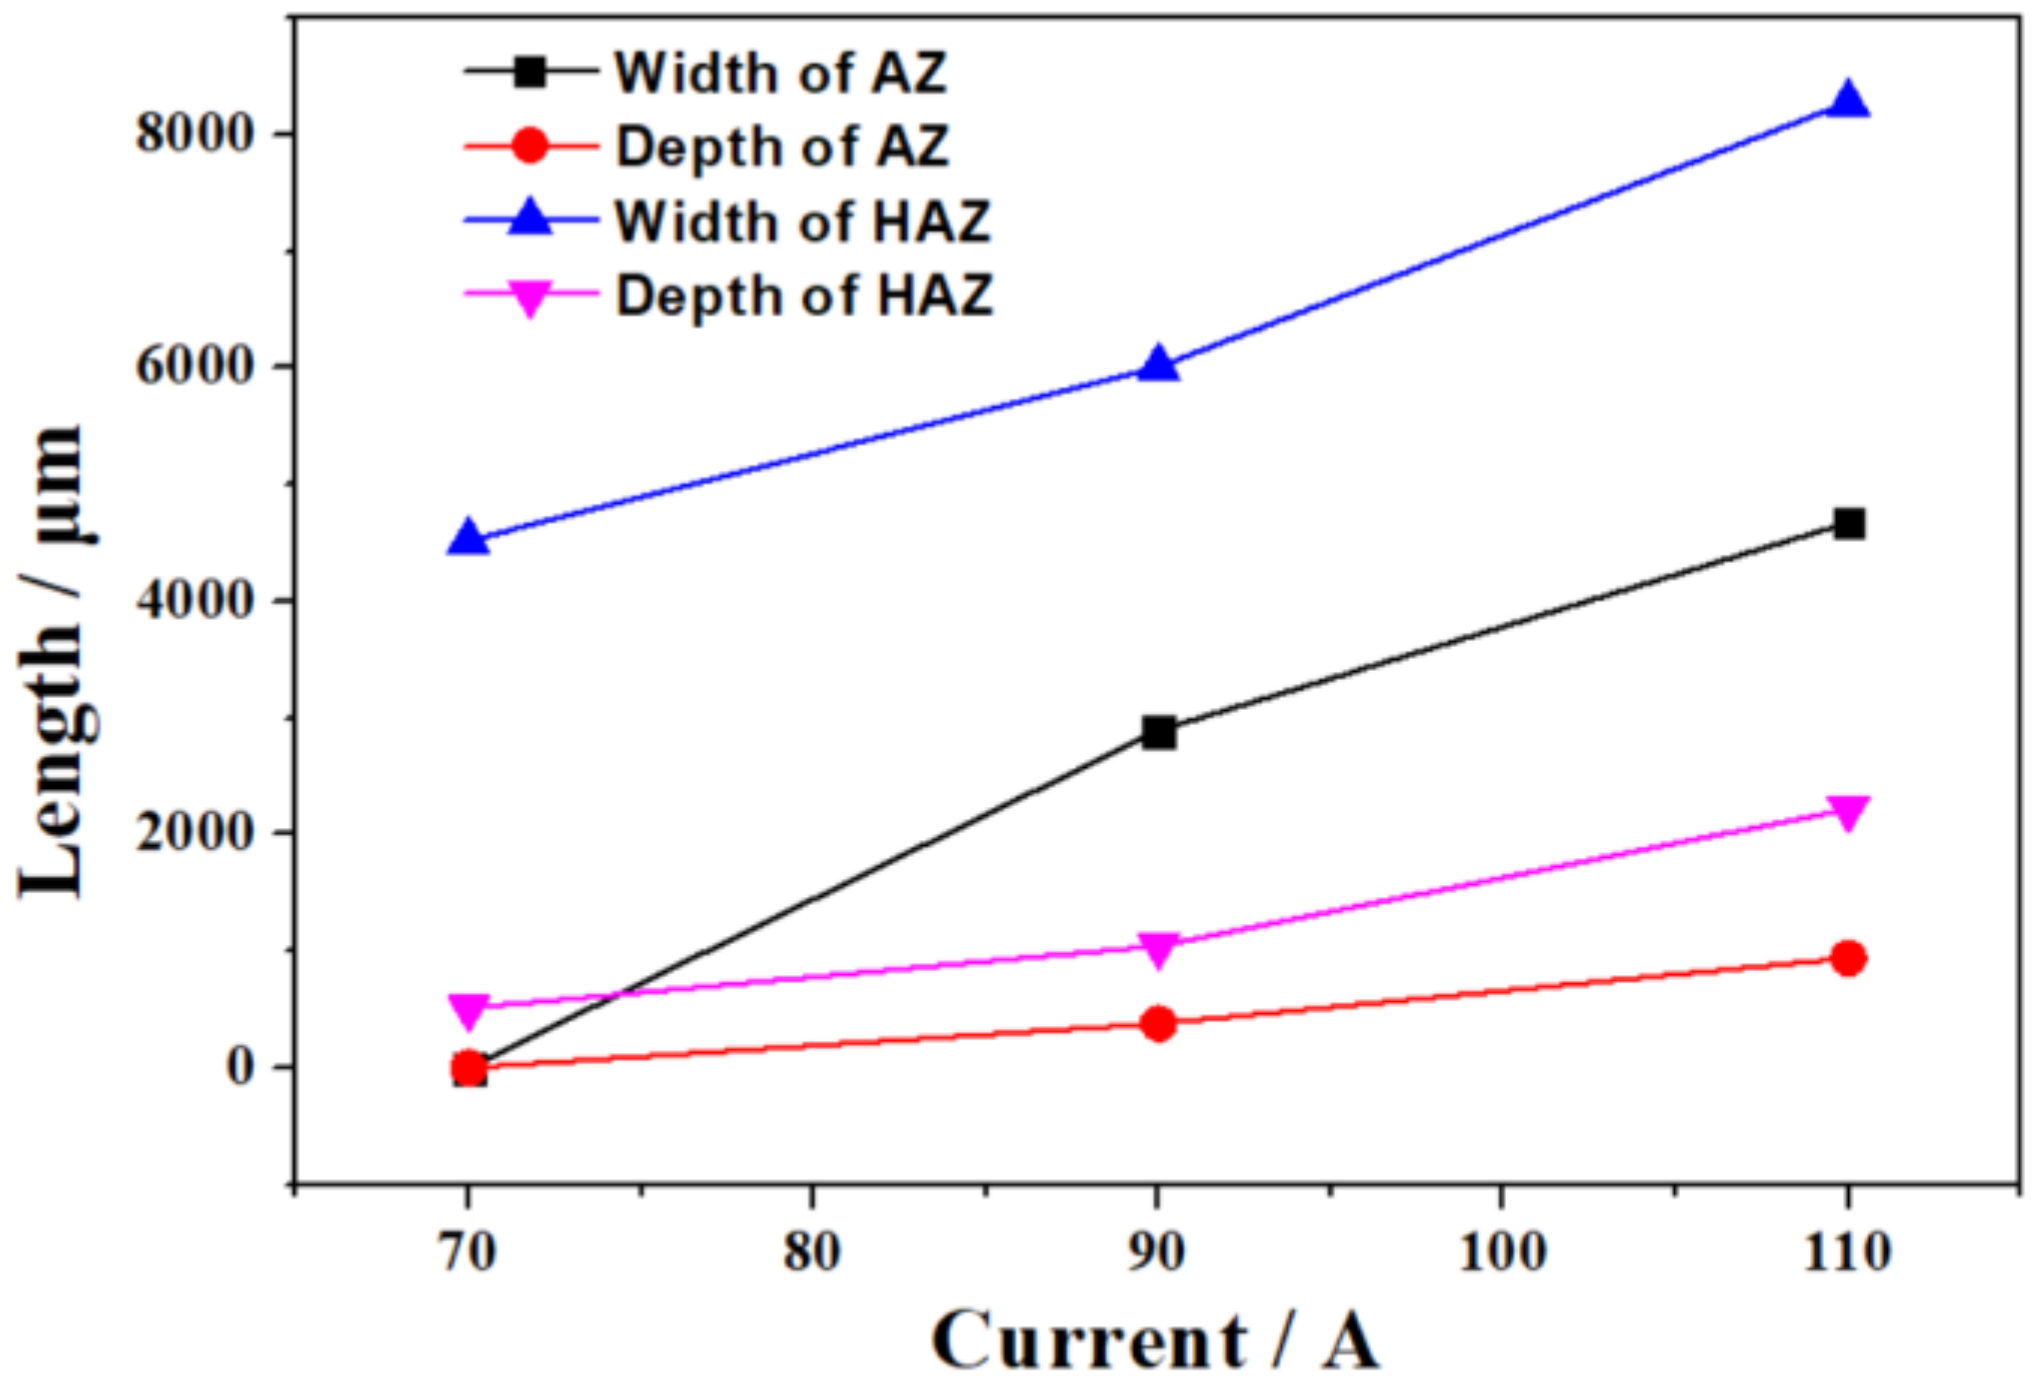
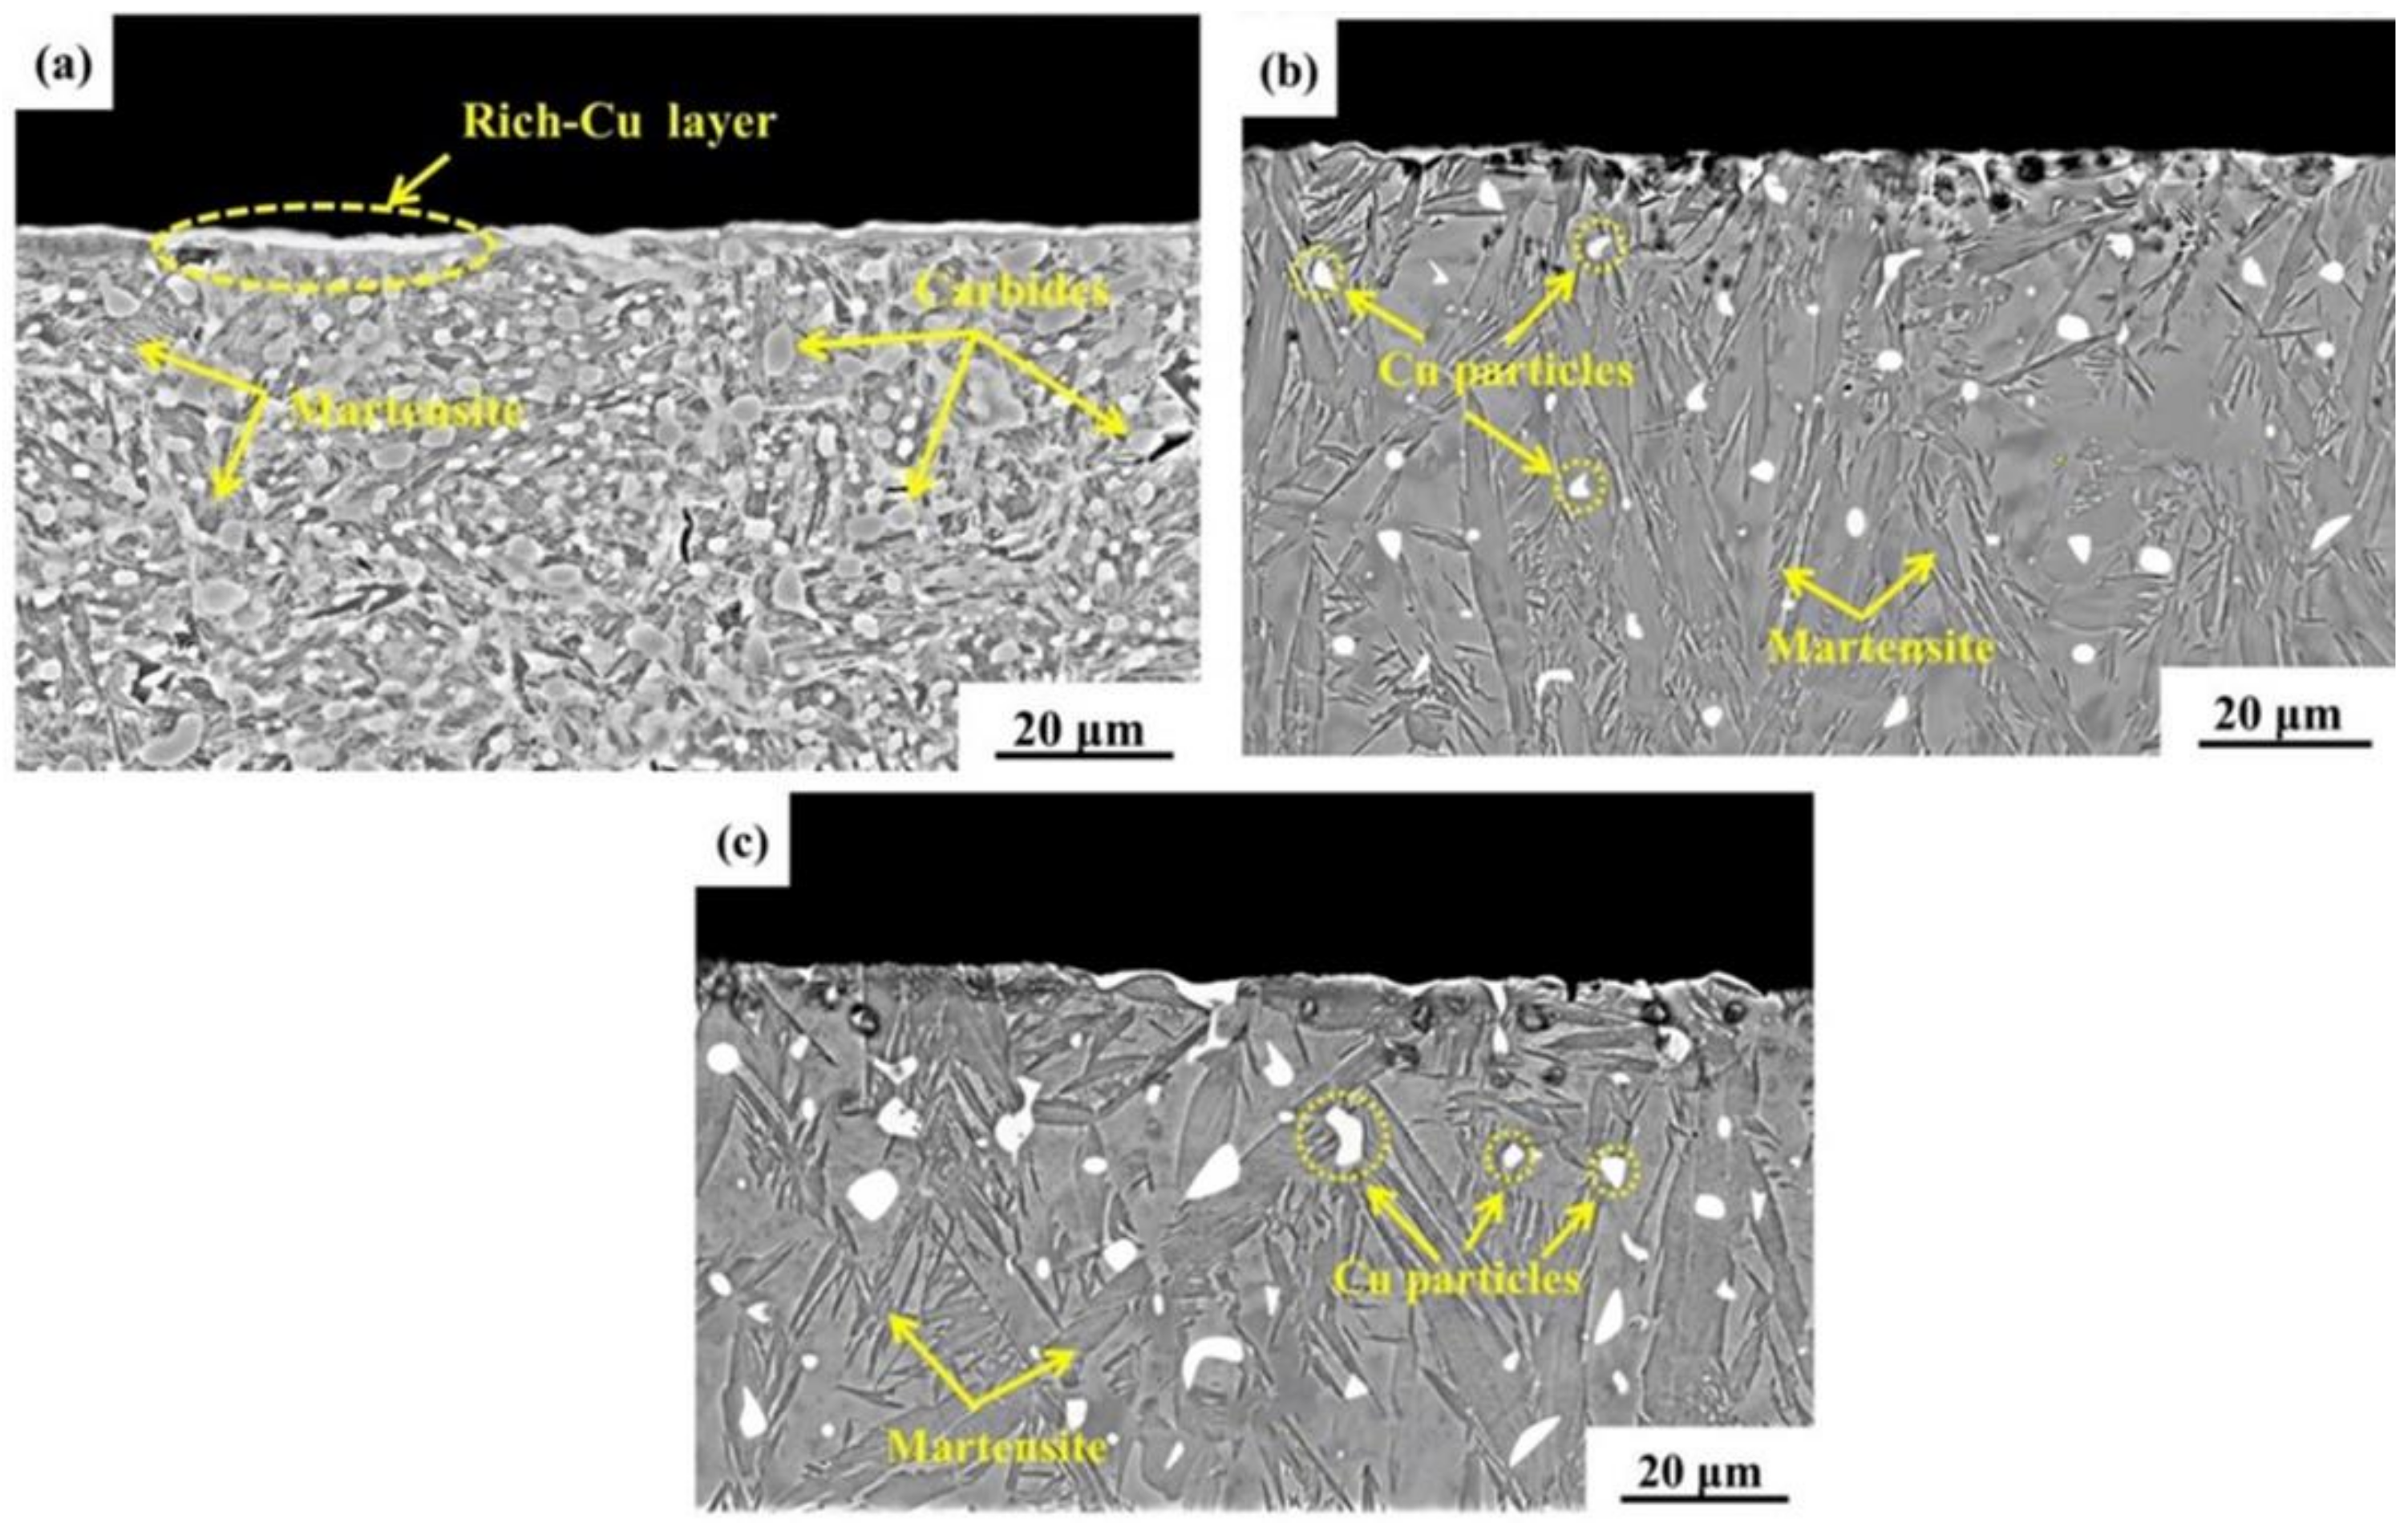
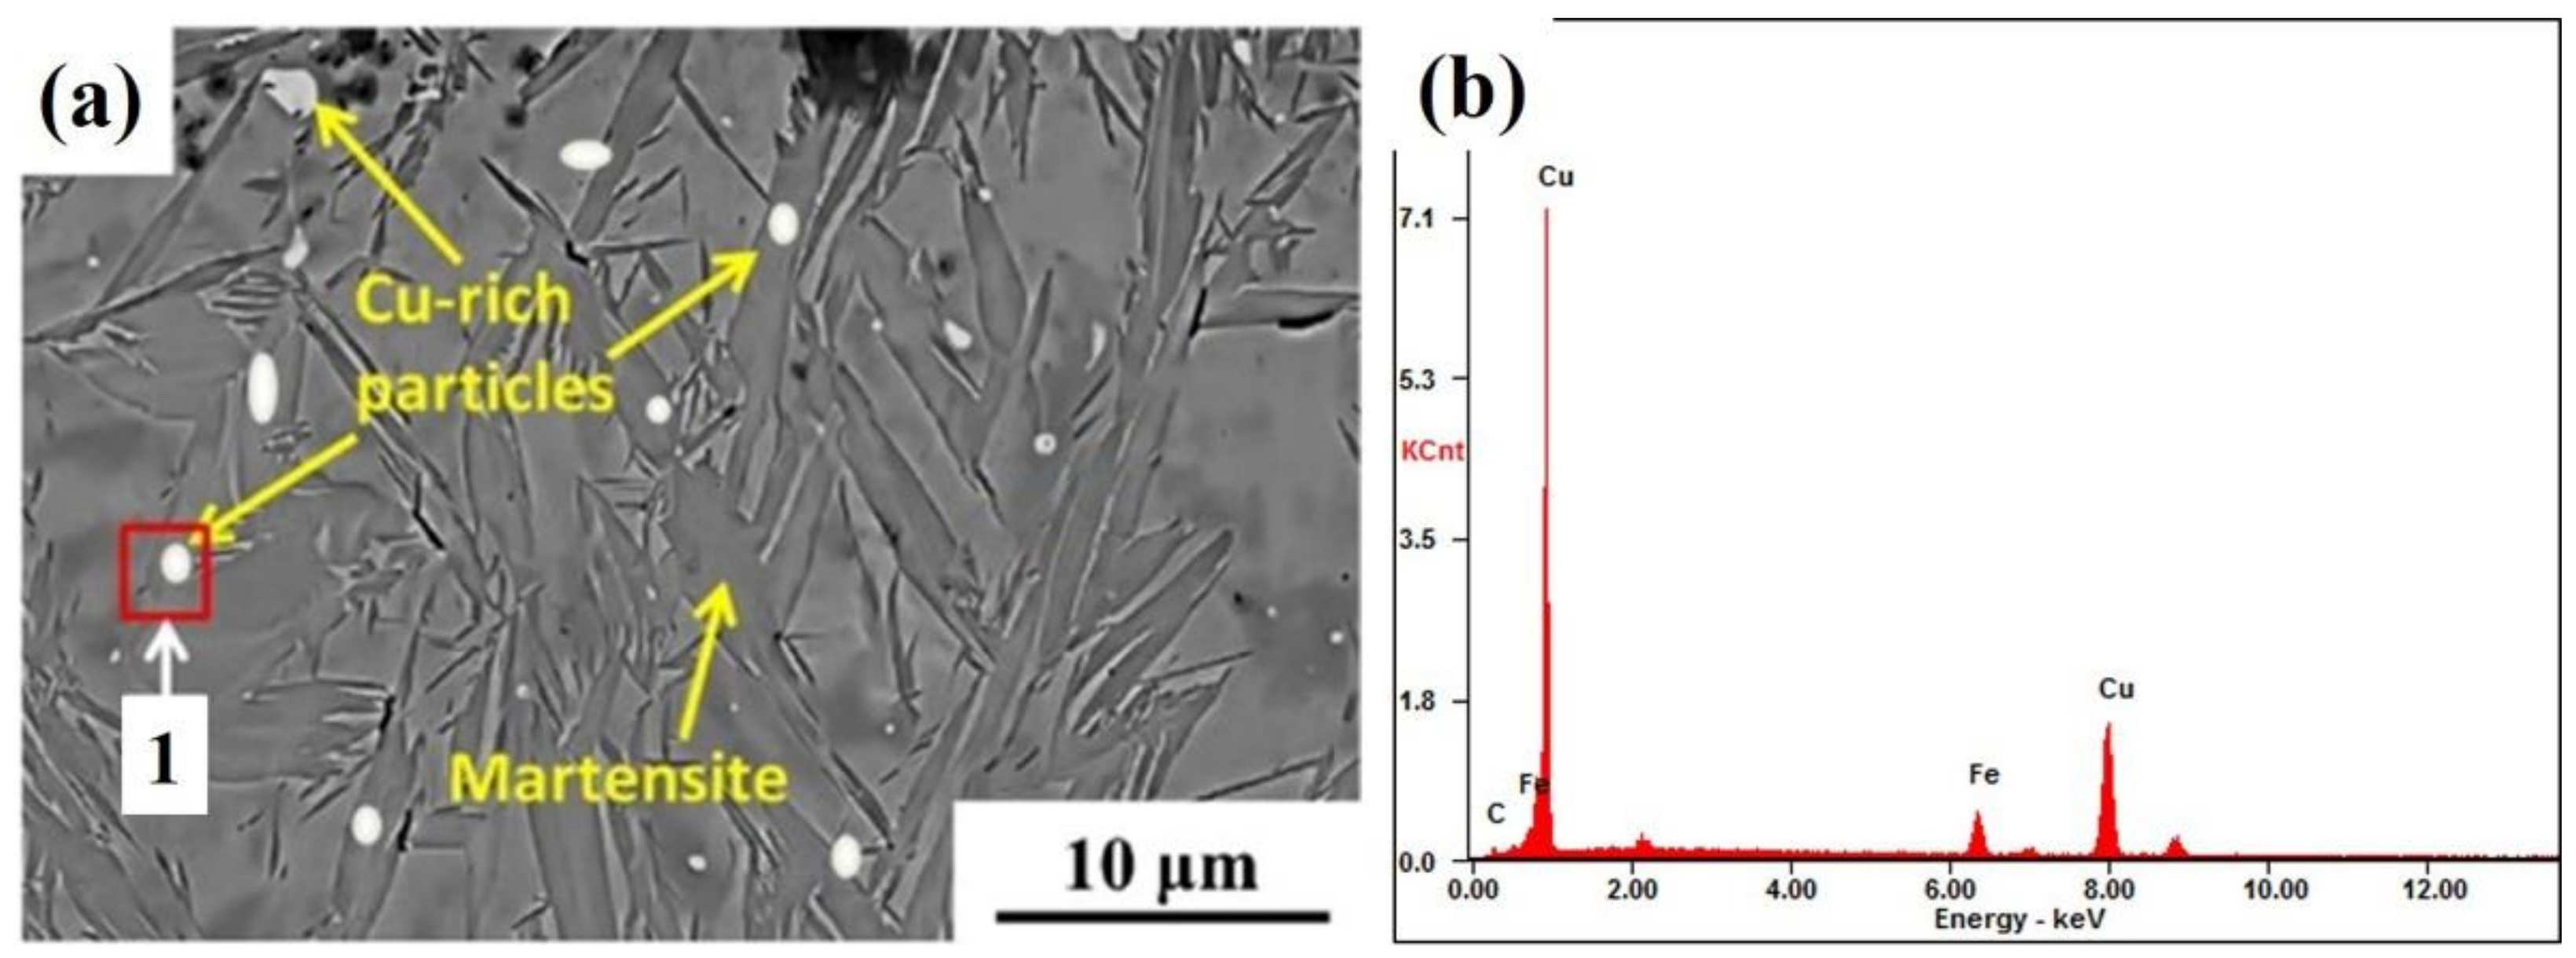
- The microstructures of the alloyed coatings are distinctly influenced by the arc current. After PTA alloying at 90 A and 110 A, the alloyed coating is composed of bamboo-like martensite, retained austenite, and Cu-rich particles. Cu-rich particles are gradually embedded in the substrate because of the liquid phase separation and high cooling rate of the PTA process.
- (2)
- The microhardness of the alloyed coatings is significantly improved and is approximately four times higher than that of the untreated sample. However, it is slightly lower than that of the remolten sample, due to the dissolution of the Cu particles. With the increase in the PTA current, the location of the maximum microhardness of the PTA alloying samples becomes further away from the surface.
- (3)
- The Cu composite coatings exhibit outstanding antifriction behavior. Compared to the untreated sample, the COFs and the wear rates of the PTA alloying samples are significantly lower due to the lubricating effect of Cu particles.
- (4)
- The dominant wear mechanism of the alloyed coatings at RT is slight abrasive wear, while the rise in the test temperature leads to a shift in the wear mechanism to mild abrasive wear and oxidative wear at HT. The Cu-rich particles contained in the alloyed layer can form Cu films which have a lubricating effect and prevent the alloyed coating from undergoing severe wear.
Author Contributions
Funding
Acknowledgments
Conflicts of Interest
References
- Yin, F.; Hua, L.; Mao, H.; Han, X. Constitutive modeling for flow behavior of GCr15 steel under hot compression experiments. Mater. Des. 2013, 43, 393–401. [Google Scholar] [CrossRef]
- Cao, Y.J.; Sun, J.Q.; Ma, F.; Chen, Y.Y.; Cheng, X.Z.; Gao, X.; Xie, K. Effect of the microstructure and residual stress on tribological behavior of induction hardened GCr15 steel. Tribol. Int. 2017, 115, 108–115. [Google Scholar] [CrossRef]
- Ulutan, M.; Kiliçay, K.; Celik, O.N.; Er, Ü. Microstructure and wear behaviour of plasma transferred arc (PTA)-deposited FeCrC composite coatings on AISI 5115 steel. J. Mater. Process. Technol. 2016, 236, 26–34. [Google Scholar] [CrossRef]
- Berger, L.M. Application of hardmetals as thermal spray coatings. Int. J. Refract. Met. Hard Mater. 2015, 49, 350–364. [Google Scholar] [CrossRef]
- Fan, C.; Chen, M.C.; Chang, C.M.; Wu, W. Microstructure change caused by (Cr, Fe)23C6 carbides in high chromium Fe–Cr–C hardfacing alloys. Surf. Coat. Technol. 2006, 201, 908–912. [Google Scholar] [CrossRef]
- Chen, J.; Chun, G.; Zhou, J. Microstructure and tribological properties of laser cladding Fe-based coating on pure Ti substrate. Trans. Nonferrous Met. Soc. China 2012, 22, 2171–2178. [Google Scholar] [CrossRef]
- Bourithis, E.; Tazedakis, A.; Papadimitriou, G. A study on the surface treatment of “Calmax” tool steel by a plasma transferred arc (PTA) process. J. Mater. Process. Technol. 2002, 128, 169–177. [Google Scholar] [CrossRef]
- Hou, Q.Y. Influence of molybdenum on the microstructure and properties of a FeCrBSi alloy coating deposited by plasma transferred arc hardfacing. Surf. Coat. Technol. 2013, 225, 11–20. [Google Scholar] [CrossRef]
- Veinthal, R.; Sergejev, F.; Zikin, A.; Tarbe, R.; Hornung, J. Abrasive impact wear and surface fatigue wear behaviour of Fe–Cr–C PTA overlays. Wear 2013, 301, 102–108. [Google Scholar] [CrossRef]
- Ozel, S.; Kurt, B.; Somunkiran, I.; Orhan, N. Microstructural characteristic of NiTi coating on stainless steel by plasma transferred arc process. Surf. Coat. Technol. 2008, 202, 3633–3637. [Google Scholar] [CrossRef]
- Bourithis, L.; Milonas, A.; Papadimitriou, G.D. Plasma transferred arc surface alloying of a construction steel to produce a metal matrix composite tool steel with TiC as reinforcing particles. Surf. Coat. Technol. 2003, 165, 286–295. [Google Scholar] [CrossRef]
- Liu, L.; Shen, H.H.; Liu, X.Z.; Guo, Q.; Meng, T.X.; Wang, Z.X.; Yang, H.J.; Liu, X.P. Wear resistance of TiN (Ti2N)/Ti composite layer formed on C17200 alloy by plasma surface Ti-alloying and nitriding. Appl. Surf. Sci. 2016, 388, 103–108. [Google Scholar] [CrossRef]
- Cao, H.T.; Dong, X.P.; Pan, Z.; Wu, X.W.; Huang, Q.W.; Pei, Y.T. Surface alloying of high-vanadium high-speed steel on ductile iron using plasma transferred arc technique: Microstructure and wear properties. Mater. Des. 2016, 100, 223–234. [Google Scholar] [CrossRef]
- Zhang, P.L.; Liu, X.P.; Lu, Y.L.; Yan, H.; Yu, Z.; Li, C.; Lu, Q. Microstructure and wear behavior of Cu–Mo–Si coatings by laser cladding. Appl. Surf. Sci. 2014, 311, 709–714. [Google Scholar]
- Novytskyi, V.G.; Havryliuk, V.P.; Lakhnenko, V.L.; Panasenko, D.D.; Ya. Khoruzhyi, V.; Kal’chuk, N.A. Effect of carbon and copper on the structure of cast Fe-Cr-Cu-C alloys and their tribological characteristics under the conditions of sliding friction. J. Frict. Wear 2015, 36, 56–64. [Google Scholar] [CrossRef]
- Chen, C.; Duan, C.; Li, Y.; Feng, X.; Shen, Y. Effects of Cu content on the microstructures and properties of Cr–Cu composite coatings fabricated via mechanical alloying method. Powder Technol. 2015, 277, 36–46. [Google Scholar] [CrossRef]
- Wu, H.; Wei, H.; Hussain, G.; Tao, K.; Asif, I.; Rao, W. Plasma surface Cu alloyed layer as a lubricant on stainless steel sheet: Wear characteristics and on-job performance in incremental forming. J. Wuhan Univ. Technol.-Mater. Sci. Ed. 2016, 31, 422. [Google Scholar] [CrossRef]
- Zeng, Q.; Dong, G.; Xie, Y. Structure and tribological properties of amorphous carbon films deposited by electrochemical method on GCr15 steel substrate. Appl. Surf. Sci. 2008, 254, 2425–2430. [Google Scholar] [CrossRef]
- Zhao, H.; Li, J.; Zheng, Z.; Wang, A.; Zeng, D.; Miao, Y. The microstructures and tribological properties of composite coatings formed via PTA surface alloying of copper on nodular cast iron. Surf. Coat. Technol. 2016, 286, 303–312. [Google Scholar] [CrossRef]
- Chen, Y.Z.; Liu, F.; Yang, G.C.; Xu, X.Q.; Zhou, Y.H. Rapid solidification of bulk undercooled hypoperitectic Fe–Cu alloy. J. Alloys Compd. 2007, 427, L1–L5. [Google Scholar] [CrossRef]
- Hou, Q.Y.; Ding, T.T.; Huang, Z.Y.; Wang, P.; Luo, L.M.; Wu, Y.C. Microstructure and properties of mixed Cu–Sn and Fe-based alloys without or with molybdenum addition processed by plasma transferred arc. Surf. Coat. Technol. 2015, 283, 184–193. [Google Scholar] [CrossRef]
- Zhang, X.; Tang, B.; Fan, A.; Ma, Y.; Tian, L. Preparation and characterization of plasma Cu surface modified stainless steel. J. Wuhan Univ. Technol.-Mater. Sci. Ed. 2012, 27, 260–264. [Google Scholar] [CrossRef]
- Kesavan, D.; Kamaraj, M. The microstructure and high temperature wear performance of a nickel base hardfaced coating. Surf. Coat. Technol. 2010, 204, 4034–4043. [Google Scholar] [CrossRef]
- Ezirmik, V.; Senel, E.; Kazmanli, K.; Erdemir, A.; Ürgen, M. Effect of Copper Addition on the Temperature Dependent Reciprocating Wear Behaviour of CrN Coatings. Surf. Coat. Technol. 2007, 202, 866–870. [Google Scholar] [CrossRef]
- Wei, C.B.; Tian, X.B.; Yang, Y.; Yang, S.Q.; Fu, R.K.Y.; Chu, P.K. Microstructure and tribological properties of Cu–Zn/TiN multilayers fabricated by dual magnetron sputtering. Surf. Coat. Technol. 2007, 202, 189–193. [Google Scholar] [CrossRef]


| C | Si | Mn | S | Cr | P | Fe |
|---|---|---|---|---|---|---|
| 0.95–1.10 | 0.15–0.35 | <0.50 | <0.025 | 0.30–1.60 | <0.025 | Bal. |
| Sample No. | PTA Current (A) | Scanning Speed(mm/min) | Gas flow(L/min) | Working Distance(mm) |
|---|---|---|---|---|
| 1 | 70 | 300 | 3 | 5 |
| 2 | 90 | 300 | 3 | 5 |
| 3 | 110 | 300 | 3 | 5 |
| Sample No. | Cu | Fe |
|---|---|---|
| 1—70 A | 0 | 100 |
| 2—90 A | 9.75 | 90.25 |
| 3—110 A | 12.89 | 87.21 |
© 2018 by the authors. Licensee MDPI, Basel, Switzerland. This article is an open access article distributed under the terms and conditions of the Creative Commons Attribution (CC BY) license (http://creativecommons.org/licenses/by/4.0/).
Share and Cite
Xiong, Y.; Lin, D.; Zheng, Z.; Li, J.; Deng, T. The Effect of Different Arc Currents on the Microstructure and Tribological Behaviors of Cu Particle Composite Coating Synthesized on GCr15 Steel by PTA Surface Alloying. Metals 2018, 8, 984. https://doi.org/10.3390/met8120984
Xiong Y, Lin D, Zheng Z, Li J, Deng T. The Effect of Different Arc Currents on the Microstructure and Tribological Behaviors of Cu Particle Composite Coating Synthesized on GCr15 Steel by PTA Surface Alloying. Metals. 2018; 8(12):984. https://doi.org/10.3390/met8120984
Chicago/Turabian StyleXiong, Yibo, Dongqing Lin, Zhizhen Zheng, Jianjun Li, and Tiantian Deng. 2018. "The Effect of Different Arc Currents on the Microstructure and Tribological Behaviors of Cu Particle Composite Coating Synthesized on GCr15 Steel by PTA Surface Alloying" Metals 8, no. 12: 984. https://doi.org/10.3390/met8120984
APA StyleXiong, Y., Lin, D., Zheng, Z., Li, J., & Deng, T. (2018). The Effect of Different Arc Currents on the Microstructure and Tribological Behaviors of Cu Particle Composite Coating Synthesized on GCr15 Steel by PTA Surface Alloying. Metals, 8(12), 984. https://doi.org/10.3390/met8120984