Article

The Effects of TIG Welding Rod Compositions on Microstructural and Mechanical Properties of Dissimilar AISI 304L and 420 Stainless Steel Welds

by
Aziz Barış Başyiğit
1,* and
Mustafa Gökhan Murat
2
1
Metallurgical and Material Engineering Department, Faculty of Engineering, Kırıkkale University, 71450 Kırıkkale, Turkey
2
Department of Defense Technologies, Institute of Science, Kırıkkale University, 71450 Kırıkkale, Turkey
*
Author to whom correspondence should be addressed.
Metals 2018, 8(11), 972; https://doi.org/10.3390/met8110972
Submission received: 17 October 2018 / Revised: 15 November 2018 / Accepted: 19 November 2018 / Published: 21 November 2018

Abstract

:
The usage of AISI/SAE 304L austenitic and 420 martensitic stainless steels is receiving greater interest especially in the defence and navy industries. 304L stainless steels exhibit excellent resistance to oxidizing media, while martensitic 420 alloy provides high strength values besides satisfactory corrosion properties at ambient atmospheres. In this work; 420 quality martensitic stainless steel is TIG (Tungsten Inert Gas) welded with 304L quality low carbon austenitic stainless steel plates. As filler metal dominantly determines the weld metals chemical compositions and final microstructures, 3 different TIG welding rods of ER312, ER316L ve ER2209 are used in welding operations in order to obtain 3 discrete weld metal contents under high purity argon shielding gas. Microstructural inspection, microhardness survey and Charpy V-notch impact tests are applied to all joints after welding operations. The specimen welded by ER2209 TIG welding rod executed the highest impact test results besides exhibiting the lowest micro-hardness profiles at heat affected zones and weld metals. All of the welded specimens weld region hardness profiles were determined to be lower than unwelded 420 martensitic stainless steel base metal.

1. Introduction

420 quality martensitic stainless steels are preferred in various industries where medium corrosion resistance in mildly aggressive ambients is adequate and besides they are demanded especially for their high strength values as compared to other groups of stainless steels [1].
304L quality austenitic stainless steels are used especially in oxidizing corrosive medias and they exhibit high toughness from cryogenic up to high temperature applications [2,3].
While austenitic stainless steel alloys are not transformation hardenable, martensitic alloys on the other hand are hardenable, therefore joining these two groups of stainless steels requires some precautions before, during and after fusion welding techniques [2,3,4,5].
Many authors proposed studies about 304L and 420 stainless steels welds with other groups of alloys but welding of dissimilar 304L with 420 is not reported. This research is distinctive at this standpoint. The decision to weld together different types of material groups is commonly due to economic considerations. The second main reason is taking the advantage of the chemical and/or physical properties of both separate groups altogether in one uniform structure to meet optimum requirements of weldments [2].
In this study; these two different groups of stainless steels are joined by TIG (Tungsten Inert Gas) fusion welding. The joints microstructural developments are inspected by metallographic techniques as indicated in literature [2,3,6,7].
The welded samples are machined after welding operations according to TS EN ISO 15614-1 [8] standard for performing test specimens including; Charpy V-notch impact test [9,10], micro-hardness surveys [11] and microstructural investigations. The weldability of these two different stainless steel alloys is analysed.

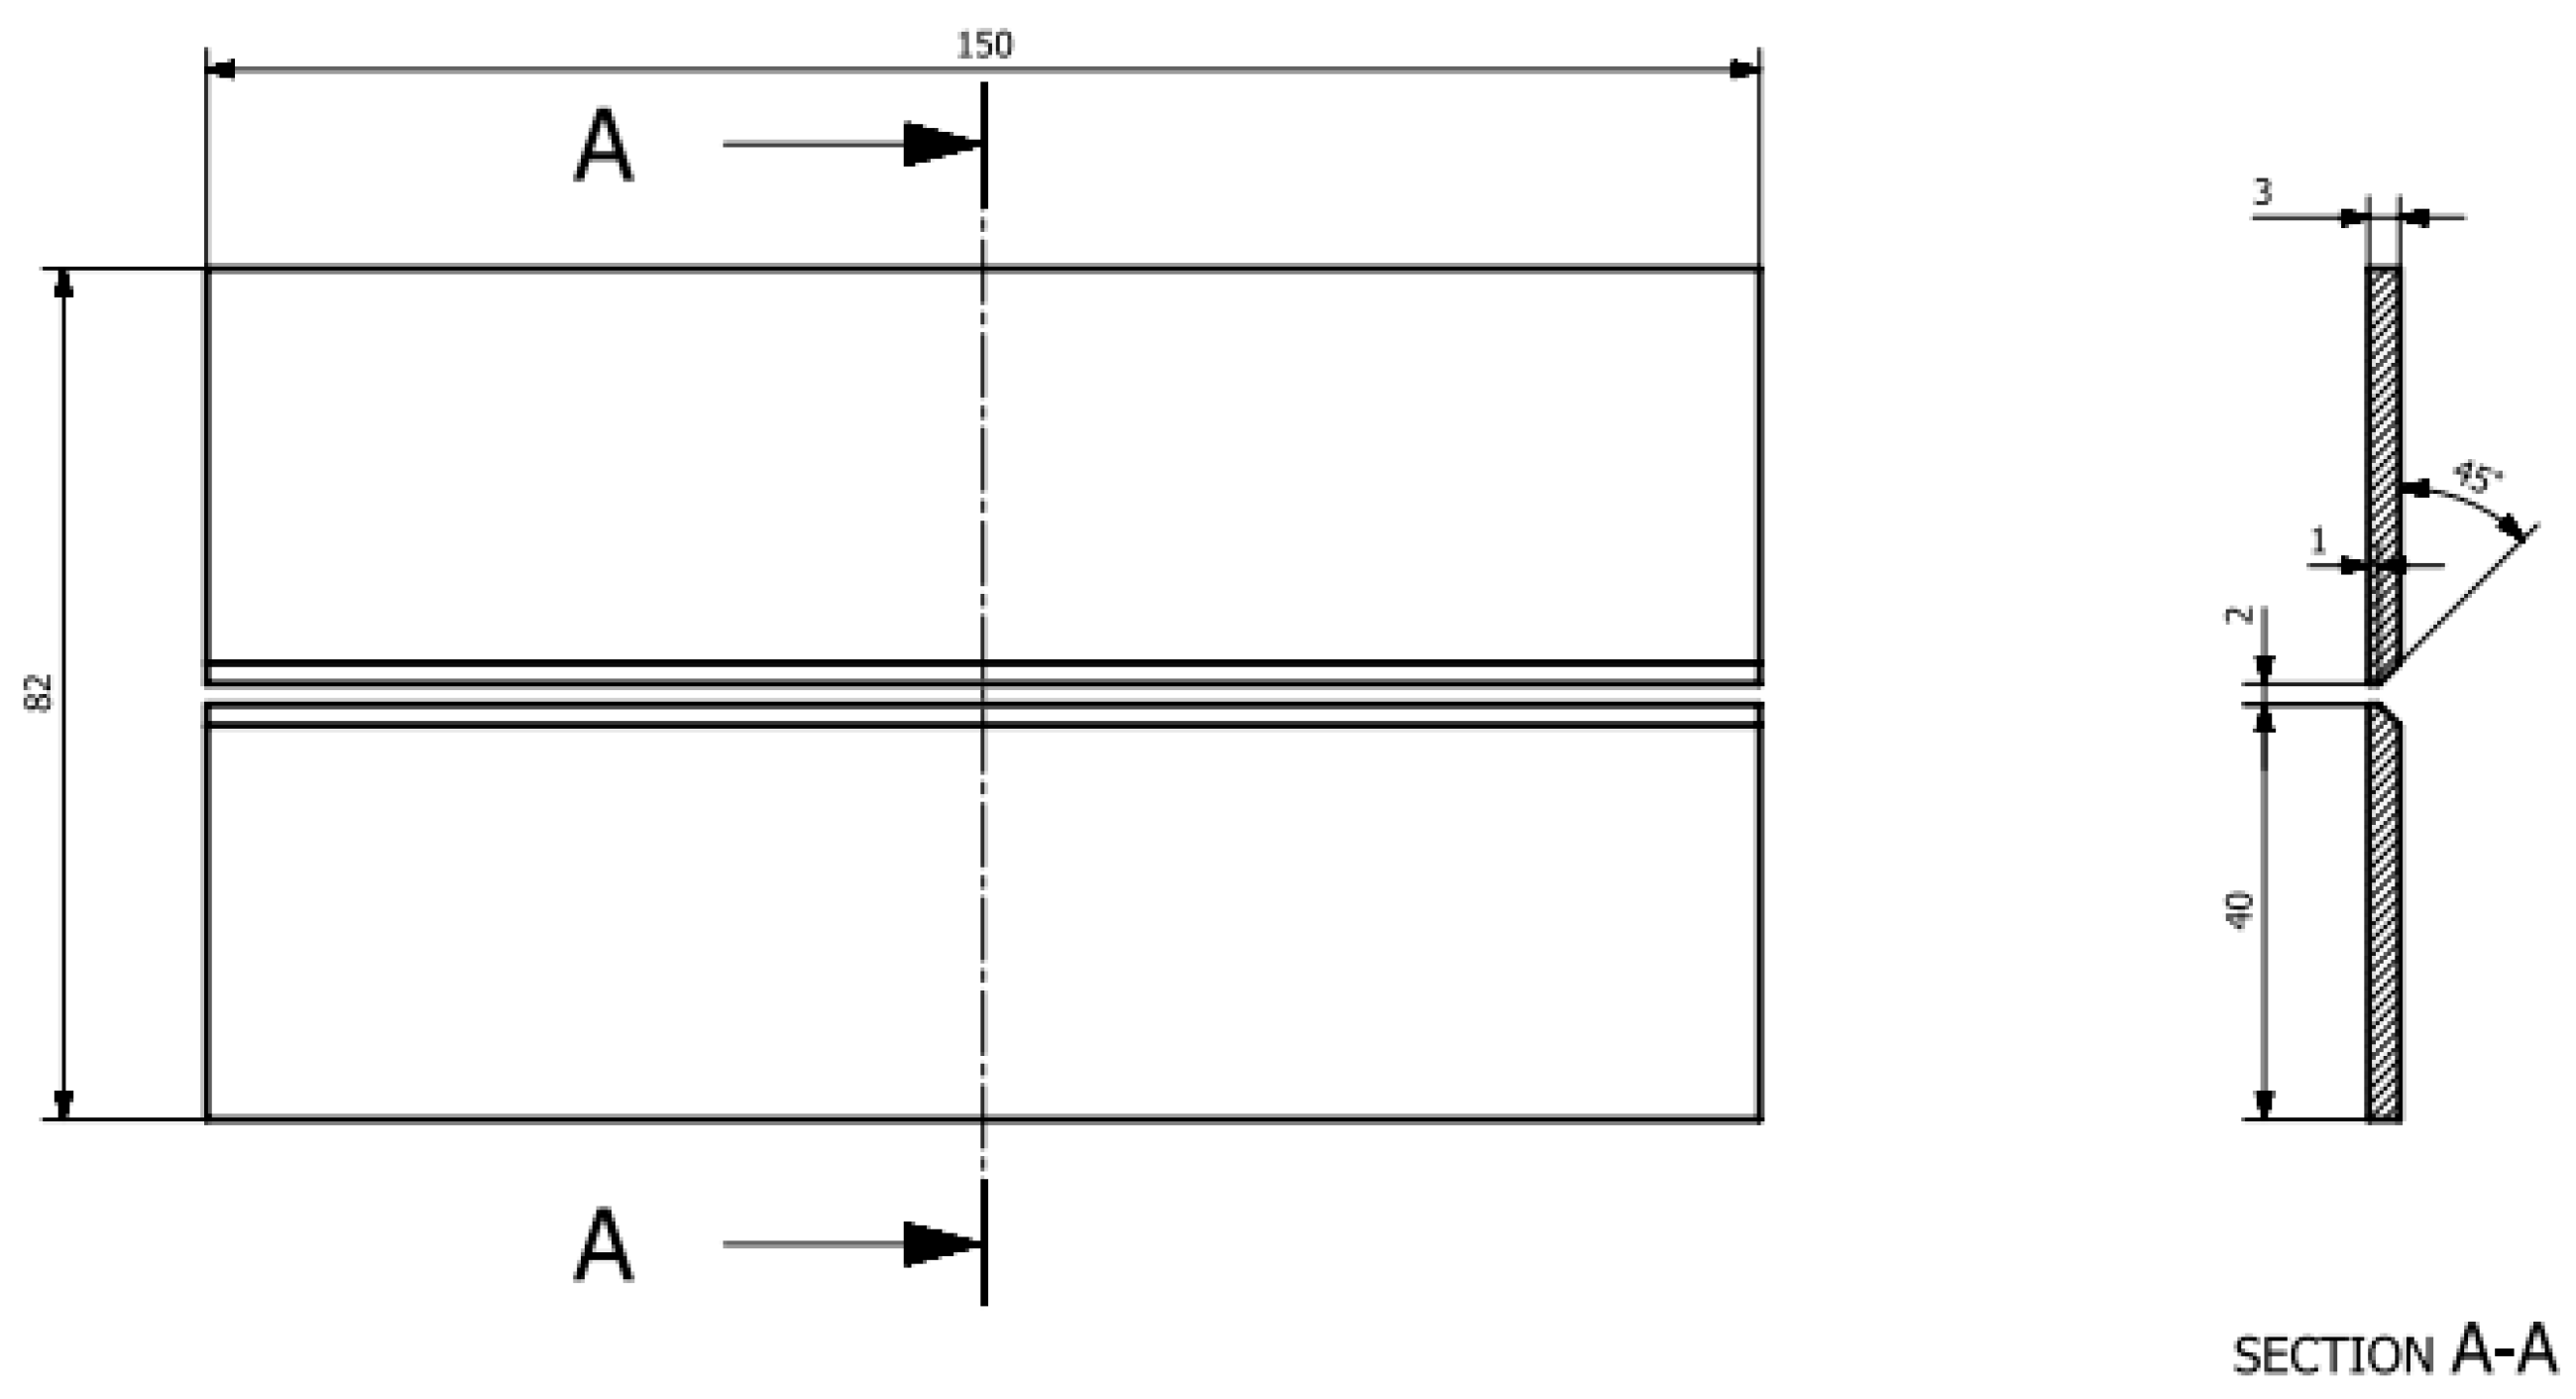
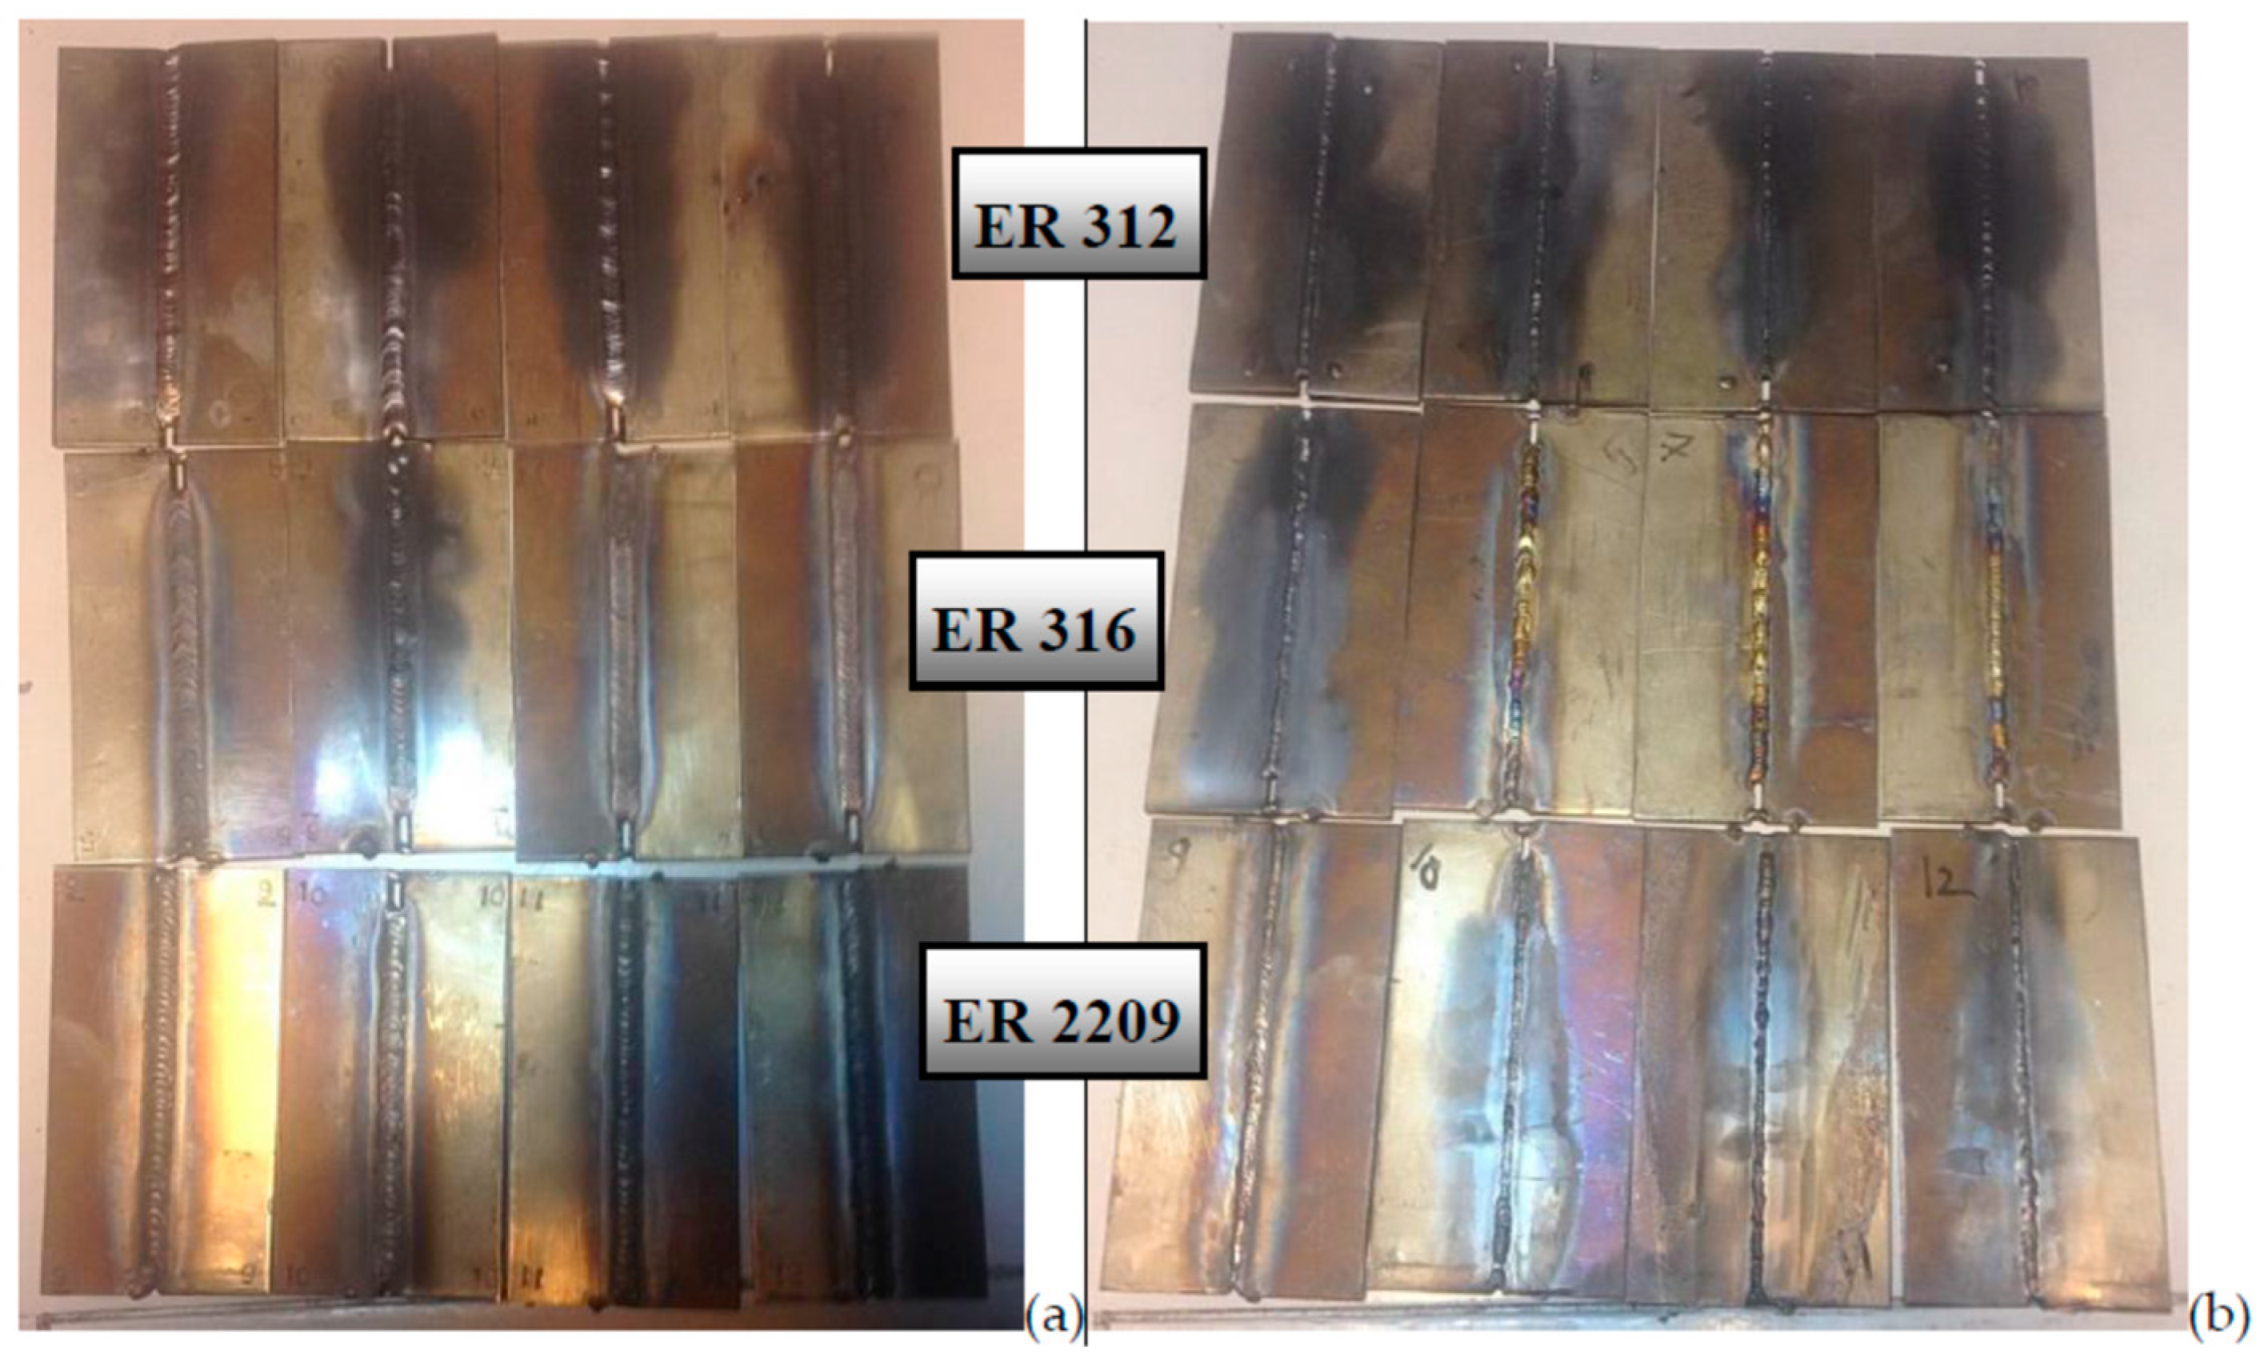
2. Materials and Methods

AISI/SAE 304L (S30403) austenitic and AISI/SAE 420 martensitic (S42000) stainless steel plates with 3 mm thicknesses are prepared for TIG welding. Welding operation is applied within two passes.
The chemical composition of base metals from spectral analysis that applied in laboratories by AMETEK Spectromax Optical Argon Emission Spectrometer is given in Table 1. Both of the base metals chemical compositions are within the required limit values as indicated in ASTM A240/A240M Standard [12].
The effects of chemical compositions on weld metals microstructural and mechanical properties are intended to be investigated. Three different (ER312, ER316L and ER 2209) TIG welding rod compositions from manufacturers production analysis are listed in Table 2.
The specimen couples are given in Figure 1. All of the 420 martensitic stainless steel plates are heat treated at 300 °C in 45 min just before welding operation in order to decrease the cooling rates of weld region uniformly. As the cooling rate decreases in the weld region just after welding, hard and brittle phases like martensite can have less opportunity to form. Authors indicated that if the amount of martensite increases in the weld region, hardness increases but also failures and cracks occur at the same time in their research [15]. 304L stainless steel plates were not heat treated before welding so that these alloys cannot be hardened by transformation of austenite to martensite phases as a result of their low carbon contents [1,2,3,4].
Argon with purity of 99.998% is used as shielding gas in welding operations. The weldments are also shielded by argon gas from the root sides. TIG welding is applied by ESAB TIG 4300i-AC/DC.
In TIG welding operation, the net heat input is estimated for both of the weld passes by H n e t = η   ×   E   ×   I V equation [3,4].
The symbols: ‘η’ indicates welding efficiency; ‘E’ is the welding voltage (volts); ‘I’ indicates welding current (Amperes); ‘V’ is the welding speed (mm/seconds).
‘η’ value is 70% (0.7) in TIG welding application for DC(−) current type [4].
As the welding operation is applied within two passes; Hnet is estimated for both root and final passes separately.
H n e t   r o o t   p a s s = 0.7 × 9   V × 67.5   A 2.29   ( mm / sec ) = 186   Joule / mm
H n e t   f i n a l   p a s s = 0.7 × 11   V × 92.5   A 2.18   ( mm / sec ) = 327   Joule / mm
TIG welding parameters are listed in Table 3.
The front and back side views of joined samples are given in Figure 2.
After welding operation all of the weldments are post-weld heat treated for thermal stress relieving at 360 °C in 45 min inside a furnace as indicated in literature [2].
After post-weld heat treatment, joints are machined for microstructural inspections, microhardness surveys and impact tests according to ISO 15614-1 standard as scheduled in Figure 3.
Three impact test samples, one microstructural investigation with micro-hardness test specimen are prepared as given in Figure 3.
Microstructural investigations were applied by Leica Brand optical microscope that can magnify up to 1000× capacity. The etchant is prepared by 20% NaOH solution as indicated in literature [2,3,6]. Samples were electrolytically etched in NaOH solution by applying 2.5 volts and 1.6 amperes of current values.
The microvickers hardness test is applied to both 304L and 420 base metals and also with three individual places on weld metals and heat affected zones separately according to the EN ISO 9015-2 standard [11] by 0.3 kg loading for 15 s at 22 °C constant laboratory temperature.
Welded martensitic stainless steels exhibit 4 distinct regions in their heat affected zones according to the distances to fusion zone from HAZ. These four regions exhibit different microstructures and hardness values in consequence of temperature distribution due to welding. The first region, just adjacent to the fusion boundary consists of mainly austenite and some ferrite at elevated temperatures during welding. Upon cooling as soon as welding finishes, dominant austenite phase transforms into martensite and delta ferrite remains in minor quantities. Hence, the maximum hardness values are determined in first region. As getting far away from the fusion zone to the base metal the temperature decreases. So the other next three zones in HAZ consists decreasing amounts of austenite that should be transformed into martensite upon cooling [2].
In this study, the micro hardnesses on each HAZ sample is recorded by scanning the maximum values of micro hardnesses throughout the measuring line according to EN ISO 9015-2 Standard. The first indentation in HAZ is applied at a distance of minimum 0.3 mm away from fusion line and the following each other indentations are applied with minimum 0.3 mm intervals. Therefore, the maximum three values of microhardnesses are recorded in HAZ as shown in Figure 4.
The width of weld metals and HAZ are approximately determined by macro imaging like shown in the middle macrograph of Figure 4 as example. The width of the heat affected zones are measured approximately between 2 and 3 millimetres depending on the locations of weld regions. The approximate width value of HAZ and weld metal is estimated as 2.5 mm and 8.5 mm respectively.
Impact energy tests are applied on each two base metals and also on all welded specimens including weld metals according to the ASTM A370 [9] and ASTM E23-12c [10] standards at 22 °C laboratory constant temperature. Charpy impact test specimen is machined to 2.5 × 10 × 55 mm of sub-sized with a V-notch as given in Figure 5.

3. Results

3.1. Microstructural Investigations

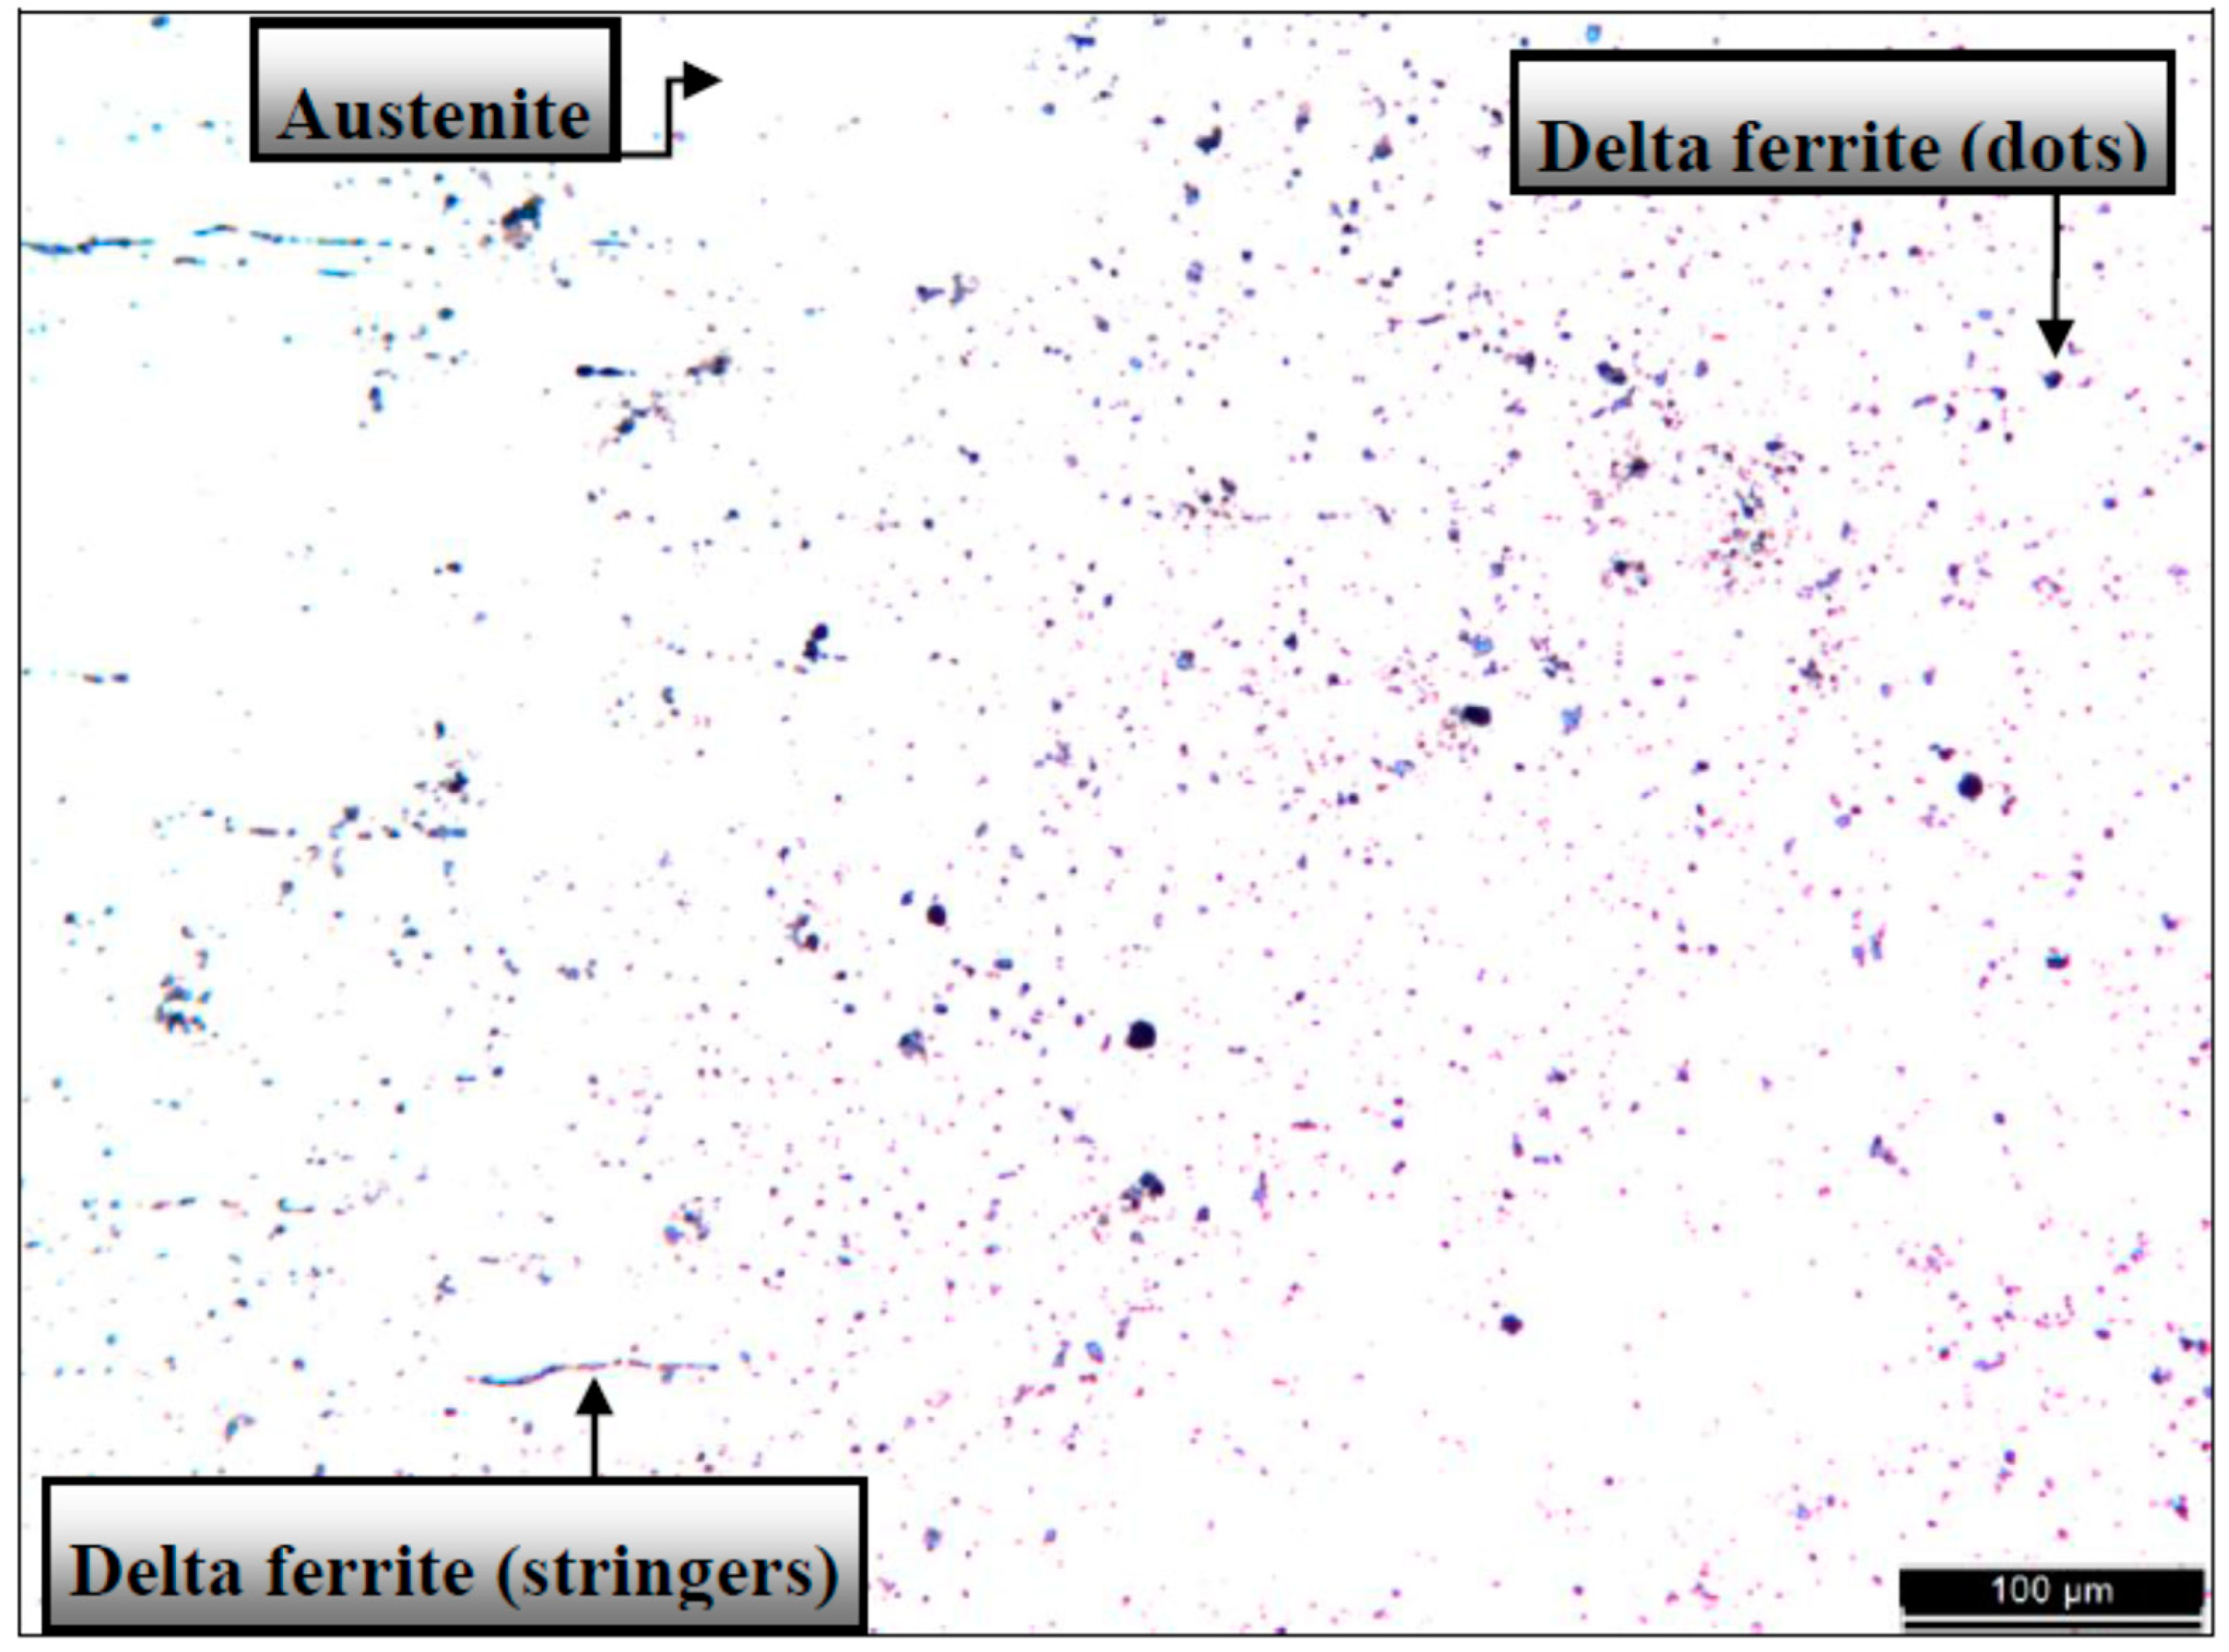
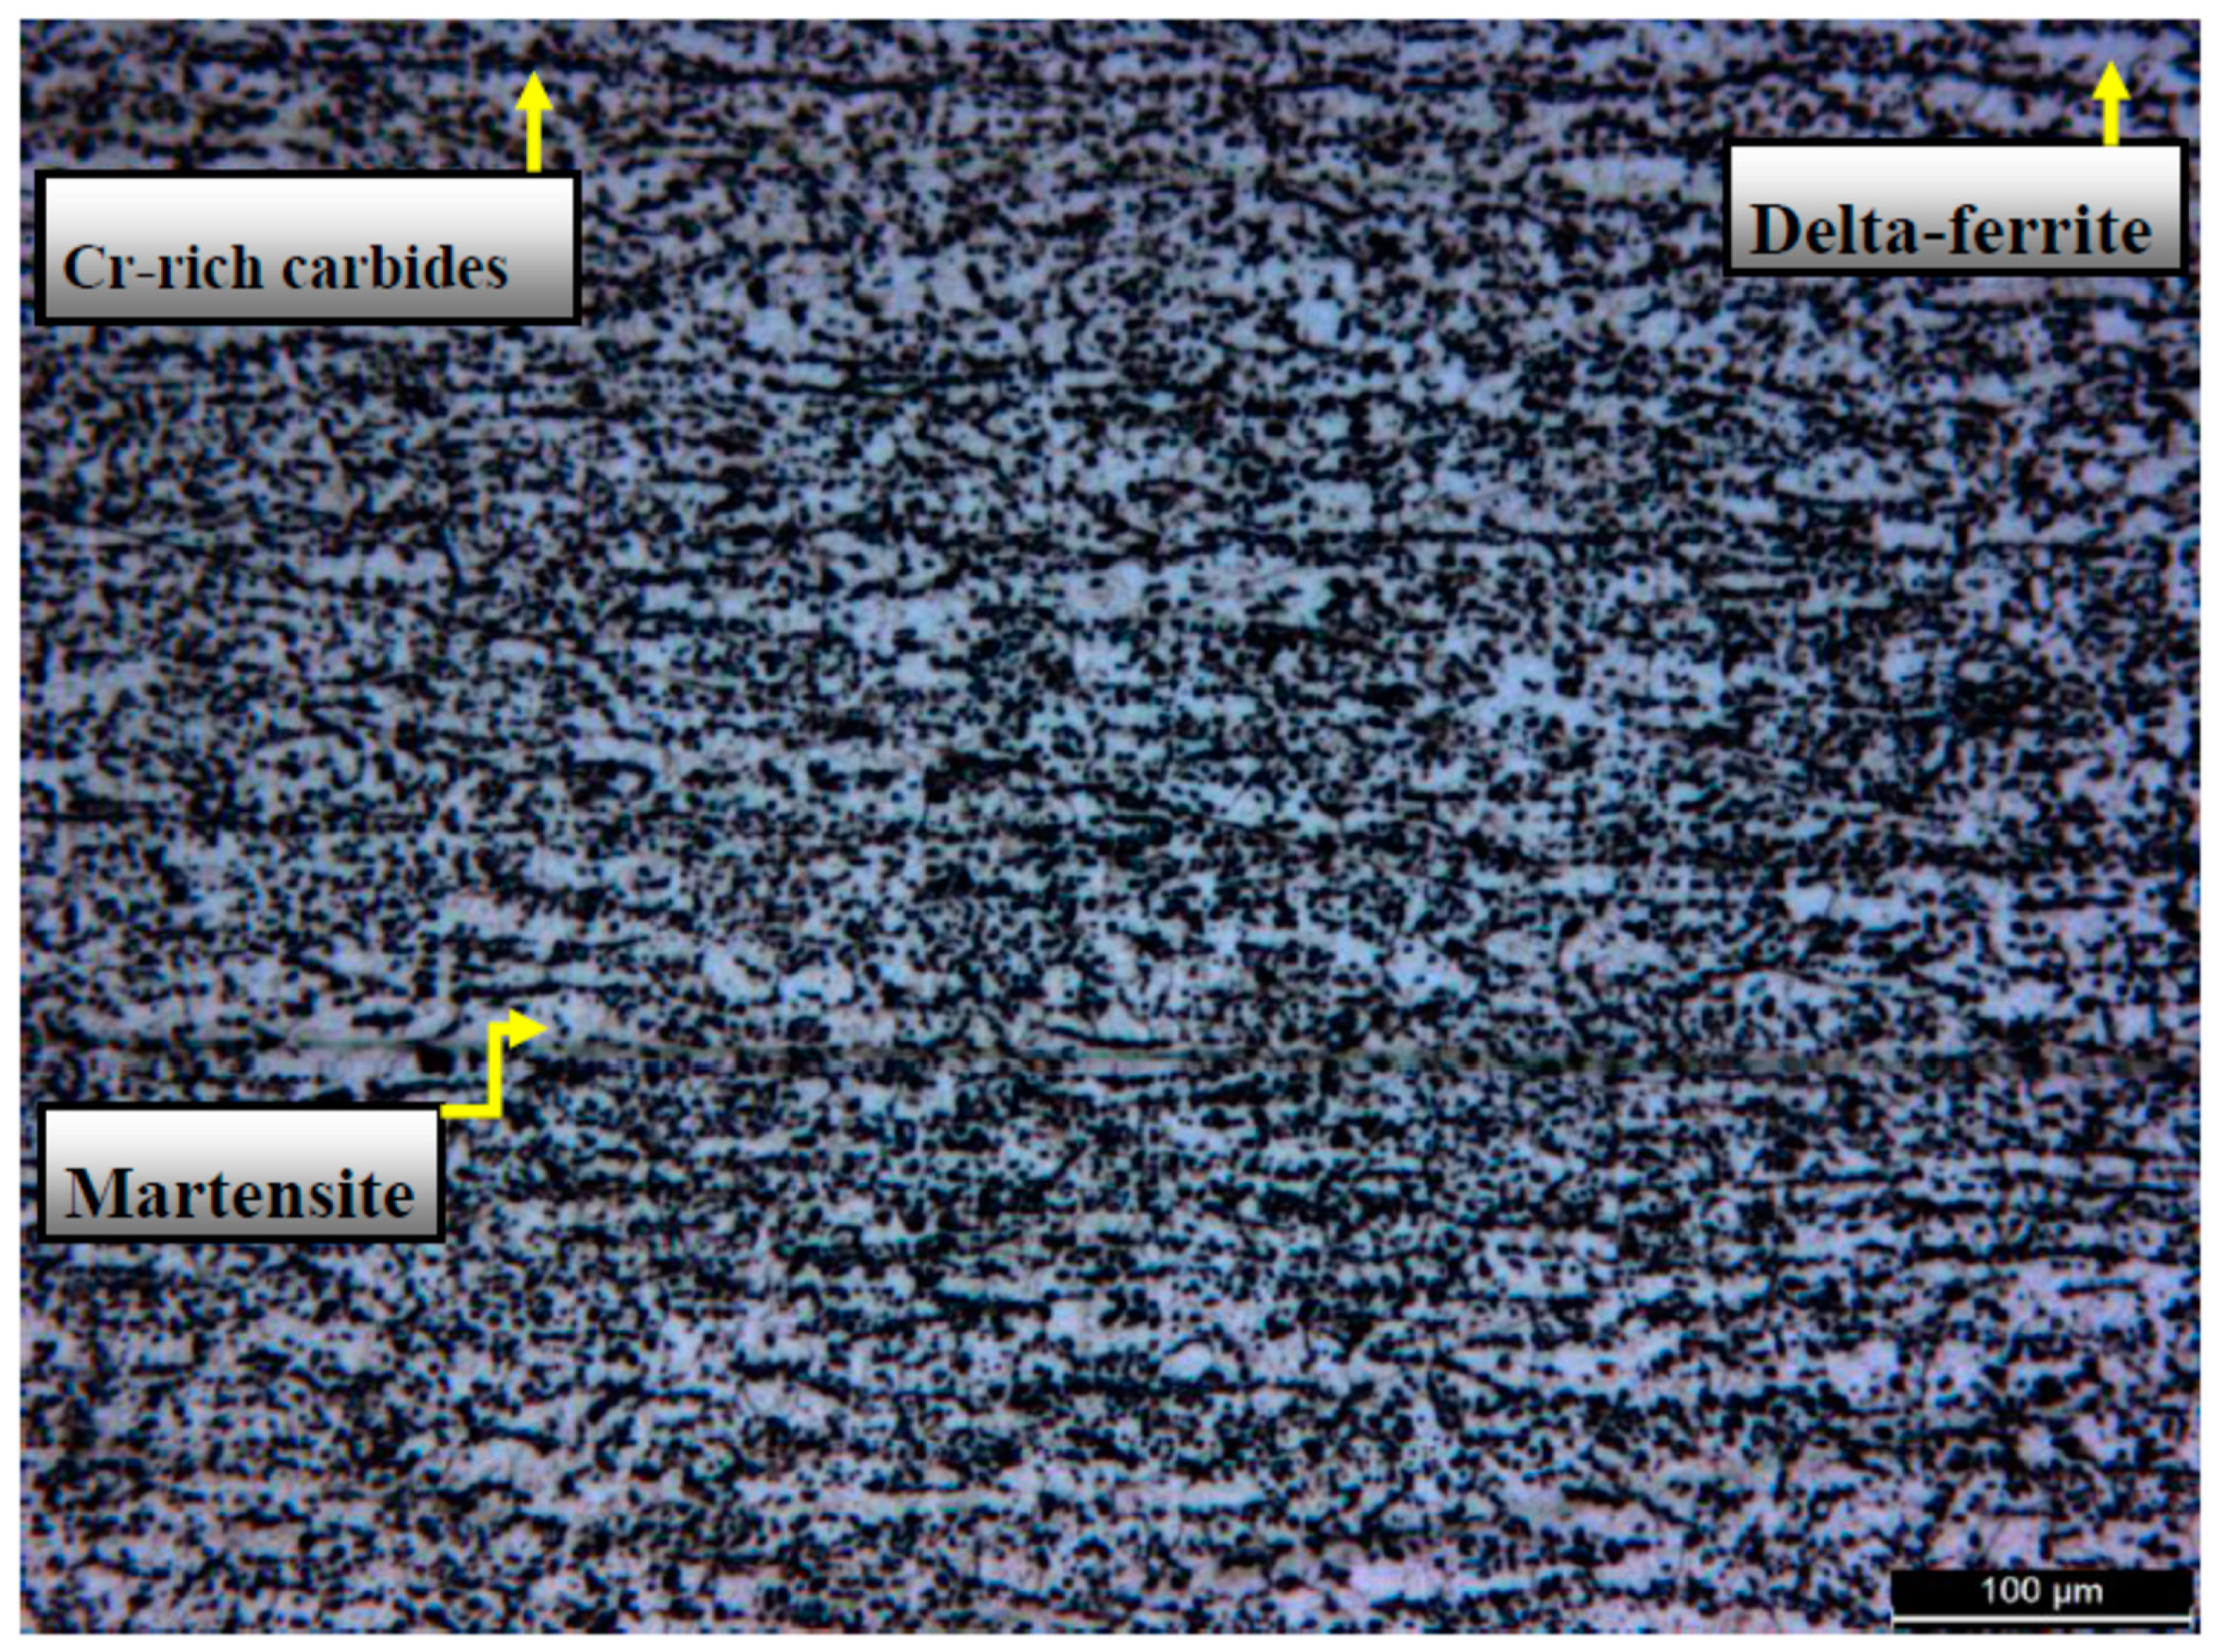
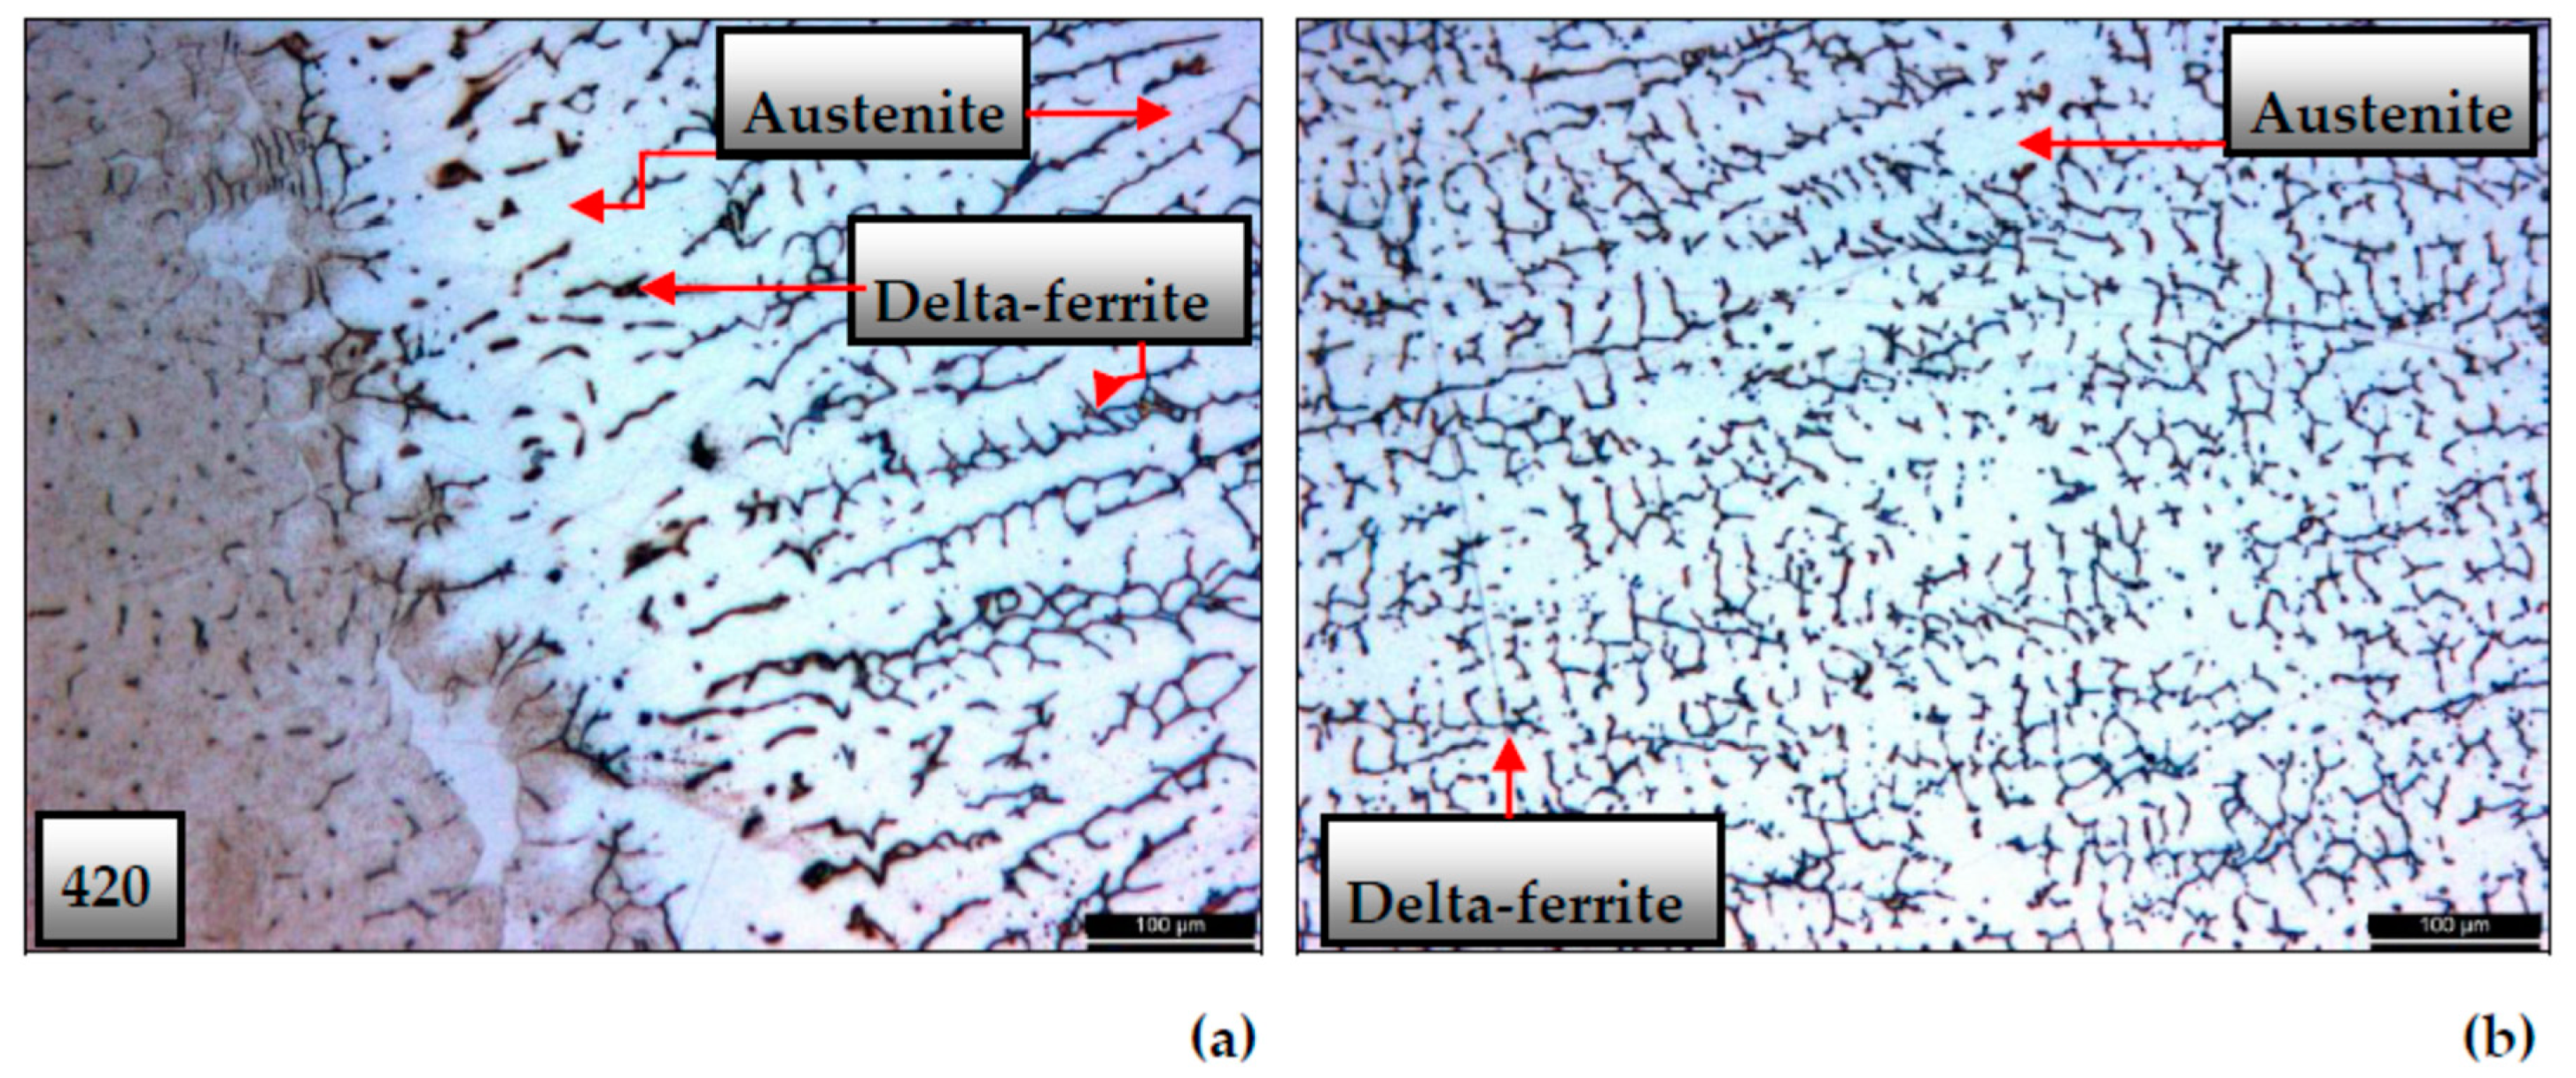
3.1.1. Microstructures of Base Metals

Dominant austenitic structure is identified in 304L stainless steel base metal micrograph as shown in Figure 6.
White (brighter) phase is austenite and darker phase (as dots and stringers) is grain boundary delta-ferrite in Figure 6.
420 stainless steels unwelded base metal microstructure is given in Figure 7.
The darkest (black points or regions) phase is chromium rich carbides, dark phases are martensite and white (bright) phase is delta-ferrite in Figure 7.

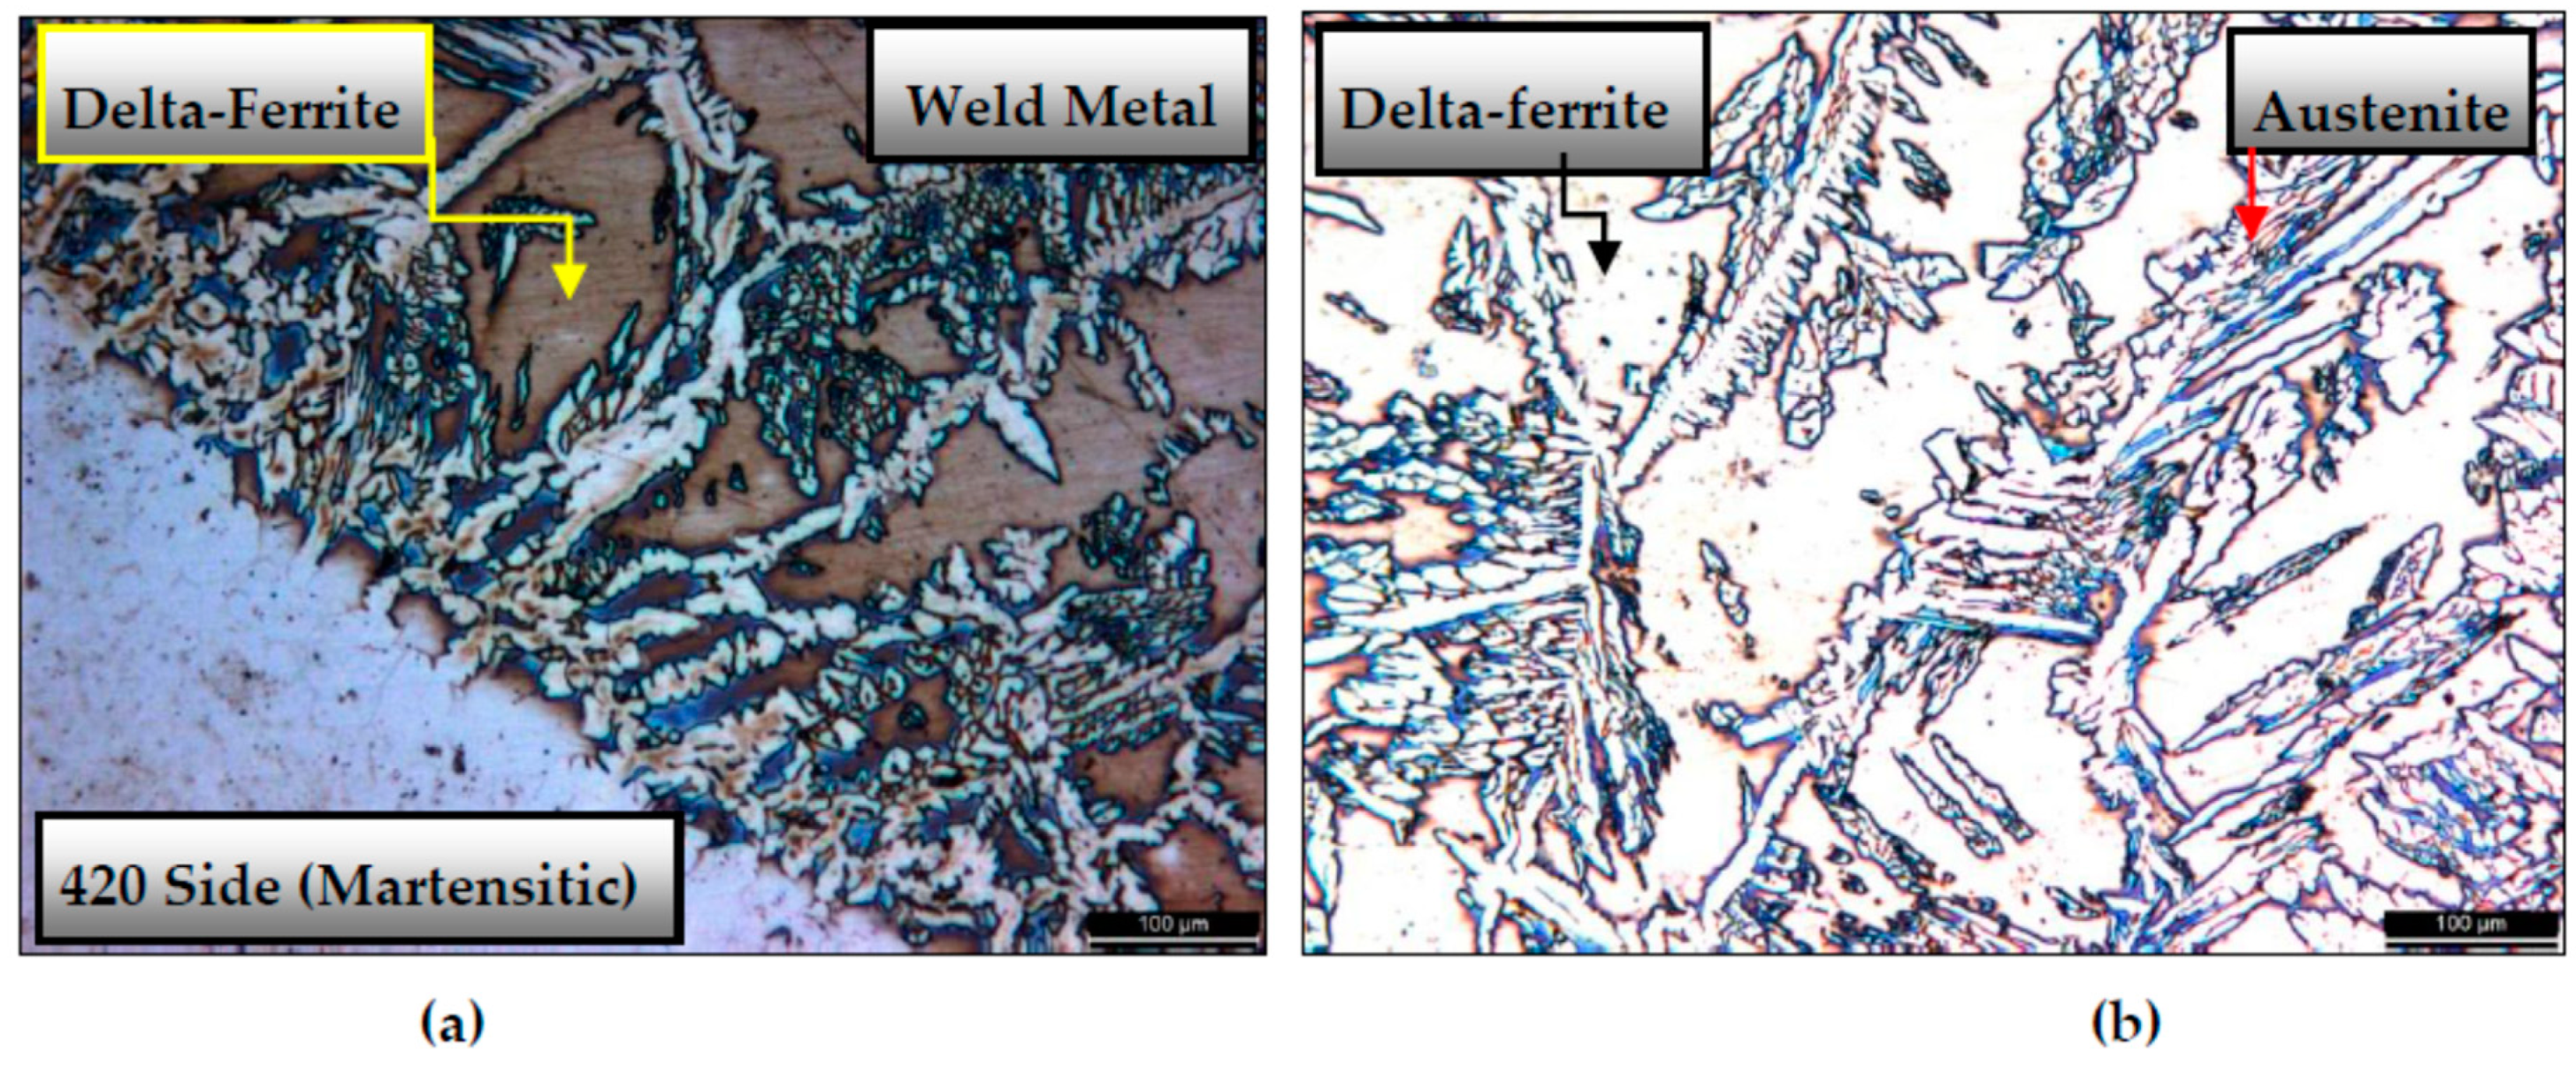
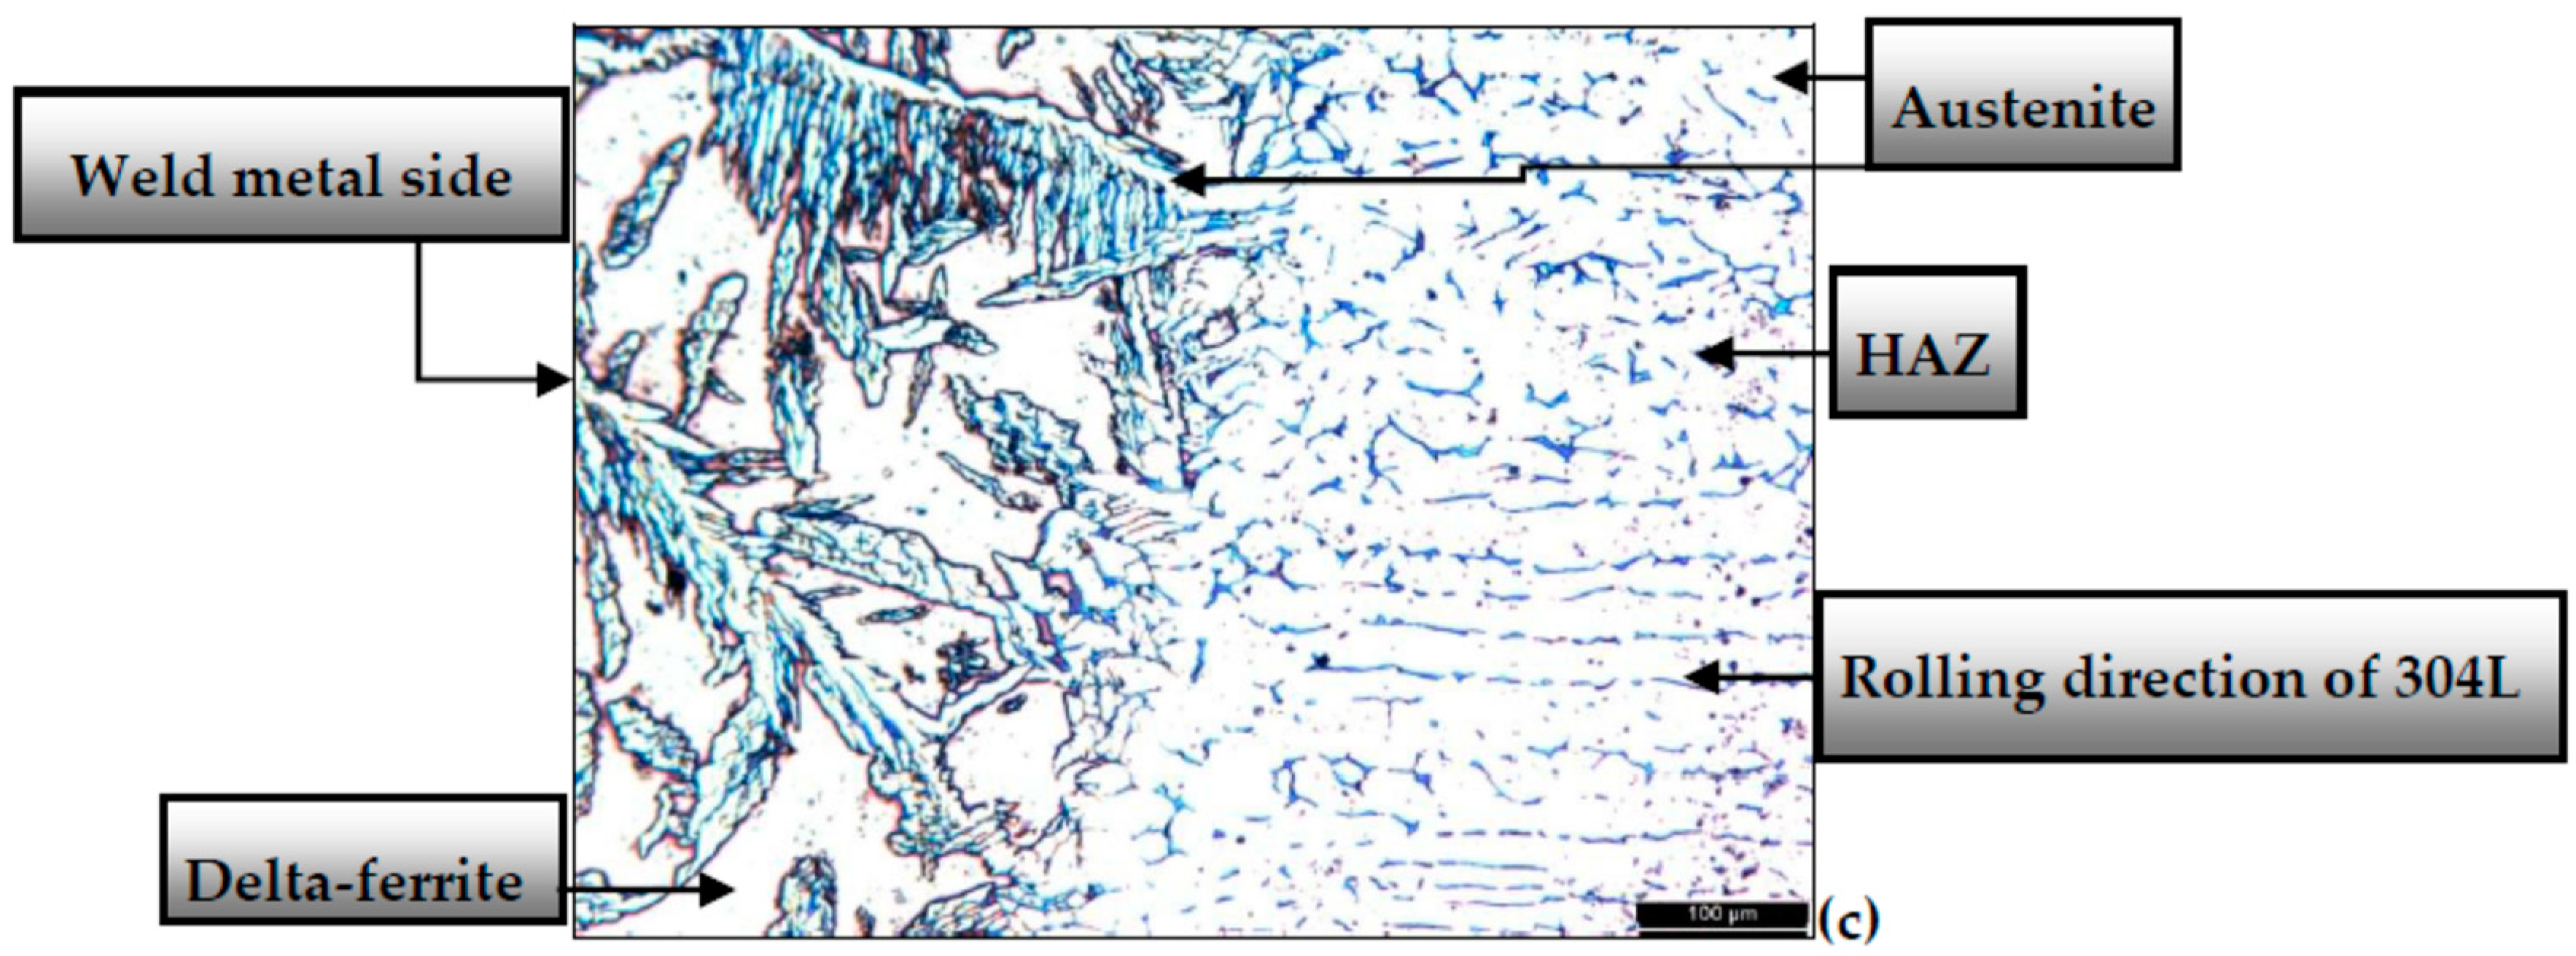
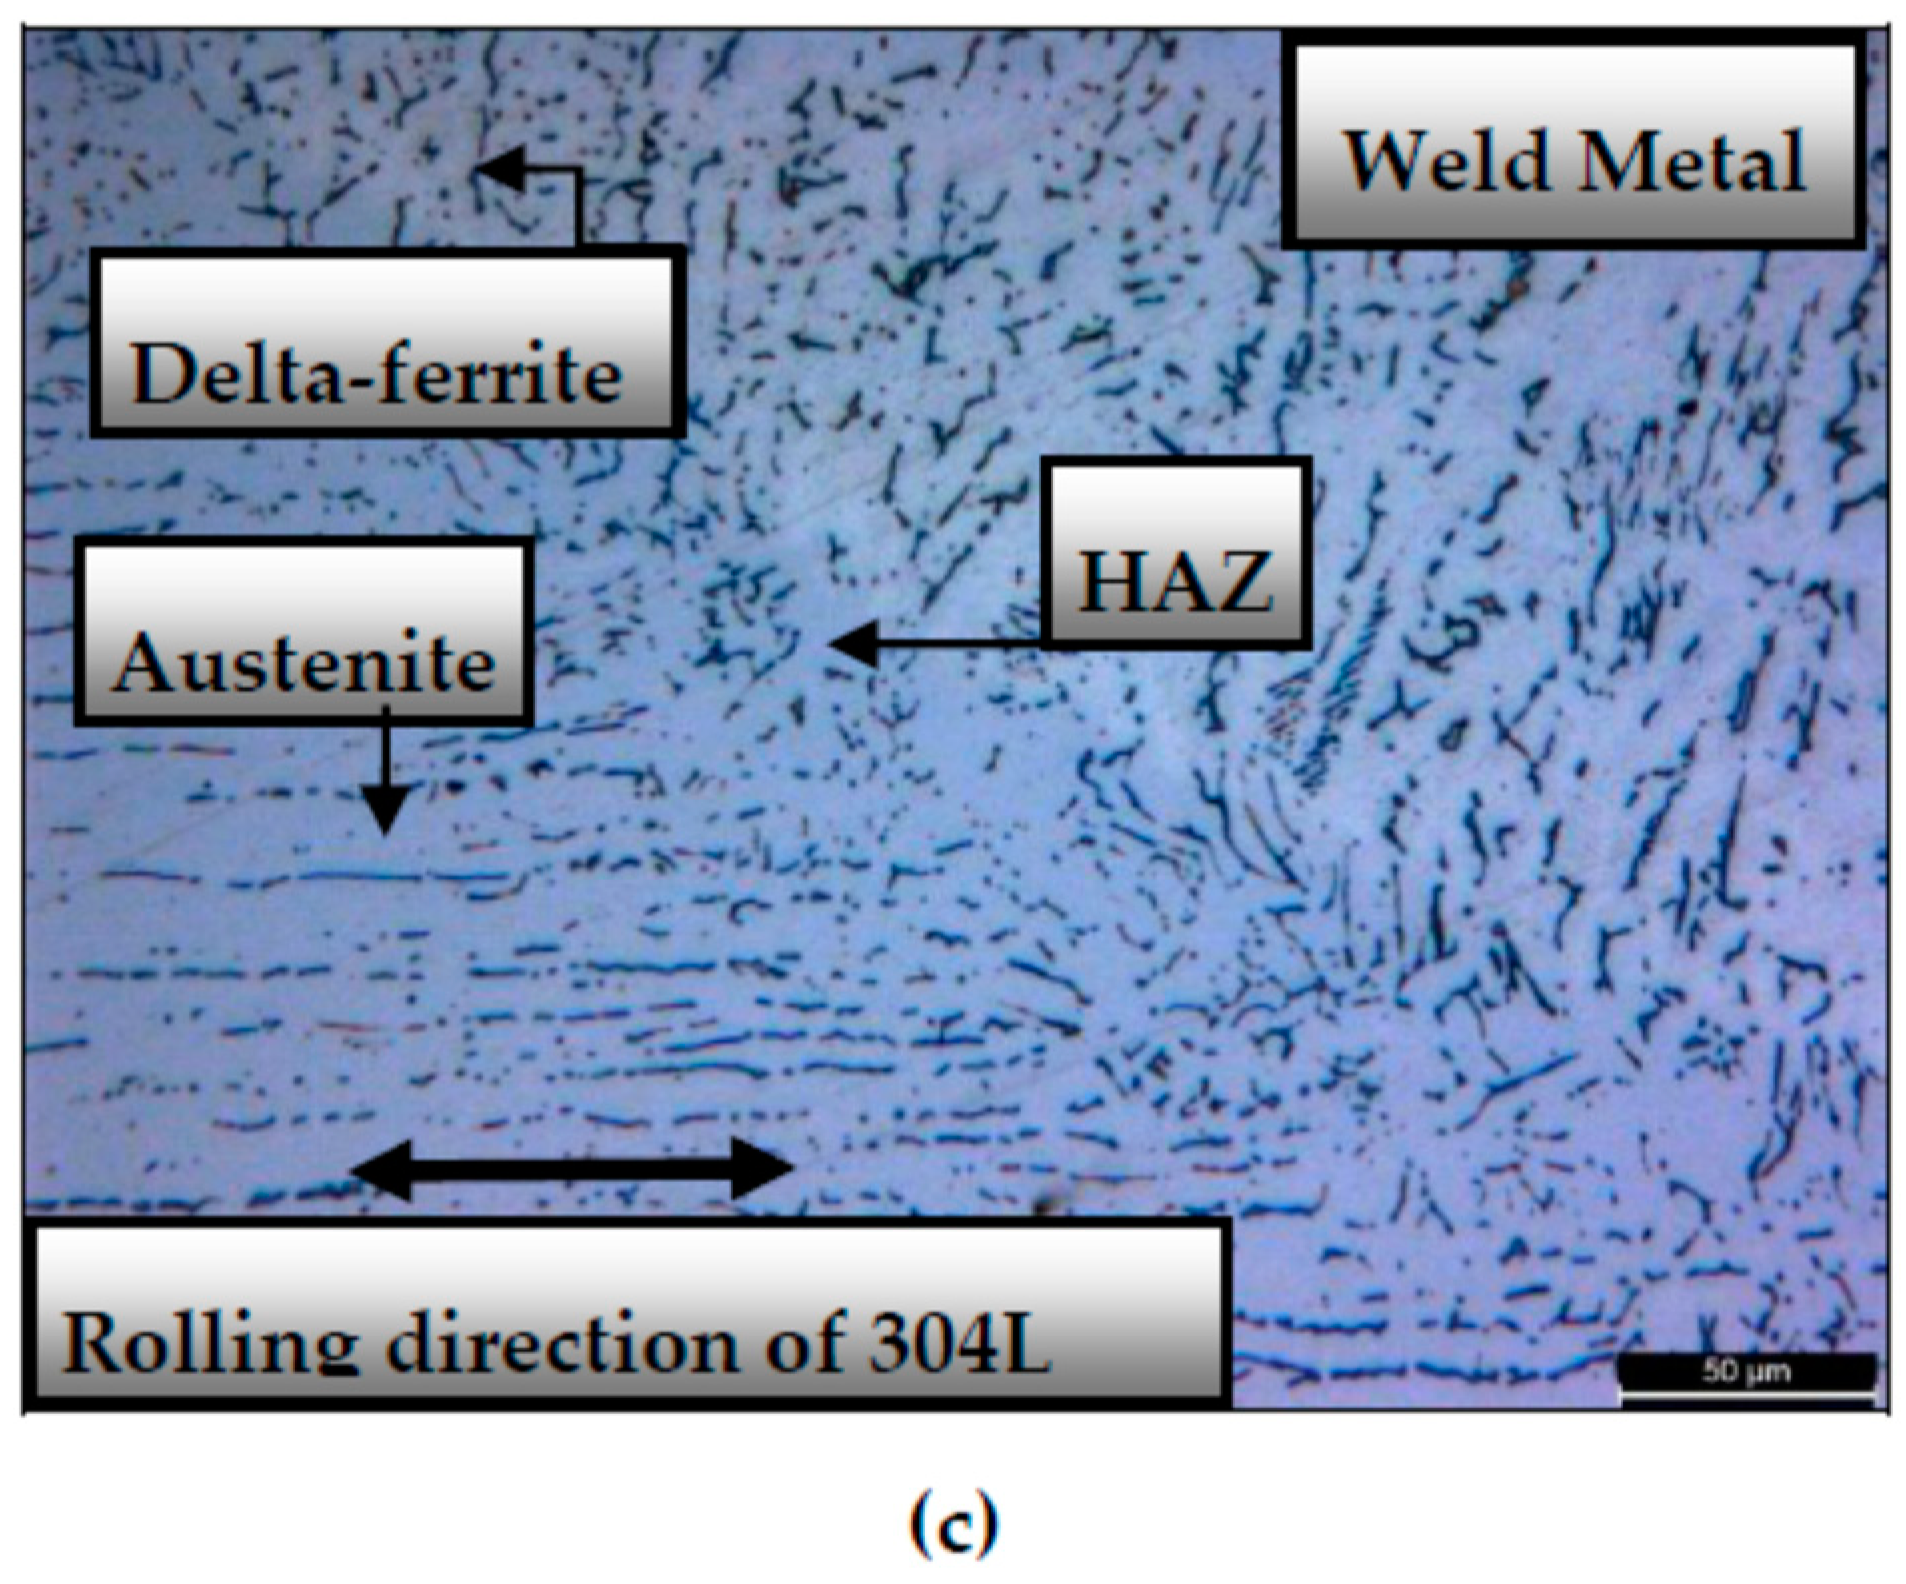
3.1.2. Microstructures of Samples Welded by ER312 TIG Rod

The microstructures of 304L and 420 stainless steel specimens joined with ER312 TIG Welding Rod is given in Figure 8.
The left hand side of Figure 8a consists of martensite (bright) phase with a few amount of grain boundary delta ferrite (darker) as a result of ER312 TIG rod chemical compositions reaction to NaOH etchant. The right side of Figure 8a is the weld metal region. The white and dendritic-like phase is austenite and the brown phase is delta-ferrite. Weld metal consists of austenite and delta-ferrite in Figure 8b. NaOH reacts with delta-ferrite but martensite phase needs much more time to react with NaOH so that martensite is not attacked (white contrast) as given in Figure 8a. Also austenite is not attacked from NaOH, so that it has exhibited white contrast like martensite that seen in Figure 8a,c.
While getting closer to the weld metal zone from the 304L HAZ region that is shown in Figure 8c, the rolling structure transforms into dendritic-like grains as a consequence of increasing welding heat input towards to the weld centre line.

3.1.3. Microstructures of Samples Welded by ER316L TIG Rod

The microstructures of 304L and 420 stainless steel specimens welded with ER316L TIG Welding Rod is given in Figure 9.
Dominant martensite phase (brownish) with a few amount of delta-ferrite (brighter phase) is observed in right hand side of Figure 9a. Chromium rich carbides are also visible like darker lines and dots. At the left hand side in Figure 9a, as a result of ER316L TIG welding rod, the dominant austenitic phase with a minority of delta-ferrite is observed. In Figure 9b, in weld metal, the dark fields are grain boundary delta ferrite phase and brighter (white) regions indicates the austenite phase. The rolling direction of 304L plate is visible in Figure 9c but as getting closer to weld metal the rolling structure of lines transforms into lamellar delta ferritic structure with white contrasted austenite phase.

3.1.4. Microstructures of Samples Welded by ER2209 TIG Rod

The microstructures of 304L and 420 stainless steel specimens welded with ER2209 TIG Welding Rod is given in Figure 10.
In Figure 10, as compared to the Figure 9, there has been no major differences noted about the specimen that welded by ER2209 TIG Rod. Hence, especially in Figure 10c, the weld metals grain boundaries (left hand side) seemed like more globular structure against to Figure 9c.

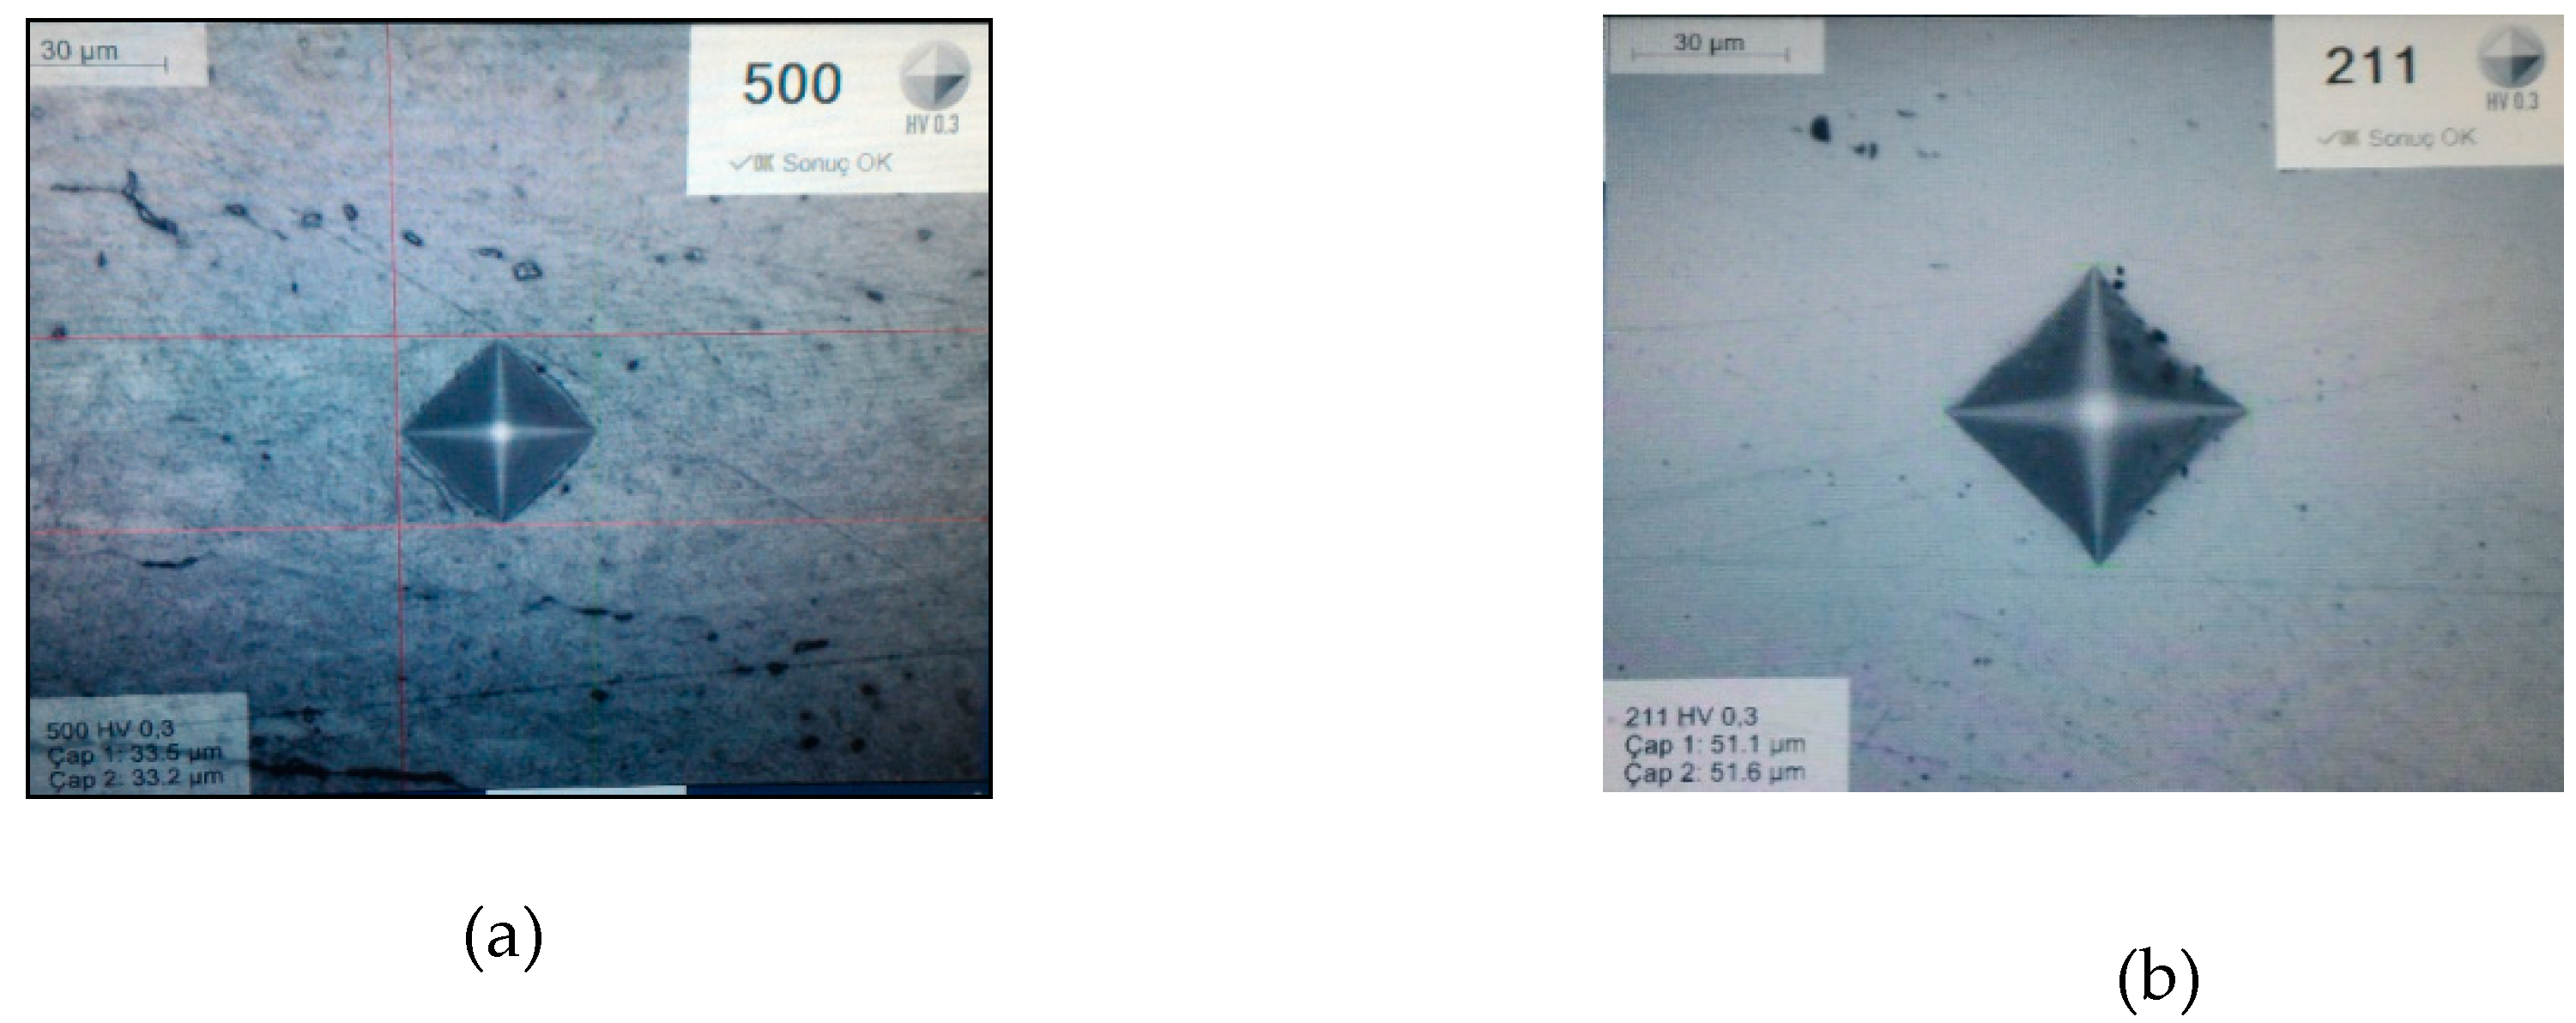
3.2. Micro-Hardness Inspections

3.2.1. Micro-Hardness Values of Base Metals

Base metals of both 304L and 420 stainless steel plates microvickers hardness values are determined as 211 HV0.3 and 500 HV0.3 respectively. The indents of microvickers testing instrument screen views of base metals are given in Figure 11 as examples.
Hardness values of base metals are determined after welding and stress relieving heat treatment operation.
Microvickers hardness of 420 quality stainless steel was recorded as higher than 304L stainless steel as shown in Figure 11a,b. 304L austenitic stainless steel expressed raw material hardness values after welding so that it cannot be strengthened by transformation of phases.

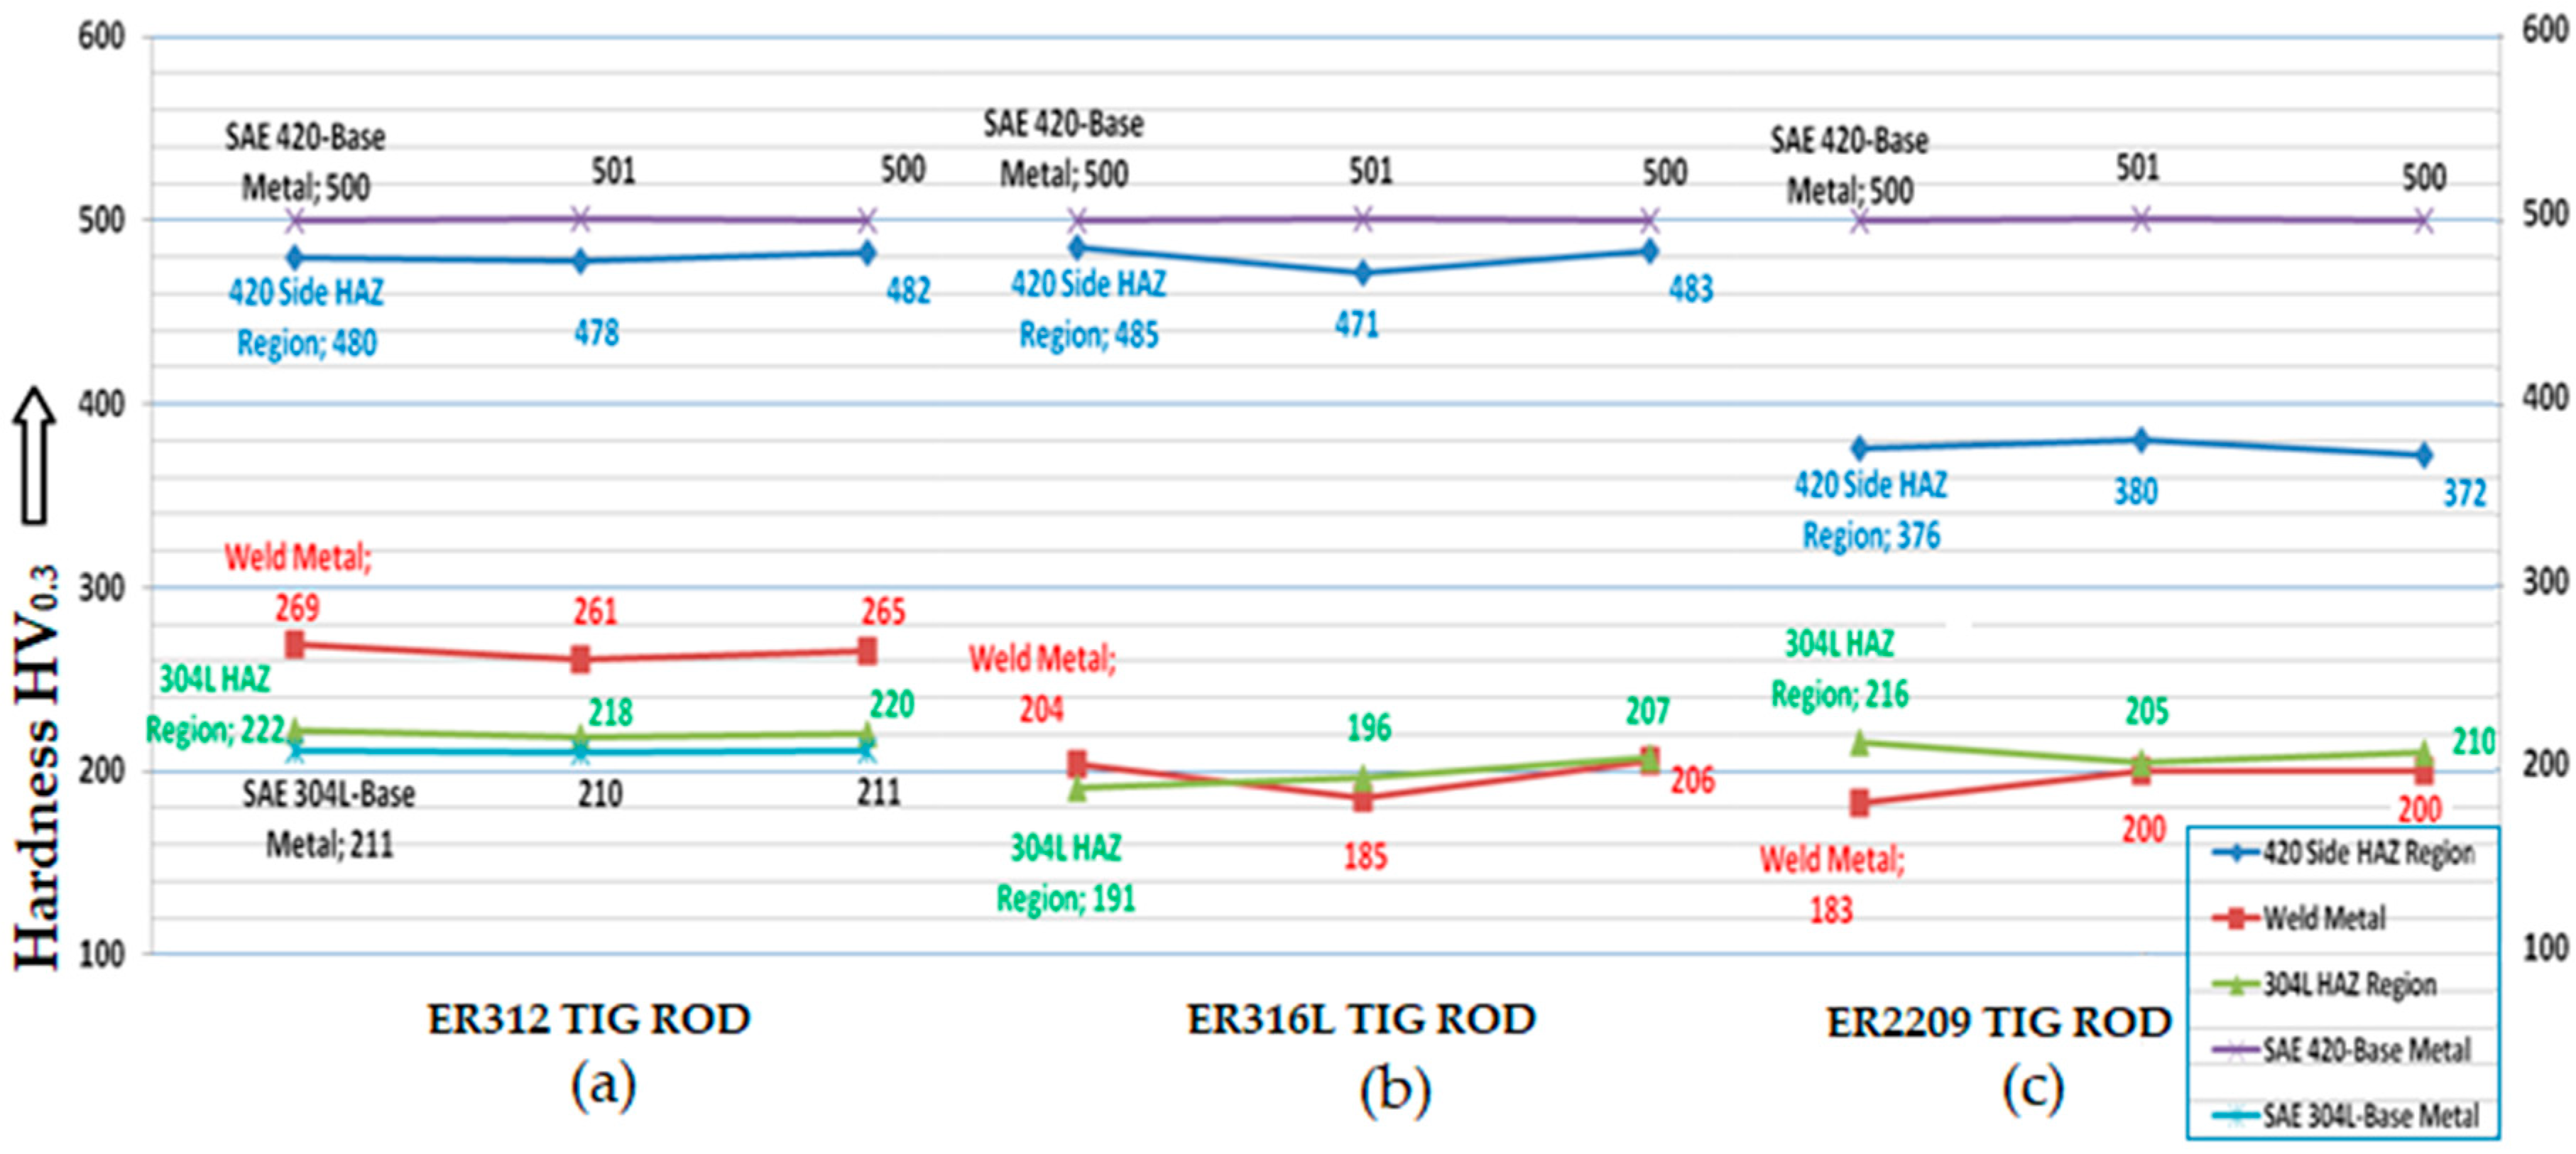
3.2.2. Micro-Hardness Values of Welded Samples

The microvickers hardness test results of specimens welded with ER312, ER316L and ER2209 TIG welding rods are given in Table 4.
As given in Table 4, 420 alloy base metal sides-HAZ exhibited the maximum micro hardness values (480 HV) in samples welded by both ER312 and ER316L TIG Rod, in consequence of higher carbon values of 420 and also TIG Rods. Whether the carbon content and cooling rates of weld region are high, the hardness values of weld metal and HAZ result also in high values just after welding operation. The cooling rates are provided within equal conditions ensured by pre-heating operation on all 420 alloy samples. Thus, the amount of elements basically like carbon that supports hardening is the key factor in determining the final hardness of weld metal in this research.
304L stainless steel has no opportunity to get hardened via transformation of austenite to martensite upon cooling in welding operations because of the chemical composition. Hence, the hardness values of 304L side-HAZ are detected maximum 220 HV0.3. 304L base metal hardnesses are determined 210 HV0.3 among all samples welded by each three TIG rod types.
Besides, the weld metal hardness of samples welded with ER312 TIG rod exhibited the highest mean value as 265 HV0.3. That is the result of ER 312 having the highest carbon and chromium contents that directly effects hardenability.
The effect of TIG rod type on microhardness values of weld zones is given as graphical scheme in Figure 12.
ER2209 TIG rod has the least amounts of alloying elements primarily carbon and manganese related to hardenability as compared with ER312 and ER316L TIG rods. Therefore the lowest hardness values of weldment are determined in samples joined with ER2209 TIG rod as graphically compared in Figure 12.

3.3. Impact Energy Tests

Charpy V-notch impact energy test results of 304L and 420 base metals are listed in Table 5. 4 individual impact energy test samples are prepared for each base metal.
As 420 alloy is transformation hardenable as a result of having hardening elements compared to 304L, 420 base metal exhibited higher hardness and lower impact energy values than 304L alloy. Whether the hardness values increases impact energy values decreases.
8 specimens are prepared for each TIG welding rod in order to verify the test results. Impact energy test results of welded joints are listed in Table 6.
According to the impact energy test results in Table 6, the maximum impact energy is obtained from the specimen welded with ER2209 TIG Rod while the lowest impact energy is determined in specimen welded with ER312 TIG Rod. None of the impact test samples has broken away into two pieces.
ER312 TIG rod includes a larger amount of carbon and chromium content as compared with the ER2209 and ER316L TIG rod so that dendritic carbides and martensite have a greater opportunity to occur in the weld region. As the amounts of martensite and carbides (especially chromium-carbides) increases, the hardness of weld metal and HAZ increases besides impact energies decreases. ER 2209 TIG Rods chemical composition ensures the final weld metal to be primarily as austenitic and delta ferritic in structure.

4. Discussion

The samples joined with the ER312 TIG welding rods exhibited a dendritic austenitic structure in weld metal as it includes no nitrogen, and the nitrogen makes the austenitic structure become more globular instead of a needle-like structure in the weld metal. The ER312 TIG rod has higher amounts of carbon and chromium than the other two TIG rod types, so that after the welding operation with cooling effects, the weld metal has the highest strength values by forming martensite and carbides as compared with other samples.
The samples joined with the ER316L and ER2209 TIG welding rods have exhibited globular austenitic microstructure in the weld metal zones as a consequence of including nitrogen in these TIG rods.
The microhardness values of 304L and 420 unwelded base metals are determined as 211 HV and 500 HV, respectively.
420 alloy base metal sides-HAZ exhibited the maximum microhardness values (480 HV) in samples welded by all three types of TIG Rods as a consequence of the higher carbon values of 420 alloy steel as compared to 304L base metal sides-HAZ regions. As the weld region carbon contents and cooling rates increase, the hardness values of the weld metal and HAZ also increase.
304L stainless steel alloy cannot be hardened by forming martensite from austenite upon cooling in welding operations because of its chemical composition. Therefore, the hardness values of 304L side-HAZ are determined maximum as 220 HV0.3.
The weld metal of samples welded by ER312 TIG rod exhibited the maximum microhardness mean value as 265 HV0.3 in consequence of ER 312 having the highest carbon and chromium contents that effects hardening performance.
The samples joined with the ER2209 TIG rod exhibited minimum microhardness values due to the composition of the TIG rod.
304L and 420 alloys unwelded base metals impact energy tests are resulted in approximately 39 joules and 24 joules respectively.
The samples joined with ER2209 TIG Rod displayed the highest impact energy values within all TIG Rods as this result is close to 304L original raw metal impact energy values.
In joining dissimilar 420 and 304L stainless alloys by TIG or other fusion welding techniques, corrosion behaviours of weldments will be investigated in future studies.

5. Conclusions

ER2209 TIG rod exhibited the maximum Charpy V-notch impact energy test values and the lowest microhardness test results among three types of TIG rods as a consequence of its chemical composition.
As compared to other two types of TIG rods, ER2209 TIG rod having the maximum nitrogen content made the austenitic microstructure become more globular after welding. Globular structure gains more ductile properties instead of dendritic lamellar and needle-like microstructures.
ER2209 TIG welding rod can be selected in welding of dissimilar 420 and 304L stainless alloys for safely qualified joining.

Author Contributions

Conceptualization, A.B.B; methodology, A.B.B.; validation, A.B.B; formal analysis, A.B.B. and M.G.M.; investigation, A.B.B. and M.G.M.; resources, A.B.B. and M.G.M.; data curation, A.B.B. and M.G.M.; writing—original draft preparation, A.B.B and M.G.M.; writing—review and editing, A.B.B; visualization, A.B.B. and M.G.M.; supervision, A.B.B.; project administration, A.B.B.

Funding

This research received no external funding.

Acknowledgments

The authors express their thanks to Gazi University and Kırıkkale University, Metallurgical and Materials Engineering Departments Laboratories for their precious supports about testing instruments.

Conflicts of Interest

The authors declare no conflict of interest.

References

  1. ASM Handbook, Volume 1: Properties and Selection: Iron, Steel and High Performance Alloys; ASM International: Geauga, OH, USA, 2005; pp. 1311–1312.
  2. Lippold, J.; Kotecki, D. Welding Metallurgy and Weldability of Stainless Steels; Wiley Interscience Publications: Hoboken, NJ, USA, 2005; pp. 56, 67–79, 141–143, 343–345. [Google Scholar]
  3. ASM Metals Handbook Volume 6: Welding Brazing and Soldering; ASM International: Almere, The Netherlands, 1993; pp. 37, 1111–1113, 1170, 1181.
  4. Kou, S. Welding Metallurgy, 2nd ed.; Wiley Interscience Publications: Hoboken, NJ, USA, 2002; pp. 37, 43. [Google Scholar]
  5. ASM Metals Handbook Volume 4, Heat treating; ASM International: Almere, Netherlands, 1991; pp. 1694, 1697.
  6. Vander Voort, G.F. ASM Handbook Volume 9: Metallography and Microstructures; ASM International: Materials Park, OH, USA, 2004; pp. 670–700. [Google Scholar]
  7. Brandes, E.A.; Brook, G.B. Smithells Metals Reference Book, 7th ed.; Butterworth, Heinemann, Reed Elsevier Plc Group: Oxford, UK, 1999; pp. 10–40. [Google Scholar]
  8. ISO 15614-1. Specification and Qualification of Welding Procedures for Metallic Materials-Welding Procedure Test-Part 1: Arc and Gas Welding of Steels and Arc Welding of Nickel and Nickel Alloys; International Organization for Standardization: Geneva, Switzerland, 2017. [Google Scholar]
  9. ASTM A370. Standard Test Methods for Mechanical Testing of Steel Products; ASTM International: West Conshohocken, PA, USA, 2017. [Google Scholar]
  10. ASTM E23-12c. Standard Test Methods for Notched Bar Impact Testing of Metallic Materials; ASTM International: West Conshohocken, PA, USA, 2012. [Google Scholar]
  11. EN ISO 9015-2. Destructive Tests on Welds in Metallic Materials, Hardness Testing, Part 2: Micro-Hardness Test on Arc Welded Joints; International Organization for Standardization: Geneva, Switzerland, 2016. [Google Scholar]
  12. ASTM A240/A240M. Standard Specification for Chromium and Chromium-Nickel Stainless Steel Plate, Sheet and Strip for Pressure Vessels and for General Applications; ASTM International: West Conshohocken, PA, USA, 2017. [Google Scholar]
  13. AWS A5.9. Specification for Bare Stainless Steel Welding Electrodes and Rods; American Welding Society: Miami, FL, USA, 2017. [Google Scholar]
  14. EN ISO 14343. Welding Consumables, Wire Electrodes, Strip Electrodes, Wires and Rods for Arc Welding of Stainless and Heat Resisting Steels, Classification; International Organization for Standardization: Geneva, Switzerland, 2017. [Google Scholar]
  15. Tavares, S.S.M. Failure of super 13Cr stainless steel due to excessive hardness in the welded joint. Eng. Fail. Anal. 2018, 51, 92–98. [Google Scholar] [CrossRef]
Figure 1. The dimensions of specimen couples for welding (mm).
Metals 08 00972 g001
Figure 2. Welded specimens (a) front sides; (b) back sides.
Metals 08 00972 g002
Figure 3. Test schedule on weldments according to ISO 15614-1 Standard.
Metals 08 00972 g003
Figure 4. Microhardness test points
Metals 08 00972 g004
Figure 5. Impact test specimen.
Metals 08 00972 g005
Figure 6. 304L base metal microstructure.
Metals 08 00972 g006
Figure 7. 420 base metal microstructure.
Metals 08 00972 g007
Figure 8. Microstructures of sample welded by ER312 TIG Rod (a) 420 side-HAZ (Heat Affected Zone) and weld metal; (b) weld metal; (c) weld metal and HAZ-304L side (scale: 100 µm).
Metals 08 00972 g008aMetals 08 00972 g008b
Figure 9. Microstructures of sample welded by ER316L TIG Rod (a) weld metal HAZ-420 side; (b) weld metal; (c) 304L side-HAZ and weld metal (scale: 50 µm).
Metals 08 00972 g009aMetals 08 00972 g009b
Figure 10. Microstructures of sample welded by ER2209 TIG Rod (a) 420 side, HAZ and weld metal; (b) weld metal; (c) weld metal, HAZ and 304L side (scale: 100 µm).
Metals 08 00972 g010aMetals 08 00972 g010b
Figure 11. Microvickers test screen views of base metals (a) 420; (b) 304L (scale: 30 µm).
Metals 08 00972 g011
Figure 12. The effect of TIG rod type on microhardness values of weld zones. Samples welded by (a) ER312; (b) ER316L; (c) ER2209 TIG Rods.
Metals 08 00972 g012
Table 1. Spectral analysis of 304L and 420 stainless steel plates.
MaterialElements (weight %)
CSiMnPSCrMoNiVNFeOthers
304L0.02640.3791.190.02110.003018.230.05428.010.1020.069571.60.9968
4200.2350.5060.6280.01330.002113.360.00670.1410.04180.022884.90.1433
Table 2. Elemental production analysis values of TIG welding rods.
AWS A5.9 [13], EN ISO 14343-A [14] TIG RodsElements (weight %)
CMnSiNiCrMoCuN
ER3120.151.60.48.830.70.20.14-
ER316L0.011.70.41218.22.60.100.04
ER22090.011.50.58.522.73.20.010.17
Table 3. TIG welding parameters.
TIG Welding RodWelding Current DC(−) (Amperes)Welding Voltage (Volts)Pure Argon Shielding Gas Flow (l/min)Welding Speed (mm/sec.)Welding Heat Input (Joule/mm)TIG Welding Electrode Type
(Ø2.0 mm)Root Pass2nd. Pass Root Pass2nd. PassRoot Pass2nd. PassRoot Pass2nd. PassRoot Pass2nd. Pass
ER31265–7090–959111062.332.16185.70326.72WT 20 (red) (2% Thoriated) Ø2.4 mm
ER316L2.292.18
ER22092.252.20
Table 4. Micro-hardness values of weldments.
Microvickers Hardness (HV0.3)
Test No.Specimen welded by ER312 TIG Rod
420 HAZWeld Metal304L HAZ
1480269222
2478261218
3482265220
Mean value480265220
Standard Deviation242
Test No.Specimen welded by ER316L TIG Rod
420 HAZWeld Metal304L HAZ
1485204191
2471185196
3483206207
Mean value480198198
Standard Deviation7.5711.598.18
Test No.Specimen welded by ER2209 TIG Rod
420 HAZWeld Metal304L HAZ
1376183216
2380200205
3372200210
Mean value376194210
Standard Deviation49.815.51
Table 5. Charpy impact energy values of base metal specimens.
Base MetalSpecimen No.kgmJOULE (kg·m2/s2)
304L13.8037.278
24.2041.202
34.1040,221
44.0039.240
Average Value4.0339.485
Standard Deviation0.171.68
42012.5024.525
22.5024.525
32.5024.525
42.4023.544
Average Value2.4824.279
Standard Deviation0.050.49
Table 6. Charpy impact energy values of welded specimens.
TIG Welding Rod Type
ER312ER316LER2209
Specimen No.kgmJOULE (kg·m2/s2)Specimen No.kgmJOULE (kg·m2/s2)Specimen No.kgmJOULE (kg·m2/s2)
12.8027.47 63.2031.39 114.6045.13
32.4023.54 63.2031.39 114.5044.15
32.5024.53 63.2031.39 124.4043.16
32.6025.51 73.5034.34 124.5044.15
42.9028.45 73.4033.35 133.3032.37
42.8027.47 83.2031.39 144.2041.20
52.7026.49 83.4033.35 144.5044.15
52.8027.47 103.6035.32 154.5044.15
Mean Value2.6926.36Mean Value3.337532.74Mean Value4.312542.31
Standard Deviation0.171.69Standard Deviation0.161.57Standard Deviation0.434.18

