Article

Modelling of Creep in Alloys Strengthened by Rod-Shaped Particles: Al-Cu-Mg Age-Hardenable Alloys

1
DIISM, Università Politecnica delle Marche, via Brecce Bianche, 60131 Ancona, Italy
2
Mechanical Engineering Department, ORT Braude College, P.O.Box 78, Karmiel 2161002, Israel
*
Author to whom correspondence should be addressed.
Metals 2018, 8(11), 930; https://doi.org/10.3390/met8110930
Submission received: 24 October 2018 / Revised: 7 November 2018 / Accepted: 8 November 2018 / Published: 10 November 2018

Abstract

:
In recent years, a creep model that does not involve adjustable parameters has been successfully applied to coarse-grained aluminum. The main feature of this model is that it is fully predictable. On the other hand, in the case of age-hardenable alloys, any physically-based creep model should take into account the changes in the volume fraction, size and distribution of strengthening precipitates, and the effect of grain size. With this aim in view, in this paper, the original model previously applied to single phase-alloys has been modified to describe the effects of the grain size and of the consequences of the high-temperature exposure on the strengthening role of precipitates. To this end, phenomenological equations describing the coarsening phenomena and their dependence on the applied stress have been introduced. The modified model has given an excellent description of the experimental behavior of an AA2024-T3 alloy tested at 250 and 315 °C and has provided a sound explanation of the difference observed when comparing the minimum creep rate obtained using two different testing techniques.

1. Introduction

AA2024 (Al-4%Cu-1.5%Mg) Aluminum alloy is one of the most widely used materials for airplane structures [1,2,3], and, as a result, has been deeply investigated to clarify the relationship between its microstructure and mechanical properties [4,5,6,7,8,9]. Although one could, at a glance, conclude that this material is now fully characterized, many researchers continue to study its high temperature response [10,11,12,13]. The crucial point in further investigating AA2024 is that, differently from its room temperature behavior, a direct correlation between its microstructure evolution during high-temperature exposure and creep response has been seldom achieved. An exception can be found in the few studies already mentioned [7,8,9], which, however, dealt with an annealed powder-metallurgy material and, for this reason, should be cautiously considered when dealing with a conventional wrought and aged alloy. In a recent investigation by the same authors of the study here presented [14], constant load creep experiments on an Alclad AA2024-T3 alloy were carried out at 315 °C, in most cases up to sample fracture. The experimental temperature, which was well above the maximum allowable limit usually prescribed when using AA2024 alloys, was specifically chosen to easily study the effects of microstructural instability on creep response. The T3 state consists in solution-treatment, cold working and natural ageing up to a “stable” condition. In fact, this combination of heat treatments and cold working is known to produce an extremely complex microstructure. Buchheit et al. [15], for example, found that 60% of particles between 500 and 700 nm in size were equilibrium S-phase (Al2CuMg), while Boag et al [16] found a multitude of phases of different chemistry, including S and θ (Al2Cu) phases and other particles containing Cu, Fe, Mn, Si and Mg. These studies specifically considered the corrosion properties of the alloy and were thus mainly focused on coarse particles. By contrast, creep response is dramatically influenced by the presence of nano-sized precipitates, while it is only marginally affected by coarse particles, which are mostly located on grain boundaries. Ageing at low temperature results in the formation of GPB zones, S’-metastable phase and, only in a later stage, of the stable S-phase [17]. In this context, the selection of a high temperature for creep testing in Reference [14] was focused on easing the transition of the intermediate phases to their equilibrium S-phase, possibly even during the heating stage of the experiments, before loading. With the same goal in sight, additional variable load experiments were carried out. In these tests, the initial stress was maintained until in proximity or well within the minimum creep rate range (as usual under constant load condition, the steady state was replaced by a more or less extended range during which the strain rate reached its minimum value) and then abruptly increased. Figure 1a plots the minimum creep rate dependence on the applied stress of the AA2024-T3 alloy at 315 °C in Reference [14].
The slope of the line describing this dependence, for the constant load experiments (CLE), was indeed very close to the theoretical 4–5 value for pure Al in power-law creep [20]. These results do not present notable deviations from the findings of previous studies [6], which reported similar trends in the same temperature regime. By contrast, the picture is different when the variable load experiment (VLE) data are considered. In this case, the minimum creep rate measured after a stress increase, which followed a relatively long exposure at 315 °C under a lower stress, was one order of magnitude higher than that measured by conventional tests. In addition, the datum for the constant load experiment at 25 MPa as well as the data for the variable load tests in which the initial stress was 25 MPa roughly align on a curve whose slope is substantially higher than 4–5. The major difference between these two curves is that one describes the minimum creep rate data measured at 315 °C in the minimum creep rate range after very different durations of exposure at high temperature under different stresses. By contrast, the other curve identifies a group of experiments for which the time of exposure was comparable and mostly spent under the same stress. In the variable load experiments, the test duration after load change was short, even negligible in comparison with the time during which the sample was stressed under 15 or 25 MPa. This difference is a key feature for the interpretation of the data presented in Figure 1a. AA2024, as mentioned above, is an age-hardenable alloy in which the major strengthening contribution is the presence of a fine distribution of secondary-phase precipitates. At the high temperatures investigated in Reference [14], the reasonable expectation was that the most important precipitate was S phase. This conclusion seems even more reasonable, since creep has been observed to substantially accelerate the kinetics of particles precipitation and evolution [10,11], leading to a faster formation of the equilibrium phase and to its coarsening even at lower temperatures. Thus, once precipitation is complete, coarsening rapidly takes place, greatly reducing the effectiveness of the particles in obstructing dislocation mobility, an effect that is more pronounced in those tests in which the material has experienced a high temperature for longer times.
Such complex microstructural evolution has obvious consequences on the mechanical response of the alloy. The minimum creep rate dependence on applied stress and temperature, for example, is usually described by a power law, modified to take into account the presence of precipitates [8,9,20]. The resulting phenomenological creep equation assumes the form
ε ˙ m = A D 0 L G b k T ( σ σ p G ) n exp ( Q L R T )
where A is a material parameter, k is the Boltzmann constant, G is the shear modulus, b is the length of the Burgers vector, R is the gas constant and n = 4–5. D0L and QL are, respectively, the pre-exponential factor and the activation energy in the Arrhenius equation describing the temperature dependence of the vacancy diffusion coefficient. The strengthening term σp in Equation (1) (frequently identified under the name of threshold stress) represents the effect of the interaction between particles and dislocations. It cannot be directly measured, but can be estimated by a best fitting procedure of experimental creep data, or, from the yield stress values. If the particle strengthening term is properly calculated, when the minimum creep rate is plotted as a function of the effective stress (σe = σ − σp), the experimental data align on a straight line of slope close to 4–5, as in pure Al (Figure 1b). Details about the calculation of the particle strengthening term are given in Reference [14], but it must be mentioned here that in the quoted work, it was assumed that fine precipitates consisted of nearly equiaxed particles as observed in References [7,8,9], which could not be actually the case in a material tested in T3 state. An analysis of Figure 1b, on the other hand, clearly shows that the strain rate in the alloy is orders of magnitude lower than the one measured in the pure metal [18] or in an Al-0.5%Mg alloy under an applied stress equivalent to the effective stress acting on AA2024. The most widely invoked explanation for this behavior [19] is that alloying severely reduces the stacking fault energy of the alloy [21,22]. Since the parameter A is traditionally considered to be proportional to the third-power of the stacking fault energy [20], a large reduction of this latter parameter [21,22] could indeed result in a decrease of one or even two orders of magnitude in the strain rate for a given effective stress. Yet, recent investigations present a quite different picture of the situation, since alloying actually only slightly reduces stacking fault energy, and this reduction is by far too modest to account for the dramatic reduction in the parameter A [23]. Thus, by Equation (1), one can still obtain an excellent description of the experimental data, but this description largely remains of a phenomenological nature, and any possible correlation with the microstructural evolution of the material is still based on weak bases.
The aim of this study is to reconsider the creep data regarding the AA2024-T3 alloy by applying the dislocation creep model originally developed for Cu [24,25,26,27] and austenitic steels [28] and already successfully used for the description of pure Al [18] and Al-Mg alloys [19].

2. Materials and Methods

Constant load creep experiments were carried out (details on the experimental procedure are given in [14]) on the AA2024 T3 alloy at 315 °C, in most cases up to sample fracture. Additional variable load experiments were carried out at the same temperature. In these experiments, the initial stress (25 MPa, except for one single case in which the initial stress was 15 MPa) was maintained until in proximity of the beginning of the minimum creep rate range. The test duration to reach the minimum creep rate range was estimated on the basis of the results of the CLE previously carried out under the corresponding stress. Then, the applied stress was abruptly increased and maintained up to sample rupture. Additional CLE were subsequently carried out at 250 °C, to broaden the range of experimental conditions and assess the effect of temperature.
The metallographic study was conducted by a Ultra Plus high-resolution scanning electron microscope (HRSEM) (Carl Zeiss AG, Oberkochen, Germany).

3. The Model

3.1. Equations for Dislocation Creep in Al: Strengthening Terms

The model, developed by Sandström [24,25,26,27,28], is based on the well-known Taylor equation, in the form
σ e = σ σ 0 = σ i + σ ss + σ ρ = σ i + σ ss + α m G b ρ
where m is the Taylor factor (m = 3.06 for fcc metals) and σρ = αmGbρ1/2 is the dislocation hardening term. The term σi represents the stress required to move a dislocation in the absence of other dislocations, and incorporates the effect of grain size, while α is a constant (in the following, α = 0.3 will be considered). The internal stress in pure Al σi was calculated by the equation
σ i = A y σ Al G + k hp d g
where σAl is the creep stress needed to obtain a given strain rate in coarse grained annealed pure Al under a given strain rate, dg is the grain size, khp is the Hall-Petch constant and Ay = 0.0042 [18]. Equation (3) was here rewritten as
σ i = A y ( σ - σ p σ SS k hp d g ) G + k hp d g
where σ is the stress under which the alloy creeps at the given strain rate; σp and σss are the particle and solid solution strengthening terms respectively (see below). The stress term in the first part of the equation was depurated from the effect of the grain size strengthening to avoid considering the same phenomenon twice. Once the particle and solid solution strengthening terms are known, Equation (4) can be simply handled, as soon as the Hall-Petch constant is determined (see Appendix A for details on this calculation).
Solute atmospheres reduce dislocation mobility; the term σss thus represents the stress required for dislocations to move through the viscous drag due to solute atoms (Cu and Mg in AA2024). The equation for drag stress was given in Reference [26], in the form
σ SS = v d c β 2 b Ω D Mg k T I ( z 0 )
where vd is the dislocation velocity, c is Mg atomic concentration, Da = D0Mg·exp(−Qa/RT) is the diffusivity of the solid solution elements in Al. The term I(z0) can be calculated by numerical integration of
I ( z 0 ) = 1 z 0 2 2 π 3 z 5 / 2 exp ( z ) d z
with
z 0 = β / b k T
The dislocation velocity could be expressed in the usual form
ε ˙ = ρ m b v d
where ρm is the mobile dislocation density, a fraction of the free dislocations. Equation (8) has an obvious important implication. In the AA2024 T3 alloy, for a given applied stress (or even effective stress), the strain rate is at least two orders of magnitude lower than the one observed in an Al-Mg alloy with a comparable content of elements in solid solution (roughly estimated in 0.5% at). Thus, the drag stress is correspondingly lower, that is, quite negligible in comparison with the other terms in Equation (2). On this basis, the assumption σss ≅ 0 will be used in the following.
Last, the threshold stress σp represents the strengthening contribution due to the interaction between fine particles and dislocations.

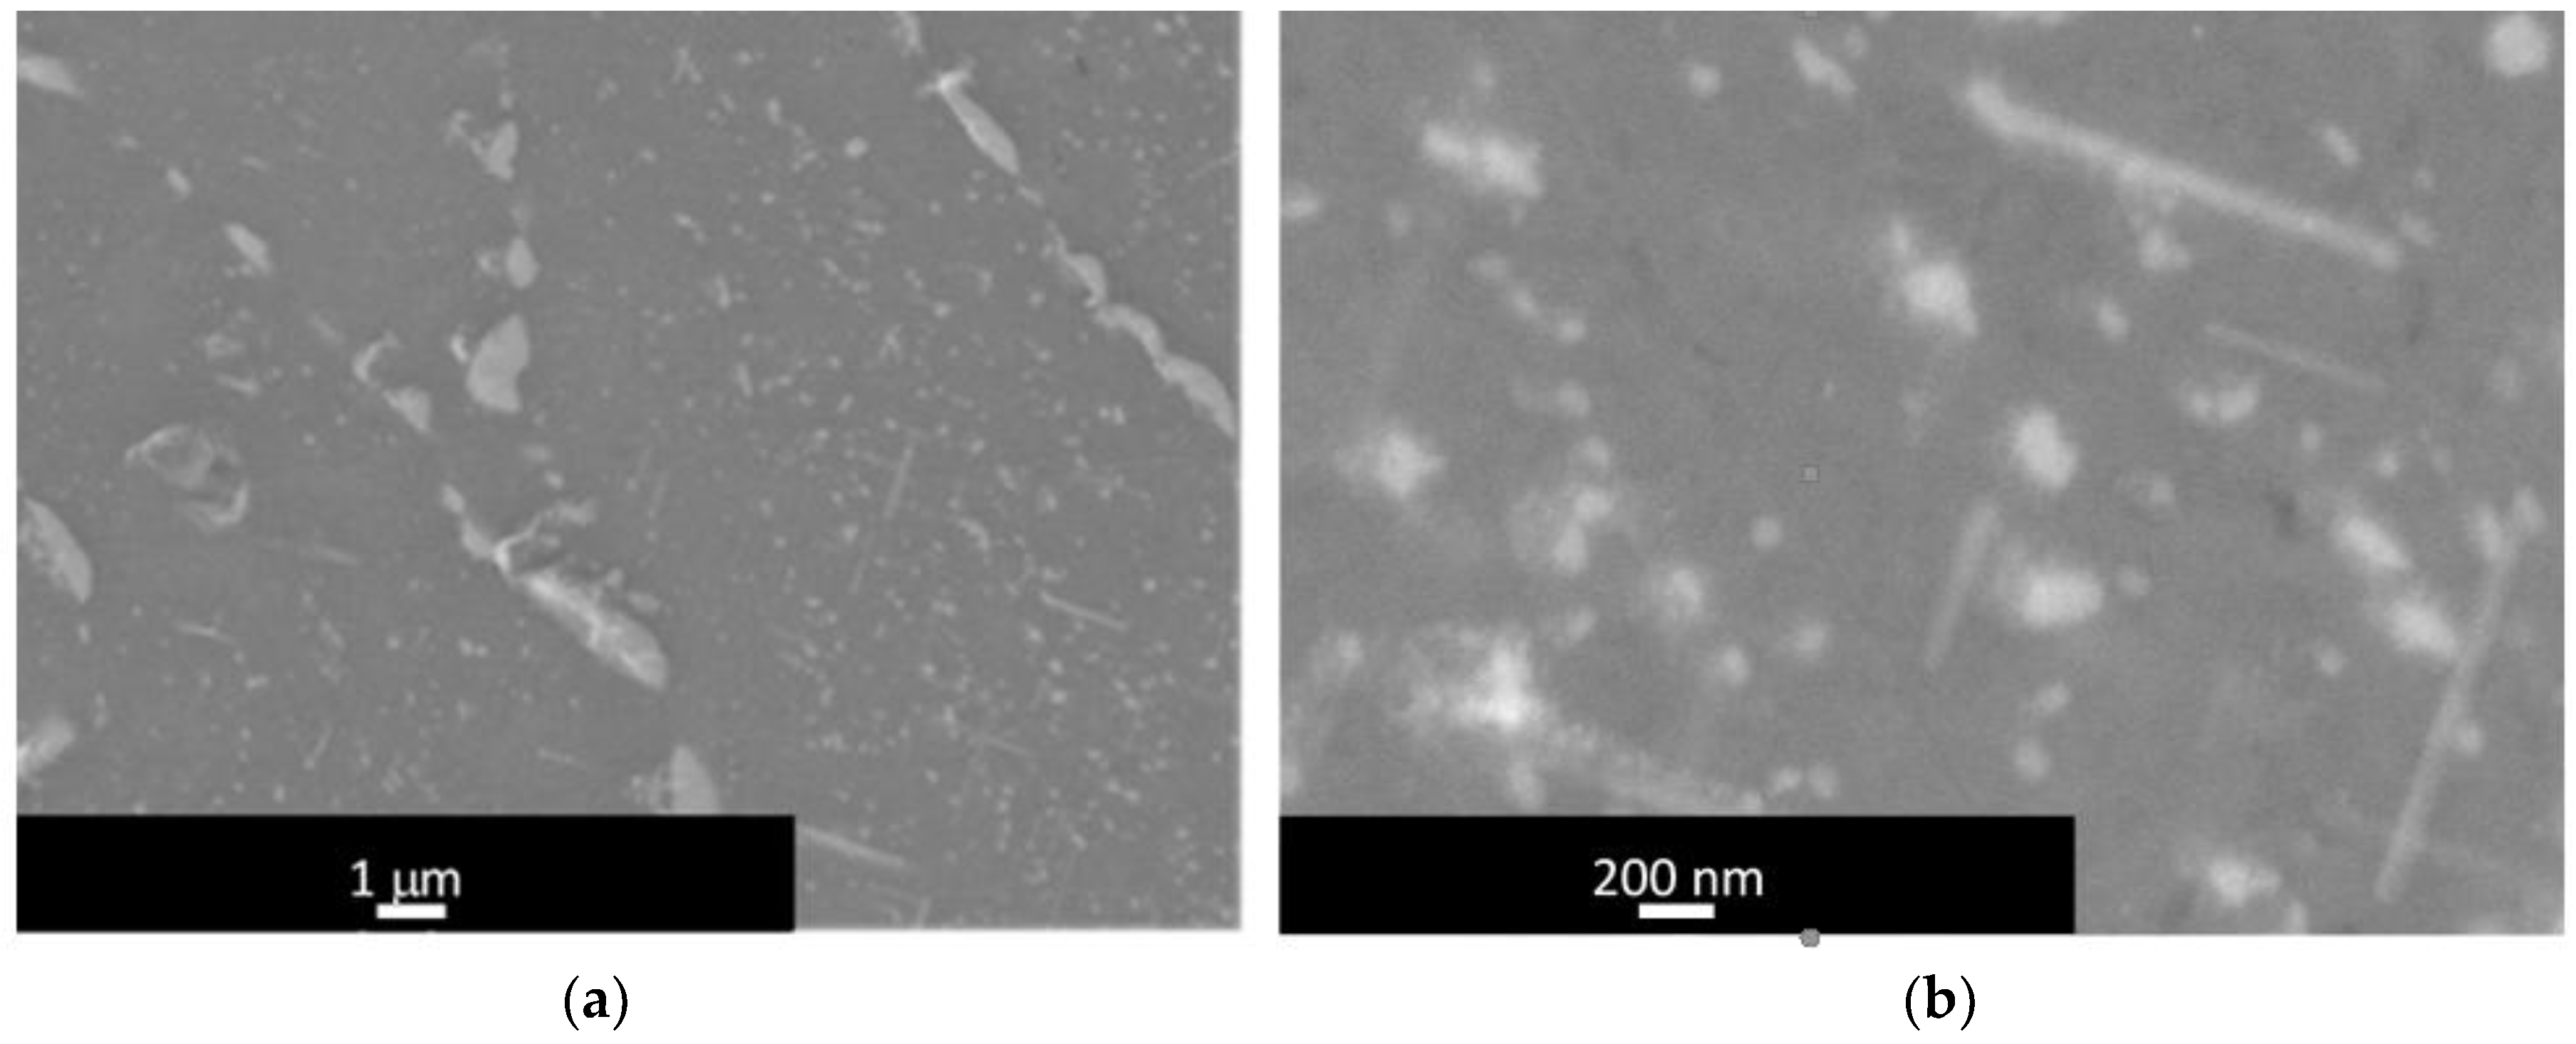
3.2. Nature of Particle Strengthening in 2024 Alloy

In aged AA2024 alloy, the aluminium matrix is reinforced with a densely spaced distribution of precipitates. In Al-Cu-Mg alloys with Cu:Mg atomic ratio close to 1, the precipitation sequence is described as
αss → Cu:Mg co-clusters/GPB zones → GPB2/S’’ phase → S’/S phase
where αss is the super-saturated solid solution, GPB are the Guiner-Preston-Bagaryatsky zones and the S’’ (GPB2) is an intermediate phase preceding the formation of the semicoherent S’ phase [29]. S’ and S phase have a very similar composition and crystal structure, but S’’ phase is thought to have limited influence on the strength of AA2024. Thus, following Khan et al. [29], it is possible to apply a simplified approach in which the precipitation sequence becomes
αss → Cu:Mg co-clusters → S phase
Cu:Mg co-clusters play a significant role in determining the material strength of the T3 state at room temperature, but are obviously unstable, and, when exposed to high temperatures for a sufficiently long time, they are replaced by the equilibrium S-phase, so their effect will be here neglected.
The equilibrium S-phase in the peak-aged state assumes the shape of non-shearable rods aligned in the {100} directions, although equiaxed precipitates can be also observed in the alloy after long creep exposure [14]. This represents a marked difference with the behavior of the annealed AA2024PM studied in References [7,8,9], where only nearly equiaxed or slightly elongated particles were observed to decorate grain interior.

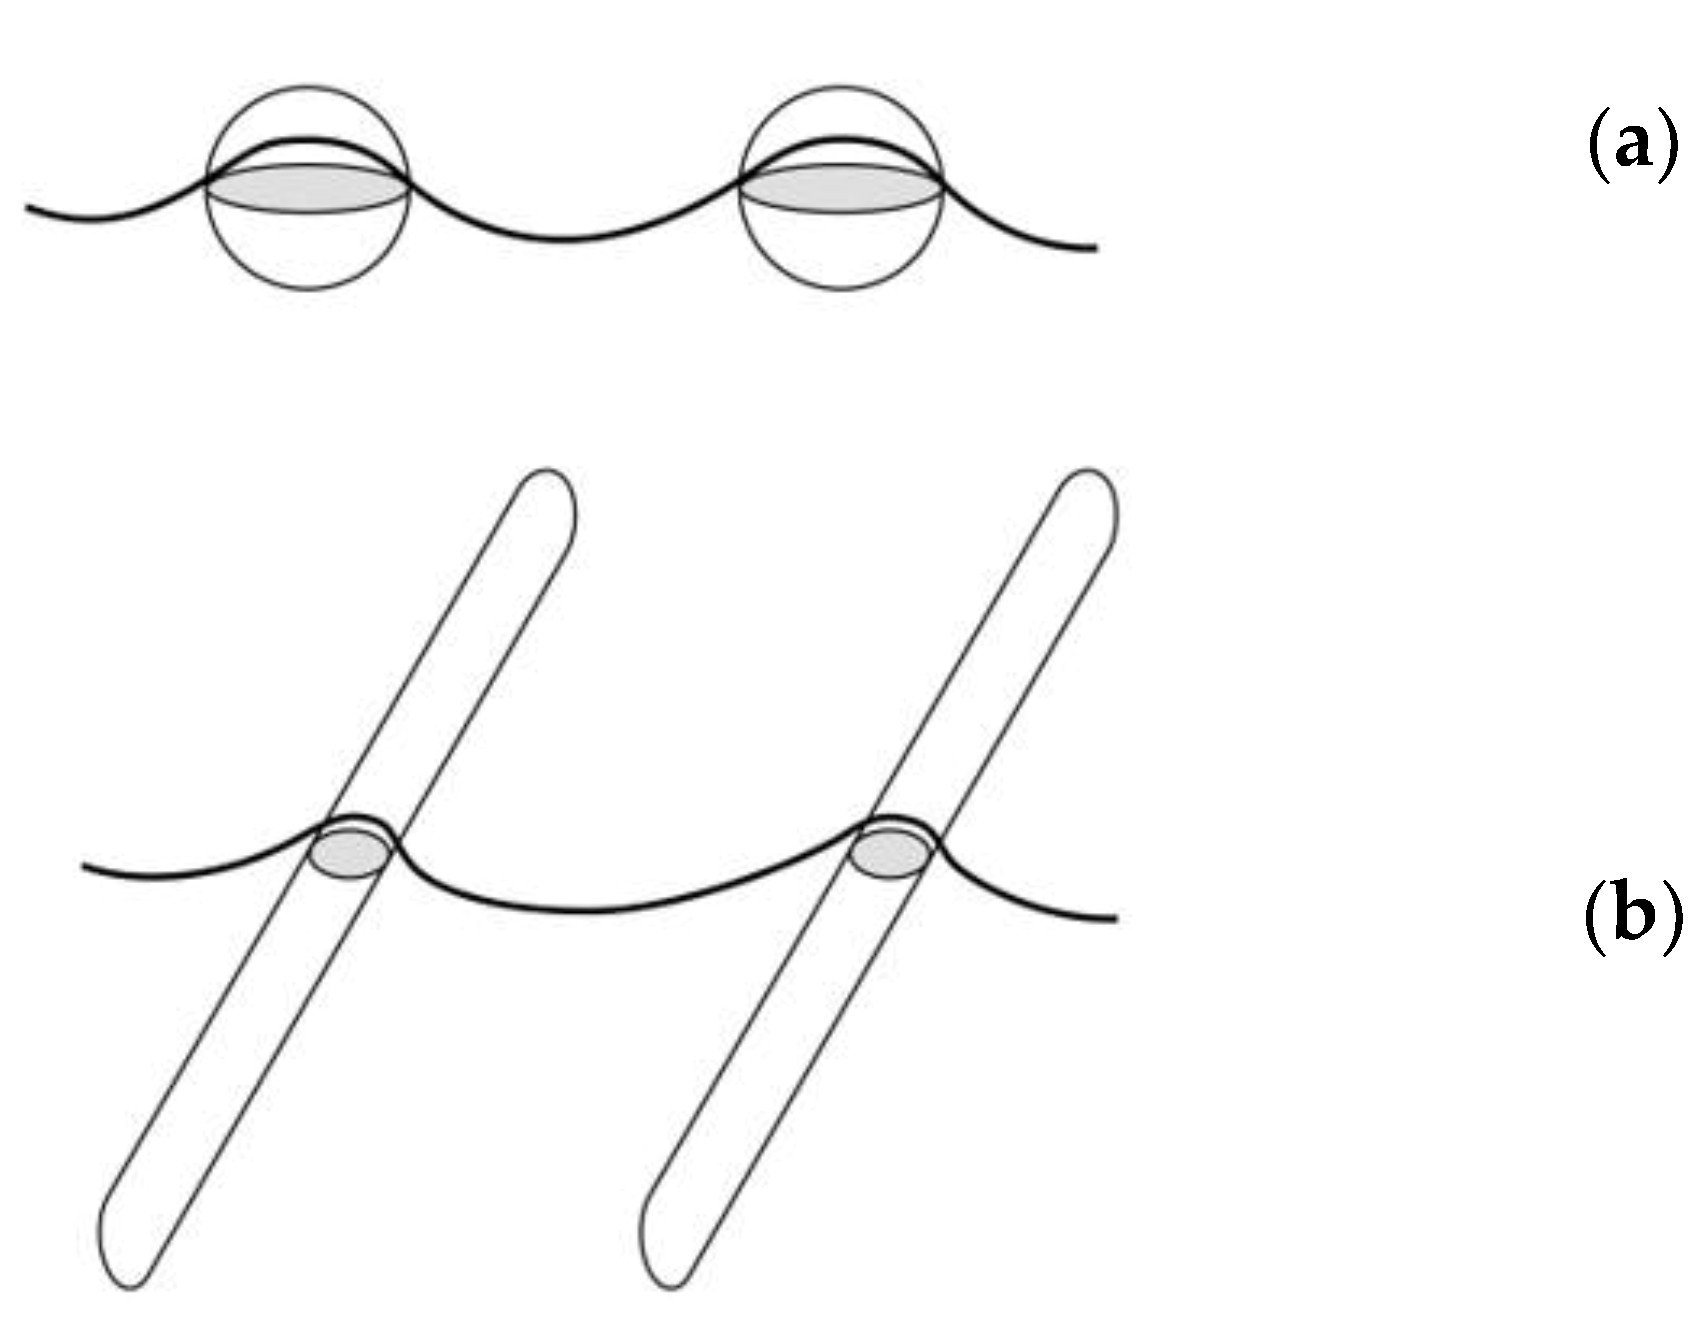
3.3. Models for Particle-Dislocation Interaction

At room temperature, and in the high-stress regime in creep, the particle-strengthening terms equals the Orowan stress. In the case of rod-like precipitates of diameter dp, oriented in {100} directions [29], the Orowan stress can be calculated as
σ Or = 0.112 m G b d p ln ( 1.316 d p b ) ( f 1 / 2 + 0.94 f + 1.44 f 3 / 2 )
where f is the volume fraction of the intraguanular precipitate and the interparticle spacing along the dislocation slip plane is
λ = d p π 4 f cos ( 54.7 ° )
Both Equations (9) and (10), which were obtained by Khan and co-workers on the basis of purely geometric considerations, will be used in this work without any corrections.
At high temperature and under low stresses, when Orowan by-pass cannot be operative, i.e., for σ < σOr, dislocations can overcome particles by climb (see Reference [20] and References [30,31] for detailed reviews of the different theories on this subject). Figure 2 shows a schematic depiction of a dislocation negotiating a particle array. In Figure 2a, the dislocation climbs over equiaxed particles of size ds. The climb resistance of the particles, a parameter which describes the rate of increase of the line length as the dislocation climbs over the precipitate, for general climb of spherical particles, can be expressed as [30,31]
R c = d 3 λ
The ratio between the threshold stress and the Orowan stress (denoted as αp in the following) then assumes the form [30]
σ p σ Or = α p = R c 2
which, for the aforementioned spherical particles, gives
σ p σ Or = 1 2 2 f 3 π
Equation (13) predicts that, for general climb, the particle strengthening contribution is a fairly low fraction of the Orowan stress (αp = 0.023 for f = 1%). This is in marked contrast with the older theories of local climb, which, although unlikely to occur due to the sharp bending of the dislocation at the particle interface, predicted a αp one order of magnitude higher [30]. This higher αp value, on the other hand, is much closer to the values calculated from experiments.
It has been recognized that the Friedel spacing for weak obstacles can be more appropriately used in the calculation, since the spacing along the dislocation line is larger than the mean planar spacing used for obtaining Equation (12). The ratio between the threshold stress and the Orowan stress becomes [30]
α p = ( R c 2 ) 1.5
Last, one could reasonably assume that there is a statistical distribution of particle spacings, and that the dislocation can find easy gates through the resulting particle dispersion [20]. In such a case, Equation (12) becomes
α p = R c 1.68 + R c
while Equation (14), which accounts for the Friedel correction, becomes [31]
α p = R c 1.5 2 2 + R c 1.5
Equations (12)–(16) predict that the threshold stress, for a given stable microstructure, is a temperature-independent function of the climb resistance, and, for a given particle geometry, a constant fraction of the Orowan stress. In fact, the proportionality between the particle-strengthening term due to climb and the Orowan stress was not taken as granted. Lagneborg [32] and later Rösler [33], for example, concluded that climb above non-interacting particles should result in a particle strengthening term which is proportional to the applied stress, the proportionality constant being almost independent from volume fraction and size of the precipitates. Thus, for cube-shaped particles inclined by 45° to the glide plane, the particle strengthening term should assume a value close to 1/3 of the applied stress [33]. In addition, Rösler concluded that high aspect ratio particles are not expected to exert a much higher strengthening effect than equiaxed precipitates, at least as long as the applied stress does not approach the Orowan stress.
Last, but not least, it has been supposed that a threshold stress could also arise from the detachment of the dislocations from the interacting surface of a non-coherent particle; the resulting stress required to detach the dislocation from the particle surface (σd) can then expressed by an equation in the form
σ p = σ d = σ Or 1 k d 2
where kd is the relaxation factor for the attractive dislocation/particle interaction [34,35]. This detachment stress could reasonably be assumed to coincide with the threshold stress estimated in several alloys, which in general is much higher than that the term associated to general climb, and much closer to the local climb one. In fact, the attractive interaction between particle and dislocation stabilizes the sharp curvatures of the dislocation line that are more typical of local climb model. In any case, we again observe a threshold stress proportional to the Orowan stress.
In Figure 2b, the dislocation climbs over rods, of diameter dr = 1/3 ds, with the same volume and interparticle spacing on the slip plane of the equiaxed precipitates in Figure 2a. The rod axis forms an angle ϕ with the slip plane. With the above-mentioned size of the transversal section, the rods have a length equivalent to 12 ds. Creep exposure of the 2024 T3 alloy actually results in the formation of even longer rods (Figure 3). At a glance, climb of a dislocation over these long rods requires a much higher increase of the line length than over an equiaxed precipitate of the same volume. Although this model did not predict a significant effect of the particle shape, at least for moderately elongated precipitates, Rösler observed that climb becomes more “local” as the dislocation climbs the rod. Thus, a dislocation whose slip plane cuts the rods halfway along its length will require a higher stress to overcome the obstacle, than another dislocation whose slip plane is closer to the rod tip. If the traditional view, in which σp is proportional to σOr, is maintained, one should thus reasonably, albeit qualitatively, conclude that, in the presence of strongly elongated precipitates, αp should be substantially higher than the value predicted for general climb of spherical particles, and much closer to the value for local climb.
The above analysis, which just takes into account the most convincing theories about the nature of the particle strengthening term, results in a σp value that is either proportional to the applied stress or to the Orowan stress. Yet, the proportionality constants, as they result from modelling, are temperature-independent, which is in contrast with experimental evidence that rather points toward a marked dependence on T of the particle-strengthening term. Thus, the models mentioned above require a fitting procedure of the experimental data to determine either αp or kd at a given temperature and for a given alloy. This fact implies that none of the models here presented have the nature of a model that does not requires any data fitting.

3.4. Rate Equation and Temperature Dependence

The evolution of dislocation density during straining can be expressed as [24,25,26,27]
d ρ d ε = m b L ω ρ 2 ε ˙ M τ l ρ 2
where ω is a constant, τl is the dislocation line tension (τl = 0.5Gb2), M is the dislocation mobility and L is the dislocation mean free path, i.e., the distance travelled by a dislocation before it undergoes a reaction. The first term on the right-hand side of Equation (18) represents the strain hardening effect due to dislocation multiplication, which is more rapid when L and, consequently, CL assume low values and/or the dislocation density is high. The second and third terms on the right-hand side of Equation (18) describe the effect of recovery. At high temperature, the last term in Equation (18) largely predominates on the second term. Since the main emphasis in this study is to describe what happens at high temperatures, Equation (18) can be simplified to
d ρ d ε = m b L 2 ε ˙ M τ l ρ 2
The dislocation mean free path should be calculated by considering that, in general, the obstacles that the mobile dislocations meet during slip determine the slip length. In the simplified model here presented, these obstacles can be other dislocations, grain boundaries and particles. Thus, in the presence of a densely spaced distribution of fine particles interacting with dislocations, giving the same weight to all the obstacles, the dislocation mean free path can be expressed in the form
1 L = 1 L + 1 λ + 1 d g ρ C L + 1 λ
Dislocation mobility in pure Al can be expressed as [24,25,26,27]
M = D 0 L b k T exp ( σ ρ b 3 k T ) exp { Q L R T [ 1 ( σ ρ R max ) ] }
where Rmax is the maximum strength of the alloy, tentatively quantified in pure Al as in Reference [18] as 1.5 times the ultimate tensile strength (RUTS) of the alloy at room temperature.

3.5. Solid Solution Strengthening Effect on Temperature Dependence of the Strain Rate

During slip, in Al-Cu-Mg alloys, the Cu and Mg atoms still in solid solution have to jump in and out of the atmospheres that spontaneously form around dislocations. Thus, an additional term describing the energy necessary to overcome this barrier must be added to the activation energy, in the form [28]
U ss = β R b k
with
β = 1 3 π ( 1 + ν ) ( 1 ν ) b G Ω δ
where ν is the Poisson’s ratio (=0.3 in Al), Ω is the average Al-atomic volume and δ is the volume atomic misfit. The formulation of dislocation mobility alloys containing atoms in solid solution thus becomes
M D 0 L b k T exp ( σ ρ b 3 k T ) exp { Q L R T [ 1 ( σ ρ R max ) 2 ] } exp ( U ss R T )

4. Modelling of the Minimum Creep Rate Dependence on Applied Stress in AA2024 T6-T3 Alloy

4.1. The Role of Particle Size and Distribution

Figure 4 plots the variation of the yield stress at room temperature for the AA2024 alloy in the T3 and T6 states, after holding at these temperatures for different durations [36]. The plot clearly shows that: i. the room temperature strength of the unexposed alloy in the T6 state is higher; ii. exposure at high temperature causes a rapid decline in the yield stress.
Although, after exposure at 315 °C, both the T3 and T6 states exhibit the same response after just 5 h (data points overlap), at a lower temperature the situation is very different. After exposure at 260 °C, the alloy in the T3 state has a yield stress which is ostensibly higher that the peak-aged material. This difference can be easily rationalized by considering that, upon heating, the alloy in the T6 state rapidly overages for the coarsening of the S-phase precipitates. In the T3 state, the alloy is in an underaged condition, and even contains a relatively high dislocation density, introduced by stretching after solution treatment. Upon heating, this microstructure evolves, the Cu:Mg co-clusters and the other intermediate phases dissolve and are progressively replaced by the equilibrium phase [37]. Thus, overageing is somewhat delayed in the T3 state (20–30 h at 260 °C). This mechanism is by far more rapid at 315 °C and the T3 and T6 states exhibit the same yield strength.
The first point to be analyzed in a material with an unstable microstructure such as the AA2024-T6 alloy is thus, the effect of the time of exposure on the size and distribution of the S-phase strengthening precipitates. Since the grain-boundary particles cannot be expected to directly interact with dislocations, only the role of intragranular precipitates will be considered in the following. In particular, it will be here assumed that these particles are predominantly rod-shaped S-phase, as in the Al-Cu-Mg alloy studied by Rockenhäuser et al [38]. These authors investigated the effect of an exposure at 190°C, both in stressed and unstressed conditions, on an alloy with an initial population of very fine S precipitates. In particular, they analyzed the evolution of the diameter of the S-phase rods, which was 3.4 nm in the aged (195 °C-28 h) initial state.
The traditional equation [39,40] for describing the particle coarsening of a population of particles of initial diameter d0p, after an exposure of duration t at a given temperature T, has the form
d p 3 = d 0 p 3 + k g t exp ( Q a R T )
where kg is a constant, and Qa is the activation energy for the diffusion of the constituent elements in the matrix. The experimental data in Reference [38] can be easily used to estimate kg at 190 °C. Then, taking Qa = 134 kJ/mol, which is the activation energy for the diffusion of Cu in Al [41], Equation (25) can be directly used to estimate the size of the rod diameter after prolonged exposure to high temperature. A long-time exposure would result in S-particle coarsening, and, if the volume fraction of intragranular precipitates does not change, in pronounced softening, i.e., in a reduction of the yield strength.
Let one suppose that the S-phase coarsening law obtained above is valid for the AA2024 alloy. The yield stress, i.e., the stress measured at the early beginning of plastic straining, could be properly described by Equation (2) in the form
σ y = σ i + σ ss + σ p + α m G b ρ
In addition, one can reasonably assume that
σ y a σ i + σ ss + α m G b ρ
whereis σ y a is the yield strength of the matrix, that is, of an alloy with comparable levels of impurities and elements in solid solution, and with massive particles on grain boundaries, thus giving
σ y = σ y a + σ p
The combination of Equations (27) and (28) can then be used to estimate the yield stress at 260 and 315 °C of an alloy strengthened by a constant volume fraction f of intragranular S-particles of initial diameter d0 = 3.4 nm [38].

4.2. Quantification of Particle Strengthening Effect

As mentioned above, Figure 4 refers to tensile tests carried out at room temperature, i.e., in a condition in which climb is hardly operative. Thus, the particle hardening term should be equivalent to the Orowan stress (αp = 1). Taking σ y a = 75 MPa (yield strength of Alclad AA2024-O from [36]), the curves in Figure 4 were obtained with f = 0.9 and 0.6% at 260 and 315 °C respectively. The slight overestimation of the strength after very long exposure is an effect of the corresponding overestimation of the strength of the matrix, since even a moderate grain growth should result in a σ y a somewhat lower than 75 MPa. The agreement of the model curves with the data for the T6 state is remarkable, albeit one could wonder if the computed volume fraction of intragranular precipitates is realistic, or rather grossly underestimated. As a matter of fact, the volume fraction of the S-phase could be as high as 4% at 260 °C [37] and be accompanied by substantial amounts of other intermetallic phases. Experimental evidence indeed demonstrates that holding at high temperature results in a strong increase in the number of coarse particles at grain boundaries. Figure 3a shows chains of coarse precipitates, formed during creep exposure, which clearly delineate the grain boundaries. These coarse particles are partly equilibrium S-phase precipitates [15], which in this form do not effectively contribute to the strength. One can thus conclude that this approach gives a reliable description of the softening phenomena associated with intragranular-particle coarsening.
Figure 5 plots the yield stress at 260 and 315 °C of the AA2024 alloy in the T3 and T6 states, after holding at these temperatures for different durations [36]. Thus, the data refer to the sample with the same microstructures considered in Figure 4, but tested at the annealing temperature. The use of αp = 1 results in strongly overestimated values of the yielding (again the strength of the matrix was assimilated to that of an Alclad AA2024-O alloy tested at the same temperatures after similar durations of high-T exposure [36]). The curves in Figure 5 were then obtained with αp = 0.7 and 0.55 with f = 0.9 and 0.6% at 260 °C and 315 °C respectively. These values of αp are much higher than the one predicted by the local climb model of equiaxed particles, in agreement with the qualitative conclusions drawn in Section 3.3.

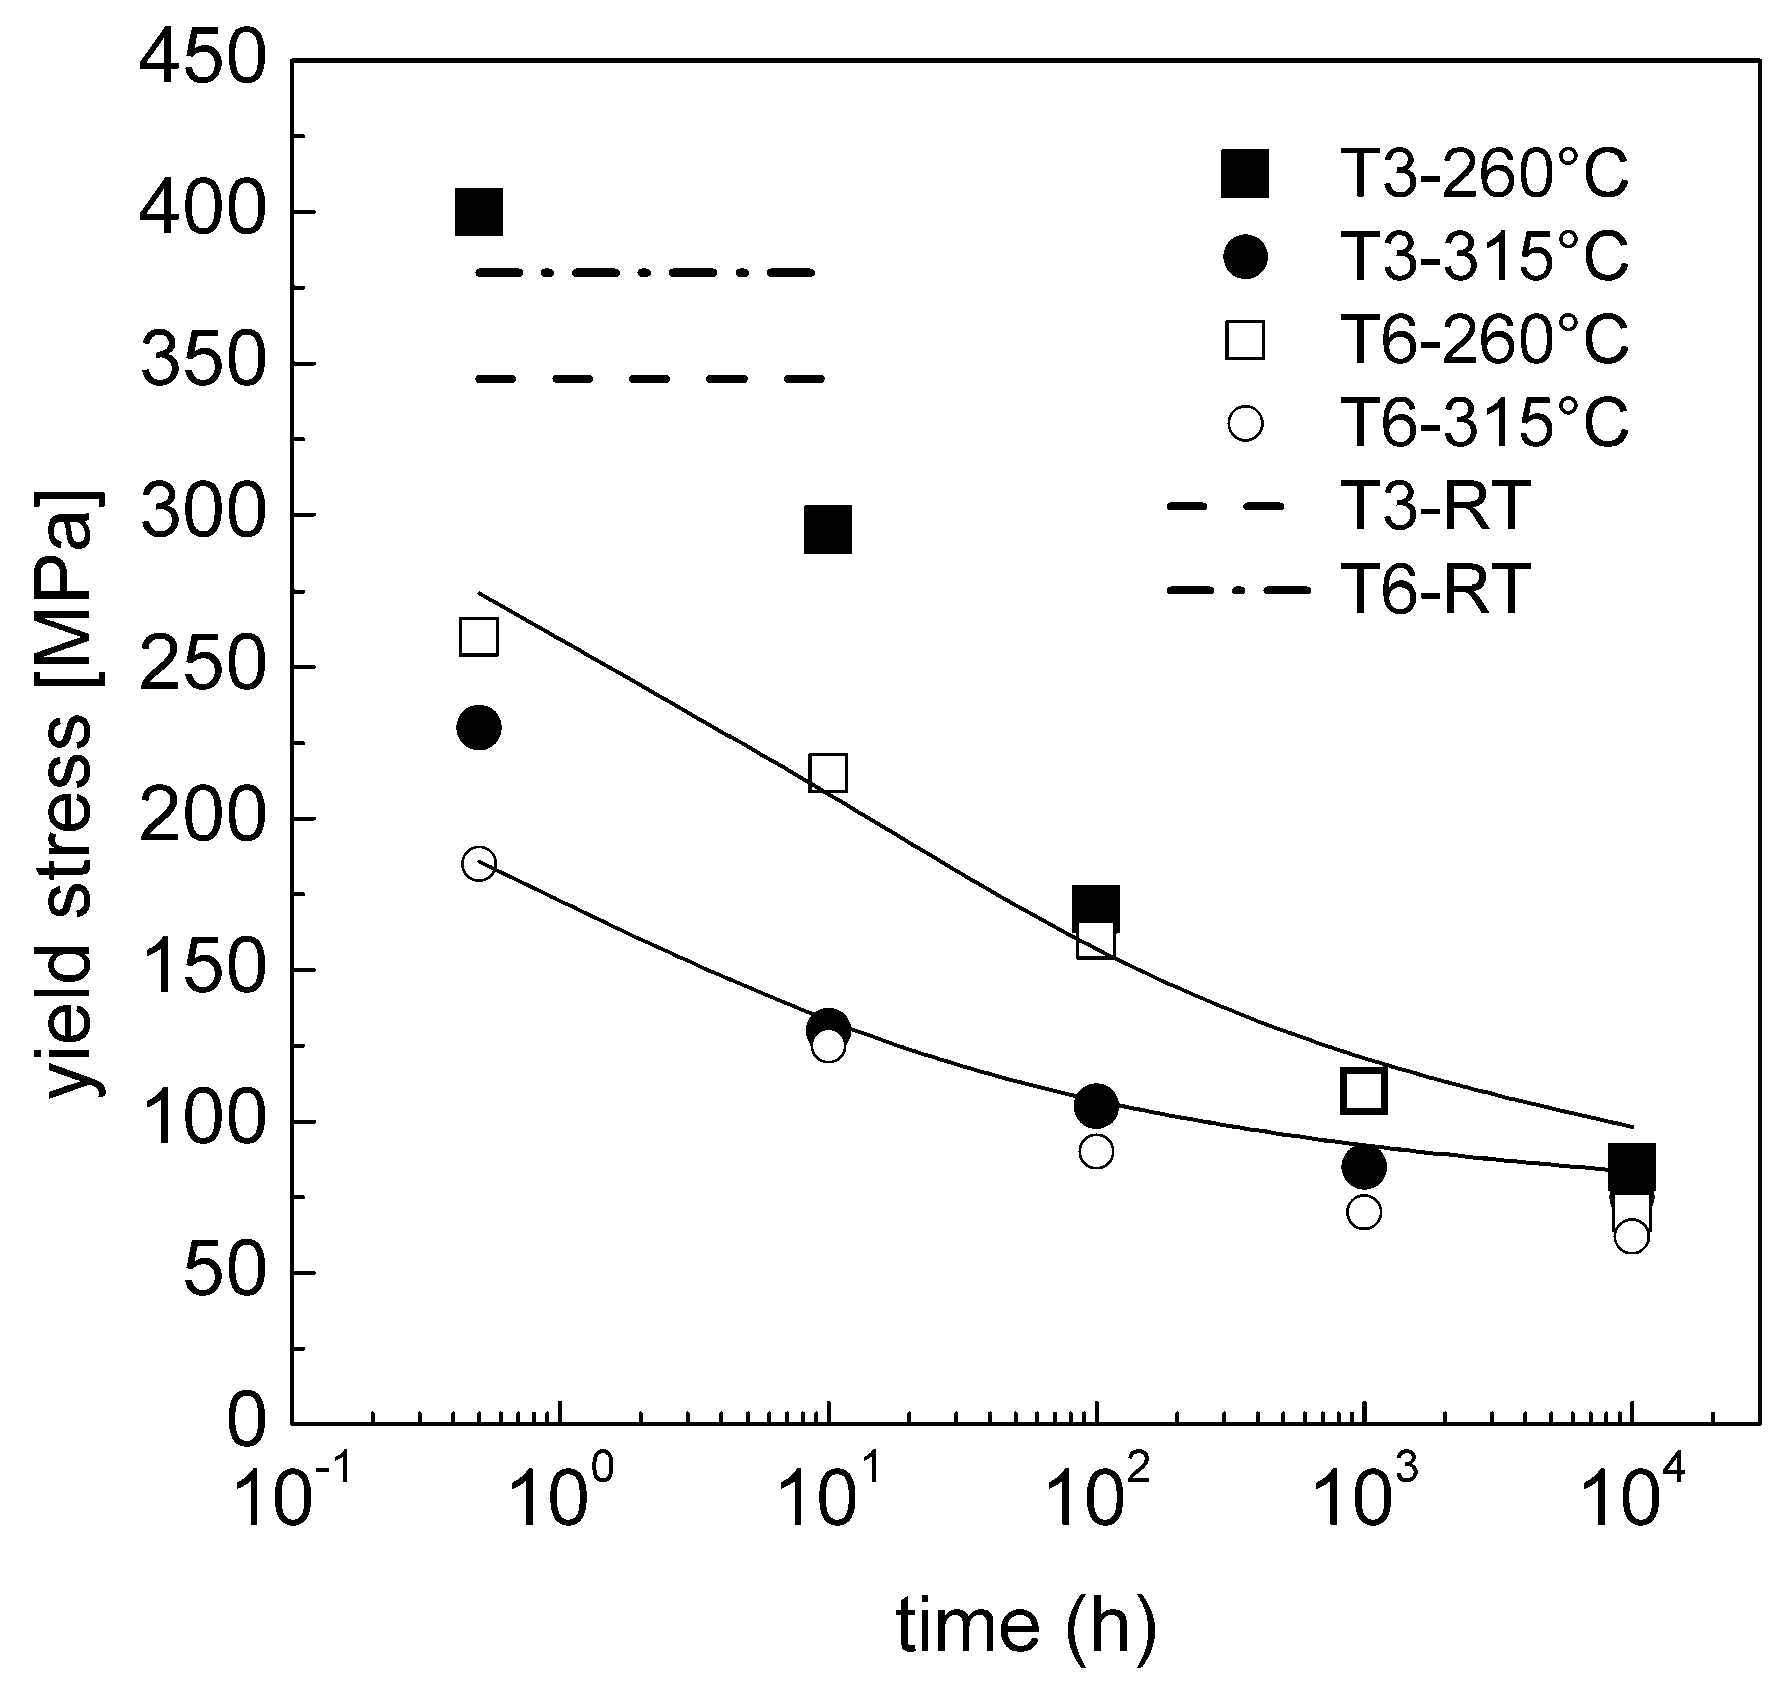
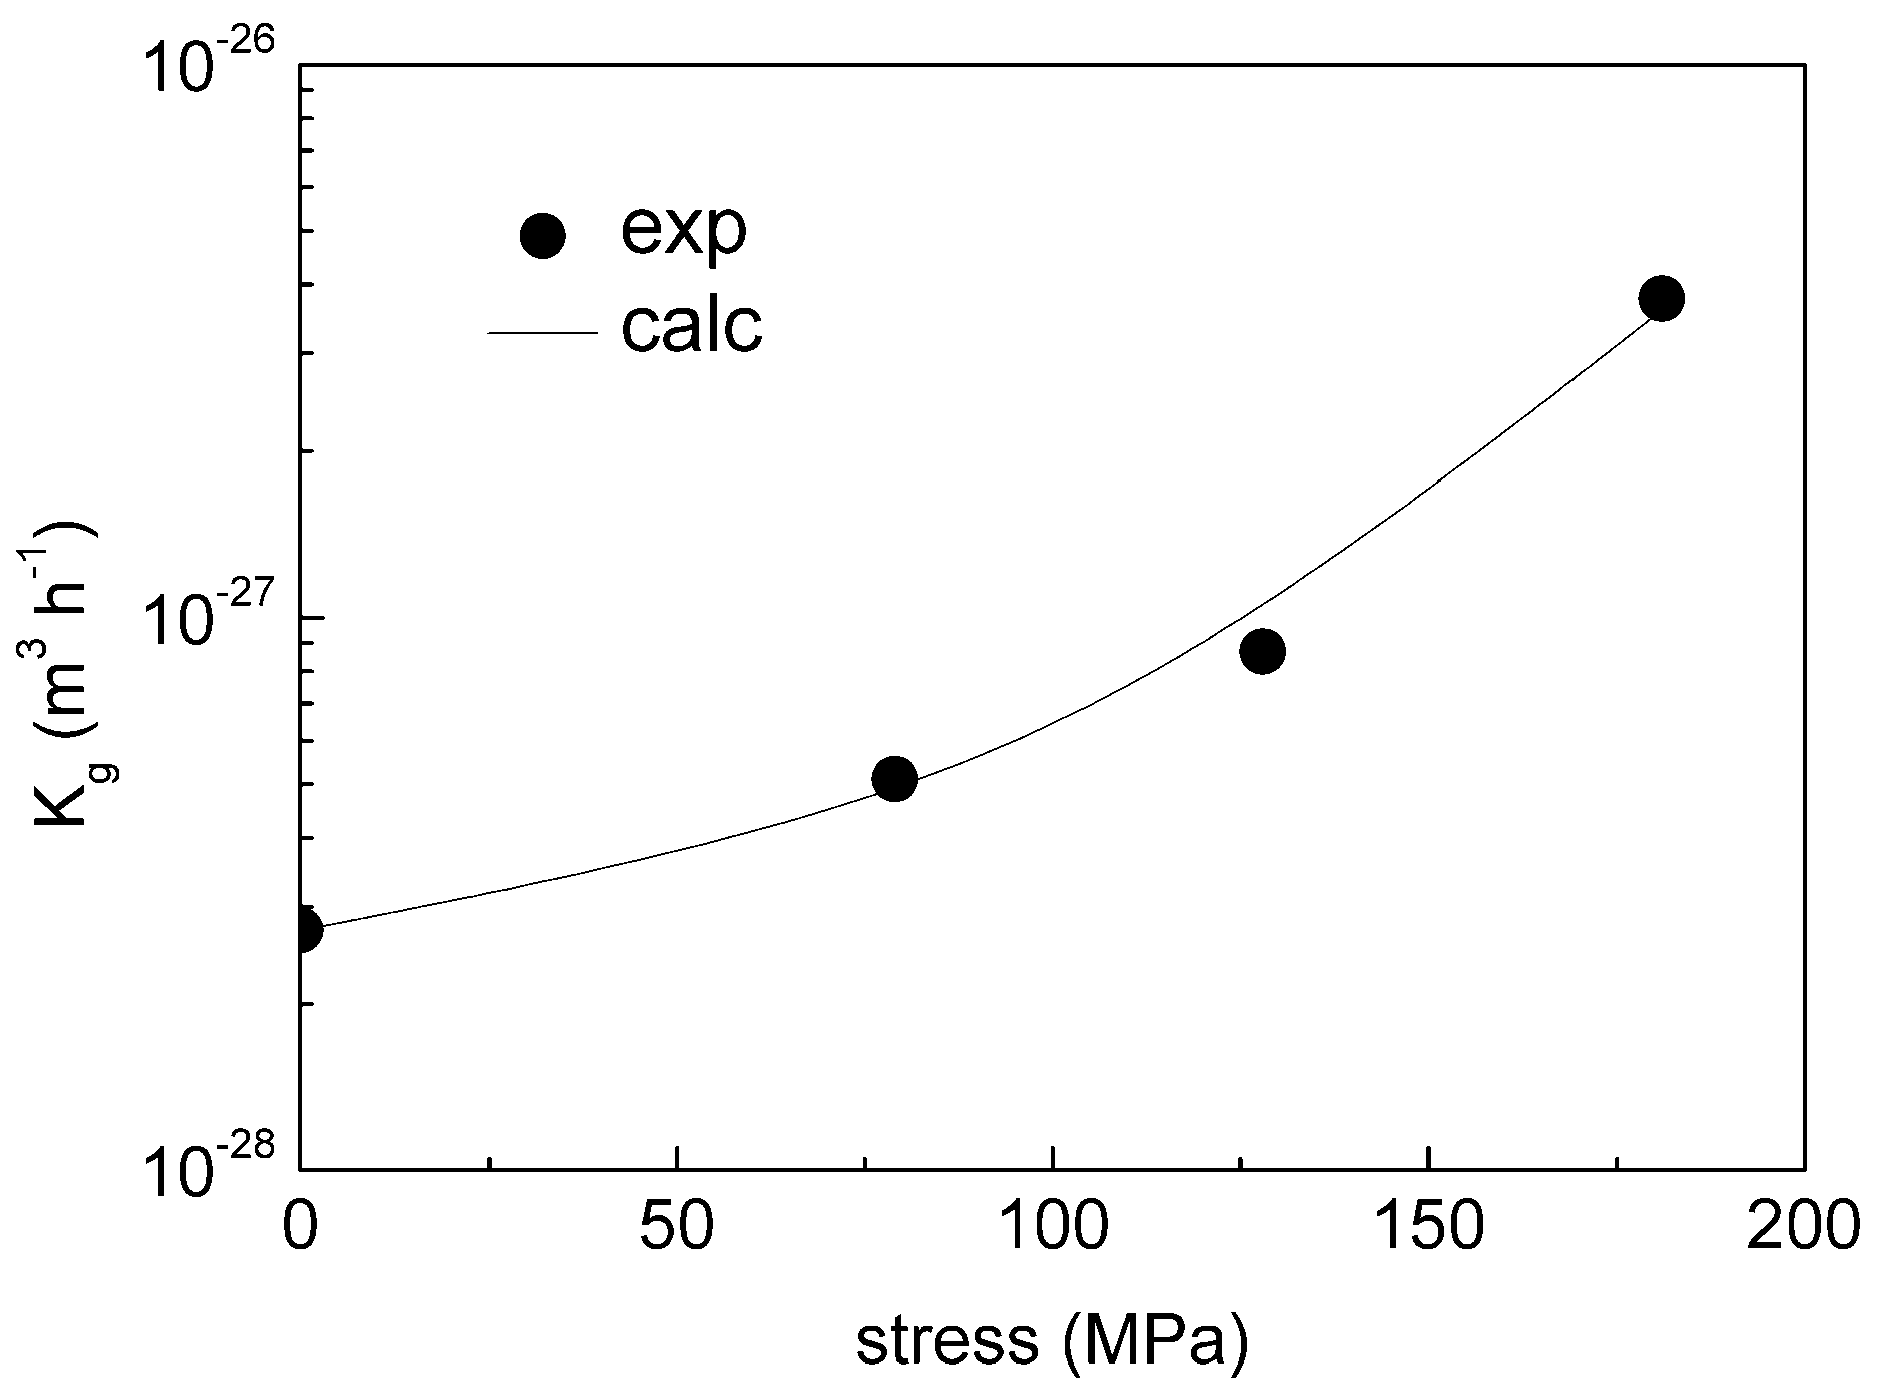
4.3. Effect of Stress on Particle Evolution

The analysis in Section 3.2 shows that Equation (25) provides a reliable estimate of the coarsening phenomena during annealing. Extensive experiments on creep ageing [10,11] confirm that an applied stress greatly accelerates the phenomena described above. Again, the work by Rockenhäuser et al. [38] could provide precious experimental data in the form of rod diameter as a function of time of exposure.
The stress applied introduces fresh dislocations and additional point defects, which significantly enhance diffusion, a phenomenon that could be expressed by a reduction of the activation energy for the coarsening process. The coarsening acceleration described in Reference [38] could be then tentatively described by modifying Equation (25) as
d p 3 = d 0 p 3 + k g t exp { Q a R T [ 1 k σ ( σ G ) 2 ] } = d 0 p 3 + K g t
where kσ is a constant. Figure 6 plots the variation of Kg with stress at 190 °C as well as the curve that describes Equation (29). The correlation is excellent (correlation coefficient 0.998). Thus, Equation (29) could be used to estimate the particle size at the time at which the minimum in strain rate is measured.

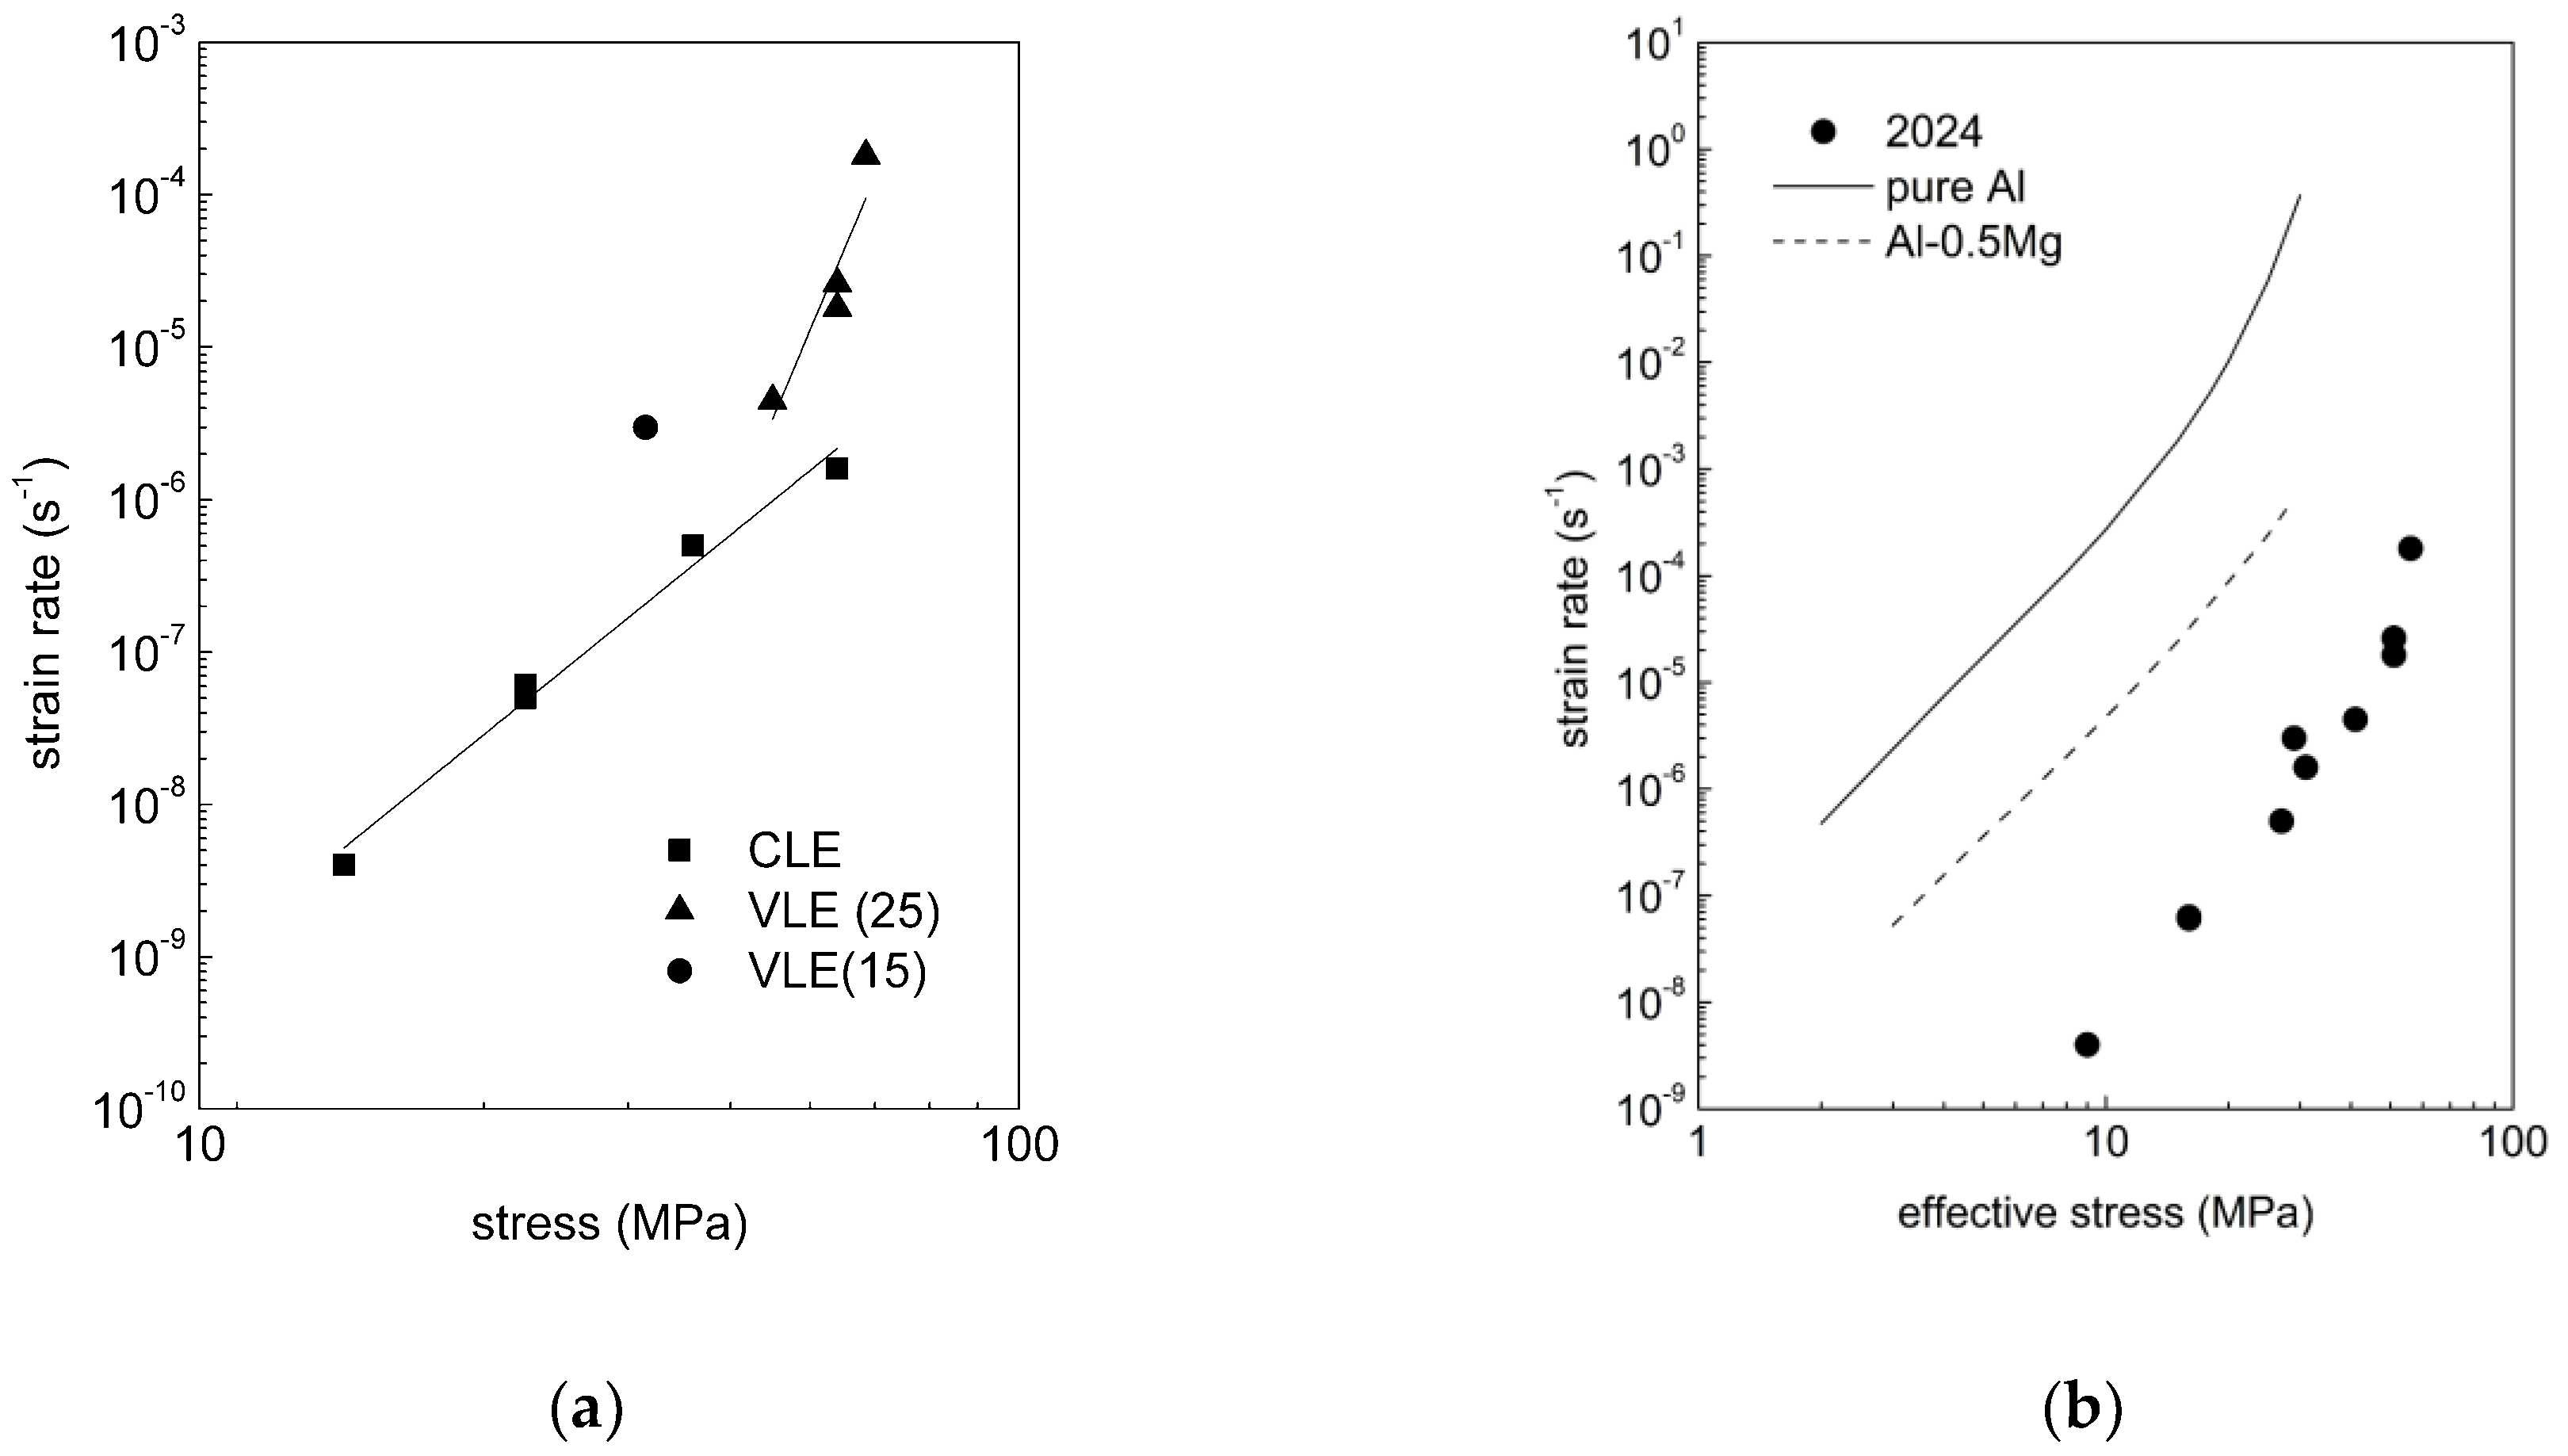
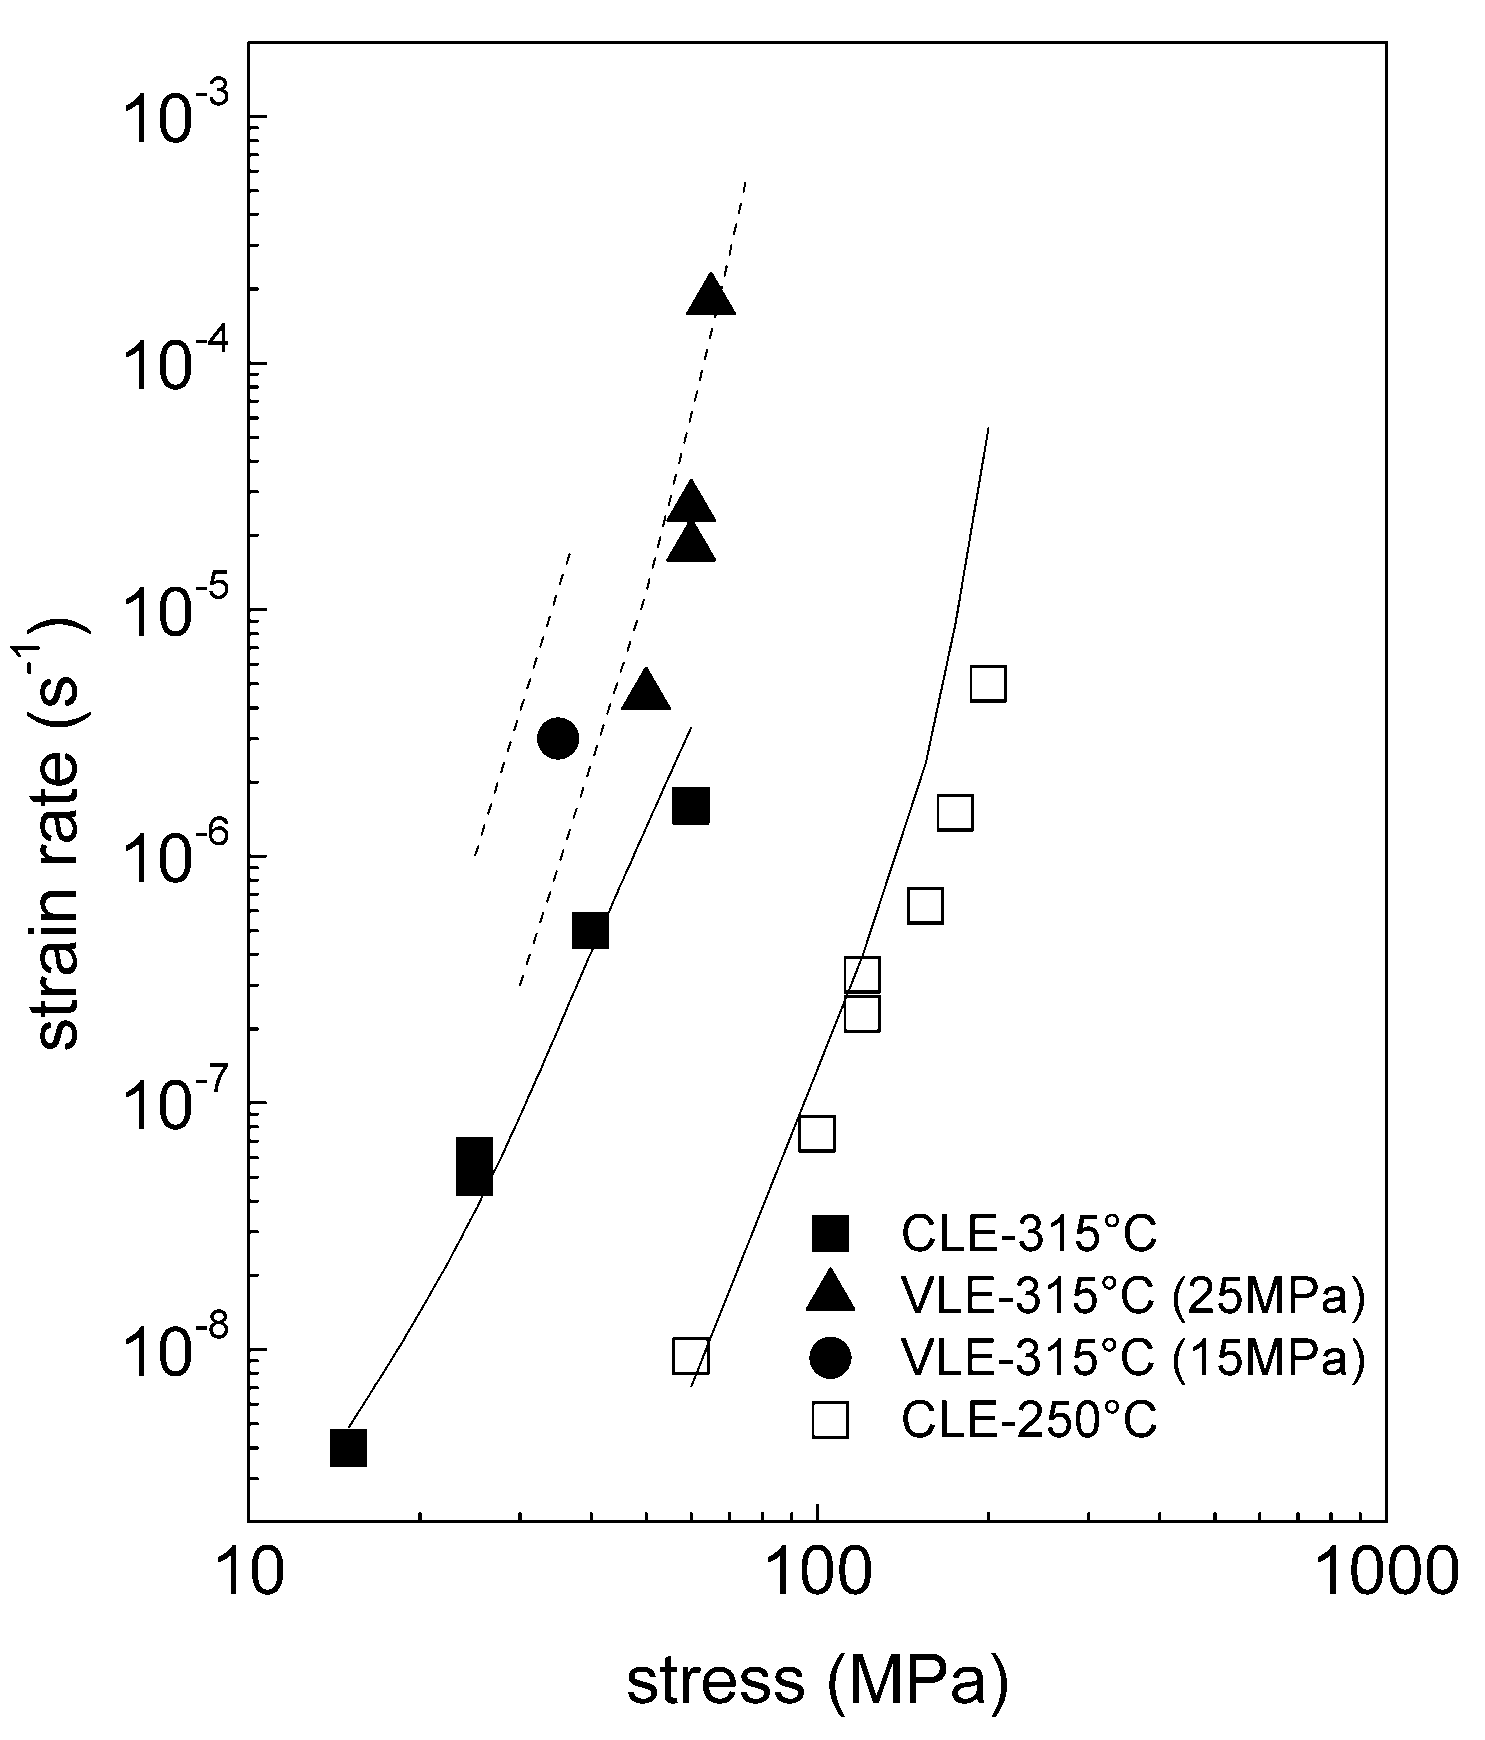
4.4. Description of the AA2024 T3 Constant and Variable Load Experiments

Figure 7 plots the minimum creep rate dependence on applied stress at 315 and 250 °C for the AA2024 T3 alloy. Table 1 summarizes the experimental details of the different experiments, and, in particular, the time at which the minimum in creep rate was reached (tm).
The creep rate dependence on applied stress at steady state (here assimilated to the minimum creep rate range), for L* ≈ λ, can be obtained by combining Equations (2) and (19), giving
ε ˙ ss = 2 M cg τ l b λ m ( σ ρ α m G b ) 4
where
σ ρ = σ σ p σ i σ ss σ σ p = σ e
The data in Table 1 can be easily used to estimate the rod diameter at tm, assuming, for example, d0 ≅ 3.4 nm as in Reference [38]. To take into account the effect of heating and soaking times, a permanence of 1.5 h at the testing temperature before loading was considered, giving an estimate of the diameter of the rods at the beginning of the test of 4 and 9 nm at 250 and 315 °C respectively. The volume fraction of the intragranular precipitates was assumed to be f = 0.9 and 0.6% and αp = 0.7 and 0.55, respectively, as in the previous sections. This quantity is obviously only a mere fraction of the total amount of particles, since, as mentioned above, creep exposure resulted in a massive precipitation of Al-Cu-Mg or Al-Cu phases on grain boundaries.
The last term still to be determined is the maximum strength Rmax, here tentatively quantified, for each single test in correspondence to the minimum in creep rate, as
R max = 1.5 ( R UTS a + σ Or )
being R UTS a ≈ 75 MPa the tensile strength at room temperature of an alloy with the same impurity level and similar content of elements in solid solution and coarse intergranular precipitates (again, the AA2024-O alloy [36]). Figure 7 also plots the curves calculated by the model here presented, without any data fitting of the creep data. The solid lines are the curves connecting the modelled value of the strain rate for any given applied stress. The broken lines connect the calculated values of the strain rate for the tests with similar time of exposure under an initial stress (25 MPa or 15 MPa), followed by a much shorter exposure to the same temperature under a higher but different load, which is thought to have a minimal effect on the particle size and distribution. The agreement between experimental data and model is excellent (the correlation coefficient was 0.997 and 0.965 at 250 and 315 °C respectively). A significant deviation was observed only in the very high stress region (very short time of exposure) at 250 °C, i.e., in a condition where the initial dislocation density and the presence of an intermediate phases confer a higher strength to the alloy. This behavior was expected, since the model is based on the assumption that creep-exposure only causes coarsening of the equilibrium phase, as could be the case for the T6 condition.
Although the model gives a very good description of the experiments, it should be kept in mind that this conventional presentation could be somewhat misleading. Figure 8 actually plots, again, the experimental data and the iso-P (iso-σp) model curves, where P represents a given combination of the size and volume fraction of the intragranular precipitates, that is, a given value of the particle-strengthening contribution. The Figure clearly shows that each single datum for the CLE lies on a different iso-P curve. By contrast, the VLE, for which the time of exposure is roughly coincident with the duration of the first stage of the test, carried out under the lower stress, actually lies on the same iso-P curve (broken lines in Figure 7). This fact easily explains the difference in strain rate between the CLE and VLE. In addition, the model also gives a reason for the lower creep rate measured in the AA2024 T3 alloy, for a given effective stress, when compared with pure Al and Al-Mg alloys (the effect shown in Figure 1b). The magnitude of the minimum strain rate in particle-strengthened alloys is influenced by two different parameters, namely the particle strengthening term σp, which was already considered in the phenomenological Equation (1), and the dislocation mean free path L, which does not appear in the traditional phenomenological models. This latter microstructural features is substantially coincident with the interparticle spacing in the AA2014-T3 alloy, which, in turn, is orders of magnitude shorter than the dislocation mean free path in single phase metals and alloys.
In this sense, the advantages of the model here presented over the traditional phenomenological power law equation are remarkable:
  • The model does not require any fitting of the experimental creep data (none of the creep data were used to fit the equations, once the model was properly tuned by other microstructural results and tensile testing, required to provide an estimate of αp).
  • The model is self-consistent, since it easily explains the lower creep rate observed when comparing the alloy tested under a given effective stress and the pure metal under an equivalent applied stress.
  • Although the model considers only rod-shaped particles, the observed presence of equiaxed precipitates does not seem to significantly affect the accuracy of the description.
  • The main drawback of the model here presented, is that the quantification of the particle-strengthening term still needed to be evaluated from experimental data (the yield stress). Thus, the determination of the threshold stress originated by particle-dislocation interaction remains phenomenological in nature.

5. Conclusions

A model for the description of the minimum creep rate dependence on applied stress and temperature for the AA2024 aluminum alloy has been presented in this study. The constitutive equations are a derivation of a model that was originally developed for Cu and has already been used for pure Al and Al-Mg alloys. The original equation has been modified to take into account the fine grain size typical of many commercial alloys, the presence of precipitates, whose size and distribution vary with creep exposure, and the resulting variation of particle strengthening. In particular, the effect of the particles has been accounted for by directly introducing a threshold stress (a usual step in the phenomenological approach in use) and the interparticle spacing in the equation for the minimum creep rate. Since both these quantities vary with temperature, stress and time of exposure, a set of equations has been proposed to quantify these phenomena. The new set of equations has provided an excellent description of the experimental data.

Author Contributions

C.P. performed the experiments; C.P. and S.S. analyzed the data; M.R. provided the material, performed FSP and the microstructural analysis; S.S. wrote the paper.

Funding

The study was partially funded by ORT Braude College, Karmiel, Israel.

Conflicts of Interest

The authors declare no conflict of interest.

Appendix A

The effect of grain size on the strength of aluminum alloys at ambient temperature has been analyzed in a number of different studies (see [42] for a synthesis of the most important findings in this regards). In the present instance, the simplest description of such effect, namely the Hall-Petch relationship, was considered. There is strong evidence that the Hall-Petch relationship holds also at high temperature, although khp, which can be considered a measure of the effectiveness of grain boundaries in increasing material strength, strongly decreases with increasing temperature [43] and decreasing strain rate [44]. This temperature dependence of the Hall-Petch “constant” can be described by the phenomenological equation [44]
k hp 2 = B hp exp ( β hp T )
where Bhp is a constant and
β hp = β 0 β 1 ln ε ˙
The constant β0 does not change much in fcc metals such as Cu or Pb (β0 ≅ 0.003 K−1), while β1 ranges between 2 × 10⁻⁴ (for Cu) and 2.4 × 10⁻³ K−1 (for Pb) [44]. The constants Bhp and β1 were therefore calculated for Al by considering that, at 350 °C and 6.67 × 10⁻⁴ s−1, khp = 0.65 MPa·mm−1/2 [43], while, at room temperature and under the usual conditions for tensile testing (strain rates ranging between 1 × 10⁻⁴ s−1 and 1 × 10⁻³ s−1), khp ranged between 2.0–2.5 [45] and 2.8 MPa·mm−1/2 [42]. This calculation gave Bhp = 86.5 MPa2·mm−1 and β1 = 8 × 10⁻⁴ K−1 (Figure A1).
Figure A1. Experimental values of the Hall-Petch constant (from [42] and [43]) and model curves for different strain rates.
Metals 08 00930 g0a1
The figure plots the collection of the experimental data reported in [37] (which include the results illustrated in [45]) supplemented by the value for khp at room temperature given in [42], and the curves obtained by Eqns. (A1) and (A2). The Figure clearly shows that most experimental data are close to the model curves for 10−4 and 10−3 s−1, which, as mentioned above, roughly correspond to the usual strain rates for constant strain rate testing. The khp values given by Equation (A1) and (A2) could then be used to estimate the grain-boundary strengthening effect in Equation (3). Yet, since the value of internal stress, which is required to estimate the minimum strain rate, contains the grain-size strengthening term that depends on the strain rate, an iterative process was required to properly obtain the model curves presented in Figure 7 and Figure 8.

References

  1. Nakai, M.; Eto, T. New aspects of development of high strength aluminum alloys for aerospace applications. Mater. Sci. Eng. A. 2000, 258, 62–68. [Google Scholar] [CrossRef]
  2. Huda, Z.; Edi, P. Materials selection in design of structures and engines of supersonic aircrafts: A review. Mater. Des. 2013, 46, 552–560. [Google Scholar] [CrossRef]
  3. Dursun, T.; Soutis, C. Recent developments in advanced aircraft aluminium alloys. Mater. Des. 2014, 56, 862–871. [Google Scholar] [CrossRef]
  4. Lumley, R.N.; Morton, A.J.; Polmear, I.J. Enhanced creep performance in an Al-Cu-Mg-Ag alloy through underageing. Acta Mater. 2002, 50, 3597–3608. [Google Scholar]
  5. Lumley, R.N.; Polmear, I.J. The effect of long term creep exposure on the microstructure and properties of an underaged Al-Cu-Mg-Ag alloy. Scr. Mater. 2004, 50, 1227–1231. [Google Scholar] [CrossRef]
  6. Heimerl, G.J.; Farquhar, J. Compressive and Tensile Creep of 7075-T6 and 2024-T3 Aluminium Alloy Sheet; U.S. Department of Energy Office of Scientific and Technical Information: Washington, DC, USA, 1 December 1959.
  7. Kloc, L.; Cerri, E.; Spigarelli, S.; Evangelista, E.; Langdon, T.G. Significance of continuous precipitation during creep of a powder metallurgy aluminum alloy. Mater. Sci. Eng. A 1996, 216, 161–168. [Google Scholar] [CrossRef]
  8. Kloc, L.; Spigarelli, S.; Cerri, E.; Evangelista, E.; Langdon, T.G. Creep behavior of an aluminum 2024 alloy produced by powder metallurgy. Acta Mater. 1997, 45, 529–540. [Google Scholar]
  9. Spigarelli, S.; Cabibbo, M.; Evangelista, E.; Langdon, T.G. Creep properties of an Al-2024 composite reinforced with SiC particulates. Mater. Sci. Eng. A 2002, 328, 39–47. [Google Scholar]
  10. Lin, Y.C.; Xia, Y.C.; Jiang, Y.Q.; Li, L.T. Precipitation in Al-Cu-Mg alloy during creep exposure. Mater. Sci. Eng. A. 2012, 556, 796–800. [Google Scholar]
  11. Lin, Y.C.; Xia, Y.C.; Jiang, Y.Q.; Zhou, H.M.; Li, L.T. Precipitation hardening of 2024-T3 aluminum alloy during creep aging. Mater. Sci. Eng. A 2013, 565, 420–429. [Google Scholar]
  12. Härtel, M.; Frint, P.; Abstoss, K.G.; Wagner, M.F.-X. Effect of creep ad aging on the precipitation kinetics of an Al-Cu alloy after one pass of ECAP. Adv. Eng. Mater. 2018, 20, 1700307. [Google Scholar] [CrossRef]
  13. Maximov, J.T.; Duncheva, G.V.; Anchev, A.P.; Ichkova, M.D. Modeling of strain hardening and creep behaviour of 2024T3 aluminium alloy at room and high temperatures. Comput. Mater. Sci. 2014, 83, 381–393. [Google Scholar] [CrossRef]
  14. Regev, M.; Rashkovsky, T.; Cabibbo, M.; Spigarelli, S. Microstructure stability during creep of friction stir welded AA2024-T3 alloy. J. Mater. Eng. Perform. 2018, 1–10. [Google Scholar] [CrossRef]
  15. Buchheit, R.G.; Grant, R.P.; Hiava, P.F.; Mckenzie, B.; Zender, G. Local dissolution phenomena associated with S phase (Al2CuMg) particles in aluminum alloy 2024-13. J. Electrochem. Soc. 1997, 144, 2621–2628. [Google Scholar] [CrossRef]
  16. Boag, A.; Hughes, A.E.; Wilson, N.C.; Torpy, A.; MacRae, C.M.; Glenn, A.M.; Muster, T.H. How complex is the microstructure of AA2024-T3? Corros. Sci. 2009, 51, 1565–1568. [Google Scholar] [CrossRef]
  17. Shih, H.C.; Ho, N.J.; Huang, J.C. Precipitation behaviors in Al-Cu-Mg and 2024 aluminum alloys. Metall. Mater. Trans. A 1996, 27, 2479–2494. [Google Scholar] [CrossRef]
  18. Spigarelli, S.; Sandström, R. Basic creep modelling of aluminium. Mater. Sci. Eng. A. 2018, 711, 343–349. [Google Scholar] [CrossRef]
  19. Spigarelli, S.; Paoletti, C. A unified physical model for creep and hot working of Al-Mg solid solution alloys. Metals 2018, 8, 9. [Google Scholar] [CrossRef]
  20. Kassner, M.E.; Pérez-Prado, M.-T. Five-power-law creep in single phase metals and alloys. Prog. Mater. Sci. 2000, 45, 1–102. [Google Scholar] [CrossRef]
  21. Morishige, T.; Hirata, T.; Uesugi, T.; Takigawa, Y.; Tsujikawa, M.; Higashi, K. Effect of Mg content on the minimum grain size of Al-Mg alloys obtained by friction stir processing. Scr. Mater. 2011, 64, 355–358. [Google Scholar] [CrossRef]
  22. Lee, B.H.; Kim, S.H.; Park, J.H.; Kim, H.W.; Lee, J.C. Role of Mg in simultaneously improving the strength and ductility of Al-Mg alloys. Mater. Sci. Eng. A 2016, 657, 115–122. [Google Scholar] [CrossRef]
  23. Zhao, D.; Løvvik, O.M.; Marthinsen, K.; Li, Y. Impurity effect of Mg on the generalized planar fault energy of Al. J. Mater. Sci. 2016, 51, 6552–6568. [Google Scholar] [CrossRef] [Green Version]
  24. Sandström, R.; Andersson, H.C.M. Creep in phosphorus alloyed copper during power-law breakdown. J. Nucl. Mater. 2008, 372, 76–88. [Google Scholar] [CrossRef]
  25. Sandström, R. Basic model for primary and secondary creep in copper. Acta Mater. 2012, 60, 314–322. [Google Scholar] [CrossRef]
  26. Sandström, R. Influence of phosphorus on the tensile stress strain curves in copper. J. Nucl. Mater. 2016, 470, 290–296. [Google Scholar] [CrossRef]
  27. Sandström, R. The role of cell structure during creep of cold worked copper. Mater. Sci. Eng. A 2016, 674, 318–327. [Google Scholar] [CrossRef]
  28. Korzhavyi, P.A.; Sandström, R. First-principles evaluation of the effect of alloying elements on the lattice parameter of a 23Cr25NiWCuCo austenitic stainless steel to model solid solution hardening contribution to the creep strength. Mater. Sci. Eng. A 2015, 626, 213–219. [Google Scholar] [CrossRef]
  29. Khan, I.N.; Starink, M.J.; Yan, J.L. A model for precipitation kinetics and strengthening in Al-Cu-Mg alloys. Mater. Sci. Eng. A 2008, 472, 66–74. [Google Scholar] [CrossRef]
  30. Blum, W.; Reppich, B. Creep of particle-strengthened alloys. Creep Behav. Cryst. Solids. 1985, 83–135. [Google Scholar]
  31. Heilmaier, M.; Reppich, B. Particle Threshold Stresses in High Temperature Yielding and Creep: A Critical Review. In Proceedings of the Creep Behavior of Advanced Materials for the 21st Century, San Diego, CA, USA, 28 February–4 March 1999. [Google Scholar]
  32. Lagneborg, R.; Bergman, B. The stress/creep rate behaviour of precipitation-hardened alloys. Met. Sci. 1976, 10, 20–28. [Google Scholar] [CrossRef]
  33. Rösler, J. Back-stress calculation for dislocation climb past non-interacting particles. Mater. Sci. Eng. A 2003, 339, 334–339. [Google Scholar] [CrossRef]
  34. Rösler, J.; Arzt, E. A new model-based creep equation for dispersion strengthened materials. Acta Metall. Mater. 1990, 38, 671–683. [Google Scholar] [CrossRef]
  35. Rösler, J.; Joos, R.; Arzt, E. Microstructure and creep properties of dispersion-strengthened aluminum alloys. Metall. Trans. A 1992, 23, 1393–1521. [Google Scholar] [CrossRef]
  36. Kaufman, J.G. Properties of Aluminium Alloys: Tensile, Creep, and Fatigue Data at High and Low Temperatures; ASM international: Materials Park, OH, USA, 1999. [Google Scholar]
  37. Zhang, F.; Levine, L.E.; Allen, A.J.; Campbell, C.E.; Creuziger, A.A.; Kazantseva, N.; Ilavsky, J. In situ structural characterization of ageing kinetics in aluminum alloy 2024 across angstrom-to-micrometer length scales. Acta Mater. 2016, 111, 385–398. [Google Scholar] [CrossRef] [PubMed] [Green Version]
  38. Rockenhäuser, C.; Schriever, S.; von Hartrott, P.; Piesker, B.; Skrotzki, B. Comparison of long-term radii evolution of the S-phase in aluminum alloy 2618A during ageing and creep. Mater. Sci. Eng. A 2018, 716, 78–86. [Google Scholar] [CrossRef]
  39. Lifshitz, I.M.; Slyozov, V.V. The kinetics of precipitation from supersaturated solid solutions. J. Phys. Chem. Solids. 1961, 19, 35–50. [Google Scholar] [CrossRef]
  40. Wagner, C. Theorie der Alterung von Niederschlägen durch Umlösen (Ostwald-Reifung). Zeitschrift Für Elektrochemie, Berichte Der Bunsengesellschaft Für physikalische Chemie 1961, 65, 581–591. [Google Scholar]
  41. Liu, D.; Zhang, L.; Du, Y.; Xu, H.; Liu, S.; Liu, L. Assessment of atomic mobilities of Al and Cu in fcc Al–Cu alloys. Calphad 2009, 33, 761–768. [Google Scholar] [CrossRef]
  42. Cordero, Z.C.; Knight, B.E.; Schuh, C.A. Six decades of the Hall–Petch effect—A survey of grain-size strengthening studies on pure metals. Int. Mater. Rev. 2016, 61, 495–512. [Google Scholar] [CrossRef]
  43. Kassner, M.E.; Li, X. The effect of grain size on the elevated temperature yield strength of polycrystalline aluminum. Scr. Metall. Mater. 1991, 25, 2833–2838. [Google Scholar] [CrossRef]
  44. Panin, V.E.; Armstrong, R.W. Hall-Petch analysis for temperature and strain rate dependent deformation of polycrystalline lead. Phys. Mesomech. 2016, 19, 35–40. [Google Scholar] [CrossRef]
  45. Al-haidary, J.T.; Petch, N.J.; de los Rios, E.R. The plastic deformation of polycrystals I. Aluminium between room temperature and 400 °C. Philos. Mag. A 1983, 47, 869–890. [Google Scholar] [CrossRef]
Figure 1. (a) Experimental values of the minimum creep rate for tests on AA2024 T3 at 315 °C [14]. CLE stands for constant load experiments. VLE stands for variable load experiments (tests during which an initial value of the applied stress, 15 or 25 MPa, was increased at the early beginning or in proximity of the minimum creep rate range). (b) Strain rate as a function of the effective stress σ-σ0 for the data (a) compared with the response of pure Al [18] and Al-0.5Mg [19].
Metals 08 00930 g001
Figure 2. Schematic depiction of a dislocation negotiating a particle array. In (a) the dislocation climbs over equiaxed particles of size ds. In (b), the dislocation climbs over rods, of diameter dr = 1/3 ds, with the same volume and interparticle spacing on the slip plane of the equiaxed precipitates in (a). The rod axis forms an angle ϕ with the slip plane.
Metals 08 00930 g002
Figure 3. Microstructure of the sample tested under 25 MPa at 315 °C up to rupture. The distribution of precipitates was quite inhomogeneous in the various grains. The grain on the right in (a), in particular, was one of those with a higher volume fraction of particles. Semi-continuous chains of coarse particles precipitated during creep highlight grain boundaries. In (b), elongated particles can be easily observed, alongside small circular precipitates (most easily rods observed in a transversal section) and slightly coarser equiaxed particles.
Metals 08 00930 g003
Figure 4. Calculated variation of the yield stress for AA2024 T6; the symbols represent the experimental data from Reference [36] for the T3 and T6 states, tested at room temperature. Initial rod diameter 3.4 nm, volume fraction of the intragranular S-phase 0.9% at 250 °C and 0.6% at 315 °C respectively. The figure also reports the yield strength at room temperature for the unexposed T3 and T6 states [36].
Metals 08 00930 g004
Figure 5. Calculated variation of the yield stress for AA2024 T6 at 260 and 315 °C, after different durations of annealing at these temperatures; the symbols represent the experimental data from Reference [36] for the T3 and T6 states Initial rod diameter 3.4 nm, volume fraction of the intragranular S-phase 0.9% at 250°C and 0.6% at 315 °C respectively. The figure also reports the yield strength at room temperature for the T3 and T6 states [36].
Metals 08 00930 g005
Figure 6. Coarsening constant at 190 °C as a function of applied stress (experimental data from Reference [38]).
Metals 08 00930 g006
Figure 7. Minimum creep rate dependence on applied stress. The solid curves connect the modelled values of the strain rate for each single CSE; the broken curves connect the strain rate values modelled by assuming that the time of exposure does not change appreciably for the tests carried out under different loads. The latter condition is comparable to the conditions experienced during the VLE. The grain size used in estimating the internal stress was 50 μm.
Metals 08 00930 g007
Figure 8. Model curves representing the strain rate variation with stress for microstructures that experienced different durations of exposure under a given load; (a) 250 °C; (b) 315 °C. Each curve is thus relative to a microstructure equivalent to that observed at tm under a given applied stress (iso-P curves). The open data in (b) are from the VLE (f = 0.5 and 0.22% at 250 and 315 °C respectively).
Metals 08 00930 g008
Table 1. Creep data for the CLE and VLE.
CLE
T (°C)σ (MPa)tm (h) ε ˙ m (s−1)
250602009.4 × 10−9
100107.5 × 10−8
12073.3 × 10−7
15516.0 × 10−7
1750.351.5 × 10−6
2000.055.0 × 10−6
31515*3374.0 × 10−9
25505.0 × 10−8
4085.0 × 10−7
600.61.6 × 10−6
VLE
T (°C)σ (First Loading) (MPa)σ (Final Loading) (MPa)t Under First Load (h)tm Second Load (h)
3152550151
2560150.08
2565150.03
15*353371
* Data for the same experiment; the load was changed when the material reached the steady state/minimum creep rate range after 337 h.

