Article

The Impact of Pt Concentration on Crystal Growth Mechanism in Pt-Pd Binary Alloy System in the Context of Molecular Dynamics

1
Physics Department, Science Institute, Bitlis Eren University, Bitlis 13000, Turkey
2
Physics Department, Faculty of Arts and Sciences, Bitlis Eren University, Bitlis 13000, Turkey
*
Author to whom correspondence should be addressed.
Metals 2018, 8(11), 926; https://doi.org/10.3390/met8110926
Submission received: 18 October 2018 / Revised: 3 November 2018 / Accepted: 6 November 2018 / Published: 9 November 2018
(This article belongs to the Special Issue Rapid Solidification Processing)

Abstract

:
This work aims to investigate the effect of Pt concentration on the crystal growth mechanism of a Platinum-Palladium (Pt-Pd) binary alloy system during the annealing process; starting from the amorphous phase to some definite temperatures. The calculations have been performed by using molecular dynamic (MD) simulations. Interatomic interactions are described by the Sutton-Chen type Embedded Atom Potential Energy function. In order to understand the main structural properties at the stable and unstable phases; changes in radial distribution function (RDF) curves versus time have been analyzed for different annealing temperatures. Crystalline type bonded pairs have been determined using MD calculations which is required for the computation of Avrami coefficients and for understanding crystal growth mechanism. The results demonstrate that the increase in concentration of Pt during annealing leads to migration of atoms in the crystal lattice points; elimination of dislocations and formation of perfect crystal structure.

1. Introduction

Platinum (Pt) and Pt-based alloys are extensively used because of their significant technological applications. In recent years, numerous studies have been introduced on platinum and platinum-based alloys [1,2,3]. Although these alloys are costly materials, they are commonly-used in industry and technology due to their unique physical properties [4]. Particularly, these metal alloys are preferred for some applications in areas such as electronics, crystal growth, automotive, solidification technology and the jewelry industry [5,6]. Rhodium (Rh) and Palladium (Pd) materials are suitable elements for solid solution because they are easily soluble in Platinum. Pt-Pd solid solutions have some important physical properties [7,8] and they are used in the productions of thin films and play an important role in experimental studies of metallurgical science. Despite their advantages, many physical properties of Pt-alloys have not been determined because of their high cost performance. Furthermore, the experimental investigations at nanoscale of Pt is not practical and difficult [9,10]. These difficulties can be eliminated by strong simulations which are preferred in different disciplines [11,12,13].
With developments in computer technology, the simulation methods are very significant for nearly all scientific studies [14]. Recently, in the nanotechnology and cluster physics fields, with increasing computer facilities, simulation applications have increased [15]. Especially, molecular dynamics (MD) simulations which have become one of the most important methods in recent years [16,17,18]. It describes the molecular systems by imitating the behavior of atoms and molecules at the microscopic level. At the same time, MD calculations allow us to obtain the physical properties of the model systems during solidification and crystallization processes under different conditions [19,20].
In this current study, we aim to obtain crystallization properties of Pt-Pd alloy at certain annealing temperatures from the amorphous phase for different Pt concentrations. For this purpose, we investigated the volume fraction, which was calculated by atomic clusters containing crystal-type bonded pairs during phase transitions. The parameters of potential energy function (PEF) based on the Sutton-Chen family of potential have been fitted to the experimental parameters of the alloy system. The Avrami coefficients were calculated by using volume fraction to understand the crystallization mechanism at different annealing temperatures.

2. Theory

2.1. Molecular Dynamic Simulation

Molecular dynamic (MD) simulation method aims to obtain some physical properties of the systems by using numerical calculations and it includes the interactions between the atoms of the system [21]. In this method, the system is described by interaction forces between atoms that are located on lattice points in a MD cell. Equilibrium state and minimum energy condition are provided by using a potential energy function [22]. In our calculations, the MD method improved by Parrinello and Rahman (PR) was used to study structural and dynamical in which both the volume and the shape of the simulation box by using periodic conditions [23]. A typical MD simulation is performed in four steps which are preparation, stabilization, getting results and analysis. In the first step, initial velocities are assigned according to the Maxwell-Boltzmann distribution function and atoms are located in lattice points of known crystal structures of a model system. During the second step, the equation of motion of atoms is obtained by using numerical integration algorithms. In the last stage, some measurements are performed on the system in equilibrium [24].
In the PR MD method, edge vectors of calculated cell are represented by three time dependent vectors A(t), B(t) and C(t). A cell matrix is defined as h(t) = (ABC) and the Lagrange function of the cell with changeable volume and geometry can be written as:
L PR = 1 2 i = 1 N m i ( s ˙ i t G s ˙ i ) Φ ( r ) + 1 2 W T r ( h ˙ t h ˙ ) p Ω
which can be used to derive the following equations of motion, where m is the mass, G is metric tensor, W is an arbitrary constant in mass size, p is the external pressure and Ω is the volume of MD cell.
s ¨ i = j i N m i 1 d ϕ ( r i j ) r i j d r i j ( s i s j ) G 1 G ˙ s ˙ i
h ¨ = W 1 ( Π I p ) σ
where Π describes the microscopic stress tensor coming from virial theorem and I is the unit matrix. ϕ(rij) indicates the potential energy function which represents physical interactions between i and j atoms and σ is a matrix showing the surface size of MD cell [25].
In this study, we used the MD simulation method for the isothermal-isobaric ensemble (NPT) and we examined the model alloy system at constant pressure. The molecular dynamics step was set up at 5.01 fs and the equations of motions were integrated by a fifth-order Gear predictor-corrector algorithm. The model system with 4000 atoms was built in super-lattice structure of Pt-Pd alloy at different concentrations of Pt, PtxPd100−x (x = 50, 70, 90), which are L10 lattice for Pt50-Pd50, and L12 for Pt70-Pd30, and finally FCC lattice for Pt90-Pd10 crystal structures. In the MD calculations, firstly, the systems were heated above melting points that are known as experimental for different concentration values of Pt. Then, the systems were rapidly cooled up to 300 K at the cooling rate of 1 × 10¹³ K/s to observe their amorphous phase. Finally, the systems are again heated starting from the amorphous phase during the annealing.

2.2. Embedded Atom Method (EAM)

According to this method, the total energy of a crystal is
E T = ε i = 1 N [ 1 2 j i N ( a r i j ) n c ρ ¯ i ]
where the first term, ϕij shows two body interaction potentials between i and j atoms. Second term, Fi(ρi) indicates embedding functional depending on charge density [26], ρi, which reads
ρ ¯ i = j i N ( a r i j ) m
The potential energy parameters between atoms are obtained in the studies [5,27].
The radial distribution function (RDF) is calculated to understand the structural features of the model system at solid-liquid-amorphous phase transitions. The mathematical expression of RDF, g(r), as follows
g ( r ) = V N 2 i n i ( r ) 4 π r 2 Δ r
where r is the radial distance, ni(r) is the coordination number of atom i separated with r within the Δr interval and brackets denote the time average [22].

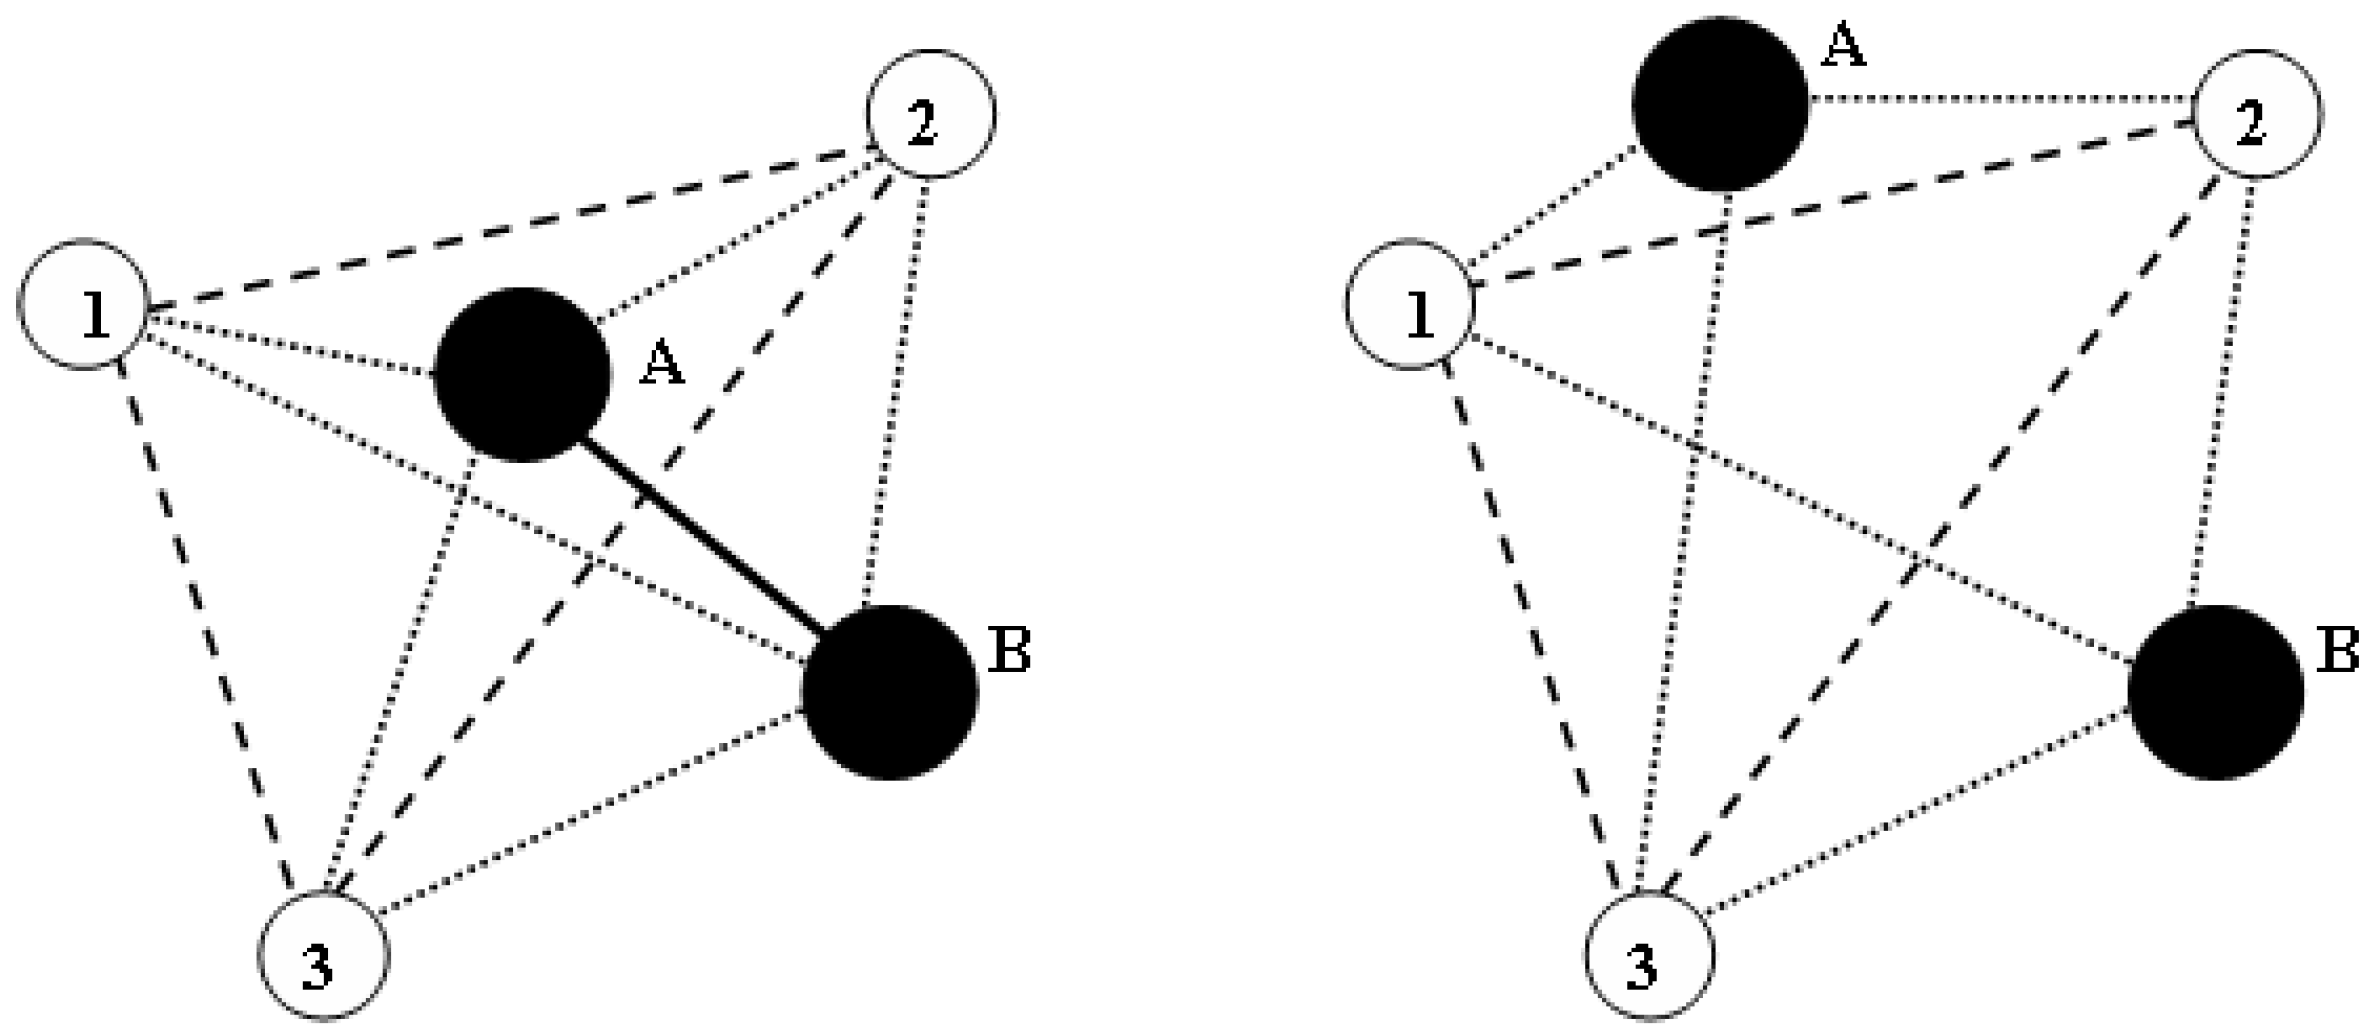
2.3. Honeycutt-Andersen Method (HA)

Many studies show that HA method is very important to obtain some structural properties of atomic clusters during the solidification. Structural analysis of this kind of clusters which arise during the phase transitions is possible by performing a method developed by Honeycutt and Anderson [28]. According to the HA method, in a cluster atomic arrangement or atomic structure is described by four basic indices (ijkl) as seen in Figure 1. The value of i is 1 if two atoms make a bond and i will be 2 in the case of a non-bonded pair. The second indices j, represents the number of neighbor atoms shared by both of the atoms pairs. Third indices k, is the number of bonds between neighbor atoms. l is distinctive indices which represents the difference in bond geometry in the structure. For example, 1421 and 1422 represent the bond pairs which are forming characteristic FCC and HCP structures, respectively [28,29]. 1551 bonded pairs are define an ideal icosahedral (ICOS) structure, 1541 and 1431 are used to determine the defected ICOS structures. These are most basic bond pairs representing the amorphous structure. The basic pairs of the BCC lattice structure are 1661 and 1441. The existence of bond formation is ensured by cut-off distance which corresponds to the region between first and second peaks in RDF [30].

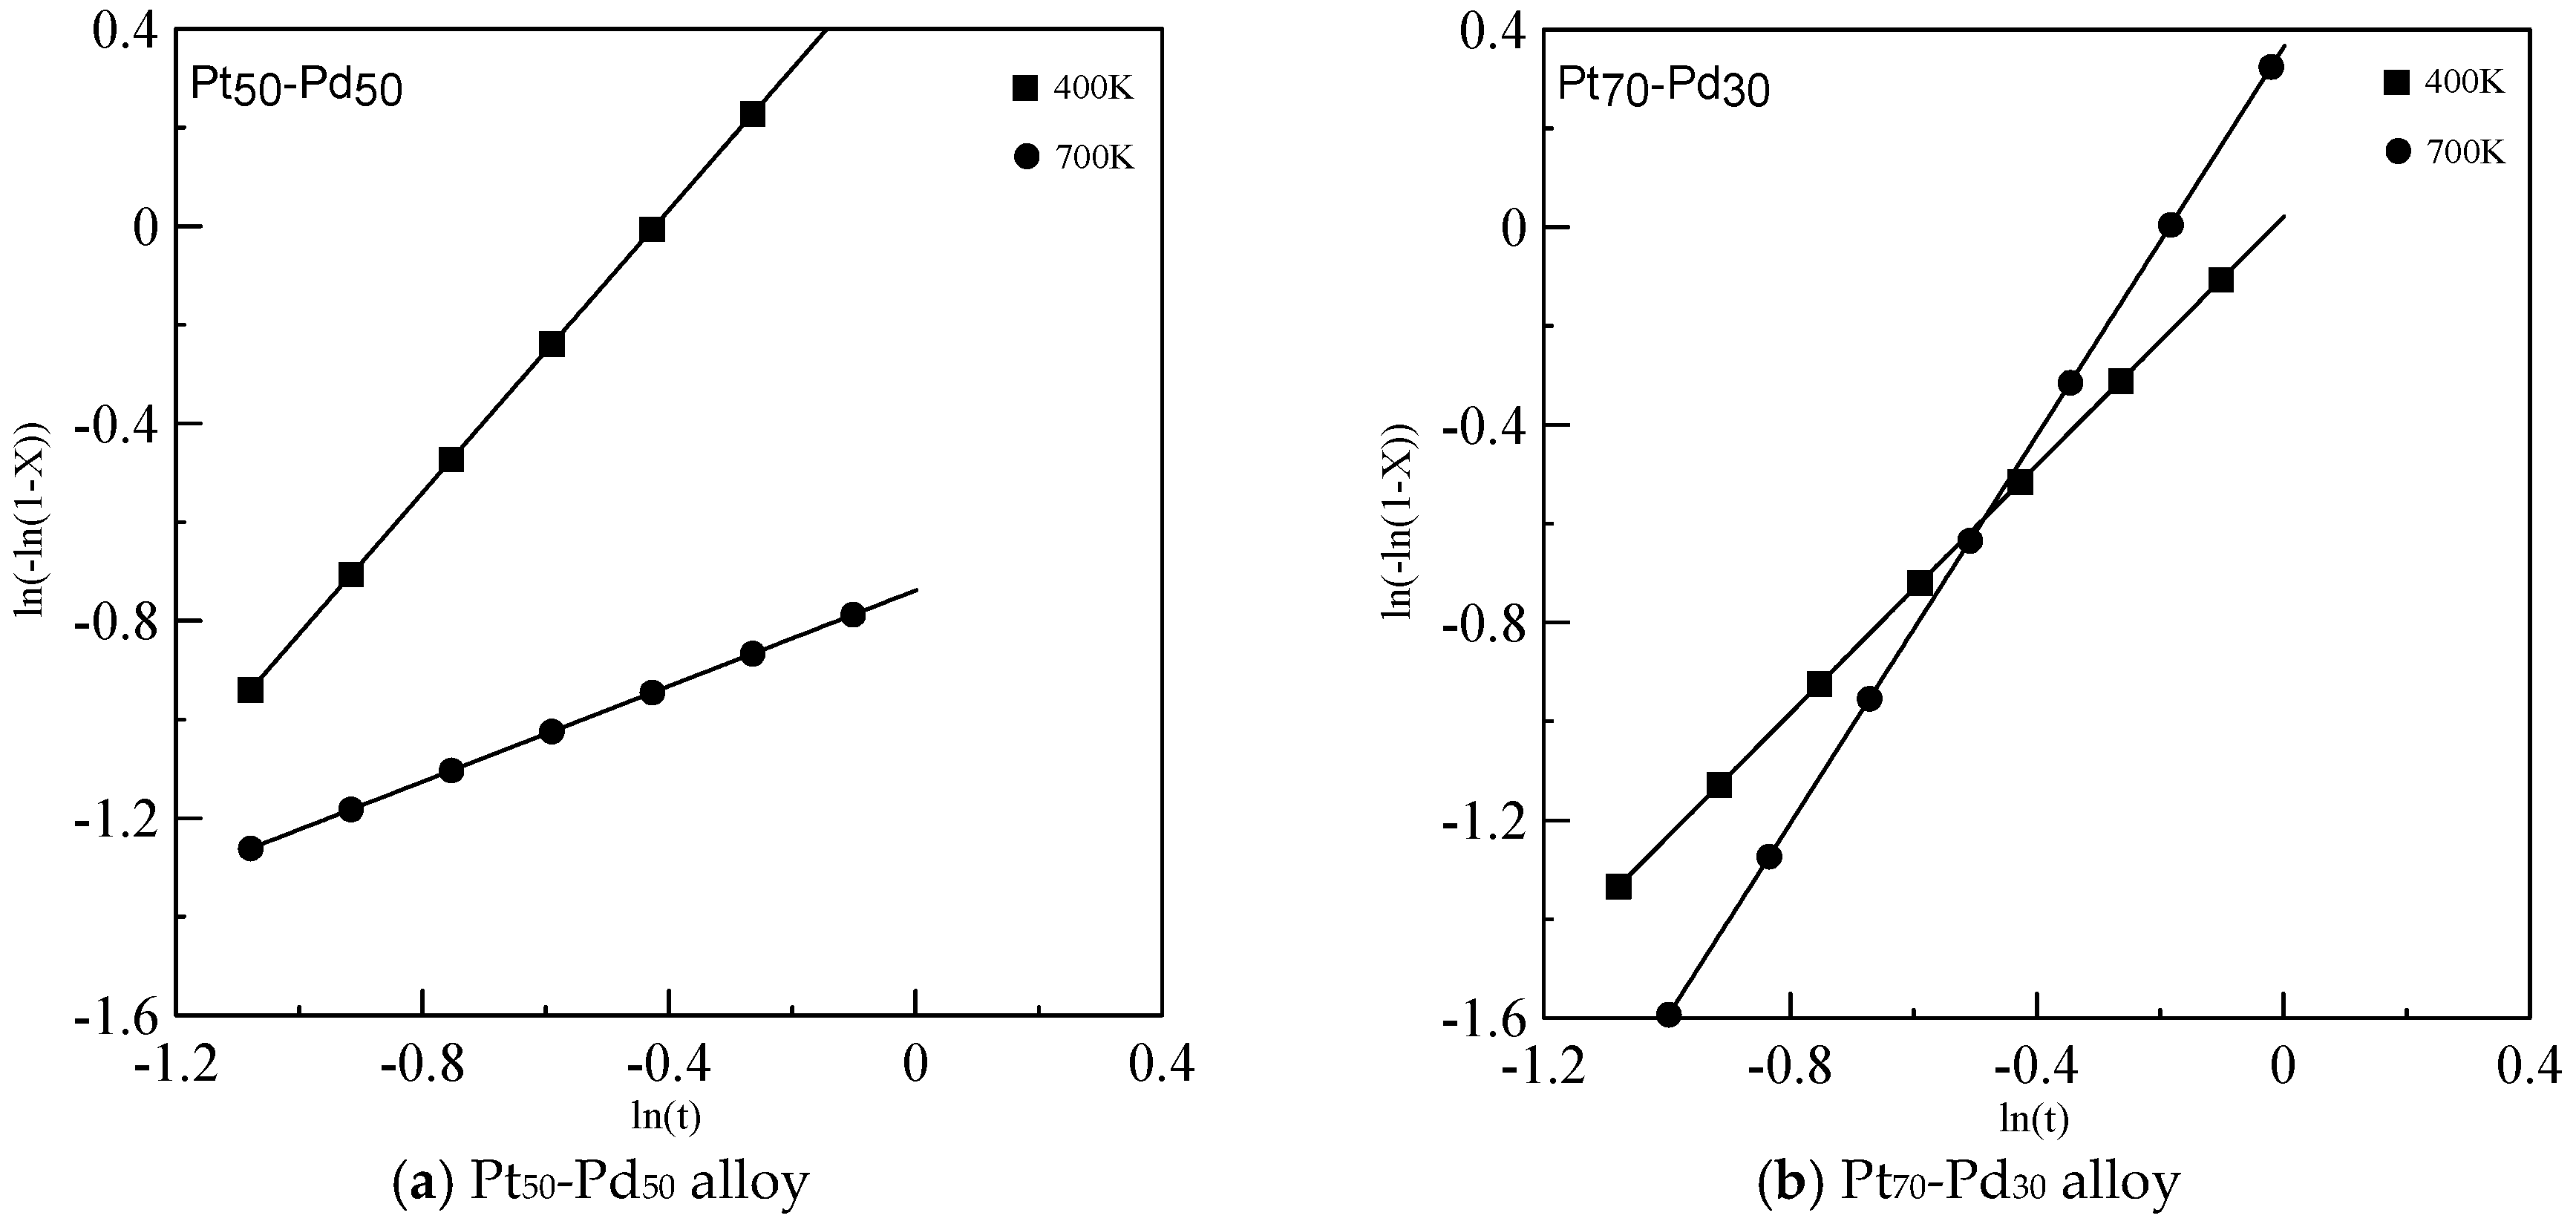
2.4. Johnson-Mehl-Avrami (JMA) Crystallization Kinetics

Avrami coefficients or exponents may give information about the crystallization properties of a material which is calculated using the results obtained from experimental measurements. The JMA equation for fixed temperature crystallization kinetics reads [31]
ln ( 1 x ) = ( k · t ) n
where x is the volume-fraction which varies in t period, n is the Avrami exponent and k is the reaction rate constant which is a function of the annealing temperature. This equation can be written as
ln [ ln ( 1 x ) ] = n · ln ( k ) + n · ln ( t )
Here, the variation in volume fraction which means the gradient of the plot of the function ln[−ln(1 − x)] according to ln(t) gives the Avrami exponent. Experimental studies show that the Avrami exponential (n) can take the values between 1–4. The case of n = 1 refers to surface nucleation and one-dimensional growth, n = 2 refers to volume nucleation and one-dimensional growth, n = 3 refers to volume nucleation and two-dimensional growth, and n = 4 is volume nucleation and three-dimensional growth [32,33]. The 1421, 1441, 1661 and 1422 bonded pairs are the basis structure of the crystal unit cell. The volume fraction which is depending on the percentage of these crystal type bonded pairs is calculated for different annealing temperatures. Avrami coefficients will be obtained using this fraction in Equation (8).

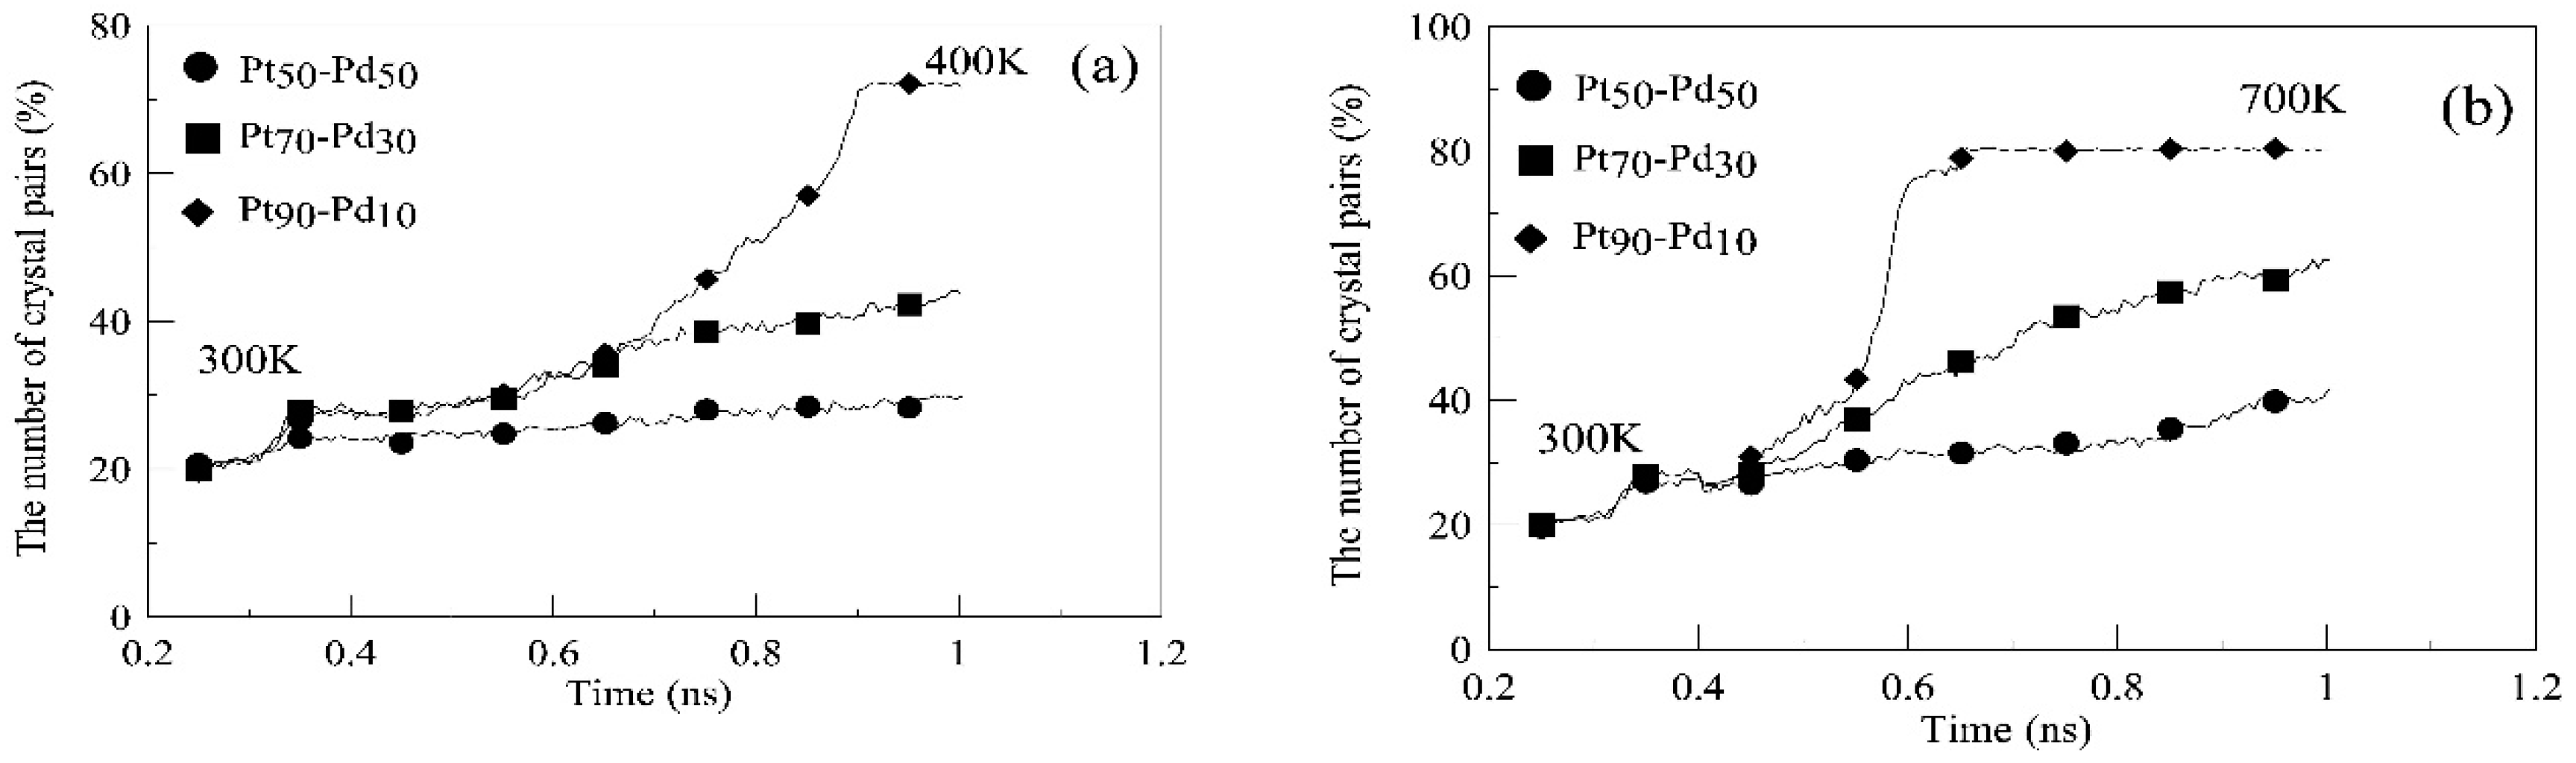
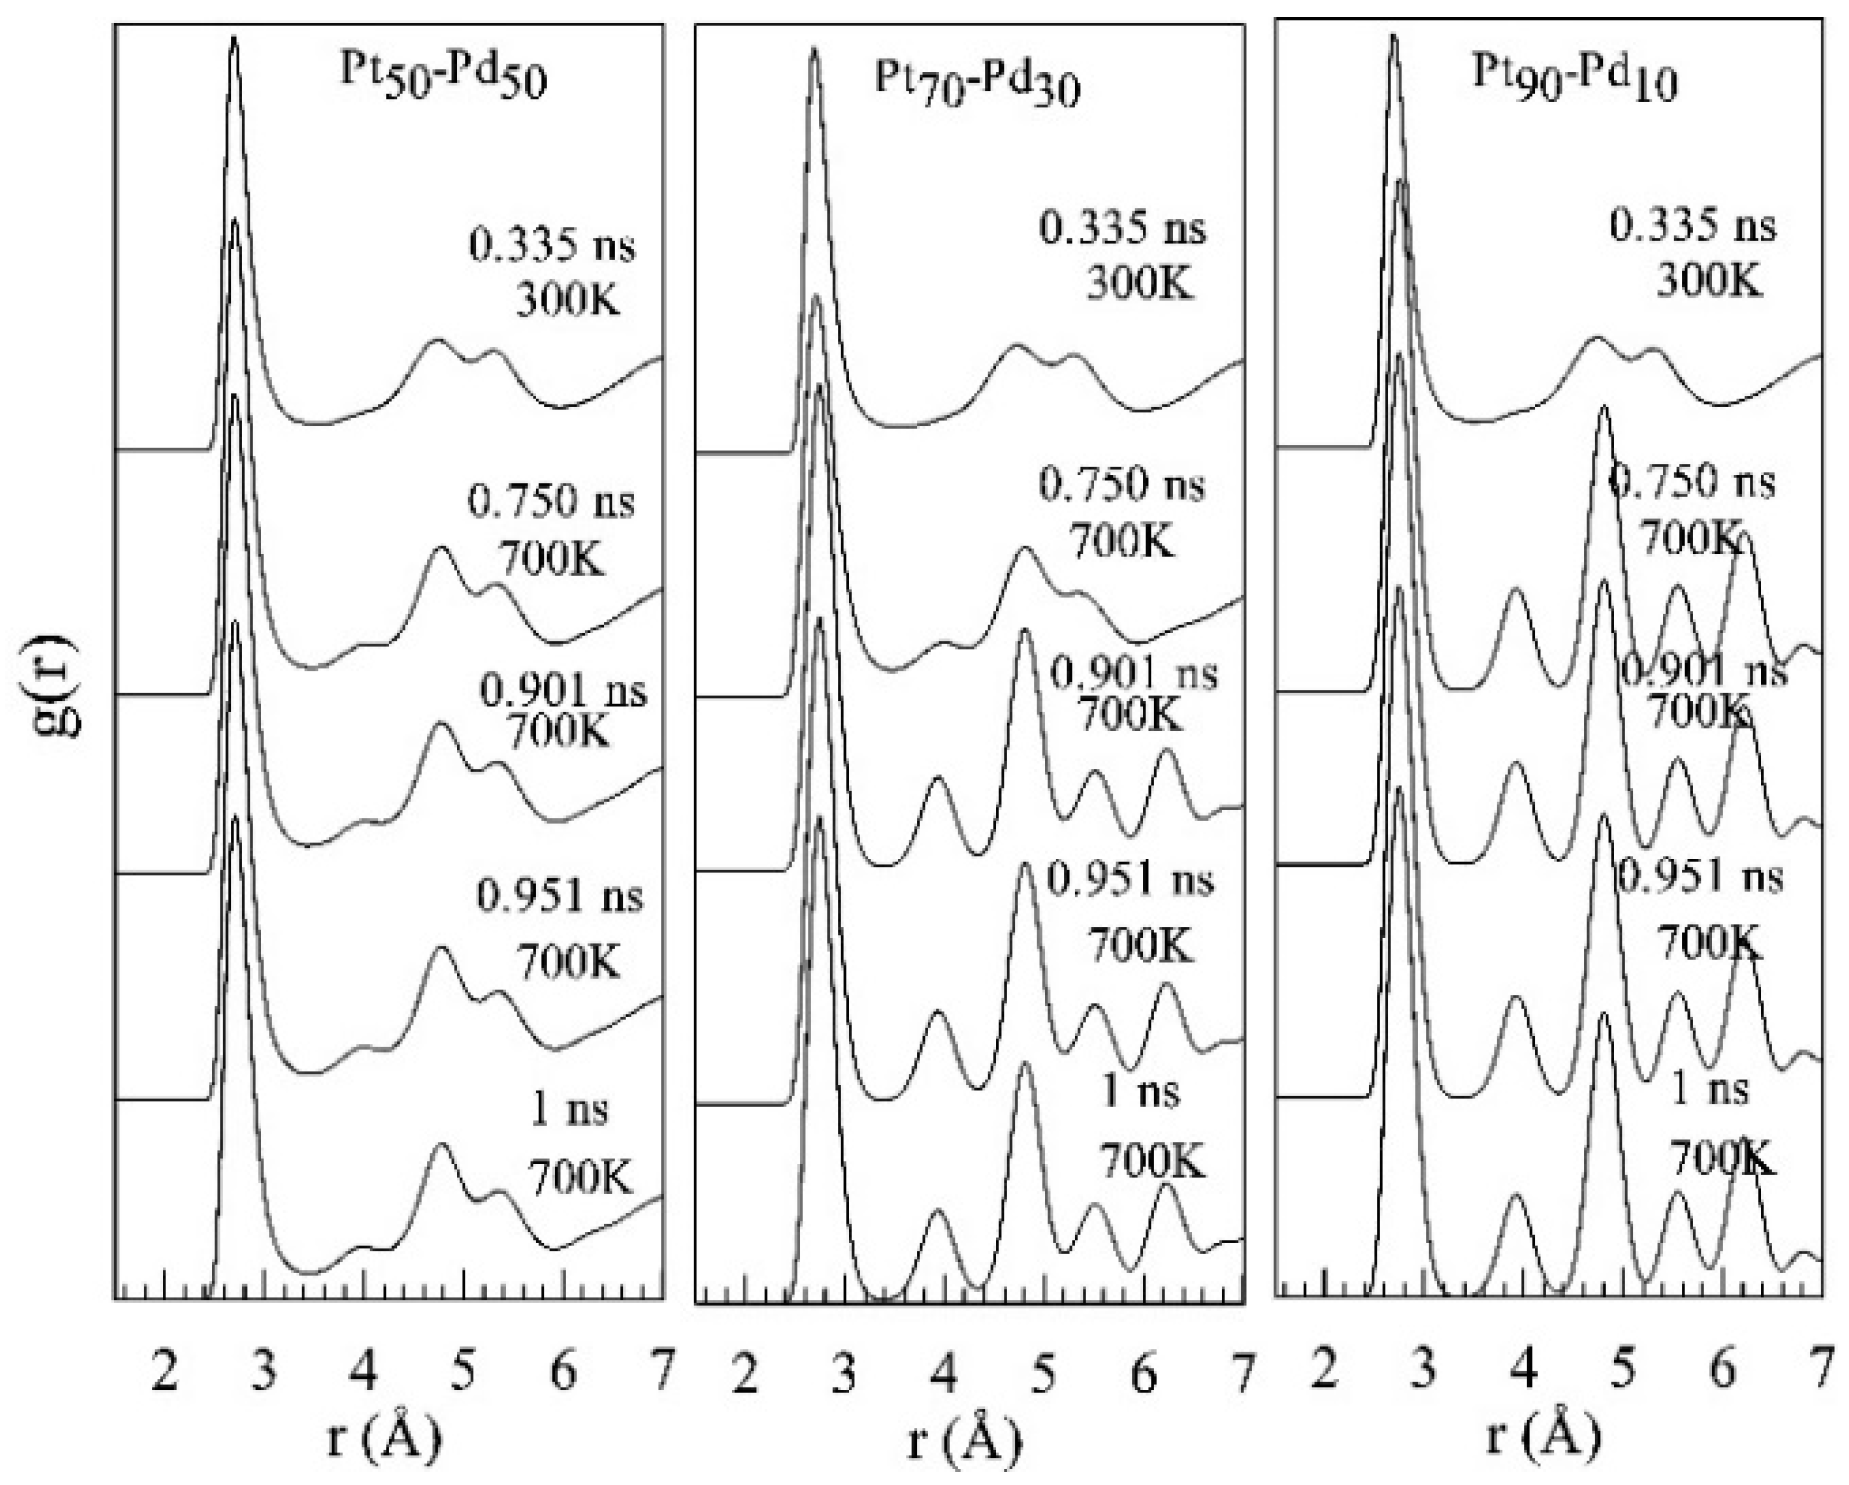
3. Results and Discussion

JMA kinetics is one of the most efficient techniques to determine crystallization properties and kinetics of a material [34]. Information about Avrami coefficients leads to a better understanding of the crystallization mechanism during the annealing process starting from the amorphous phase at 300 K [34]. In order to obtain Avrami coefficients, the number of bonded pairs has been investigated during the annealing process. In addition, Avrami coefficients in JMA equations can be obtained by using percentage variation of crystalline pairs which can be considered as a function of volume fraction x.
For three different Pt concentrations of the Pt-Pd system, Figure 2 shows the change of the number of crystal bonded pairs which are obtained by increasing the temperature from 300 K (amorphous phase) to 400–700 K. At 800 K, the system has transformed into a liquid phase for all Pt concentrations. The total number of crystalline bonded crystal pairs which represent FCC, BCC and HCP crystal lattices has been calculated using the HA method (1421 + 1422 + 1441 + 1661). The number of crystal bonded pairs is lower for Pt50Pd50 which means that the system is not completely transformed to a stable crystal phase at a temperature of 400 K. Increase the annealing temperature leads to an increase in total number of crystalline bonded pairs for all the Pt concentrations at 800 K. Furthermore, the number of crystalline-type bonded pairs increases with the addition of Pt atoms to the system. Particularly, the amount of bonded pairs is found as 70% of Pt90Pd10 during the annealing process.
The radial distribution function (RDF) has been applied to reveal the atomic distribution along the distance between described central atom and neighboring atoms [35]. For a gaseous system, the number of atoms in a definite volume is small because of the motion of atoms and the distribution of atoms is independent from r distance. This situation is different for a solid material due to less atomic vibrations and motion so that atoms form a close-packed structure. Therefore, the peaks of the RDF curves have been observed for some definite atomic distances. Figure 3 and Figure 4 show RDF curves which are obtained in a certain time and for different Pt concentrations of Pt-Pd systems. In this annealing process, the temperature is increased from 300 K (amorphous phase) to 400 and 700 K. At an annealing temperature of 400 K, crystal phase transition has not been observed for Pt50-Pd50 system which is stabilized in the amorphous phase in which case atoms become completely disordered. Second peak (corresponds to the amorphous phase) of RDF curves are more split. This is because of the high cooling speed so that atoms cannot find an opportunity to be located in lattice points and are randomly distributed in the MD cell. In other words, the atoms are distributed randomly in the MD cell, because the high cooling rate prevents to find the required time in order to locate in crystal lattice points of atoms. The intensity of crystal peaks is obviously increasing with the increase in Pt concentration. This is the result of the formation of a more stable crystal lattice structure. Increase in the number of Pt atoms leads to the location of atoms in lattice points. Same situation is valid for annealing temperature of 700 K. Increasing the annealing temperature causes an increase in the strength of the peaks for all Pt concentrations. As seen from Figure 3 and Figure 4, for an annealing time of 0.750 ns and for Pt90-Pd10, the intensity of the second and third peaks of RDF in the case of 400 K are weaker compared with that of 700 K. This result is in good agreement with the change of the number of crystal-bonded pairs shown in Figure 2.
Another investigation into the effect of bonded pairs on growth processes enables us to determine the existence probability of bonded pairs in the system. Percentage change is used for obtaining Avrami coefficients in JMA equations. Percentage variation of crystalline-type bonded pairs between initial and final growing time has been taken into account to determine the Avrami coefficients. The obtained curve gives the Avrami coefficients when the change of ln(−ln(1 − x)) (here x corresponds to the percentage variation of crystalline bonded pairs) according to ln(t) has been fitted. Figure 5a–c indicates the fitting curves for different Pt concentrations of the Pt-Pd system at temperatures of 400 and 700 K. These curves give the Avrami coefficients or exponents (n). The Avrami coefficient value for Pt50Pd50 is 0.48 at 400 K and 1.43 at 700 K. In a Pt70Pd30 system, Avrami coefficients for 400 K and 700 K are 1.25 and 1.96, respectively. The Avrami value is 2.3 for Pt90Pd10 at 400 K and 3.68 at 700 K. Avrami coefficients are increasing with the annealing temperature for all the concentrations which means that surface and one-dimensional nucleation is effective for low temperature and three-dimensional nucleation is observed for higher annealing temperatures. The concentration is also effective on the coefficients.
Avrami coefficients provide convenient information to understand the crystal growth mechanism in a certain temperature [36]. In phase transitions, nucleation and crystal growth mechanisms are extremely important [37,38]. For two different annealing temperature values, the change in Avrami coefficients with Pt concentrations has been shown in Figure 6. It can be clearly seen from this figure that Avrami coefficients increase with increasing Pt concentrations. While the annealing temperature increases, the values of Avrami coefficients also increase for different Pt concentrations. Particularly, the value of n is approaching to 4 at 700 K for Pt90Pd10. These result indicate that three-dimensional growth takes place as a result of an increase in Pt.
Figure 7a shows the image of the atomic distribution of Pt50-Pd50 at an annealing temperature of 400 K. In this figure, there is no crystal layers and the structure seems amorphous. Figure 7b,c shows images of atomic distributions from different points of view for Pt90-Pd10. The atoms start to be located into crystal lattice points with the increase of Pt and atomic layers can be clearly seen from the figure. This image is consistent with the figures related to Avrami coefficients. Figure 8 shows the atomic distribution of Pt90-Pd10 alloy for an annealing temperature of 700 K. Figure 7 and Figure 8 indicate that an increase in Pt concentration leads to definite atomic arrays and the structure is transformed into the crystal structure. At this annealing temperature, the Avrami coefficient is determined as nearly 4 which is a sign of three-dimensional growth.

4. Conclusions

In this study, our main goal is to investigate and reveal the effect of Pt concentration on the crystal growth mechanism for a Pt-Pd binary alloy system using molecular dynamic simulations. For this purpose, we consider that the experimentally obtained volume fraction corresponds to the variation in percentage of crystal-type bonded pairs. These bonded pairs represent nanosize atomic clusters and are required to calculate Avrami coefficients during the annealing process. For different annealing temperatures (from amorphous to crystal phase) of the chosen model alloy system, it has been calculated and concluded that the values of Avrami coefficients increase with Pt concentration. The value of the Avrami coefficient is approximately 4 at an annealing temperature of 700 K, which shows that the crystal growth is three dimensional. For the Pt90-Pd10 alloy, 700 K has been determined as an ideal annealing temperature value in which it is possible to observe a perfect crystallization process.

Author Contributions

Investigation, F.A.C.; Methodology, S.K.; Writing-original draft, K.K.

Funding

This research was funded by Physics Department, Science Institute, Bitlis Eren University and Physics Department, Faculty of Arts and Sciences, Bitlis Eren University.

Conflicts of Interest

The authors declare no conflict of interest.

References

  1. Rdzawski, Z.M.; Stobrawa, J.P. Microstructure and properties of the new Pt-Rh based alloys for hightemperature applications. J. Mater. Process. Technol. 2004, 153, 681–687. [Google Scholar] [CrossRef]
  2. Ren, D.; Qin, J.; Wang, J.; Tsong, T.T. Oscillatory compositional depth profiles in surface segregation of a Pt-Rh alloy. Phys. Rev. B 1993, 47, 3944. [Google Scholar] [CrossRef]
  3. Clay, J.P.; Greeley, J.P.; Ribeiro, F.H.; Delgass, W.N.; Schneider, W.F. DFT comparison of intrinsic WGS kinetics over Pd and Pt. J. Catal. 2014, 320, 106–117. [Google Scholar] [CrossRef]
  4. Wang, W.; Wang, Z.; Wang, J.; Zhong, C.-J.; Liu, C.-J. Highly active and stable Pt-Pd alloy catalysts synthesized by room-temperature electron reduction for oxygen reduction reaction. Adv. Sci. 2017, 4, 1600486. [Google Scholar] [CrossRef] [PubMed]
  5. Luyten, J.; De Keyzer, J.; Wollants, P.; Creemers, C. Construction of modified embedded atom method potentials for the study of the bulk phase behaviour in binary Pt-Ph, Pt-Pd, Pd-Ph and ternary Pt-Pd-Rh alloys. Calphad 2009, 33, 370–376. [Google Scholar] [CrossRef]
  6. Celik, F.A. The investigation of nucleation rate and johnson-mehl-avrami model of Pt-Pd alloy using molecular dynamics simulation during heat treatment processes. J. Alloys Compd. 2015, 632, 116–121. [Google Scholar] [CrossRef]
  7. Shao, G.; Zhangr, J.; Li, T. Investigation of Potential Parameters Effect on Stable Structures of Pt-Pd Alloy Nanoparticles by Particle Swarm Algorithm. In Proceedings of the 2017 32nd Youth Academic Annual Conference of Chinese Association of Automation (YAC), Hefei, China, 19–21 May 2017. [Google Scholar]
  8. Garbacz, H.; Mizera, J.; Laskowski, Z.; Gierej, M. Microstructure and mechanical properties of a Pt-Rh alloy produced by powder metallurgy and subjected to plastic working. Powder Technol. 2011, 208, 488–490. [Google Scholar] [CrossRef]
  9. Yuge, K.; Seko, A.; Kuwabara, A.; Oba, F.; Tanaka, I. First-principles study of bulk ordering and surface segregation in Pt-Rh binary alloys. Phys. Rev. B 2006, 74, 174202. [Google Scholar] [CrossRef]
  10. Sosa, E.; Liu, H. Oxygen adsorption on Pt-Pd nanoclusters by DFT and ab initio atomistic thermodynamics. J. Alloys Compd. 2018, 735, 643–653. [Google Scholar] [CrossRef]
  11. Tanaka, H. Relationship among glass-forming ability, fragility, and short-range bond ordering of liquids. J. Non-Cryst. Solids 2005, 351, 678–690. [Google Scholar] [CrossRef]
  12. Gasser, U.; Schofield, A.; Weitz, D. Local order in a supercooled colloidal fluid observed by confocal microscopy. J. Phys. Condens. Matter 2002, 15, S375. [Google Scholar] [CrossRef]
  13. Desgranges, C.; Delhommelle, J. Molecular simulation of the nucleation and growth of gold nanoparticles. J. Phys. Chem. C 2009, 113, 3607–3611. [Google Scholar] [CrossRef]
  14. Celtek, M.; Sengul, S. The characterisation of atomic structure and glass-forming ability of the Zr-Cu-Co metallic glasses studied by molecular dynamics simulations. Philos. Mag. 2018, 98, 783–802. [Google Scholar] [CrossRef]
  15. Liu, Z.; Zhang, R. AACSD: An atomistic analyzer for crystal structure and defects. Comput. Phys. Commun. 2018, 222, 229–239. [Google Scholar] [CrossRef]
  16. Ozgen, S.; Duruk, E. Molecular dynamics simulation of solidification kinetics of aluminium using Sutton–Chen version of EAM. Mater. Lett. 2004, 58, 1071–1075. [Google Scholar] [CrossRef]
  17. Yildiz, A.; Celik, F. Atomic concentration effect on thermal properties during solidification of Pt-Rh alloy: A molecular dynamics simulation. J. Cryst. Growth 2017, 463, 194–200. [Google Scholar] [CrossRef]
  18. Zhang, Y.; Jiang, S. Atomistic mechanisms for temperature-induced crystallization of amorphous copper based on molecular dynamics simulation. Comput. Mater. Sci. 2018, 151, 25–33. [Google Scholar] [CrossRef]
  19. Zhu, X.; Chen, K. Molecular dynamics simulation of homogeneous nucleation of K-Br cluster. J. Phys. Chem. Solids 2005, 66, 1732–1738. [Google Scholar] [CrossRef]
  20. Yu, W.; Wang, X.; Wang, H. Atomic simulation on evolution of nano-crystallizaion in amorphous metals. Trans. Nonferrous Met. Soc. China 2006, 16, s327–s331. [Google Scholar]
  21. Kazanc, S.; Ozgen, S.; Adiguzel, O. Pressure effects on martensitic transformation under quenching process in a molecular dynamics model of Ni-Al alloy. Phys. B 2003, 334, 375–381. [Google Scholar] [CrossRef]
  22. Kazanc, S. Molecular dynamics study of pressure effect on crystallization behaviour of amorphous Cu-Ni alloy during isothermal annealing. Phys. Lett. A 2007, 365, 473–477. [Google Scholar] [CrossRef]
  23. Parrinello, M.; Rahman, A. Crystal structure and pair potentials: A molecular-dynamics study. Phys. Rev. Lett. 1980, 45, 1196. [Google Scholar] [CrossRef]
  24. Haile, J.M. Molecular Dynamics Simulation: Elementary Methods; Wiley: New York, NY, USA, 1992. [Google Scholar]
  25. Rapaport, D.C.; Rapaport, D.C.R. The Art of Molecular Dynamics Simulation; Cambridge University Press: Cambridge, UK, 2004. [Google Scholar]
  26. Sutton, A.; Chen, J. Long-range finnis-sinclair potentials. Philos. Mag. Lett. 1990, 61, 139–146. [Google Scholar] [CrossRef]
  27. Dereli, G.; Cagin, T.; Uludogan, M.; Tomak, M. Thermal and mechanical properties of Pt-Rh alloys. Philos. Mag. Lett. 1997, 75, 209–218. [Google Scholar] [CrossRef] [Green Version]
  28. Honeycutt, J.D.; Andersen, H.C. Molecular dynamics study of melting and freezing of small Lennard Jones clusters. J. Phys. Chem. 1987, 91, 4950–4963. [Google Scholar] [CrossRef]
  29. Wang, L.; Liu, H.; Chen, K.; Hu, Z. The local orientational orders and structures of liquid and amorphous metals Au and Ni during rapid solidification. Phys. B 1997, 239, 267–273. [Google Scholar] [CrossRef]
  30. Jakse, N.; Pasturel, A. Ab initio molecular dynamics simulations of local structure of supercooled Ni. Chin. J. Chem. Phys. 2004, 120, 6124–6127. [Google Scholar] [CrossRef] [PubMed]
  31. William, J.; Mehl, R. Reaction kinetics in processes of nucleation and growth. Trans. Metall. Soc. AIME 1939, 135, 416–442. [Google Scholar]
  32. Avrami, M. Kinetics of phase change. J. Chem. Phys. 1939, 7, 1103–1112. [Google Scholar] [CrossRef]
  33. Li, X.; Yan, M.; Wang, J.; Huang, H.; Kong, C.; Schaffer, G.; Qian, M. Non-isothermal crystallization kinetics and mechanical properties of Al86Ni6Y4.5Co2La1.5 metallic glass powder. J. Alloys Compd. 2012, 530, 127–131. [Google Scholar] [CrossRef]
  34. Xie, X.; Gao, H. Calorimetric studies on the crystallization of Li2S–B2O3 glasses. J. Non-Cryst. Solids 1998, 240, 166–176. [Google Scholar] [CrossRef]
  35. Qi, Y.; Çağın, T.; Kimura, Y.; Goddard, W.A., III. Molecular-dynamics simulations of glass formation and crystallization in binary liquid metals: Cu-Ag and Cu-Ni. Phys. Rev. B 1999, 59, 3527. [Google Scholar] [CrossRef]
  36. Zhang, P.; Hui, W.; Zhang, Y.; Ren, X.; Zhang, D. Molecular dynamics simulation for the rapid solidification process of MgO–Al2O3–SiO2 glass-ceramics. J. Non-Cryst. Solids 2012, 358, 1465–1473. [Google Scholar] [CrossRef]
  37. Lu, K. Nanocrystalline metals crystallized from amorphous solids: Nanocrystallization, structure, and properties. Mater. Sci. Eng. 1996, 16, 161–221. [Google Scholar] [CrossRef]
  38. Çelik, F.A.; Kazanc, S.; Yildiz, A.; Ozgen, S. Pressure effect on the structural properties of amorphous Ag during isothermal annealing. Intermetallics 2008, 16, 793–800. [Google Scholar] [CrossRef]
Figure 1. Representation of the Honeycutt-Anderson method. The continuous line shows a root pair which makes a bond with each other. A dotted line indicates the neighbor atoms which bond with a root pair. A dashed line represents the bonds between neighbor atoms. The figure shows (left) 1331 bonded pair and (right) 2331 non-bonded pair.
Metals 08 00926 g001
Figure 2. The variation of the number of crystal bonded pairs with time for different Pt concentration rates in Pt-Pd alloy during annealing; (a) 400 K annealing temperature, (b) 700 K annealing temperature.
Metals 08 00926 g002
Figure 3. RDF curves obtained at different times and for different temperatures of the process at 300 and 400 K.
Metals 08 00926 g003
Figure 4. RDF curves obtained at different times and for different temperatures of the process at 300 and 700 K.
Metals 08 00926 g004
Figure 5. Fitting curves of ln(−ln(1 − x)) change with ln(t) for different annealing temperatures. (x is the volume fraction and t is the annealing time).
Metals 08 00926 g005aMetals 08 00926 g005b
Figure 6. The change of Avrami coefficients with a Pt concentration for different annealing temperatures.
Metals 08 00926 g006
Figure 7. The image of atomic distribution at a defined annealing temperature for alloys (yellow atoms are Pt atoms).
Metals 08 00926 g007
Figure 8. The image of atomic distribution at a defined annealing temperature for Pt90-Pd10 and 700 K. (yellow atoms are Pt atoms).
Metals 08 00926 g008

