Abstract
The laser hot-wire welding process was adopted to weld 7075 high-strength aluminum alloy. The influence laws of parameters on the weld formation were analyzed during laser hot-wire welding, and the microstructure characteristics and mechanical properties of welds were analyzed. The results showed that the parameters whose significance of influence on weld formation as ranked from high to low were laser power, current, gap width, welding speed and wire feeding rate. With the increase of wire temperature, the weld formation quality became better initially and then worse. Under the condition of optimized parameters, good weld formation could be obtained. The weld zone had a fine grain microstructure, and was in casting state consisted of dendritic crystal and equiaxed crystal. The heat affected zone mainly consisted of columnar crystal. The microhardness decreased gradually from base metal to heat affected zone then to weld zone. The tensile fracture of weld specimen occurred at the weld zone, and was in the ductile fracture state. The tensile strength of weld joint was 206 MPa and was 64.2% of base metal strength.
1. Introduction
High-strength aluminum alloy is widely used in high speed trains, aerospace, military industry and high-end equipment fields by virtue of its high strength, high corrosion resistance and other beneficial combination properties [1,2]. Laser processing is a promising technology that has been used widely in the material processing field [3,4,5,6,7,8,9]. Laser welding is also widely used in various material processing. Laser welding of high-strength aluminum alloy has many advantages, such as a small heat affected zone, little welding deformation, high bonding strength, and high welding efficiency [5,6,7,8,9]. However, it also has restrictions: (1) strict requirements applied to the butt joint gap of laser welding; (2) the welding process is unstable, the weld formation is unsatisfactory, and the collapse, pore, crack and other defects easily occur; (3) the weld elements are easily burnt and lost, and the weld performance is difficult to be regulated by controlling the element composition. During laser welding of aluminum alloy with filler wire, the introduction of welding wire greatly improves the welding quality. The main functions of welding wire include [10,11,12,13,14,15,16,17]: (1) providing essential elements for the weld joint, so as to enhance the weld performance and reduce weld crack and structure softening; (2) remedying element burning loss and obtaining full weld; (3) introducing nucleation particle and promoting weld microstructure refinement; (4) decreasing the accuracy requirement for joint assembly. However, during the welding process of high-strength aluminum alloy by laser welding with filler wire, both the welding wire and base metal need to absorb the laser energy for melting, and the aluminum alloy has high thermal conductivity and high reflectivity. Therefore, higher laser energy shall be introduced to realize the welding. However, during welding with much higher laser energy, the welding keyhole and molten pool fluctuate more frequently, which will cause an unstable welding process. The closure, collapse and necking of keyhole can easily cause more bubbles in molten pool, inducing poor welding quality. Therefore, improving the stability of dynamic behaviors of the keyhole and molten pool can not only reduce the generation of porosities, but also obtain better welding quality [18,19,20,21].
Laser hot-wire welding is a multi-heat source welding method combining a laser heat source and current heating welding wire [22]. The welding wire will be preheated by the current during the welding process, which can reduce the dependency of the welding wire on the laser heat source and enhance the utilization efficiency of the laser to melt the base metal. The preheating temperature of welding wire can be accurately controlled through adjusting the current, thus the feeding stability of the welding wire can be controlled and good welding quality can be obtained. Wen et al. [23] studied the transition behavior of welding wire in the laser hot-wire welding process. Different transition behaviors of welding wire were observed under different technological conditions through high-speed camera. At different preheating temperatures of welding wire, the welding wire had three transition modes: Dropping transition, fusing and broke transition and continuous transition. Good weld formation and a stable welding process could be obtained when the welding wire was in continuous transition mode. Ohnishi et al. [24] studied the high-power laser hot wire welding of high-strength steel plate. The results showed that the preheating of wire and sufficient laser power can produce a fully penetrated keyhole, which could effectively improve the gap tolerance and inhibit oxidation. Liu et al. [25] studied the laser hot-wire welding experimentally and numerically. The results showed that the hot wire not only reduced the laser energy consumption, but also the feeding stability of the welding wire was controlled and good welding quality was obtained. If the heating temperature of welding wire was too low, the welding wire needed to absorb more laser energy to melt; if the heating temperature of welding wire was too high, the welding wire would lose its rigidity and be difficult to be accurately fed into the molten pool; only when the welding wire was at appropriate preheating temperature, would the transition of welding wire could be continuous and stable, and good weld formation would be obtained [26,27].
This article focuses on the weld formation during laser hot-wire welding of 7075 high-strength aluminum alloy. The influence laws of different parameters (including hot-wire current, laser power, welding speed, wire feeding rate and gap width) on the weld formation were investigated through the orthogonal experimental method. The relations between welding wire temperature and welding quality were analyzed further. Then the parameters for good weld formation were optimized and obtained. The microstructures and mechanical properties of welds were also studied and discussed.
2. Materials and Methods
The base metal used in the experiments was 7075 high-strength aluminum alloy plate with 1.5 mm thickness, 40 mm width, and 100 mm length. Its heat treatment state was T-651 state. The welding wire was 7075 high-strength aluminum alloy with a diameter of 1.2 mm. The chemical compositions of the base metal and welding wire are shown in Table 1.

Table 1.
Chemical compositions of the base metal and welding wire (mass, wt%).
The TPS2700 wire feeder (Fronius International GmbH, Cologne, Germany) with wire heating function was used in experiments. The adjustable range of wire heating current of the wire feeder was 0–270 A, and the adjustable range of wire feeding rate was 0.5–22 m/min. During heating the welding wire, the positive pole of the wire feeder power source contacted the welding wire through the wire feeding head, while the negative pole contacted the base metal. When the current circuit was closed, the resistance heat would generate in the welding wire between the positive and negative poles. The heating temperature of welding wire could be adjusted by adjusting the current. Before the welding experiments, the relations between the current and the welding wire temperature were obtained firstly by using infrared thermal imager to detect the temperature of welding wire under different currents. The model of infrared thermal imager was FLIR A615 (Gongyue Electronics Co., Ltd., Shanghai, China), the measurable temperature range was +300~2000 °C and the accuracy was ±2 °C. The schematic diagram of welding wire temperature measuring is shown in Figure 1. The vertical height between the wire feeding head and the workpiece was 10 mm, the horizontal distance from the contact point between welding wire and base metal to the wire feeding head was 20 mm, and the wire feeding angle was 30°. During the testing, the contact between welding wire and base metal should be guaranteed. Infrared thermal imager was set on side to shoot the thermal images of welding wire. After measurement, the temperature of welding was obtain based on the thermal images.
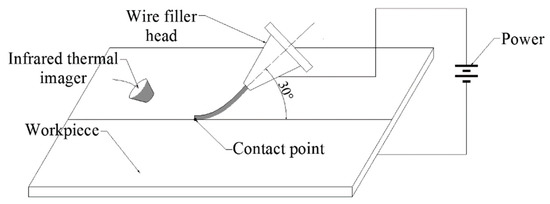
Figure 1.
Schematic diagram of wire temperature measuring.
The laser used in experiment was YLS-4000-CL fiber laser (IPG Photonics Corporation, Oxford, MA, USA). The rated output power of laser was 400~4200 kW. The emitted laser wavelength was 1070 nm. The laser beam was transmitted by optical fiber with a core diameter of 400 μm and focused by a lens with a 200 mm focal distance. The measured diameter of the focusing spot where the energy decreased to 86% of total energy was 0.48 mm. During the laser hot-wire welding process, the ABB IRB2400 six-axles robot (ABB Corporation, Beijing, China) was used to realize synchronous control to the laser and wire feeder. The schematic diagram of laser hot-wire welding is shown in Figure 2. Before the welding, the abrasive paper was used to grind the surface and side of the base metal and absolute ethyl alcohol was used to wipe the surface and side of the base metal to remove the surface organic films and impurities.
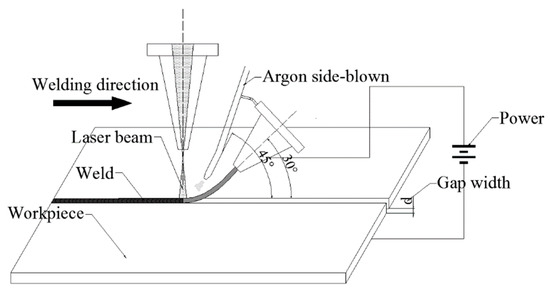
Figure 2.
Schematic diagram of laser hot-wire welding.
During the laser hot-wire welding, the current, laser power, wire feeding rate, welding speed and gap width were the main welding parameters which influence the weld formation. In order to study the influence laws of these five factors on the weld formation, an orthogonal table containing five factors and four levels is shown in Table 2. Other parameters were set to fixed values, such as defocusing distance, wire feeding angle and shielding gas flow rate. The defocusing distance of the laser beam was set to +8 mm. Under this defocusing distance, the size of spot irradiated on the material surface was about 9 mm, thus sufficient laser energy irradiating on the surface of the welding wire could be guaranteed. During welding, the argon was blown onto the top and bottom surface of base metal simultaneously, with a gas flow of 15 L/min. The side-blowing angle on the top surface was 45° with an arrangement form of front blowing. For the shielding gas of bottom surface, the argon was blown into the welding groove below the plate.
Table 2.
Standard orthogonal test table.
After welding, the appearance formation of the weld was observed and analyzed first. The welded specimen was cut and the cross section of weld and tensile sample was obtained, as shown in Figure 3. Then, the weld cross section was ground with abrasive paper and polished with diamond polishing agent with a grain size of 2.5 μm. Afterwards, 40% hydrofluoric acid (HF), 38% concentrated hydrochloric acid (HCI), 68% concentrated nitric acid (HNO3) and distilled water (H2O) were used to prepare a etchant liquid by a volume ratio of 2:1:1:40, and then the weld cross section was corroded. In the experiments, the morphology of cross section and the metallographic structure of welds were observed by a VHX-500FE digital microscope (KEYENCE Corporation, Osaka, Japan) with super wide-field view. The microhardness of the welds was measured by a HVS-1000A Vickers microhardness tester (Laizhou Huayin Test Instruments Co. Ltd., Yantai, China) with a load of 50 g on the indenter for 10 s. The tensile strength was tested by a RG4100 electronic universal testing machine (Wance Technologies Ltd., Shenzhen, China), and the drawing speed was 2 mm/min. the micro morphologies of fractures of tensile specimens were observed by using the JSM-6380LV scanning electron microscope (SEM) (JEOL, Tokyo, Japan).
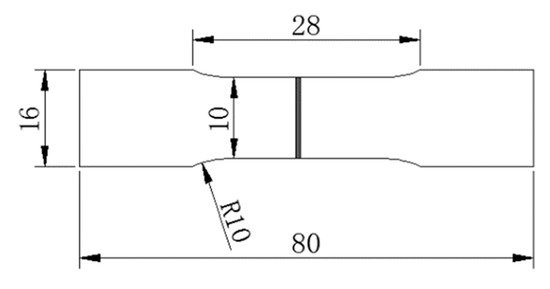
Figure 3.
Schematic diagram of tensile sample size (unit: mm).
3. Results and Discussion
3.1. Welding Temperature
The obtained thermal image of the welding wire in measuring is shown in Figure 4. The welding wire was sent out from the wire feeding head, and the wire temperature reached the maximum value near the contact point. As shown in Figure 4, the wire temperature was extracted from the point located near the contact point. During temperature extracting, different welding wire temperatures were obtained respectively under the conditions of different wire feeding rates and heating currents. Under one set of parameters, 5 temperature values at 5 different times were extracted at the same temperature measurement point shown in Figure 4. And then the average temperature value was calculated as the welding wire temperature value under one set of parameters. After obtaining the welding wire temperature values under all parameter conditions, the relationships between wire feeding rate, current and wire temperature were obtained, as shown in Figure 5.
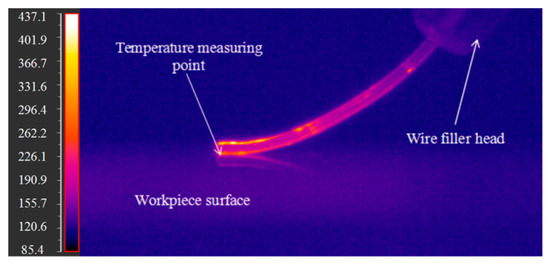
Figure 4.
Thermal image of welding wire.
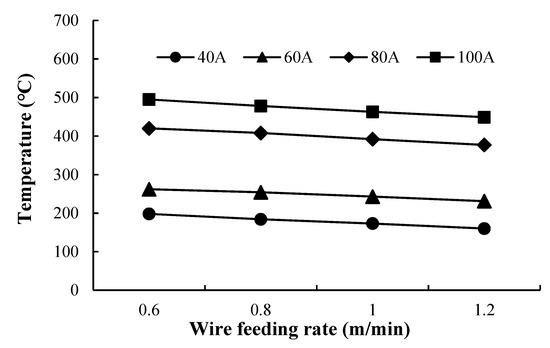
Figure 5.
The relationships between wire feeding rate, current and wire temperature.
As shown in Figure 5, the temperature of the welding wire increased with the increase of current, while the temperature decreased with the increase of wire feeding rate. The reason was that when the wire feeding rate increased, the length of welding wire to be heated within the unit time increased, thus the welding wire temperature decreased. When the current increased from 60 A to 80 A, the welding wire temperature increased by a large amplitude. That was because, with the increase of welding wire temperature, the resistivity of welding wire increased significantly, and more resistance heat was generated within the unit time, so the increasing amplitude of the temperature was large.
3.2. Influence of Parameters on Weld Formation
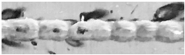
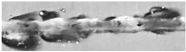
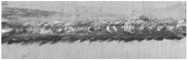
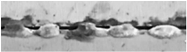
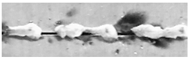
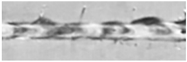
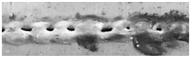
Table 3 shows the weld surface morphologies and cross section morphologies corresponding to 16 orthogonal experiments.
Table 3.
Weld surface morphology and cross-section morphology.
The weld formation quality of laser hot-wire welding includes both the surface morphology and the cross section morphology of the weld. Here, the weld surface morphology was judged according to whether the weld surface was continuous and whether the collapse and undercutting existed. The weld cross section morphology was judged according to whether the weld was penetrated and whether the weld reinforcement was within the reasonable range. In order to evaluate the weld surface formation and weld section morphology, the scoring criteria was established based on the welding standard of aluminum structures of Australian/New Zealand AS/NZS1665:2004, as shown in Table 4. The weld formation morphology was divided into four grades: Grade A for good; grade B for ordinary; grade C for poor; grade D for unconnected state. The scores of different grades were: 20 for grade A; 15 for grade B; 10 for grade C; 5 for grade D. The comprehensive score of weld morphology was obtained by adding the surface morphology score and the cross section morphology score. There were three scoring factors in the evaluation of cross section morphology. The final score of cross section morphology was chosen from the lowest score among these three scoring factors. The weld morphology grades and scores corresponding to the 16 orthogonal experiments are shown in Table 5.
Table 4.
Evaluation standard for welding quality of aluminum alloy.
Table 5.
Welding quality score results.
On the basis of the comprehensive scores in Table 5, the range analysis was conducted to the orthogonal experiment results, and the analysis results were shown in Table 6. Where, ki was the average score of experiment group under the same level of one factor, and R was the range between the maximum and minimum ki of each factor. A higher ki value represented better weld surface morphology and cross section morphology obtained under the corresponding level. The range R represented the fluctuation degree of welding quality within the variation of levels of one factor. A larger R value represented more prominent influence of the factor on the weld formation quality. According to the data in Table 6, the influence laws of welding factors and levels on the weld formation quality were obtained and shown in Figure 6.
Table 6.
Range analysis of welding quality score.
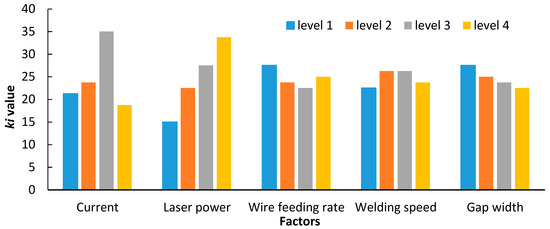
Figure 6.
Relationships between the weld formation and the factors and levels.
As shown in Table 6, during laser hot-wire welding, the factors whose significance of influence on the weld formation as ranked from high to low were laser power, current, gap width, welding speed and wire feeding rate. According to Figure 6, the ki values of laser power and current fluctuated greatly with the change of levels, indicating that the weld formation quality was significantly influenced by laser power and current. This was because both the laser power and the current were important heat sources during welding process, which simultaneously decided the pool width, weld penetration and the melting degree of welding wire. During laser hot-wire welding, the current only heated the welding wire, while the laser heated both base metal and welding wire. Laser power had greater influence on the weld penetration and pool width than current. Therefore the laser power had the greatest influence on weld formation. Moreover, the ki values of wire feeding rate, welding speed and gap width under different levels were small and their differences were small, indicating that their influences on weld formation quality were small and similar.
On the basis of the relation between current and welding wire temperature shown in Figure 5 and the influence laws of current on the weld formation of laser hot-wire welding shown in Figure 6, the relationships between the welding wire temperature and the weld formation quality coefficient ki were obtained, as shown in Figure 7. The figure showed that as the welding wire temperature increased from 200 °C to about 400 °C, the weld formation quality coefficient ki increased gradually, which represented the weld formation quality becoming better. However, as the welding wire temperature increased further above 400 °C, the weld formation quality coefficient ki decreased, which represented the weld formation quality becoming worse. During laser hot-wire welding, if the welding wire heating temperature was too low, more laser energy would be absorbed by the wire, and less laser energy would be used for melting the base metal, which could cause lack of fusion to the weld. If the welding wire heating temperature was too high, the welding wire would absorb less laser energy and more laser energy would be used for melting the base metal, which could cause over-penetration to the weld. Therefore, with the gradual increase of welding wire temperature, the ki increased firstly and then decreased. This indicated that an optimal range existed for the welding wire heating temperature during laser hot-wire welding. Thus, the matching relationship existed between current and laser power. When the laser power matched the current, the welding wire could be preheated to an appropriate temperature and could be stably fed and fully fused, the base metal could reach an ideal depth of fusion, and good weld formation could be obtained.
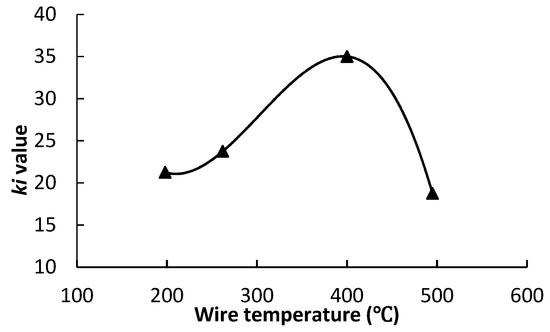
Figure 7.
Relationship between wire temperature and weld formation ki value.
3.3. Microstructure
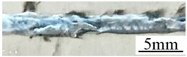
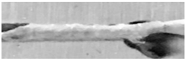
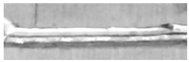
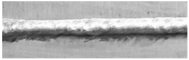
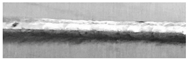
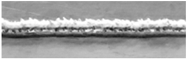
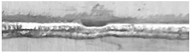
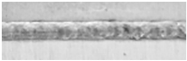
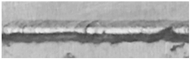
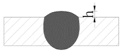
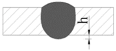
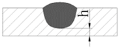
Based on the orthogonal experiments, the welding parameters were further optimized. During the experiment, the best matching values of laser power and current were obtained first, and then the other process parameters were optimized through single factor analysis, and finally a set of optimal parameters was obtained. The optimized parameters were: Current 90 A, laser power 1400 W, wire feeding rate 0.6 m/min, welding speed 8 mm/s, and gap width 0.1 mm. The weld surface morphology and cross section morphology shown in Figure 8 were obtained by welding under this group of parameters. As shown in the figure, the weld surface was continuous, the weld reinforcements on the top and bottom surface of the weld were appropriate, and the weld formation was good.
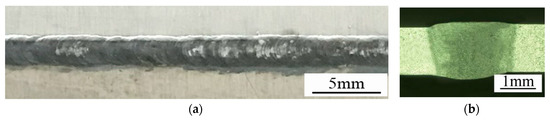
Figure 8.
Weld surface and cross section morphology. (a) Weld surface; (b) Cross section.
Figure 9 shows the metallographic images of the base metal and the weld cross section. As shown in the figure, the base metal presented a rolled metallographical morphology, and the grains were distributed in fibrous form along the rolling direction. The grains in weld zone were dendritic crystal and partially equiaxed crystal and the metallographic morphology of the weld zone was in casting state. The dendritic crystal grown and formed along the temperature gradient direction during the rapid cooling process of weld. The temperature gradient near the weld center was very small during the rapid cooling process of weld, and the constitutional supercooling phenomenon existed in the molten metal near weld center. Therefore, the crystal nucleus could form in the molten metal near weld center and grow into equiaxed crystal. The grains of heat affected zone of weld were mainly columnar crystal. Under the influence of temperature gradient, the columnar crystal in heat affected zone was distributed along the temperature gradient direction.
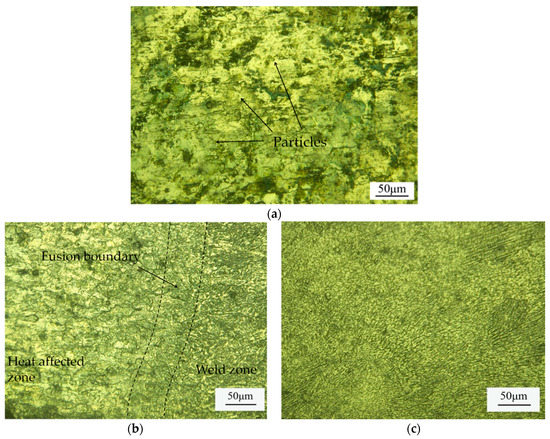
Figure 9.
Metallographic structure of base metal and weld cross section. (a) Base metal; (b) Heat affected zone; (c) Weld zone.
Compared with the grain size of the base metal, the grains in the weld zone were clearly refined, while the grains in the heat affected zone were thicker. The reason was that after a heat circulation of rapid heating, melting and re-solidifying, the grains in the weld zone did not have enough time to grow up. For the heat affected zone, the original grains grew up further and formed a thick structure under the influence of high temperature. In addition, as shown in Figure 9a, a large number of granular secondary phases existed in base metal. These granular secondary phases were gradually separated out from the solid solution during the rolling treatment process of base metal, which played a role of intensifying structure properties of base metal.
3.4. Microhardness
Figure 10 shows the detected microhardness of the weld specimen. As shown in the figure, the softening phenomenon occurred in the weld zone. The average hardness of the base metal was 182 HV0.05, while the average microhardness of the weld zone was 114 HV0.05 (62.6% of base metal). The metallographical structure analysis showed that the weld zone presented a casting metallographical morphology after re-melting and rapid cooling during welding process. The swelling existed in the casting metallographical structure of the weld zone, which caused the decrease of microhardness. However, the base metal had a rolled metallographical structure, which was compact and had strengthening secondary phase reinforced mechanical properties, so that the base metal had higher microhardness. Although the grain size of weld zone was less than that of the base metal and finer grains could help to improve the microhardness of the weld, it still could not remedy the low microhardness feature of the casting structure. The microhardness of the heat affected zone decreased gradually from the base metal to the weld zone. The reason was that different positions away from the weld zone suffered different degrees of heat effect. The position close to weld zone suffered greater influence of high temperatures, and the microhardness was low. The position close to the base metal suffered smaller influence of high temperatures, and then the microhardness was closer to that of the base metal. As shown in Figure 10, the heat affected zone had a big width about 0.98 mm. This was mainly because 7075 aluminum alloy had high heat conductivity coefficient, thus the high temperature transmission distance was large.
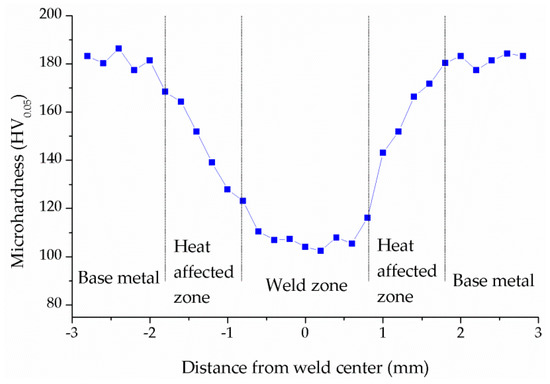
Figure 10.
Results of microhardness.
3.5. Tensile Strength
The tensile strength of the base metal and weld specimen were tested, and the tested results were listed in Table 7. The tensile strength of the base metal was 321 MPa, and the fracture occurred at the middle part of test specimen. The tensile strength of the weld specimen was 206 MPa, which was about 64.2% of that of base metal, and the fracture occurred at the weld zone. The elongation of the weld specimen was less than half that of the base metal.
Table 7.
Tensile test results.
In order to further analyze the fracture mode, the fracture morphologies were observed using a scanning electron microscope, as shown in Figure 11. The fracture of the base metal had larger-size and deep dimples, and prominent tearing ridges existed around the dimples. Thus, it could be inferred that the base metal was of ductile fracture morphology. In addition, the fragmentized grains could be clearly observed in the dimple at base metal fracture. These grains were the strengthening secondary phase which played a role in enhancing the strength of the base metal. At the weld fracture, a large number of small-size and shallow dimples were observed, and the tearing ridges were also distributed around the dimples, so that the weld specimen was also of ductile fracture morphology. However, at the weld fracture, the depth and size of the dimple were obviously smaller than those at base metal fracture, indicating that the base metal had larger elongation than the weld. This result was mutually verified with the elongation results in Table 7. There was no strengthening phase observed in the dimple at the weld fracture, which was one of the reasons why the tensile strength of the weld specimen was lower than that of the base metal. Another reason was that the rolled structure of the base metal had higher strength than the casting structure of the weld specimen.
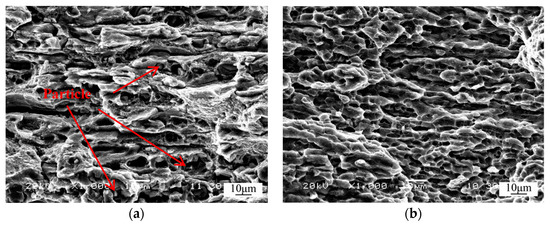
Figure 11.
Fracture morphology. (a) Fracture of base metal (b) Fracture of weld.
4. Conclusions
This article studied experimentally the influence laws of parameters on weld formation during laser hot-wire welding of 7075 high-strength aluminum alloy, and the metallographic structure and mechanical properties of the weld were analyzed. The following important conclusions were drawn:
- (1)
- The parameters whose significance of influence on the weld formation as ranked from high to low were laser power, current, gap width, welding speed and wire feeding rate. The laser power and current had relatively higher significances than the others, because they were important heat sources during welding process, which simultaneously decided the pool width, weld penetration and the melting degree of the welding wire.
- (2)
- With the increase of welding wire temperature, the weld formation quality became better initially and then worsened. If the welding wire heating temperature was too low, it was easy to cause lack of fusion to the weld. If the welding wire heating temperature was too high, it was easy to cause over-penetration to the weld. This indicated that an optimal range existed for the welding wire heating temperature during laser hot-wire welding.
- (3)
- High-quality weld formation could be obtained when the current was 90 A, laser power was 1400 W, wire feeding rate was 0.6 m/min, welding speed was 8 mm/s and gap width was 0.1 mm, during laser hot-wire welding of 7075 aluminum alloy with 1.5 mm thickness.
- (4)
- The weld zone structure was a casting metallographic structure consisting of refined dendritic crystal and equiaxed crystal, and the heat affected zone had thick columnar crystal. The microhardness decreased gradually from base metal to heat affected zone and then to weld zone. The average microhardness of the weld zone was 114 HV0.05. The tensile fracture of the weld specimen occurred at the weld zone. The tensile strength of the weld joint was 206 MPa, which was 64.2% of the base metal strength.
Author Contributions
Conceptualization, formal analysis, investigation and supervision, S.L.; data curation, W.X.; writing-original draft preparation, G.X.; writing-review & editing, B.C.
Funding
This research was supported by the National Natural Science Foundation of China (No. 51505145), and the Hunan Provincial Key Laboratory of High Efficiency and Precision Machining of Difficult to-Cut Material (No. E21536).
Conflicts of Interest
The authors declare no conflict of interest.
References
- Azimi, A.; Fallahdoost, H.; Nejadseyfi, O. Microstructure, mechanical and tribological behavior of hot-pressed mechanically alloyed Al-Zn-Mg-Cu powders. Mater. Des. 2015, 75, 1–8. [Google Scholar] [CrossRef]
- Vijaya Kumar, P.; Madhusudhan Reddy, G.; Srinivasa Rao, K. Microstructure, mechanical and corrosion behavior of high strength AA7075 aluminium alloy friction stir welds-Effect of post weld heat treatment. Def. Technol. 2015, 11, 362–369. [Google Scholar] [CrossRef]
- Martinez, S.; Lamikiz, A.; Ukar, E.; Calleja, A.; Arrizubieta, J.A.; Lopez de Localle, L.N. Analysis of the regimes in the scanner-based laser hardening process. Opt. Laser Eng. 2017, 90, 72–80. [Google Scholar] [CrossRef]
- Calleja, A.; Tabernero, I.; Fernandez, A.; Celaya, A.; Lamikiz, A.; Lopez de Localle, L.N. Improvement of strategies and parameters for multi-axis laser cladding operations. Opt. Laser Eng. 2014, 56, 113–120. [Google Scholar] [CrossRef]
- Wang, J.C. Development and expectation of laser welding technology. Laser Technol. 2001, 25, 48–54. (In Chinese) [Google Scholar]
- Cai, H.; Xiao, R.S.; Chen, K. Mechanical Property of CO2 Laser Welded Joint of 1420 Aluminum-Lithium Alloy. Chin. J. Lasers 2009, 36, 122–125. (In Chinese) [Google Scholar]
- Zhao, H.; Niu, W.; Zhang, B.; Lei, Y.P.; Kodama, M. Modelling of keyhole dynamics and porosity formation considering the adaptive keyhole shape and three-phase coupling during deep-penetration laser welding. J. Phys. D Appl. Phys. 2011, 44, 1–13. [Google Scholar] [CrossRef]
- Qi, J.F.; Zhang, D.Y.; Xiao, R.C.; Chen, K.; Zuo, T.C. Joint performance of CO2 laser beam welding 5083-H321 aluminum alloy. China Weld. 2007, 16, 40–45. (In Chinese) [Google Scholar]
- Yu, Y.C.; Wang, C.M.; Yu, S.F. Microstructures and property of butt laser joints of aluminium alloy 5A06 sheets with filler. Laser Technol. 2010, 34, 34–36. (In Chinese) [Google Scholar]
- Yang, D.; Li, X.; He, D.; Huang, H. Effect of minor Er and Zr on microstructure and mechanical properties of Al–Mg–Mn alloy (5083) welded joints. Mater. Sci. Eng. A Struct. 2013, 561, 226–231. [Google Scholar]
- Croteau, J.R.; Griffiths, S.; Rossell, M.D.; Leinenbach, C.; Kenel, C.; Jansen, V.; Seidman, D.N.; Dunand, D.C.; Vo, N.Q. Microstructure and mechanical properties of Al-Mg-Zr alloys processed by selective laser melting. Acta Mater. 2018, 153, 35–44. [Google Scholar] [CrossRef]
- Näsström, J.; Frostevarg, J.; Kaplan, A.F.H. Multipass laser hot-wire welding: Morphology and process robustness. J. Laser Appl. 2017, 29, 022014. [Google Scholar] [CrossRef]
- Liu, F.C.; Zhou, B.S.; Mao, Y.Q.; Huang, C.P.; Chen, Y.H. Microstructure and mechanical properties of laser welding joints between 2198/2060 Al-Li alloys. Metal. Sci. Technol. 2018, 34, 111–122. [Google Scholar]
- Tzeng, Y.C.; Wu, C.T.; Lee, S.L. The effect of trace Sc on the quench sensitivity of Al-7Si-0.6Mg alloys. Mater. Lett. 2015, 161, 340–342. [Google Scholar] [CrossRef]
- Lu, G.F.; Zhang, L.J.; Pei, Y.; Ning, J.; Zhang, J.X. Study on the size effects of H-Shaped fusion zone of fiber laser welded AZ31 joint. Metals 2018, 8, 198. [Google Scholar]
- Tzeng, Y.C.; Chung, C.Y. Effects of trace amounts of Zr and Sc on the recrystallization behavior and mechanical properties of Al-4.5Zn-1.6Mg alloys. Mater. Lett. 2018, 228, 270–272. [Google Scholar] [CrossRef]
- Näsström, J.; Frostevarg, J.; Kaplan, A.F.H. Arc formation in narrow gap hot wire laser welding. Weld. J. 2018, 97, 171–178. [Google Scholar]
- Peng, J.; Li, L.Q.; Lin, S.Y.; Deng, Z.; Zhang, F.R. Melting of filler metal and transfer stability in laser welding with pre-melting liquid filler. Trans. China Weld. Inst. 2016, 7, 9–12. (In Chinese) [Google Scholar]
- Jia, C.B.; Liu, X.F.; Wu, C.S.; Lin, S.B. Stereo analysis on the keyhole and weld pool behaviors in K-PAW with triple CCD cameras. J. Manuf. Process. 2018, 32, 754–762. [Google Scholar] [CrossRef]
- Ai, Y.W.; Jiang, P.; Wang, C.M.; Mi, G.Y.; Geng, S.N. Experimental and numerical analysis of molten pool and keyhole profile during high-power deep-penetration laser welding. Int. J. Heat Mass Transf. 2018, 126, 779–789. [Google Scholar] [CrossRef]
- Zeng, Z.; Oliveira, J.P.; Bu, X.Z.; Yang, M.; Li, R.X.; Wang, Z.M. Laser welding of BTi-6431S high temperature titanium alloy. Metals 2017, 7, 504. [Google Scholar] [CrossRef]
- Liu, S.; Liu, W.; Harooni, M.; Ma, J.J.; Kovaceic, R. Real-time monitoring of laser hot-wire cladding of Inconel 625. Opt. Laser Technol. 2014, 62, 124–134. [Google Scholar] [CrossRef]
- Wen, P.; Shan, J.G.; Zheng, S.Q.; Wang, G. Control of wire transfer behaviors in hot wire laser welding. Int. J. Adv. Manuf. Technol. 2016, 83, 9–12. [Google Scholar]
- Ohnishi, T.; Kawahitito, Y.; Mizutani, M.; Katayama, S. Butt welding of thick, high strength steel plate with a high power laser and hot wire to improve tolerance to gap variance and control weld metal oxygen content. Sci. Technol. Weld Join. 2013, 18, 314–322. [Google Scholar] [CrossRef]
- Liu, W.; Ma, J.J.; Liu, S.; Kovacevic, R. Experimental and numerical investigation of laser hot wire welding. Int. J. Adv. Manuf. Technol. 2015, 78, 1485–1499. [Google Scholar] [CrossRef]
- Kadoi, K.; Shinozaki, K.; Yamamoto, M.; Owaki, K.; Inose, K.; Takayanagi, D. Development of high-efficiency/high-quality hot-wire laser fillet welding process. J. Japan Weld. Soc. 2011, 29, 62–65. [Google Scholar] [CrossRef]
- Metzbower, E.A.; Bhadeshia, H.K.D.H.; Phillips, R.H. Microstructures in hot wire laser beam welding of HY 80 steel. Metal Sci. Technol. 1994, 10, 56–59. [Google Scholar] [CrossRef]


© 2018 by the authors. Licensee MDPI, Basel, Switzerland. This article is an open access article distributed under the terms and conditions of the Creative Commons Attribution (CC BY) license (http://creativecommons.org/licenses/by/4.0/).