Abstract
In secondary coolant system of the pressurized water reactors, the reduced corrosion products such as metallic Cu and Pb particles were accumulated in the pores of the magnetite flakes and electrically contacted to the steam generator materials. The micro-galvanic corrosion behavior of steam generator materials (steam generator tube materials: Alloy 600 and Alloy 690, steam generator tube sheet materials: SA508 Gr.3) contacted to the corrosion products (magnetite, Cu, and Pb) was investigated in an alkaline solution. The steam generator materials considered in this study were all the anodic elements of the galvanic pair because their corrosion potentials were lower than those of the corrosion products. The corrosion rate of the steam generator materials was increased by the galvanic coupling with the each corrosion products, and was more accelerated with increasing the area ratio of the corrosion products to the steam generator materials. Among the corrosion products, Cu has the largest galvanic effect on steam generator materials in the pores when area ratio of cathode to anode is 10.
1. Introduction
In nuclear power plants, Fe ions were released from the surface of carbon steel piping and were combined with dissolved oxygen to form a magnetite in a secondary coolant system of the pressurized water reactors (PWRs). The magnetite particles are transported into the steam generators (SGs) from the carbon steel piping and deposited on the surface of SG heat exchanger tubes, top of tube sheet, and tube support structures [1]. The magnetite adhering to the SG structures causes an acceleration of the corrosion of the various SG materials [2,3].
Recently, many investigations on the galvanic effect by magnetite on the corrosion behavior of secondary coolant system materials such as nickel-based alloys [4,5,6] and carbon steel [7,8,9] have been reported. It is well known that the SG deposits mainly consist of magnetite and are porous in nature [10,11]. Unlike hematite, magnetite has a high electrical conductivity of 0.025 µs/cm at room temperature [12]. Hence, an electric contact between SG structural materials and magnetite deposits could be occurred. In various secondary environments, it was reported that the corrosion potential of magnetite was higher than those of secondary system materials and the corrosion rate of the SG materials was greatly increased due to the shift in their potentials to the anodic direction [4,5,6,7,8,9]. Through the galvanic effect of magnetite on the SG materials, the mechanism on the galvanic corrosion of the secondary system materials coupled to magnetite is well established.
Although the magnetite mainly composed of SG tube deposits, metallic Cu and Pb particles were also constituted the SG tube deposits in secondary coolant systems [13,14]. In particular, Cu and Pb particles were concentrated within the micro-pores of the SG deposits due to the boiling behavior. Consequently, the surface of SG materials is in electrical contact with the metallic Cu and Pb particles and thus would affect in the corrosion behavior of SG materials. Therefore, a need exists to know about the galvanic corrosion behavior between SG materials and corrosion products such as metallic Cu and Pb in secondary water of PWRs. However, there are few studies for the effect of Cu and Pb on the galvanic corrosion of SG materials in the simulated secondary water of PWRs. In addition, there is no research comparing the degree of galvanic effect by the various corrosion products (magnetite, Cu, and Pb) constituting SG deposits.
To characterize the SG deposits in nuclear power plants, many researches have been performed. The Electric Power Research Institute (EPRI) technical report issued in 1996 showed an overview of the nature and characteristics of SG deposits [13]. Recently, Diego and Merino [15] presented the microstructural characterization of SG deposits and studied the effect of different mitigation methods, in order to avoid the formation of hard SG deposit. Some researchers investigated the effect of the porosity and thickness of SG tube deposit on the thermal conductivity [16]. However, they could not show the microstructure and porosity of the cross-section of SG deposits because the fracture surfaces of SG deposits were too rough. In particular, the investigation on the impurity concentration within the micro-pores formed on the SG deposits has not been conducted.
In this study, the micro-galvanic corrosion behavior of SG materials (SG heat exchanger tube materials: Alloy 600 and Alloy 690, SG tube sheet materials: SA508 Gr.3) in pores formed on the magnetite flakes was investigated in an alkaline solution. The magnetite flake samples taken from an operating SG of PWR were analyzed to identify the various corrosion products accumulated in the pores of the flakes. In addition, we analyzed the impurity concentration within the micro-pores of SG deposit and thermodynamically calculated the stable phases of impurities such as Cu and Pb. To simulate the real magnetite accumulated on the surface of SG materials, the magnetite films were electrodeposited on the surface of Alloy 690 substrate from a Fe(III)-TEA electrolyte using potentiostatic technique. Then, the electrochemical corrosion parameters of SG materials and the corrosion products (magnetite, Cu, and Pb) were measured in the alkaline solution through the various electrochemical corrosion techniques.
2. Materials and Methods
2.1. Materials
SG structural materials (SG heat exchanger tube materials: Alloy 600 and Alloy 690, SG tube sheet materials: SA508 Gr.3) and corrosion products (purity 99.99% Cu and Pb plates) were cut into a size of 10 mm × 5 mm × 1 mm for electrochemical corrosion tests. The specimens were ground using silicon carbide papers down to #1000. The chemical composition of the various SG materials is given in Table 1.

Table 1.
Chemical composition of the SG materials of the PWR (wt.%).
Magnetite flake samples were collected from the outer surface of SG tubes of the operating PWR after Cycle 27 during sludge lancing. The SG model is a Westinghouse model-F and the material of SG heat exchanger tubes is thermally treated Alloy 600. The samples taken from the sludge lancing were dried in an inert atmosphere at approximately 80 °C for 12 h. In Electric Power Research Institute (EPRI) report [17], it is recommended that temperatures over 100 °C should be avoided during the drying to prevent the decomposition of any resin fines or beads in the sample. It is generally not advisable to dry SG deposit samples in air due to the potential for conversion of typical deposit species (e.g., magnetite, metallic copper, etc.) to more oxidized phases (e.g., hematite, copper oxide, etc.), which are not representative of species predicted in a steam generator of PWR [17]. After the drying, the samples were separated into different deposit types such as tube scale, powder sludge, and hard top of the tube-sheet sludge. Separated samples were stored in an vacuum desiccator. The elemental composition of the magnetite flakes was analyzed by induced coupled plasma atomic emission spectroscopy (ICP-AES) using a Thermo Scientific iCAP 7000 (Thermo Scientific, Cambridge, UK) series for quantitative analysis. Calibration was conducted with external standards. Standard solutions were produced by diluting a 1000 mg/L single-element solution (Plasma CAL, SCP Science, Baie D’Urfè, QC, Canada). The samples were dissolved in 20 mL aqua regia (5 mL concentrated nitric acid + 15 mL concentrated hydrochloric acid).
2.2. Electrodeposition of the Mmagnetite Film
In this work, the magnetite flakes collected from the operating PWR are not suitable for conducting the electrochemical experiments because the flake samples are too brittle to fabricate the electrochemical specimens. Hence, to evaluate the electrochemical corrosion behavior of magnetite itself, it is necessary to make a rigid and dense magnetite electrode. Therefore, a thick magnetite layer was electrochemically deposited on the substrate. An electrodeposition solution was mixed with 2 M NaOH, 0.1 M triethanolamine (TEA) and 0.043 M Fe2(SO4)3. The electrodeposition of magnetite film was performed using a PAR273 potentiostat (Ametek, Berwyn, PA, USA) with the Power suite software (version 2.58, Ametek, Berwyn, PA, USA) and a three-electrode cell system. A saturated calomel electrode (SCE) was used as a reference electrode and a platinum wire was used as a counter electrode. Magnetite films were electrodeposited on the Alloy 690 substrate at an applied potential of −1.05 VSCE at 80 °C for 2 h. After electrodeposition, the magnetite electrodes were carefully rinsed with deionized water and dried in an oven at 60 °C for 10 min.
2.3. Microstructural Analysis
The SG deposit flakes were ion-milled by a focus ion beam (FIB) to observe the cross-section of the flakes. The corrosion products constituting the SG deposit flakes and chemical impurities within the pores of flakes were analyzed by a scanning electron microscopy (SEM) equipped with an energy-dispersive X-ray spectrometer (EDS) analysis. The phase distribution map and preferred orientation of the flakes were also analyzed by a SEM combined with electron back-scatter diffraction (EBSD) analyzer.
To verify that a pure magnetite film was produced, the microstructure of electrodeposited magnetite films were analyzed by high resolution X-ray diffraction (HR-XRD) using a Rigaku SmartLab (Rigaku, Tokyo, Japan) apparatus with Cu-Ka radiation. The morphology of the electrodeposited magnetite films was analyzed to examine that the Alloy 690 substrate was exposed to the solution before and after the electrochemical tests using a SEM.
2.4. Electrochemical Tests
Two different electrochemical techniques were used to study galvanic corrosion of SG materials in simulated secondary water of PWRs: potentiodynamic polarization test and polarization resistance measurement. The potentiodynamic polarization tests were carried out using a PAR273 potentiostat (EG&G) with Power suite software. The potentiodynamic polarization test was conducted in deaerated aqueous solution at 80 °C. The pH of the test solution was adjusted to be 9.0 at 25 °C with ethanolamine (ETA), which is used as a major organic reagent to control the pH of secondary water in PWRs. Test solutions were deaerated by continuously purging with high-purity (99.98%) nitrogen gas at a rate of 100 cc/min during the tests. This test environment was chosen to simulate a secondary water chemistry of PWRs. An SCE and a platinum wire were used as a reference electrode and counter electrode, respectively. After the open circuit potential (OCP) was stabilized, polarization scans for SG materials and corrosion products were started from 10 mV below the OCP to the anodic direction or from 10 mV above the OCP to the cathodic direction. The scan rate of the test was 1 mV/s. Each anodic and cathodic polarization curve was finally combined in one graph.
The corrosion rates of SG materials were estimated by means of the Tafel extrapolation of the cathodic and anodic curve between 50 and 100 mV away from the corrosion potential (Ecorr). The galvanic potential (Ecouple) and the galvanic current density (icouple) of the galvanic couple were obtained from the potentiodynamic polarization curves based on the mixed potential theory.
If the Ecouple is closed to the Ecorr of the materials acting as an anode, icouple will be slightly different from the measured anodic current density of the anode because the measured anodic current density is greatly influenced by the cathodic current density in this region. In other words, the measured anodic current density during the polarization scan is different from the actual anodic current density in potential range close to the corrosion potential (weak polarization region) as seen in Equation (1) below.
where imeasured a is the anodic current density measured by using the potentiostat. ia and ic are the current density for real anodic and cathodic reaction, respectively.
To more accurately obtain the Ecouple and the icouple of the SG materials coupled to the corrosion products, the measured anodic polarization curve were estimated by using Equation (1) and (2). Here, ic can be obtained from the following Equation (2):
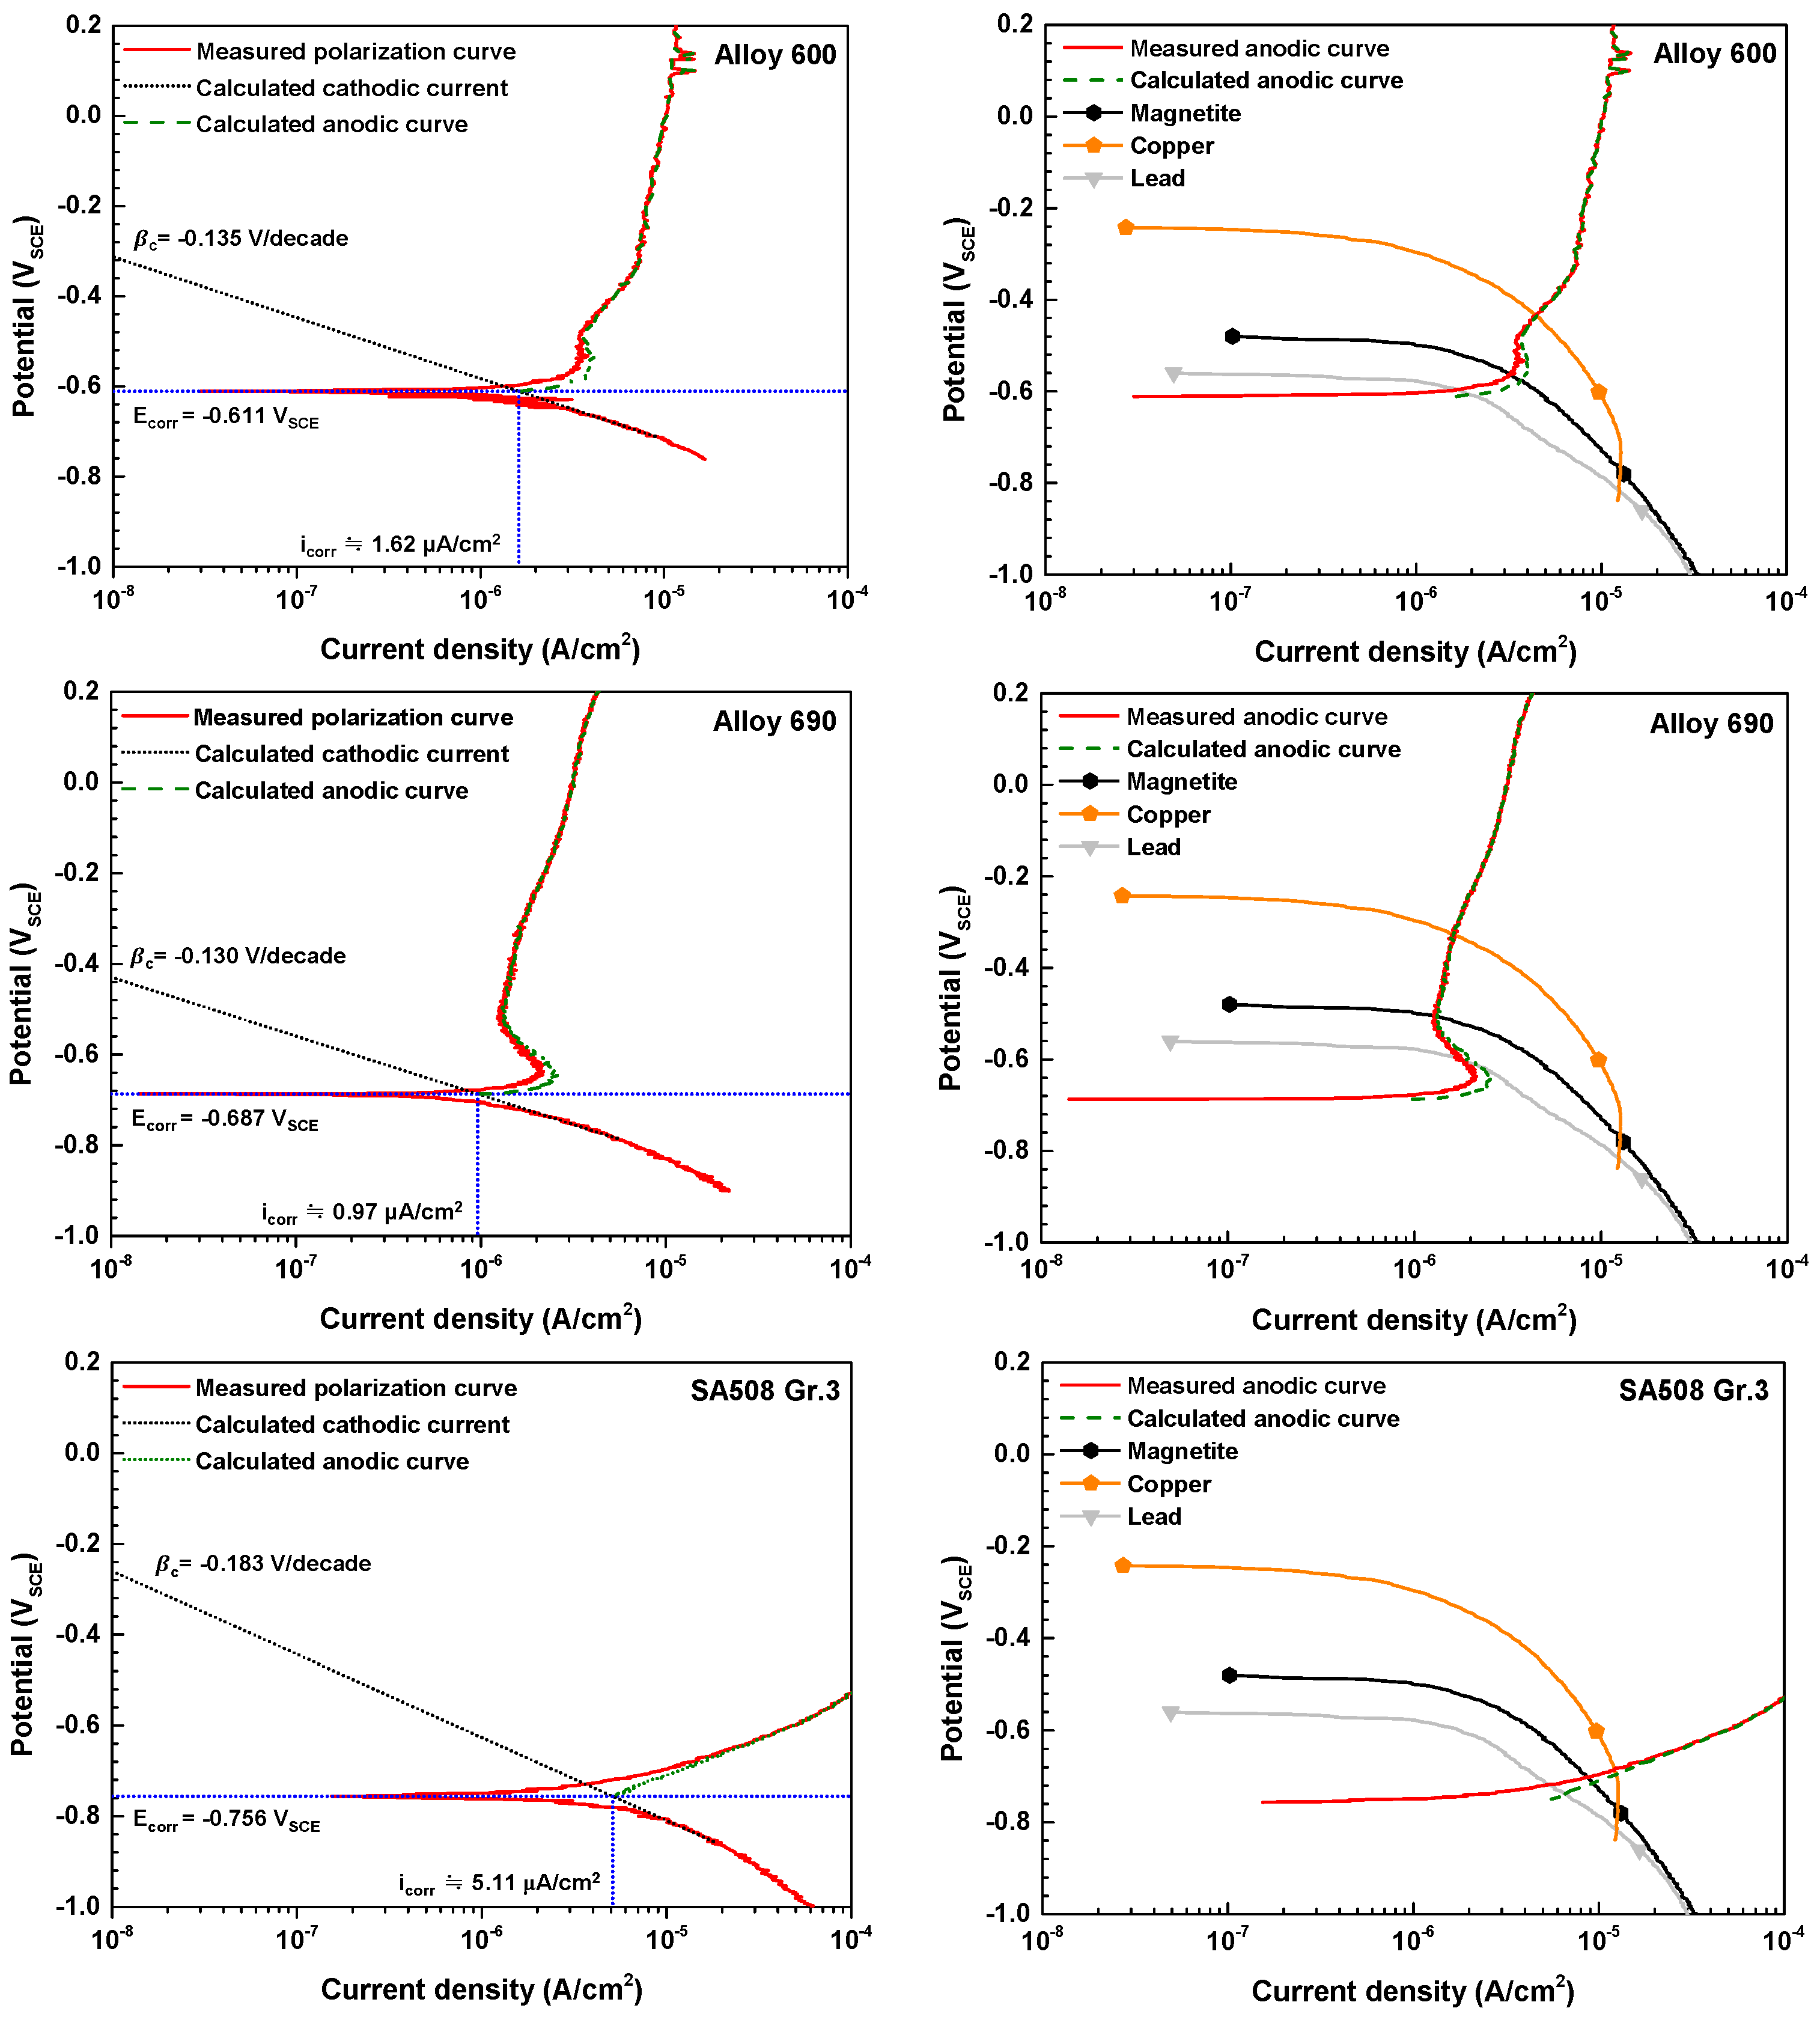
where ηc is the overpotential (∆E) and icorr is the corrosion current density obtained from potentiodynamic curve. βc is Tafel constant for cathodic reaction. From the cathodic polarization curve, βc of Alloy 600, Alloy 690, and SA508 could be derived as −0.135, −0.130, and −0.183 V/decade, respectively. By using Equations (1) and (2), real anodic current density ia were obtained and thus, more accurate the icouple of the SG materials at Ecouple could be estimated. In galvanic couple, the Ecouple and the icouple are determined by the intersection of the re-calculated anodic curve of SG materials and the measured cathodic curve of corrosion products, according to the mixed potential theory.
In addition, polarization resistance of the SG materials was derived from the slope of current against potential in the stepped-up polarization from Ecorr − 10 mV to Ecorr + 10 mV at a scan rate of 0.2 mV/s. All electrochemical tests were conducted at least three times on separate specimens to verify reproducibility. Good reproducibility was confirmed.
3. Results and Discussion
3.1. Characterization of the SG Tube Deposit Flakes Collected From the SG
The elemental composition of the SG flake samples obtained using ICP-AES (Thermo Scientific, Cambridge, UK) is given in Table 2. The values were measured except for O. As determined by ICP-AES, the main element in the samples was Fe. Trace elements such as Mn, Ni, Cu, Ti, Al, Cr, Si, Mg, and Ca were also observed.
Table 2.
Elemental composition of the flakes collected from the operating SG using ICP-AES (wt.%).
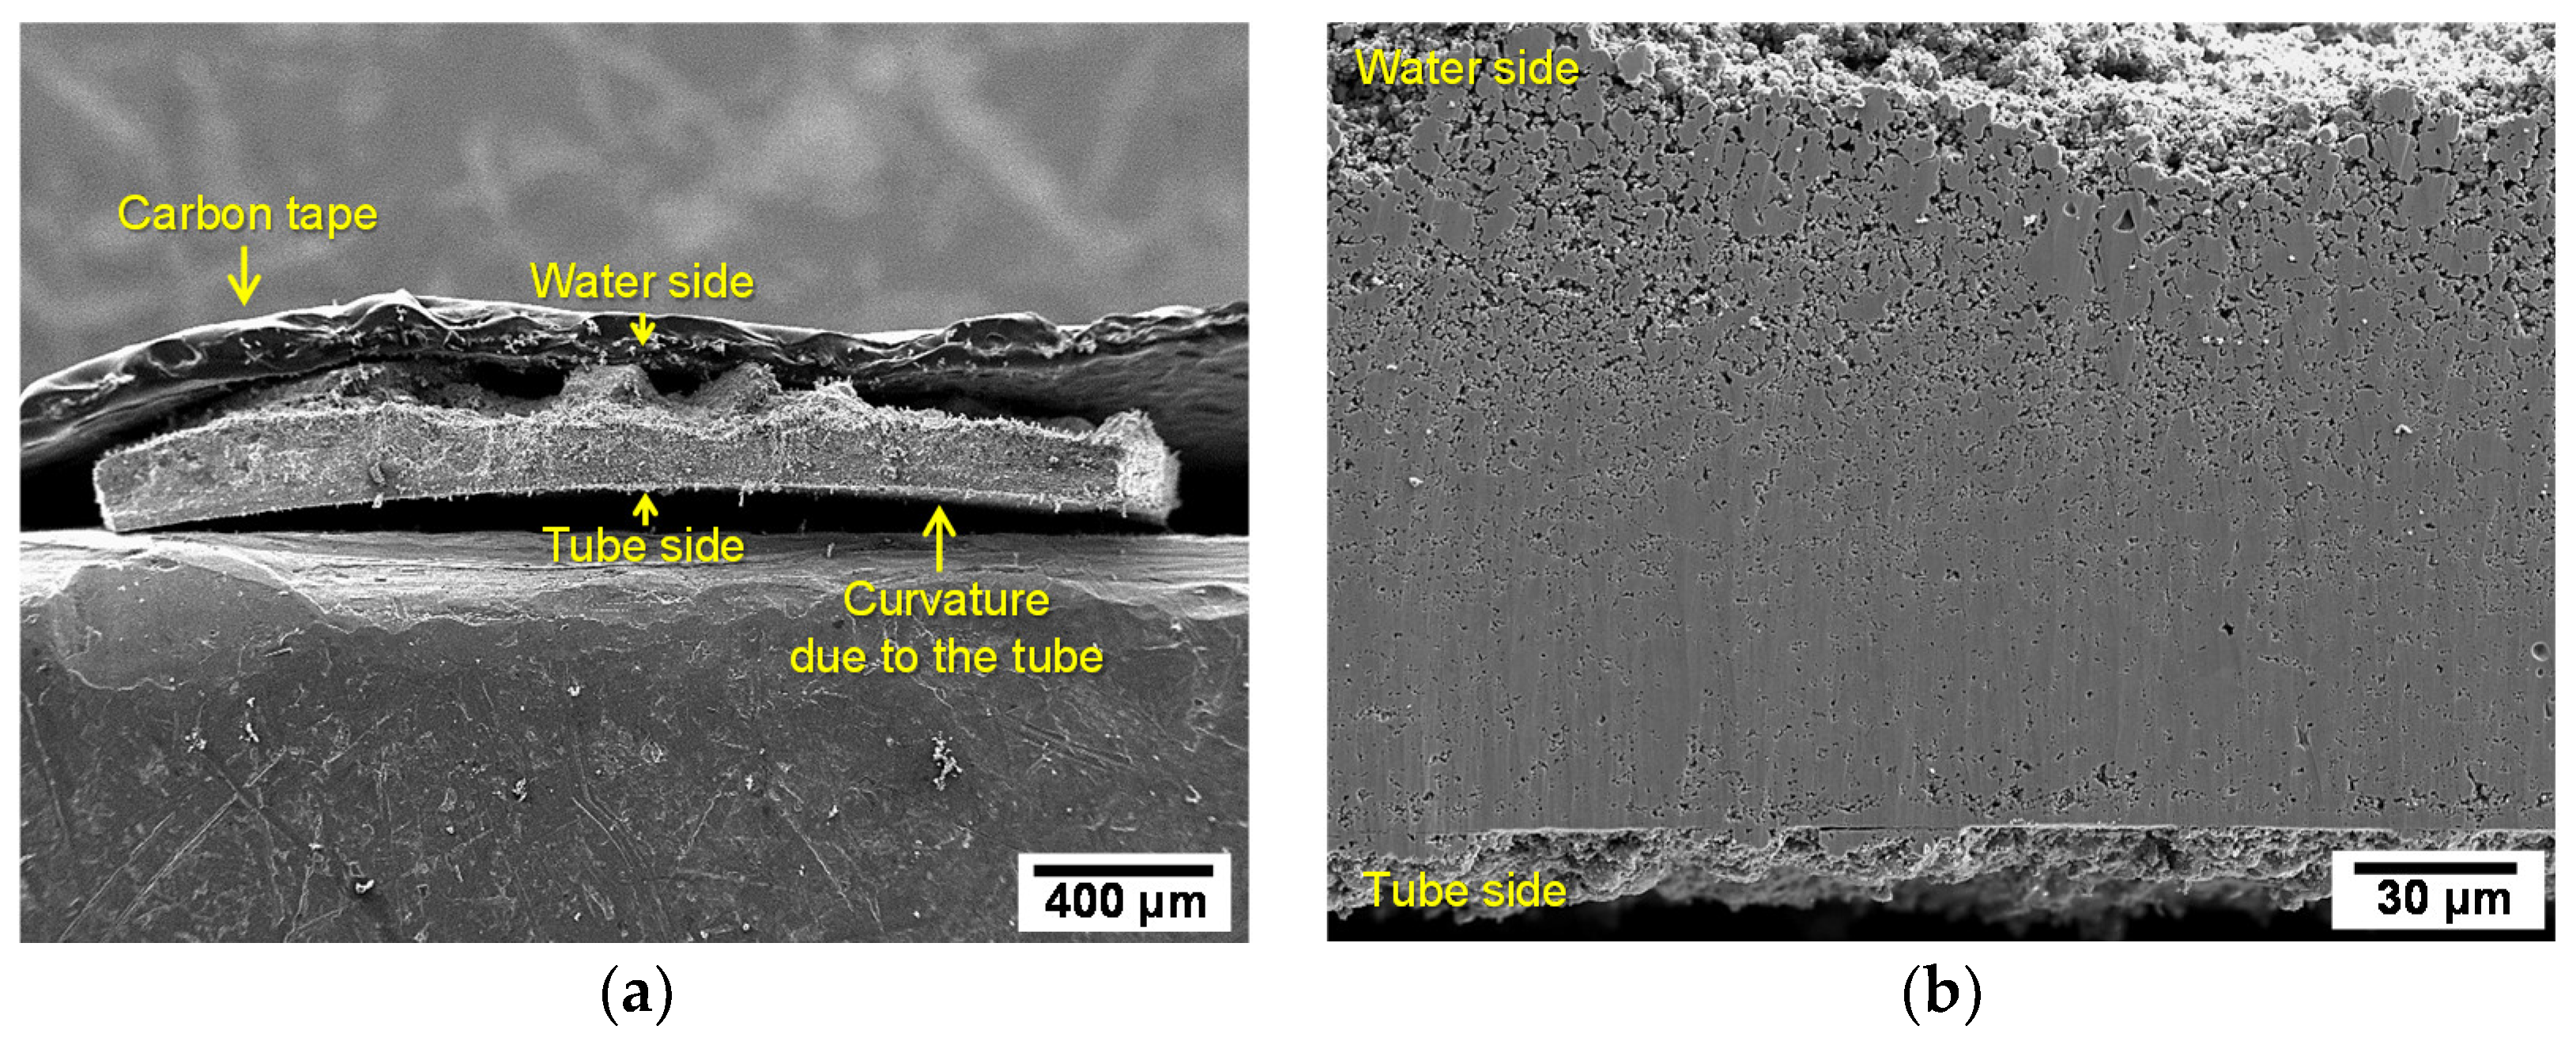
Figure 1 shows the SEM micrographs of the SG flakes. As shown in Figure 1a, the flake sample showed a curvature compatible with the outer surface of the SG tube. The concave side of the flake was originally in contact with the outer surface of SG tubes (tube side). On the other hand, the convex side of the flake was exposed to the high-temperature secondary water of the SG (high-temperature water side). The cross-sectional images of the SG flake showed that the thickness was about 120~130 µm (Figure 1b). A large number of the pores were observed throughout the flake sample. The number of pores and pore size increased from the tube side to the water side. These results may be closely related to the boiling behavior such as bubble growth and boiling chimney [13,14]. Based on the observation of many numbers of micro-pores, it is concluded that the high-temperature water could be exposed to the surface of SG tubes through the pores and caused the various corrosion phenomena such as pitting corrosion and stress corrosion cracking.
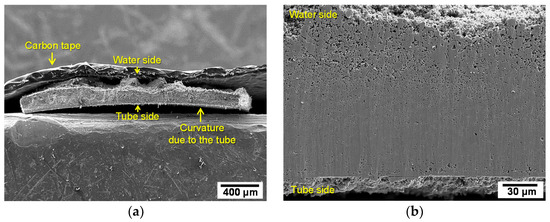
Figure 1.
SEM micrographs of SG flakes: (a) overall appearance and (b) cross section of flake.
Figure 2 shows the EBSD data on the tube side of the SG flakes. As shown in Figure 2a, the analyzed region is containing of the number of the micro-pores. A first map based on the image quality pattern (IQ) data reveals a contrast related to local variations of surface quality, crystallinity, and orientation (Figure 2b). In the 001 inverse pole figure (IPF) orientation map (Figure 2c), a random orientation was observed (predominant orientation color did not appear). Figure 2d shows the phase distribution map. Four phases such as magnetite (Fe3O4), trevorite (Ni2FeO4), jacobsite (Mn2FeO4), Cu, and zero solutions (black regions) were observed and randomly distributed in all the analyzed regions. The detailed phase fractions of the flakes are presented in Table 3. These results indicated that the flake samples were mainly composed of magnetite and contained only small amounts of trevorite, jacobsite, and metallic Cu particle. In these EBSD results, the micro-pores could be represented to the zero solutions (black regions). In general, zero solutions are points in the scan for which no indexing solution could be found for the corresponding pattern [18]. From the EBSD results in this work, it could be confirmed that not only Cu particles were precipitated on the tube surface but also the particles were precipitated on the inside of pores.
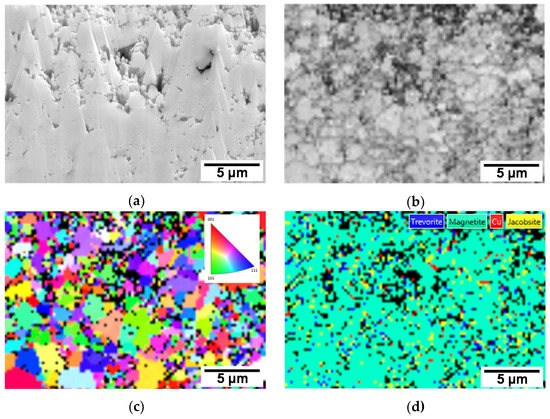
Figure 2.
EBSD data on the tube side of the SG flakes: (a) SEM micrograph; (b) IQ index representation; (c) 001 IPF orientation map; and (d) phase distribution map.
Table 3.
Phase fraction of the tube side of the SG flakes using EBSD analysis.
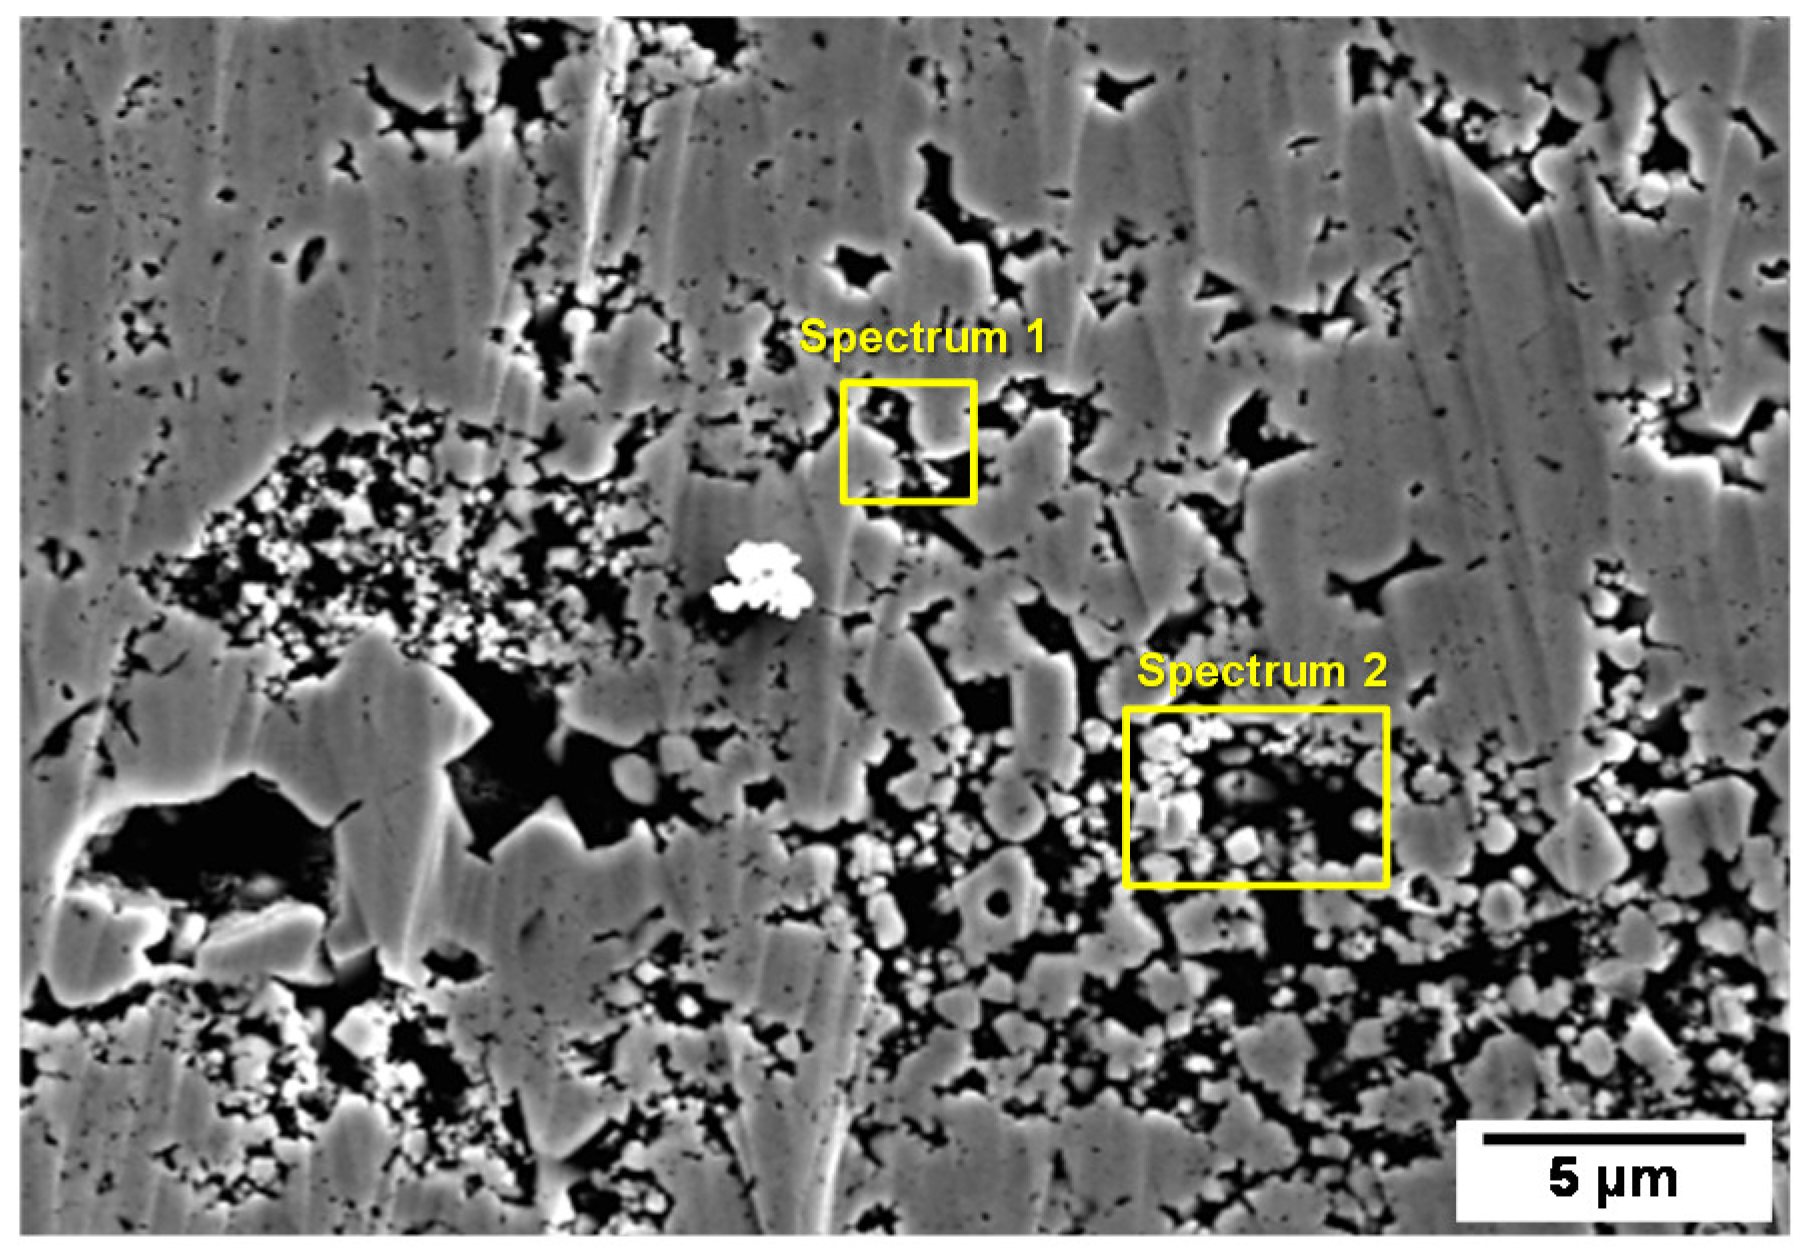
Figure 3 presents the SEM-EDS analysis of the impurities within the micro-pores on the tube side of the SG flakes. It is well known that the impurities were predominantly concentrated within the pores due to the boiling behavior. The quantitative EDS mapping results are given in Table 4. Some impurities such as Cu, Pb, P, S, and Cl were detected within the micro-pores of the deposits. In particular, it could be seen that Cu and Pb concentrations was high.

Figure 3.
SEM-EDS analysis of the impurities within the pores on the tube side of the SG flakes.
Table 4.
Chemical composition of impurities in the pores formed on tube side of SG flakes using SEM-EDS analysis (wt.%).
From the potential-pH diagram (Pourbaix diagram) of the Cu-H2O and Pb-H2O systems at 280 °C, which was calculated using the FACT-SAGE software, Cu and Pb are soluble in secondary water of SG. The pH of the secondary water of SG (pH adjusting agent: ETA, temperature: 280 °C, pH 9.5 at 25 °C) is about 6.14, which was calculated using the MULTEQ code, which was developed by the Electric Plant Research Institute (EPRI). In the secondary system, the preferred ionic form of Cu is Cu(OH)+ and Pb is Pb(OH)+ [13]. Under the secondary water condition, Cu(OH)+ and Pb(OH)+ can further react to form Cu(OH)2 and Pb(OH)2 [13]. These soluble Cu and Pb species within the micro-pore of magnetite flake could be electrochemically reduced on the outer surface of SG materials through the following reactions (3) and (4).
Cu(OH)2 (aq.) + 2H+ + 2e → Cu (s) + 2H2O
Pb(OH)2 (aq.) + 2H+ + 2e → Pb (s) + 2H2O
The thermodynamic calculation using the HSC Chemistry 6 software [19] gives ∆G280 °C = −75.1 kJ/mol for reaction (1) and ∆G280 °C = −67.2 kJ/mol for reaction (2). Based on the results, it is concluded that the formation reactions of metallic Cu and Pb are thermodynamically spontaneous in the secondary system of SG. Therefore, Cu and Pb are expected to exist in a metallic form in the micro-pores of the magnetite flakes.
3.2. Microstructural Analysis of the Electrodeposited Magnetite Films
Figure 4 presents the HR-XRD patterns of the electrodeposited magnetite film on Alloy 690 substrate. The electrodeposited magnetite film shows the highly crystalline, and the position and relative intensity of the diffraction peaks of the film sample matched well with the standard XRD data for magnetite (PDF No. 01-080-6406). The peaks of any other phases were no observed in HR-XRD patterns, indicating the high purity of the magnetite products.
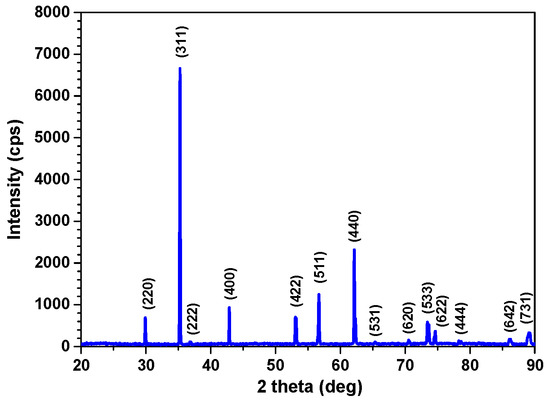
Figure 4.
HR-XRD patterns of the electrodeposited magnetite film on Alloy 690 substrate.
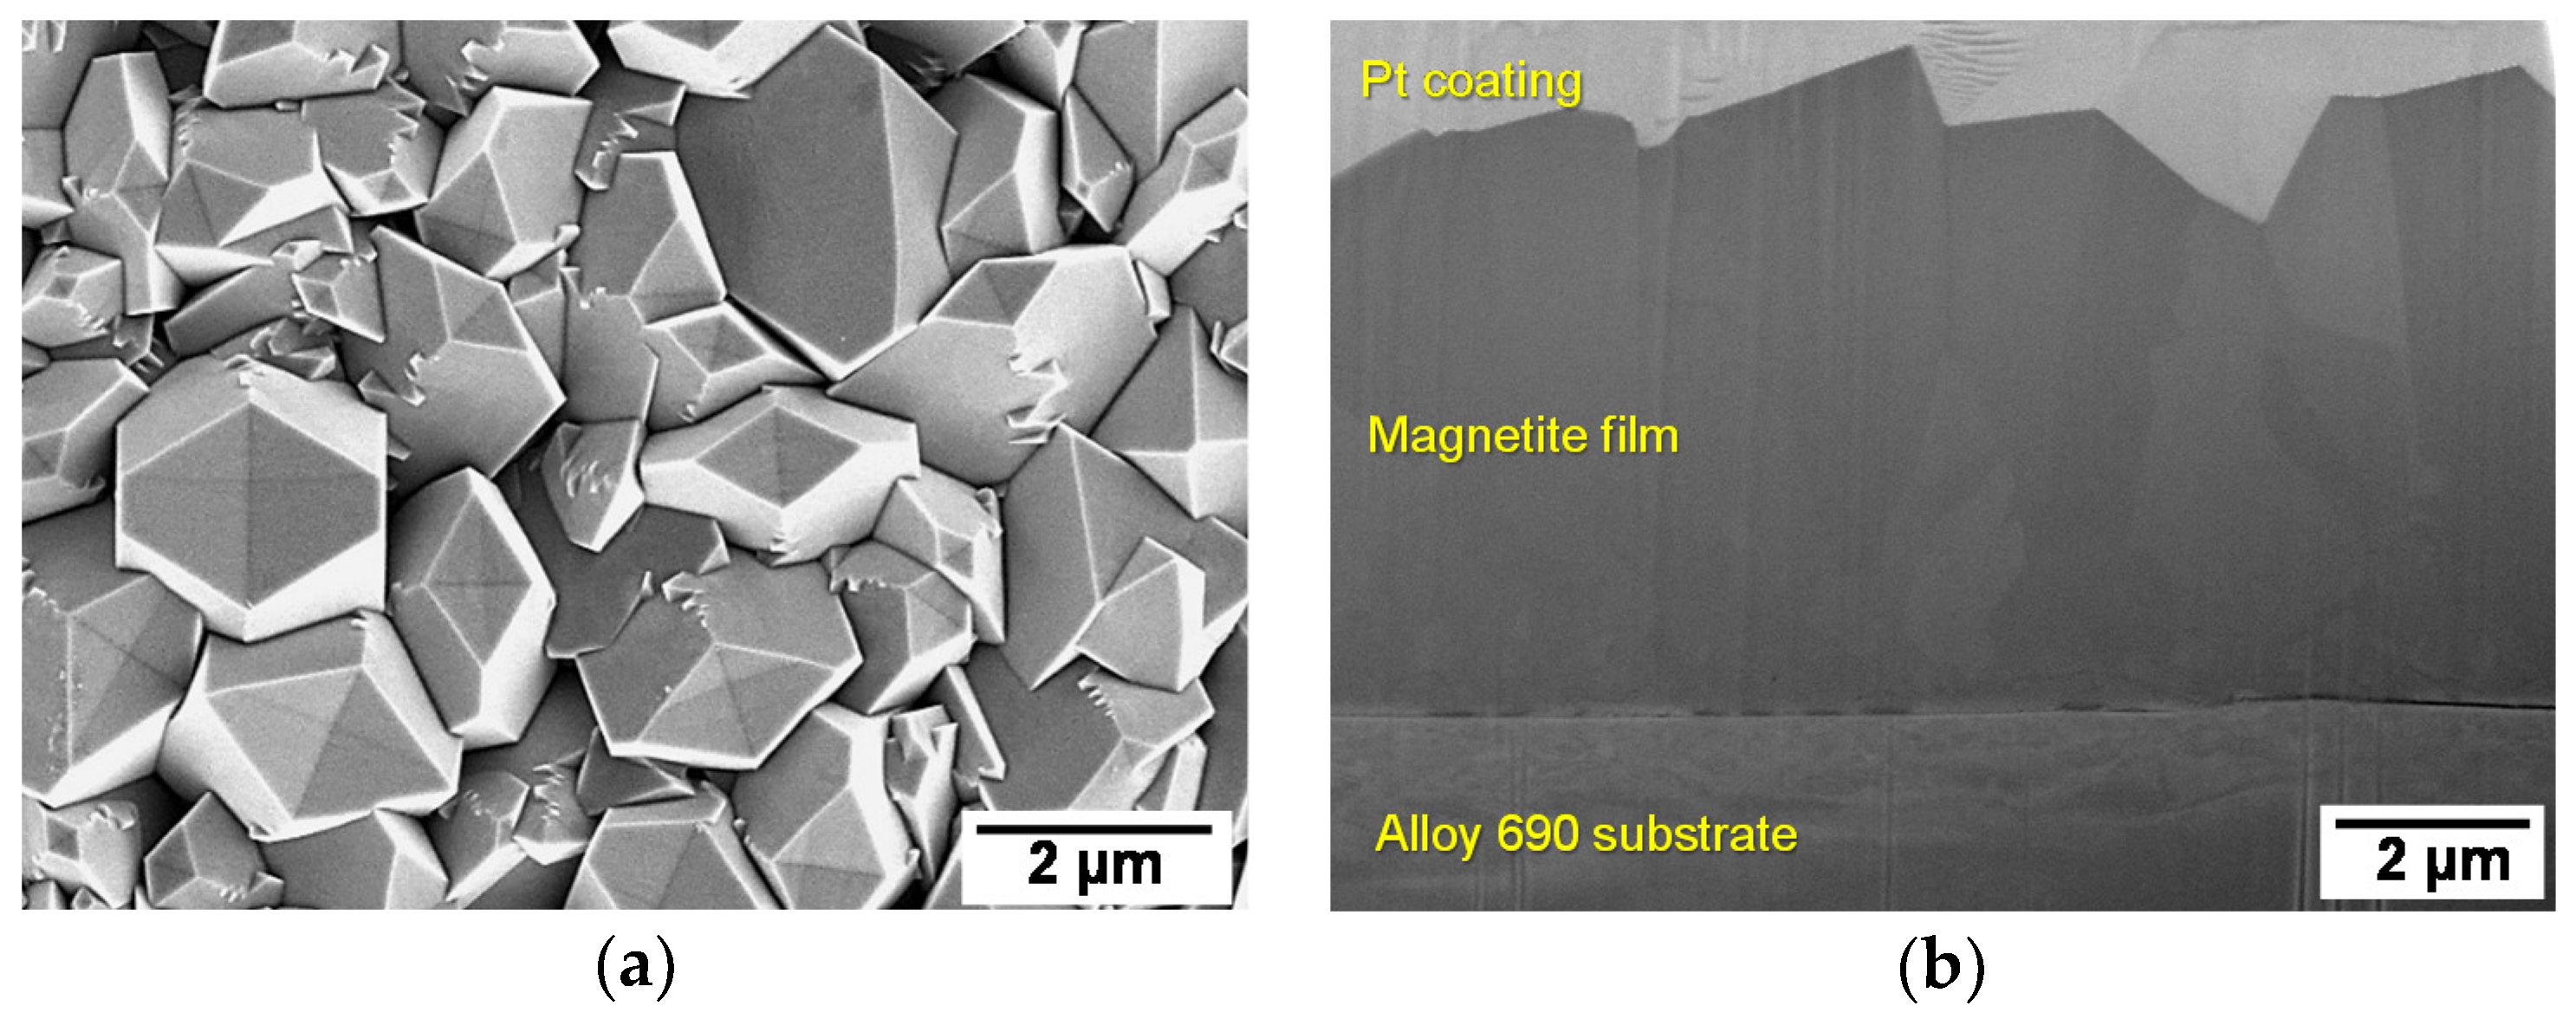
Figure 5 shows SEM micrographs of the surface and cross section of electrodeposited magnetite films on Alloy 690 substrate before and after the potentiodynamic polarization tests. As shown in Figure 5a, the magnetite films had highly faceted particle morphologies before the electrochemical test. The diameters of the magnetite particles were in range of about 2~4 μm. The thickness of the magnetite films was approximately 6 μm (Figure 5b). After the electrochemical test, the magnetite films seemed to be slightly dissolved. However, it still had the highly faceted morphologies (Figure 5c). The thickness of the dissolved magnetite films was approximately 5 μm (Figure 5d). Before and after the conducting the electrochemical test, the magnetite films were all very compact and adherent to the Alloy 690 substrate. In addition, no defects such as holes, gaps, or cracks could be observed at the interface between the magnetite layers and the Alloy 690 substrate, which confirms that the magnetite films were tightly bonded to the Alloy 690 substrate after performing the electrochemical test. Consequently, these results indicate that the electrodeposited magnetite film electrode is very effective and proper to measure the electrochemical corrosion behavior of magnetite itself and its effect on the galvanic corrosion behavior of SG materials, without the exposure of the Alloy 690 substrate to the test solutions.
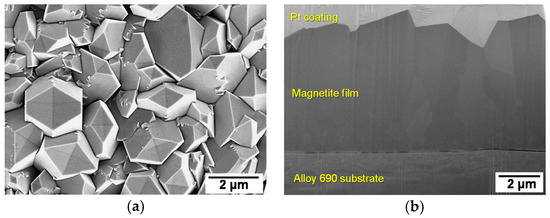
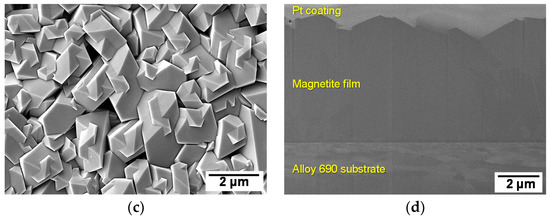
Figure 5.
SEM micrographs of the surface and cross section of electrodeposited magnetite films on Alloy 690 substrate before and after the potentiodynamic polarization tests: (a) the surface before the test and (b) the cross section before the test; (c) the surface after the test; and (d) the cross section after the test.
3.3. Electrochemical Corrosion Behavior of the SG Materials
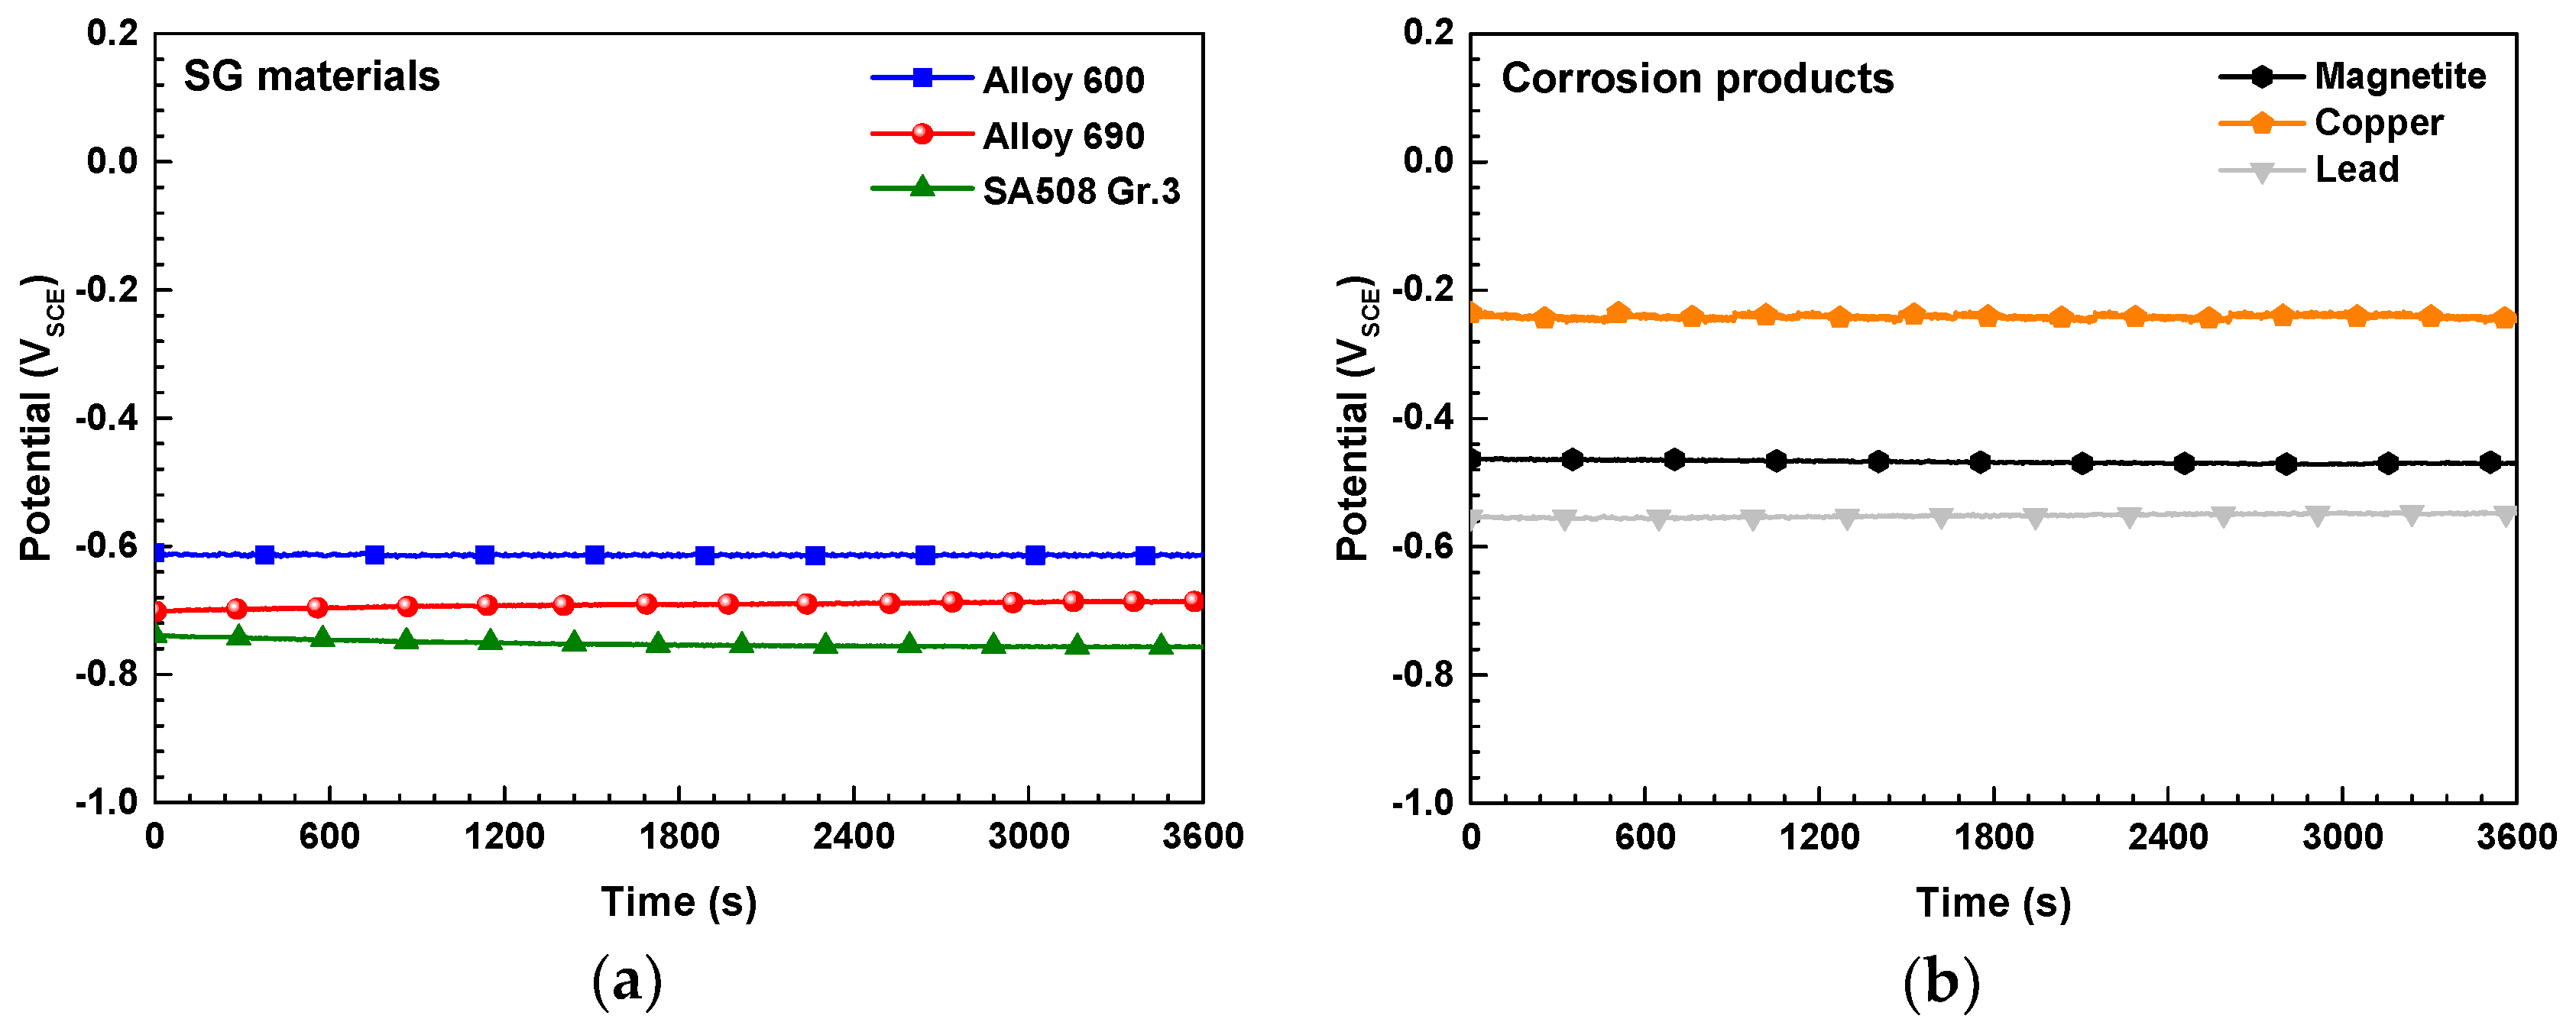
To elucidate the electrochemical corrosion behavior between the SG materials (Alloy 690, Alloy 600, and SA 508 Gr.3) and corrosion products (magnetite, Cu, and Pb) existed in the SG deposit flakes, the Ecorr of the SG materials and the corrosion products was measured by using potentiostat. Figure 6 presents the Ecorr of the SG materials and the corrosion products in the alkaline solution at 80 °C as a function of time. The Ecorr of the test materials is ranked in the following order: Cu > magnetite > Pb > Alloy 600 > Alloy 690 > SA 508 Gr.3. Compare with the Ecorr of the SG materials, the Ecorr of the all corrosion products was higher than that of SG materials.
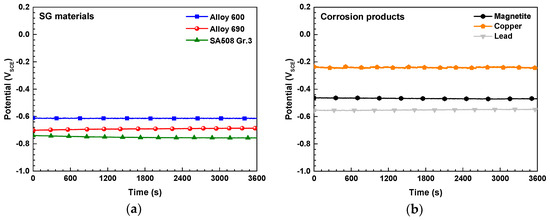
Figure 6.
Corrosion potentials of the SG materials and the corrosion products constituting the SG flakes in alkaline solution at 80 °C: (a) the SG materials and (b) the corrosion products.
To cause the galvanic corrosion between the two or more dissimilar materials, a potential difference (usually > 50 mV [20]) has to exist between the different materials. The potential difference between the Pb (the corrosion product with the lowest potential among the three corrosion products) and Alloy 600 (the highest potential materials among the three SG materials) exceeds about 60 mV. Accordingly, when the corrosion products and SG materials are electrically contacted and exposed the same electrolyte, all corrosion products will behave as the cathode of the galvanic couple, while all SG materials will be acted as the anode and is expected to undergo excessive corrosion.
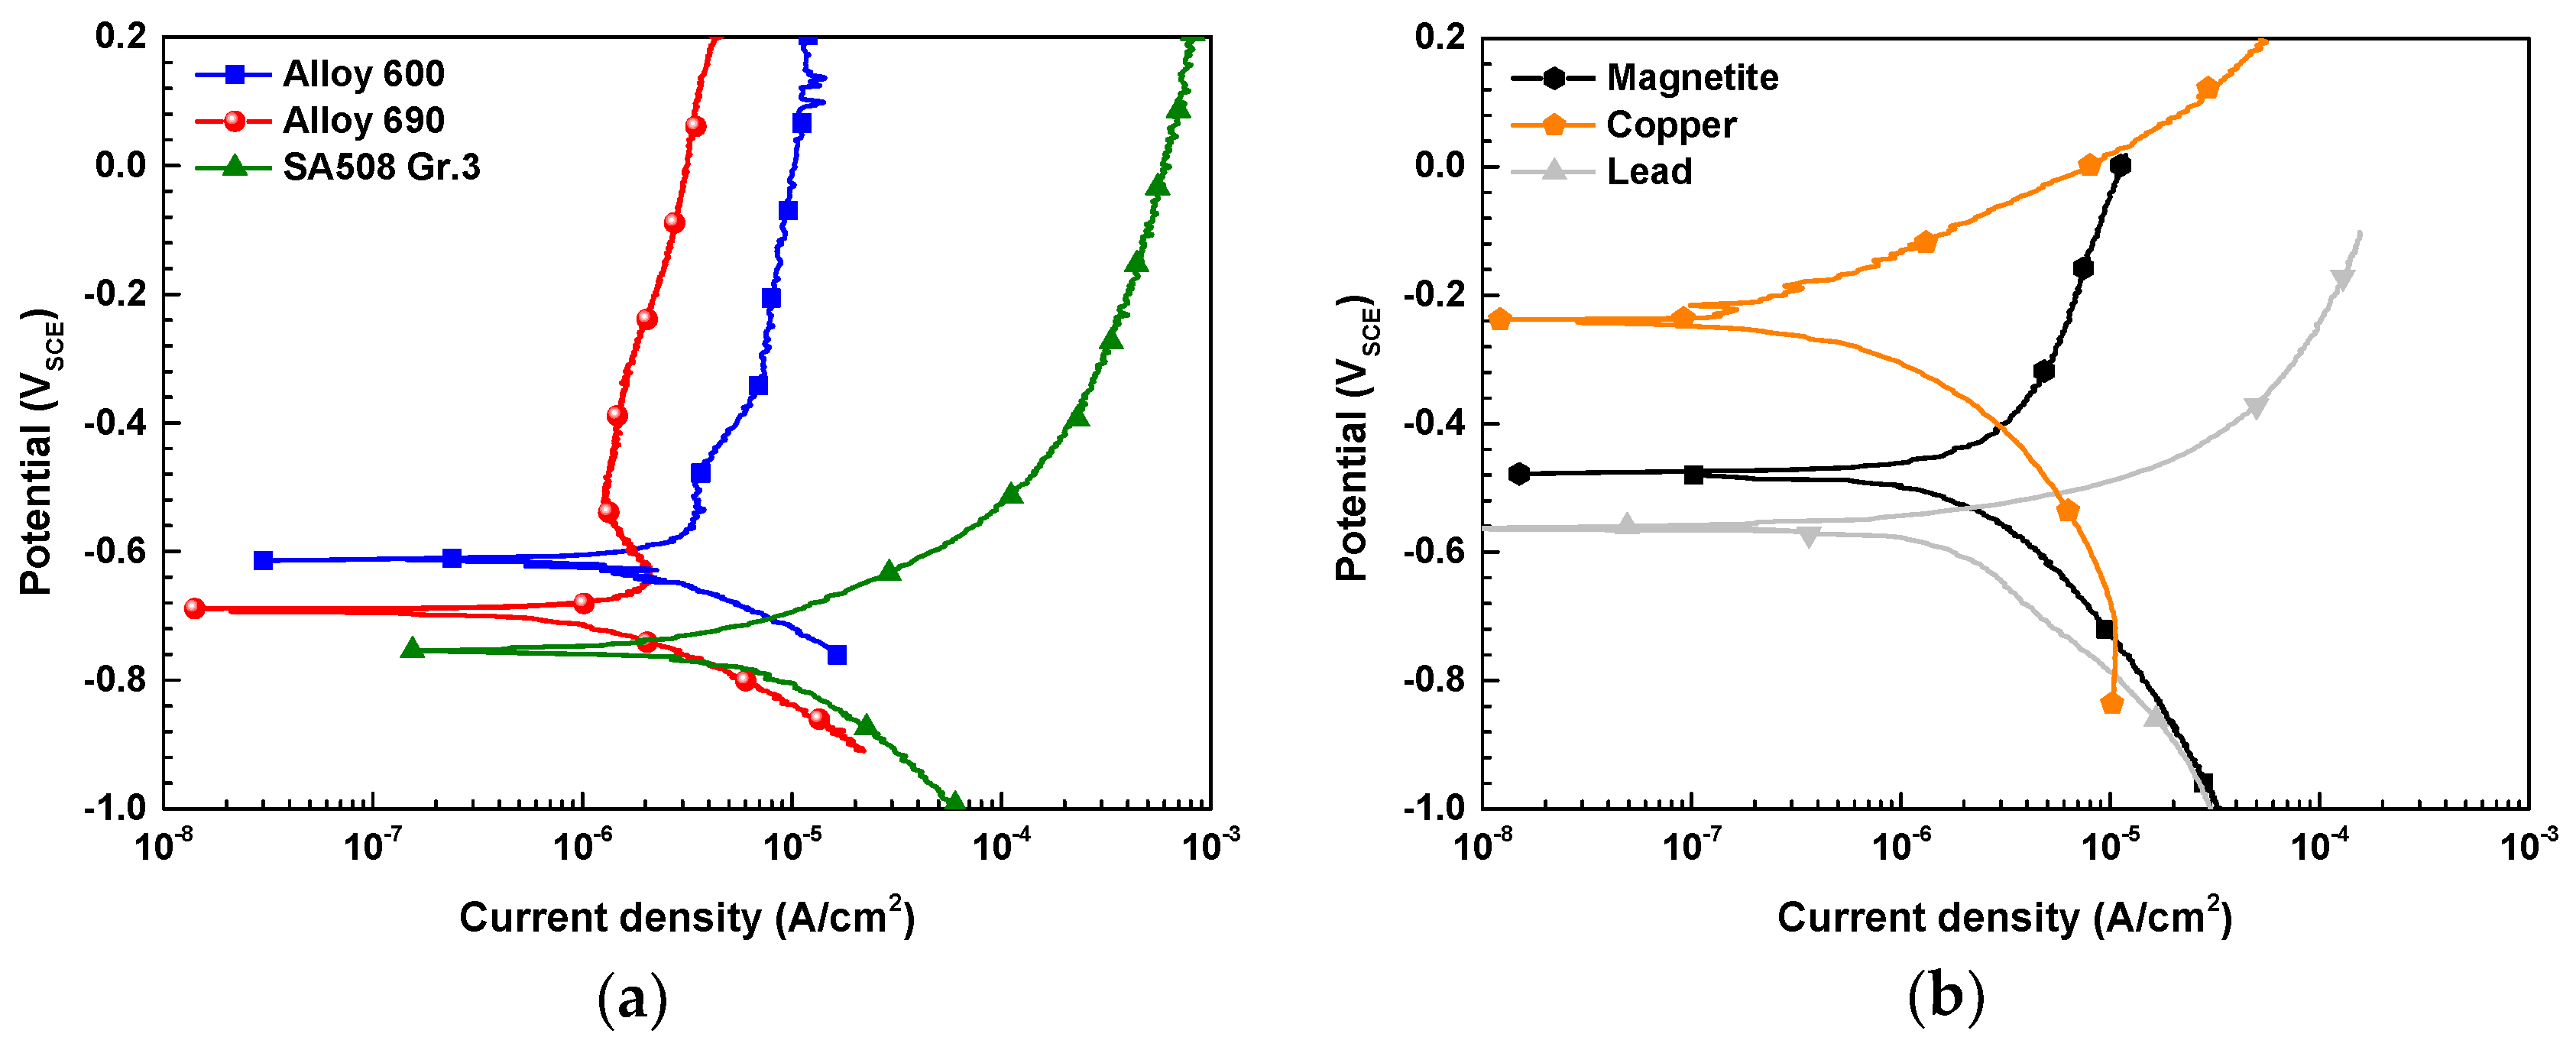
Figure 7 shows the potentiodynamic polarization curves of the SG materials and the corrosion products. The icorr of SG materials and the corrosion products were calculated by cathodic Tafel extrapolation of polarization curved in Figure 8. The icorr of the test materials is ranked in the following order: Cu (0.36 µA/cm2) > Alloy 690 (1.05 µA/cm2) > magnetite (1.24 µA/cm2) > Pb (1.52 µA/cm2) > Alloy 600 (1.62 µA/cm2) > SA 508 Gr.3 (5.11 µA/cm2). The various electrochemical corrosion parameters of SG materials are summarized in Table 5.
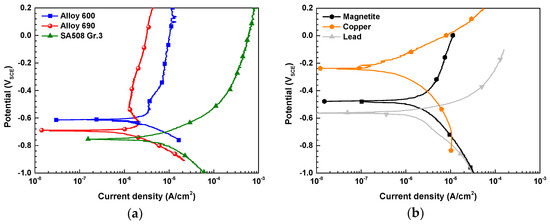
Figure 7.
Potentiodynamic polarization curves of the SG materials and the corrosion products in alkaline solution at 80 °C: (a) the SG materials and (b) the corrosion products.
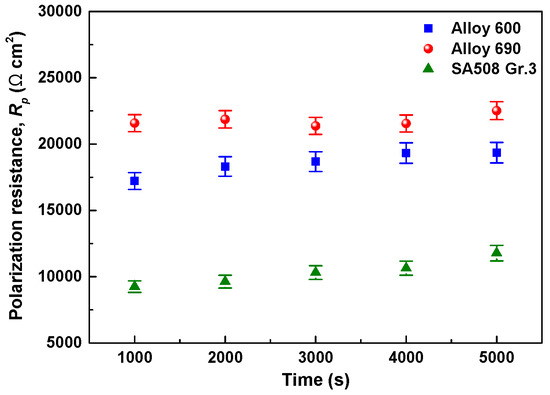
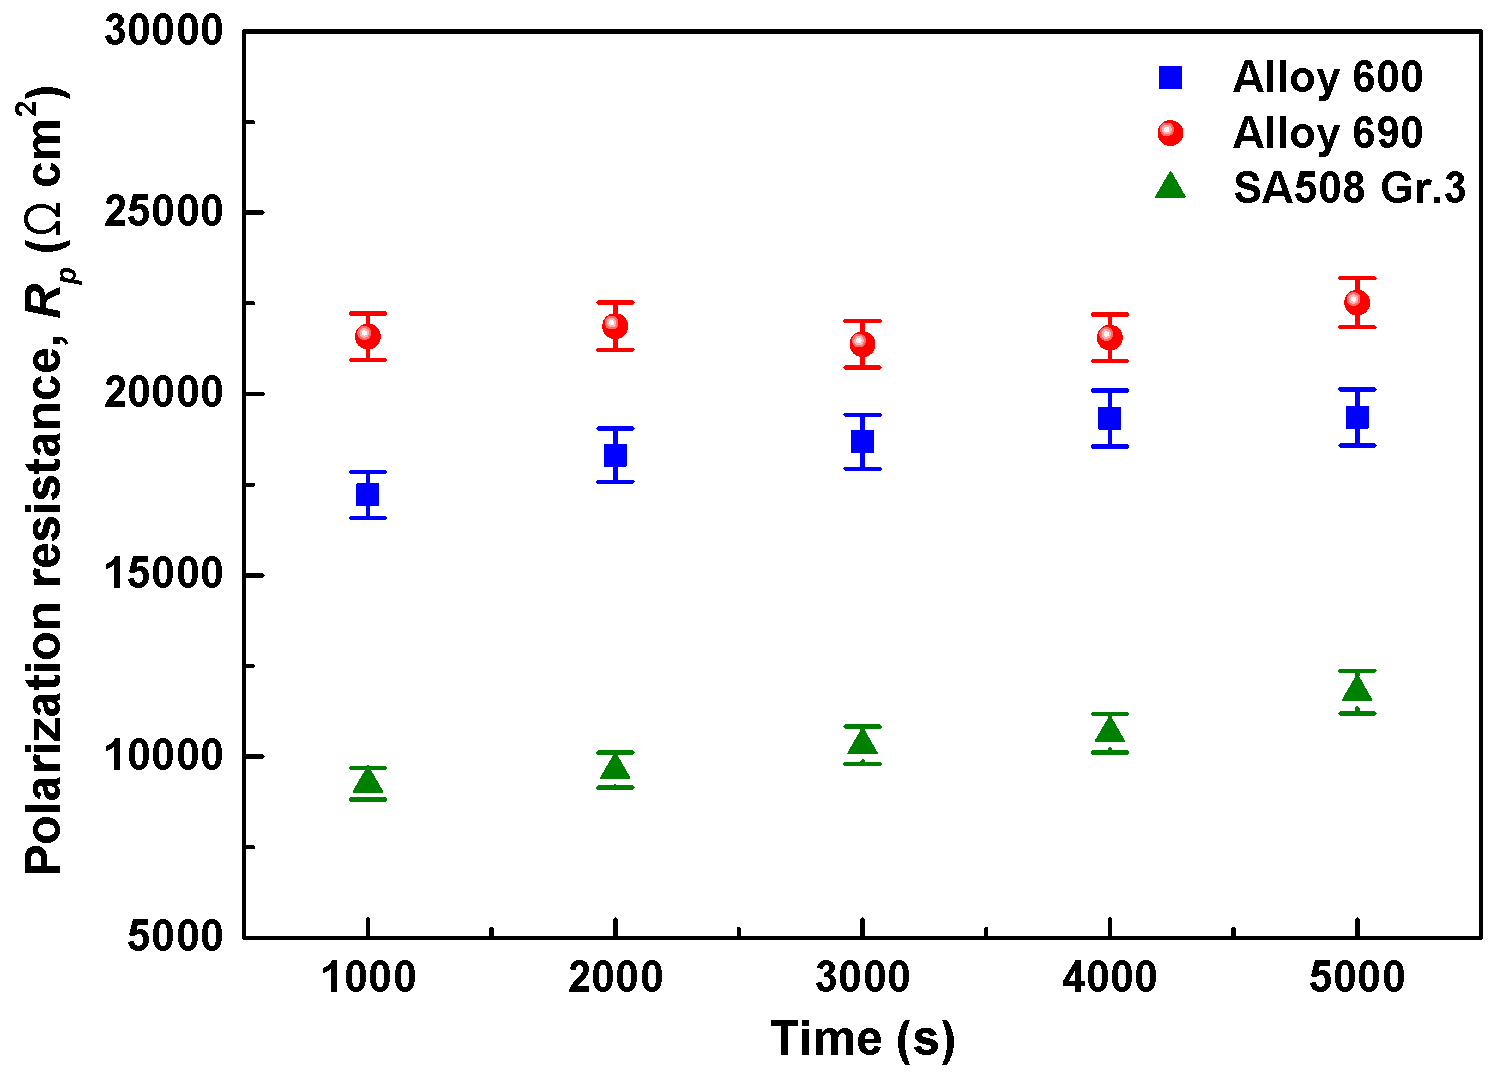
Figure 8.
Polarization resistances of the SG materials calculated during linear polarization test in alkaline solution at 80 °C.
Table 5.
Measured values of anodic and cathodic Tafel constants βa and βc, corrosion potential Ecorr, corrosion current density icorr obtained from potentiodynamic polarization curves, polarization resistance Rp, and corrosion current density icorr. pr obtained from polarization resistance test.
Figure 8 present the polarization resistance (Rp) of the SG materials as a function of time calculated during linear polarization test. Although the value of Rp was slightly increased at the early stage, the increase of Rp value was not large. The mean value of Rp becomes smaller in order of Alloy 690 > Alloy 600 > SA 508 Gr. 3 (Table 5). The corrosion current density icorr. pr calculated from polarization resistance test are similar to those of icorr.
In secondary coolant system, the magnetite particles are accumulated on the heated surfaces of SG heat exchanger tube and thus, the deposits are very porous in nature due to boiling behavior on SG tube surface [14,15]. Among the aggressive impurities, the metal ions such as Cu and Pb ions are concentrated within the pores formed on the magnetite layer and will be in the metallic particle form by electrochemical reduction reaction. When the corrosion products such as Cu and Pb and SG materials are electrically contacted within the micro-pores of magnetite flake, a galvanic corrosion between SG materials and corrosion products (magnetite, Cu, and Pb) will occur because magnetite, Cu, and Pb has a high electrical conductivity. Therefore, the polarization curves of Figure 8 were rearranged in Figure 9 to predict the galvanic corrosion behavior between SG materials and corrosion products using the mixed potential theory. As mention above, in order to more accurately obtain the Ecouple and the icouple of the SG materials, the measured polarization curve were re-calculated by using Equations (1) and (2). In galvanic couple, the Ecouple and the icouple are determined by the intersection of the calculated anodic curve of SG materials and the measured cathodic curve of corrosion products. The galvanic corrosion parameters are presented in Table 6. As shown in Figure 9 and Table 6, when SG materials and corrosion products are galvanically coupled in equal area (area ratio (AR) of cathode/anode = 1), the Ecouple of the all galvanic couple is expected to shift in the positive direction and the icouple of all SG materials is significantly increased by the coupling.
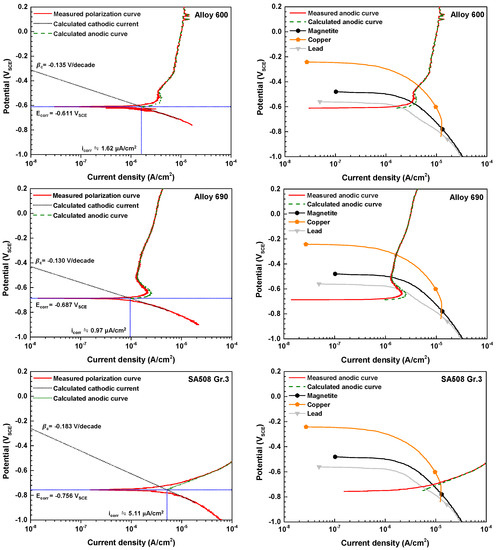
Figure 9.
Calculated anodic curves of the SG materials and galvanic corrosion behavior between the SG materials (calculated anodic curves) and the corrosion products (cathodic polarization curves) in alkaline solution at 80 °C.
Table 6.
Measured values of galvanic corrosion potential Ecoupled and galvanic corrosion current density icoupled of SG materials coupled to corrosion products obtained from the measured cathodic and calculated anodic polarization curves by using mixed potential theory (AR = 1).
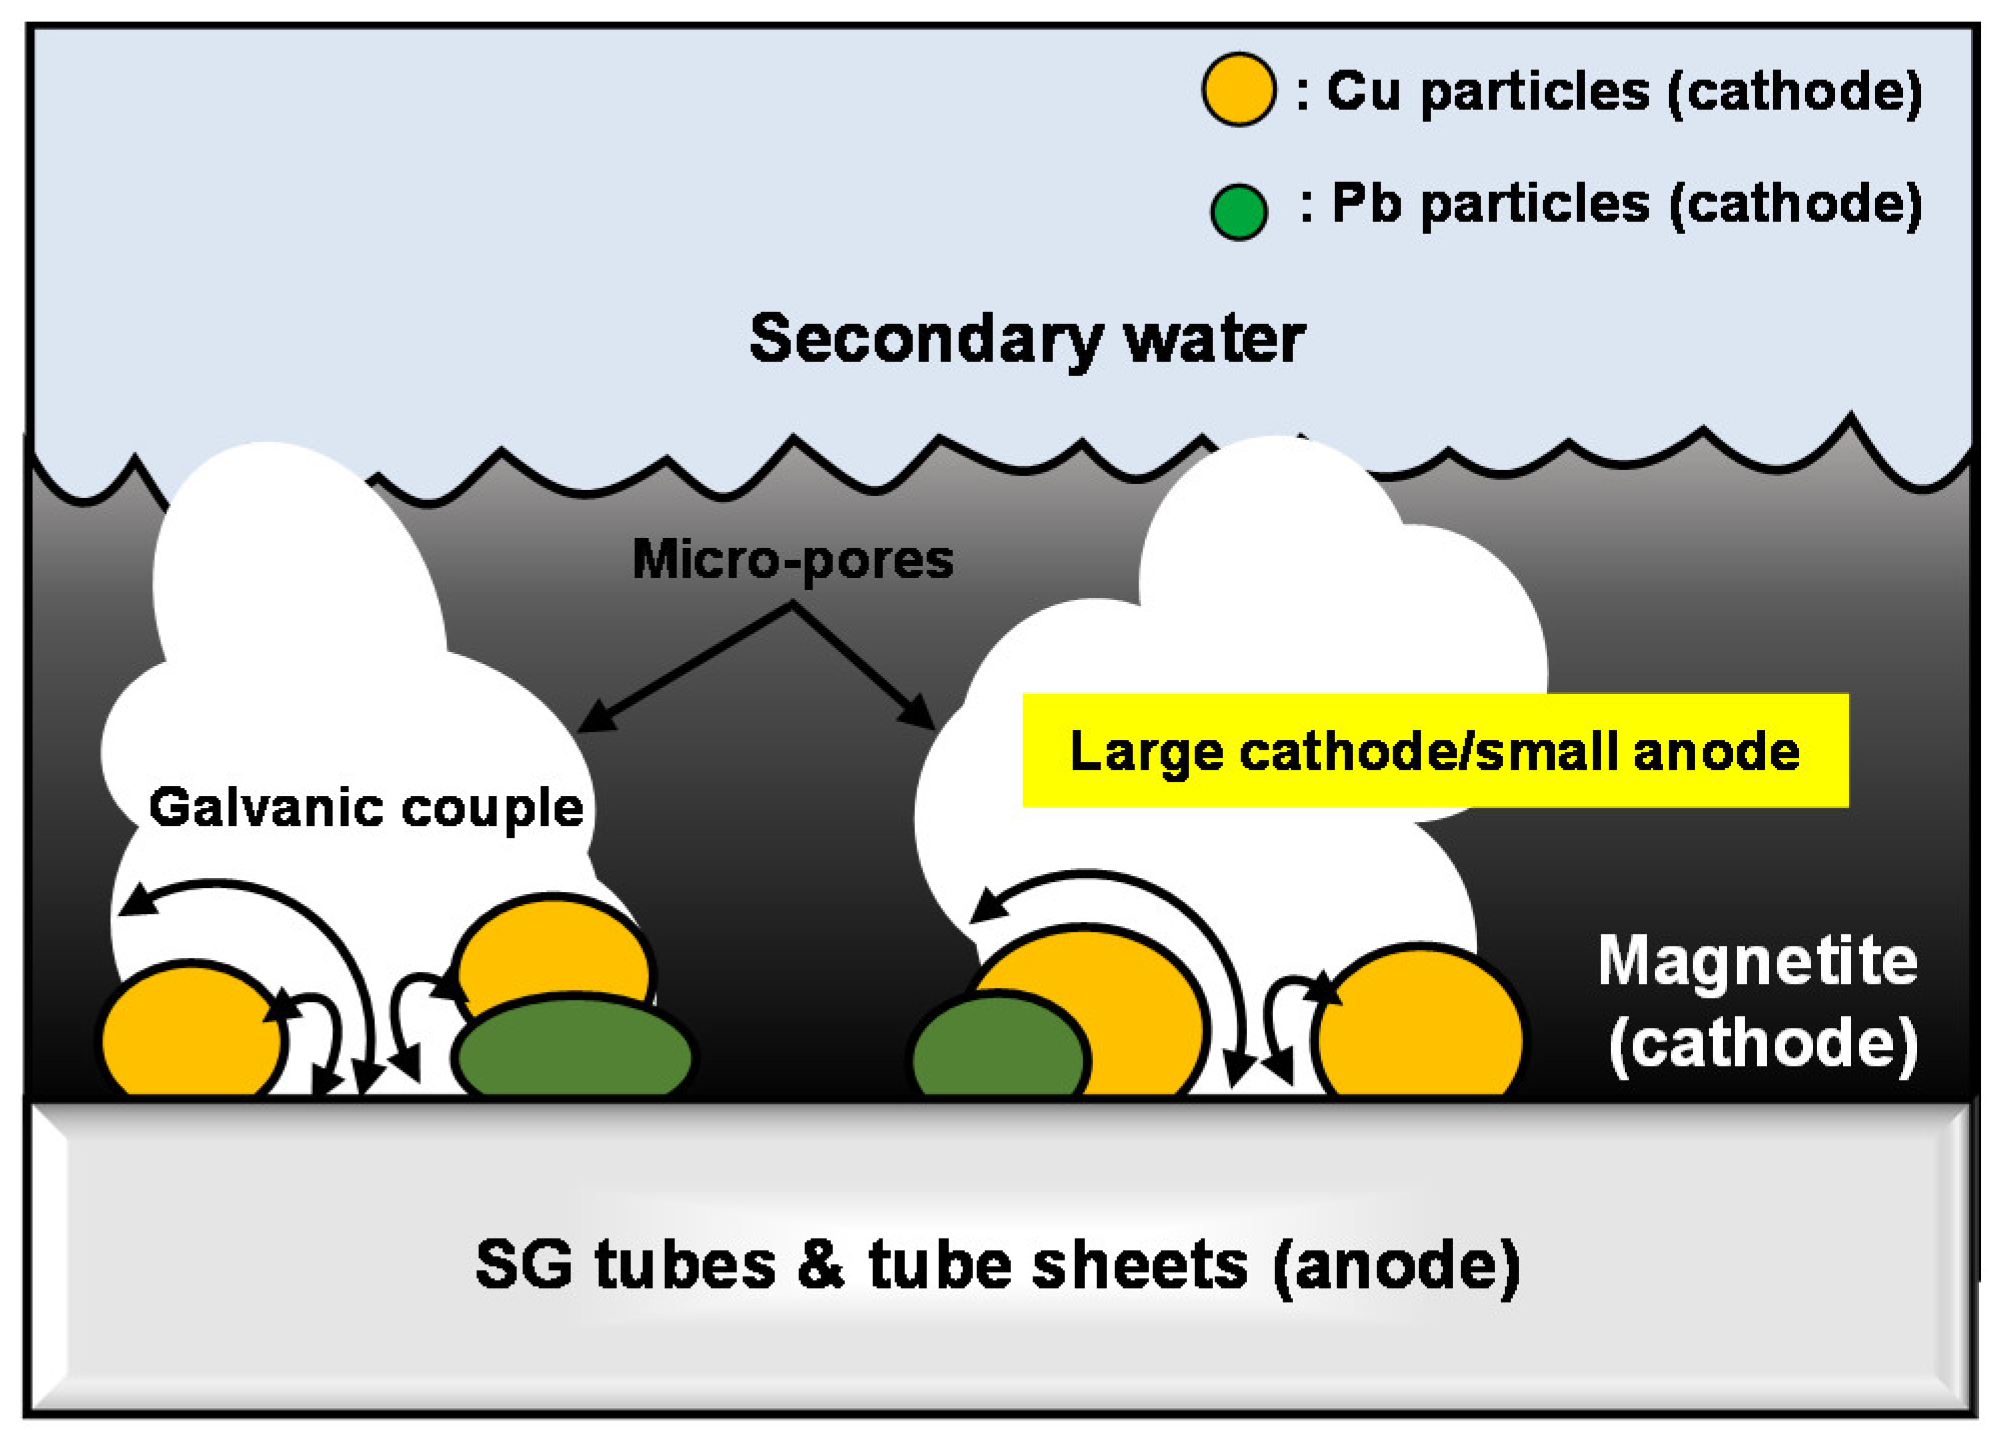
In general, the surface of SG tube is typically covered with the magnetite layer under the alkalized reducing conditions of PWRs. This magnetite layer contains many micro-pores. As shown in Figure 10, the small surface area of SG tube is exposed to the reducing secondary water due to the micro-pores at the oxide/steel interface. In this case, the exposed surface of SG tube is galvanically coupled to a relatively large area of magnetite, metallic Cu and Pb particles. Consequently, the corrosion is accelerated from the small surface area of SG tube owing to the galvanic coupling with magnetite, Cu and Pb particles. Hence, the AR effect on the corrosion acceleration of SG materials should be elucidated.

Figure 10.
Schematics of the galvanic corrosion process between SG materials and corrosion products exposed to the secondary water.
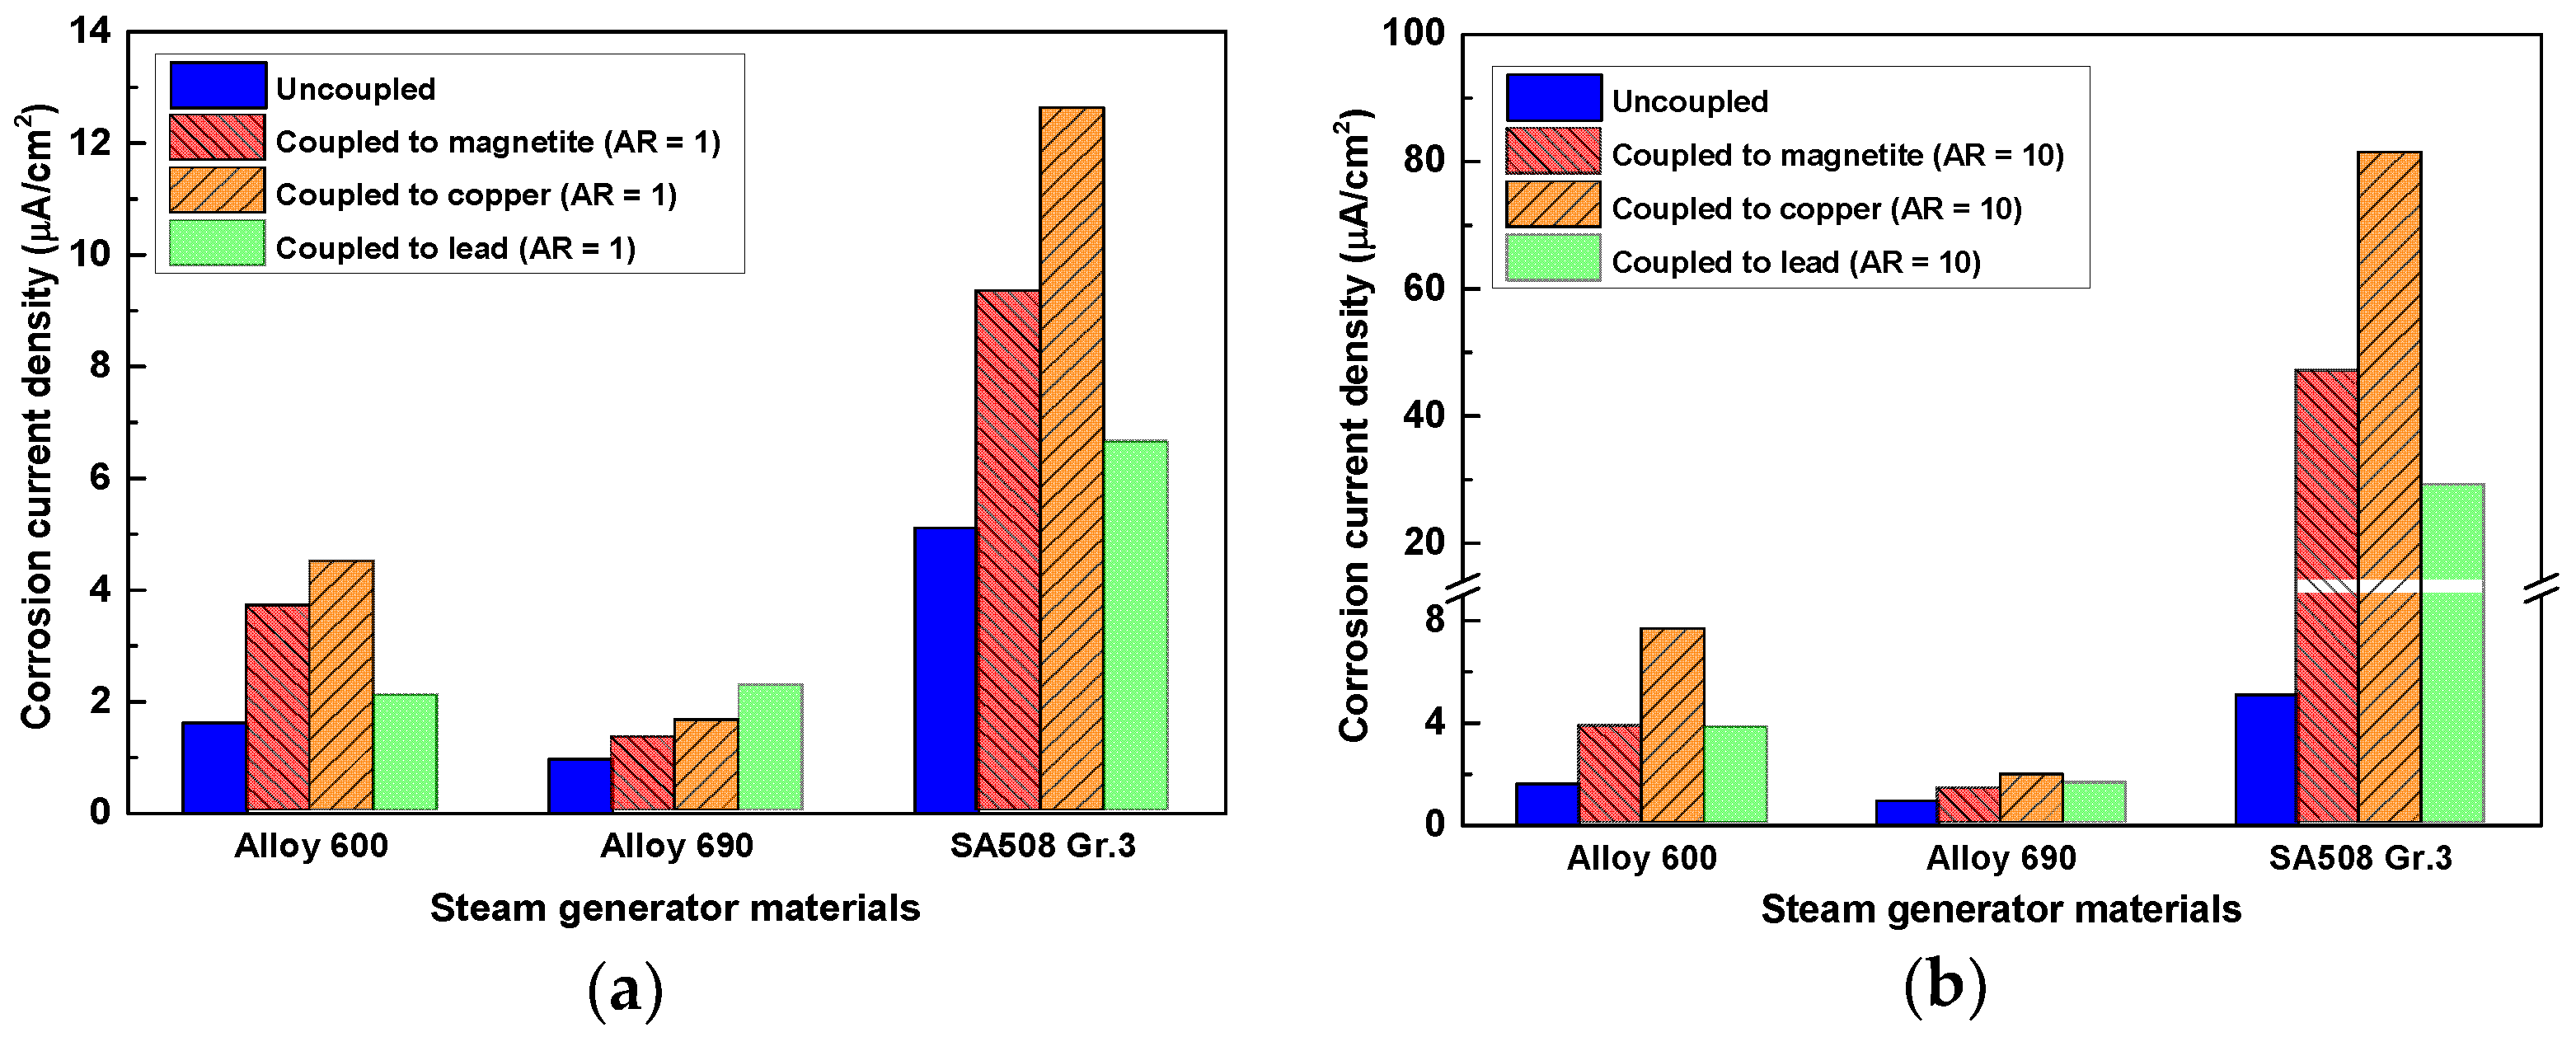
To evaluate the AR effect on the galvanic corrosion, polarization curves of corrosion products with an area of 12 cm2 (AR = 10) were rearranged and calculated by the polarization curves of those with an area of 1.2 cm2 (AR = 1). The changes in the corrosion current density of SG materials caused by the galvanic coupling and AR (1 → 10) were summarized in Figure 11. In the case of AR = 1, the degree of galvanic effect of Alloy 600 and SA 508 Gr.3 is ranked in the following order: Cu > magnetite > Pb. In addition, that of Alloy 690 is in the following order: Pb > Cu > magnetite. The accelerated corrosion of SG materials becomes more severe due to the increased AR from 1 to 10. In the case of AR = 10, The degree of galvanic effect of Alloy 600 and SA 508 Gr.3 is ranked in the following order: Cu > magnetite > Pb. In addition, that of Alloy 690 is in the following order: Cu > Pb > magnetite. In the case of AR = 10, Cu has the largest galvanic effect on all SG materials.
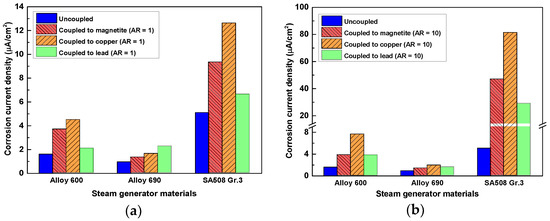
Figure 11.
Change in the anodic dissolution rate of the SG materials by the AR of corrosion products in alkaline at 80 °C: (a) AR = 1 and (b) AR = 10.
As reported in many previous studies [4,5,6,7,8,9], this work again confirmed that magnetite accelerates the corrosion rate of SG materials by galvanic coupling. In addition, the results in this work had shown that metallic Cu and Pb as well as magnetite increased the corrosion rate of SG materials. Furthermore, when the AR was increased, Cu has the largest galvanic corrosion effect. Based on these results, the galvanic effect of corrosion products on the SG material should take into account not only the magnetite but also the metal form of Cu and Pb. Therefore, even if trace amount of Cu particles are present in the SG tube deposits, the Cu removal process should be included in the chemical cleaning process.
4. Conclusions
The galvanic corrosion of SG materials (Alloy 690, Alloy 600, SA 508 Gr.3) within the micro-pores of magnetite flakes was investigated in an alkaline solution using the electrochemical corrosion tests. In addition, the magnetite flake samples removed from an operating SG were characterized to identify the various corrosion products accumulated in the pores of the flakes.
- Based on the EBSD results, the flake samples were mainly composed of magnetite and contained only small amounts of trevorite, jacobsite, and metallic Cu particle.
- SEM-EDS results showed that some impurities such as Cu, Pb, P, S, and Cl were concentrated in the micro-pores of the deposits. In particular, Cu and Pb are expected to exist in a metallic form in the micro-pores of the magnetite flakes because the formation reactions of metallic Cu and Pb are thermodynamically spontaneous in the secondary system of SG.
- The all SG materials considered in this study were act as an anode of the galvanic couple with the each corrosion products (magnetite, copper, and lead) and the corrosion rate of all SG materials was significantly increased. When the AR was increased 1 to 10, Cu has the largest galvanic corrosion effect to all SG materials.
- The galvanic effect of metallic copper and lead as well as the magnetite should be considered in the corrosion behavior of SG tube contacted to the corrosion products.
Author Contributions
S.-H.J. performed the overall experiments and wrote the draft manuscript; G.D.S. analyzed the deposited-magnetite layers; D.H.H. conceived and supervised this work.
Funding
This work was supported by the National Research Foundation of Korea (NRF) grant funded by the Korea government (No. 2017M2A8A4015159).
Conflicts of Interest
The authors declare no conflict of interest. The funders had no role in the design of the study; in the collection, analyses, or interpretation of data; in the writing of the manuscript, or in the decision to publish the results.
References
- Goujon, C.; Pauporté, T.; Bescond, A.; Mansour, C.; Delaunay, S.; Bretelle, J.-L. Effects of curative and preventive chemical cleaning processes on fouled steam generator tubes in nuclear power plants. Nucl. Eng. Des. 2017, 323, 120–132. [Google Scholar] [CrossRef]
- Fujiwara, K.; Kawamura, H.; Kanbe, H.; Hirano, H.; Takiguchi, H.; Yoshino, K.; Yamamoto, S.; Shibata, T.; Ishigura, K. Applicability of chemical cleaning process to steam generator secondary side, (I) outline of the investigation and cleaning effectiveness. J. Nucl. Sci. Techonol. 2004, 41, 44–54. [Google Scholar] [CrossRef]
- Kawamura, H.; Fujiwara, K.; Kanbe, H.; Hirano, H.; Takiguchi, H.; Yoshino, K.; Yamamoto, S.; Shibata, T.; Ishigura, K. Applicability of chemical cleaning process to steam generator secondary side, (III) effect of chemical cleaning on long term integrity of steam generator tube after chemical cleaning process. J. Nucl. Sci. Techonol. 2006, 43, 665–668. [Google Scholar]
- Jeon, S.H.; Song, G.D.; Hur, D.H. Corrosion behavior of Alloy 600 coupled with electrodeposited magnetite in simulated secondary water of PWRs. Mater. Trans. 2015, 56, 2078–2083. [Google Scholar] [CrossRef]
- Jeon, S.H.; Song, G.D.; Hur, D.H. Galvanic corrosion between Alloy 690 and magnetite in alkaline aqueous solutions. Metals 2015, 5, 2372–2382. [Google Scholar] [CrossRef]
- Song, G.D.; Jeon, S.H.; Kim, J.G.; Hur, D.H. Synergistic effect of chloride ions and magnetite on the corrosion of Alloy 690 in alkaline solutions. Corrosion 2017, 73, 216–220. [Google Scholar] [CrossRef]
- Jeon, S.H.; Song, G.D.; Hur, D.H. Electrodeposition of magnetite on carbon steel in Fe(III)-triethanolamine solution and its corrosion behavior. Mater. Trans. 2015, 56, 1107–1111. [Google Scholar] [CrossRef]
- Song, G.D.; Jeon, S.H.; Kim, J.G.; Hur, D.H. Effect of polyacrylic acid on the corrosion behavior of carbon steel and magnetite in alkaline aqueous solutions. Corrosion 2017, 72, 1010–1120. [Google Scholar] [CrossRef]
- Song, G.D.; Jeon, S.H.; Kim, J.G.; Son, Y.H.; Hur, D.H. Galvanic effect of magnetite on the corrosion behavior of carbon steel in deaerated alkaline solutions under flowing conditions. Corros. Sci. 2018, 131, 71–80. [Google Scholar] [CrossRef]
- Hur, D.H.; Choi, M.S.; Kim, U.C.; Han, J.H. Magnetite dissolution and corrosion behavior in high temperature EDTA solvents. Nucl. Eng. Des. 2003, 220, 11–16. [Google Scholar] [CrossRef]
- Jeon, S.H.; Son, Y.H.; Choi, W.I.; Song, G.D.; Hur, D.H. Simulating porous magnetite layer deposited on Alloy 690TT steam generator tubes. Materials 2018, 11, 62. [Google Scholar] [CrossRef] [PubMed]
- Tsuda, N.; Nasu, K.; Fujimori, A.; Siratori, K. Electronic Conduction in Oxides; Springer-Verlag: Berlin/Heidelberg, Germany, 2000. [Google Scholar]
- EPRI-TR-106048. Characterization of PWR Steam Generator Deposits; EPRI: Palo Alto, CA, USA, 1996. [Google Scholar]
- Jeon, S.H.; Hong, S.; Kwon, H.C.; Hur, D.H. Characteristics of steam generator tube deposits in an operating pressurized water reactor. J. Nucl. Mater. 2018, 507, 371–380. [Google Scholar] [CrossRef]
- Diego, G.D.; Merino, S. Microstructural characterization of sludge steam generator from Spanish NPP’s. In Proceedings of the 20th International Conference on Water Chemistry in Nuclear Reactor System, Brighton, UK, 2–7 October 2016. No. 139. [Google Scholar]
- Turner, C.W.; Klimas, S.J.; Brideau, M.G. Thermal resistance of steam-generator tube deposits under single-phase forced convection and flow-boiling heat transfer. Can. J. Chem. Eng. 2000, 78, 53–60. [Google Scholar] [CrossRef]
- EPRI-TR-3002002794. Steam Generator Management Program: PWR Steam Generator Deposit Characterization Sourcebook; EPRI: Palo Alto, CA, USA, 2014. [Google Scholar]
- Wright, S.I.; Nowell, M.M.; Lindeman, S.P.; Camus, P.P.; Graef, M.D.; Jackson, M.A. Introduction and comparison of new EBSD post-processing methodologies. Ultramicroscopy 2015, 159, 81–94. [Google Scholar] [CrossRef] [PubMed]
- HSC Chemistry 6, version 6.12; Outotec Research Oy: Pori, Filand, 2006.
- Tostmann, K.-H. Korrosion; Wiley-VCH: Weinheim, Germany, 2001. [Google Scholar]


© 2018 by the authors. Licensee MDPI, Basel, Switzerland. This article is an open access article distributed under the terms and conditions of the Creative Commons Attribution (CC BY) license (http://creativecommons.org/licenses/by/4.0/).