Abstract
Microstructure control is of vital importance in tailoring physical properties of metallic materials. Despite the enormous efforts devoted to the study of microstructure evolution during recrystallization, most previous research has been conducted under non-simple conditions, either applying complex deforming boundary conditions or employing specimens with sophisticated crystalline structure. These complexities hinder comprehensive understanding of the fundamental aspects in texture evolution and make it even harder to penetrate the already intricate recrystallization behaviors. The present study aims at a detailed evaluation of widely used phenomenological model in reproducing experimentally observed deformation characteristics under simple crystalline structure and deformation condition, as well as the prediction of nucleation sites during static recrystallization. In situ electron back-scattering diffusion (EBSD) observations were performed to record texture change during static recrystallization of single crystal pure iron specimens after tensile deformation. CP-FEM (crystal plasticity finite element method) method was employed to simulate deformed texture. Deformation heterogeneity characterized by kernel average misorientation maps derived from EBSD data and numerical calculations were compared. The former data shows deformation heterogeneity sensitive to localized microstrain while the later delivers an effective meso-scale deformation distribution. Observed approximate nucleation sites have shown a qualitative coincidence with highly distorted regions in numerical calculations.
1. Introduction
In metallic materials, atoms are orderly arranged into the form of crystals. The agglomeration of crystals and crystalline defects makes up the microstructure of metals. A large number of material properties are related to the distribution of microstructural elements over the volume of the material. By controlling the microstructure, materials with improved material properties, such as strength, toughness, ductility, hardness, corrosion resistance, or wear resistance can be attained without adding high price rare elements [1,2]. One of the well-accepted methods in texture control is through the combination of plastic deforming and annealing [3,4].
When plastically deformed metal materials are subject to heat treatment under sufficiently high temperature, new and relatively defect-free grains will emerge from deformed material matrix and expand until the deformation microstructure becomes fully consumed. These two processes, referred to as “nucleation” and “growth”, form the microstructural evolution mechanism known as recrystallization [5]. In the past years, microstructure evolution during plastic deformation and recrystallization has piqued the interest of many researchers.
Despite efforts devoted to in-situ/ex-situ observations and simulations of texture evolution during plastic deforming and static recrystallization in various scales, previous research works are still short in several aspects:
Firstly, despite wide industrial application of body centered cubic metals, texture evolution observation of BCC metal with the simplest crystalline structure—single crystal BCC iron is astonishingly rare. Due to the deficiency in available observation results, some recent advanced modellings of texture change during plastic deforming and recrystallization of single crystal iron were either compare with materials of similar microstructure such as low carbon IF steel [6], ARMCO Fe [7], or datasets derived up to 30 years ago [8,9], long before modern microstructural-crystallographic characterization techniques, like electron back-scattering diffusion (EBSD) and dark field X-Ray microscopy get involved.
Moreover, most investigations of texture evolution during plastic deformation and following recrystallization have been conducted under non-simple conditions—extra complexities would have been introduced into experiments due to the use of metals with complex crystalline structures as well as the employment of deforming techniques with sophisticated boundary conditions. Most widely adopted materials in experimental observations of such studies have been particle-containing alloys [10,11,12] and polycrystalline pure metals [13,14] with intricate crystal structures. The complexity in initial microstructure would lead to interaction between migrating boundaries and static ones, hard particles, as well as other texture components during grain growth.
Even for studies carried out on single crystal materials, like the ones on plastically deformed single crystal copper by Zaafarania et al. [15] and on single-crystal nickel-base super alloy by Zambaldi et al. [16], as they employed indentation to introduce plastic deformation into the specimens the straining condition of deformed matrix was quite complex and straining level could not be well controlled. Models able to reproduce kink bands occurred during tensile tests on single crystal superalloy tubes were developed by researchers from Ecole des Mines de Paris [17,18]. Without available microstructure data of deformed specimen, comparison between simulation models and experimental measurements were limited to only load-displacement and shape of slipping band on the tube. The coupling between intricacy in experimental conditions and inevitable randomness rooting in the nature of recrystallization hinders comprehensive understanding of the fundamental aspects in texture evolution and puts extra obstacles in the interpretation of observed results. Other investigations employing rolling (e.g., [19,20,21,22]) channel die compression (e.g., [23,24]), and micro-pillar compression (e.g., [25,26]) would suffer from similar problems.
To sum up, for revealing the relationship between initial texture and deformed texture, and that between deformed matrix and recrystallized structure, study of texture evolution during plastic deforming and recrystallization under conditions with minimized complexity is demanded.
The present study aims at a detailed evaluation of widely used phenomenological model in reproducing experimentally observed deformation characteristics under simple crystalline structure and deformation condition, as well as the prediction of nucleation sites during static recrystallization. In situ EBSD observations were performed to record texture change during static recrystallization of single crystal pure iron specimens after tensile deformation. Meanwhile, crystal plasticity finite element method (CP-FEM) was employed to simulate deformed texture and strain/stress distribution after tensile test. Deformation heterogeneities characterized by kernel average misorientation (KAM) map derived from EBSD data and numerical calculation were compared. The former data shows deformation heterogeneity sensitive to localized microstrain while the later delivers an effective meso-scale deformation distribution. Observed approximate nucleation sites have shown a qualitative coincidence with highly distorted regions in numerical calculations.
2. Methodology
2.1. Experimental Setting
Single-crystal 99.994+% pure iron (from MaTecK, Juelich, Germany) was chosen for studying texture evolution in this experiment. To avoid extra strain introduced during specimen fabrication, specimens were cut with wire electrical discharging machine into the shape shown in Figure 1. The profile deliberately introduces strain concentration to ensure that recrystallized region falls into the neck of the specimen, thus an area of interest can be determined prior to observations. Six specimens with three different initial orientations were fabricated from two single crystal rods (specimen 1-1, 1-2 were cut out from one rod and the other four specimens from another). Initial crystal orientations are given in Table 1 in Euler angles following Bunge’s convention [27].
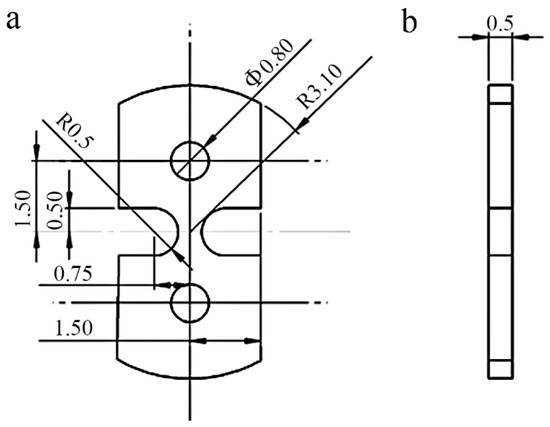
Figure 1.
Dimensions of the specimen: (a) front view; and (b) side view (units are in mm).

Table 1.
Neck elongation and initial crystal orientation of each specimen.
To provide driving force for recrystallization, plastic deformation was applied to the specimens by slowly stretching with a uniaxial tensile machine shown in Figure 2a at room temperature until neck elongation had reached 15–30%. Specimens were fixed into position by inserting pins of diameter 0.79 mm through the two pinholes. Tensile direction was aligned with the centerline of specimen. Tensile loading speed was set to a constant 0.2 mm/min to guarantee quasi-static deformation condition. Neck elongation and initial crystal orientation of each specimen are listed in Table 1. Cold worked specimens were sent to mechanical polishing with SiC2400. Then the surface of specimen was sequentially polished with 6, 2 and 0.25 μm diamond suspensions. Finally, the surface was finished by chemical-mechanical polishing using colloidal silica solution. Surfaces free of detectable polishing damages were generated from the surface preparation procedures.
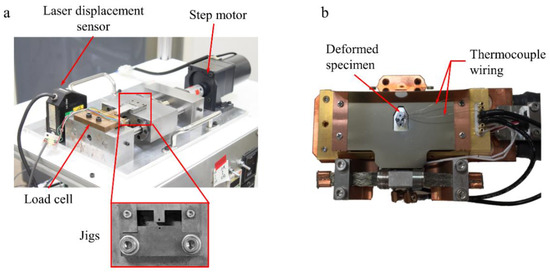
Figure 2.
(a) Device employed for tensile test; (b) deformed specimen set on in situ heating stage.
In-situ annealing and EBSD observation was carried out using a heating stage (Type HSEA-1000, TSL Solutions Ltd., Sagamihara, Japan) with heating range from room temperature to 1000 °C. Figure 2b depicts heating stage used in in situ observation. After deformed specimen was mounted on heating stage, two pairs of thermocouples were attached to both the observed specimen surface and the heating basis to precisely control the temperature of specimen. The specimens were heated to 600 °C to initiate recrystallization and kept at the temperature for a certain time span. In order to determine when to stop for a scan, field emission scanning electron microscope (FE-SEM) was employed to monitor grain growth (JSM 7001F, JEOL, Tokyo, Japan). Temperature variation was constrained to be within ±0.2 °C during annealing. Then specimen temperature was reduced to 200 °C and EBSD scanning was performed with a step size of 2 μm over an area of approximate 900 μm × 500 μm. High vacuum level of Pa was kept throughout the in-situ observation to prevent oxidization.
It should be recognized that the conducted observations extracted microstructure information only from the sample surface. Given the fact that both specimen deformation and grain growth actually happen in three-dimensional space, it is important to thoroughly consider the effect of characterizing 3D phenomenon with 2D observations. As for evaluating strain and deformation energy distribution with 2D EBSD scans, Calcagnotto et al. compared 2D EBSD scan results with 3D ones on compressed dual-phase steels and concluded dislocation distribution estimation from 2D EBSD scans has a reasonable precision [28]. In terms of texture evolution realized by nucleation and growth, although surface effects such as thermal grooving would also contribute to the observed results [29], grain formation and expansion similar to those presented in 2D scanning were also reported in 3D observations [30]. Thus, sufficient information can be obtained from 2D observation for investigating non-specific texture evolution in plastic deformation and static recrystallization.
2.2. CP-FEM Simulation Setting
In addition to in situ EBSD observations in which microstructure on observed surface can be analyzed with high spatial resolution, numerical simulations of tensile deforming process were employed for a comprehensive understanding of straining in the whole bulk. Crystal plasticity finite element method was implemented in the user subroutine UMAT using commercial software package ABAQUS (version 6.14-1, Dassault Systèmes Simulia, Johnston, RI, USA) as the boundary problem solver.
Constitutive model used in this work follows the continuum mechanical framework of elastoplasticity at finite strain established by Asaro et al. [31,32]. At quasi-static strain rates, the localized obstacles to dislocation glide are mainly overcome by thermal activation. Shear strain rate of each slip system can be described with a power law model as follows:
where is the reference shear rate, the shear stress required to overcome the athermal barrier to dislocation motion on the -th slip system, the resolved shear stress on the -slip system, and the strain-rate sensitivity.
An isotropic hardening system following the hardening-recovery format proposed by Kocks and Mecking [33] was employed in this study. All slip systems were assumed to harden at the same rate, resulting in the following evolution equation of slipping system critical shear stress [34]:
where is the initial critical shear stress, the saturation critical shear stress, and stands for the initial hardening rate.
In the current work, {110} <–111> and 12 {112} <11–1> slip families were taken into account during CP-FEM calculation. Glide of dislocations on these slipping systems have been reported to govern mechanical response and accommodate plastic deformation of BCC metals at room temperature [35,36]. By fitting load-stroke curves derived from numerical calculations to those attained in experiments, hardening parameters can be determined, as listed in Table 2. Elastic constants were taken from [37].
Table 2.
Material constants and parameters in current CP-FEM model.
Specimen dimensions in CP-FEM simulation were in accordance with the design shown in Figure 1. The minor dimension deviation introduced during specimen fabrication was ignored in numerical study. Each specimen was divided into 12,606 nodes and 9865 C3D8R mesh elements (three-dimensional quadrilateral mesh with one reduced integration point). Five layers of elements were used along thickness direction. Boundary conditions of the simulation is illustrated in Figure 3. Uniaxial tensile deformation was applied as displacement boundary condition on the upper half of the top pin hole along y-axis such that a constant loading speed same as experiment was obtained. Lower half of the bottom pin hole was fully constrained and other part of the specimen was free to deform.
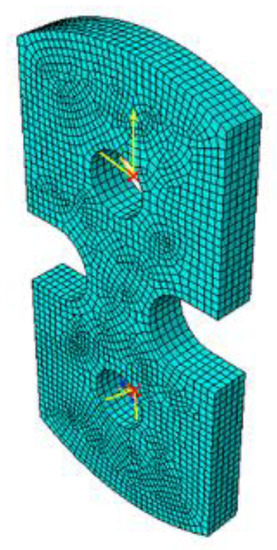
Figure 3.
Boundary condition of CP-FEM simulation model. Upper half of the top pin hole was coupled with a reference point subject to displacement along vertical direction. Lower half of the bottom pin hole was fully constraint through the coupling with another reference point.
3. Results and Discussions
3.1. Deformation Characteristics
To validate CP-FEM simulation results, deformation characteristics including deformed specimen profile, load-stroke curve and microstructure derived from observations and simulations were compared in detail.
Experimentally measured and numerically calculated specimen profiles after tensile deformation have been shown in Figure 4. For space-saving purpose, only specimen with the largest neck elongation, i.e., specimen 3-1, has been presented. Similarity in general shape is obvious between measured and simulated results, except for that shrinkage in neck width is a little bit more severe in experiment.
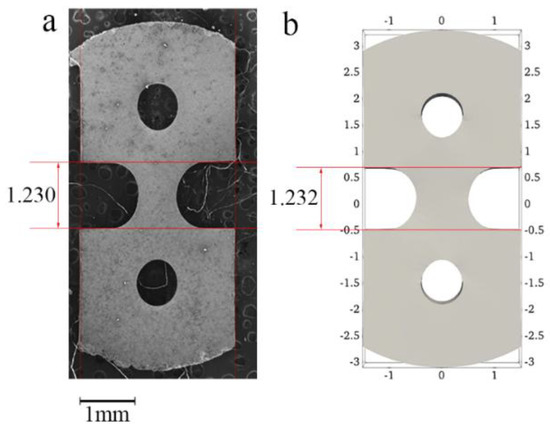
Figure 4.
Specimen profile of specimen 3-1 after deformation (a) measured by SEM; and (b) derived from CP-FEM simulation (units are in mm).
With aforementioned set of parameters, fitting results on experimentally derived load-stroke curves of three different initial crystal orientations are presented in Figure 5. As previously mentioned, for each of the three different initial orientations, two repetitions of tensile tests were conducted to evaluate the statistical scatter in measured load-stroke curves. As presented in Figure 5, satisfying reproducibility was found in separated experiments with same initial crystal orientation, confirming the reliability of experimental results.
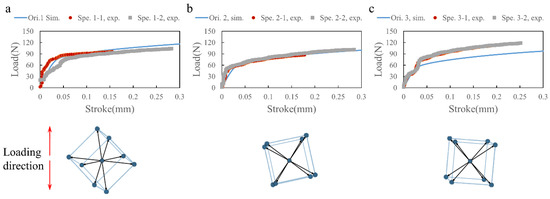
Figure 5.
Measured and simulated load stroke curves of (a) initial orientation 1; (b) orientation 2; and (c) orientation 3. Crystal lattices before tensile loading were given with black lines highlighting <111> slipping directions. Loading direction was given with red arrow.
Good fittings were observed on orientation 1 and 2. For simulation with orientation 3 in Figure 5c, yielding point in simulated load-stroke curve was lower than that in experimental data. Nevertheless, the hardening tendency coincided with experiments as indicated by a same slope in load-stroke curves.
Deformed microstructure of specimen neck region was extracted and visualized with inverse pole figures (IPF) using the open-source MATLAB toolbox MTEX 5.1.1 [38]. The comparison between EBSD observed microstructures and numerically simulated ones after tensile deformation is given in Figure 6. To save space, only the results of specimens with larger neck elongation in each initial crystal orientation are presented. As shown in Figure 6, good agreement between measured and simulated texture can be found for all three initial crystal orientations. The capability of current CP-FEM setting in characterizing texture evolution during tensile deforming can be confirmed.
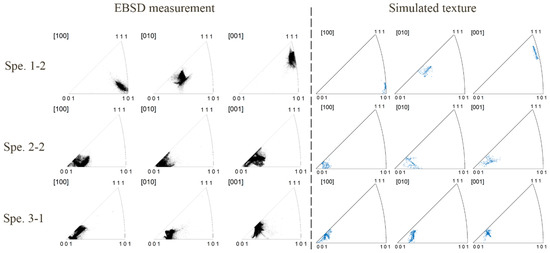
Figure 6.
Comparison between EBSD observed microstructures in the specimen neck region and numerically calculated results after tensile deformation. Only the specimens with larger neck elongation in each initial orientation were presented to save space.
Thus, it can be concluded that CP-FEM simulations were reliable in reproducing deformation characteristics of single crystal iron specimen with distinct initial crystal orientations.
3.2. Deformation Heterogeneity
Plastic deformation rarely happens in a homogeneous manner in microscale. Especially for a single crystal specimen in which the activation of slipping systems is largely determined by its initial crystal orientation, deformation heterogeneity is commonly presented in forms like deformation and transition bands. These band regions contain a larger quantity of dislocations, as well as larger variations in crystalline orientation and higher local deformation energy. Nucleation, especially nucleation by the migration of low angle boundaries which are formed by a collection of dislocations, tends to locate in these heterogeneities since concentration of lattice defects provides potential nucleation sites for the following generation of high angle grain boundaries separating this area with surrounding [39].
Kernel average misorientation mapping gives a representation of pointwise heterogeneity inside selected kernel by calculating and averaging the misorientations between the center point of the kernel and all neighboring points in the kernel. In this study, only the points at the perimeter of the kernel were used for the calculation of KAM value. For EBSD observations, kernel size was selected so that only first order neighbors of selected points were included, as demonstrated in Figure 7a. For numerical calculated results, the surface layer of elements were extracted and first order neighbors were decided based on connectivity of mesh elements, as depicted in Figure 7b. Then KAM values were calculated based on the local variation in misorientation as:
where N is the number of neighboring points inside the kernel, is the misorientation between selected point and the i-th neighbor.
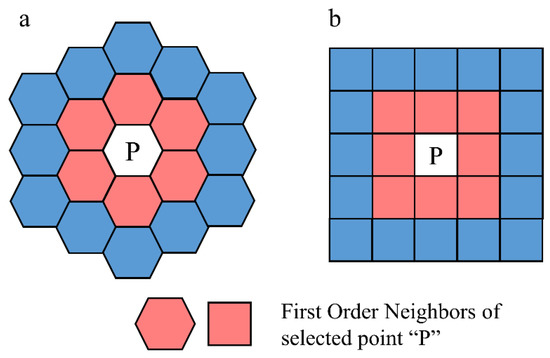
Figure 7.
Principle of KAM calculation performed on (a) EBSD data; (b) simulation results; P stands for the selected point. Red blocks indicate first order neighbors of the selected point.
KAM maps measured with EBSD on specimens after tensile deformation are shown in Figure 8. In this work as well other research works on plastic heterogeneity (e.g., [40,41]), KAM maps are used to show the heterogeneity in deformation and stored energy on observed surface as high KAM regions indicate highly distorted regions. By comparing between groups (a–b), (c–d), and (e–f), deformation heterogeneity patterns were found to be dependent on initial crystal orientation of the specimen. For specimens with the same initial texture, the same heterogeneity pattern persisted when specimens were deformed to different degrees. However, as applied plastic deformation grew larger, deformation heterogeneity patterns were strengthened for the storage of more deformation energy, as can be concluded by comparing Figure 8a,b, as well as Figure 8c,d.
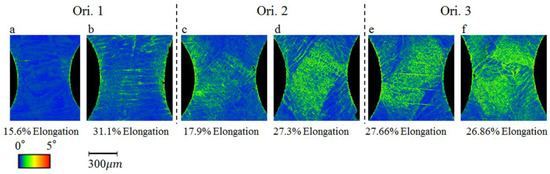
Figure 8.
Kernel average misorientation maps derived from EBSD after tensile deformation of (a) spe. 1-1; (b) spe. 1-2; (c) spe. 2-1; (d) spe. 2-2; (e) spe. 3-1; and (f) spe. 3-2. Dashed lines were used to separate specimens with different initial orientations.
With the principle shown in Figure 7b, KAM values can be calculated from CP-FEM results in a comparable definition to EBSD measurements. Contour plots of derived KAM values are demonstrated in Figure 9. Similar to the results derived from EBSD data, deformation heterogeneity patterns were dependent of initial crystal orientations. The same pattern persists for specimens of the same initial crystal orientation but undergone different degrees of plastic deformation.
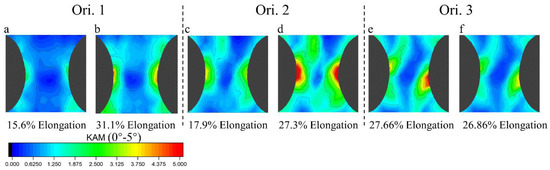
Figure 9.
Kernel average misorientation maps derived from CP-FEM simulation after tensile deformation of (a) spe. 1-1; (b) spe. 1-2; (c) spe. 2-1; (d) spe. 2-2; (e) spe. 3-1; and (f) spe. 3-2. Dashed lines were used to separate specimens with different initial orientations.
By comparing KAM maps derived from EBSD scans (Figure 8) and CP-FEM simulations (Figure 9), it can be seen that the results derived from CP-FEM would capture more macroscopic features of plastic deformation. Around specimen edges, high KAM value regions were observed both in EBSD data and simulations; contour lines in Figure 9 have shown similar shapes with their counterparts in Figure 8—horizontal lines were both found in Figure 8a and Figure 9a, contour lines forming similar inclined rectangular shapes can be seen in Figure 8c–f and Figure 9c–f. In the central area of specimen neck, low KAM areas indicated by large region colored in blue were found in numerical calculations, while miniature deformation heterogeneity formed clear slipping bands under EBSD observations. Additionally, in areas where local variation in misorientation is large, simulated KAM values are generally larger than the ones derived from experiments since clearly more of regions colored in red can be identified from Figure 9.
The reasons accounting for these differences may be that simulated deformation heterogeneity differs from experimental observations in mainly two aspects: firstly, due to resolution difference(in current study, each EBSD scan contains over 200,000 data points while CP-FEM calculations were conducted on less than 10,000 elements), local distortions cannot be fully expressed in simulations; Secondly, the convergence of FEM simulation results is built on continuum theory in which large local distortion which can cause the divergence of to-be-solved partial differential equations is not allowed. Therefore, significant local fluctuations in lattice rotation and large relative nodal displacement were eliminated, leading to a more averaged and macroscopic result in CP-FEM simulations; Moreover, the rudimentary model employed in current work may be incapable of capturing the immediate partitioning of a discrete structure evolving inside the material bulk. More sophisticated crystal plasticity models taking account of intrinsic features of BCC plasticity such as non-Schmidt effects and dislocation climbing [42] as well as models which are able to characterize interaction between dislocations with arbitrary grid resolution [43] may be helpful in reproducing such microscale deformation heterogeneity.
3.3. Nucleation Sites—Observation and Prediction
Full recrystallization process was recorded with in-situ EBSD system. Microstructure evolutions of specimen 1-2, 2-2, 3-1 and 3-2 during annealing at 600 °C till 1 h are presented in Figure 10, Figure 11, Figure 12 and Figure 13. As for specimen 1-1 and 2-1, the applied deformation seemed not enough to trigger texture evolution and no newly formed grain was found even after heated for 1 h.
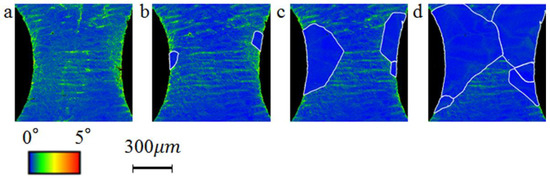
Figure 10.
Microstructure evolution of specimen 1-2 at annealing time (a) 0 min; (b) 5 min; (c) 15 min; and (d) 60 min. Grain boundaries were highlighted with white lines.
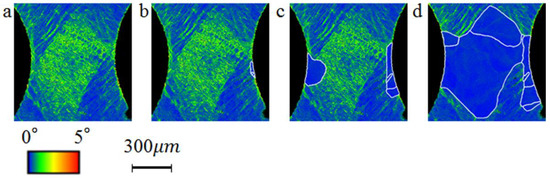
Figure 11.
Microstructure evolution of specimen 2-2 at annealing time (a) 0 min; (b) 5 min; (c) 30 min; and (d) 60 min. Grain boundaries were highlighted with white lines.
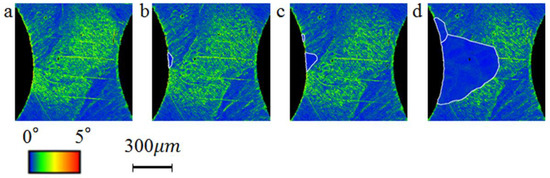
Figure 12.
Microstructure evolution of specimen 3-1 at annealing time (a) 0 min; (b) 12.83 min; (c) 15 min; and (d) 60 min. Grain boundaries were highlighted with white lines.
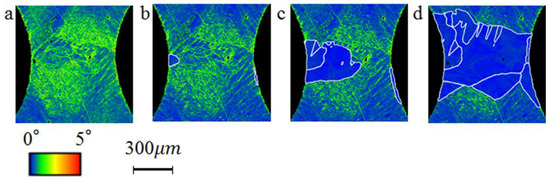
Figure 13.
Microstructure evolution of specimen 3-2 at annealing time (a) 0 min; (b) 10 min; (c) 20 min; and (d) 60 min. Grain boundaries were highlighted with white lines.
Two different types of nucleation can be observed in the presented texture evolution records: at the early stage of annealing, new grains emerged from the edge regions where large deformation heterogeneity was characterized by high KAM value, as can be seen in Figure 10b, Figure 11b, Figure 12b, and Figure 13b. According to Cahn-Cottrell model, the formation of these grains may consist of two steps—first sub-grain boundaries took shape by polygonization of condensed dislocations and then embryos expanded in area at the cost of absorbing and rearranging neighboring microstructural defects [44,45,46]; the second type of nucleation started from already-formed high angle grain boundaries, as can be noticed in Figure 10c,d and Figure 11c,d and other recorded microstructure after annealing for longer than 15 min. As been suggested by Beck, the mechanism of such nucleation may be due to the migration of pre-existing high angle grain boundaries toward more highly-deformed areas [47,48]. The later mechanism is commonly accompanied by high angle grain boundary serration and is not only related to local deformation heterogeneity but also grain boundary curvature [49]. In this paper, focus will be put on the first kind of nucleation in which deformation heterogeneity has a decisive impact on nucleation site.
In Figure 14, inverse pole mappings of specimens at the time point when newly-formed grains were first observed were given and nucleation sites were pointed out with yellow circles. For specimen 1-1, and 2-1, since no recrystallization was observed, no circle was plotted on the corresponding figures. As previously mentioned, most newly formed grains at early stage of static recrystallization originated from specimen edges in this study.
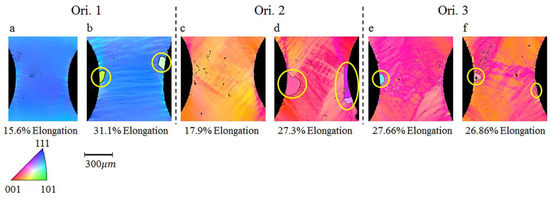
Figure 14.
EBSD measured inverse pole mapping of (a) 1-1 annealed for 60 min; (b) 1-2 annealed for 5 min; (c) 2-1 annealed for 60 min; (d) 2-2 annealed for 30 min; (e) 3-1 annealed for 15 min; and (f) 3-2 annealed for 10 min. Grain boundaries were labeled with solid black lines. These mappings have indicated approximate locations of nucleation sites. Yellow circles pointed out nucleation sites at the first stage of recrystallization. Dashed lines were used to separate specimens with different initial orientations.
The same nucleation sites were labeled on top 20% KAM value regions of all specimens as demonstrated in Figure 15. As can be noticed, although nuclei did appear from high KAM locations (among top 20% on observed surface), it was impossible to determine exact locations merely from KAM values. Especially in Figure 15d–f, despite high KAM concentration in the central of specimen neck, first grains emerged from the edges. The main reason might be that KAM map, in its nature, would be largely influenced by local deformation features, such as stress concentration due to local zig-zags around specimen edge, surface unevenness and impurity contained in specimens. These local features added “noise” into KAM mapping and impeded the expression of mesoscale distribution of deformation heterogeneity. As a result, it is challenging to make precise predictions of nucleation sites with EBSD observed deformation heterogeneity alone.
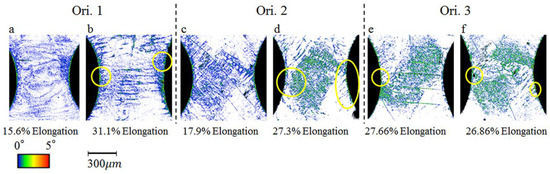
Figure 15.
KAM maps showing locations with top 20% KAM values for specimen (a) 1-1; (b) 1-2; (c) 2-1; (d) 2-2; (e) 3-1; and (f) 3-2 before annealing. Yellow circles pointed out nucleation sites same as those in the previous figure. Dashed lines were used to separate specimens with different initial orientations.
By comparing approximate nucleation sites depicted in Figure 15 and high KAM regions in numerical calculation, qualitative coincidence can be found, indicating a potential correlation between nucleation and mesoscale distortion in calculation. This substantiates the use of microstructure simulation algorithms such as cellular automaton, phase field method and Monte Carol model on energy/distortion distribution derived from CP-FEM for nucleation prediction. Yet direct quantitative comparison between concentration of dislocations in CP-FEM and observed nucleation sites is difficult due to the following obstacles: firstly, with two-dimensional microstructure characterization methods, it is challenging to capture the true nucleation sites as nuclei may actually occur beneath the observed plane and emerge into the observed scope during growth; secondly, numerically calculated specimens can hardly have exactly the same macroscopic deformation as derived in experiments. Thus, a perfect overlay of the mesh grid in simulation and the measured points would be of great difficulty. Quantitative analysis like cross-correlation which is sensitive to such overlapping can hardly be performed.
4. Conclusions
In the present study, CP-FEM combined with in situ EBSD observations were used to characterize deformation heterogeneity on tensile deformed single crystal pure iron specimens of three different initial crystal orientations. Texture evolution during annealing under 600 °C was traced and approximate nucleation sites were compared with high KAM areas derived from EBSD data and simulations. The following conclusions can be drawn:
- Real-world scale CP-FEM calculations on single crystal iron tensile test were compared with experimental observations in four aspects: macroscopic deformation of specimen, load-stroke curve, deformed texture and kernel average misorientation maps. The capability of widely used phenomenological model in reproducing experimentally observed deformation characteristics was evaluated.
- Comparison was made between deformation heterogeneities expressed by KAM derived from EBSD observations and numerical simulations. Around the edges, high deformation heterogeneities were both found in experiments and simulations, while in the central of specimen neck, KAM maps contained more local deformation information than numerically calculated results. Failure in capturing microscale deformation heterogeneity in simulations may be attributed to relatively low grid resolution and incapability of employed constitutive equations in accounting for evolving of discrete dislocation structures inside the material.
- Areas with large distortion concentration in simulation has a qualitative coincidence with approximate nucleation sites in the first stage of recrystallization. This observation justifies the direct application of microstructure simulation methods such as cellular automaton model on energy/distortion distribution derived from CP-FEM for nucleation prediction.
- Experimentally-derived KAM maps have shown similar level of heterogeneity in a large portion of specimen edges. Experimentally observed KAM map is sensitive to local miniature features like zig-zags along edge curvature, surface unevenness, and impurity in specimen.
Author Contributions
Z.L. performed the experiments and simulations, analyzed results and composed the manuscript; M.Y. supervised throughout experiments, reviewed, and edited the manuscript; M.T. contributed to the design of experiment, material preparation, and specimen fabrication; and A.Y. contributed to the CPFEM simulation techniques.
Funding
This research was funded by AMADA Foundation, grant number AF-2016035.
Conflicts of Interest
The authors declare no conflict of interest.
References
- Torquato, S. Random Heterogeneous Materials: Microstructure and Macroscopic Properties; Springer Science & Business Media: Berlin, Germany, 2013; Volume 16, ISBN 1475763557. [Google Scholar]
- Zum Gahr, K.-H. Microstructure and Wear of Materials; Elsevier: Amsterdam, The Netherlands, 1987; Volume 10, ISBN 0080875742. [Google Scholar]
- Pérez-Prado, M.T.; Del Valle, J.A.; Contreras, J.M.; Ruano, O.A. Microstructural evolution during large strain hot rolling of an AM60 Mg alloy. Scr. Mater. 2004, 50, 661–665. [Google Scholar] [CrossRef]
- Li, B.L.; Godfrey, A.; Meng, Q.C.; Liu, Q.; Hansen, N. Microstructural evolution of IF-steel during cold rolling. Acta Mater. 2004, 52, 1069–1081. [Google Scholar] [CrossRef]
- Humphreys, F.J.; Hatherly, M. Recrystallization and Related Annealing Phenomena; Elsevier: Amsterdam, The Netherlands, 2012; ISBN 008098388X. [Google Scholar]
- Lu, C.; Gao, Y.; Deng, G.Y.; Michal, G.; Huynh, N.N.; Liu, X.H.; Tieu, A.K. Atomic-scale anisotropy of nanoscratch behavior of single crystal iron. Wear 2009, 267, 1961–1966. [Google Scholar] [CrossRef]
- Tang, M.; Marian, J. Temperature and high strain rate dependence of tensile deformation behavior in single-crystal iron from dislocation dynamics simulations. Acta Mater. 2014, 70, 123–129. [Google Scholar] [CrossRef]
- Domain, C.; Monnet, G. Simulation of Screw Dislocation Motion in Iron by Molecular Dynamics Simulations. Phys. Rev. Lett. 2005, 95, 215506. [Google Scholar] [CrossRef] [PubMed]
- Gordon, P.A.; Neeraj, T.; Li, Y.; Li, J. Screw dislocation mobility in BCC metals: The role of the compact core on double-kink nucleation. Model. Simul. Mater. Sci. Eng. 2010, 18, 13. [Google Scholar] [CrossRef]
- Lens, A.; Maurice, C.; Driver, J.H. Grain boundary mobilities during recrystallization of Al-Mn alloys as measured by in situ annealing experiments. Mater. Sci. Eng. A 2005, 403, 144–153. [Google Scholar] [CrossRef]
- Zhu, K.Y.; Chaubet, D.; Bacroix, B.; Brisset, F. A study of recovery and primary recrystallization mechanisms in a Zr-2Hf alloy. Acta Mater. 2005, 53, 5131–5140. [Google Scholar] [CrossRef]
- Helbert, A.L.; Wang, W.; Brisset, F.; Baudin, T.; Penelle, R. In situ EBSD investigation of recrystallization in a partially annealed and cold-rolled aluminum alloy of commercial purity. Adv. Eng. Mater. 2012, 14, 39–44. [Google Scholar] [CrossRef]
- Field, D.P.; Bradford, L.T.; Nowell, M.M.; Lillo, T.M. The role of annealing twins during recrystallization of Cu. Acta Mater. 2007, 55, 4233–4241. [Google Scholar] [CrossRef]
- Kerisit, C.; Logé, R.E.; Jacomet, S.; Llorca, V.; Bozzolo, N. EBSD coupled to SEM in situ annealing for assessing recrystallization and grain growth mechanisms in pure tantalum. J. Microsc. 2013, 250, 189–199. [Google Scholar] [CrossRef] [PubMed]
- Zaafarani, N.; Raabe, D.; Singh, R.N.; Roters, F.; Zaefferer, S. Three-dimensional investigation of the texture and microstructure below a nanoindent in a Cu single crystal using 3D EBSD and crystal plasticity finite element simulations. Acta Mater. 2006, 54, 1863–1876. [Google Scholar] [CrossRef]
- Zambaldi, C.; Roters, F.; Raabe, D.; Glatzel, U. Modeling and experiments on the indentation deformation and recrystallization of a single-crystal nickel-base superalloy. Mater. Sci. Eng. A 2007, 454–455, 433–440. [Google Scholar] [CrossRef]
- Forest, S. Modeling slip, kink and shear banding in classical and generalized single crystal plasticity. Acta Mater. 1998, 46, 3265–3281. [Google Scholar] [CrossRef]
- Meric, L.; Cailletaud, G. Single Crystal Modeling for Structural Calculations: Part 2—Finite Element Implementation. J. Eng. Mater. Technol. 1991, 113, 171–182. [Google Scholar] [CrossRef]
- Zhang, Y.B.; Godfrey, A.; Liu, Q.; Liu, W.; Jensen, D.J. Analysis of the growth of individual grains during recrystallization in pure nickel. Acta Mater. 2009, 57, 2631–2639. [Google Scholar] [CrossRef]
- Ateba Betanda, Y.; Helbert, A.L.; Brisset, F.; Mathon, M.H.; Waeckerlé, T.; Baudin, T. Measurement of stored energy in Fe-48%Ni alloys strongly cold-rolled using three approaches: Neutron diffraction, Dillamore and KAM approaches. Mater. Sci. Eng. A 2014, 614, 193–198. [Google Scholar] [CrossRef]
- Liu, Q.; Juul Jensen, D.; Hansen, N. Effect of grain orientation on deformation structure in cold-rolled polycrystalline aluminium. Acta Mater. 1998, 46, 5819–5838. [Google Scholar] [CrossRef]
- Malta, P.O.; Alves, D.S.; Ferreira, A.O.V.; Moutinho, I.D.; Dias, C.A.P.; Santos, D.B. Static Recrystallization Kinetics and Crystallographic Texture of Nb-Stabilized Ferritic Stainless Steel Based on Orientation Imaging Microscopy. Metall. Mater. Trans. A Phys. Metall. Mater. Sci. 2017, 48, 1288–1309. [Google Scholar] [CrossRef]
- Radhakrishnan, B.; Sarma, G. Simulating the deformation and recrystallization of aluminum bicrystals. JOM 2004, 56, 55–62. [Google Scholar] [CrossRef]
- Zaefferer, S.; Kuo, J.C.; Zhao, Z.; Winning, M.; Raabe, D. On the influence of the grain boundary misorientation on the plastic deformation of aluminum bicrystals. Acta Mater. 2003, 51, 4719–4735. [Google Scholar] [CrossRef]
- Korte-Kerzel, S. Microcompression of brittle and anisotropic crystals: Recent advances and current challenges in studying plasticity in hard materials. MRS Commun. 2017, 7, 109–120. [Google Scholar] [CrossRef]
- Chen, R.; Sandlöbes, S.; Zehnder, C.; Zeng, X.; Korte-Kerzel, S.; Raabe, D. Deformation mechanisms, activated slip systems and critical resolved shear stresses in an Mg-LPSO alloy studied by micro-pillar compression. Mater. Des. 2018, 154, 203–216. [Google Scholar] [CrossRef]
- Bunge, H.J.; Esling, C. Deutsche Gesellschaft für Metallkunde; Quantitative texture analysis; DGM Informationsgesellschaft: Berlin, German, 1986; pp. 52–126. [Google Scholar]
- Calcagnotto, M.; Ponge, D.; Demir, E.; Raabe, D. Orientation gradients and geometrically necessary dislocations in ultrafine grained dual-phase steels studied by 2D and 3D EBSD. Mater. Sci. Eng. A 2010, 527, 2738–2746. [Google Scholar] [CrossRef]
- Rost, M.J.; Quist, D.A.; Frenken, J.W.M. Grains, Growth, and Grooving. Phys. Rev. Lett. 2003, 91, 1–4. [Google Scholar] [CrossRef] [PubMed]
- Jensen, D.J.; Schmidt, S. Time Evolution in 3D Metal Microstructures—Recrystallization. Mater. Trans. 2009, 50, 1655–1659. [Google Scholar] [CrossRef]
- Peirce, D.; Asaro, R.J.; Needleman, A. An analysis of nonuniform and localized deformation in ductile single crystals. Acta Metall. 1982, 30, 1087–1119. [Google Scholar] [CrossRef]
- Asaro, R.J. Crystal plasticity. Trans. ASME J. Appl. Mech. 1983, 50, 921–934. [Google Scholar] [CrossRef]
- Kocks, U.F.; Mecking, H. Physics and phenomenology of strain hardening: The FCC case. Prog. Mater. Sci. 2003, 48, 171–273. [Google Scholar] [CrossRef]
- Groh, S.; Marin, E.B.; Horstemeyer, M.F.; Zbib, H.M. Multiscale modeling of the plasticity in an aluminum single crystal. Int. J. Plast. 2009, 25, 1456–1473. [Google Scholar] [CrossRef]
- Ali, D.; Mushtaq, N.; Butt, M.Z. Investigation of active slip-systems in some body-centered cubic metals. J. Mater. Sci. 2011, 46, 3812–3821. [Google Scholar] [CrossRef]
- Li, S.; Gazder, A.A.; Beyerlein, I.J.; Davies, C.H.J.; Pereloma, E.V. Microstructure and texture evolution during equal channel angular extrusion of interstitial-free steel: Effects of die angle and processing route. Acta Mater. 2007, 55, 1017–1032. [Google Scholar] [CrossRef]
- Ledbetter, H.M.; Reed, R.P. Elastic Properties of Metals and Alloys, I. Iron, Nickel, and Iron-Nickel Alloys. J. Phys. Chem. Ref. Data 1973, 2, 531–618. [Google Scholar] [CrossRef]
- Bachmann, F.; Hielscher, R.; Schaeben, H. Texture Analysis with MTEX—Free and Open Source Software Toolbox. Solid State Phenom. 2010, 160, 63–68. [Google Scholar] [CrossRef]
- Humphreys, F.J. Nucleation in Recrystallization. Mater. Sci. Forum 2004, 467–470, 107–116. [Google Scholar] [CrossRef]
- Zouari, M.; Bozzolo, N.; Loge, R.E. Mean field modelling of dynamic and post-dynamic recrystallization during hot deformation of Inconel 718 in the absence of δ phase particles. Mater. Sci. Eng. A 2016, 655, 408–424. [Google Scholar] [CrossRef]
- Signorelli, J.; Fourty, A.; Roatta, A.; Schwindt, C.; Schlosser, F.; Bolmaro, R. Study of Plastic Heterogeneity in a Low Carbon Steel Sheet by EBSD. Procedia Mater. Sci. 2015, 8, 986–993. [Google Scholar] [CrossRef]
- Cereceda, D.; Diehl, M.; Roters, F.; Raabe, D.; Perlado, J.M.; Marian, J. Unraveling the temperature dependence of the yield strength in single-crystal tungsten using atomistically-informed crystal plasticity calculations. Int. J. Plast. 2016, 78, 242–265. [Google Scholar] [CrossRef]
- Admal, N.C.; Po, G.; Marian, J. A unified framework for polycrystal plasticity with grain boundary evolution. Int. J. Plast. 2018, 106, 1–30. [Google Scholar] [CrossRef]
- Beck, P.A. The formation of recrystallization nuclei. J. Appl. Phys. 1949, 20, 633–634. [Google Scholar] [CrossRef]
- Cahn, R.W. A New Theory of Recrystallization Nuclei. Proc. Phys. Soc. Sect. A 1950, 63, 323–336. [Google Scholar] [CrossRef]
- Cottrell, A.H. Theory of dislocations. Prog. Met. Phys. 1953, 4, 205–264. [Google Scholar] [CrossRef]
- Beck, P.A.; Sperry, P.R. Strain induced grain boundary migration in high purity aluminum. J. Appl. Phys. 1950, 21, 150–152. [Google Scholar] [CrossRef]
- Dillamore, I.L.; Katoh, H. The Mechanisms of Recrystallization in Cubic Metals with Particular Reference to Their Orientation-Dependence. Met. Sci. 1974, 8, 73–83. [Google Scholar] [CrossRef]
- Sakai, T.; Belyakov, A.; Kaibyshev, R.; Miura, H.; Jonas, J.J. Dynamic and post-dynamic recrystallization under hot, cold and severe plastic deformation conditions. Prog. Mater. Sci. 2014, 60, 130–207. [Google Scholar] [CrossRef]


© 2018 by the authors. Licensee MDPI, Basel, Switzerland. This article is an open access article distributed under the terms and conditions of the Creative Commons Attribution (CC BY) license (http://creativecommons.org/licenses/by/4.0/).