Abstract
The flow behavior of the Al–Si–Mg alloy under uniaxial compression loading was investigated at different strain rates (10−3 s−1, 10−2 s−1,10−1 s−1, 100 s−1) at a wide range of temperatures (573 K, 623 K, 673 K, 723 K, 773 K). The results showed that the peak stress increase with the strain rate and decrease with the increase of temperature. According to the measured flow stress curves, a modified Johnson-Cook (J-C) constitutive model taking strain rate effect on thermo softening into account was proposed to delineate the flow behavior. The comparisons between the measured flow curves and the predicted ones showed them to be very close and the average error is 1.65%. The added experiments were also conducted for validating the modified model, and the predicted data well agreed with the measured flow stress curves. That indicated the modified Johnson-Cook model is reliable and can accurately delineate the flow behavior of Al–Si–Mg alloy.
1. Introduction
Reducing weight of an automobile’s body can reduce pollutant emissions, improve fuel efficiency and make driving safer. Almost all automobile manufacturers put their attention on weight reduction [1,2]. The Al–Si–Mg system alloys are the most commonly used lightweight material because of their excellent castability, corrosion resistance and the possibility of precipitation hardening [3,4,5]. However, the usage of those alloys is still limited as lower mechanical properties are induced by the coarse casting dendritic microstructures and defects. Severe plastic deformation methods, such as friction stir processing [4], equal channel angular pressing [6] and cryorolling [7], are found to effectively eliminate those drawbacks. During those processes, a large amount of plastic deformation is introduced into the material which refines its casting features, thereby improving the mechanical performance of the material [8]. Thus, it is particularly significant to establish the optimal process parameters for refining the microstructure and improving the mechanical property. A processing map and the finite element method are the two common means to optimize the process parameters. A precise relationship between the thermal mechanical behavior and external loading of the material is the foundation for establishing an accurate processing map or a finite element model.
A constitutive model can be used for simulating the relationship of material thermo mechanical behavior and external loading, which is greatly determined by the material crystal structure and deformation conditions. A precise constitutive model is crucial in making an optimal forming process or establishing a reliable finite element model. Lots of research has made efforts to comprehend and model the thermo mechanical response at varied deformation conditions. Johnson and Cook presented the Johnson-Cook (J-C) model for computing the various materials’ flow behavior under large strains, high strain rates and temperatures; the computed data were in good agreement with the experimental results at cylinder impact conditions [9]. Zerilli and Armstrong proposed the dislocation-mechanics-based constitutive model for copper and iron, and found that materials with different crystal structures have a different constitutive model due to the varied dislocation properties [10]. Nemat-Nasser and Li developed a physically-based model for face centered cubic (FCC) materials, the prediction data fitted the experimental data very well [11]. Khan and Liang proposed a constitutive model that takes the influence of strain and strain rate on the work hardening into account, the model had a good correlation with the measured data [12]. Yang et al. and Dong et al. established the Arrhenius-type constitutive model of the GH4169 superalloy and Al–Mg–Si aluminum alloy respectively, and the flow behaviors were accurately predicted in both studies [13,14]. An artificial neural network (ANN) was also used to predict the flow behavior and mechanical performance as which can mimic complex and non-linear relationships. Lin et al. predicted the flow behavior of the 42CrMo steel by ANN method, the absolute relative error for the test dataset was 4.56% [15]; Filippis et al. predicted the micro-hardness and ultimate tensile strength of the friction stir-welding butt joints by the ANN method [16]. Furthermore, the ANN method can also be used for optimizing the process parameters [17,18]. Those constitutive models can be divided into three classes: physical based models, empirical phenomenological models, and ANN models [19]. Physical-based models predict the thermo-mechanical behavior based on the mechanisms of dislocation motion and microstructure evolution [20,21]. However, it is difficult to establish an accurate mathematical relationship between the external loading and the dislocation motion or microstructure evolution. Accordingly, many researchers put their efforts into developing phenomenological based models because those models always characterize with a concise format and are easier to calibrate [22].
The J-C model is the widely used phenomenological-based model. In order to delineate the thermal mechanical response more precisely, many modified J-C models have been proposed to satisfy varied deformation conditions. Ravindranadh proposed a modified J-C model which took the effects of work hardening and thermal softening into account, and the modified model successfully enhanced the prediction accuracy of the flow behavior of the FeCoNiCr alloy [23]. Wang proposed a modified J-C model that considered the coupling effects of strain, strain rate and forming temperature, the modified model had a well agreement with the measured data of the 30Cr2Ni4MoV [24]. Tao established a modified J-C model that considered the interaction of strain hardening and thermal softening for simulating the flow behavior of the Ti-6Al-4V tube, the modified model had better prediction precision [25]. Wang proposed a modified J-C model to predict the flow behavior of 35CrMo steel, and the modified model possessed a higher fitting precision than the original one [26]. As face-centered cubic material, aluminum alloys were proved to have thermal dependent strain rate sensitivity [27] and the influence of strain rate on thermal softening was not considered in the above modified models. However, the problems related to softening material behavior in numerical simulations, such as pronounced mesh dependency and infinitely small softening zone with zero dissipated energy, affected the efficiency and accuracy of the numerical simulations [28]. Aiming to eliminate those problems, regularization techniques such as gradient-enhanced models or nonlocal integral formulations were employed in finite element simulations [29,30,31,32].
In this study, quasi-static hot compression experiments of Al–Mg–Si aluminum alloy were performed with different strain rates and temperatures, and the material responses at those deformation conditions were researched. A modified Johnson-Cook model considering the strain rate effect on thermal softening was established for this material. Finally, a comparison analysis of the flow curves obtained by experiment and prediction was conducted.
2. Materials and Methods
The commercial casting Al–Mg–Si alloy was used, and its chemical composition is listed in Table 1. Cylindrical specimens (Ø 10 mm × H 15 mm) were machined from a casting ingot. The isothermal hot compression experiments were performed by a Gleeble-3800 thermo-mechanical (Northwest Institute for Non-ferrous Metal Research, Xi’an, China) simulator with different temperatures (573 K, 623 K, 673 K, 723 K, 773 K) and strain rates (10−3 s−1, 10−2 s−1, 10−1 s−1, 100 s−1). All samples were firstly heated to preset temperature with a 5 °C·s−1 heating rate, and held for 2 min to eliminate the temperature gradient inside the sample before the compression process. Aiming to impede oxidation of the specimen surface, the chamber was in a vacuum state during the heating and compression process. Two very thin tantalum plates were cohered at the end of the sample to minimize the friction effect and prevent the adhesion of the specimen on the die. The test setup and the specimens are illustrated in Figure 1.

Table 1.
Chemical composition of the Al–Mg–Si alloy (wt %).
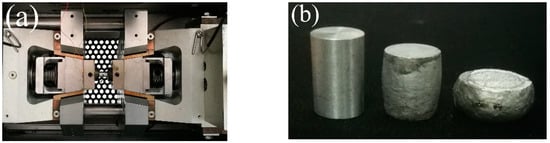
Figure 1.
(a) The test setup and (b) the specimens before, during and after the tests.
3. Results
The flow curves at various strain rates and temperatures are illustrated in Figure 2. As shown in Figure 2, those curves are characterized with similar features at various compression strain rates and temperatures. The true stress increases dramatically during the initial compression stage, and reaches the peak value. Then, the true stress descends gradually and then reaches a plateau state. Those flow stress features are the results of competing between work hardening and dynamic softening during the isothermal compression. At the initial stage, the dislocations propagate and accumulate dramatically at precipitate particles or impenetrable obstacles. The work hardening dominates the flow behavior during this period and the true stress increases with strain. Meanwhile, the stored energy rapidly accumulates with the increase of strain, which provides driving force for the dislocation climb and dislocation glide. The dislocation climb and dislocation glide can lead to the annihilation of dislocations, and that is deemed to be the softening process. When flow stress reaches the peak value, an instantaneous equilibrium between work hardening and dynamic softening occurs. With a further increase of deformation, the dynamic softening dominates the flow behavior, and the flow curves descend. The latter plateau state can be attribute to the dynamic equilibrium between work hardening and dynamic softening.
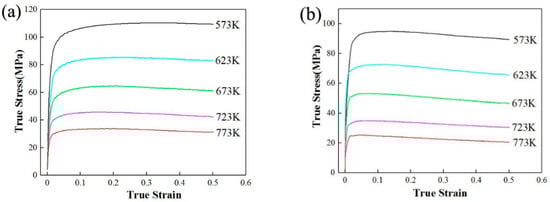
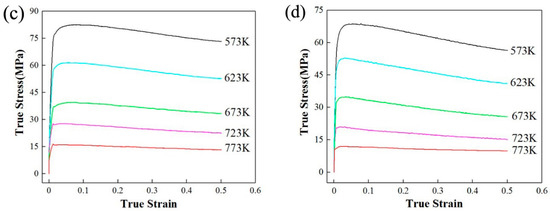
Figure 2.
Flow curves of A356 alloys obtained from compression tests: (a) 100 s−1; (b) 10−1 s−1; (c) 10−2 s−1; (d) 10−3 s−1.
As shown in Figure 2, the flow curves are sensitive to the deformation condition, and that can be attributed to the work hardening and dynamic softening. As there is not enough time for energy accumulation and dislocation annihilation at a higher strain rate, the flow stress increases with strain rate [33]. With increasing of the deformation temperature, the textural softening will lead to a decrease in the stress for dislocation motion, while the stress needed to deform the material decreases [34]. Moreover, plenty of the strength phases will successive dynamic coarsening or dissolution at higher temperature, which can also lead to a decrease of flow stress [35]. Thus, the flow stress decreases with the increase of deformation temperature.
4. Discussion
4.1. The Johnson-Cook (J-C) Model
The J-C model is employed in many finite element software for delineating the material responses at different deformation condition. That is because it only has five material constant and is easy to calibrate. The J-C model can be expressed as Equation (1):
where σ is equivalent (von Mises) flow stress, ε is the equivalent plastic strain, is the dimensionless plastic strain rate, T* = (T − Tr)/(Tm − Tr) is the homologous temperature, m1, m2, m3, m4 and m5 are the material constant. Those constants can be obtained based on the experimental data, and the results are showed in Table 2. Comparisons between the experimental data and the predictions are illustrated in Figure 3. It can be found that the original J-C model cannot accurately fit the experimental data.
Table 2.
The calculation results of the material constant.
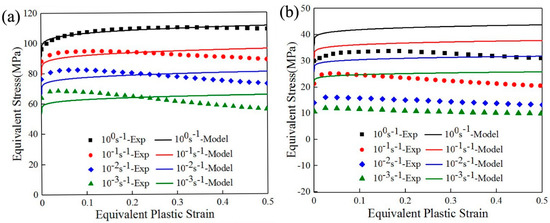
Figure 3.
Comparison between the experimental data and the predictions (a) 573 K; (b) 773 K.
4.2. The Modified Johnson-Cook Model
Obviously, the influence of strain rate and temperature are expressed by individual terms in the original J-C expression. However, many experimental observations showed that some material, especially FCC structured aluminum alloys, manifest thermal dependent strain rate sensitivity [27]. Therefore, the effect of strain rate on the thermo softening must be considered. Meanwhile, the temperature-dependent term 1 − (T − Tr)/(Tm − Tr) in the original model cannot accommodate the case when the current temperature is lower than the reference temperature as then the above term within parenthesis becomes a negative number raised to the power m. Furthermore, aiming to fit the flow curves more accurately, a quadratic polynomial is added in the work hardening term. Thus, a modified J-C model is presented as Equation (2):
where m1, m2, m3, m4 and m5 are the material constants, the dimensions of the new material constants m1, m2, m3 and m4 are MPa, and the material constant m5 is dimensionless; m6 is dimensionless strain rate hardening coefficient; is relative strain rate for ; m7 is dimensionless thermo softening exponent, and it will be represented by a function about the strain rate; Tm, T, Tr is the melting temperature, current temperature and reference temperature respectively. Tm is equal to 885.5 K and 573 K is taken as the reference temperature.
The parameters in the modified J-C model can be obtained systematically according to the measured data during the compression tests as follows:
(1) m1, m2, m3, m4 and m5 can be acquired by polynomial fitting with the experimental conditions of and T = Tr = 573 K. At this condition, Equation (2) reduces to:
substituting equivalent plastic strain and equivalent stress under the deformation conditions, and the values of m1, m2, m3, m4 and m5 can be fitted as 95.63075 MPa, −126.84303 MPa, 27.18656 MPa, 110.7135 MPa and 0.6568, respectively.
(2) When T = Tr = 573 K, Equation (2) can be transformed as follows:
using the three different strain rates (except the reference strain rate) and the corresponding stresses at different strains (0, 0.05, 0.1, 0.15, 0.2, 0.25, 0.3, 0.35, 0.4, 0.45, 0.5) to draw vs. curves, as showing in Figure 4. It is clear that m6 is not a constant and varies with equivalent plastic strains. In other words, m6 can be expressed by a function of the equivalent plastic strain and strain rate.
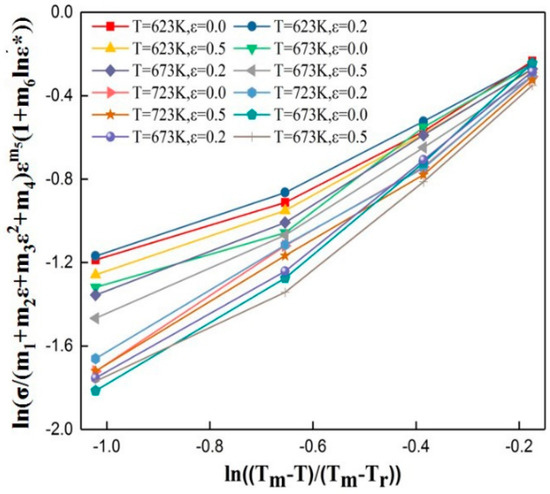
Figure 4.
Relationship between and .
Aim to determine the specific expression of m6, the relationships between m6 and equivalent plastic strain and are curved and illustrated in Figure 5. From Figure 5a we can find that m6 can be fitted very well by a quadratic polynomial of plastic strain. At the same time, from Figure 5b we can find that m6 can also be fitted very well by a quadratic polynomial of. Therefore, considering the interaction between ε and , the m6 can be expressed by a binary quadratic polynomial about ε and as follows:
where F0–F5 are regression coefficients, and are shown in Table 3.
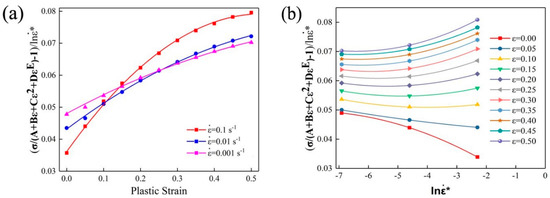
Figure 5.
The relationship between m6 and plastic strain (a) and (b).
Table 3.
The regression coefficients of the fuction .
(3) After that, Equation (2) can be transformed as follows:
Taking the natural logarithm on both side of Equation (6):
Using the different plastic strains (0, 0.2, 0.5) and the flow stresses at four deformation temperatures (623 K, 673 K, 723 K, 773 K), the relationships between and can be obtained, as shown in Figure 6. According to Figure 6, it could be observed that the thermo softening exponent m7 is varied with plastic strain, temperature, as well as strain rate.
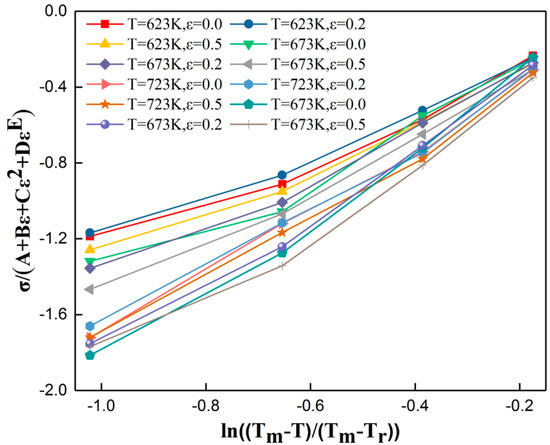
Figure 6.
The relationships between and .
Aiming to determine the specific fuction expression of the thermo softening exponent m7, the relationships between m7 and plastic strain, and are curved and illustrated in Figure 7. From Figure 7a we can conclude that m7 can be fitted very well by a cubic polynomial of variable plastic strain. From Figure 7b,c we can find that m7 can be fitted very well by a quadratic polynomial of variable and , respectively. Therefore, the m7 can be expressed by a ternary polynomial about ε, and as follows:
where M0–M10 are regression coefficients.
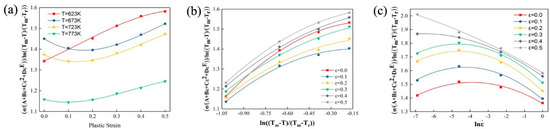
Figure 7.
The relationship between m and plastic strain (a), (b) and (c).
Substituting the values of m7 at the four strain rates four deformation temperatures (623 K, 673 K, 723 K, 773 K) and the corresponding flow stress at different strains (0, 0.05, 0.1, 0.2, 0.3, 0.4, 0.5) into Equation (8), the regression coefficients can be determined by regression method and the results are shown in Table 4.
Table 4.
The regression coefficients of the fuction .
Using the parameters in Table 2 and Table 3, the unique flow curves of Al–Si–Mg alloy at different deformation conditions can be calculated by the modified Johnson-Cook model, and comparisons between the experimental results and calculated data are shown in Figure 8. As illustrated in Figure 8, the calculated data can fit the material responses, such as yield stress, work hardening, flow stress and thermo softening very well.
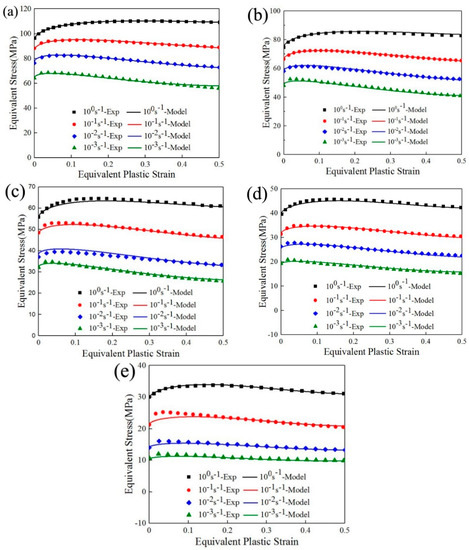
Figure 8.
Comparison between the measured data and calculated data by the modified Johnson-Cook (J-C) model (a) 573 K; (b) 623 K; (c) 673 K; (d) 723 K and (e) 773 K.
Aiming to assess the precision of this modified model, the average error between the calculated true stress σc and experimental obtained true stress σe can be computed as follows:
Extracting the flow stress values of both calculation results and the measured data at four strain rates and five deformation temperatures (573 K, 623 K, 673 K, 723 K, 773 K) with different equivalent plastic strains (0, 0.1, 0.2, 0.3, 0.4, 0.5), the error can be calculated by employing Equation (9). The error of the modified model is 1.65%. Furthermore, the compression tests were conducted at 320 °C with 1 s−1 and at 400 °C with 0.5 s−1. The comparison results between the experimental data and the predictions by the modified model are illustrated in Figure 9. All that indicates that this modified model makes an accurate simulation of the material responses under a quasi-static loading state at a wide range of temperatures, and can be used to make a metal forming process and establish a finite element model.
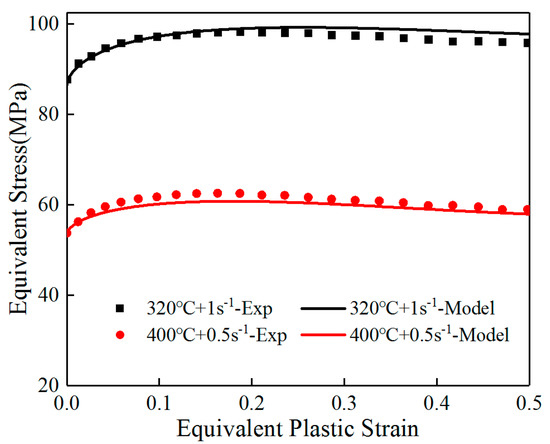
Figure 9.
The comparison results between the experimental data and the predictions.
5. Conclusions
In the present paper, the quasi-static loading responses of Al–Si–Mg alloy are studied by hot compression experiments. It can be observed from the experimental results that the flow stress increases with strain rate and decreases with increasing deformation temperature. According to the experimental data, a modified J-C model taking the strain rate effect on thermo softening into account is proposed. Its calculation results agree well with the measured flow stress. The average error of the modified model is 1.65%.
Author Contributions
Conceptualization, Q.Z.; methodology, Q.Z.; software, Z.L.; validation, Z.L.; formal analysis, Z.L.; investigation, Z.L.; data curation, Z.L.; writing-original draft preparation, Z.L.; writing-review and editing, Q.Z.; funding acquisition, Q.Z.
Funding
This research was funded by the National Natural Science Foundation of China, grant number 51875441.
Conflicts of Interest
The authors declare no conflict of interest. The funders had no role in the design of the study; in the collection, analyses, or interpretation of data; in the writing of the manuscript; or in the decision to publish the results.
References
- Serrenho, A.C.; Norman, J.B.; Allwood, J.M. The impact of reducing car weight on global emissions: The future fleet in Great Britain. Philos. Trans. R. Soc. A 2017, 375, 20160364. [Google Scholar] [CrossRef] [PubMed]
- Wang, Y.F.; Zhao, S.D.; Zhao, X.Z.; Zhao, Y. Microstructural coarsening of 6061 aluminum alloy semi-solid billets prepared via recrystallization and partial melting. J. Mech. Sci. Technol. 2017, 31, 3917–3923. [Google Scholar] [CrossRef]
- Dong, X.X.; Ji, S.X. Si poisoning and promotion on the microstructure and mechanical properties of Al-Si-Mg cast alloys. J. Mater. Sci. 2018, 53, 7778–7792. [Google Scholar] [CrossRef]
- Phalgun, N.; Saumyadeep, J.; Rajiv, S.M.; Glenn, G.; Blair, E.C. Influence of friction stir processing on the room temperature fatigue cracking mechanisms of A356 aluminum alloy. Mater. Sci. Eng. A Struct. 2018, 716, 165–178. [Google Scholar] [CrossRef]
- Mao, F.; Yan, G.Y.; Xuan, Z.J.; Cao, Z.Q.; Wang, T.M. Effect of Eu addition on the microstructures and mechanical properties of A356 aluminum alloys. J. Alloys Compd. 2015, 650, 896–906. [Google Scholar] [CrossRef]
- Marzyeh, M.; Mahmoud, N.A.; Behrang, P.; Bashir, H.; Tadashi, F. EBSD and DTA characterization of A356 alloy deformed by ECAP during reheating and partial re-melting. Metall. Mater. Trans. A 2015, 45, 1540–1551. [Google Scholar] [CrossRef]
- Krishna, N.N.; Ashfaq, M.; Susila, P.; Sivaprasad, K.; Venkateswarlu, K. Mechanical anisotropy and microstructural changes during cryorolling of Al-Mg-Si alloy. Mater. Charact. 2015, 107, 302–308. [Google Scholar] [CrossRef]
- Immanuel, R.J.; Panigrahi, S.K. Deformation behavior of ultrafine grained A356 material processed by cryorolling and development of Johnson-Cook model. Mater. Sci. Eng. A Struct. 2018, 712, 747–756. [Google Scholar] [CrossRef]
- Johnson, G.R.; Cook, W.H. A constitutive model and data for metals subjected to large strain, high strain rates and high temperatures. In Proceedings of the Seventh International Symposium on Ballistic, The Hague, The Netherlands, 19–21 April 1983. [Google Scholar]
- Zerilli, G.J.; Armstrong, R.W. Dislocation-mechanics-based constitutive relations for material dynamics calculations. J. Appl. Phys. 1987, 61, 1816–1825. [Google Scholar] [CrossRef]
- Nemat-Nasser, S.; Li, Y. Flow stress of F.C.C. polycrystals with application to OFHC Cu. Acta Mater. 1998, 46, 565–577. [Google Scholar] [CrossRef]
- Khan, A.S.; Liang, R. Behavior of three B.C.C. metal over a wide range of strain rates and temperatures: Experiments and modeling. Int. J. Plast. 1999, 15, 1089–1109. [Google Scholar] [CrossRef]
- Yang, X.W.; Li, W.Y.; Ma, J.; Hu, S.T.; He, Y.; Li, H.; Xiao, B. Thermo-physical simulation of the compression testing for constitutive modeling of GH4169 superalloy during linear friction welding. J. Alloys Compd. 2016, 656, 395–407. [Google Scholar] [CrossRef]
- Dong, Y.Y.; Zhang, C.S.; Zhao, G.Q.; Guan, Y.J.; Gao, A.J.; Sun, W.C. Constitutive equation and processing maps of an Al-Mg-Si aluminum alloy: Determination and application in simulation extrusion process of complex profiles. Mater. Des. 2016, 92, 983–997. [Google Scholar] [CrossRef]
- Lin, Y.C.; Zhang, J.; Zhong, J. Application of neural networks to predict the elevated temperature flow behavior of a low alloy steel. Comput. Mater. Sci. 2008, 43, 752–758. [Google Scholar] [CrossRef]
- Filippis, L.A.C.E.; Serio, L.M.; Facchini, F.; Mummolo, G.; Ludovico, A.D. Prediction of the Vickers Microhardness and Ultimate Tensile Strength of AA5754 H111 Friction Stir Welding Butt Joints Using Artificial Neural Network. Materials 2016, 9, 915. [Google Scholar] [CrossRef] [PubMed]
- Casalino, G.; Facchini, F.; Mortello, M.; Mummolo, G. ANN modeling to optimize manufacturing processes: The case of laser welding. In Proceedings of the 8th IFAC Conference on Manufacturing Modelling, Management and Control (MIM), Troyes, France, 28–30 June 2016. [Google Scholar]
- Casalina, G.; Losacco, A.M.; Arnesano, A.; Facchini, F.; Pierangeli, M.; Bonserio, C. Statistical analysis and modelling of an Yb: KGW femtosecond laser micro-drilling process. In Proceedings of the 10th CIRP Conference on Intelligent Computation in Manufacturing Engineering, Ischia, Italy, 20–22 July 2016. [Google Scholar] [CrossRef]
- Lin, Y.C.; Chen, X.M. A critical review of experimental results and constitutive descriptions for metals and alloys in hot working. Mater. Des. 2011, 32, 1733–1759. [Google Scholar] [CrossRef]
- Lin, Y.C.; Chen, M.S.; Zhong, J. Prediction of 42CrMo steel flow stress at high temperature and strain rate. Mech. Res. Commun. 2008, 35, 142–150. [Google Scholar] [CrossRef]
- Maheshvari, A.K.; Pathak, K.K.; Ramakrishnan, N.; Narayan, S.P. Modified Johnson-Cook material flow model for hot deformation processing. J. Mater. Sci. 2010, 45, 859–864. [Google Scholar] [CrossRef]
- Sung, J.H.; Kim, J.H.; Wagoner, R.H. A plastic constitutive equation incorporating strain, strain-rate, and temperature. Int. J. Plast. 2010, 26, 1746–1771. [Google Scholar] [CrossRef]
- Bobbili, R.; Madhu, V.A. Modified Johnson-Cook model for FeCoNiCr high entropy alloy over a wide range of strain rates. Mater. Lett. 2018, 218, 103–105. [Google Scholar] [CrossRef]
- Wang, Y.P.; Han, C.J.; Wang, C.; Li, S.K. A modified Johnson-Cook model for 30Cr2Ni4MoV rotor steel over a wide range of temperature and strain. J. Mater. Sci. 2011, 46, 2922–2927. [Google Scholar] [CrossRef]
- Tao, Z.J.; Fan, X.G.; Yang, H.; Ma, J.; Li, H. A modified Johnson-Cook model for NC warm bending of large diameter thin-walled Ti-6Al-4V tube in wide ranges of strain rates and temperatures. Trans. Nonferrous Met. Soc. 2018, 28, 298–308. [Google Scholar] [CrossRef]
- Wang, S.X.; Huang, Y.C.; Xiao, Z.B.; Liu, H. A modified Johnson-Cook model for hot deformation behavior of 35CrMo steel. Metals 2017, 7, 337. [Google Scholar] [CrossRef]
- Khan, A.S.; Meredith, C.S. Thermo-mechanical response of Al6061 with and without equal channel angular pressing (ECAP). Int. J. Plast. 2010, 26, 189–203. [Google Scholar] [CrossRef]
- Vignjevic, R.; Djordjevic, N.; Vuyst, T.D.; Gemkow, S. Modelling of strain softening materials based on equivalent damage force. Comput. Method Appl. Mech. 2018, 335, 52–68. [Google Scholar] [CrossRef]
- De Borst, R.; Pamin, J. Some novel developments in finite element procedures for gradient-dependent plasticity. Int. J. Numer. Methods Eng. 1996, 39, 2477–2505. [Google Scholar] [CrossRef]
- Fu, L.; Du, X.W. Mesh-dependence of material with softening behavior. Chin. J. Aeronaut. 2010, 23, 46–53. [Google Scholar] [CrossRef]
- Jirásek, M.; Marfia, S. Non-local damage model based on displacement averaging. Int. J. Numer. Methods Eng. 2005, 63, 77–102. [Google Scholar] [CrossRef]
- Korsunsky, A.M.; Nguyen, G.D.; Houlsby, G.T. Analysis of essential work of rupture using non-local damage-plasticity modelling. Int. J. Fract. 2005, 135, L19–L26. [Google Scholar] [CrossRef]
- Li, B.; Pan, Q.L.; Yin, Z.M. Characterization of hot deformation behavior of as-homogenized Al-Cu-Li-Sc-Zr alloy using processing map. Mater. Sci. Eng. A Struct. 2014, 614, 199–206. [Google Scholar] [CrossRef]
- Kassner, M.E.; Campbell, C.S.; Ermagan, R. Large-Strain Softening of Aluminum in Shear at Elevated Temperature: Influence of Dislocation Climb. Metall. Mater. Trans. A 2017, 48, 3971–3974. [Google Scholar] [CrossRef]
- Wu, H.; Wen, S.P.; Huang, H.; Gao, K.Y.; Wu, X.L.; Wang, W.; Nie, Z.R. Hot deformation behavior and processing map of a new type Al-Zn-Mg-Er-Zr alloy. J. Alloys Compd. 2016, 685, 869–880. [Google Scholar] [CrossRef]
© 2018 by the authors. Licensee MDPI, Basel, Switzerland. This article is an open access article distributed under the terms and conditions of the Creative Commons Attribution (CC BY) license (http://creativecommons.org/licenses/by/4.0/).