Article

Numerical Modeling of the Effect of Randomly Distributed Inclusions on Fretting Fatigue-Induced Stress in Metals

1
Department of Mechanics and Engineering Science, Nanjing University of Science and Technology, Nanjing 210094, China
2
Department of Electrical energy, Metals, Mechanical Constructions, and Systems, Faculty of Engineering and Architecture, Ghent University, 9052 Zwijnaarde, Belgium
3
Institute of Research and Development, Duy Tan University, 03 Quang Trung, Da Nang, Vietnam
4
Soete Laboratory, Faculty of Engineering and Architecture, Ghent University, Technologiepark Zwijnaarde 903, B-9052 Zwijnaarde, Belgium
*
Author to whom correspondence should be addressed.
Metals 2018, 8(10), 836; https://doi.org/10.3390/met8100836
Submission received: 10 September 2018 / Revised: 12 October 2018 / Accepted: 15 October 2018 / Published: 17 October 2018
(This article belongs to the Special Issue Recent Advances on Fretting Fatigue)

Abstract

:
The analysis of fretting fatigue plays an important role in many engineering fields. The presence of heterogeneity may affect the performance of a machine or a structure, including its lifetime and stability. In this paper, the effect of randomly distributed micro inclusions on the fretting fatigue behaviour of heterogeneous materials is analysed using the finite element method (FEM) for different sizes, shape and properties of inclusions. The effect of micro inclusions on macroscopic material properties is also considered by representative volume element (RVE). It is shown that the influence of micro inclusions on macroscopic material properties cannot be ignored, and the shape and size of the inclusions have less effect on the macroscopic material properties as compared to the material properties of inclusion and volume ratio. In addition, various parameters of inclusions have little effect on the peak tensile stress, which remains almost the same as homogeneous material. Peak shear stress occurs at many places inside the specimen, which can result in multiple cracking points inside the specimen, as well as at the contact surface. Moreover, the stress band formed by the stress coupling between adjacent inclusions may have an important influence on the direction of crack growth.

1. Introduction

Fretting fatigue can significantly affect structural performance in many engineering applications [1]. The fatigue life of the structure may be reduced by the fretting phenomenon, which occurs due to small oscillatory motion between two contact surfaces [2]. The reduction in fatigue life can reach up to 50% [3]. The failure process is generally characterized by two phases, crack nucleation [4,5] and crack propagation [6,7]. Researchers are concerned with contact stresses because it directly affects the initiation of cracks [8]. The contact stresses are affected by various factors, such as loading magnitude, contact geometry, surface imperfections and slip amplitude, which consequently affect the failure process. On the other hand, material properties also have significant influence on contact stresses. By common consensus, heterogeneity of material has a great influence on the life and stability of the structure [9]. For many engineering components, the required design lifetime can be affected significantly by heterogeneity. Therefore, material heterogeneity has been widely studied in recent years [10,11,12,13,14]. Generally, materials contain fibers [15,16,17,18,19], particles [20,21], precipitates, porosities, or voids/cracks [14,22] at the micro level, which are common causes of the heterogeneity. Generally, scanning electron microscopy (SEM) is used to observe the microstructure of material [23]. There are several kinds of typical inclusions in alloys; Al2O3, MgO, Al2MgO4, CaSO4, TiB2, Al3Ti and refractory brick (Al, Si, O). Typical geometric form of inclusions are particles, films or group of films and rods [24]. As a result, stress concentration will appear at the interface between different materials or voids, which may give rise to shorter fatigue life. Thus, in addition to contact area, the subsurface area can also be affected by the heterogeneity, and in some cases it is strongly affected [25]. There are many ways to analyze the behavior of heterogeneous materials. Previous researchers have proposed several models to predict the effect of inclusions and defects on metal fatigue strength. Murakami and Endo [25] proposed an engineering guide to predict the fatigue strength of components with heterogeneity. Some experimental results about high-strength steels showed that fatigue failures were mostly caused by the inclusions inside the matrix [26,27,28,29,30,31].
In short, both fretting fatigue and heterogeneity may significantly influence the lifetime and stability of mechanical components. Numerous factors can affect micro stress field, thus affecting the fretting fatigue behavior [8]. The macroscopic fatigue failure occurs due to the distribution of micro-stress. In the literature, homogeneous materials are widely assumed to study fretting fatigue problems [14]. Generally, the micro cracks are observed inside the slip zone and at the contact edge. For experimental methods, it is difficult to get the details of stress field and initiation of crack. Therefore, numerical modeling is an efficient way to solve the problem of fretting fatigue [8,32,33,34,35,36,37,38] and fracture [39,40,41,42,43]. However, only few studies have taken into account the heterogeneity of material under fretting fatigue conditions [14,44,45]. Kumar et al. used numerical analysis to study the influence of heterogeneity on stress distribution in fretting fatigue problems [14]. They studied heterogeneity by considering micro-voids in the material, which is found in metal alloys [46]. They found that the effect of heterogeneity on shear stress was greater than on normal stress. Normally, for homogeneous material, the peak shear stress appears at the contact interface. However, in the case of heterogeneous materials, the peak may shift to the micro-voids. In the practical situation, the materials always have some heterogeneity due to heat treatment process. The inclusions can be regarded as foreign particles, which exist in metals [47]. According to the relative position of the inclusions and the material surface, there can be surface inclusions and internal inclusions [48].
In this study, we focus on two kinds of common inclusions in aluminum alloy 2024-T3. Considering the effect of micro inclusions on macroscopic material properties by means of representative volume element (RVE), a numerical analysis is presented to study the influence of local randomly distributed inclusions on the stress distribution of fretting fatigue specimens. The influence of different variables, namely material properties, volume ratio and shape of the inclusions is investigated. This study presents the variation of different stresses at the contact interface, as well as under the surface, and thus allows predicting probable crack initiation sites. From the result of stress analysis, conclusions are drawn.

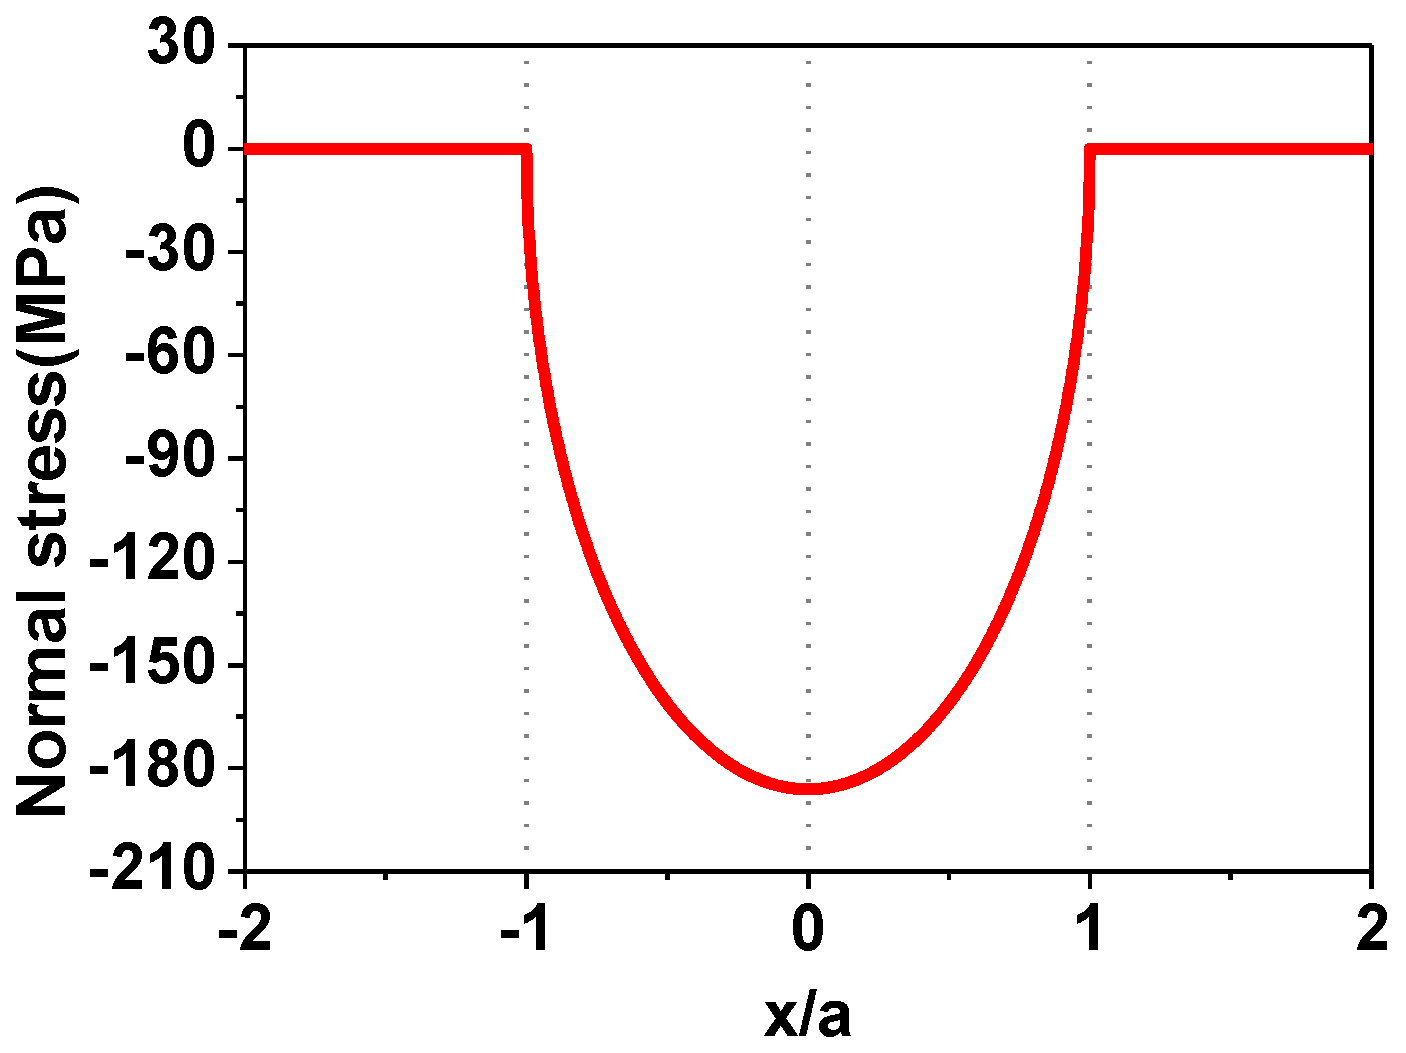
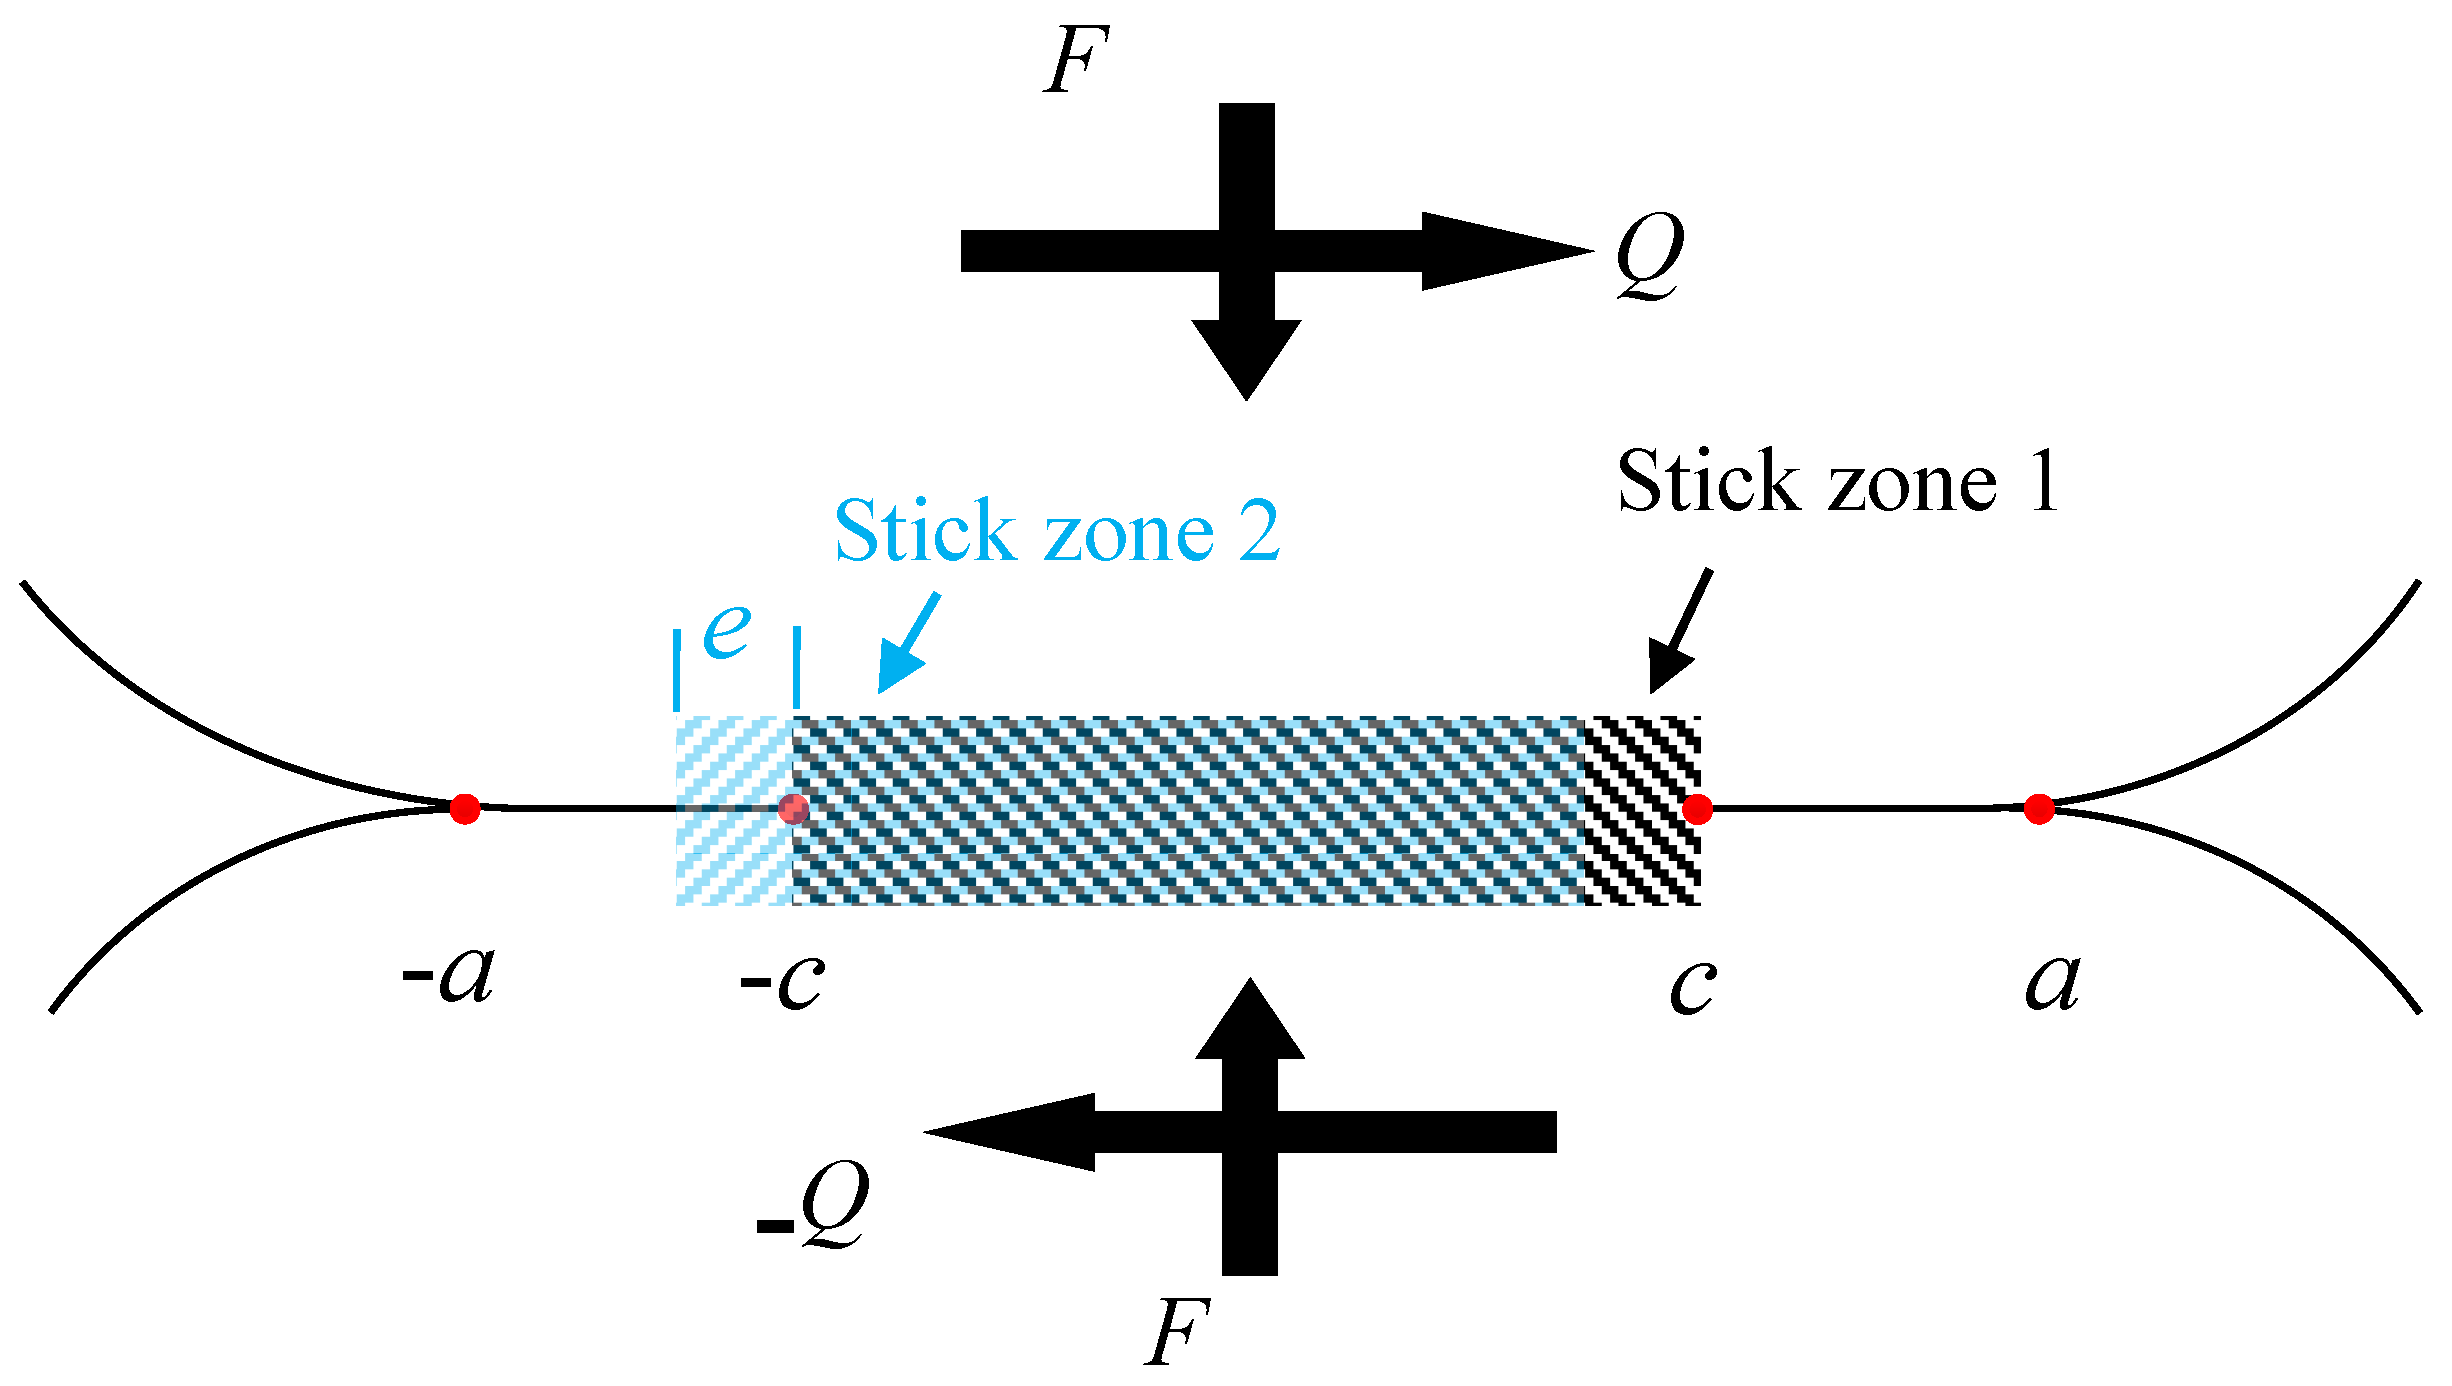
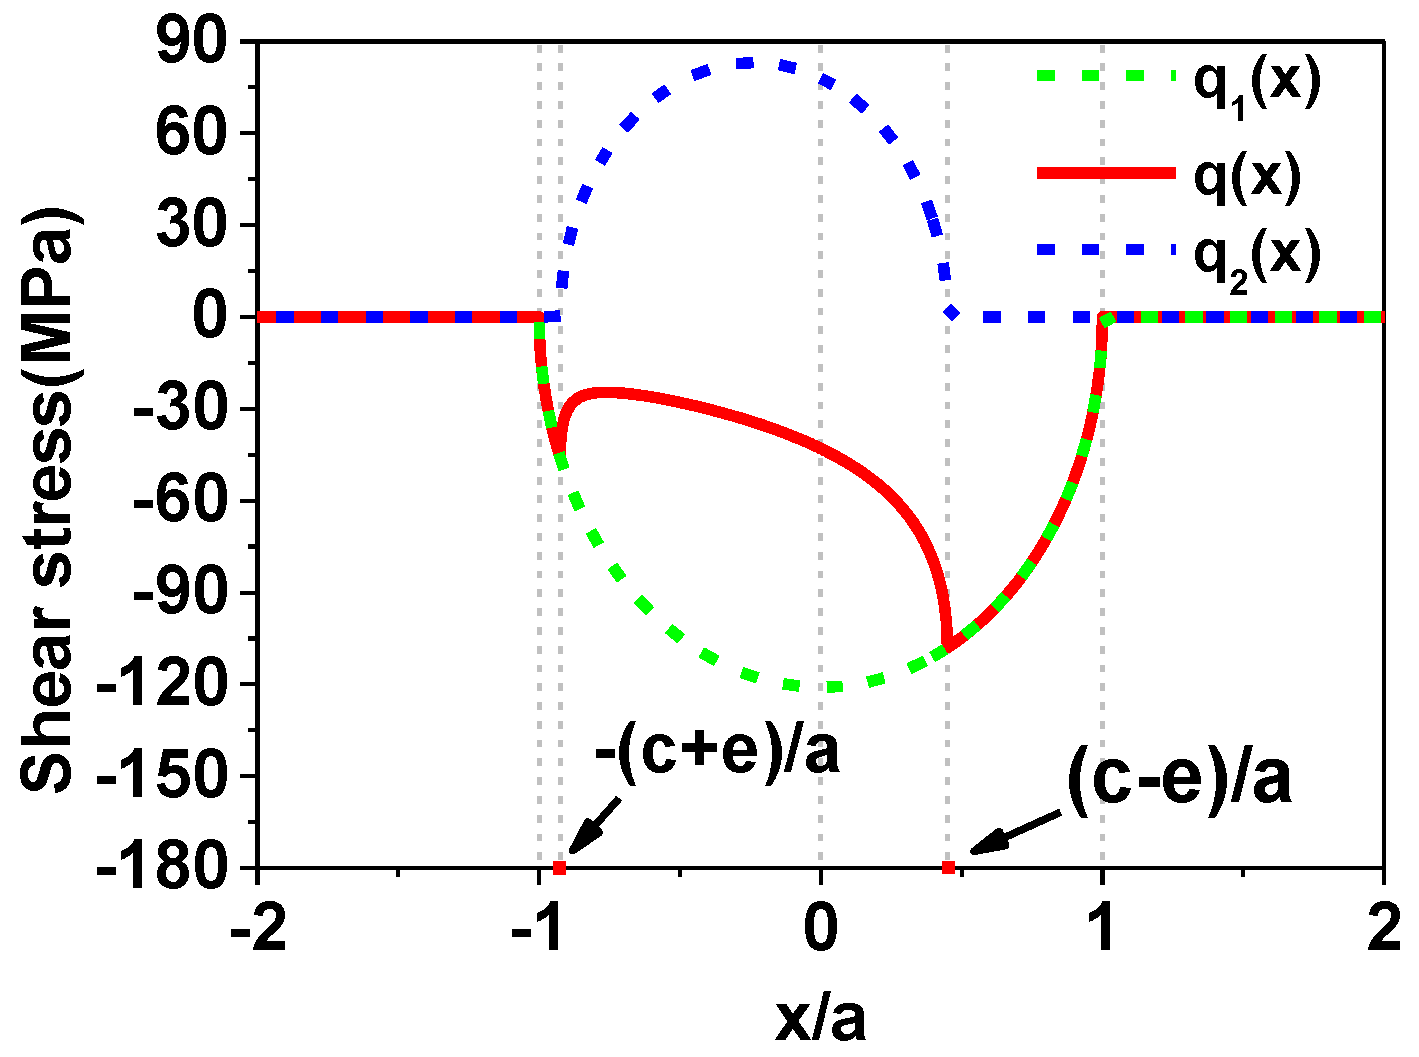
2. Line Contact under Partial Slip

Before we study the influence of inclusions on fretting fatigue behavior in heterogeneous material, a brief review of Hertzian contact is presented here, which also can be used to verify the finite element (FE) model for homogenous material. The contact is said to be line contact if it is between a cylinder and a flat body (or two parallel cylinders). We have an analytical solution [49] to get the normal stress of the contact surface, if there is only a normal force F to compress the two bodies:
p ( x ) = p max 1 ( x a ) 2
where p ( x ) represents the normal stress distribution, a is the semi contact width and p m a x the peak value of normal contact stress at the centre of the contact zone, and is given by [49]:
p max = F E t π R
where t is the thickness of both cylinder and the flat specimen and R is the equivalent radius and E is the equivalent modulus of elasticity, i.e.,:
1 R = 1 R 1 + 1 R 2
1 E = 1 v 1 2 E 1 + 1 v 2 2 E 2
R 1 is the radius of the pad and R 2 is the radius of the specimen, which is flat for our configuration. E 1 and E 2 are Young’s moduli, and v 1 and v 2 are Poisson’s ratios for the two bodies, respectively. The parameter a is given by:
a = 2 F R t π E
Figure 1 shows the normal stress distribution of the contact interface of the specimen. On the whole contact surface (between ‒1 ≤ x/a ≤ 1), it is a parabolic distribution.
To illustrate the effects of tangential loading Q a modified formulation is required [50,51]. Near the contact edge, c | x | < a , this is the slip zone and there will be relative sliding between the contact interfaces. Therefore, we can express the shear traction as μ p ( x ) . Whereas, near the contact centre, | x | < c , there is a centrally symmetrical stick zone (indicated as stick zone 1 in Figure 2), which means that the contact surfaces will move together. So that in this zone the shear traction q ( x ) does not reach the critical value μ p ( x ) .
The contact shear traction can be modeled by the Coulomb friction law, which is given by:
q ( x ) = q 1 ( x ) + q 2 ( x )
where q 1 ( x ) = μ p ( x ) . q 1 represents shear traction due to slip. q 2 is added as a perturbation in the solution of slip condition, to represent shear traction in the stick zone.
q 1 ( x ) = μ p max 1 ( x a ) 2
Moreover, in the slip zones, the perturbation q 2 ( x ) is zero.
q 2 ( x ) = 0 , c | x | a
However, for the stick zones, it is given by:
q 2 ( x ) = μ p max c a 1 ( x c ) 2 , | x | c
where:
c a = 1 Q μ F
Finally, when there are normal loads F and tangential loads Q simultaneously, the shear stress distribution on the contact surface is expressed as:
q ( x ) = { μ p max 1 ( x a ) 2 , c < | x | < a μ p max [ 1 ( x a ) 2 c a 1 ( x c ) 2 ] , | x | c
Furthermore, there also may be bulk stresses σ a x i a l acting on the body, thus the perturbation shear traction q 2 ( x ) is given by [52]:
q 2 ( x ) = μ p max c a 1 ( x + e c ) 2 , | x + e | c
In the above formula, there is an eccentric displacement e = a σ a x i a l 4 μ p max in the stick zones (the stick zone changes into stick zone 2) as shown in Figure 2. For the slip zone, the shear traction still follows the Coulomb friction model q ( x ) = μ p ( x ) . Therefore, the shear stress is given by:
q ( x ) = { μ p max 1 ( x a ) 2 , a x < c e & c e < x a μ p max [ 1 ( x a ) 2 c a 1 ( x + e c ) 2 ] , | x + e | c
An example of the above analytical solutions is shown in Figure 3.

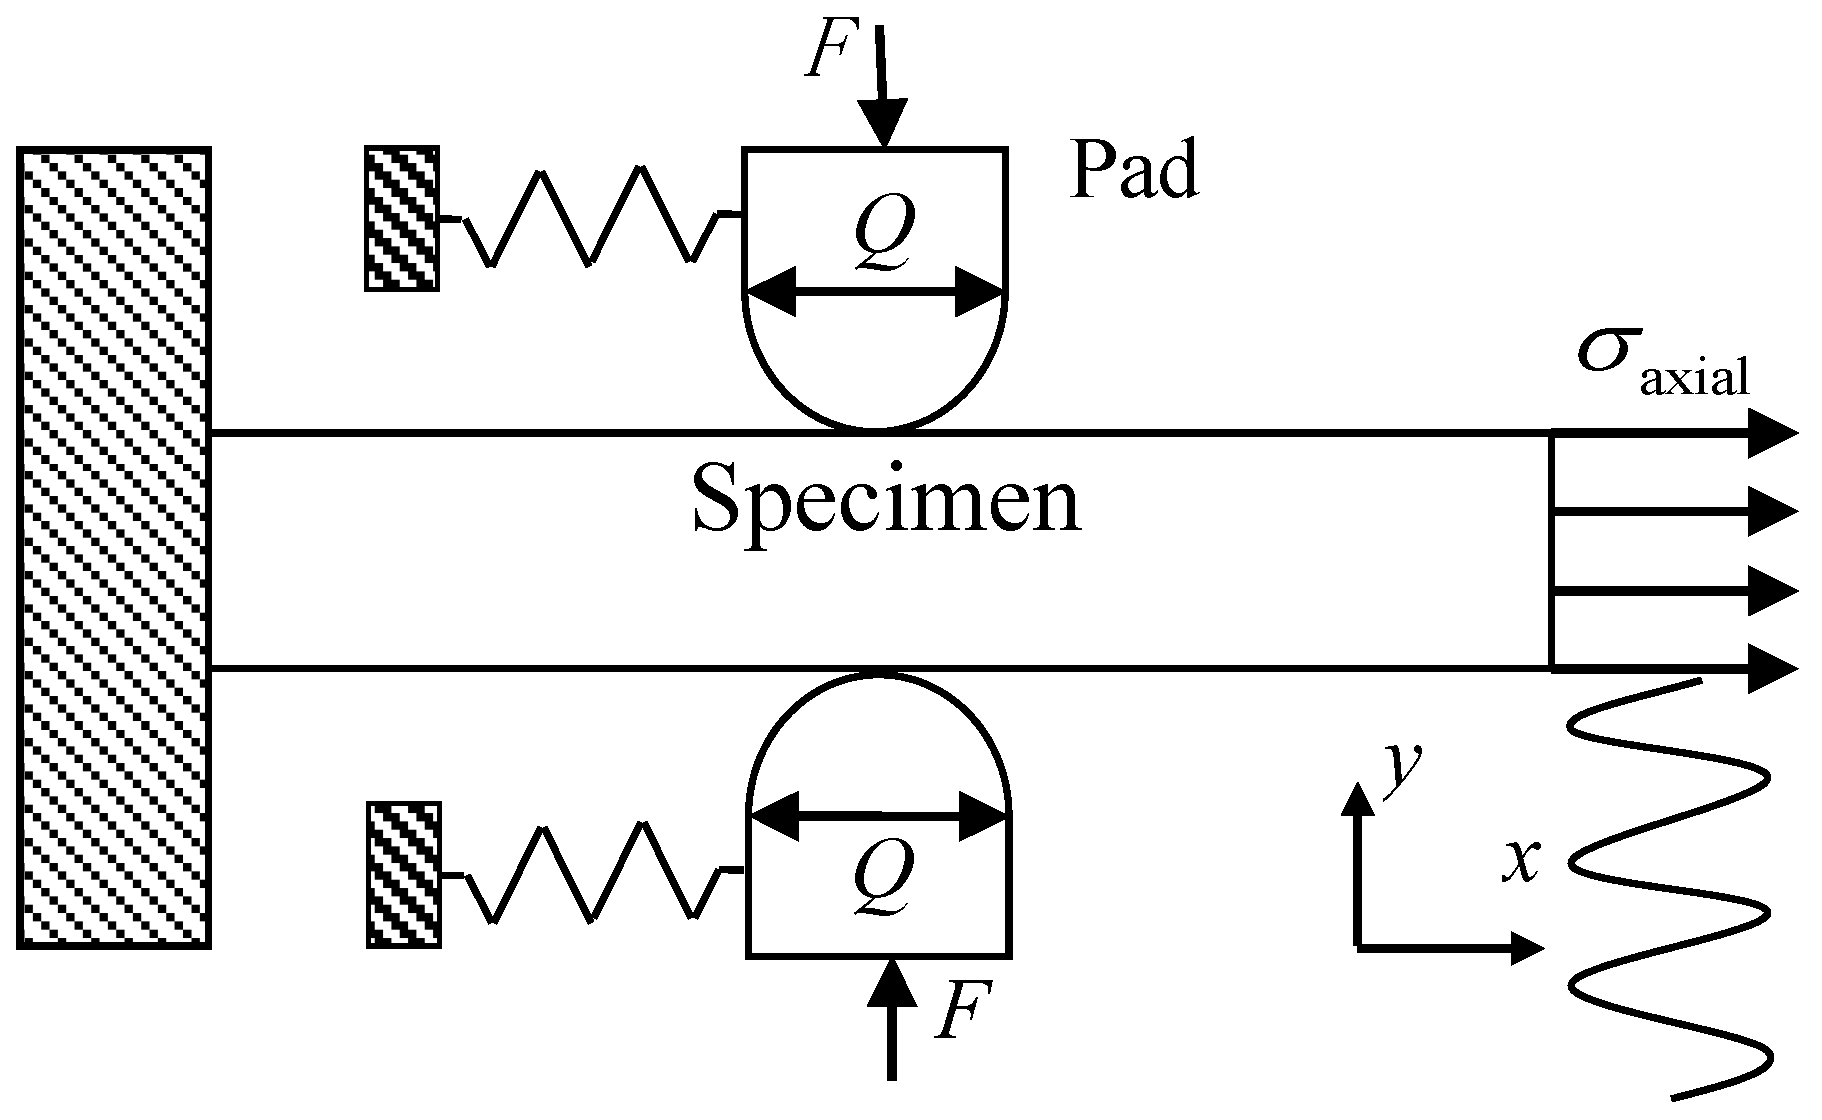
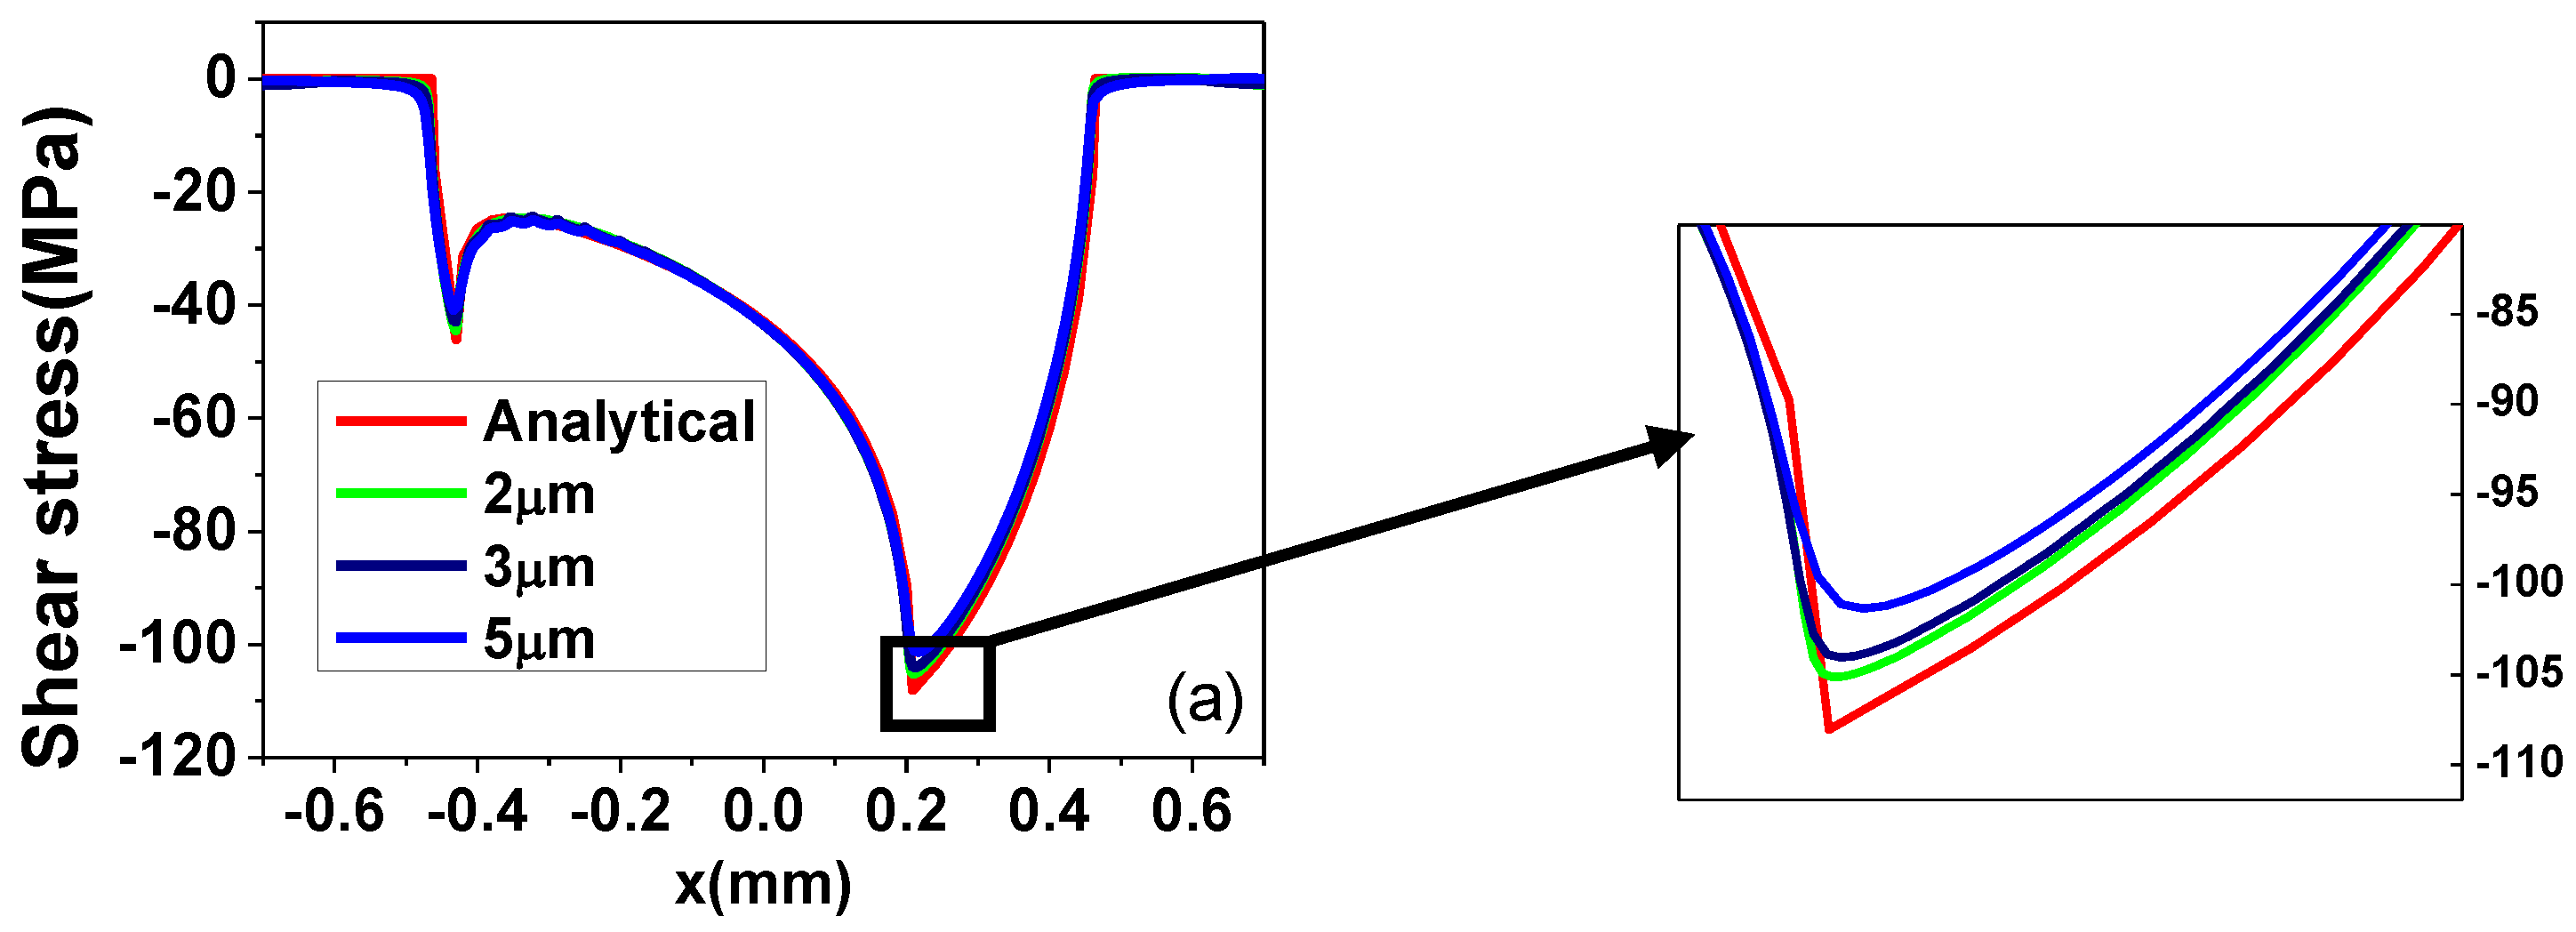
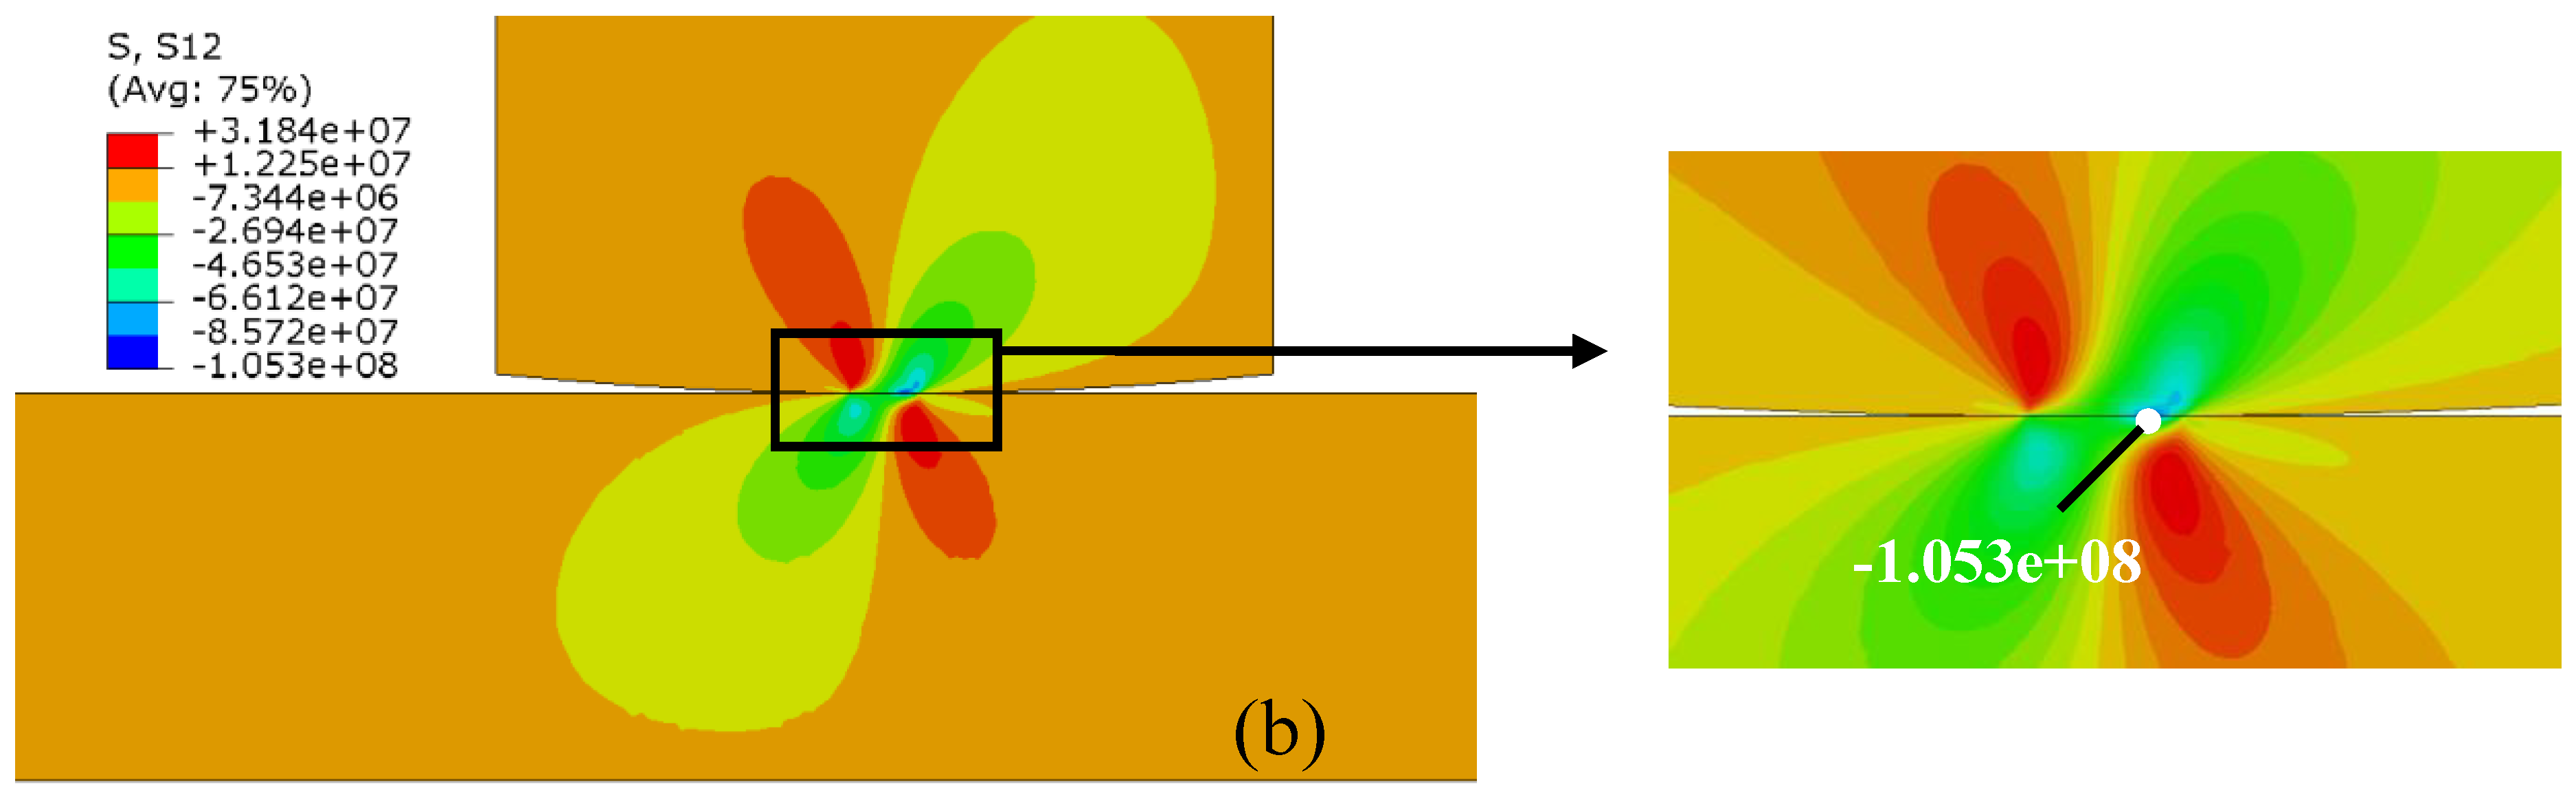
3. Finite Element Model and Validation

From Figure 4, we can see the experimental setup by a schematic view [53] for contact of two cylindrical pads and a flat specimen. Under the action of normal load F, the two fretting pads maintain the contact. In addition, the coefficient of friction between the contact surfaces is 0.65 [53]. The cyclic axial load σ axial is acting on the right side of the specimen. Two springs are attached to the fretting pad, which will generate the tangential load Q, under the combined effect of these loads, so that fretting fatigue will occur around the contact area.
As geometries and loads are symmetric, a simplified model of the structure can be constructed, which is one pad and half of the specimen. In the same way as previous research [8,14,35,38], we can model the load and boundary conditions as shown in Figure 5.
The radius of the pad and width of the specimen are taken from [53]. As shown in Figure 5, the length of the specimen is 40 mm and the width is equal to 5 mm. In addition, the thickness of two bodies and the radius of the cylindrical pad are 4 mm and 50 mm, respectively. At the top surface of the cylindrical pad, a normal load F is applied. The pad is restrained from both sides in the x-direction. On the right hand-side and left hand-side of the specimen, an axial stress σ a x i a l and a reaction stress σ r e a c t i o n are applied, respectively. The value of σ r e a c t i o n is given by [54]:
σ r e a c t i o n = σ a x i a l - Q A s
where Q is the tangential force between the contact surfaces. In addition, the cross sectional area of the specimen is expressed as A s . The bottom side of the specimen is fixed in the y-direction. In order to verify our FE model and study the effect of inclusions on fretting fatigue, the experimental data used in this paper is taken from the work of Talemi and Wahab [53]. In this study, both in validation models and in parametric studies, the FF2 [53] load case has been used, with F = 543N, σ a x i a l = 115 MPa and Q max = 186.25 N.
Both pad and specimen are made of aluminum alloy 2024-T3, which are widely used in the aviation field. Here, we choose two kinds of inclusions Al2CuMg and Al2O3 that are very commonly embedded in aluminum alloy 2024-T3 [55]. Their SEM observations showed that inclusions in material are highly discrete and randomly distributed. So we model the heterogeneity of materials by representative volume element method using DIGIMAT-FE which is a tool that considers the effects of microstructure on macroscopic material properties as shown in Figure 6. It should be noted that this study does not consider the heterogeneity of cylindrical pad material.
In this way, we can get the macro material properties (equivalent elastic modulus E and equivalent Poisson’s ratio µ ) that consider the effect of microscopic inclusions [56,57,58,59]. Here, we just consider the elastic material response, because for all specimens with inclusions, von-Mises stress is always below the yield limit under such loading conditions. This is common in fretting fatigue problems. According to the previous literature, the original material properties of aluminum alloy 2024-T3 [53], Al2CuMg [60] and Al2O3 [61] in this paper are given in Table 1. This article assumes that the cylindrical pad is a homogeneous aluminum alloy 2024-T3.
According to the SEM study by Merati [55], here 2%, 4%, and 6% volume ratio υ between inclusions and matrix material was chosen. From the experimental observation by Hashimoto et al. [62] and other FEM research about the inclusion [62,63], we consider the inclusions as idealized spherical and ellipsoid with 23 μm to 65 μm diameter, perfectly bonded with matrix material. Due to the randomness and uniformity of the inclusions’ distribution, the RVE is constructed as a cube, which is subjected to periodic boundary conditions. In order to study the effect of inclusion, various sizes and distribution are considered. As an example, an RVE with spherical Al2O3 inclusions, 65 μm diameter, and 6% volume ratio has been studied first.
This case has the strongest inclusions, and the convergence of RVE size is studied for it. Four different kinds and sizes of RVEs and corresponding mesh models are shown in Figure 7. For the convergence study nine different sizes have been calculated and the corresponding macro material properties are shown in Figure 8. When the RVE size reaches 325 μm, the macro elastic modulus remains around 78.84 GPa, Poisson’s ratio will be around 0.32 and the relative difference from adjacent results is less than 1%. Therefore, the converged RVE size of this case is 325 μm and it can be applied to all other cases. In order to be safe, each case has been calculated three times, and then the average of the results is taken. In this way, we can get the macroscopic material properties of a specific heterogeneous aluminum alloy.
The fretting fatigue FE model of heterogeneous material can be built in two ways: (a) use the equivalent homogenized material in the whole specimen, or (b) model a small area near the contact region using the heterogeneous material with inclusions and use equivalent homogenized material in the rest of the specimen. Since inclusion will cause stress concentration [25,30,48,55], and fretting fatigue has maximum stress near the contact area [8], the second way is chosen in order to study the effect of inclusion on the stress distribution near the contact area. The partition diagram of the specimen is shown in Figure 9.
After that, a parametric 2D finite element model is created in ABAQUS [64] using Python script. A higher-order element always causes an instability in the stress value on the contact surfaces [65]. Therefore, we chose the CPE4R element (plane strain element, 2D, four nodes) instead of eight-node elements to mesh both parts. As shown in Figure 3, the stress distribution in the contact region is very complicated and stress amplitude is large. In particular, near the border between slip and stick zone, it changes very rapidly. In order to get precisely the stress distribution and contact stresses, the model is refined near the region of contact and inclusions. The boundary and loading conditions are as described at the beginning of this section. The contact behavior is described by the master-slave algorithm. A Lagrange multiplier is used to establish the contact between the pad and the specimen. The other contact methods can also be applied as shown by other researchers [66]. The slave surface is defined on the top surface of the specimen and the master surface is defined on the bottom surface of the pad. For homogeneous material, the stress distribution at the contact interface can be obtained analytically, if the assumptions of the Hertz solution are met. The most important two assumptions are: (a) pure elasticity and (b) the size of the contact area is small enough relative to both contact bodies. The first assumption is met as only linear elasticity is considered in this study. The second one is also called the half-space assumption [52]. The contact width for all load cases in the experiment [53] is 0.47 mm, which is less than one tenth of the height (5 mm) of the sample. A comparison between the analytical solution of Equation (13) and simulation results with different mesh sizes, for the case of homogeneous material, is shown in Figure 10a. Element sizes of 5 μm, 3 μm and 2 μm around the contact zone have been chosen for the convergence study. The mesh refinement showed convergence towards the peak analytical solution for the shear traction. Finally, according to the results, a 2 µm × 2 µm element size is used around the contact zone, which is smaller than in most of the previous numerical studies [8,32,33,34,35,36,37,38]. The simulation results and the theoretical results may not be exactly the same, due to numerical errors and geometric constraints [67]. However, the difference between simulation and theoretical solution is less than 2% (green line and red line in the Figure 10a), which can be considered as good enough to validate our FE contact model.
For comparative analysis, all the cases involved in this study are given in Table 2. The aspect ratio describes the evolution of inclusion from sphere to ellipsoid. The size refers to the diameter of the ball or the length of the long axis of the ellipsoid. In case 7 and case 8, we consider the ellipsoid inclusions and in order to control them, they have the same cross-sectional area as the spherical inclusion with a diameter of 44 µm and the long axis length of the ellipsoid converted to 53.889 µm and 62.225 µm, respectively.
From the results of case 3 and case 5 to 9, it can be seen that the macroscopic material properties have little to do with the size and shape of inclusions. However, by comparing case 1 with case 3, it is shown that the material properties of inclusions have a significant impact on macro elastic modulus. Similarly, by comparing case 3, 4 and 5, it is shown that the volume fraction ratio of inclusion also obviously affects the macroscopic material properties. The macroscopic Poisson’s ratio has hardly changed for the different cases.
As the contact width for all load cases in the experiment [53] is 0.47 mm. A 2 mm × 2 mm rectangle is chosen in Area 1 in Figure 9. The numerical study in this paper is divided into two parts. The first part is the simulation of the nine inclusion-structures in Table 2, which have completely randomly distributed inclusions. For the second part, since the inclusion locations of each case are randomly generated, each case cannot have the same inclusion order. This makes it impossible to use the control variable method to explore the effect of the shape, size and position of the inclusions on the contact stress distribution. Therefore, we artificially placed four inclusions below the sample contact area to compare the effects of different inclusions on the surface stress distribution. These inclusions vary in size, shape, and material corresponding to different cases. Figure 11 shows a completed finite element model, corresponding to case 3 in Table 2.

4. Numerical Results and Discussion

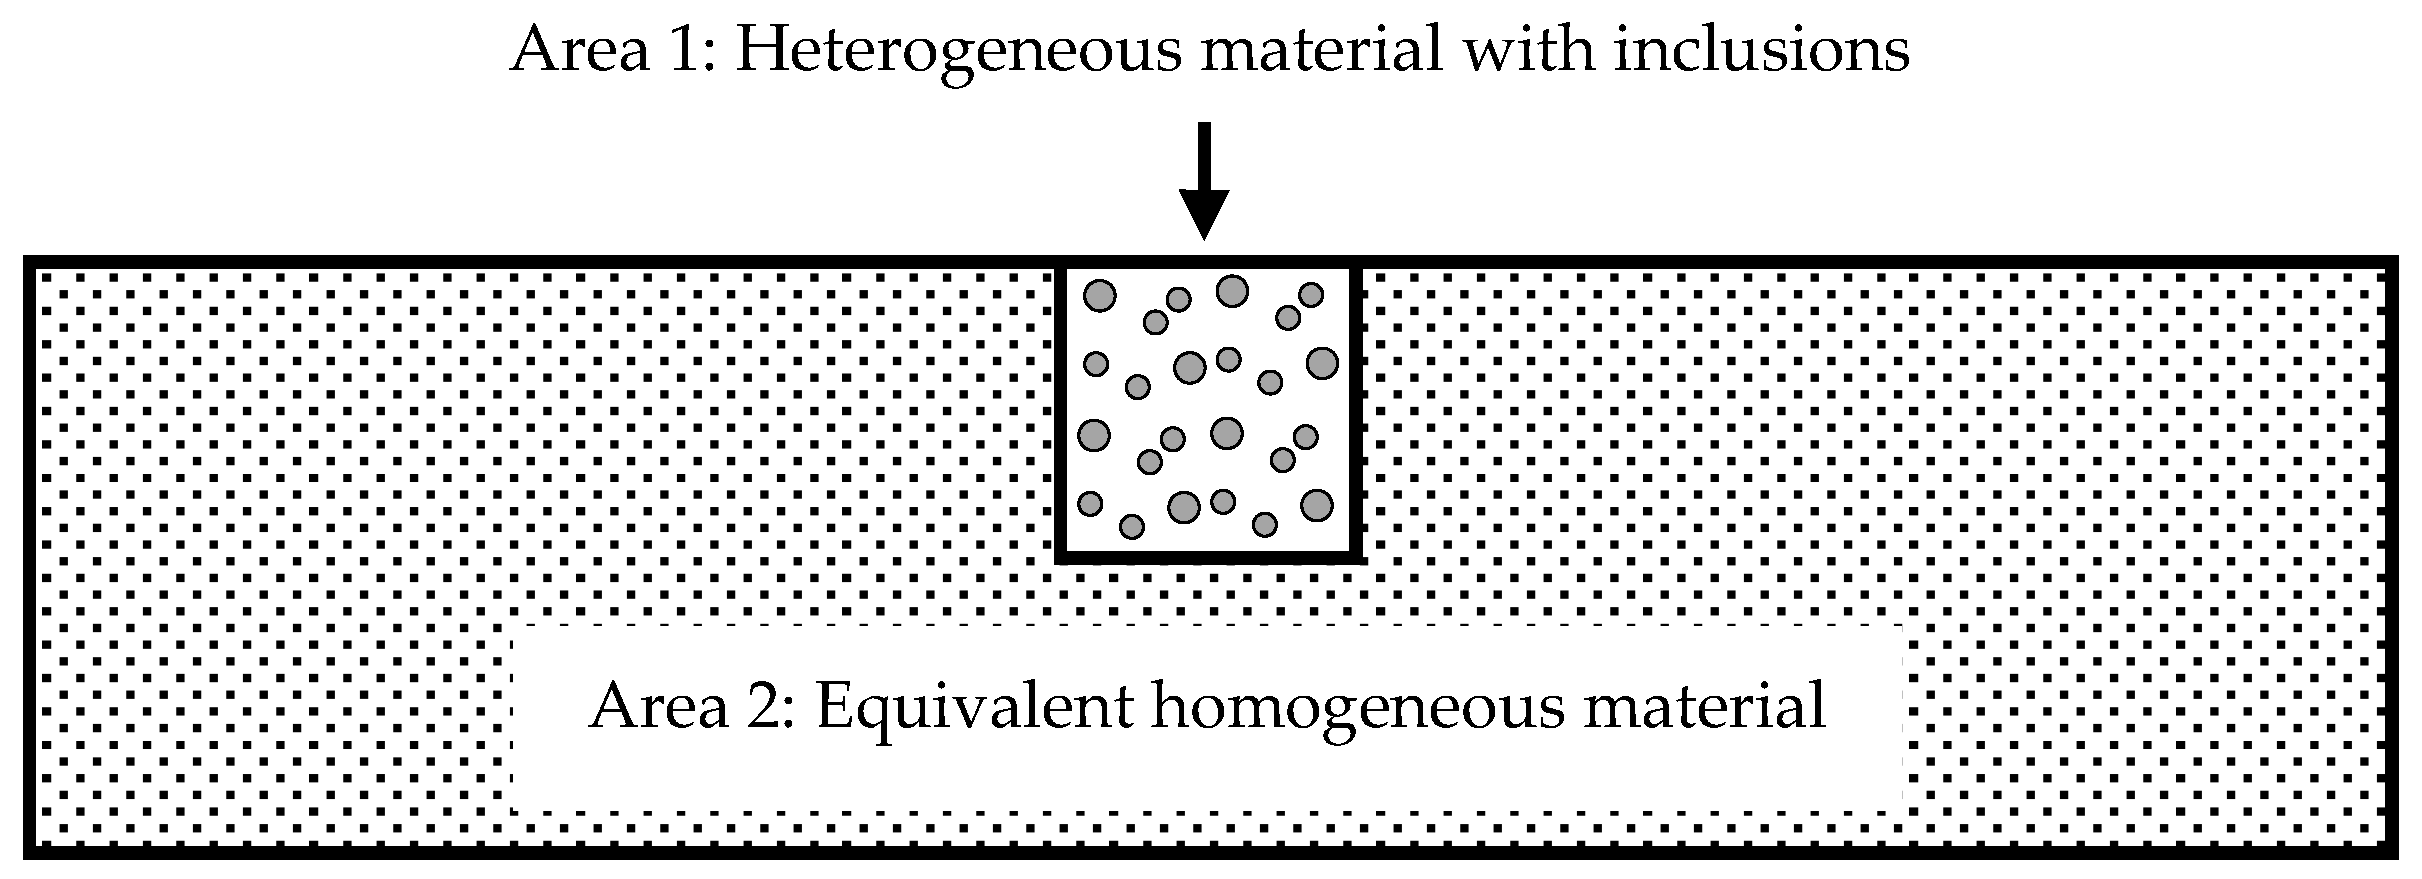
4.1. Completely Randomly Distributed Inclusions

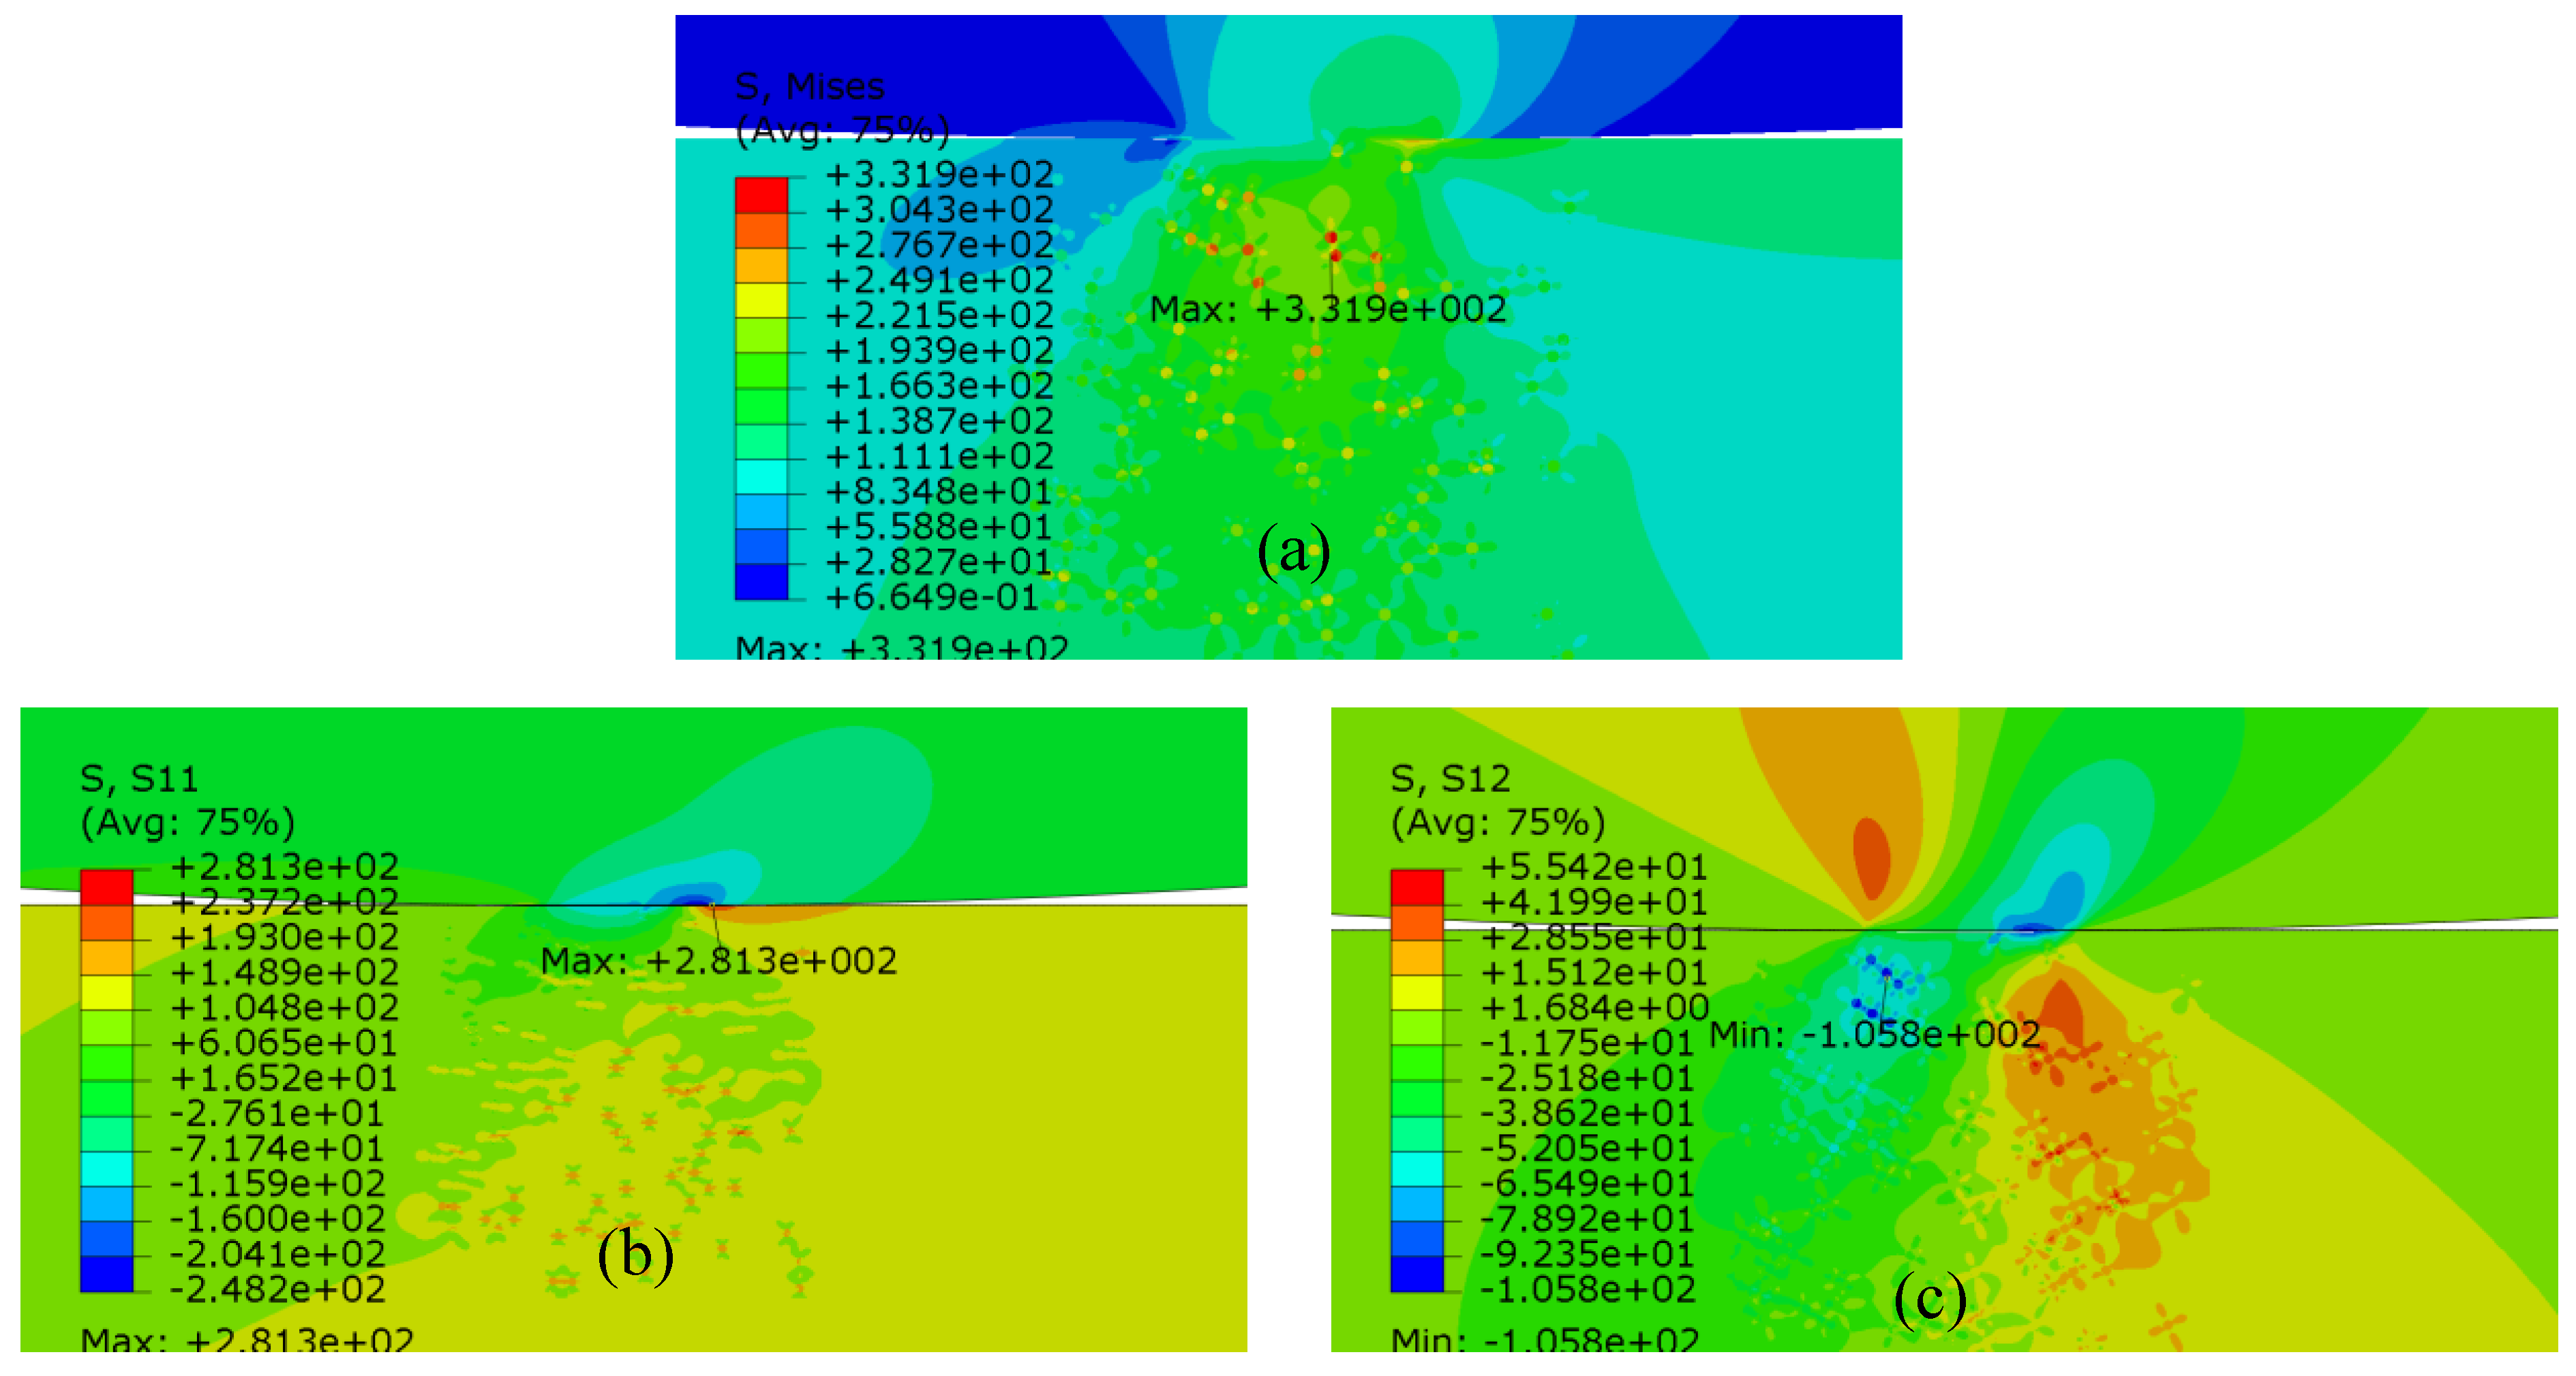
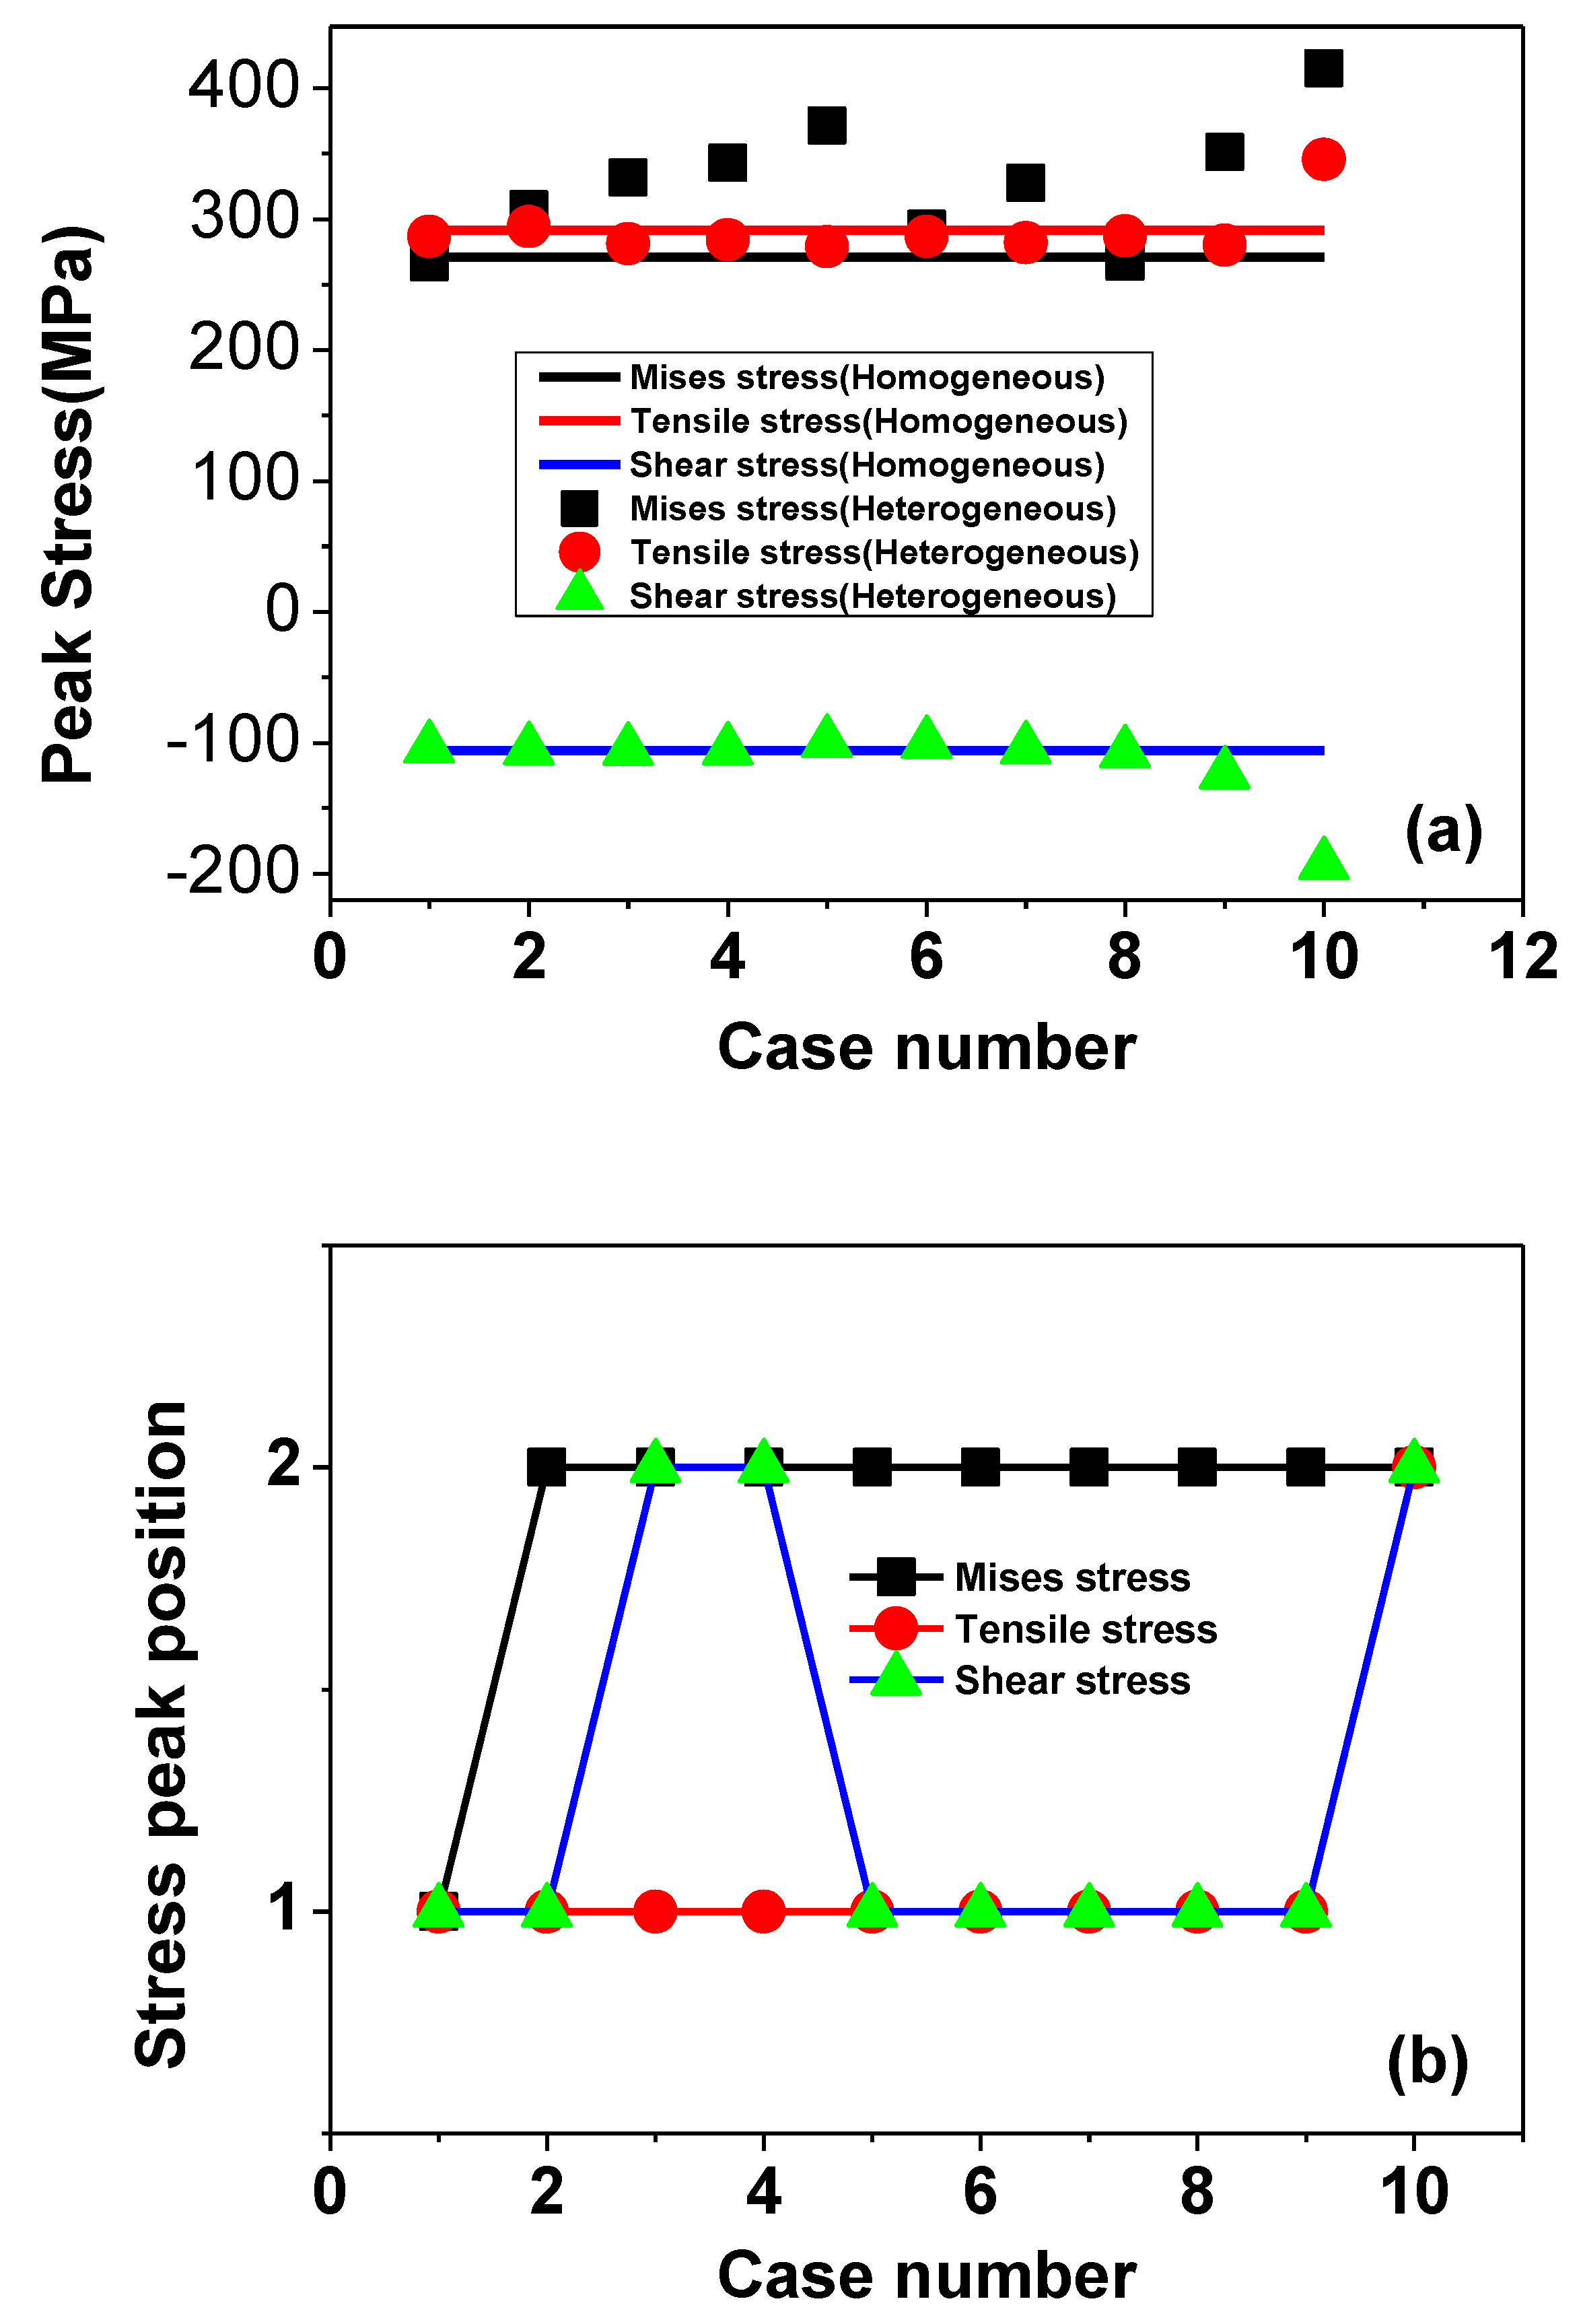
4.1.1. Stress Peak and Its Location

There are many experimental studies [48,55,68,69] and numerical studies [63] on the fatigue problem of heterogeneous materials. However, limited numerical research on fretting fatigue of heterogeneous materials is available [14]. Therefore, the first part of our research is to study the cases with random distribution inclusions. In real metal materials, inclusions and defects are common and randomly distributed. In the fretting fatigue problem of homogeneous materials, the peak of shear stress appears between the stick zone and the slip zone, as shown in Figure 10b. The peak tensile stress and peak von-Mises stress in the whole specimen appears near the edge of contact [8]. From experimental materials and loading conditions, the point of occurrence of von-Mises stress and tensile stress peaks was observed at x = 0.47 mm, the shear stress peak occurred at x = 0.21 mm on the contact surface. But for the heterogeneous materials with randomly distributed inclusions (Table 2), significant stress concentration inside the specimen is observed, as shown in Figure 12. It is the stress distribution below the contact surface of the specimen. It can be seen, from comparison between Figure 10b and Figure 12c, that the shear stress peak is transferred from the contact surface to the inside of the specimen in the heterogeneous situation. It also showed that there may be multiple high stress concentration points inside the structure, hereby forming an influencing group of intrusions, eventually causing multiple fatigue cracking points inside the material as observed in the experiment [55].
Due to the complete randomness of the inclusion distribution, it is difficult to investigate the effect of particle size, shape and other factors on the stress distribution by the control variable method; such as maintaining the same inclusion material, shape, size but different volume ratio (case 2, 3, 4) to study the effect of volume ratio on the surface stress distribution of the sample. There is no regularity in the results, that is, the stress peak is almost determined by the critical defects in each case. It is similar as the experimental observation, that the size of the particles is not necessarily related to the fatigue life [55].
Based on the performed simulations, peak stress value and locations are determined, as shown in Figure 13.
Although various parameters (type, volume ratio, size, shape) of inclusions are considered in the numerical model, the data from Figure 13a indicates that tensile stress and shear stress are similar to homogeneous materials except for the von-Mises stress, which is significantly higher than the case of homogeneous materials. As shown in Figure 13b, the stress peak location is the same as the homogeneous specimen on the contact surface as mentioned before, the ordinate value is equal to 1, otherwise (below the contact surface), is equal to 2. These figures show that, for a fretting fatigue problem, heterogeneous materials containing randomly distributed inclusions have almost the same tensile and shear stress peaks and locations as homogeneous materials on the contact surface. Due to the presence of hard inclusion, the equivalent elastic modulus of the material becomes larger, resulting in a situation where the stress peak in heterogeneous material is sometimes even lower than that of the homogeneous material. But at the same time, the shear stress inside the specimen is also relatively large, comparable to peak value on the surface. Therefore, for materials with shear stress as the main fatigue index, it is likely that cracks will occur simultaneously on the surface as well as inside (Figure 12c). The von-Mises stress will be higher and appear below the contact surface with a high probability. Moreover, we can notice that for Case 10, which uses voids instead of inclusions, all of the three kinds of stress peak are significantly increased and appear inside the specimen near the edge of voids. This confirms experimental observations, that porosity is the main cause of fatigue damage, followed by oxide [68] and provides more useful results data.

4.1.2. Stress Peak Location Characteristic

From Figure 13b, we can see the shear stress is randomly appearing inside or on the surface of the material. In Figure 12c, it is also indicated that there will be multiple cracking points appearing on the surface or inside the material because both have roughly the same shear stress. For homogeneous materials, the peak value of shear stress appears on the contact surface. Also, in the left side of the sample below the surface, the shear stress is relatively higher as shown in Figure 10b. So when there are inclusions in the material, the peak value of shear stress is likely to transfer to this area (left side of sample inside). The local inclusion alignment of the stress and peak location of case 3 and case 4 are shown in Figure 14. Therefore, this shows that the inclusion in the high stress region is more likely to cause the transfer of stress peaks from surface to inside the specimen. There is also an effect of mutual coupling between the inclusions. Forming a stress band between the inclusions may directly affect the expansion direction of cracks at a later stage.
In all cases, except for the case of void (case 10), case 5 has the highest von-Mises stress. The local inclusion alignment of the stress peak location of case 5 is shown in Figure 15a. Stress coupling between the inclusions also appears here; smaller and denser inclusions form a more pronounced stress band as shown in Figure 15.

4.2. Randomly Distributed and Manually Placed Inclusions

After observing the preliminary analysis of the effects of random phenomena on inclusion, we artificially placed four inclusions below the contact surface of the specimen for each case shown in Figure 11. The geometric center is zero, and the abscissas corresponding to the four inclusions are 0.43, 0, 0.21 and 0.47. These four points correspond to the two peaks of shear stress, the geometric center and the contact edge point. As for the vertical position, their original position is 100 µm below the specimen surface. In order to analyze the effect of inclusion on the contact surface stress distribution, the size and shape of inclusions are corresponding to each case.

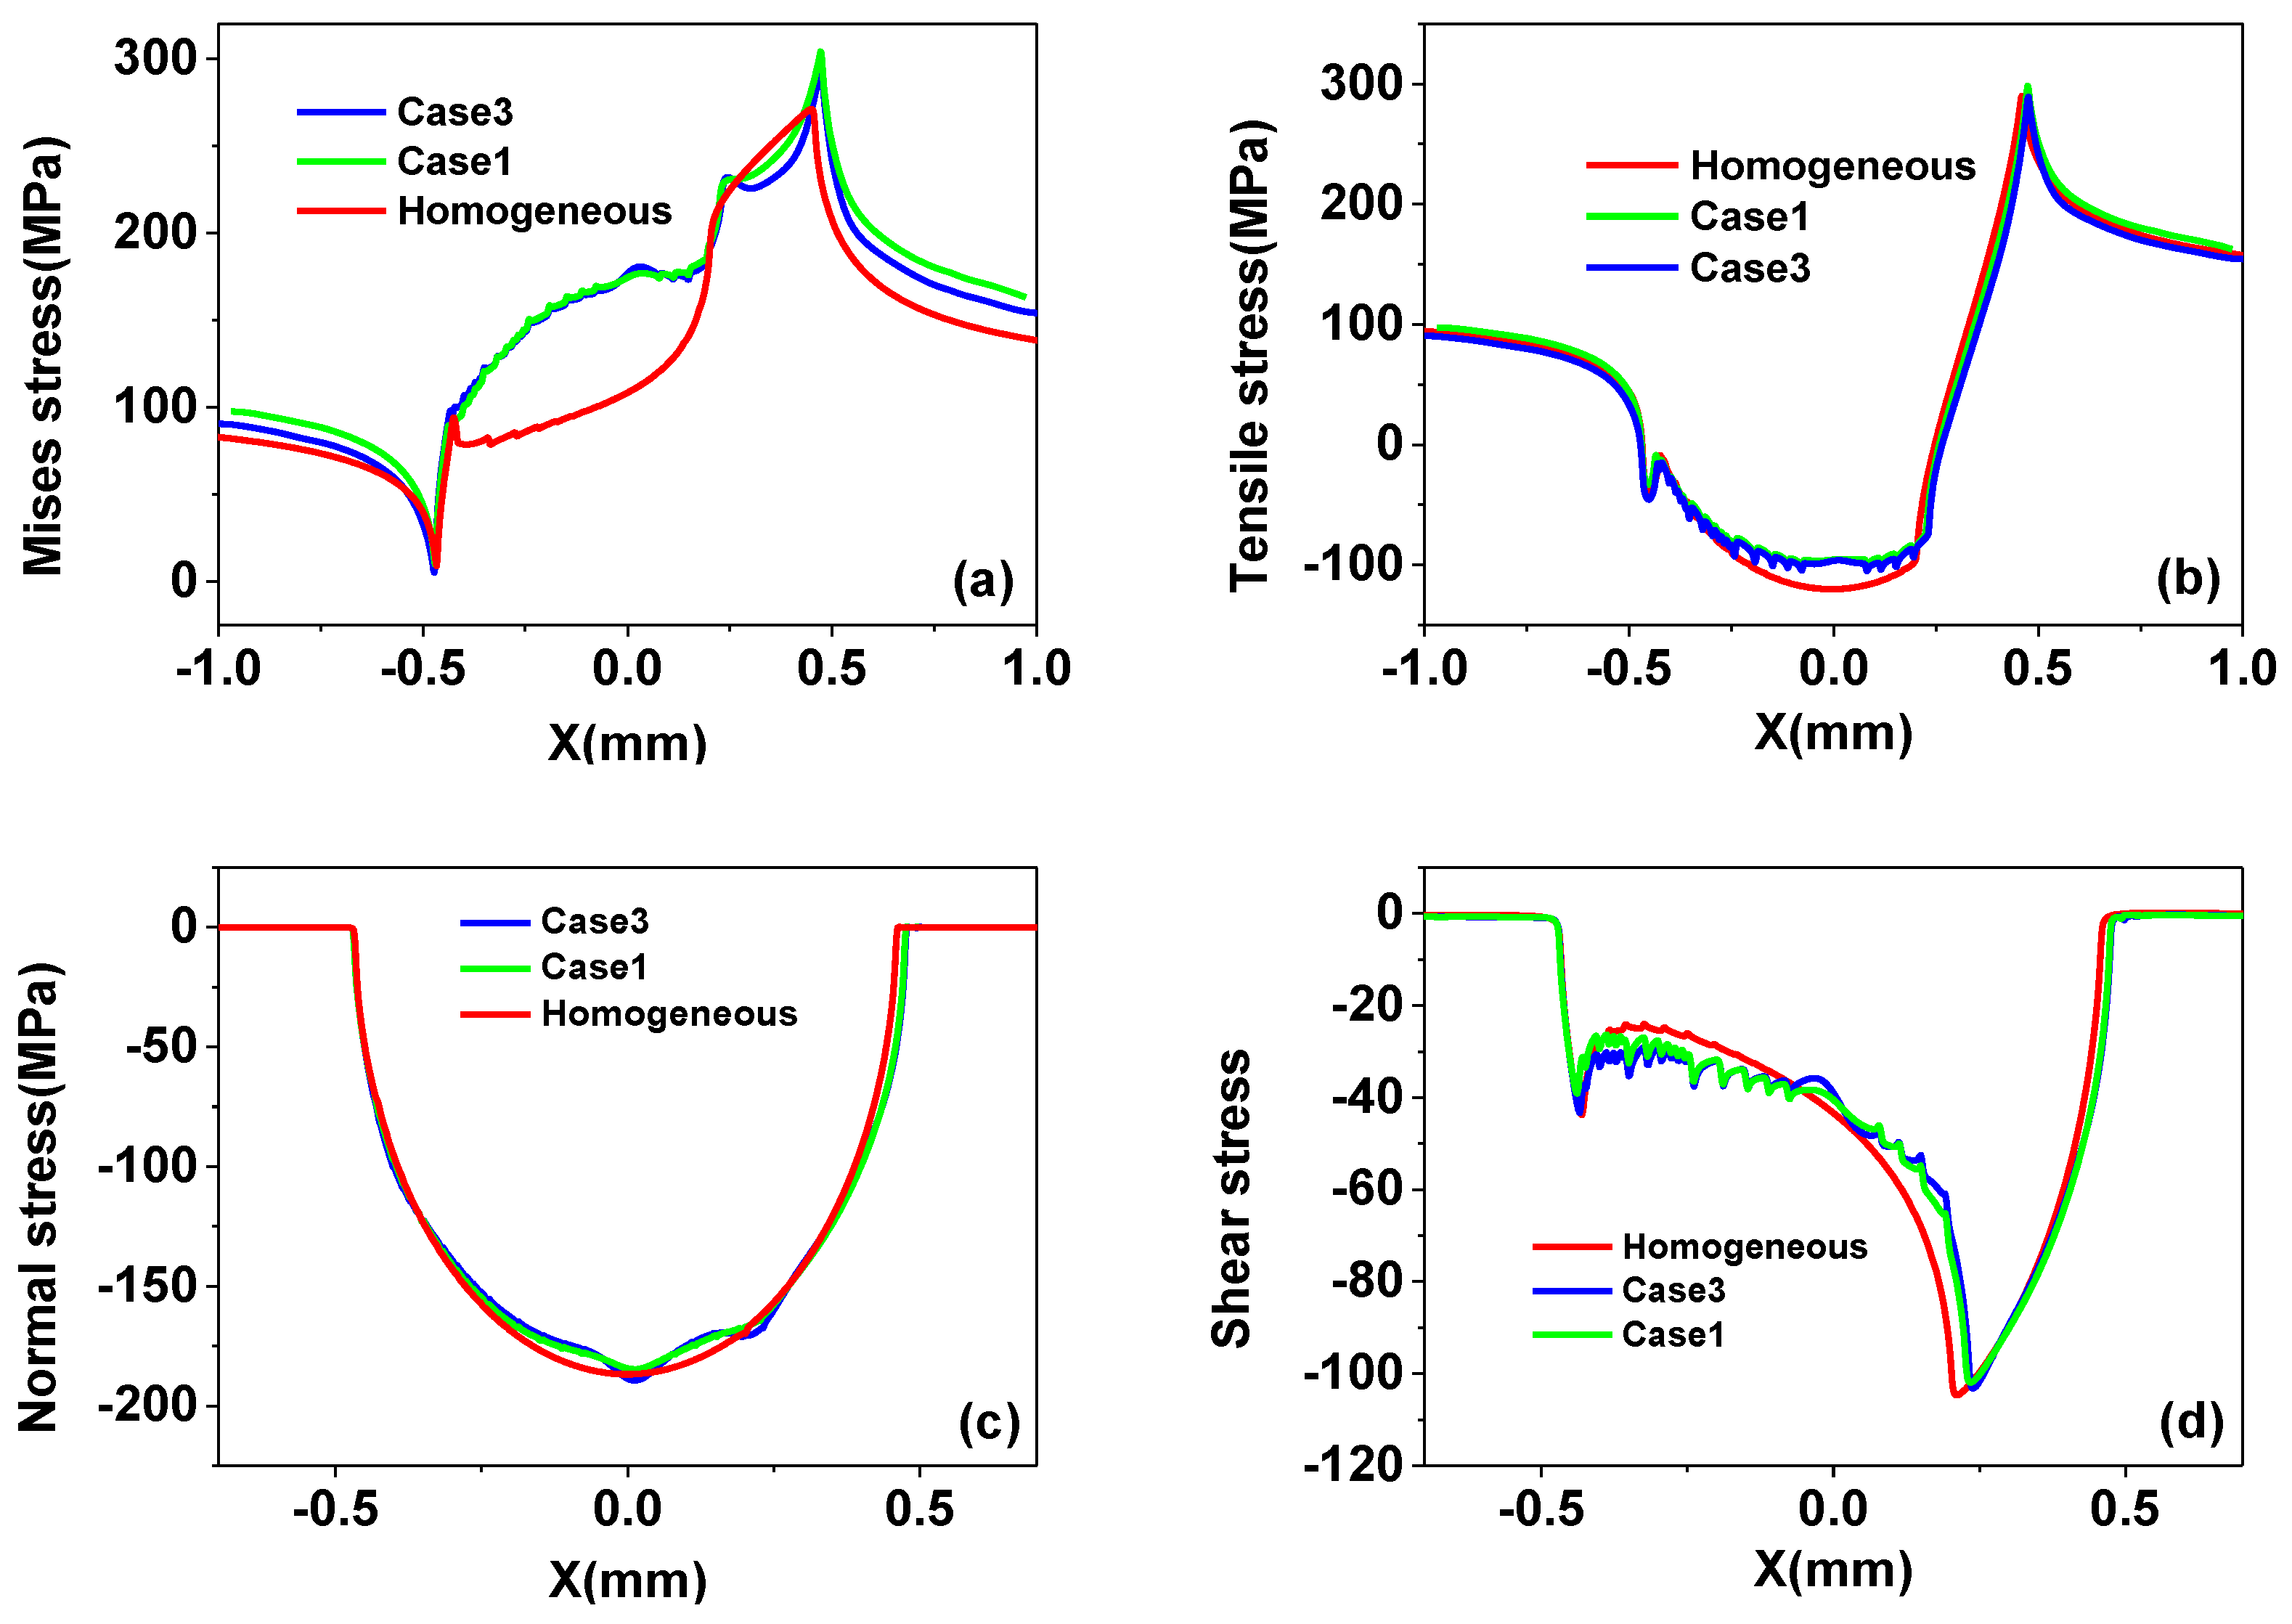
4.2.1. Effect of Inclusions Type

As commonly known, there are many kinds of inclusions inside metallic materials depending on the process of smelting impurities. Here, we consider two different inclusions to compare case 1 and case 3 (Table 2).
As we can see in Figure 16a, in both of homogenous and heterogeneous specimens, the von-Mises stress peak is near the contact edge, and it changes very sharply near the edge of the contact. The presence of inclusions makes the peak of the von-Mises stress increase significantly, and Al2CuMg has a more obvious effect than Al2O3. This means that in the heavy load condition, the presence of inclusions may accelerate the distortion of the contact edge of the fretting fatigue contact member. The effect of inclusion on the surface tensile stress is not obvious. However, the inclusion will affect the normal and shear stresses.

4.2.2. Effect of Distance from Surface

The volume ratio (cases 2, 3 and 4) is not easy to measure for a single or several inclusions, so here we refer to the volume ratio as the particle crowding, which is reflected here as the distance between the inclusion and the contact surface. Thus, here for case 2, case 3 and case 4, the distance between the center of particle to the surface is 120 µm, 100 µm and 80 µm, respectively. The results are shown in Figure 17.
In the experimental study [48], the authors believe that the distance between the inclusions or the distance from the surface of the defect is important for fatigue damage. From our results, it is clear from Figure 17 that the distance from the surface has a more significant effect on the shear stress and normal stress. The smaller the distance from the surface, the greater the peak value of the shear stress generated. However, it can also be seen that the influence of the depth on the surface contact stress distribution is different for the inclusions at different lateral positions.

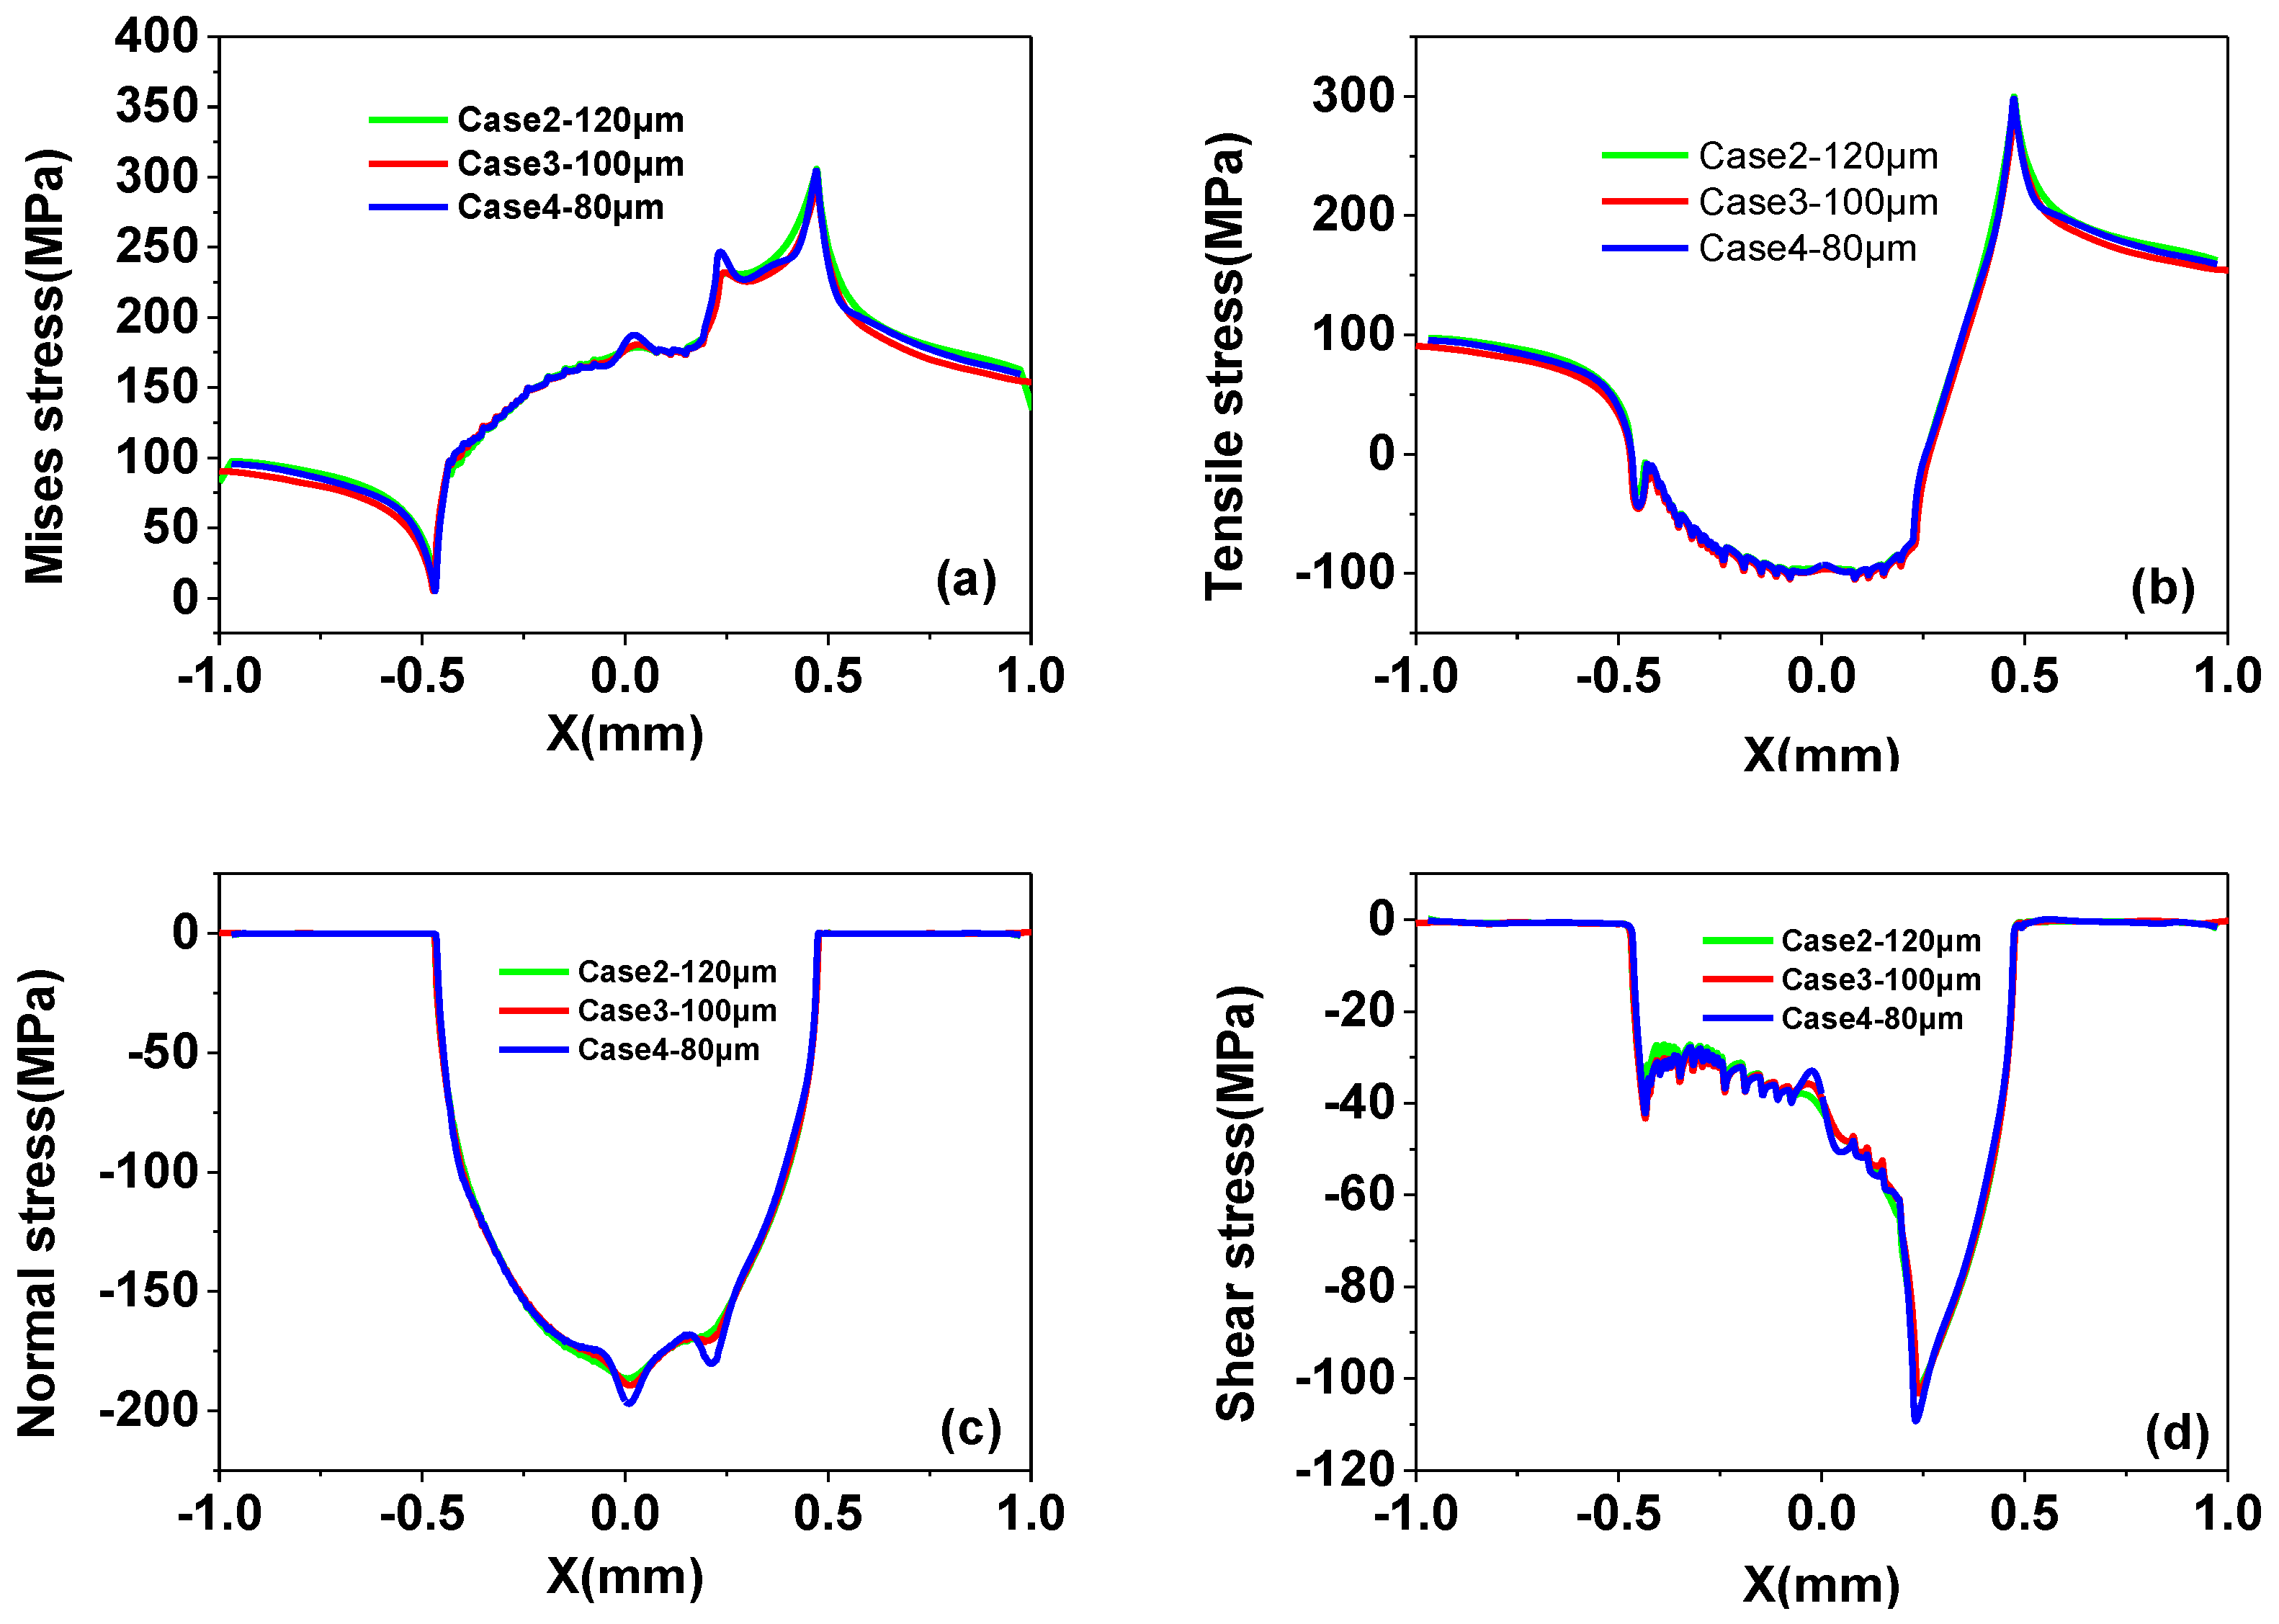
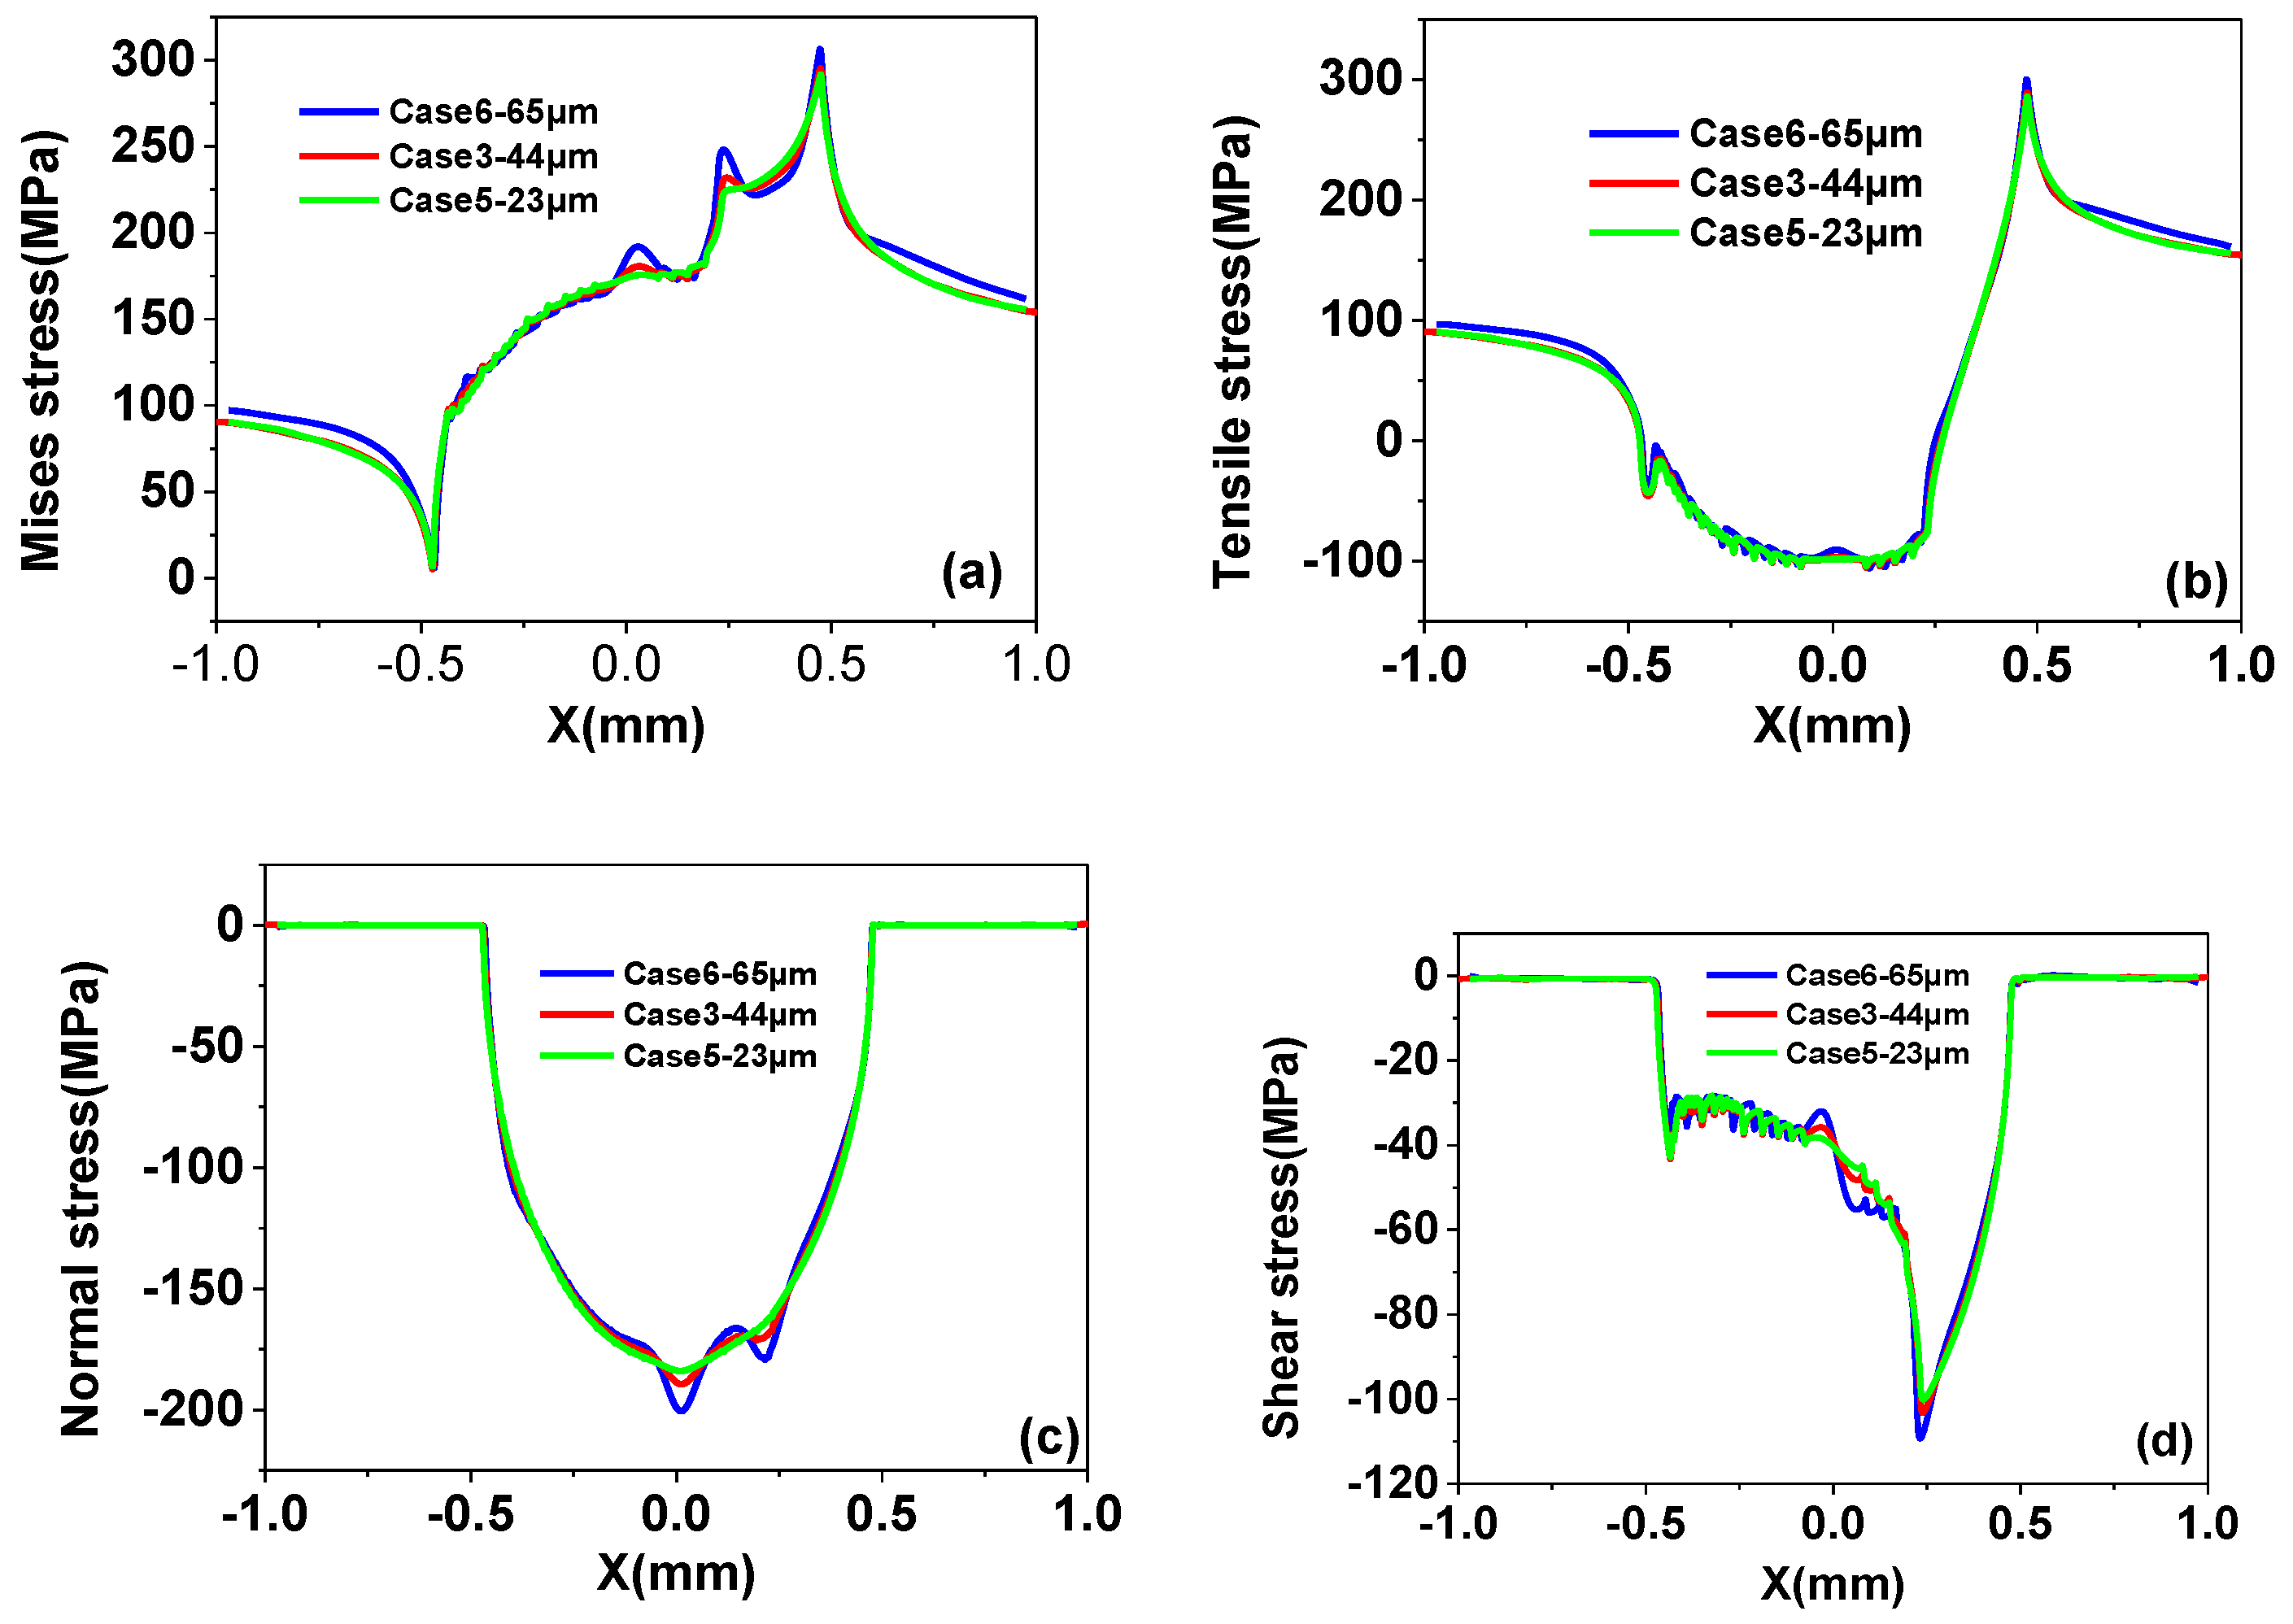
4.2.3. Effect of Inclusion Size

From Figure 18, we can see that the effect of the inclusion size is more pronounced than the influence of the inclusion type on the surface stress distribution (Figure 16).

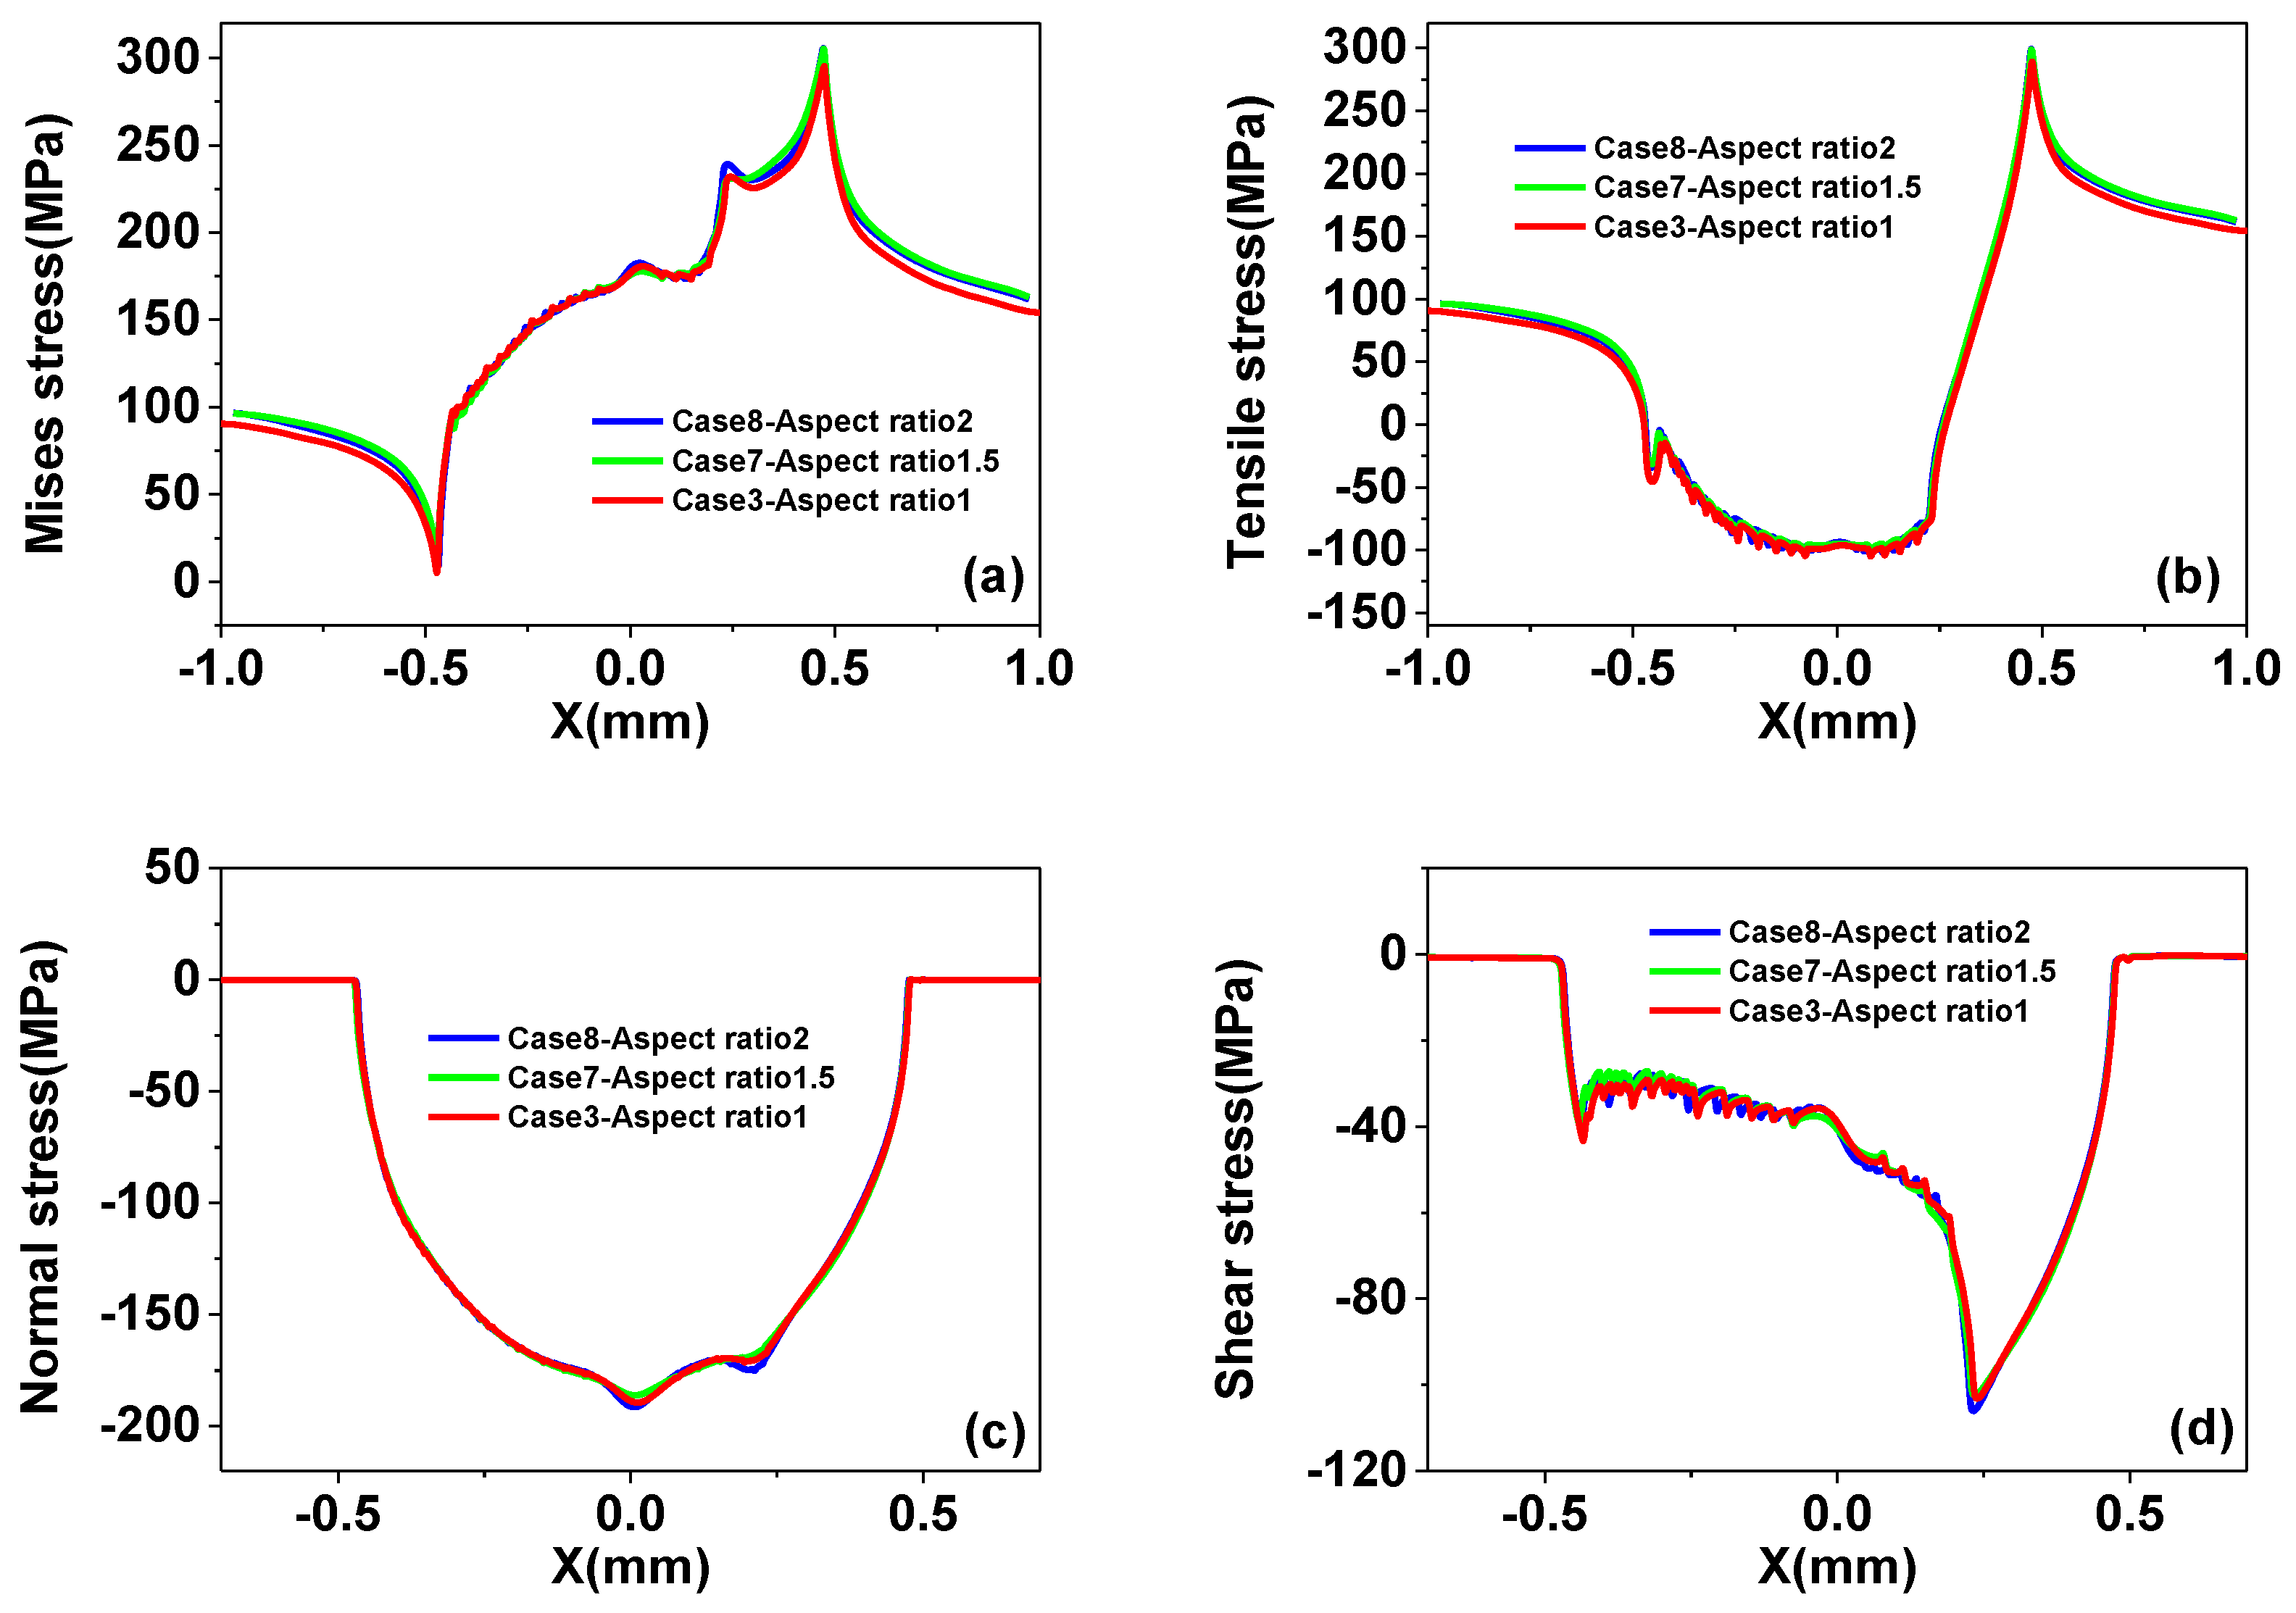
4.2.4. Effect of Inclusion Shape

Here we consider the effect of different aspect ratios of inclusions. As shown in Figure 19, there is no significant difference between inclusion shape cases. For all cases, the effect of inclusion parameters on the tensile stress is very modest.
For the current work, we considered different stresses for analysis in order to visualize the contribution of each stress. The local stress and stress concentration effects will have a direct impact on the fretting fatigue life of the specimen. The next article shall contain the application of damage parameters (critical plane approach) to compute crack initiation lives, where we shall present the comparison of numerical lives with experimental lives.

5. Conclusions

In this study, in order to consider the effect of inclusions in aluminum alloy 2024-T3 on the fretting fatigue stress distribution, a numerical research method combining RVE with a finite element method is conducted. Based on the research results, we can draw the following conclusions.
For the cases considered in this study, with the same inclusion material to volume ratio, the shape and size of the inclusions have little effect on the macroscopic material properties. However, the material properties of inclusion and volume ratio have a significant impact on macro elastic modulus. The macroscopic Poisson’s ratio has hardly changed with the change of different parameters.
Due to the randomness of the inclusion distribution, the fatigue cracking nucleation depends on the most dangerous inclusion. The von-Mises stress peak very likely increases and transfers from the contact surface to the interior of the specimen. However, various parameters of inclusions have little effect on the peak value and position of the tensile stress; it remains almost same as in the homogeneous material. Among the materials with inclusions, the peak value and position of the shear stress are consistent with the homogeneous material, but sometimes it is also transferred to the inside of the specimen. Moreover, in all cases, higher shear stress occurs in many places inside the sample, which can result in multiple cracking points inside the sample as well as at the contact surface.
Due to the presence of hard inclusions, the equivalent elastic modulus of the material becomes larger, resulting in a situation where the stress peak in heterogeneous material is sometimes even lower than that of the homogeneous material. A void compared to inclusion will cause larger stress and randomness of stress distribution. Therefore, the influence of microstructure on macroscopic material properties should be considered in engineering.
Inclusion in high stress areas is more likely to cause stress concentration leading to peak transfer. Stress coupling between adjacent inclusions will form a high stress band, which has an important effect on the direction of crack growth.
The size of the inclusions and the distance from the surface have a more significant effect on the surface stress distribution than the type and shape of inclusions. The effect of inclusion parameters on the tensile stress is insignificant.

Author Contributions

Q.D. carried out the research work and wrote the first draft of the manuscript. N.B. supported the finite element simulations and analysis of the results. X.Y. and M.A.W. provided advice on the entire work and supervised all research work.

Funding

This research was funded by [National Natural Science Foundation of China] grant number [11372138 and 11572157] and by the Research Foundation-Flanders (FWO), The Luxembourg National Research Fund (FNR) and Slovenian Research Agency (ARRS) in the framework of the FWO Lead Agency project: G018916N ‘Multi-analysis of fretting fatigue using physical and virtual experiments’]. The APC was funded by the Research Foundation-Flanders (FWO).

Acknowledgements

The authors would like to acknowledge the financial support of the National Natural Science Foundation of China (Grant No. 11372138 and No.11572157), the Research Foundation-Flanders (FWO), The Luxembourg National Research Fund (FNR) and Slovenian Research Agency (ARRS) in the framework of the FWO Lead Agency project: G018916N ‘Multi-analysis of fretting fatigue using physical and virtual experiments’.

Conflicts of Interest

The authors declare no conflict of interest.

References

  1. Wang, R.; Jain, V.; Mall, S. A non-uniform friction distribution model for partial slip fretting contact. Wear 2007, 262, 607–616. [Google Scholar] [CrossRef]
  2. Nishioka, K.; Hirakawa, K. Fundamental investigations of fretting fatigue: Part 4, the effect of mean stress. Bull. JSME 1969, 12, 408–414. [Google Scholar] [CrossRef]
  3. Jeung, H.K.; Kwon, J.D.; Lee, C.Y. Crack initiation and propagation under fretting fatigue of inconel 600 alloy. J. Mech. Sci. Technol. 2015, 29, 5241–5244. [Google Scholar] [CrossRef]
  4. Bhatti, N.A.; Wahab, M.A. Fretting fatigue crack nucleation: A review. Tribol. Int. 2018, 121, 121–138. [Google Scholar] [CrossRef]
  5. Bhatti, N.A.; Pereira, K.; Wahab, M.A. A continuum damage mechanics approach for fretting fatigue under out of phase loading. Tribol. Int. 2017, 117, 39–51. [Google Scholar] [CrossRef]
  6. Pereira, K.; Wahab, M.A. Fretting fatigue crack propagation lifetime prediction in cylindrical contact using an extended MTS criterion for non-proportional loading. Tribol. Int. 2017, 115, 525–534. [Google Scholar] [CrossRef]
  7. Martínez, J.C.; Vanegas Useche, L.V.; Wahab, M.A. Numerical prediction of fretting fatigue crack trajectory in a railway axle using XFEM. Int. J. Fatigue 2017, 100, 32–49. [Google Scholar] [CrossRef]
  8. Talemi, R.H.; Wahab, M.A. Finite element analysis of localized plasticity in Al 2024-T3 subjected to fretting fatigue. Tribol. Trans. 2012, 55, 805–814. [Google Scholar] [CrossRef]
  9. Amuzuga, K.V.; Chaise, T.; Duval, A.; Nelias, D. Fully coupled resolution of heterogeneous elastic–plastic contact problem. J. Tribol. 2016, 138, 021403. [Google Scholar] [CrossRef]
  10. Beveridge, A.J.; Wheel, M.; Nash, D. A higher order control volume based finite element method to predict the deformation of heterogeneous materials. Comput. Struct. 2013, 129, 54–62. [Google Scholar] [CrossRef] [Green Version]
  11. Toro, S.; Sánchez, P.J.; Huespe, A.E.; Giusti, S.M.; Blanco, P.J.; Feijóo, R. A two-scale failure model for heterogeneous materials: Numerical implementation based on the finite element method. Int. J. Numer. Methods Eng. 2014, 97, 313–351. [Google Scholar] [CrossRef] [Green Version]
  12. Roubin, E.; Vallade, A.; Benkemoun, N.; Colliat, J.B. Multi-scale failure of heterogeneous materials: A double kinematics enhancement for Embedded Finite Element Method. Int. J. Solids Struct. 2015, 52, 180–196. [Google Scholar] [CrossRef] [Green Version]
  13. You, Y.; Kou, X.; Tan, S. Adaptive meshing for finite element analysis of heterogeneous materials. Comput. Aided Des. 2015, 62, 176–189. [Google Scholar] [CrossRef] [Green Version]
  14. Kumar, D.; Biswas, R.; Poh, L.H.; Wahab, M.A. Fretting fatigue stress analysis in heterogeneous material using direct numerical simulations in solid mechanics. Tribol. Int. 2017, 109, 124–132. [Google Scholar] [CrossRef]
  15. Matzenmiller, A.; Lubliner, J.; Taylor, R.L. A constitutive model for anisotropic damage in fiber-composites. Mech. Mater. 1995, 20, 125–152. [Google Scholar] [CrossRef]
  16. Jiménez, F.L.; Pellegrino, S. Folding of fiber composites with a hyperelastic matrix. Int. J. Solids Struct. 2012, 49, 395–407. [Google Scholar] [CrossRef]
  17. Sager, R.; Klein, P.; Lagoudas, D.; Zhang, Q.; Liu, J.; Dai, L.; Baur, J. Effect of carbon nanotubes on the interfacial shear strength of T650 carbon fiber in an epoxy matrix. Compos. Sci. Technol. 2009, 69, 898–904. [Google Scholar] [CrossRef]
  18. Wood, C.D.; Palmeri, M.J.; Putz, K.W.; Ho, G.; Barto, R.; Brinson, L.C. Nanoscale structure and local mechanical properties of fiber-reinforced composites containing MWCNT-grafted hybrid glass fibers. Compos. Sci. Technol. 2012, 72, 1705–1710. [Google Scholar] [CrossRef]
  19. López-Realpozo, J.C.; Rodríguez-Ramos, R.; Guinovart-Díaz, R.; Bravo-Castillero, J.; Otero, J.; Sabina, F.J.; Lebon, F.; Dumont, S.; Sevostianov, I. Effective elastic shear stiffness of a periodic fibrous composite with non-uniform imperfect contact between the matrix and the fibers. Int. J. Solids Struct. 2014, 51, 1253–1262. [Google Scholar] [CrossRef]
  20. Maiti, S.N.; Sharma, K.K. Studies on polypropylene composites filled with talc particles. J. Mater. Sci. 1992, 27, 4605–4613. [Google Scholar] [CrossRef]
  21. Zhu, Y.; Kishawy, H.A. Influence of alumina particles on the mechanics of machining metal matrix composites. Int. J. Mach. Tools Manuf. 2005, 45, 389–398. [Google Scholar] [CrossRef]
  22. Marshall, D.B.; Cox, B.N.; Evans, A.G. The mechanics of matrix cracking in brittle-matrix fiber composites. Acta Metall. 1985, 33, 2013–2021. [Google Scholar] [CrossRef]
  23. Huda, Z.; Taib, N.I.; Zaharinie, T. Characterization of 2024-T3: An aerospace aluminum alloy. Mater. Chem. Phys. 2009, 113, 515–517. [Google Scholar] [CrossRef]
  24. Simensen, C.; Berg, G. A survey of inclusions in aluminum. Aluminium 1980, 56, 335–338. [Google Scholar]
  25. Murakami, Y.; Endo, M. Effects of defects, inclusions and inhomogeneities on fatigue strength. Int. J. Fatigue 1994, 16, 163–182. [Google Scholar] [CrossRef]
  26. Frost, N. Alternating stress required to propagate edge cracks in copper and nickel-chromium alloy steel plates. J. Mech. Eng. Sci. 1963, 5, 15–22. [Google Scholar] [CrossRef]
  27. Murakam, Y.; Nomoto, T.; Ueda, T. Factors influencing the mechanism of superlong fatigue failure in steels. Fatigue Fract. Eng. Mater. Struct. 1999, 22, 581–590. [Google Scholar] [CrossRef]
  28. Bathias, C. There is no infinite fatigue life in metallic materials. Fatigue Fract. Eng. Mater. Struct. 1999, 22, 559–566. [Google Scholar] [CrossRef]
  29. Yang, Z.G.; Li, S.X.; Zhang, J.M.; Zhang, J.F.; Li, G.Y.; Li, Z.B.; Hui, W.J.; Weng, Y.Q. The fatigue behaviors of zero-inclusion and commercial 42CrMo steels in the super-long fatigue life regime. Acta Mater. 2004, 52, 5235–5241. [Google Scholar] [CrossRef]
  30. Yang, Z.; Zhang, J.; Li, S.; Li, G.; Wang, Q.; Hui, W.; Weng, Y. On the critical inclusion size of high strength steels under ultra-high cycle fatigue. Mater. Sci. Eng. A 2006, 427, 167–174. [Google Scholar] [CrossRef]
  31. Yang, Z.; Li, S.; Liu, Y.; Li, Y.; Li, G.; Hui, W.; Weng, Y. Estimation of the size of GBF area on fracture surface for high strength steels in very high cycle fatigue regime. Int. J. Fatigue 2008, 30, 1016–1023. [Google Scholar] [CrossRef]
  32. Giner, E.; Sukumar, N.; Denia, F.; Fuenmayor, F. Extended finite element method for fretting fatigue crack propagation. Int. J. Solids Struct. 2008, 45, 5675–5687. [Google Scholar] [CrossRef]
  33. Yue, T.; Wahab, M.A. Finite element analysis of fretting wear under variable coefficient of friction and different contact regimes. Tribol. Int. 2017, 107, 274–282. [Google Scholar] [CrossRef]
  34. Yue, T.; Wahab, M.A. A numerical study on the effect of debris layer on fretting wear. Materials 2016, 9, 597. [Google Scholar] [CrossRef] [PubMed] [Green Version]
  35. Bhatti, N.A.; Wahab, M.A. Finite element analysis of fretting fatigue under out of phase loading conditions. Tribol. Int. 2017, 109, 552–562. [Google Scholar] [CrossRef]
  36. Yue, T.; Wahab, M.A. Finite element analysis of stress singularity in partial slip and gross sliding regimes in fretting wear. Wear 2014, 321, 53–63. [Google Scholar] [CrossRef]
  37. Tobi, A.M.; Sun, W.; Shipway, P. Investigation on the plasticity accumulation of Ti-6Al-4V fretting wear by decoupling the effects of wear and surface profile in finite element modelling. Tribol. Int. 2017, 113, 448–459. [Google Scholar] [CrossRef] [Green Version]
  38. Pereira, K.; Bordas, S.; Tomar, S.; Trobec, R.; Depolli, M.; Kosec, G.; Wahab, M.A. On the convergence of stresses in fretting fatigue. Materials 2016, 9, 639. [Google Scholar] [CrossRef] [PubMed] [Green Version]
  39. Argyris, J.H. Finite elements in non-associated plasticity—axisymmetric necking in void-containing materials. Comput. Methods Appl. Mech. Eng. 1984, 43, 325–347. [Google Scholar] [CrossRef]
  40. Ortiz, M.; Pandolfi, A. Finite-deformation irreversible cohesive elements for three-dimensional crack-propagation analysis. Int. J. Numer. Methods Eng. 1999, 44, 1267–1282. [Google Scholar] [CrossRef] [Green Version]
  41. Rabczuk, T.; Belytschko, T. Cracking particles: A simplified meshfree method for arbitrary evolving cracks. Int. J. Numer. Methods Eng. 2004, 61, 2316–2343. [Google Scholar] [CrossRef]
  42. Rabczuk, T.; Zi, G.; Bordas, S.; Nguyen-Xuan, H. A simple and robust three-dimensional cracking-particle method without enrichment. Comput. Methods Appl. Mech. Eng. 2010, 199, 2437–2455. [Google Scholar] [CrossRef]
  43. Hamdia, K.M.; Silani, M.; Zhuang, X.; He, P.; Rabczuk, T. Stochastic analysis of the fracture toughness of polymeric nanoparticle composites using polynomial chaos expansions. Int. J. Fract. 2017, 206, 215–227. [Google Scholar] [CrossRef]
  44. Zhang, M.; McDowell, D.; Neu, R. Microstructure sensitivity of fretting fatigue based on computational crystal plasticity. Tribol. Int. 2009, 42, 1286–1296. [Google Scholar] [CrossRef]
  45. Mall, S.; Namjoshi, S.; Porter, W. Effects of microstructure on fretting fatigue crack initiation behavior of Ti-6Al-4V. Mater. Sci. Eng. A 2004, 383, 334–340. [Google Scholar] [CrossRef]
  46. Chan, L.; Lu, X.; Yu, K. Multiscale approach with RSM for stress–strain behaviour prediction of micro-void-considered metal alloy. Mater. Des. 2015, 83, 129–137. [Google Scholar] [CrossRef]
  47. Razaz, G.; Carlberg, T. Casting Practices Influencing Inclusion Distributions in Billets. In Light Metals 2013; The Minerals, Metals & Materials Series; Springer: Cham, Germany, 2016; pp. 987–991. [Google Scholar]
  48. Murakami, Y. Metal fatigue: Effects of Small Defects and Nonmetallic Inclusions, 1st ed.; Elsevier: Oxford, UK, 2002. [Google Scholar]
  49. Johnson, K.L.; Johnson, K.L. Contact Mechanics, 1st ed.; Cambridge University Press: Cambridge, UK, 1987. [Google Scholar]
  50. Cattaneo, C. Sul contatto di due corpi elastici: Distribuzione locale degli sforzi. Rend. Accad. Naz. Lincei 1938, 27, 342–348. [Google Scholar]
  51. Mindlin, R.D. Elastic spheres in contact under varying oblique forces. J. Appl. Mech. 1953, 20, 327–344. [Google Scholar]
  52. Hills, D.A. Mechanics of fretting fatigue. Wear 1994, 175, 107–113. [Google Scholar] [CrossRef]
  53. Hojjati-Talemi, R.; Wahab, M.A.; Pauw, J.D.; Baets, P.D. Prediction of fretting fatigue crack initiation and propagation lifetime for cylindrical contact configuration. Tribol. Int. 2014, 76, 73–91. [Google Scholar] [CrossRef]
  54. Hojjati-Talemi, R.; Wahab, M.A. Fretting fatigue crack initiation lifetime predictor tool: Using damage mechanics approach. Tribol. Int. 2013, 60, 176–186. [Google Scholar] [CrossRef]
  55. Merati, A. A study of nucleation and fatigue behavior of an aerospace aluminum alloy 2024-T3. Int. J. Fatigue 2005, 27, 33–44. [Google Scholar] [CrossRef]
  56. Shedbale, A.S.; Singh, I.V.; Mishra, B.K. Heterogeneous and homogenized models for predicting the indentation response of particle reinforced metal matrix composites. Int. J. Mech. Mater. Des. 2017, 13, 531–552. [Google Scholar] [CrossRef]
  57. Mirkhalaf, S.M.; Andrade Pires, F.M.; Simoes, R. Determination of the size of the representative volume element (RVE) for the simulation of heterogeneous polymers at finite strains. Finite Elem. Anal. Des. 2016, 119, 30–44. [Google Scholar] [CrossRef]
  58. Heinrich, C.; Aldridge, M.; Wineman, A.S.; Kieffer, J.; Waas, A.M.; Shahwan, K. The influence of the representative volume element (RVE) size on the homogenized response of cured fiber composites. Model. Simul. Mater. Sci. Eng. 2012, 20, 75007–75031. [Google Scholar] [CrossRef]
  59. Yu, Y.; Zhang, B.; Tang, Z.; Qi, G. Stress transfer analysis of unidirectional composites with randomly distributed fibers using finite element method. Compos. Part B 2015, 69, 278–285. [Google Scholar] [CrossRef]
  60. Liu, Z.R.; Chen, J.H.; Wang, S.B.; Yuan, D.W.; Yin, M.J.; Wu, C.L. The structure and the properties of S-phase in AlCuMg alloys. Acta Mater. 2011, 59, 7396–7405. [Google Scholar] [CrossRef]
  61. Prasannavenkatesan, R.; Przybyla, C.P.; Salajegheh, N.; Mcdowell, D.L. Simulated extreme value fatigue sensitivity to inclusions and pores in martensitic gear steels. Eng. Fract. Mech. 2011, 78, 1140–1155. [Google Scholar] [CrossRef]
  62. Hashimoto, T.; Zhang, X.; Zhou, X.; Skeldon, P.; Haigh, S.J.; Thompson, G.E. Investigation of dealloying of S phase (Al 2 CuMg) in AA 2024-T3 aluminium alloy using high resolution 2D and 3D electron imaging. Corros. Sci. 2016, 103, 157–164. [Google Scholar] [CrossRef]
  63. Gall, K.; Horstemeyer, M.F.; Degner, B.W.; Mcdowell, D.L.; Fan, J. On the driving force for fatigue crack formation from inclusions and voids in a cast A356 aluminum alloy. Int. J. Fract. 2001, 108, 207–233. [Google Scholar] [CrossRef]
  64. Hibbitt, Karlsson & Sorensen, Inc. ABAQUS/Standard: User’s Manual; Hibbitt, Karlsson & Sorensen, Inc.: Pawtucket, RI, USA, 1997. [Google Scholar]
  65. Lykins, C.D. An Investigation of Fretting Fatigue Crack Initiation Behavior of the Titanium Alloy Ti-6Al-4V. Ph.D. Thesis, University of Dayton, Dayton, OH, USA, 1999. [Google Scholar]
  66. Zheng, H.; Zhang, P.; Du, X. Dual form of discontinuous deformation analysis. Comput. Methods Appl. Mech. Eng. 2016, 305, 196–216. [Google Scholar] [CrossRef]
  67. Iyer, K.; Mall, S. Analyses of contact pressure and stress amplitude effects on fretting fatigue life. J. Eng. Mater. Technol. 2001, 123, 85–93. [Google Scholar] [CrossRef]
  68. Chan, K.S. Roles of microstructure in fatigue crack initiation. Int. J. Fatigue 2010, 32, 1428–1447. [Google Scholar] [CrossRef]
  69. Lu, Y.; Taheri, F.; Gharghouri, M.A.; Han, H.P. Experimental and numerical study of the effects of porosity on fatigue crack initiation of HPDC magnesium AM60B alloy. J. Alloy. Compd. 2009, 470, 202–213. [Google Scholar] [CrossRef]
Figure 1. An example of normal stress distribution of the contact surface.
Metals 08 00836 g001
Figure 2. Slip and stick regions for the contact of two parallel cylinders.
Metals 08 00836 g002
Figure 3. Shear stress distribution at the contact interface.
Metals 08 00836 g003
Figure 4. Schematic view of a fretting fatigue experiment.
Metals 08 00836 g004
Figure 5. Configuration of the fretting fatigue numerical model.
Metals 08 00836 g005
Figure 6. Schematic of representative volume element (RVE) method.
Metals 08 00836 g006
Figure 7. Four difference size RVEs and corresponding mesh models.
Metals 08 00836 g007
Figure 8. Convergence of (a) macro elastic modulus and (b) Poisson’s ratio.
Metals 08 00836 g008
Figure 9. A partition diagram of the specimen with two area.
Metals 08 00836 g009
Figure 10. (a) Mesh sensitivity diagram (effect of mesh refinement on shear stress distribution on contact interface); (b) shear stress distribution near contact interface for homogenous case with 2 μm contact element size.
Metals 08 00836 g010aMetals 08 00836 g010b
Figure 11. Finite element model of case 3 with artificially placed four inclusions.
Metals 08 00836 g011
Figure 12. Stress distribution of Case 3 below the contact surface, (a) Mises stress, (b) tensile stress, and (c) shear stress.
Metals 08 00836 g012
Figure 13. (a) Comparison of stress peaks between heterogeneous materials and homogenous materials, and (b) their location of all cases.
Metals 08 00836 g013
Figure 14. The local inclusion alignment of the shear stress peak for (a) case 3 and (b) case 4.
Metals 08 00836 g014
Figure 15. Stress distribution of Case 5 below the contact surface, (a) Mises stress, (b) tensile stress, and (c) shear stress.
Metals 08 00836 g015
Figure 16. (a) Mises stress, (b) tensile stress, (c) normal stress, (d) shear stress distribution on the contact surface for different inclusion materials cases.
Metals 08 00836 g016
Figure 17. (a) Mises stress, (b) tensile stress, (c) normal stress, (d) shear stress distribution on the contact surface for different distance cases.
Metals 08 00836 g017
Figure 18. (a) Mises stress, (b) tensile stress, (c) normal stress, (d) shear stress distribution on the contact surface for different inclusion size cases.
Metals 08 00836 g018
Figure 19. (a) Mises stress, (b) tensile stress, (c) normal stress, (d) shear stress distribution on the contact surface for different inclusion shape cases.
Metals 08 00836 g019
Table 1. The original material properties involved in this paper.
MaterialModulus (GPa)Poisson’s Ratio
Aluminum alloy 2024-T372.10.33
A l 2 CuMg 120.50.2
A l 2 O 3 3800.2
Table 2. All the cases involved in this study.
NumberVolume RatioTypeSize (µm)Aspect Ratio E ( GPa ) μ
Case 14%Al2CuMg44173.70050.32584
Case 22%Al2O344174.2690.32791
Case 34%76.6150.32579
Case 46%78.29460.3243
Case 54%Al2O323176.55240.32503
Case 66576.50460.32537
Case 74%Al2O353.8891.576.3180.3256
Case 862.225276.1630.32255
Case 94%Al2O323 to 65176.20280.32532
Case 104%Void44169.10.327

