Article

Anodic Bubble Behavior in a Laboratory Scale Transparent Electrolytic Cell for Aluminum Electrolysis

School of Metallurgy, Northeastern University, 3-11 Wenhua Road, Heping District, Shenyang 110819, China
*
Author to whom correspondence should be addressed.
Metals 2018, 8(10), 806; https://doi.org/10.3390/met8100806
Submission received: 10 September 2018 / Revised: 29 September 2018 / Accepted: 1 October 2018 / Published: 9 October 2018

Abstract

:
In the Hall-Héroult process for extracting aluminum, the evolution and dynamics of anodic bubbles have a significant influence on the efficiency of the overall electrolysis process. In this study, the behavior of the bubbles beneath the carbon anode in cryolite-alumina molten salt was studied for the first time using a laboratory-scale transparent electrolysis cell to view the anode from the bottom. The bubble dynamics and the relevant characteristic parameters of bubbles were obtained using video cameras and image processing. It was found that the bubbles were observed to preferentially generate at several areas on the underside of the anode and the morphologies of coalesced bubbles show excellent similarity. Moreover, the behavior of gas on carbon and graphite anodes was significantly different, where the carbon anode favored the forming of larger bubbles. These observations confirmed different types of carbon anodes cause different bubble behavior. These findings are expected to be useful in optimizing the aluminum electrolysis process on an industrial scale.

1. Introduction

The Hall-Héroult electrolytic process has been the most common method for primary aluminum production since its invention in 1886 [1]. In this method, alumina is fed into a molten cryolitic electrolyte at 1203–1233 K. Carbon is employed as both the anode and cathode materials and electric current is applied through the anode to the underlying cathode. As the electrochemical reactions take place, liquid aluminum is reduced at the cathode and is deposited at the bottom of the cell, creating a separate fluid layer between the carbon cathode and the molten cryolitic bath. Simultaneously, oxide ions from the dissolved alumina discharge on the surface of the anode, forming the gas (mainly CO2 bubbles) which subsequently releases from the bottom surface of the anode. The overall theoretical cell reaction is as follows:
2 Al 2 O 3 + 3 C 3 CO 2 + 4 Al
The gas bubble generated on the bottom surface of anode has multiple effects on the electrolysis process. The motion of the bubble is the main driving force for the flow of the molten electrolyte in industrial cells [2,3], greatly enhancing heat convection and accelerating the dissolution rate of alumina [4]. However, in practice, some gas bubbles remain adhered to the anode before growing large enough to escape. Thus, the bottom surface of the anode is always partially covered by gas bubbles, which results in an additional contribution to the overall cell voltage. According to Haupin et al. [5], the extra voltage drop caused by the presence of the bubbles is about 0.15–0.35 V, which is about 4–8% of the total cell voltage. It is believed that the gas bubbles increase cell voltage by primarily increasing both ohmic resistance of the electrolyte and anodic overpotential [6]. In addition, the release of bubbles induces disturbances to the electrolyte-metal interface, causing a loss of current efficiency [7,8]. Therefore, a detailed understanding of bubble formation and release mechanisms is necessary for better control of the electrolysis process.
It is very challenging to carry out direct measurement on bubble behavior in industrial reduction cells due to the high temperature and highly corrosive nature of molten cryolite. Early studies were generally based on water models and computational simulation. The water model [9,10,11,12] is a good alternative and an adequate method for studying bubble dynamics in cell-scale research, particularly in the area of bubble induced flow. It is widely accepted that the air−water system is able to represent the CO2−cryolite system because of the similar kinematic viscosity of water to cryolite. However, in these studies, the “anode gas” is produced by injecting air underneath the anode surface, which is different from the actual occurrence in the real cell. Therefore, it is uncertain whether results obtained from water models can be directly applied to an industrial cell. With advances in computing speed and the improvement of software, a numerical model [13,14] has been developed for predicting bubble behavior. The advantage of numerical modeling is that it provides a cost-effective way to gain a detailed understanding of a complex process. However, the simulation result is closely related to the input parameters which are always obtained from physical experiments.
In order to make observations of bubble behavior similar to industrial cell environments, the laboratory transparent electrolysis cell, also called “see-through cells”, has been developed. The cell [15,16,17] is constructed of a quartz material which is able to hold the molten electrolyte for more than two hours without leakage. The electrolysis process is recorded by cameras placed close to a window. It is clear that a bubble layer is present under the anode. With this method, the gas bubbles are generated by the same electrochemical reaction as in an industrial cell. While the size of the transparent cell is an obvious weakness of this method, where the anode size is only a few centimeters, it is acceptable for the purpose of studying bubble generation and the coalescence mechanism within local areas.
Recently, Zhao et al. [18] improved transparent electrolysis cell design by introducing a second observation window, making it possible to observe beneath the anode. Important information, such as bubble shape, bubble coalescence and bubble coverage under the anode, were obtained. It was reported that gas coverage on the anode decreased with increasing current density. In addition, the voltage fluctuation first increased with increasing current density and then decreased above 0.9 A·cm−2. Zhao et al. [19] investigated the effects of anode slots on bubble behavior and cell voltage. They found that anode slots with a width of 4 mm were able to prevent smaller bubbles from coalescing into larger ones, thus decreasing bubble size and gas coverage on the anode. However, in those studies, the anodes were made of graphite, different from the carbon material used in industrial reduction cells. Several experiments reported that the shape and motion of the bubbles are strongly influenced by the properties of the anode material. Using a graphite anode and two carbon anodes, Kasherman and Skyllas-Kazacos [20] found that the bubble contribution to the effective bath resistivity was less for a carbon anode with a large coke fine fraction and porous appearance. Similar to Kasherman and Skyllas-Kazacos [20], Thorne et al. [21] found that there were significant differences in bubble behavior between graphite and carbon anodes using electrochemical techniques.
This study presents detailed observations of bubble dynamics under the carbon anode using a transparent electrolysis cell. In addition, a graphite anode was included for comparison. Bubble behavior, including bubble generation, growth and release, on the two different anodes was compared and discussed in detail. A comparison of the surface properties of the anodes was also carried out to explain the very different gas behavior observed.

2. Experimental Details

2.1. Materials and Chemicals

The composition of the electrolyte used in these experiments was 45.7 wt% NaF, 41.8 wt% AlF3, 3.5 wt% Al2O3, 4.0 wt% CaF2 and 5.0 wt% LiF, with a cryolite ratio of 2.2 (molar ratio of NaF to AlF3). All reagents were high purity (>99.5%) and dried at 673 K for 3 h before use.
Two types of anodes made of different carbon materials were used in this study. One was cut from a new industrial carbon anode produced by the Aluminum Corporation of China (referred to as the carbon anode) and the other was made of high-purity graphite provided by the Shenyang Graphite plant, China (referred to as the graphite anode). The two anodes were prepared with the same geometry (50 mm × 22 mm × 70 mm) and dried at 110 °C (383 K) for 48 h and polished with #2000 sandpaper before use. To ensure that the anodes reached a stable state, the data and images were recorded after 10 min after the electrolysis started. The detailed physicochemical properties of the two anodes are listed in Table 1.

2.2. Transparent Aluminum Electrolysis Cell

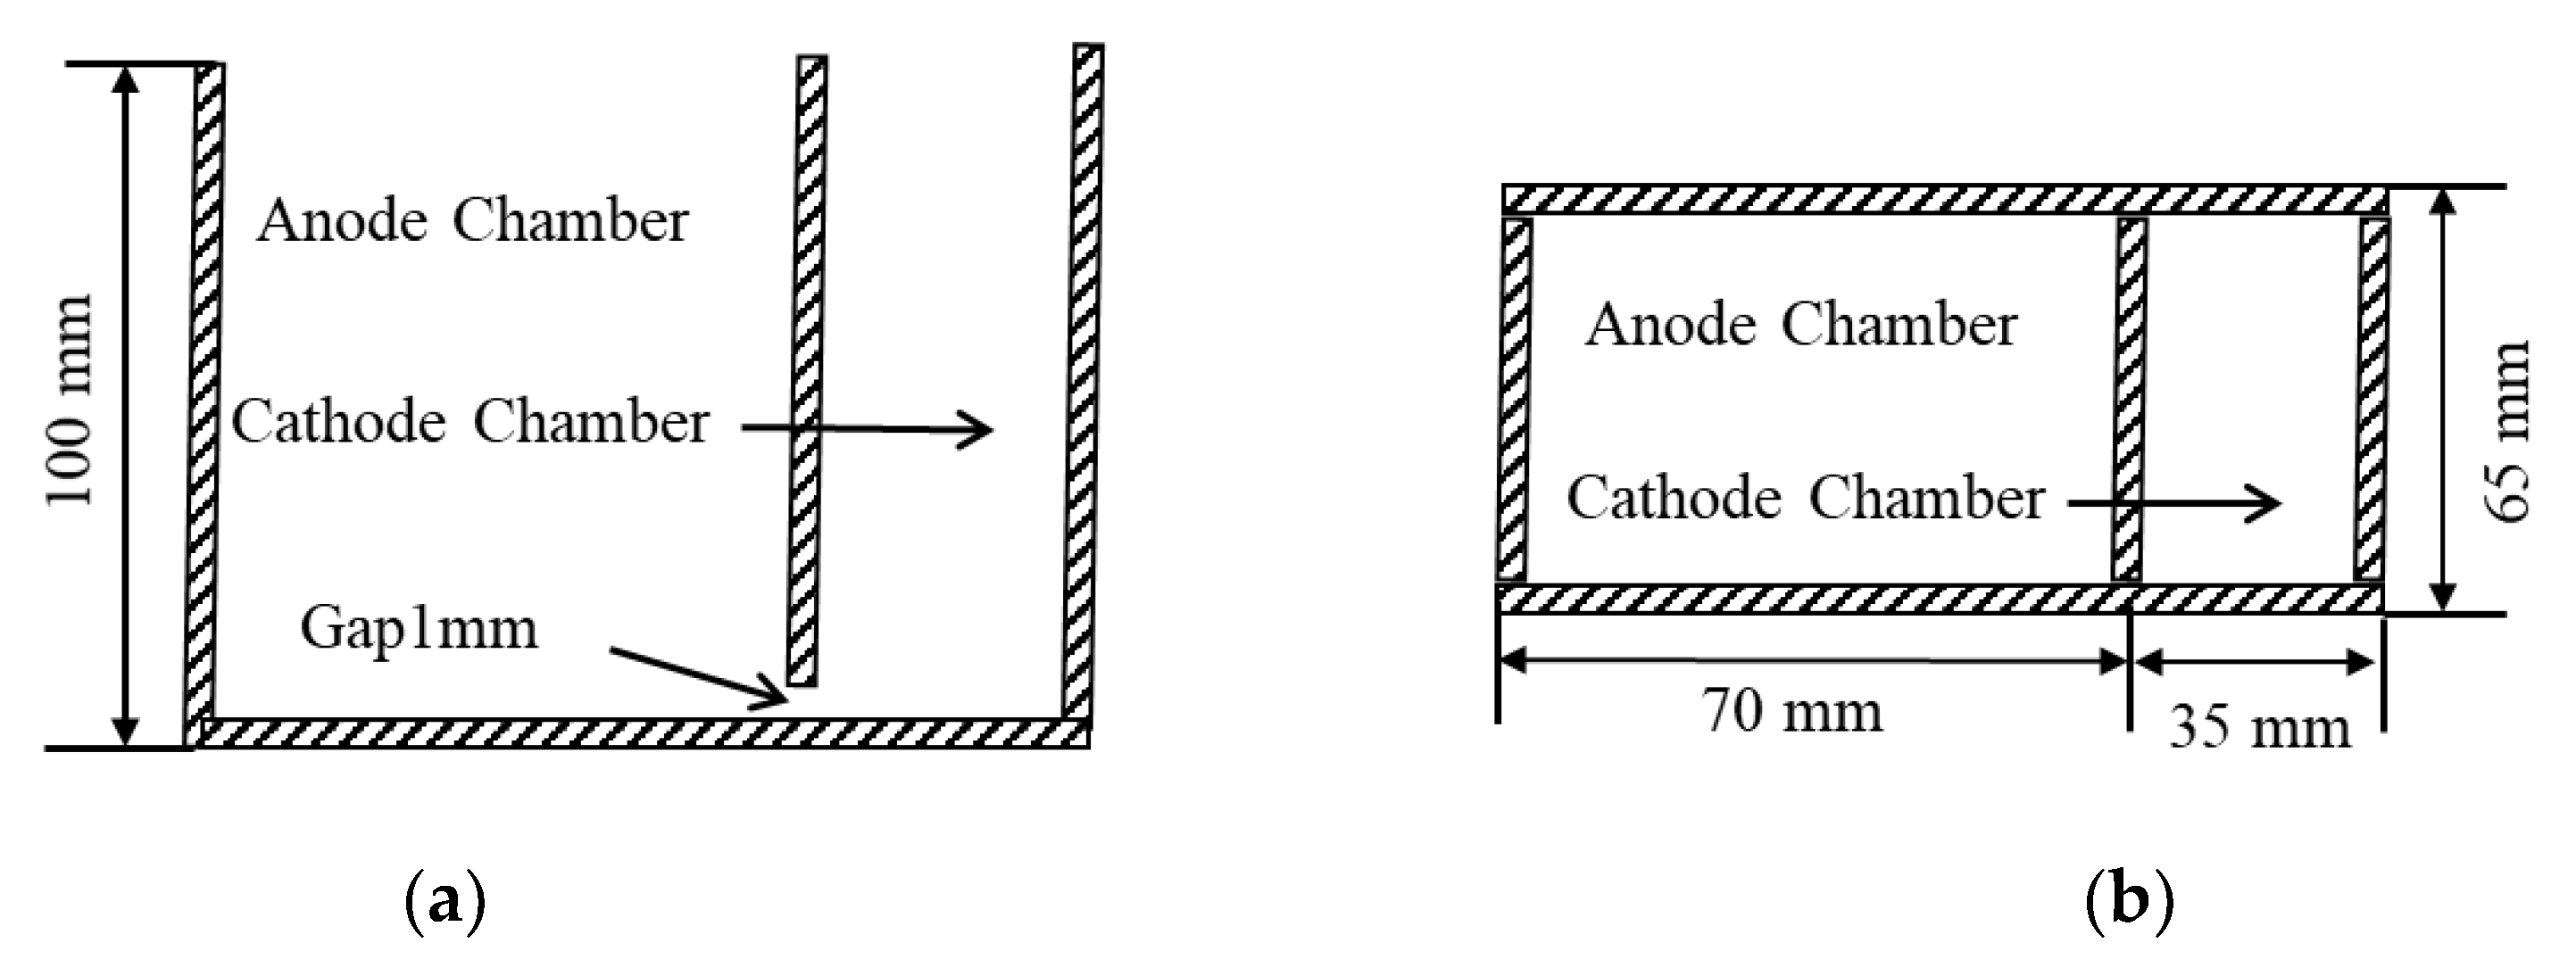
The experimental setup for observing anodic bubble behavior was a transparent electrolysis cell, as shown in Figure 1. An additional window at the bottom of the furnace was included for visual observation and imaging of the bottom surface of the anode during the experiment. A double-chamber quartz crucible with a wall thickness of 3 mm (Figure 2) was used as the container for the molten electrolyte. The anode and cathode were positioned in their respective chambers, which were connected via a narrow gap (1 mm width) at the bottom of the separating wall. Zhao et al. [18] confirmed that the design of the double-chamber crucible enabled essentially uniform current distribution on the underside of the anode. A DC power supply (MPS702, Tradex Electronic Technology Corp, Beijing, China) was used to supply current for electrolysis. The maximum voltage range for this power supply unit is 50 A. A temperature controller (CKW-3100, Chaoyang Automated Instrumentation Works, Beijing, China) was used for measurement and controlling the temperature of the furnace. A sunlamp was used at the rear window to provide back lighting and two industrial cameras (MV-VS078FC, MicroVision Company, Xi'an, China) were positioned at the front and bottom windows of the furnace to record the electrolysis process in the double-chamber crucible.
The weight of the electrolyte in each experiment was 900 g, with a molten bath height of 70 mm. The temperature of the molten electrolyte was controlled at 1215 ± 2 K, providing a superheat of about 20 K. The anode immersion depth was fixed at 25 mm. A constant current during electrolysis process was provided. The experiments were conducted at various anodic current densities ranging from 0.7 to 1.1 A·cm−2. The images were recorded at 30 frames per second, and the recording time at each current density was 2 min. It should be noted that the current density was calculated from the applied current and anode bottom area (50 mm × 22 mm, since some current went through the anode sidewalls, so the effective current density at the anode bottom was smaller than the indicated current density value). In our experiment, it was also observed that bubbles generated on sidewalls, indicating there is a non-negligible portion of current flowing out of the sidewalls.

2.3. Image Processing

Image processing was used to extract quantitative information from recorded images, including the shape, coverage and layer thickness of the bubbles. This process was described in detail in our previous work [18,19], and only a brief introduction is given here.
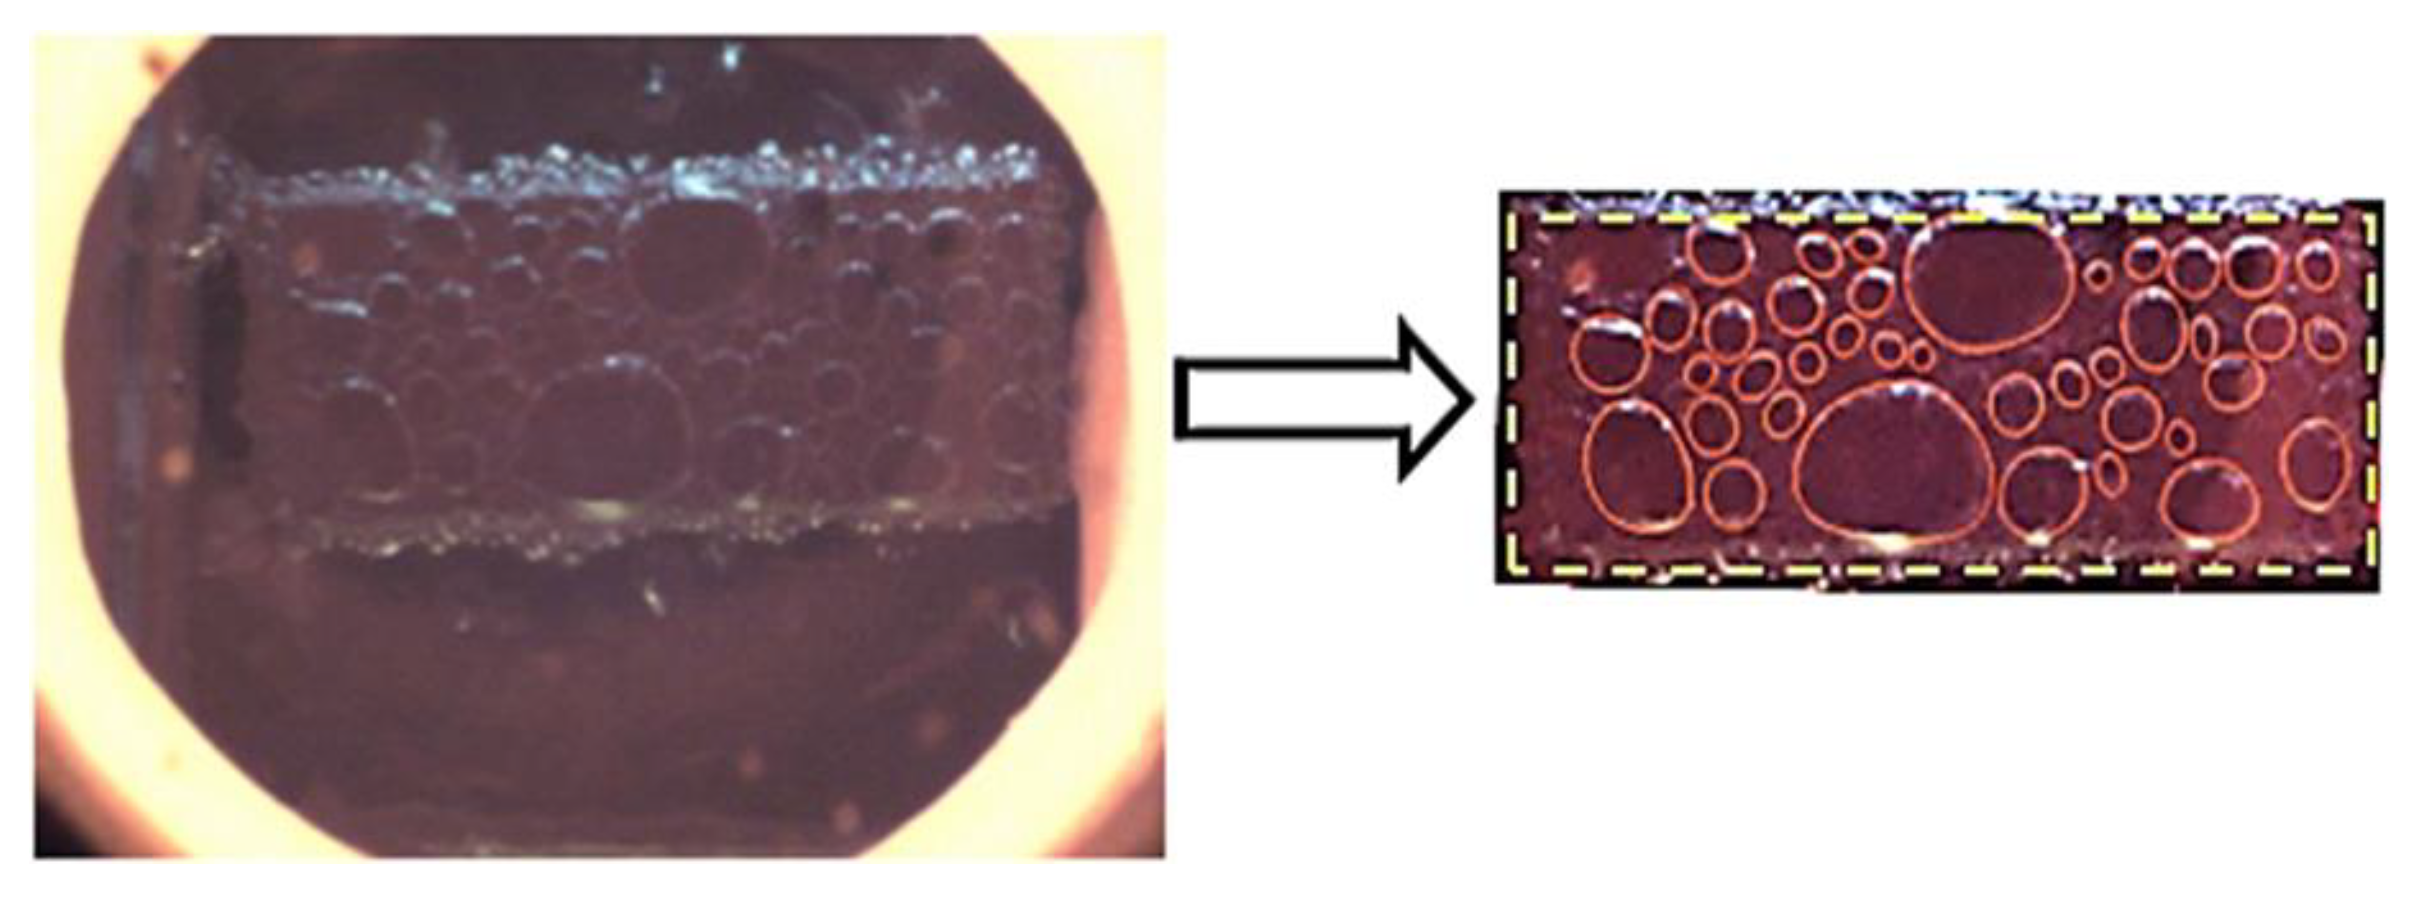
Image processing software “Image Pro-Plus 6.0” (Media Cybernetics, Rockville, MD, USA) was used to extract and mark the bubble edge. An illustrative example is shown in Figure 3. After image processing, the border of each bubble becomes clear as demonstrated in Figure 3. The covering area of the bubble underneath the anode was then calculated using the pixel information of the image. The instantaneous coverage on the anode was obtained using Equation (2). However, bubbles smaller than 0.5 mm in diameter were disregarded due to the quality of images.
φ = i = 1 n S i A a n o d e
where φ is the bubble coverage; Si is the area of the ith bubble; Aanode is the area of the anode bottom.
The mean value of bubble coverage at a fixed current density was calculated according to Equation (3).
φ ¯ = 1 m k = 1 m φ k
where m is the number of samples; φk is the bubble coverage of sample k.
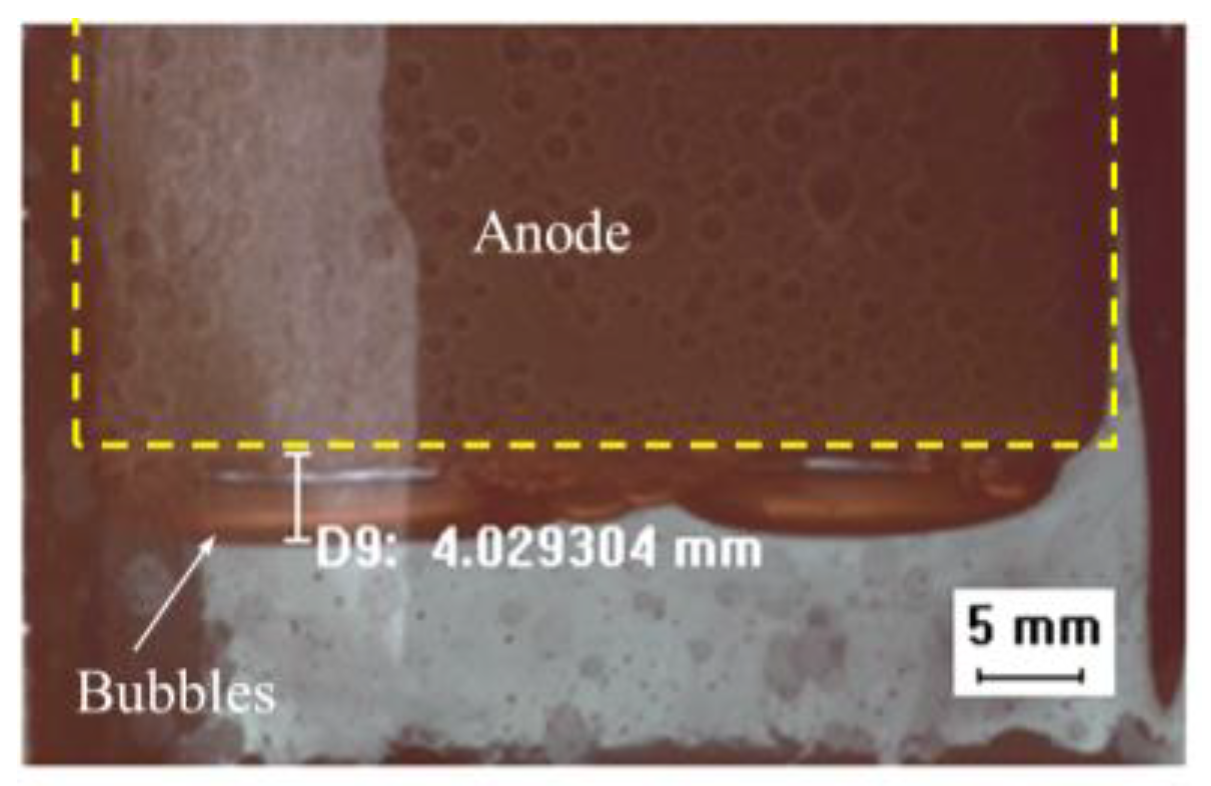
The thickness of the bubble layer was measured from the images recorded from side-view windows, as is shown in Figure 4.

3. Results and Discussions

3.1. Bubble Generation-Growth-Releasing Process

According to our observations, the bubble evolution process could be divided into four stages, bubble formation, growth, coalescence, and finally release; this is termed bubble lifetime and is thoroughly discussed in [9,15,16]. Figure 5 shows representative images of the bubbles on the two different anodes at current density of 0.7 A·cm−2.
Some obvious differences could be observed by comparing bubble morphology on two kinds of anodes as shown in Figure 5.
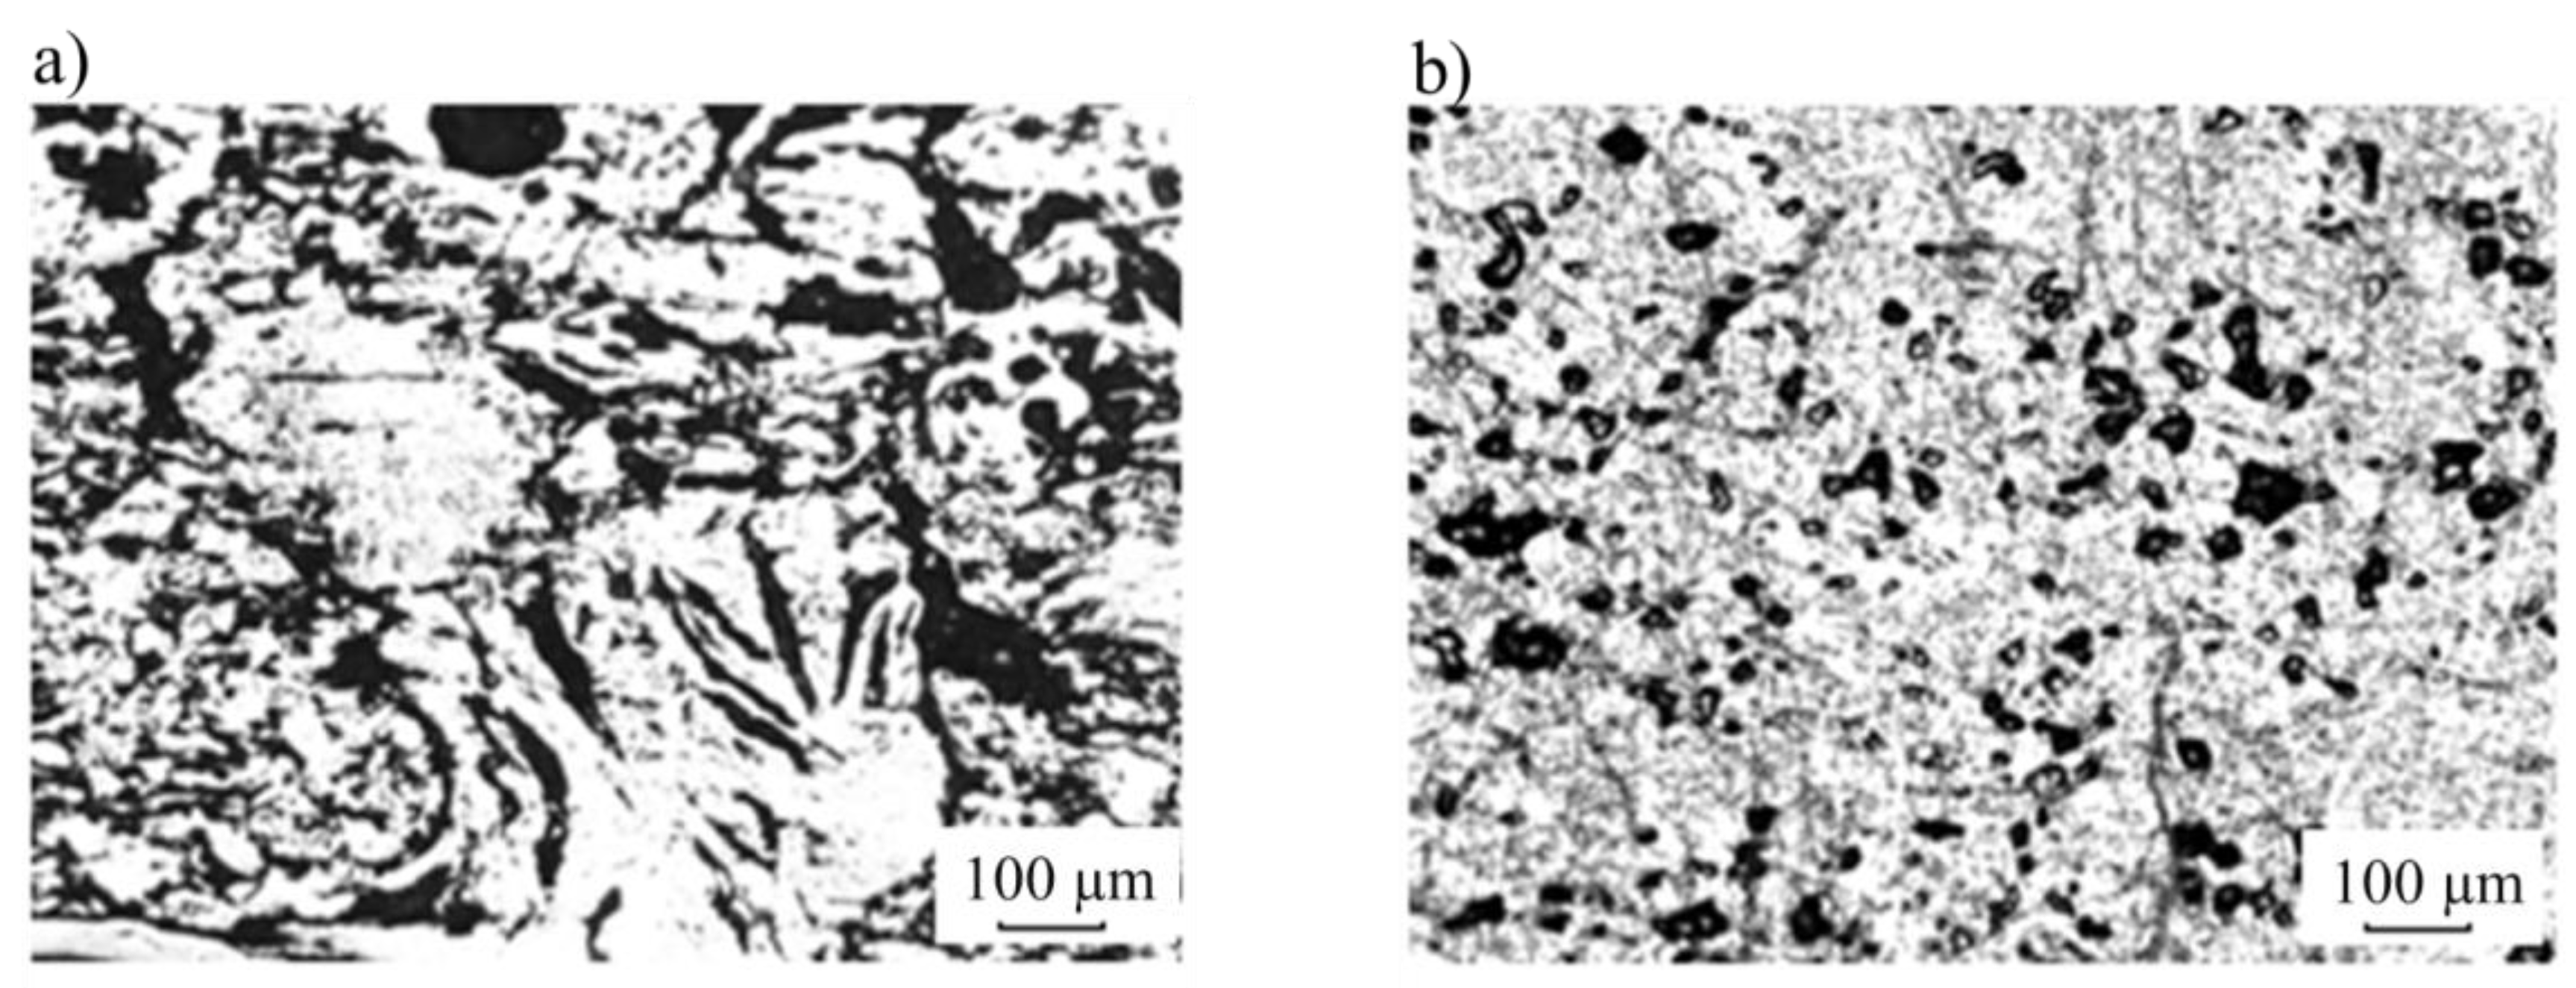
The images at 0.5 s (stage 2) display the initial stage in the lifetime of a bubble. There were a higher number of small size bubbles on the graphite anode than on the carbon anode, indicating more difficulty forming large bubbles on the graphite anode under the same conditions. This might be due to the higher porosity of carbon anodes (Figure 6). Anodes with higher porosity have more bubble nucleation sites because of pores which are considered active sites for bubble nucleation [23,24]. Therefore, compared to the graphite anode, bubbles generated on the carbon anode have a higher possibility of contact and coalescing into large bubbles.
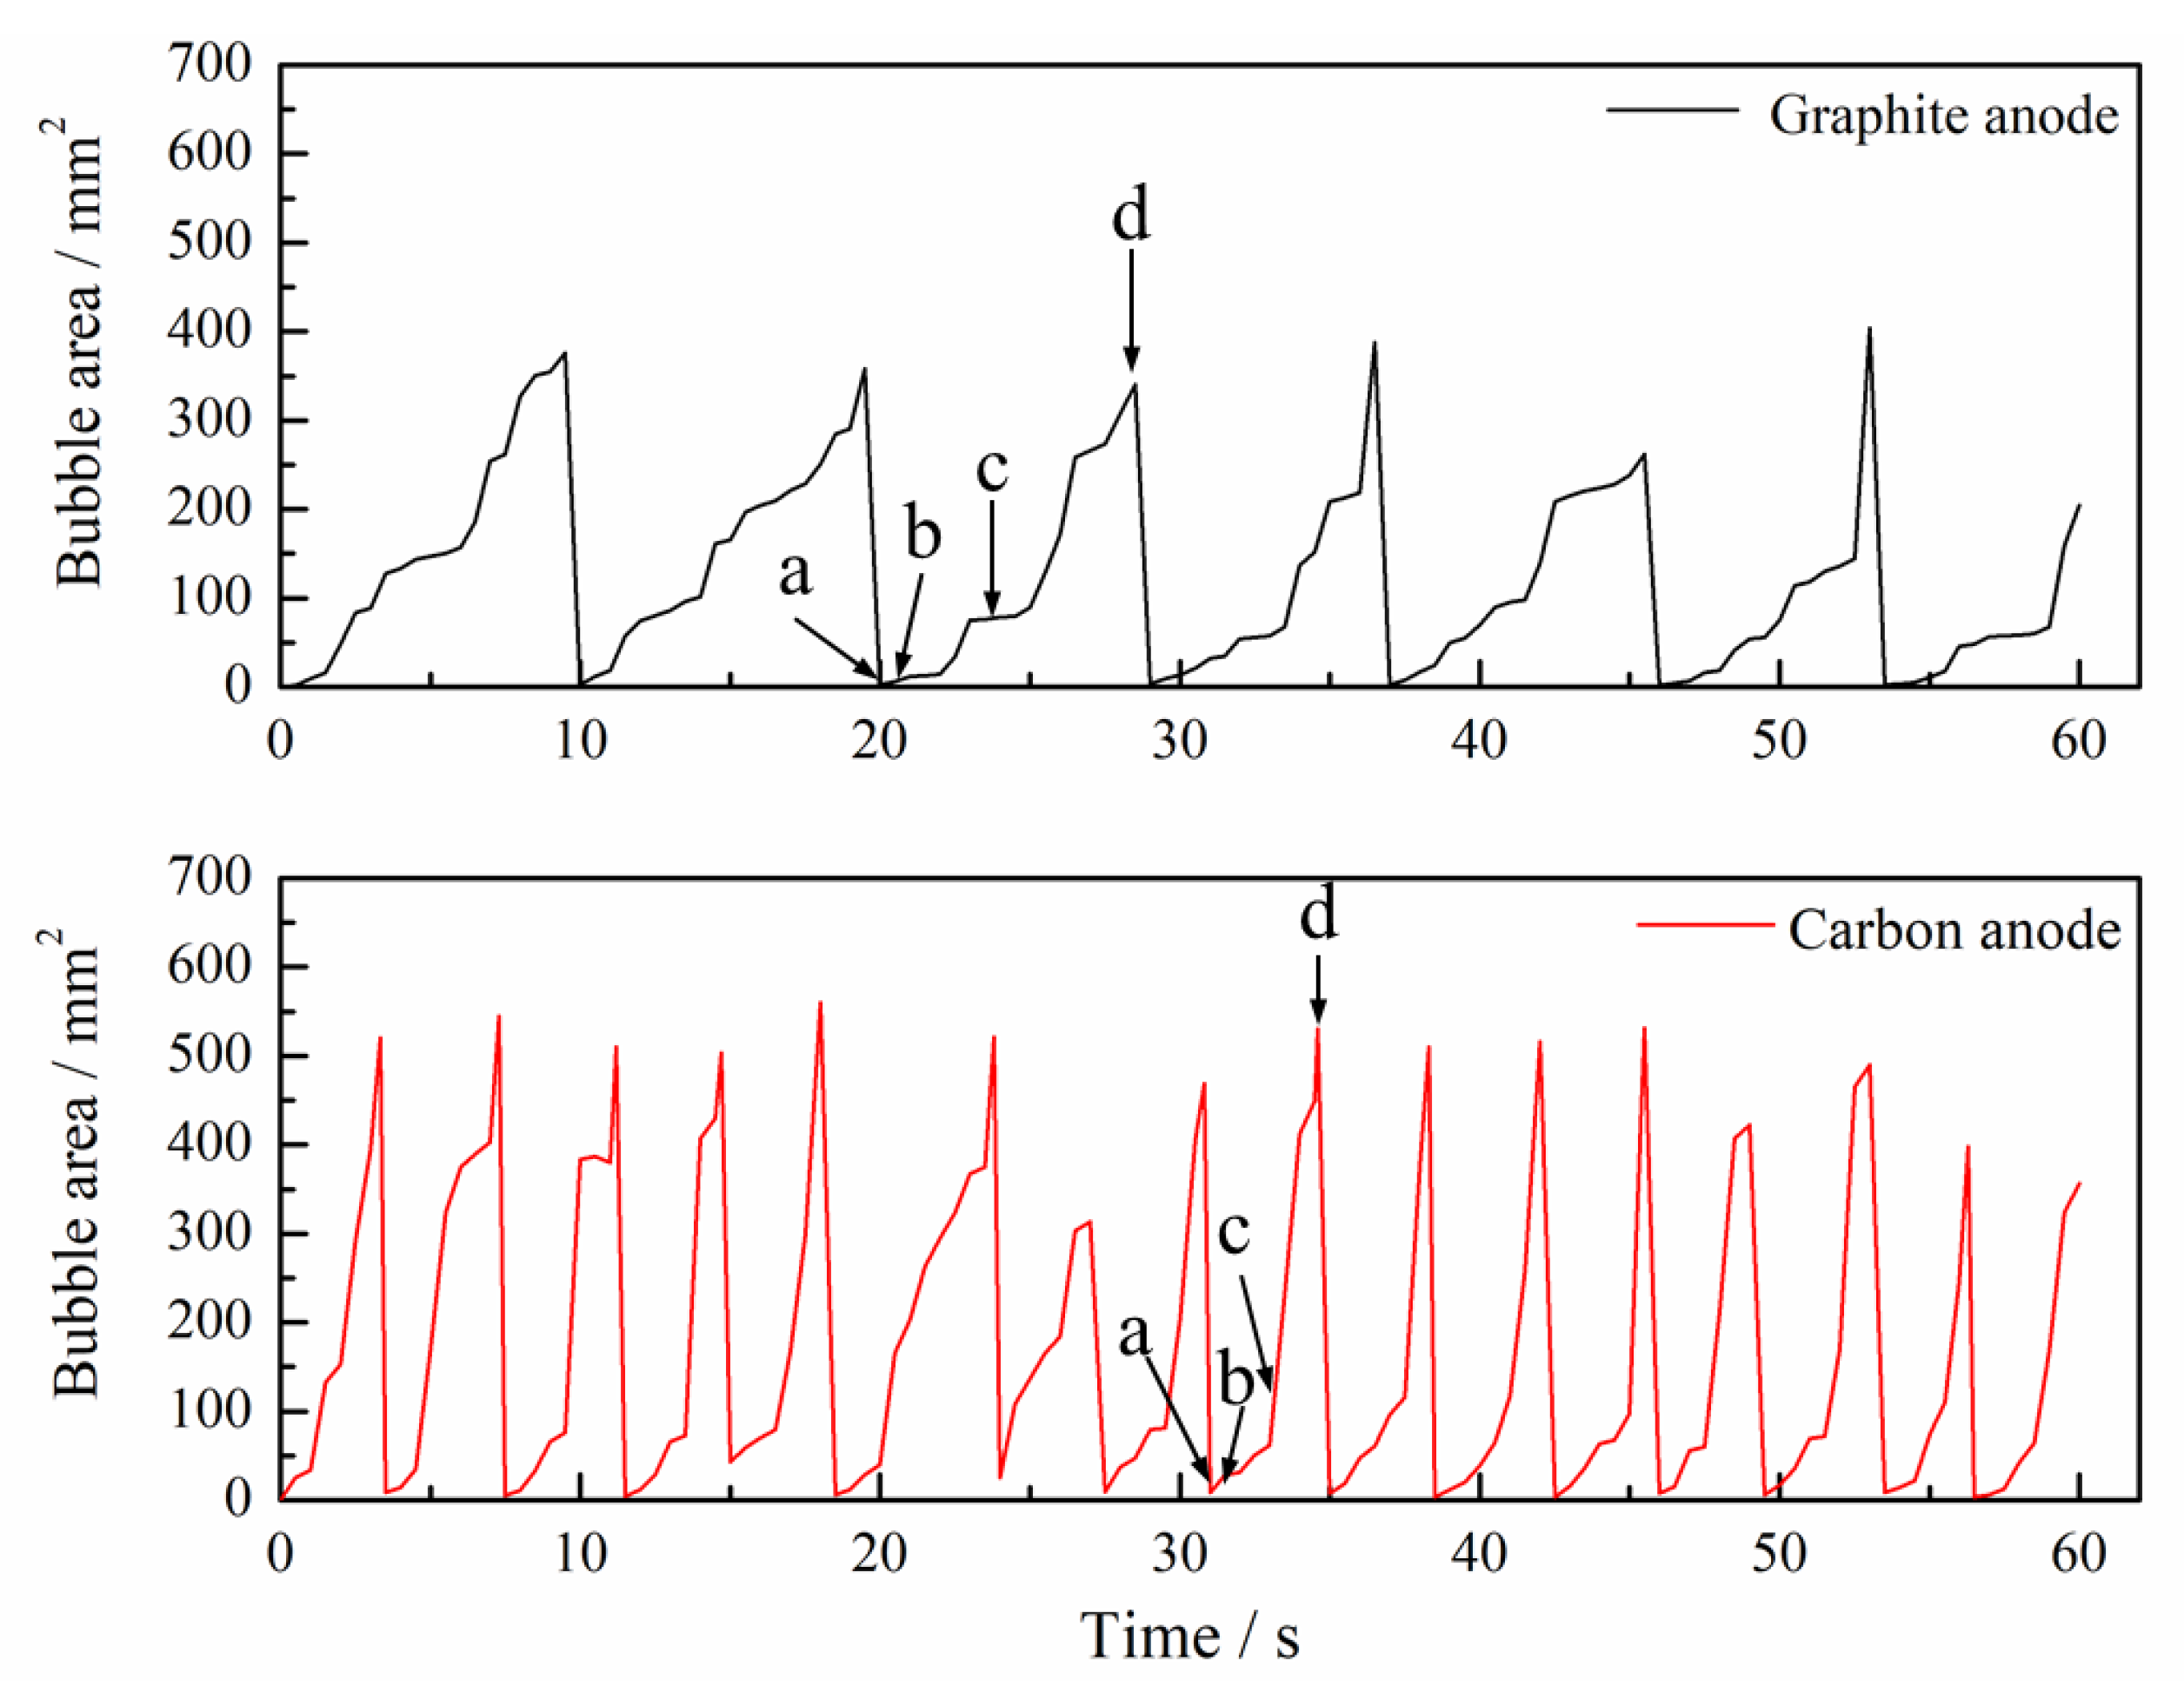
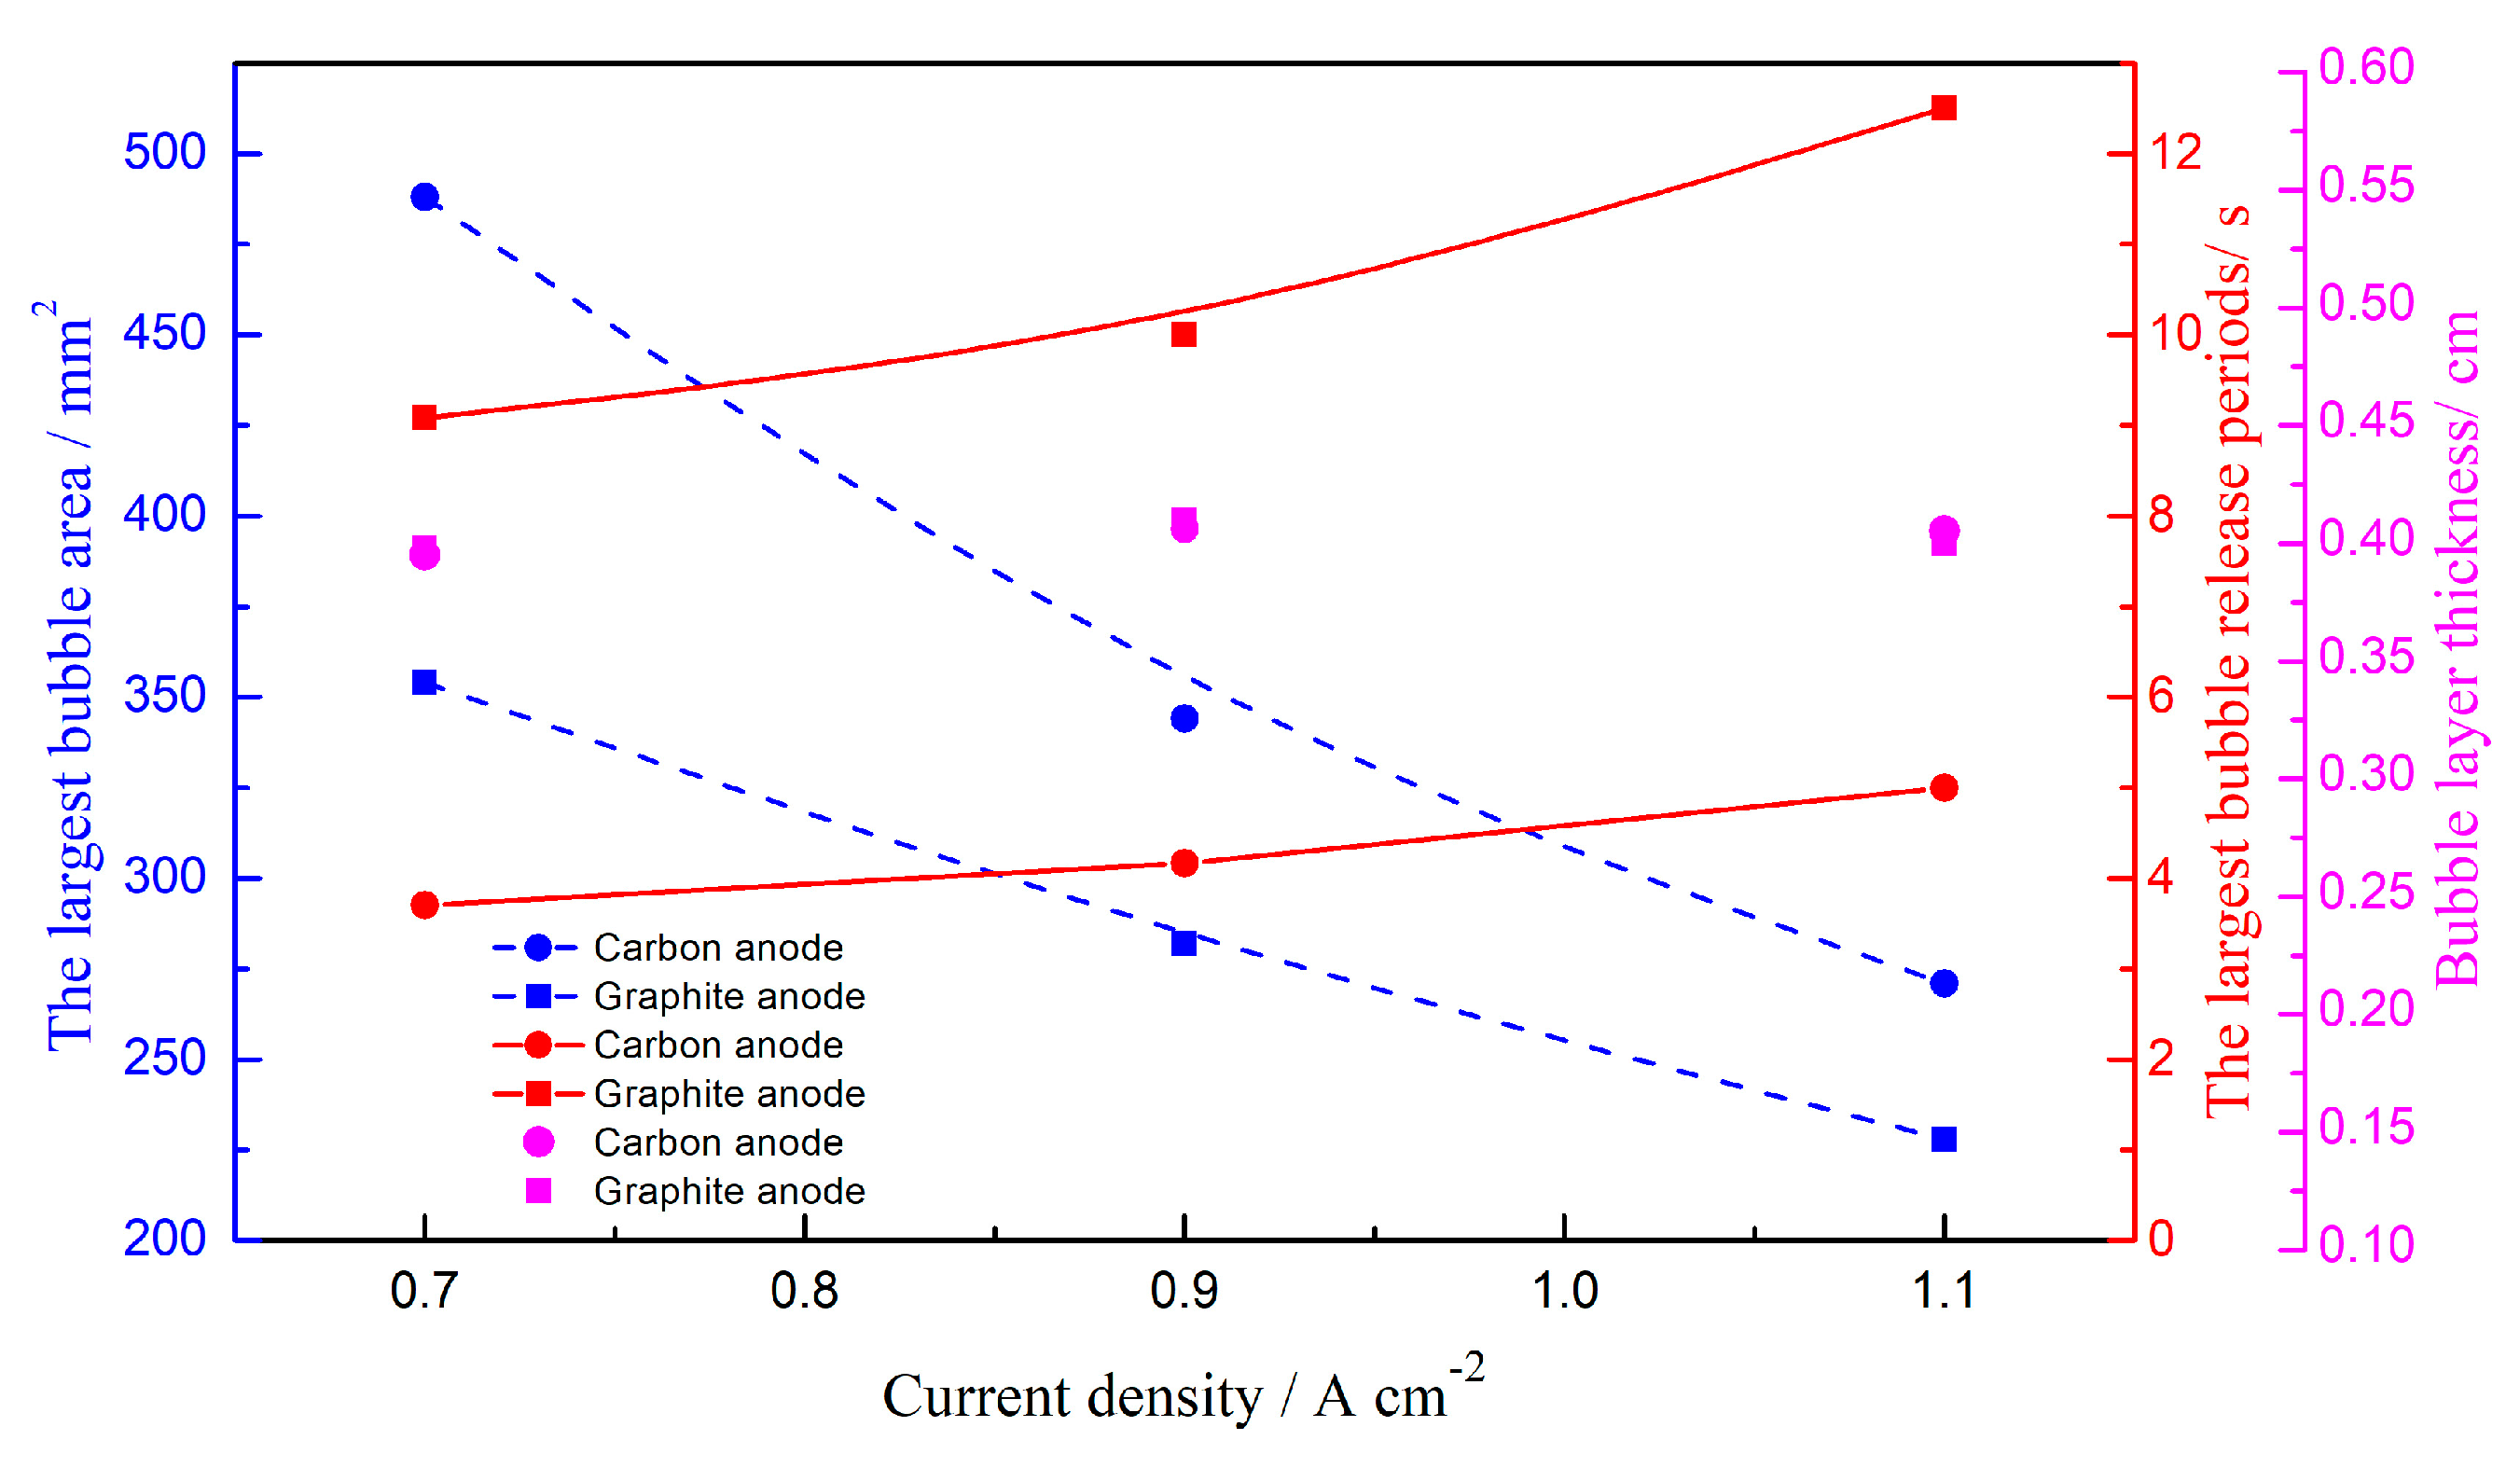
At the final stage just before release (stage 4), both anodes were covered with one or more large bubbles. The evolution of the largest bubble was analyzed using image an processing method in a period of 60 s and plotted as in Figure 7. It appeared that the critical size of the largest bubble on the carbon anode is larger than that of the graphite anode. The releasing frequency of the largest bubble on the carbon anode is almost three times that of the graphite anode. In other words, the formation speed of the largest bubble on the carbon anode was almost three times that on the graphite anode. It must be noted that some small and medium bubbles released on the graphite anode before forming the largest bubble. This could explain the difference in the volume of gas which was evolved as shown in Figure 7. Similar phenomenon was also observed under higher current densities as is shown in Figure 8. Figure 8 also shows that higher current densities lead to lower bubble size, which has been confirmed by our previous paper [18].
As described above, the carbon anode favored the evolution of larger bubbles compared to the graphite anode. Our observations confirmed previous studies [20,21].
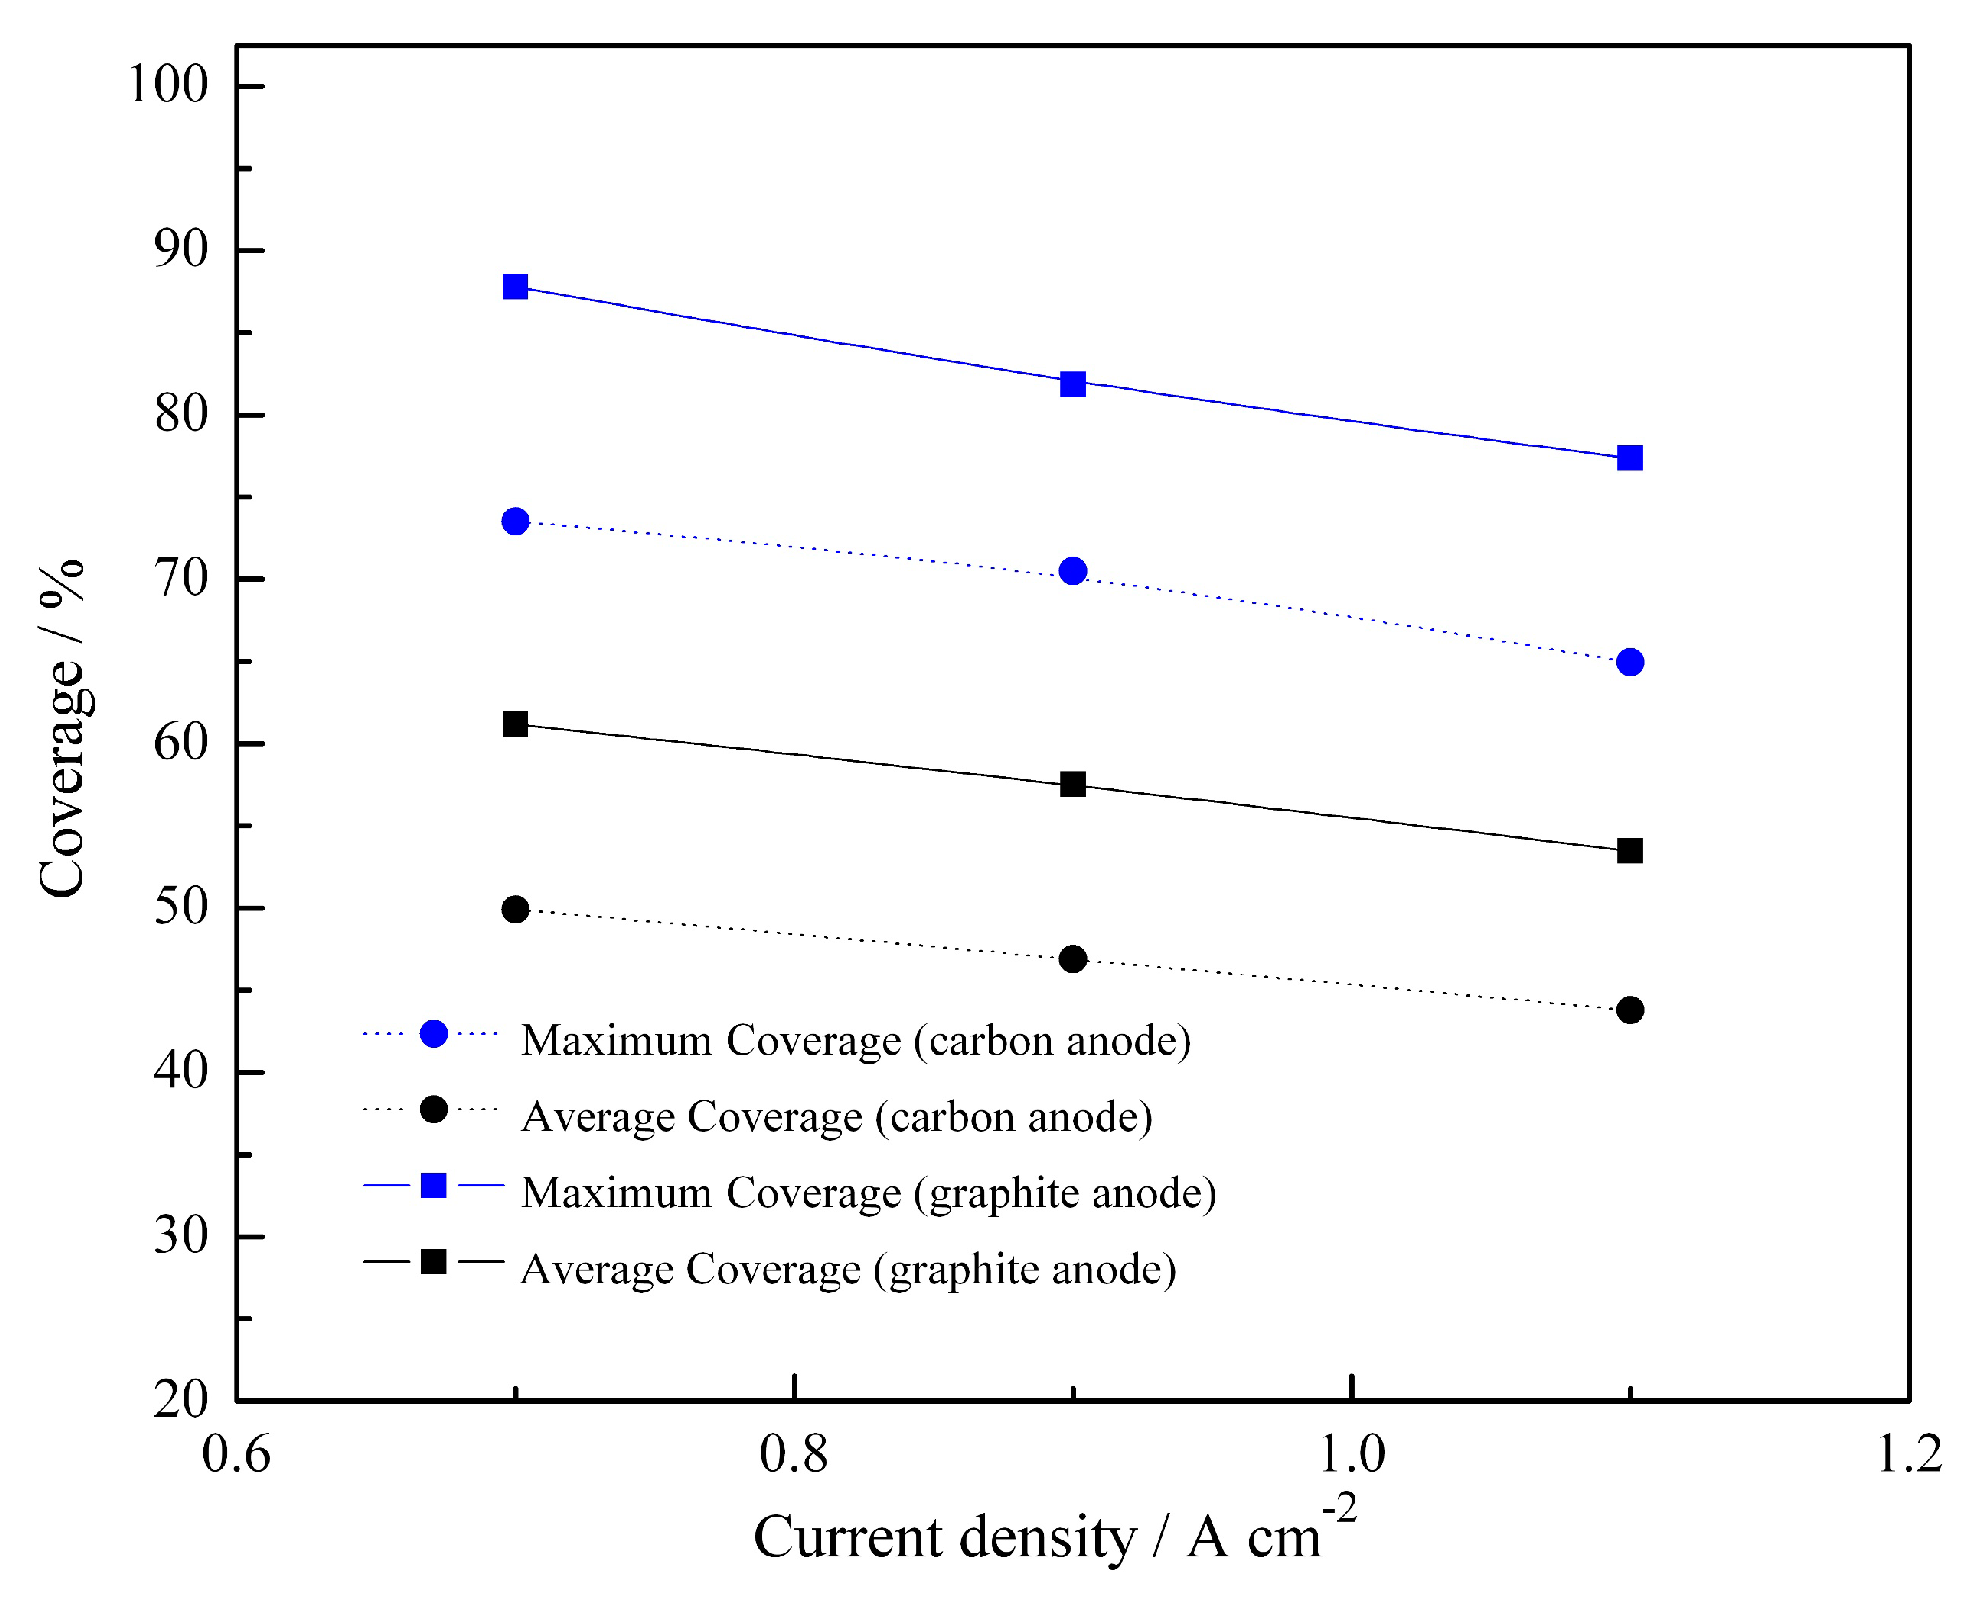
Gas coverage is known to be important in the aluminum electrolysis process. The area on the anodes covered by bubbles is practically insulated while the uncovered area will compensate for this by increasing local current density. This increase in local current density leads to hyperpolarization. Figure 9 illustrates the relationship between bubble coverage and anodic current density on the two types of anodes. The current densities range from 0.7 A·cm−2 to 1.1 A·cm−2. It is interesting to see from Figure 7 that the average coverage and maximum coverage on the graphite anode were both obviously higher than that on the carbon anode. At a current density of 0.7 A·cm−2, the average coverage and maximum coverage of carbon anode were 49.93% and 73.54% respectively, while for the graphite anode, these values displayed as 61.19% and 87.83%, respectively.
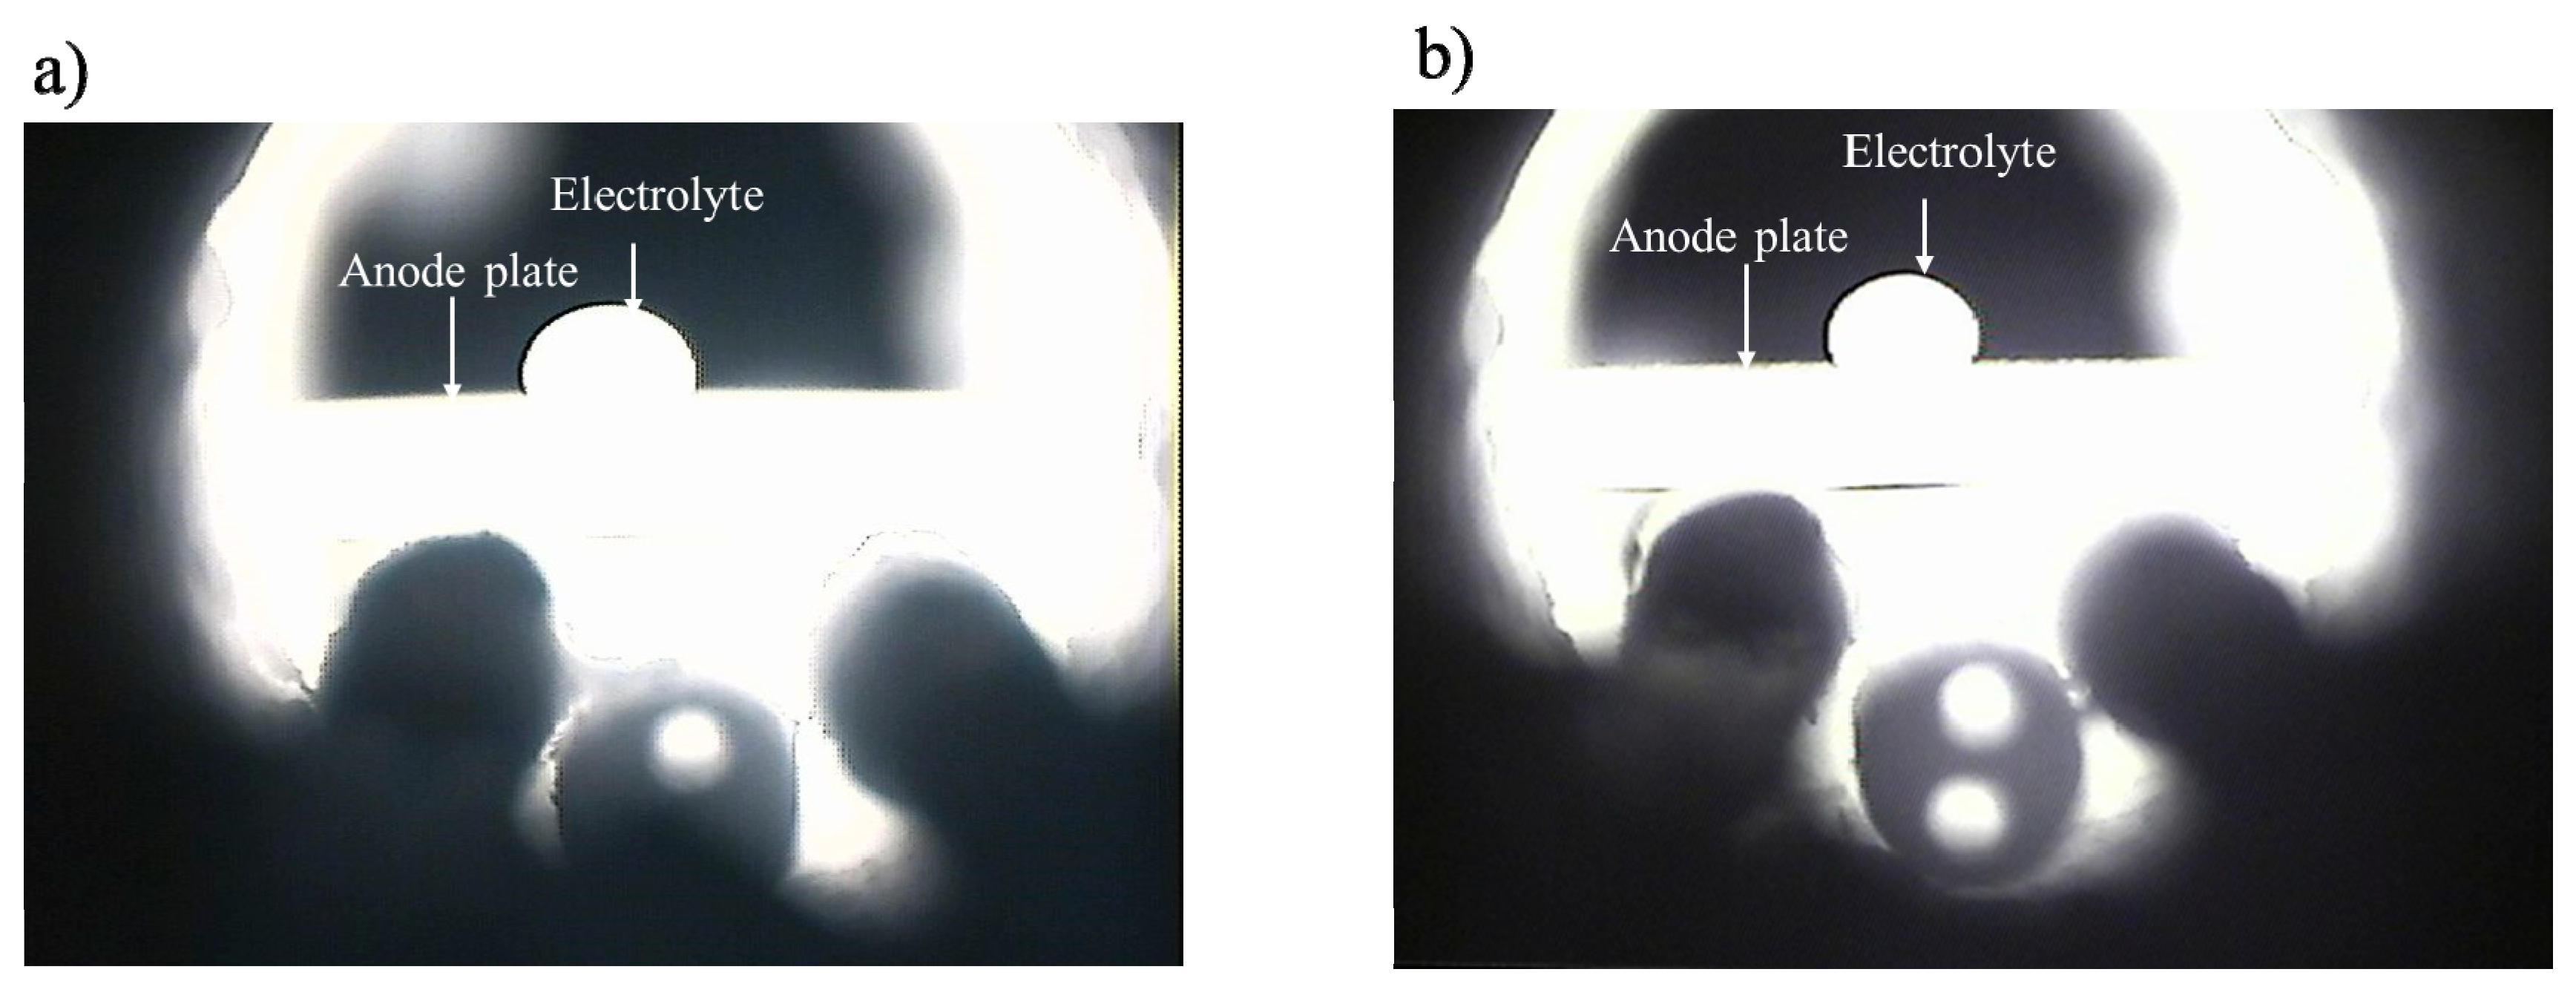
It is widely accepted that the wettability of the electrolyte on the anode has a significant effect on bubble behavior. To assess the wettability of the electrolyte on the two different anodes, a sessile drop experiment was carried out. The experimental setup used in this work has been described in a previous publication [25]. An electrolyte particle (see Experimental Details section) weighing about 0.5 g was initially placed on the horizontal sample and heated to around 1215 K in an argon atmosphere. A video camera was used to record the morphology of the electrolyte on the sample. The results are shown in Figure 10. It can be seen that the anode-electrolyte wettability was poor for both anodes. Therefore, we can exclude wettability as the reason for the different gas behavior observed for the two kinds of anodes.
The plant carbon anodes are composites of three different materials each with substantially different heat treatment, while graphitized anodes have fairly uniform properties, having been heat treated to double the temperature of normal anodes. The difference in heat treatment results in quite different physical properties as shown in Table 1. As wetting properties were similar, the differences in bubble behavior between the carbon and graphite anodes may be related to the different surface roughness and porosity. Anodes with different porosity have different true current densities at a fixed geometric current density, and causes different interfacial potential and gas evolution rate.

3.2. Bubble Nucleation

The anodic bubbles are generated at the anode bottom and are released at the anode edges in a cyclic pattern; several studies [9,15,16] reported this observation. However, bubble generation mechanism is quite complex and not well known.
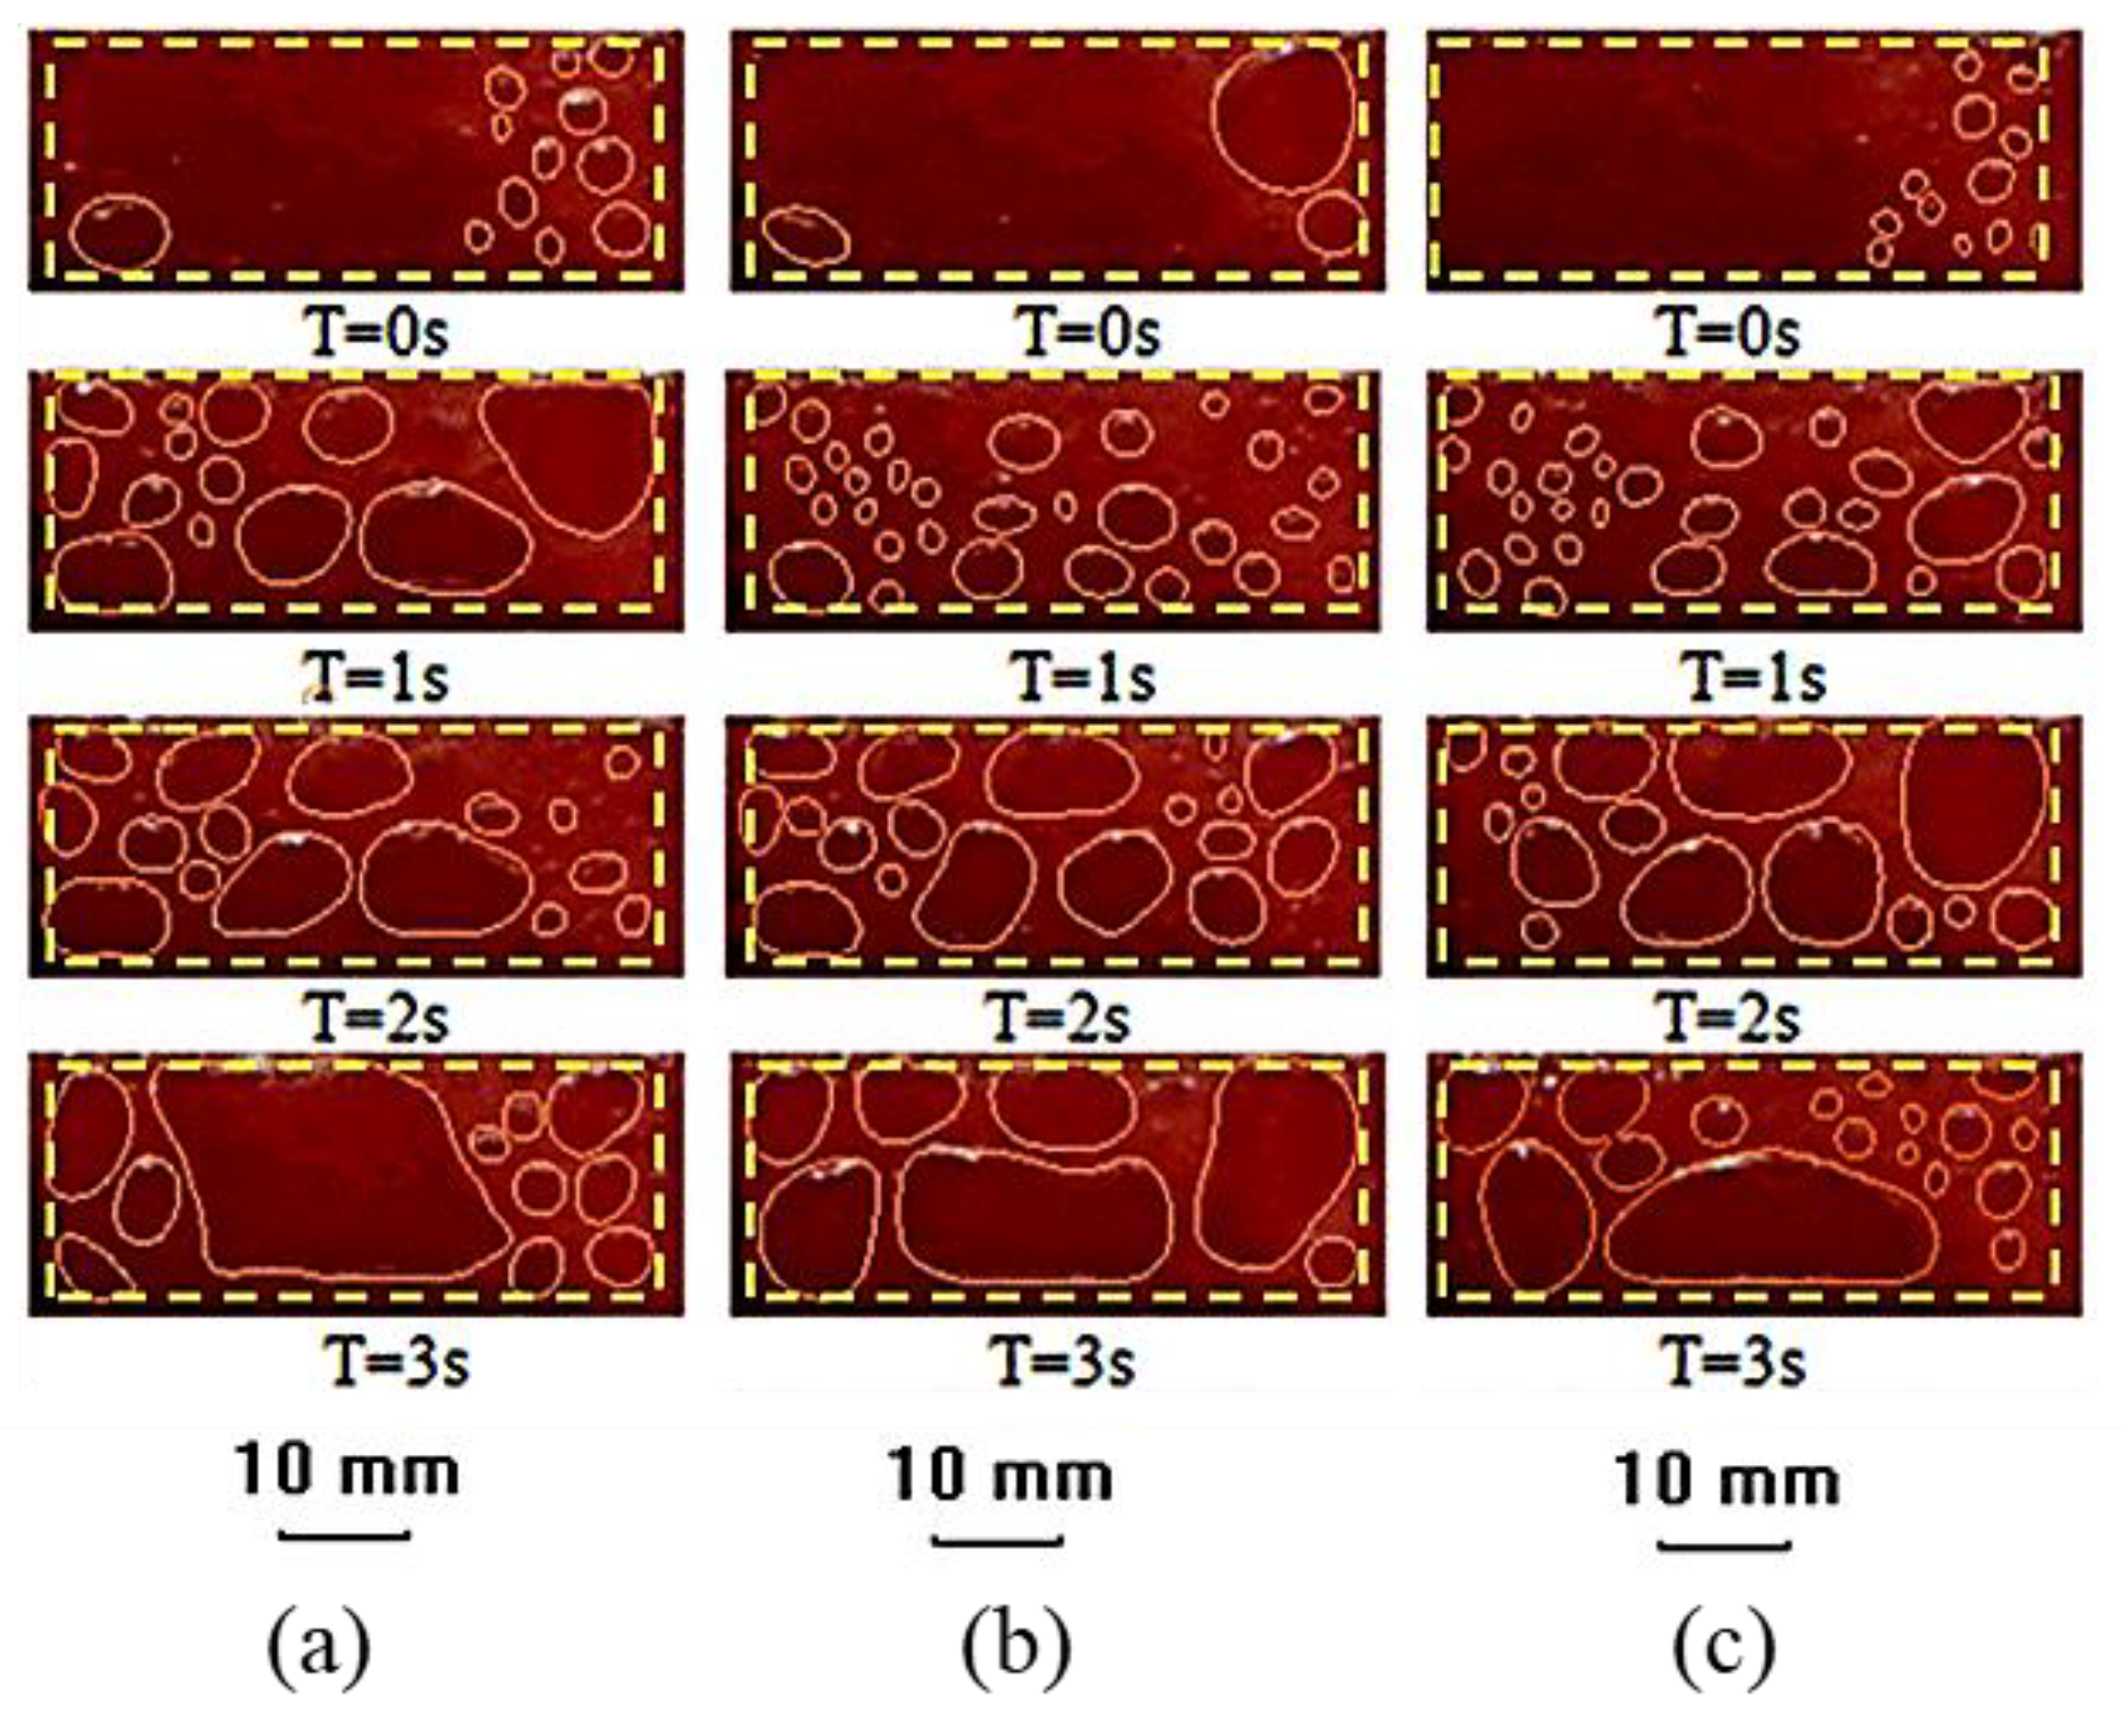
Figure 11 shows some characteristic stages of bubble morphologies on the carbon anode in the period of 3 bubble life cycles at current density of 0.7 A·cm−2. It can be seen that tiny bubbles were observed to preferentially evolve at specific areas on the anode surface. These observations indicate that the bubbles are nucleated periodically at certain sites on the bottom surface of the anode. With those bubbles growing, some new bubbles were generated at clean anode surface among these bubbles, and randomly distributed on the anode surface. This occurred because the presence of initial bubbles on an anode effectively decreases active surface area, which in turn increases real current density. Thus, more and more sites become active. However, these initial bubbles preferred to grow compared to newly generated bubbles. Thus, the sites of these initial bubbles are generally called “bubble nucleation spots”, which may be pores or defect sites on the anode surface.
A variety of coalescence behavior is observed in the bubble lifetime, which was well described in our previous study [18]. Another indication from Figure 11 the locations of coalesced bubbles show a high degree of similarity. This may be correlated with anode surface properties, including porosity and surface roughness.

4. Conclusions

The bubble behavior beneath the carbon anode was studied for the first time in cryolite-alumina molten salt, using a laboratory transparent electrolytic cell to view the anode from the bottom. The bubble generation mechanism, coalescence, and release underneath the anode were observed. The bubbles were observed to preferentially generate at several areas on the underside of the anode. It was found that larger bubbles were formed on the carbon anode with a release frequency of almost three times that of the graphite anode. However, the gas coverage on the carbon anode was lower than that on the graphite anode. The present results confirm that anode properties and performance have a significant effect on the bubble behavior.
The results of this study demonstrate, by appropriate selection of anode cokes and production process, it has the potential to reduce bubble-induced resistance in industrial electrolytic cells.

Author Contributions

Y.H. wrote the original manuscript and helped with experimental work and data analysis. Z.W. and B.G. put forward the proposal and helped with the equipment testing. Y.Y. revised the manuscript. Z.S. and X.H. have discussed the results.

Funding

This research was funded by the National Natural Science Foundation of China (grant no. 51529401, 51434005, 51474060 and 51804069) and the Fundamental Research Funds for the Northeastern University (grant no. N172503015) and The APC was funded by 51434005.

Acknowledgments

The authors would like to acknowledge the financial support from the National Natural Science Foundation of China (grant no. 51529401, 51434005, 51474060 and 51804069) and the Fundamental Research Funds for the Northeastern University (grant no. N172503015).

Conflicts of Interest

The authors declare no conflicts of interest.

References

  1. Grjotheim, K. Textbook of Aluminum Electrolysis: Fundamentals of the Hall- Héroult Process, 2nd ed.; Aluminum-Verlag: Dusseldorf, German, 1982; p. 443. [Google Scholar]
  2. Solheim, A.; Johansen, S.T.; Rolseth, S.; Thonstad, J. Gas driven flow in hall-Héroult cells. JOM 1988, 40, 57. [Google Scholar]
  3. Doheim, M.A.; El-Kersh, A.M.; Ali, M.M. Computational modeling of flow in aluminum reduction cells due to gas bubbles and electromagnetic forces. Metall. Mater. Trans. B 2007, 38, 113–119. [Google Scholar] [CrossRef]
  4. Feng, Y.Q.; Cooksey, M.A.; Schwarz, M.P. CFD Modelling of Alumina Mixing in Aluminium Reduction Cells. In Light Metals 2011; Lindsay, S.J., Ed.; Springer: Berlin, Germany, 2011; pp. 543–548. [Google Scholar]
  5. Haupin, W.E.; McGrew, W.C. A scanning reference electrode for voltage contours in aluminum smelting cells. JOM 1971, 23, 46–51. [Google Scholar] [CrossRef]
  6. Cooksey, M.A.; Taylor, M.P.; Chen, J.J.J. Resistance due to gas bubbles in alumiumum reduction cells. JOM 2008, 60, 51–57. [Google Scholar] [CrossRef]
  7. Haarberg, T.; Solheim, A.; Johansen, S.T. Effect of anodic gas release on current efficiency in Hall-Héroult cells. In Light Metals 1998; Welch, B., Ed.; Springer: Berlin, Germany, 1998; pp. 475–481. [Google Scholar]
  8. Einarsrud, K.E. The effect of detaching bubbles on aluminum-cryolite interfaces: An experimental and numerical investigation. Metall. Mater. Trans. B 2010, 41, 560–573. [Google Scholar] [CrossRef]
  9. Fortin, S.; Gerhardt, M.; Gesing, A.J. Physical modelling of bubble behavior and gas release from aluminum reduction cell anodes. In Essential Readings in Light Metals; Bearne, G., Dupuis, M., Tarcy, G., Eds.; Springer: Berlin, Germany, 1984; pp. 385–395. [Google Scholar]
  10. Vekony, K.; Kiss, K.L. Morphology of two-phase layers with large bubble. Metall. Mater. Trans. B 2010, 41, 1006–1017. [Google Scholar] [CrossRef]
  11. Shekhar, R.; Evans, J.W. Physical modeling studies of electrolyte flow due to gas evolution and some aspects of bubble behavior in advanced Hall cells Part I. Flow in cells with a flat anode. Metall. Mater. Trans. B 1994, 25, 333–340. [Google Scholar] [CrossRef]
  12. Wang, Y.F.; Zhang, L.F.; Zuo, X.J. Fluid flow and bubble behavior in the aluminum electrolysis cell. In Light Metals 2009; Bearne, G., Ed.; Springer: Berlin, Germany, 2009; pp. 581–586. [Google Scholar]
  13. Solheim, A.; Johansen, S.T. Gas induced bath circulation in aluminum reduction cells. J. Appl. Electrochem. 1989, 19, 703–712. [Google Scholar] [CrossRef]
  14. Wang, Y.F.; Zhang, L.F. Numerical modeling on the fluid flow-related phenomena in an aluminum electrolysis cell. In Light Metals 2010; Li, B.Q., Thomas, B.G., Zhang, L.F., Doyle, F.M., Campbell, A.P., Eds.; Springer: Berlin, Germany, 2010; pp. 207–214. [Google Scholar]
  15. Xue, J.L.; Oye, H.A. Bubble behavior-cell voltage oscillation during aluminium electrolysis and the effects of sound and ultrasound. In Light Metals 1995; Cutshall, E., Ed.; Springer: Berlin, Germany, 1995; pp. 265–271. [Google Scholar]
  16. Cassayre, L.; Utigard, T.A.; Bouvet, S. Visualizing gas evolution on graphite and oxygen-evolving anode. JOM 2002, 54, 41–45. [Google Scholar] [CrossRef]
  17. Utigard, T.; Toguri, J.M. Anode gas behavior during electrolysis. In Light Metals 1986; Miller, R.E., Ed.; Springer: Berlin, Germany, 1986; pp. 405–413. [Google Scholar]
  18. Zhao, Z.B.; Wang, Z.W.; Gao, B.L.; Feng, Y.Q.; Shi, Z.N.; Hu, X.W. Anodic bubble behavior and voltage drop in a laboratory transparent aluminum electrolysis cell. Metall. Mater. Trans. B 2016, 47, 1962–1976. [Google Scholar] [CrossRef]
  19. Zhao, Z.B.; Gao, B.L.; Feng, Y.Q.; Huang, Y.P.; Wang, Z.W.; Shi, Z.N.; Hu, X.W. Effects of anode wettability and slots on anodic bubble behavior using transparent aluminium electrolytic cells. JOM 2017, 69, 281–291. [Google Scholar] [CrossRef]
  20. Kasherman, D.; Kazacos, M.S. Effect of anode material and bath composition on bubble layer resistivity and gaseous volume fraction in an aluminium electrolysis cell with sloping anode and cathode. J. Appl. Electrochem. 1991, 21, 716–720. [Google Scholar] [CrossRef]
  21. Thorne, R.T.; Sommerseth, C.; Ratvik, A.P.; Rørvik, S.; Sandnes, E.; Lossius, L.P.; Linga, H.; Svensson, A.M. Bubble evolution and anode surface properties in aluminium electrolysis. J. Electrochem. Soc. 2015, 162, 104–114. [Google Scholar] [CrossRef]
  22. Franklin, R.E. The structure of graphitic carbons. Acta Cryst. 1951, 4, 253–261. [Google Scholar] [CrossRef] [Green Version]
  23. Einarsrud, K.E.; Johansen, S.T.; Eick, I. Anodic bubble behavior in Hall-Héroult cells. In Light Metals 2012; Suarez, C.E., Ed.; Springer: Berlin, Germany, 2012; pp. 875–880. [Google Scholar]
  24. Vogt, H. Contribution to the interpretation of the anode effect. Electrochim. Acta 1997, 42, 2695–2705. [Google Scholar] [CrossRef]
  25. Liu, S.Y.; Li, W.Z.; Ban, Y.G.; Wang, Z.W. Study on the wettability of electrolyte for graphite cathode blocks. China Nonferr. Metal. 2008, 6, 20–22. [Google Scholar]
Figure 1. Schematic diagrams of the transparent electrolysis cell. 1: DC power supply; 2: anode; 3: furnace; 4: cathode; 5: quartz crucible; 6: light source; 7: computer; 8: industrial cameras; 9: quartz window; 10: CKW-3100 temperature controller.
Metals 08 00806 g001
Figure 2. Double-chamber quartz crucible showing the anode and cathode chamber. (a) front view; (b) top view.
Metals 08 00806 g002
Figure 3. Image before and after image processing.
Metals 08 00806 g003
Figure 4. Measurement for the thickness of the bubble layer from side observations.
Metals 08 00806 g004
Figure 5. Comparison of bubble behavior between carbon and graphite anodes at a current density of 0.7 A·cm−2. Stage 1: Just after bubble release; Stage 2: Bubble growth; Stage 3: Bubble growth and coalescence; stage 4: Just before bubble release.
Metals 08 00806 g005
Figure 6. Optical microscopy images of the (a) carbon and (b) graphite anodes.
Metals 08 00806 g006
Figure 7. Fluctuation in the largest bubble area on the carbon and graphite anodes over time. a-stage 1; b-stage 2; c-stage 3; d-stage 4.
Metals 08 00806 g007
Figure 8. The largest bubble area, the release periods and bubble thickness as a function of anodic current density for the carbon and graphite anodes.
Metals 08 00806 g008
Figure 9. Gas coverage as a function of anodic current density for the carbon and graphite anodes.
Metals 08 00806 g009
Figure 10. Wetting angles of electrolyte on anodes at 1215 K. (a) the carbon anode; (b) the graphite anode.
Metals 08 00806 g010
Figure 11. Bubble generation-growth-releasing process on the carbon anode. (a) the 1st period; (b) the 2nd period; (c) the 3rd period.
Metals 08 00806 g011
Table 1. Physicochemical properties of the carbon and graphite anodes.
NameCarbon AnodeGraphite Anode
Bulk density (g·cm−3) a1.5701.820
Porosity (%) b216.8
Surface roughness (μm) c9.312.55
Graphitization (%) d27.078.0
Impurities (%) aS3.0110.009
Ca0.0580.126
Na0.040<0.001
Al0.0370.148
V0.040<0.001
Fe0.0270.063
Mn<0.0010.004
Ni0.012<0.001
a Bulk density and impurity contents were measured according to ISO 12985 and ISO 12980, respectively. b The Image Pro-Plus 6.0 Software was used to calculate surface porosity, where the pore area in a 2-D image was applied for the evaluation of porosity. c The surface roughness of the anode was evaluated with 3-D Confocal Microscopy (Olympus, 3D measuring Laser Microscope Ols4100, Japan). d The degree of graphitization for carbon material was calculated using the Franklin equation [22].