Article

Passivity of Spring Steels with Compressive Residual Stress

1
Department of Advanced Materials Engineering, Chosun University, 309 Pilmundaero, Dong-gu, Gwangju 61452, Korea
2
Accelerated Durability Development Team, Hyundai Motor R&D Center, 772-1 Jangdeok-dong, Hwaseong-si, Gyeonggi-do 18280, Korea
3
Department of Materials Science and Engineering, Chosun University, 309 Pilmundaero, Dong-gu, Gwangju 61452, Korea
*
Author to whom correspondence should be addressed.
Metals 2018, 8(10), 788; https://doi.org/10.3390/met8100788
Submission received: 24 August 2018 / Revised: 21 September 2018 / Accepted: 25 September 2018 / Published: 2 October 2018
(This article belongs to the Special Issue Corrosion and Protection of Metals)

Abstract

:
The electrochemical corrosion behavior and the semiconducting properties of the passive film formed on a coil spring steel were investigated in a buffer solution at pH 9. The anodic dissolution was mitigated, and the passive film grew faster for the spring steel with compressive residual stress than the one without stress. The passive films had an n-type semiconducting property with a high density of oxygen vacancy, and the defect density was lower for the specimens with compressive stress. The passive current density of the specimens with stress was higher and showed fluctuation. These characteristics imply that the growth mechanism of passive film and the transport of vacancies in the film on metals and alloys depend on the residual stress on the metallic surface.

1. Introduction

Coil springs for automobile suspension usually suffer corrosion fatigue [1,2,3,4,5,6,7] or fatigue [8,9,10,11,12,13,14,15]. Shot peening, proper design of alloy composition, and heat treatment are known to improve the resistance to fatigue [1,2,3,4,5,6,7,8,9,10,11,12,13,14,15,16]. Commercial coil springs are usually shot-peened. Shot peening provides compressive residual stress on the surface, and hence suppresses the crack growth under tensile stress during operation [1,2,4,6,7,11]. The effects of residual stress on the mechanical properties, which include fatigue and corrosion fatigue, have been extensively studied by many researchers [1,2,3,4,5,6,7,8,9,10,11,12,13,14,15,16]. However, little is known about the corrosion behavior of surfaces with residual stress.
Corrosion resistance of metallic materials is largely determined by its passivity. Passivity refers to the phenomenon whereby a metal or alloy shows a very low corrosion rate in spite of its thermodynamically high activity in a corrosion environment. This originates in the passive film, which is an oxide film formed naturally on the surface with a thickness of several nanometers. The passive film protects the metal from severe corrosion and can decelerate the corrosion rate drastically. The Point Defect Model [17] of passivity suggests that the growth and breakdown of passive films are controlled by the generation, annihilation, and transport of point defects such as vacancies and interstitials. The type and concentration of point defects are obtained from the semiconducting properties of the passive film, according to many corrosion researchers who have investigated them by using the Mott–Schottky analysis [18,19,20,21,22,23,24,25,26,27,28,29,30,31,32,33,34,35,36,37,38,39,40,41,42,43,44,45,46,47,48].
In this study, the authors aim to examine the effect of compressive residual stress on the corrosion and passivity of spring steels. Electrochemical polarization tests were used to evaluate the corrosion behavior, and a Mott–Schottky analysis was performed to determine the type and concentration of point defects in the passive film.

2. Experimental Procedures

A coil spring part from an automobile provided by Hyundai Motors Company (Seoul, Korea) was used as the specimen. The spring was made of JIS SUP-10 steel (Table 1) and was shot-peened. The samples were taken from an undamaged part of the front left-hand coil spring after a proving ground test. The paint was removed by immersing the samples into a methyl ethyl ketone solution for 10 min. The samples were categorized into two groups, the S and M groups. The specimens with residual stress, designated as the S group, were prepared by slightly polishing the surface of the spring to make a flat area of about 0.1 cm2. The depth of polishing was not the same for all specimens, so it was expected that the residual stress of each S specimen would be different. The specimens exposing the cross-section of the spring were also prepared by cutting the center of the spring for a comparative study and were designated as the M group. Multiple numbers of specimens were prepared for both groups, and each specimen was designated as S1, S2, M1, M2, and M3. The surface of the samples was finished with a 0.05-μm alumina paste.
The microstructure of specimens was observed using a field emission scanning electron microscope (FE-SEM) (Jeol, Tokyo, Japan) after etching with a 3% nital solution.
The residual stress of the specimens was measured by instrumented indentation testing (IIT) (Frontics, Seoul, Korea). IIT requires a reference sample without stress in order to measure the residual stress quantitatively, and the authors presumed that the residual stress of an M specimen was 0. The stress was measured 10 times for each S specimen and the results were then averaged.
The hardness was measured using a Vickers hardness tester (Future-Tech, Kanagawa, Japan) the test was repeated five times.
Potentiodynamic polarization, potentiostatic polarization, and Mott–Schottky analysis were performed sequentially for each specimen, using a potentiostat/galvanostat (Ivium Technologies, AJ Eindhoven, The Netherlands). The surface of the specimens was sealed with a silicone sealant, leaving an exposed area of 0.04–0.1 cm2. A three-electrode electrochemical cell was made up of a working electrode (i.e., the specimen), a counter electrode made of Pt wire, and a saturated calomel electrode (SCE) reference electrode.
A buffer solution at pH 9 was used as the electrolyte in order to establish a stable passivity as suggested by the E-pH diagram of iron (Figure 1) [49]. The solution was made of H3BO3 + C6H9O7∙H2O + Na3PO4∙12H2O at ambient temperature. The solution was purged with 99.999% N2 gas during tests. The working electrode was cathodically cleaned at −1 VSCE for 30 min. The open circuit potential was monitored for 30 min. The potential was scanned from −0.3 V with respect to the open circuit potential to 0.5 VSCE at a rate of 1 mV/s. Subsequently, the specimen was passivated by a potentiostatic polarization at 0.5 VSCE for 24 h. Finally, the capacitance was measured at potentials from 0.5 VSCE to −0.7 VSCE with the potential sweep rate of −10 mV/s for the Mott–Schottky analysis. The frequency of AC was 1 kHz [50] and the amplitude was 0.01 V.

3. Results and Discussion

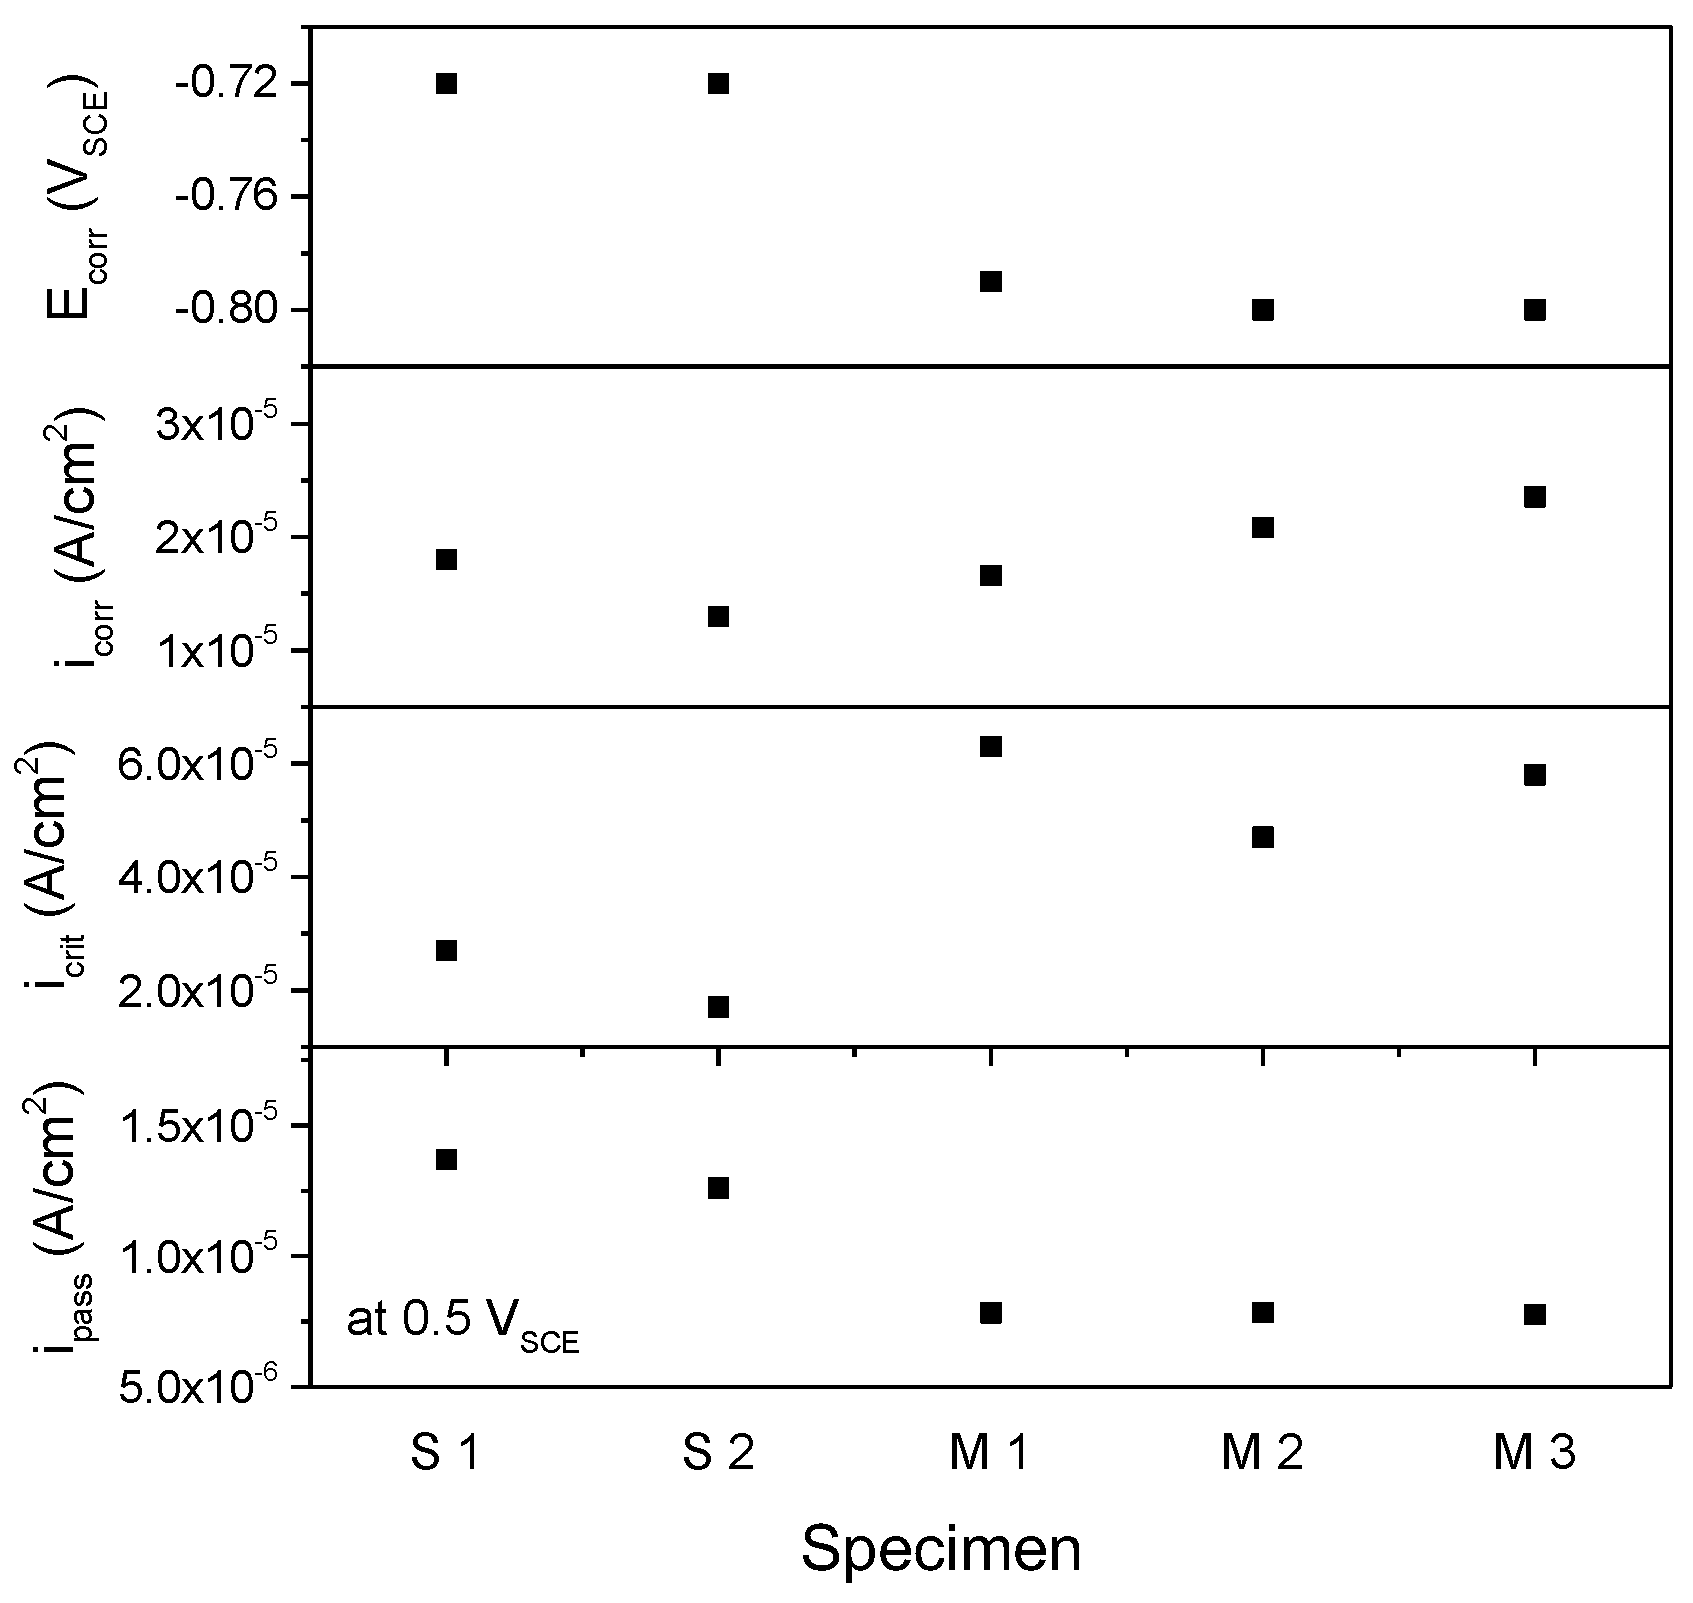
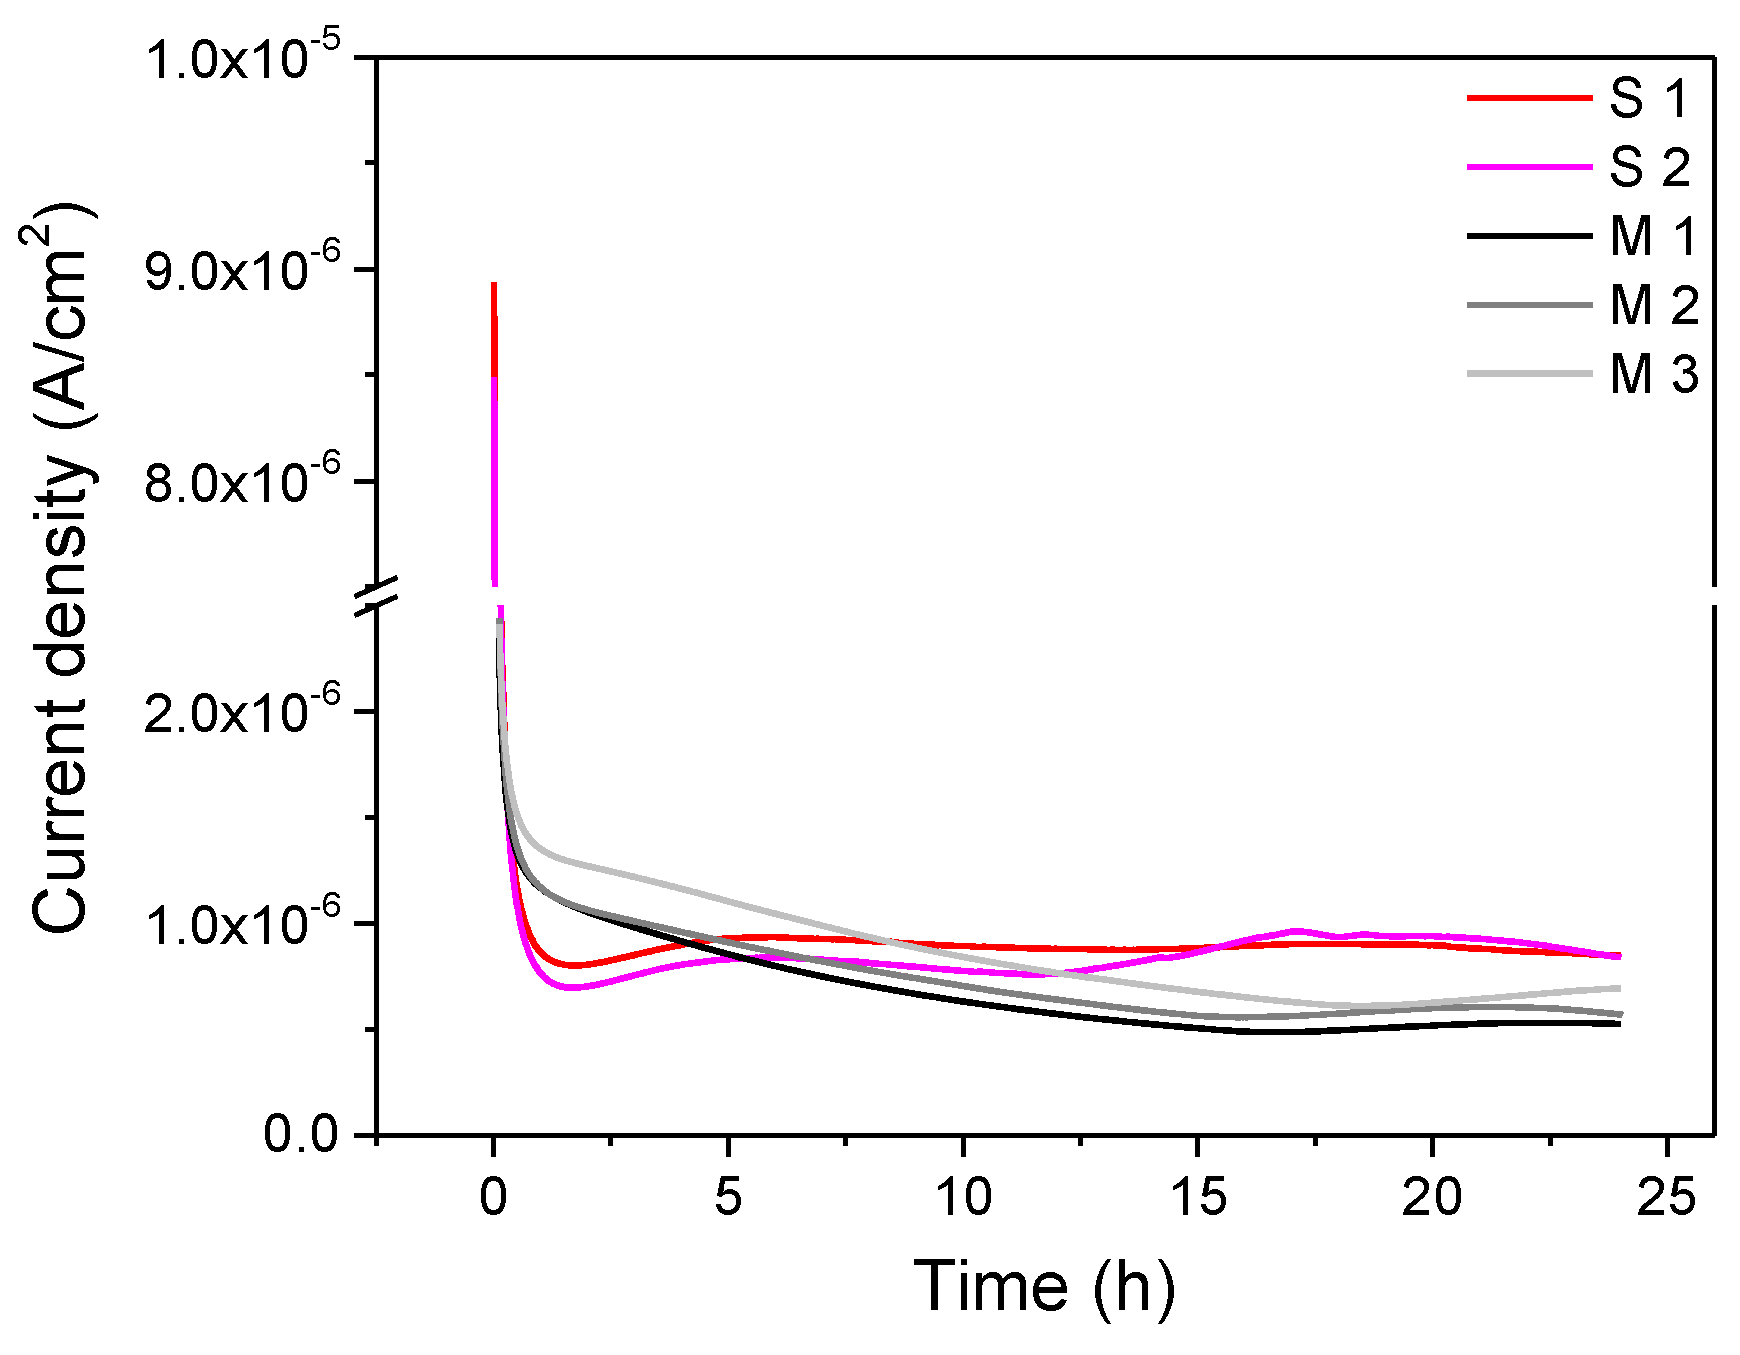
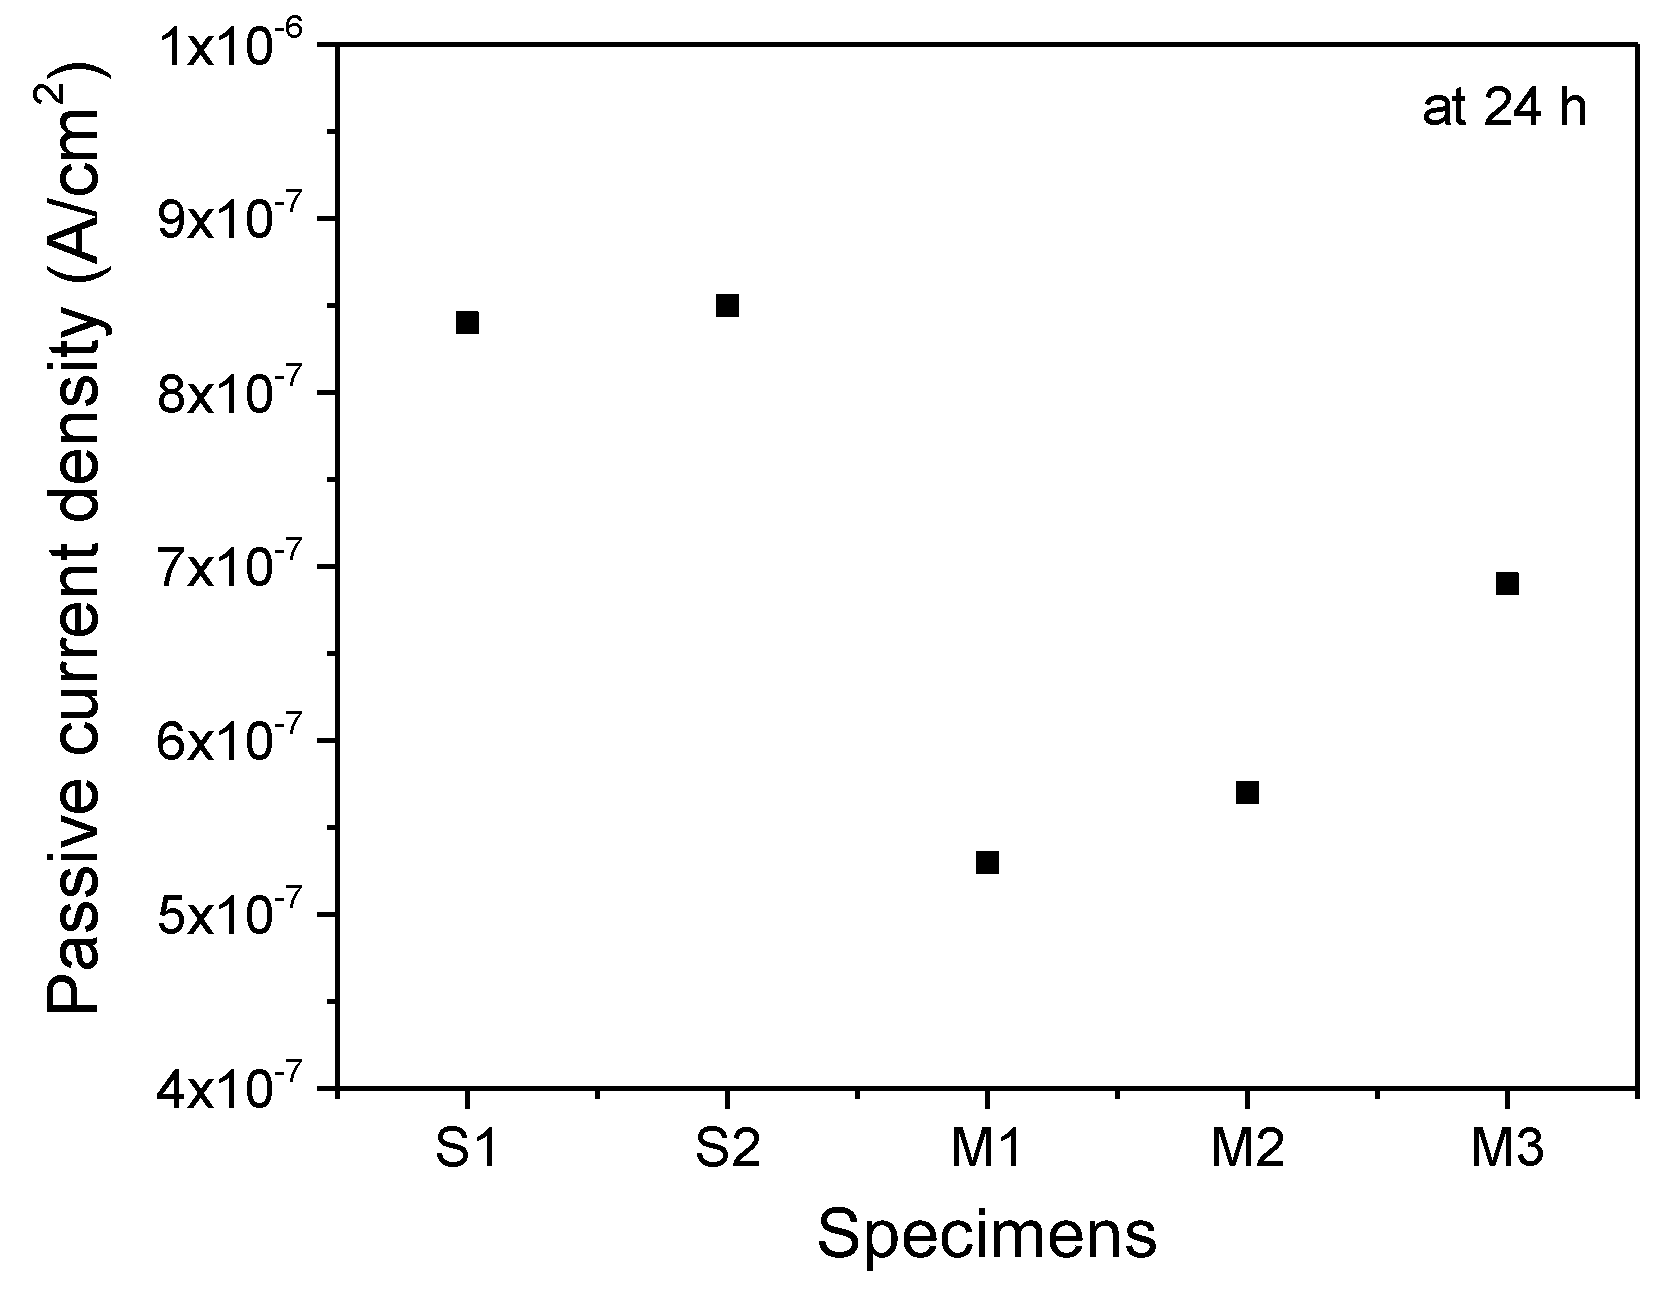
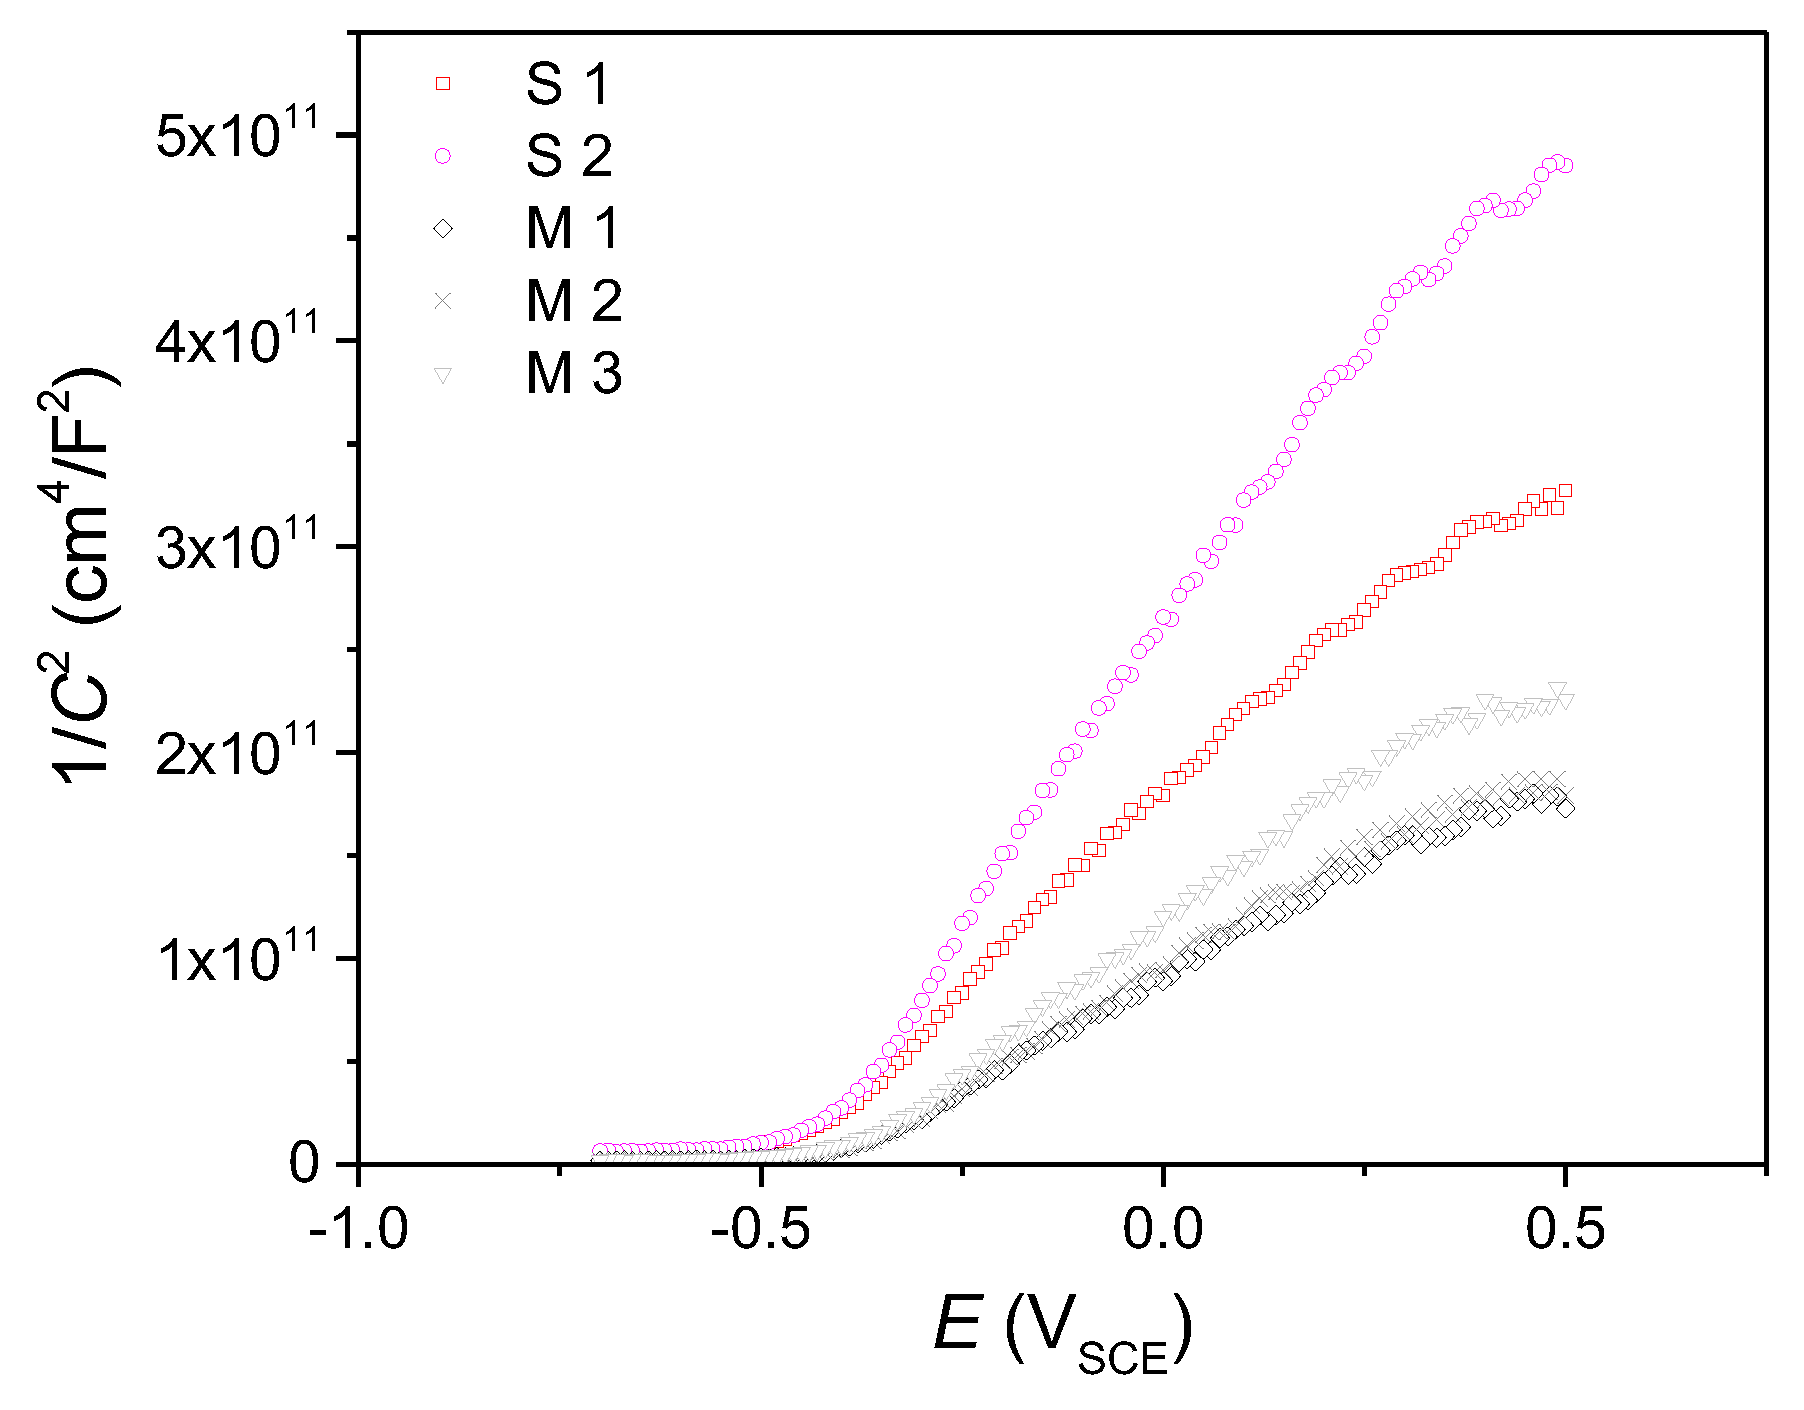
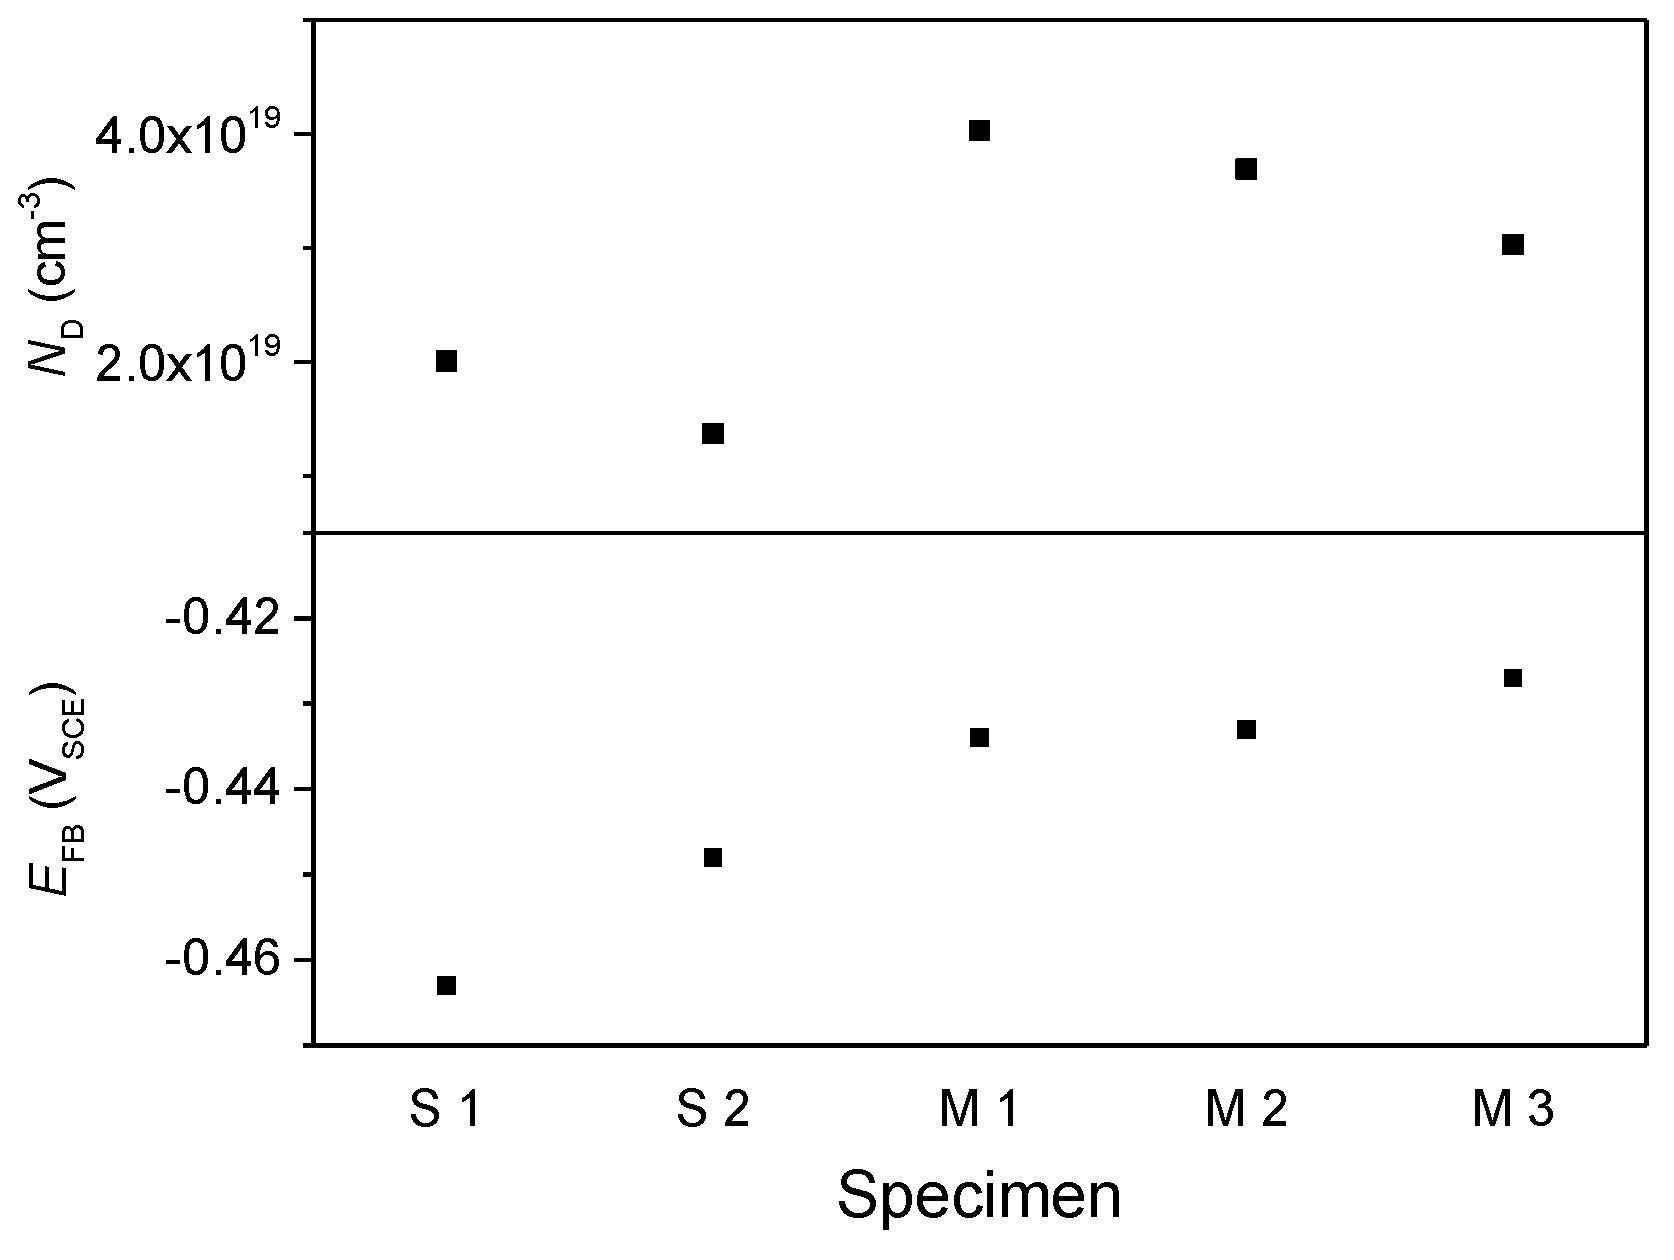
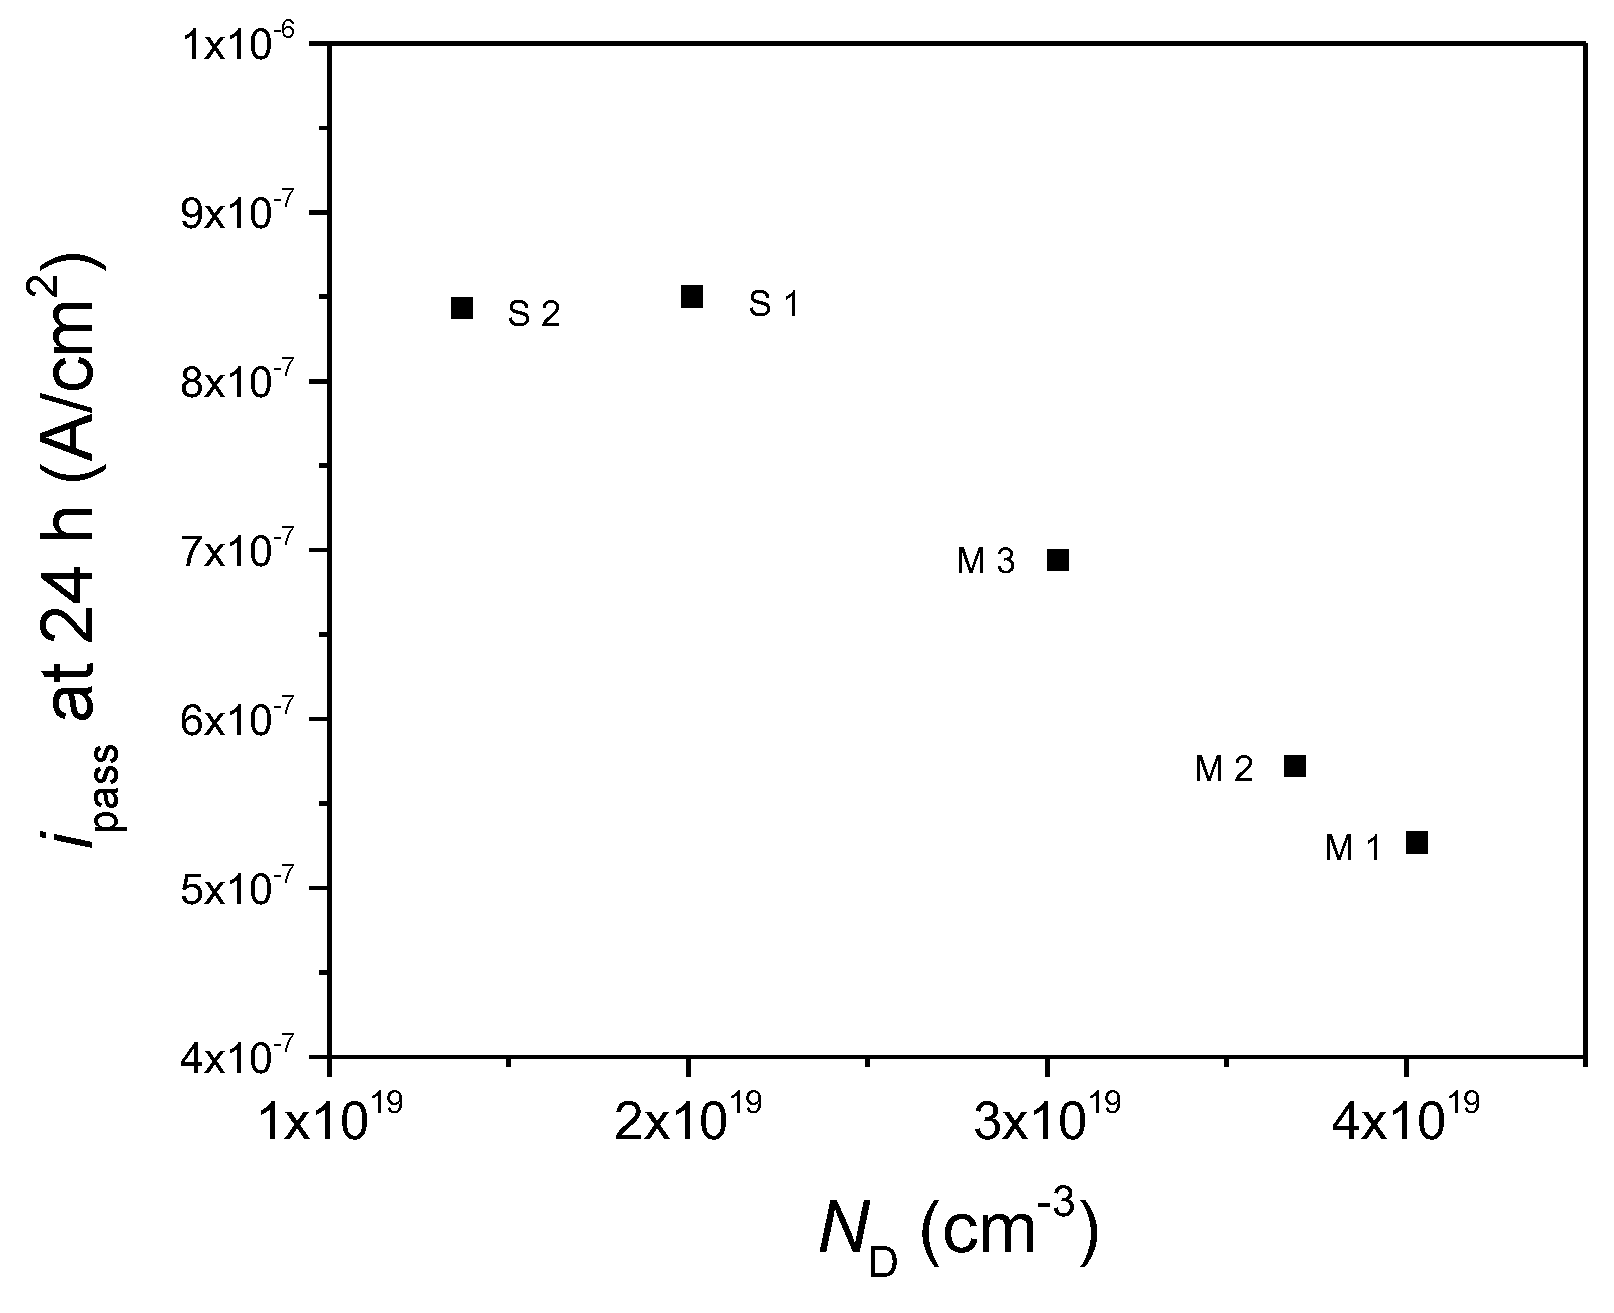
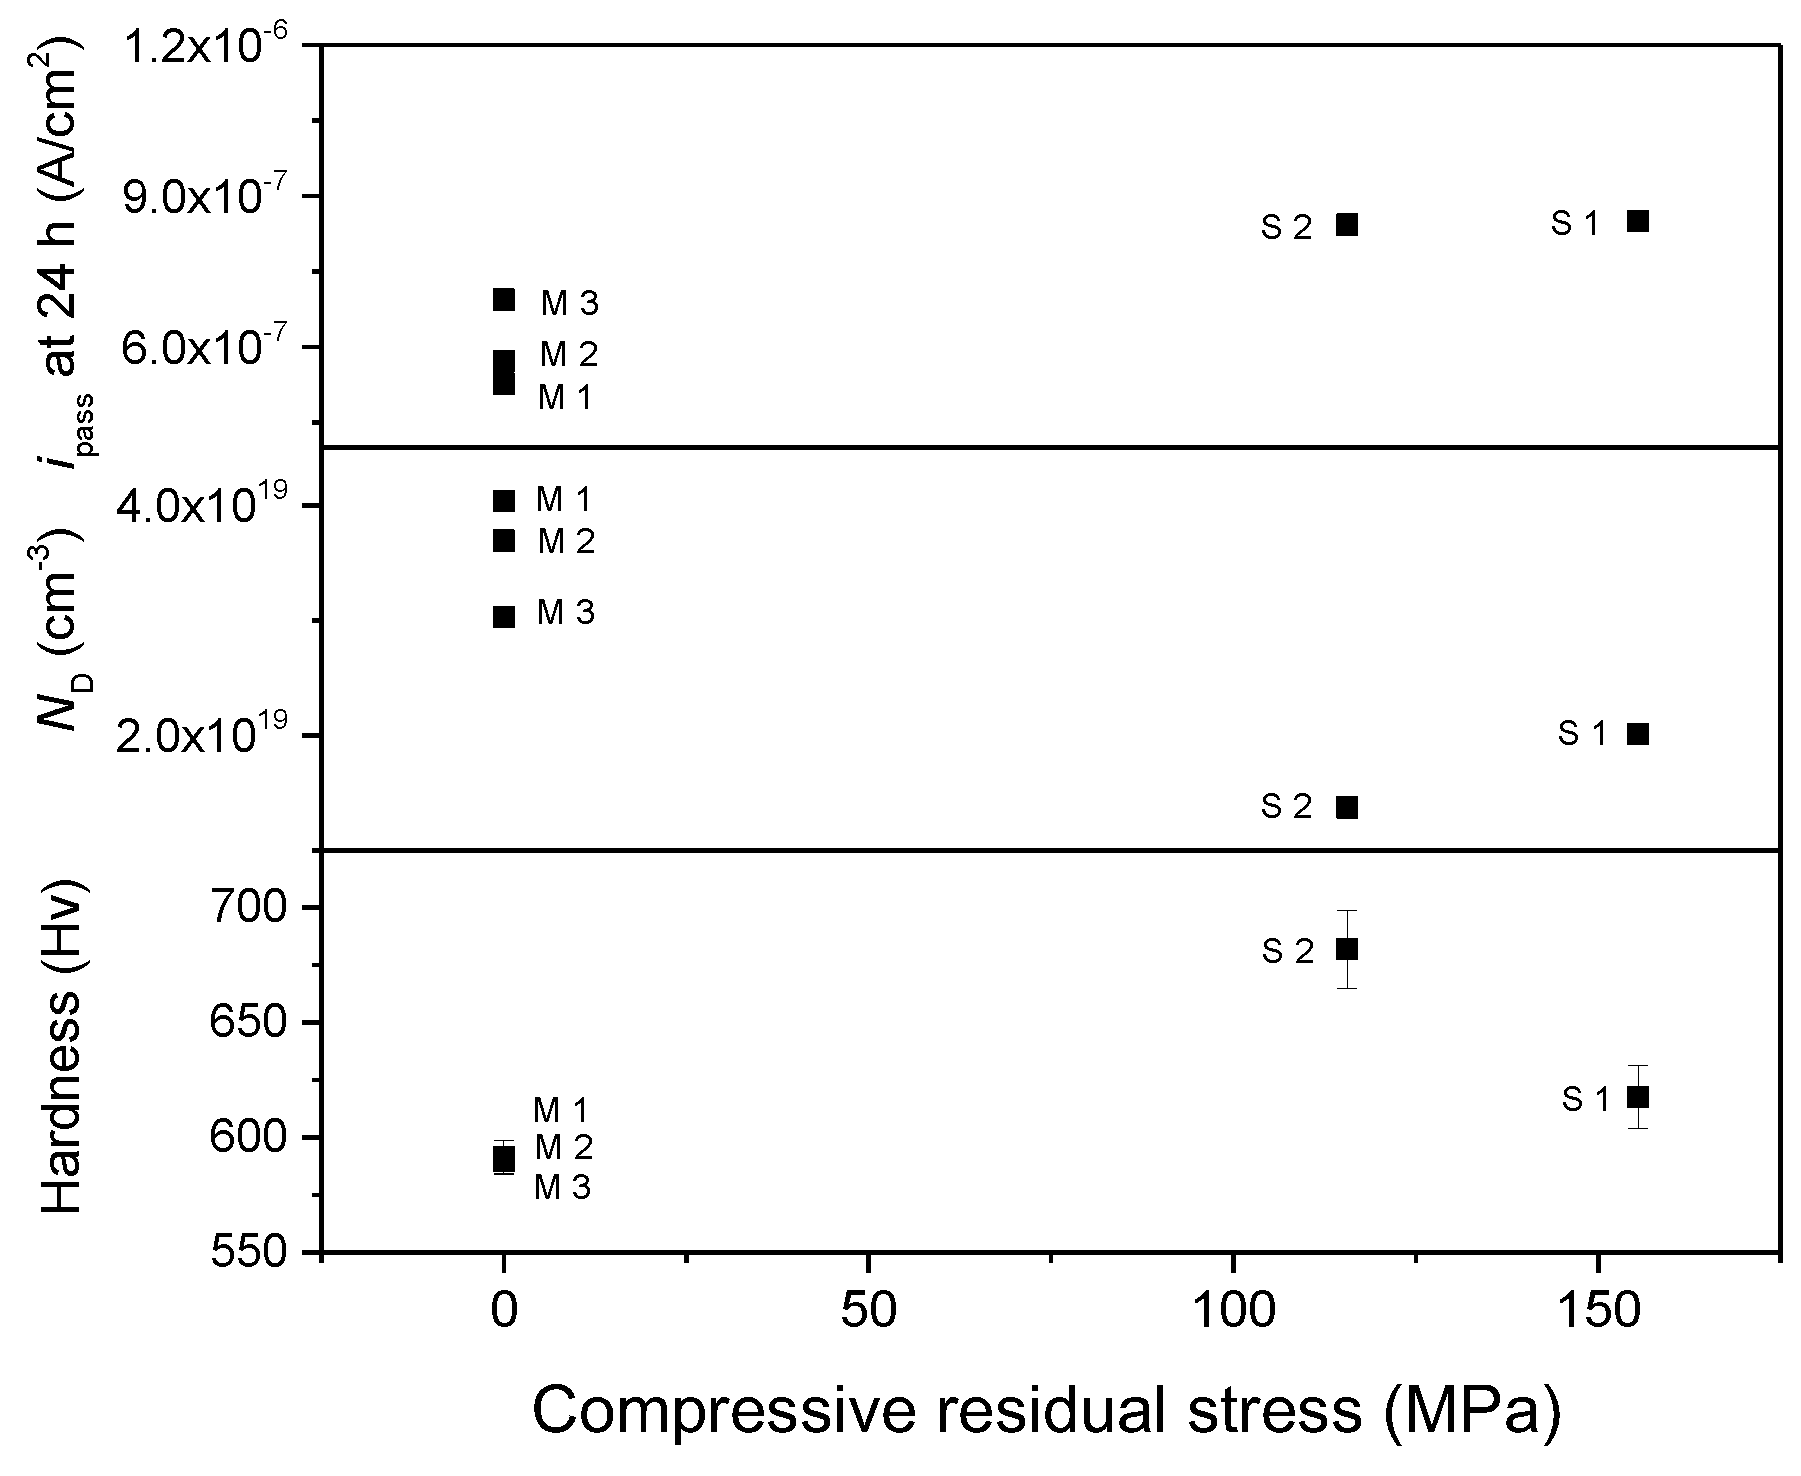
Experimental Results

Figure 2 shows the SEM images of the specimens. Lath martensite, which is usually found in spring steels with a carbon content of less than 0.6 wt% [51], is observed for both S and M group samples. Some distortion of grains due to the pressure involved by shot peening is seen from the surface to a depth of about 10–20 μm. Cracks were found in the corrosion product layer between the alloy and the coating. During the proving ground test, the paint coating was degraded and water penetrated into the coating–metal interface. Corrosion products formed on the metal below the coating and caused the detachment of the coating layer. Wet–dry cycles, temperature variation, and impingement of sand or fine gravel led to the cracking of the coating and corrosion products.
The residual stress of S group specimens was measured by IIT and is shown in Figure 3. The compressive stress of the two specimens, S1 and S2, are 155 and 116 MPa on average, respectively.
Figure 4 shows the hardness of the S and M specimens. The hardness of the S1 and S2 samples was Hv 617 and Hv 682, respectively. The hardness of the M specimens was approximately Hv 590. The hardness of the alloy surface was increased due to the increase of the dislocation density by compressive stress during shot peening [52]. The deviation between the data for the M specimens was much lower than that for the S specimens. The variations in the residual stress and hardness were large between the S specimens and also between the repetitive measurements for a given S specimen. The different depth of grinding between the S1 and S2 specimens caused a different compressive stress and hardness because the compressive stress had a gradual increase and decrease profile with depth. The deviation of data for a specimen was presumed to be due to the shot peening, which created locally irregular stress on the surface from the random overlapping of impingements.
The potentiodynamic curves of the spring steels are shown in Figure 5. The corrosion potential of the specimens was about −0.75 VSCE and the critical anodic current density was measured to be 1.7 × 10⁻⁵–6.6 × 10⁻⁵ A/cm2 at approximately −0.63 VSCE. The current density began to decrease at −0.63 VSCE and the passive current density was between 5 × 10⁻⁶–1.4 × 10⁻⁵ A/cm2 at potentials below 0.5 VSCE.
The corrosion potential (Ecorr), the corrosion rate (icorr), and the passive current density (ipass) at 0.5 VSCE are plotted in Figure 6. The corrosion potential and the passive current density at 0.5 VSCE of the S group were a little higher than those of the M group. The corrosion rate did not appear to show a dependence on the specimens. The critical anodic current density was measured to be 1.6 × 10⁻⁵–2.6 × 10⁻⁵ A/cm2 for the S group and 4.6 × 10⁻⁵–6.4 × 10⁻⁵ A/cm2 for the M group at −0.65–−0.60 VSCE, indicating that the maximum dissolution rate of the S group was lower than that of the M group. It is remarkable that the S specimens, which have residual stress, dissolved less before passivation but that the passive current density of the S specimens was higher than the M specimens without residual stress.
The potentiostatic polarization curves presented in Figure 7 also show a different passivation behavior for the S and M specimens. The passive current density of S1 and S2 decreased very rapidly and reached a minimum after about 1.5 h. Their current density showed slight increases and decreases during potentiostatic polarization. On the other hand, the current density of the M specimens decreased slowly during 16–17 h, and then showed a little increase. The passive current density of the M specimens became lower than that of the S specimens after 5–11 h.
The passive current density reached 8.4 × 10⁻⁷–8.5 × 10⁻⁷ A/cm2 for the S specimens and 5.3 × 10⁻⁷–6.9 × 10⁻⁷ A/cm2 for the M specimens after 24 h of passivation (Figure 8). The S specimens had a higher current density than that of the M specimens, although the ranking of the passive current density of each specimen shown in the potentiostatic polarization (Figure 8) was different from that shown by the ipass at 0.5 VSCE from the potentiodynamic polarization (Figure 6).
The difference in the potentiodynamic and potentiostatic polarization behaviors means that the electrochemical dissolution and passivation mechanisms of spring steels can be different under the influence of residual stress. It seems that the steel surface with compressive stress is less sensitive to an anodic dissolution and is rapidly passivated, but that its passive film is less stable than the surface without stress.
The type and concentration of point defects in the passive film were examined using a Mott–Schottky analysis. The authors of this study point out that the Mott–Schottky analysis has limitations as applied to passive films, because a passive film is not a well-defined semiconductor. Therefore, several assumptions are employed commonly and the results of the analysis are interpreted with care [53,54,55]. In particular, the quantitative property derived from the Mott–Schottky analysis (i.e., the donor density in this study) cannot be directly compared with that of other alloys. Nevertheless, the relative value of the donor density within the boundary of this study can be discussed.
The Mott–Schottky plots (Figure 9) of all specimens showed similar behavior, indicating a linear region with a positive slope between −0.3–0.3 VSCE. This means that these specimens had passive films with an n-type semiconductivity. The donor density, which implies the concentration of oxygen vacancy in the passive film [17], was determined by the Mott–Schottky relationship, as shown in Equation (1):
1 C 2 = 2 ε ε 0 e N D ( E app E FB k T e )  
where C is the capacitance of the space charge layer, ε is the dielectric constant of the passive film, ε0 is the permittivity of the vacuum, e is the charge of an electron, ND is the donor density, Eapp is the applied potential, EFB is the flat band potential, k is the Boltzmann constant, and T is the temperature. ε0 of the passive films on the specimens in this study was presumed to be 15.6, as accepted usually for the passive film of steels [20,46,47,48].
The donor density and the flat band potential of the passive films formed on the S and M specimens are shown in Figure 10. The donor density of the S1 and S2 specimens was measured to be 2.01 × 1019 cm−3 and 1.37 × 1019 cm−3, respectively, whereas that of the M specimens was 3.03 × 10¹⁹–4.03 × 1019 cm−3. The density of point defect, which is thought commonly to be oxygen vacancy for the n-type passive film [50], was found to be higher in the passive film of the steels without residual stress than in the film on the specimens with stress. The flat band potential of passive films on the M specimens was −0.427–−0.434 VSCE and a little higher than that (−0.448–0.463 VSCE) of the film on the S specimens.
Figure 11 shows the ipass at 24 h vs. the ND plot, based on the data presented in Figure 8 and Figure 10. The passive current density decreased with an increase in the defect density in the passive film generally, although such dependence was not explicit for S2. The authors could anticipate easily that a low density of point defects leads to a slow mass transport and hence a low passive current density. However, the results of this study presented the opposite, in that the passive current density for the M specimens was lower than that for the S specimens although the donor density of the M specimens was higher.
Previous reports about the relationship between the corrosion resistance and the point defect density fall into three categories. One group has suggested that the low density of point defect causes high corrosion resistance. Extensive experimental results apparently agree with this opinion [18,19,20,21,22,23,24,25,26,27,28,29,30,31,32,33,34,35,36,37]. Other researchers have reported a high corrosion rate or a low corrosion resistance for the metals or alloys with passive films with low point defect density [38,39,40,41,42], corresponding to the results drawn from this work. Another group has proposed no clear dependence of corrosion resistance on the point defect density [43,44,45]. These studies dealt with passivity or corrosion behaviors of various metals and alloys in various aqueous environments. However, the authors of this study could not find any relationship between the three different suggestions and the experimental conditions or semiconducting types from the previous works. Therefore, the origin of such discordance is not yet known. Many of the reports included a proposition that the concentration of point defect would affect the stability of the passive film and hence the corrosion resistance but did not provide a mechanism supported theoretically [18,19,21,22,23,24,25,26,27,28,29,30,31,32,33,34,35,36,37,38].
Only a few researchers, represented by Ahn et al. [44] and Park et al. [20], presented the theoretical mechanism of degradation of corrosion resistance with an increase of point defect density validated by the experimental phenomena, based on the Point Defect Model. Ahn et al. [44] and Park et al. [20] commonly conducted studies on the passive film of Ni, which is a p-type semiconductor. It was suggested that a high concentration of cation vacancy in the passive film created voids at the metal–film interface and promoted a breakdown of the passive film. Nevertheless, Ahn et al. also showed that the passive current density of Fe, which is an n-type semiconductor, did not depend on the point defect density, that is, the concentration of oxygen vacancy [44]. Their work implies that the relationship between the defect density and the corrosion resistance should be discussed while considering the type of the defect, although adequate evidence is not yet established.
Figure 12 shows the ipass at 24 h, the ND, and the hardness vs. the residual stress plots. The hardness of the S specimens was higher than that of the M specimens, but not increased with an increase in the residual stress. The passive current density was generally higher for the specimens with stress but did not appear to depend on the residual stress in the S group. The donor density was lower for the S specimens, but it had rather increased with an increase in the compressive stress in the S group. It is not clear whether the compressive residual stress involves any relationship which can be described as a linear or a high-order function from this work. However, it was noted that the bulk specimen without residual stress (i.e., the M group) and the sub-surface specimen with residual stress (i.e., the S group) had a different corrosion and passivity behavior.
Several reports suggest that the corrosion resistance is improved with compressive residual stress [56,57,58,59]. On the contrary, other studies present that shot peening lowers the corrosion resistance. Irregularity and micro-cracks due to immoderate shot peening sometimes accelerate corrosion [52]. There was a case where the corrosion rate of an SAE 5155 steel after shot peening was higher than the specimen without peening in a relatively short test, although the results were inversed after a prolonged test [56]. It might be a similar phenomenon with the potentiostatic polarization behavior shown in Figure 7 in this study, in that the current density of the S specimens underwent a fast decrease followed by a slight increase.
The donor density is known to increase and decrease during the passivation process [60]. Jang et al. [60] reported that the donor density in the passive film of Fe-20Cr-15Ni alloy rapidly increased for the initial 2 h and then decreased slowly. In the same work, the flat band potential was gradually lowered with passivation time. The passive film was thought to grow at a high rate during the initial stage with the generation of many point defects and to reach a steady state when the generation and annihilation of point defects were balanced. The passive film of the S specimens in this work grew faster (Figure 7) and had a lower donor density and flat band potential after the same passivation time as that of the film for the M specimens (Figure 10). It might be due possibly to the high diffusion rates of ions through many grain boundaries in the shot-peened surface as Lvet al. [19] have suggested. After that stage, the transport of vacancies would slow down and reach a steady state, but the high density of dislocations and grain boundaries involved with the residual stress might cause a higher transport rate in the passive film than expected in the passive film formed on normal grains without stress.

4. Conclusions

The effect of shot peening on the corrosion behavior of spring steels was investigated by electrochemical polarization tests and Mott–Schottky analysis.
The compressive stress of 116–155 MPa was induced and the hardness was increased by shot peening. The specimens with compressive residual stress were passivated faster and their density of point defect was lower than the specimens without residual stress. However, the passive current density after 24 h was higher for the specimens with stress than that for the samples without stress, possibly due to the higher diffusion rate involved with the fine and defected grain structure caused by compressive stress.

Author Contributions

Conceptualization: H.J.; Methodology: H.J.; Validation: H.J.; Formal analysis: K.-H.L.; Investigation: K.-H.L. and J.-W.S.; Resources: S.-H.A. and J.-W.S.; Data curation: K.-H.L.; Writing–Original draft preparation: K.-H.L.; Writing–Review and editing: H.J.; Visualization: K.-H.L.; Supervision: H.J. and S.-H.A.; Project administration: H.J. and S.-H.A.; Funding acquisition: H.J. and S.-H.A.

Funding

This work was supported by the “Human Resources Program in Energy Technology” of the Korea Institute of Energy Technology Evaluation and Planning (KETEP), and was granted financial resources from the Ministry of Trade, Industry & Energy, Republic of Korea (No. 20174030201620).

Conflicts of Interest

The authors declare no conflict of interest.

References

  1. Park, K.D.; Ki, W.T.; Sin, Y.J. An Evaluation on Corrosion Fatigue Life of Spring Steel by Compressive Residual Stress. Trans. Korean Soc. Automot. Eng. 2007, 15, 1–7. [Google Scholar]
  2. Jung, J.W.; Park, W.J.; Huh, S.C.; Lee, K.Y.; Ha, K.J. The Effect of Compressive Residual Stress on Fracture Toughness of SUP-9 Spring Steel for Automobile. Proc. KSAE Conf. 2003, 1624–1629. [Google Scholar]
  3. Lim, M.S. Surface treatment method of coil spring. KR10-2011-0116842, 10 November 2011. [Google Scholar]
  4. Bae, D.H.; Lee, G.Y.; Jung, W.S. Stress Analysis of the Automobile’s Coil Spring Including Residual Stresses by Shot Peening. Key Eng. Mater. 2006, 459–464. [Google Scholar] [CrossRef]
  5. Akira, T. Coil spring for a suspension of an automobile and manufacturing method thereof. WO2010146898, 23 December 2010. [Google Scholar]
  6. Kim, W.J.; Kim, J.G.; Kim, Y.S.; Ismail, O.; Tsunekawa, Y. Wear-corrosion of cast iron thermal spray coating on Al alloy for automotive components. Met. Mater. Int. 2017, 13, 317. [Google Scholar] [CrossRef]
  7. Komazaki, I.; Kobayashi, K.; Misawa, T.; Fukuzumi, T. Environmental embrittlement of automobile spring steels caused by wet–dry cyclic corrosion in sodium chloride solution. Corros. Sci. 2005, 47, 2450–2460. [Google Scholar] [CrossRef]
  8. Ramamurthy, A.C.; Lorenzen, W.I.; Bless, S.J. Stone impact damage to automotive paint finishes: An introduction to impact physics and impact induced corrosion. Prog. Org. Coat. 1994, 25, 43–71. [Google Scholar] [CrossRef]
  9. Choi, Y.S.; Kim, J.G.; Kim, Y.S.; Huh, J.Y. Corrosion characteristics of coated automotive parts subjected to field and proving ground tests. Int. J. Automot. Technol. 2008, 9, 625–631. [Google Scholar] [CrossRef]
  10. Matejicek, J.; Brand, P.C.; Drews, A.R.; Krause, A.; Lowe-Ma, C. Residual stresses in cold-coiled helical compression springs for automotive suspensions measured by neutron diffraction. Mater. Sci. Eng. A 2004, 367, 306–311. [Google Scholar] [CrossRef]
  11. Das, S.K.; Mukhioadhyay, N.K.; Kumar, B.R.; Bhattacharya, D.K. Failure analysis of a passenger car coil spring. Eng. Fail. Anal. 2007, 14, 158–163. [Google Scholar] [CrossRef]
  12. Del Llano-Vizcaya, L.; Rubio-Gonzalez, C.; Mesmacque, G.; Banderas-Hernandez, A. Stress relief effect on fatigue and relaxation of compression springs. Mater. Des. 2007, 28, 1130–1134. [Google Scholar] [CrossRef]
  13. Mano, H.; Kondo, S.; Matsumuro, A. Microstructured surface layer induced by shot peening and its effect on fatigue strength. In Proceedings of the International Symposium on Micro-Nano Mechatronics and Human Science, Nagoya, Japan, 5–8 November 2006; IEEE: Nagoya, Japan, 2006. [Google Scholar]
  14. Lim, M.S. Cold coil spring heat treatment method for improvement of inner side residual stress and fatigue life. KR10-2015-0048273, 7 May 2015. [Google Scholar]
  15. Kazuya, I. Compression coil spring and method for producing same. KR10-2015-7009184, 4 October 2015. [Google Scholar]
  16. Go, H.G. Spring manufacturing method. KR10-2014-0133138, 2 October 2014. [Google Scholar]
  17. Macdonald, D.D. Passivity–the key to our metals-based civilization. Pure Appl. Chem. 1999, 71, 951–978. [Google Scholar] [CrossRef]
  18. Yang, M.Z.; Luo, J.L.; Patchet, B.M. Correlation of hydrogen-facilitated pitting of AISI 304 stainless steel to semiconductivity of passive films. Thin Soild Films 1999, 354, 142–147. [Google Scholar] [CrossRef]
  19. Lv, J.L.; Luo, H.Y. Comparison of corrosion properties of passive films formed on phase reversion induced nano/ultrafine-grained 321 stainless steel. Appl. Surf. Sci. 2013, 280, 124–131. [Google Scholar]
  20. Park, K.J.; Ahn, S.J.; Kwon, H.S. Effects of solution temperature on the kinetic nature of passive film on Ni. Electrochim. Acta 2011, 56, 1662–1669. [Google Scholar] [CrossRef]
  21. Jang, H.J.; Kwon, H.S. Effects of Film Formation Conditions on the Chemical Composition and the Semiconducting Properties of the Passive Film on Alloy 690. Corros. Sci. Technol. 2006, 5, 141–148. [Google Scholar]
  22. Fattah-Alhosseini, A.; Vafaeian, S. Influence of grain refinement on the electrochemical behavior of AISI 430 ferritic stainless steel in an alkaline solution. Appl. Surf. Sci. 2016, 360, 921–928. [Google Scholar] [CrossRef]
  23. Jang, H.J.; Kwon, H.S. In situ study on the effects of Ni and Mo on the passive film formed on Fe–20Cr alloys by photoelectrochemical and Mott–Schottky techniques. J. Electroanal. Chem. 2006, 590, 120–125. [Google Scholar] [CrossRef]
  24. Ge, H.H.; Zhou, G.D.; Wu, W.Q. Passivation model of 316 stainless steel in simulated cooling water and the effect of sulfide on the passive film. Appl. Surf. Sci. 2003, 211, 321–334. [Google Scholar] [CrossRef]
  25. Li, D.; Wang, J.; Chen, H.; Chen, D. Investigation on electronic property of passive film on nickel in bicarbonate/carbonate buffer solution. Chin. J. Chem. 2011, 29, 243–253. [Google Scholar] [CrossRef]
  26. Freire, L.; Carmezim, M.J.; Ferreira, M.G.S.; Monremor, M.F. The passive behaviour of AISI 316 in alkaline media and the effect of pH: A combined electrochemical and analytical study. Electrochim. Acta 2010, 55, 6174–6181. [Google Scholar] [CrossRef]
  27. Sarlak, H.; Atapour, M.; Esmailzadeh, M. Corrosion behavior of friction stir welded lean duplex stainless steel. Mater. Des. 2015, 66, 209–216. [Google Scholar] [CrossRef]
  28. Lv, J.; Luo, H. Effects of strain and strain-induced α′-martensite on passive films in AISI 304 austenitic stainless steel. Mater. Sci. Eng. C 2014, 34, 484–490. [Google Scholar] [CrossRef] [PubMed]
  29. Zhang, G.A.; Cheng, Y.F. Micro-electrochemical characterization and Mott–Schottky analysis of corrosion of welded X70 pipeline steel in carbonate/bicarbonate solution. Electrochim. Acta 2009, 55, 316–324. [Google Scholar] [CrossRef]
  30. Guo, H.X.; Lu, B.T.; Luo, J.L. Study on passivation and erosion-enhanced corrosion resistance by Mott-Schottky analysis. Electrochim. Acta 2006, 52, 1108–1116. [Google Scholar] [CrossRef]
  31. Yanagisawa, K.; Nakanishi, T.; Hasegawa, Y.; Fushimi, K. Passivity of Dual-Phase Carbon Steel with Ferrite and Martensite Phases in pH 8.4 Boric Acid-Borate Buffer Solution. J. Electrochem. Soc. 2015, 162, C322–C326. [Google Scholar] [CrossRef] [Green Version]
  32. Liu, C.Y.; Jing, R.; Wang, Q.; Zhang, B.; Jia, Y.Z.; Ma, M.Z.; Liu, R.P. Fabrication of Al/Al3Mg2 composite by vacuum annealing and accumulative roll-bonding process. Mater. Sci. Eng. A 2012, 558, 510–516. [Google Scholar] [CrossRef]
  33. Lee, J.B.; Yoon, S.I. Effect of nitrogen alloying on the semiconducting properties of passive films and metastable pitting susceptibility of 316L and 316LN stainless steels. Mater. Chem. Phys. 2010, 122, 194–199. [Google Scholar] [CrossRef]
  34. Ningshen, S.; Mudali, U.K.; Mittal, V.K.; Khatak, H.S. Semiconducting and passive film properties of nitrogen-containing type 316LN stainless steels. Corros. Sci. 2007, 49, 481–496. [Google Scholar] [CrossRef]
  35. Amri, J.; Souier, T.; Malki, B.; Baroux, B. Effect of the final annealing of cold rolled stainless steels sheets on the electronic properties and pit nucleation resistance of passive films. Corros. Sci. 2008, 50, 431–435. [Google Scholar] [CrossRef]
  36. Yan, M.L.; Zhao, W.Z. Influence of temperature on corrosion behavior of PbCaSnCe alloy in 4.5 M H2SO4 solution. J. Power Sources 2010, 195, 631–637. [Google Scholar]
  37. Cheng, Y.F.; Luo, J.L. A comparison of the pitting susceptibility and semiconducting properties of the passive films on carbon steel in chromate and bicarbonate solutions. Appl. Surf. Sci. 2000, 167, 113–121. [Google Scholar] [CrossRef]
  38. Oguzie, E.E.; Li, J.; Liu, Y.; Chen, D.; Li, Y.; Yang, K.; Wang, F. The effect of Cu addition on the electrochemical corrosion and passivation behavior of stainless steels. Electrochim. Acta 2010, 55, 5028–5535. [Google Scholar] [CrossRef]
  39. Jang, H.J.; Oh, K.N.; Ahn, S.J.; Kwon, H.S. Determination of the diffusivity of cation vacancy in a passive film of Ni using Mott-Schottky analysis and in-situ ellipsometry. Met. Mater. Int. 2014, 20, 277–283. [Google Scholar] [CrossRef]
  40. Jang, H.J.; Kwon, H.S. Effects of Cr on the structure of the passive films on Ni-(15, 30) Cr. ECS Trans. 2007, 3, 1–11. [Google Scholar]
  41. Liu, B.; Zhang, T.; Shao, Y.; Meng, G.; Wang, F. Effect of hydrostatic pressure on the nature of passive film of pure nickel. Mater. Corros. 2011, 62, 269–274. [Google Scholar] [CrossRef]
  42. Jang, H.J.; Kwon, H.S. Effects of Mo on the Passive Films Formed on Ni-(15, 30) Cr-5Mo Alloys in pH 8.5 Buffer Solution. J. Korean Electrochem. Soc. 2009, 12, 258–262. [Google Scholar] [CrossRef]
  43. Park, K.; Kwon, H. Effects of manganese on the passivity of Fe-18Cr-xMn (x = 0, 6, 12). Korea Adv. Inst. Sci. Technol. Daejeon 2005, 32–40. [Google Scholar]
  44. Ahn, S.J.; Kwon, H.S.; Macdonald, D.D. Role of chloride ion in passivity breakdown on iron and nickel. J. Electrochem. Soc. 2005, 152, B482–B490. [Google Scholar] [CrossRef]
  45. Li, D.G.; Wang, J.D.; Chen, D.R.; Liang, P. The role of passive potential in ultrasonic cavitation erosion of titanium in 1 M HCl solution. Ultrason. Sonochem. 2016, 29, 279–287. [Google Scholar] [CrossRef] [PubMed]
  46. Hakiki, N.B.; Boudin, S.; Rondot, B.; Belo, M.D.C. The electronic structure of passive films formed on stainless steels. Corros. Sci. 1995, 37, 1809–1822. [Google Scholar] [CrossRef]
  47. Paola, A.D. Semiconducting properties of passive films on stainless steels. Electrochim. Acta 1989, 34, 203–210. [Google Scholar] [CrossRef]
  48. Cheng, Y.F.; Luo, J.L. Electronic structure and pitting susceptibility of passive film on carbon steel. Electrohim. Acta 1999, 44, 2947–2957. [Google Scholar] [CrossRef]
  49. Pourbaix, M. Atlas of Electrochemical Equilibria in Aqueous Solutions; National Association of Corrosion Engineers: Houston, TX, USA, 1974. [Google Scholar]
  50. Ahn, S.J.; Kwon, H.S. Effects of solution temperature on electronic properties of passive film formed on Fe in pH 8.5 borate buffer solution. Electrochim. Acta 2004, 49, 3347–3353. [Google Scholar] [CrossRef]
  51. Smith, W.F. Structure and Properties of Engineering Alloys, 2nd ed.; McGraw-Hill: New York, NY, USA, 1990. [Google Scholar]
  52. Han, M.S.; Hyun, G.Y.; Kim, S.J. Effects of Shot Peening Time on Microstructure and Electrochemical Characteristics for Cu Alloy. J. Korean Soc. Mar. Environ. Saf. 2013, 19, 545–551. [Google Scholar] [CrossRef]
  53. Di Franco, F.; Santamaria, M.; Massro, G.; Di Quarto, F. Photoelectrochemical monitoring of rouging and de-rouging on AISI 316L. Corros. Sci. 2017, 116, 74–87. [Google Scholar] [CrossRef]
  54. Tranchida, G.; Clesi, M.; Di Franco, F.; Di Quarto, F.; Santamaria, M. Electronic properties and corrosion resistance of passive films on austenitic and duplex stainless steels. Electrochim. Acta 2018, 273, 412–423. [Google Scholar] [CrossRef]
  55. Di Quarto, F.; Di Franco, F.; Miraghaei, S.; Santamaria, M.; La Mantia, F. The amorphous semiconductor Schottky barrier approach to study the electronic properties of anodic films on Ti. J. Electrochem. Soc. 2017, 164, C516–C525. [Google Scholar] [CrossRef]
  56. Park, K.D.; Sin, Y.J.; Kim, D.U. The effect of shot peening on the corrosion and fatigue crack to SAE5155 steel. J. Korean Soc. Mar. Eng. 2006, 30, 731–739. [Google Scholar]
  57. Park, K.D.; Ha, K.J. Influence of shot peening on the corrosion of spring steel. J. Ocean Eng. Technol. 2003, 17, 39–45. [Google Scholar]
  58. Hosaka, T.; Yoshihara, S.; Amanina, I.; MacDonald, B.J. Influence of grain refinement and residual stress on corrosion behavior of AZ31 magnesium alloy processed by ECAP in RPMI-1640 medium. Procedia Eng. 2017, 184, 432–441. [Google Scholar] [CrossRef]
  59. Peyre, P.; Scherpereel, X.; Berthe, L.; Carboni, C.; Fabbro, R.; Beranger, G.; Lemaitre, C. Surface modifications induced in 316L steel by laser peening and shot-peening. Influence on pitting corrosion resistance. Mater. Sci. Eng. A 2000, 280, 294–302. [Google Scholar] [CrossRef]
  60. Jang, H.J.; Park, C.J.; Kwon, H.S. Photoelectrochemical study of the growth of the passive film formed on Fe-20Cr-15Ni in a pH 8.5 buffer solution. Met. Mater. Int. 2010, 16, 247–252. [Google Scholar] [CrossRef]
Figure 1. E-pH diagram of Fe in water at 25 °C, assuming [Fe2+] = 10−6.
Metals 08 00788 g001
Figure 2. Microstructure of cross sections (a) near the surface and (b) at the middle of the spring.
Metals 08 00788 g002
Figure 3. Residual stress of the S specimens measured by instrumented indentation testing (IIT).
Metals 08 00788 g003
Figure 4. Hardness of the coil spring specimens.
Metals 08 00788 g004
Figure 5. Potentiodynamic polarization curves.
Metals 08 00788 g005
Figure 6. Corrosion parameters determined from the potentiodynamic polarization curves.
Metals 08 00788 g006
Figure 7. Current transients during potentiostatic passivation at 0.5 VSCE for 24 h.
Metals 08 00788 g007
Figure 8. Passive current density after 24 h.
Metals 08 00788 g008
Figure 9. Mott–Schottky plots.
Metals 08 00788 g009
Figure 10. Donor density and flat band potential determined by Mott–Schottky analysis.
Metals 08 00788 g010
Figure 11. Relationship between donor density and steady state passive current density.
Metals 08 00788 g011
Figure 12. Effects of compressive residual stress on steady state passive current density, donor density, and hardness.
Metals 08 00788 g012
Table 1. Chemical composition of SUP-10 steel.
ElementCSiMnPSCrV
Composition (wt%)0.45–0.550.15–0.350.65–0.95<0.035<0.0350.80–1.100.15–0.25

