Article

Evolution Properties of Tribological Parameters for Steel Wire Rope under Sliding Contact Conditions

1
School of Mechanical and Electrical Engineering, Jiangsu Key Laboratory of Mine Mechanical and Electrical Equipment, China University of Mining and Technology, Xuzhou 221116, China
2
Citic Heavy Industries Co. Ltd., Luoyang 471000, China
3
Luoyang Mining Machinery Engineering Design Institute Co. Ltd., Luoyang 471000, China
4
State Key Laboratory of Mining Heavy Equipment, CITIC HIC, Luoyang 471000, China
5
College of Mechanical Engineering, Chongqing University, Chongqing 400044, China
*
Author to whom correspondence should be addressed.
Metals 2018, 8(10), 743; https://doi.org/10.3390/met8100743
Submission received: 20 August 2018 / Revised: 20 September 2018 / Accepted: 20 September 2018 / Published: 21 September 2018

Abstract

:
Friction and wear seriously affect the safety use of winding hoist wire rope and the damage is a gradual process in practical application. In this paper, the tribological properties of a wire rope under different sliding distances were investigated. The evolutions of the coefficient of friction (COF), temperature rise, and wear characteristics under different contact loads and strokes were analyzed by a series of experiments. The results show that fluctuation of the friction is large in the early stages (before 10 min) and the major peaks depend on the stroke. When the contact load is 150 N, the COF increases most rapidly. It grows from approximately 0.48 to approximately 0.61 with the sliding distance. Additionally, the temperature rise in the wear region is higher under the large stroke (30 mm) and contact load (150 N). The maximum temperature rises are approximately 7.5 °C and 7.1 °C, respectively. Furthermore, it is approximately after 7200 mm that the temperature rise reaches a relatively stable stage. The wear scar region increases with the sliding distance and the maximum wear loss is approximately 65.5 mg at a load of 150 N. The major wear mechanisms of the wire rope are fatigue and adhesion wear.

Graphical Abstract

1. Introduction

With the development of deep resource exploitation, the multi-layer winding hoist has replaced the multi-rope friction hoist as the most suitable lifting equipment for deep coal mines in China, in particular for an ultra-deep coal mine (the hoisting height is more than 2000 m) [1,2]. Wire rope, with high axial strength and flexibility in bending, is a key part of the mine hoisting system [3,4], which determines the reliability level and the hoisting capability of the winder operations [5]. However, in the process of using the multi-layer winding hoist, it is inevitable to cause extrusion contact, vibration, and relative sliding of the wire rope between different layers [6]. Additionally, with the wire rope winding on and off drums periodically during the hoisting, the extrusion and sliding become more severe and finally cause external wear and plastic deformation, which are the primary degradation mechanisms for the winding hoist rope and determine its service life [7,8]. Moreover, according to the coal mine safety rules in China [9], the number of winding layers of the rope on the drum must be no more than two layers in a vertical shaft. This severely limits the development of the ultra-deep coal mine hoist and the main reason is that the tribological properties of the steel wire rope are not understood. Therefore, it is significant to investigate the friction and wear characteristics of the wire rope and explore the evolution of the tribological parameters at different friction stages.
In the past, several studies have been conducted on the related performance of wire ropes by many scholars. To investigate the failure behaviors of the wire rope, Chaplin [10] discussed the degradation mechanisms of wire rope used in three different applications and proposed that maintenance policy, inspection methods, and frequency must recognize the degradation mechanisms and deterioration rates applicable to the operating conditions. Schrems and Maclaren [11] designed a series of experiments to determine the cause of the early retirement of an in-service hoisting rope. The results show that the wear and deformation account for the wire breaks, which is responsible for the rope retirement. Then, Peterka et al. [12] analyzed the failure properties of hoisting steel wire rope to describe the evaluation of the rope operated in real conditions and to determine the reason of damage after a short period of use. To explore the causes of failure of wire rope, Singh et al. [8] analyzed the probable reason for failure of two wire ropes used in different underground coal mines in India and found that excessive wear is the major cause of failure. Additionally, with the aim of investigating the possible origin of wire-breaks, Karabay et al. [13] analyzed wire defects and damages during aluminum continuous casting and the wire drawing process.
As the wire rope is made of steel wires and strands, there is fretting wear between steel wires during application. To explore the fretting wear properties, Cruzado et al. [14,15] performed different fretting tests of thin steel wires and investigated the effects of contact pressure and crossing angle on the friction and wear behavior. The results show that the wear rates during the running-in period are similar and the wear in the steady state period is rather mild. Furthermore, Wang et al. [16] studied the fretting fatigue behavior of hoisting rope wires under low cycle fatigue and found that the fretting damage accelerates with increasing displacement amplitude. Moreover, considering the influence of working environment, Xu et al. [17] and Wang et al. [18] explored the fretting fatigue damages of mine rope wires in different corrosive media and found that with the increase of pH value of the corrosive media, the anti-wear property of the steel wire improves. As the wear of the wire rope is an aggravating process, the surface damage is different in different fretting stages. Wang et al. [19] investigated the dynamic wear evolution and crack propagation properties of steel wires during fretting fatigue and found that larger fatigue cycles induce decreased growth rates of the wear scar area and depth. Additionally, Zhang et al. [20] conducted a series of fretting fatigue tests on steel wires using self-made test equipment and found that the friction coefficient is lower and the fretting life is longer at the condition of a smaller crossing angle. Wang et al. [21,22] investigated torsional fretting and longitudinal fretting behaviors of steel wires. The fretting properties at a certain torsional and longitudinal frequency were also comprehensively analyzed. They found that the wear scar size and wear coefficient of fatigue wire are larger in the case of combined longitudinal and torsional fretting. Furthermore, the similarity of materials determines that there are many similar tribological properties between wire–wire contact and steel–steel contact. Many scholars investigated the effects of temperature and gaseous atmospheres on the friction and wear mechanisms of steel–steel contacts [23,24,25,26]. They found that in N2 and CO2 atmospheres, higher wear and friction were observed at high temperature. Moreover, to investigate the sliding behavior of a low-steel friction material and the effect of the temperature rise induced by frictional heating, Alemani et al. [27] conducted a series of pin-on-disc experiments under different contact loads. The characteristics of the friction layer and wear debris were discussed. Additionally, to explore the friction behaviors between the wire rope and roller, Oksanen et al. [28,29] described the wear properties of nodular cast iron in rolling–sliding contact with steel wire ropes and steel wires in the laboratory and in-service conditions. The results show that the initiation depths of the cracks increase with increasing contact pressure and the crack growth is opposite to the sliding direction in the roller surfaces. Due to the wire rope being always subjected to bending fatigue during application, the bending characteristics of wire ropes with broken wire and the wear evolution of rope under bending fatigue were investigated [30,31]. They found that broken wires lead to a concentration of severe wear and reduce the fatigue life of a wire rope. However, experimental studies cost a lot of time. In order to explore the fretting fatigue mechanism more conveniently, Wang et al. [32,33] investigated the effect of fretting parameters on stress distributions of contacting wires using the finite element method. Additionally, the fretting wear evolution and fatigue life estimation were also analyzed. The predicted fretting wear depth of steel wires shows good agreement with experimental results. Furthermore, Cruzado et al. [34,35] developed an optimized methodology for wear scars simulation using finite element software (Abaqus 6.9, SIMULIA, RI, USA) and this simulation model presents a very good correlation with respect to the experimental data. However, the previous studies mainly focused on the failure behaviors of in-service wire rope and the fretting wear properties of steel wires. The evolution of tribological characteristics for the steel wire rope under different sliding contact conditions has not previously been reported.
Therefore, the aim of this paper was to investigate the friction and wear characteristics of the wire rope sliding against itself at different stages. The effect of the stroke and contact load on the evolution of tribological parameters was also revealed. Additionally, the coefficient of friction (COF) and temperature rise during the friction tests were obtained through data collection system of the test rig and thermal infrared imager, respectively. Then, the wear debris characteristics were discussed. Furthermore, the wear scar distribution and the wear mechanism were analyzed using an optical microscope (Yongao Precision Instrument Co. Ltd., Shanghai, China) and scanning electron microscopy (SEM) (Mocai Materials Science and Technology Co. Let., Shanghai, China).

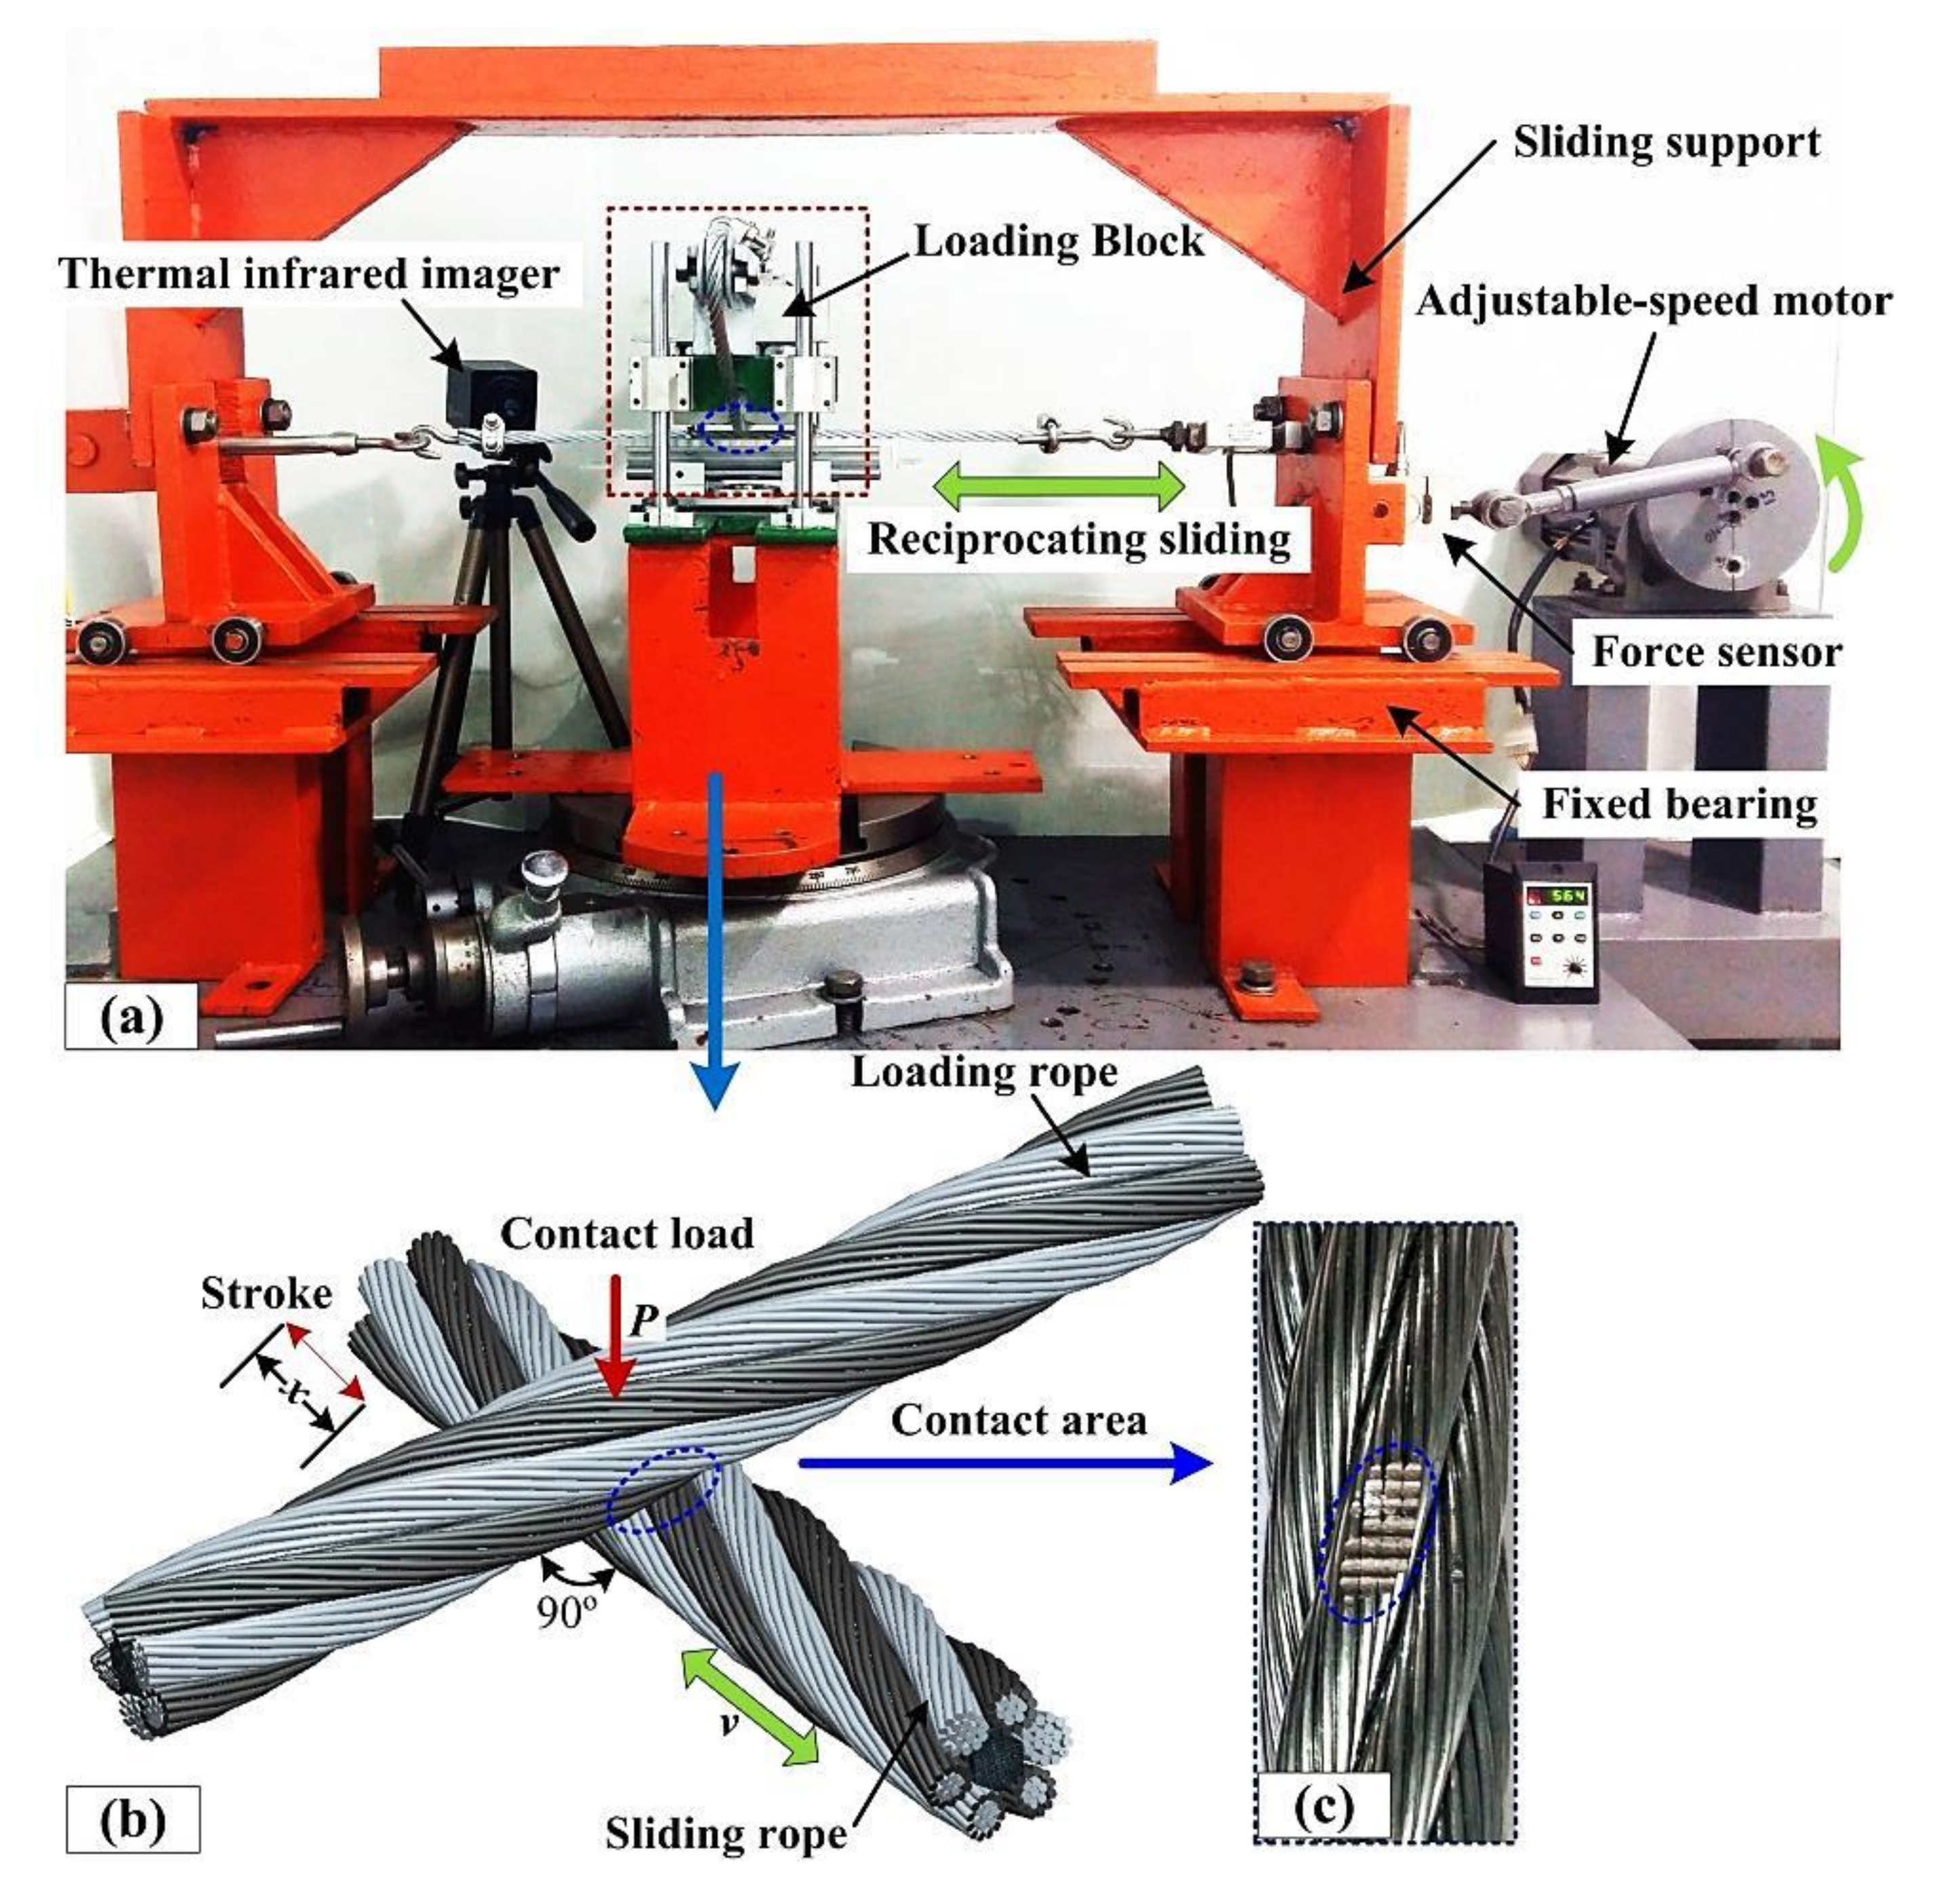
2. Experimental Details
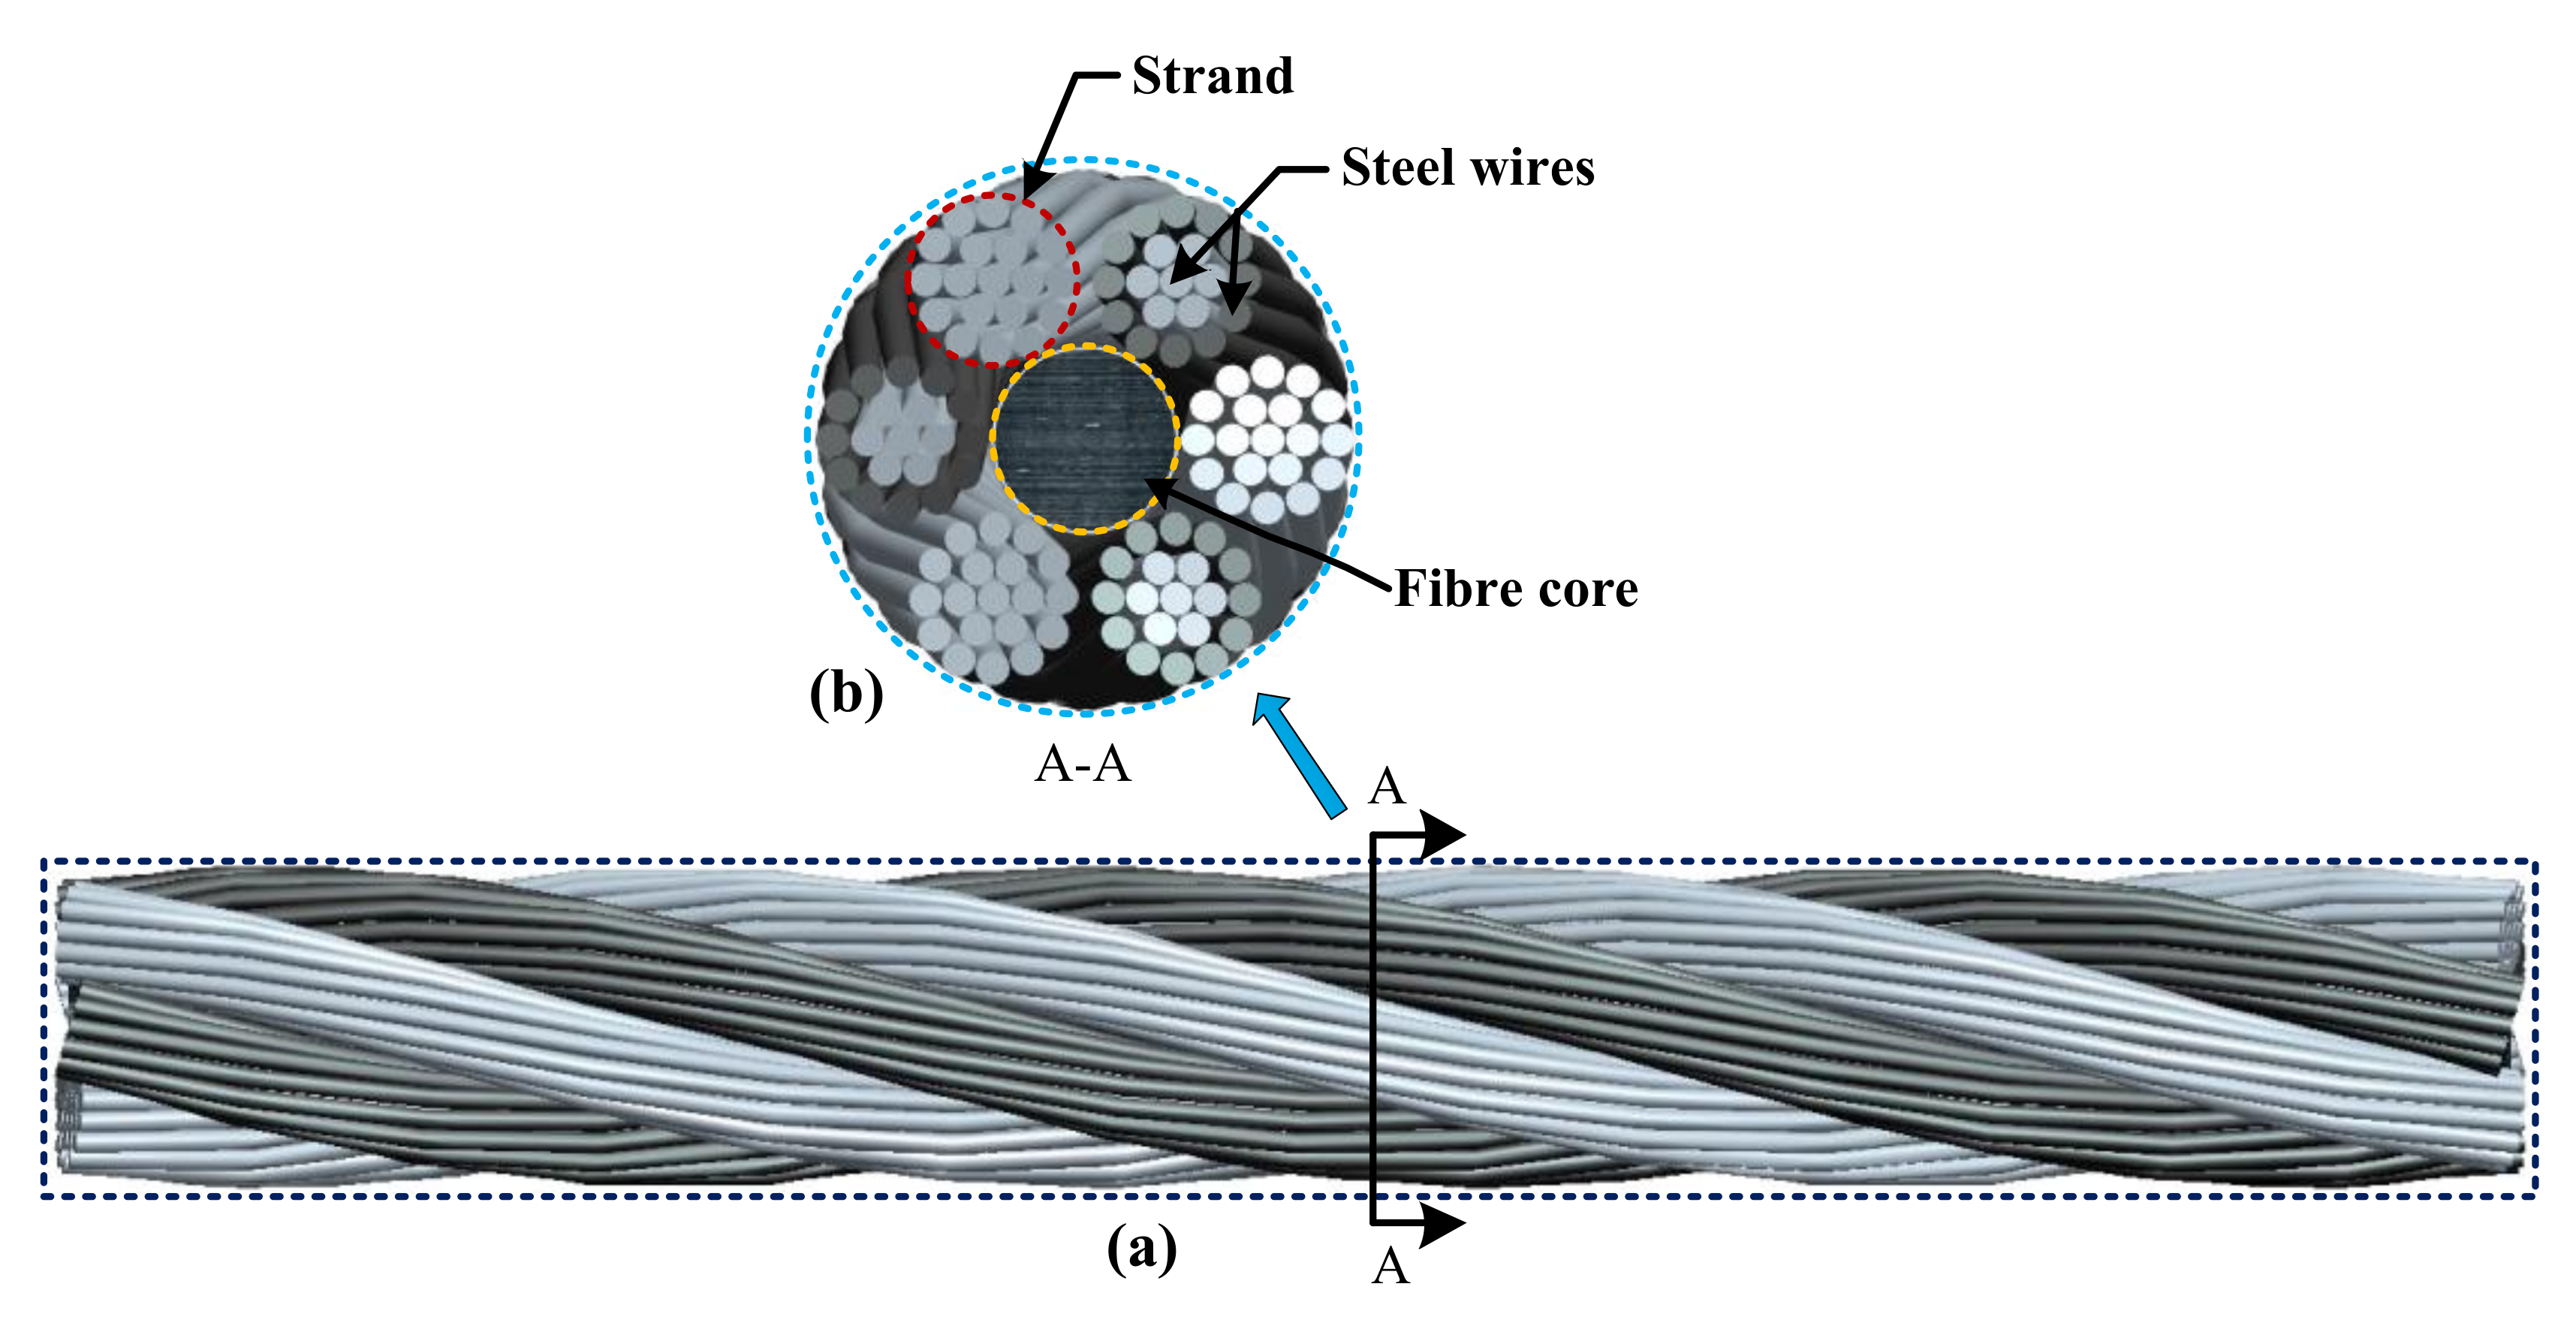
2.1. Materials

As shown in Figure 1, the 6×19+FC (fiber core) point contact wire rope was selected as the study object, which consists of 6 strands with 19 individual steel wires in each one and a rope core made of synthetic fiber. Steel wire rope is widely used in a winding hoist. The wires are manufactured by a cold drawing process from high quality carbon structural steel and the chemical composition of the wire material is 94.18% Fe, 4.53% Zn, 0.87% C, 0.39% Mn, 0.02% Si, 0.01% Ni, and other elements are S and P [36]. The detailed parameters of the steel wire rope are shown in Table 1.

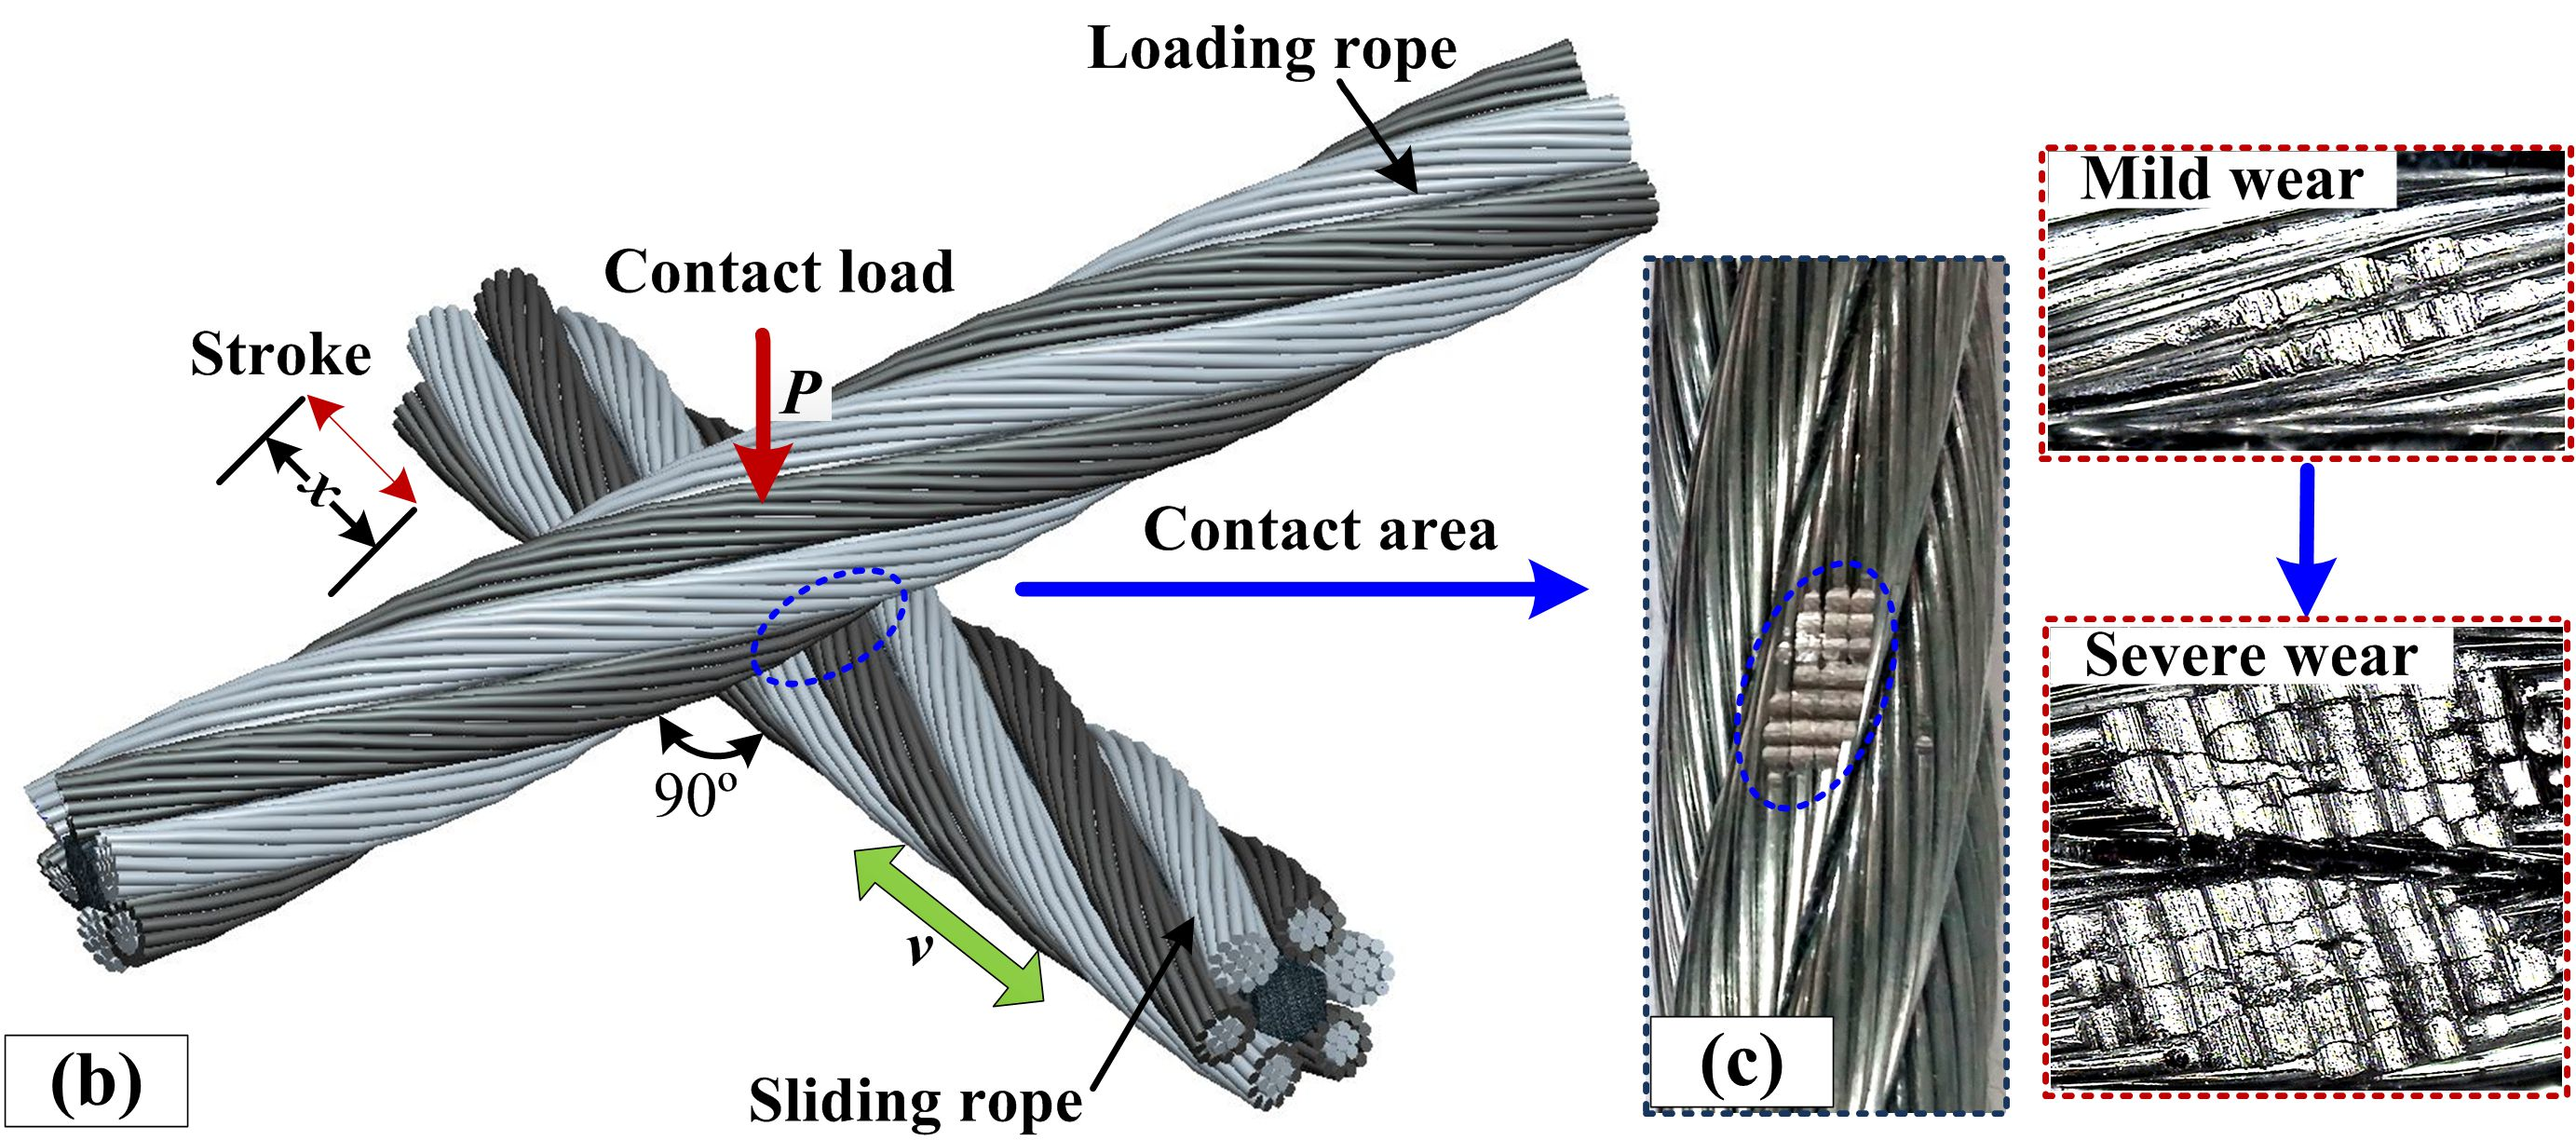
2.2. Experimental Procedure and Methods

All the friction and wear experiments of the steel wire rope were carried out using a self-made test rig, as shown in Figure 2, which can realize sliding contact of wire ropes under different conditions (contact loads, strokes, velocities, crossing angles et al.). Further description of the test rig can be found in the references [1,6,37]. As the lower sliding rope is fixed on the sliding support, the friction force collected by the force sensor includes the friction of the ropes and the friction between the sliding support and the fixed bearing during the tests. The friction between the sliding support and fixed bearing of each test was measured and defined as the initial measurement error of the test rig (f0). Figure 2b presents the contact form between the upper loading rope and the lower sliding rope. The sliding friction was simplified into two wire ropes cross contact at the crossing angle of 90°. It can be seen that the upper loading rope can only float up and down and the lower sliding rope can achieve continuous reciprocating sliding. Additionally, the contact load, sliding stroke and velocity can be adjusted within a certain range by the loading blocks and the adjustable-speed motor, respectively. Therefore, the investigation of the effect of different sliding conditions on the tribological properties of the wire rope in different stages can be realized by controlling the experimental time (total sliding distance). To meet the requirement of the experiment target, many tests under different sliding parameters were conducted first to determine the suitable contact loads and strokes used in the research. Considering the structure of the test rig, loads of 50 N, 100 N, and 150 N, and strokes of 20 mm and 30 mm were selected, which can reflect the wear process (from mild wear to severe wear) clearly and were convenient to carry out the study in this paper. Furthermore, to explore the friction and wear evolution of the wire rope on running in the stage to the stable stage, the experimental time was changed from 5 min to 30 min. According to the test parameters (stroke and contact load), all the tests can be divided into four groups. When the contact load was 100 N, strokes of 20 mm and 30 mm were selected. For contact loads of 50 N and 150 N, a stroke of 20 mm was selected. Detailed test parameters of the wear experiments are shown in Table 2. It is clear that the experiment was carried out four times with different sliding distances when the contact load and stroke were determined. As the maximum sliding distance was 21,600 mm and the experimental data were collected continuously, the COF and temperature rise of the wire rope could be obtained four times before 3600 mm (three times before 7200 mm, twice before 14,400 mm, and once before 21,600 mm) by the experiments with different test times.
The friction force and temperature in the wear region were recorded during each test, then, the coefficient of friction, temperature rise, and wear characteristics of the wire rope were calculated and analyzed after the friction tests. The sliding between wire ropes is reciprocating, which includes the extending stroke and return stroke for each cycle. The coefficient of friction in this paper was calculated from the collected data of extending strokes and following the equation:
f = i = 1 k F i k P f 0
where F is the friction force collected during each extending stroke; P is the contact load; k is the number of collected data in a single extending stroke; f0 is the initial measurement error of the test rig. Thus, the coefficient of friction is an approximate average value. As the experiment of each group was conducted four times under different test times, the COF at distances of 3600 mm, 7200 mm and 14,400 mm was averaged from the experiments. The COF at a distance of 21,600 mm was averaged with the values at the relatively stable stage. Then those values calculated from the data at different distances were defined as the average COF. Additionally, the maximum temperature rise in the contact region was obtained using a thermal infrared imager and the supporting software (ThermoX, MAGNITY ELECTRONICS, Shanghai, China). Following this, the comparative analysis for the evolution of the temperature rise under different sliding conditions was carried out. The average temperature rise was calculated using the similar method of average COF. Finally, the wear debris produced during the experiment was collected and the wear loss m was measured using an electronic analytical scale with measurement error of less than 0.1 mg. Additionally, the distribution of the wear scar and morphology features of the wear surface and debris were analyzed by optical microscope and scanning electron microscopy, respectively.

3. Results and Discussion

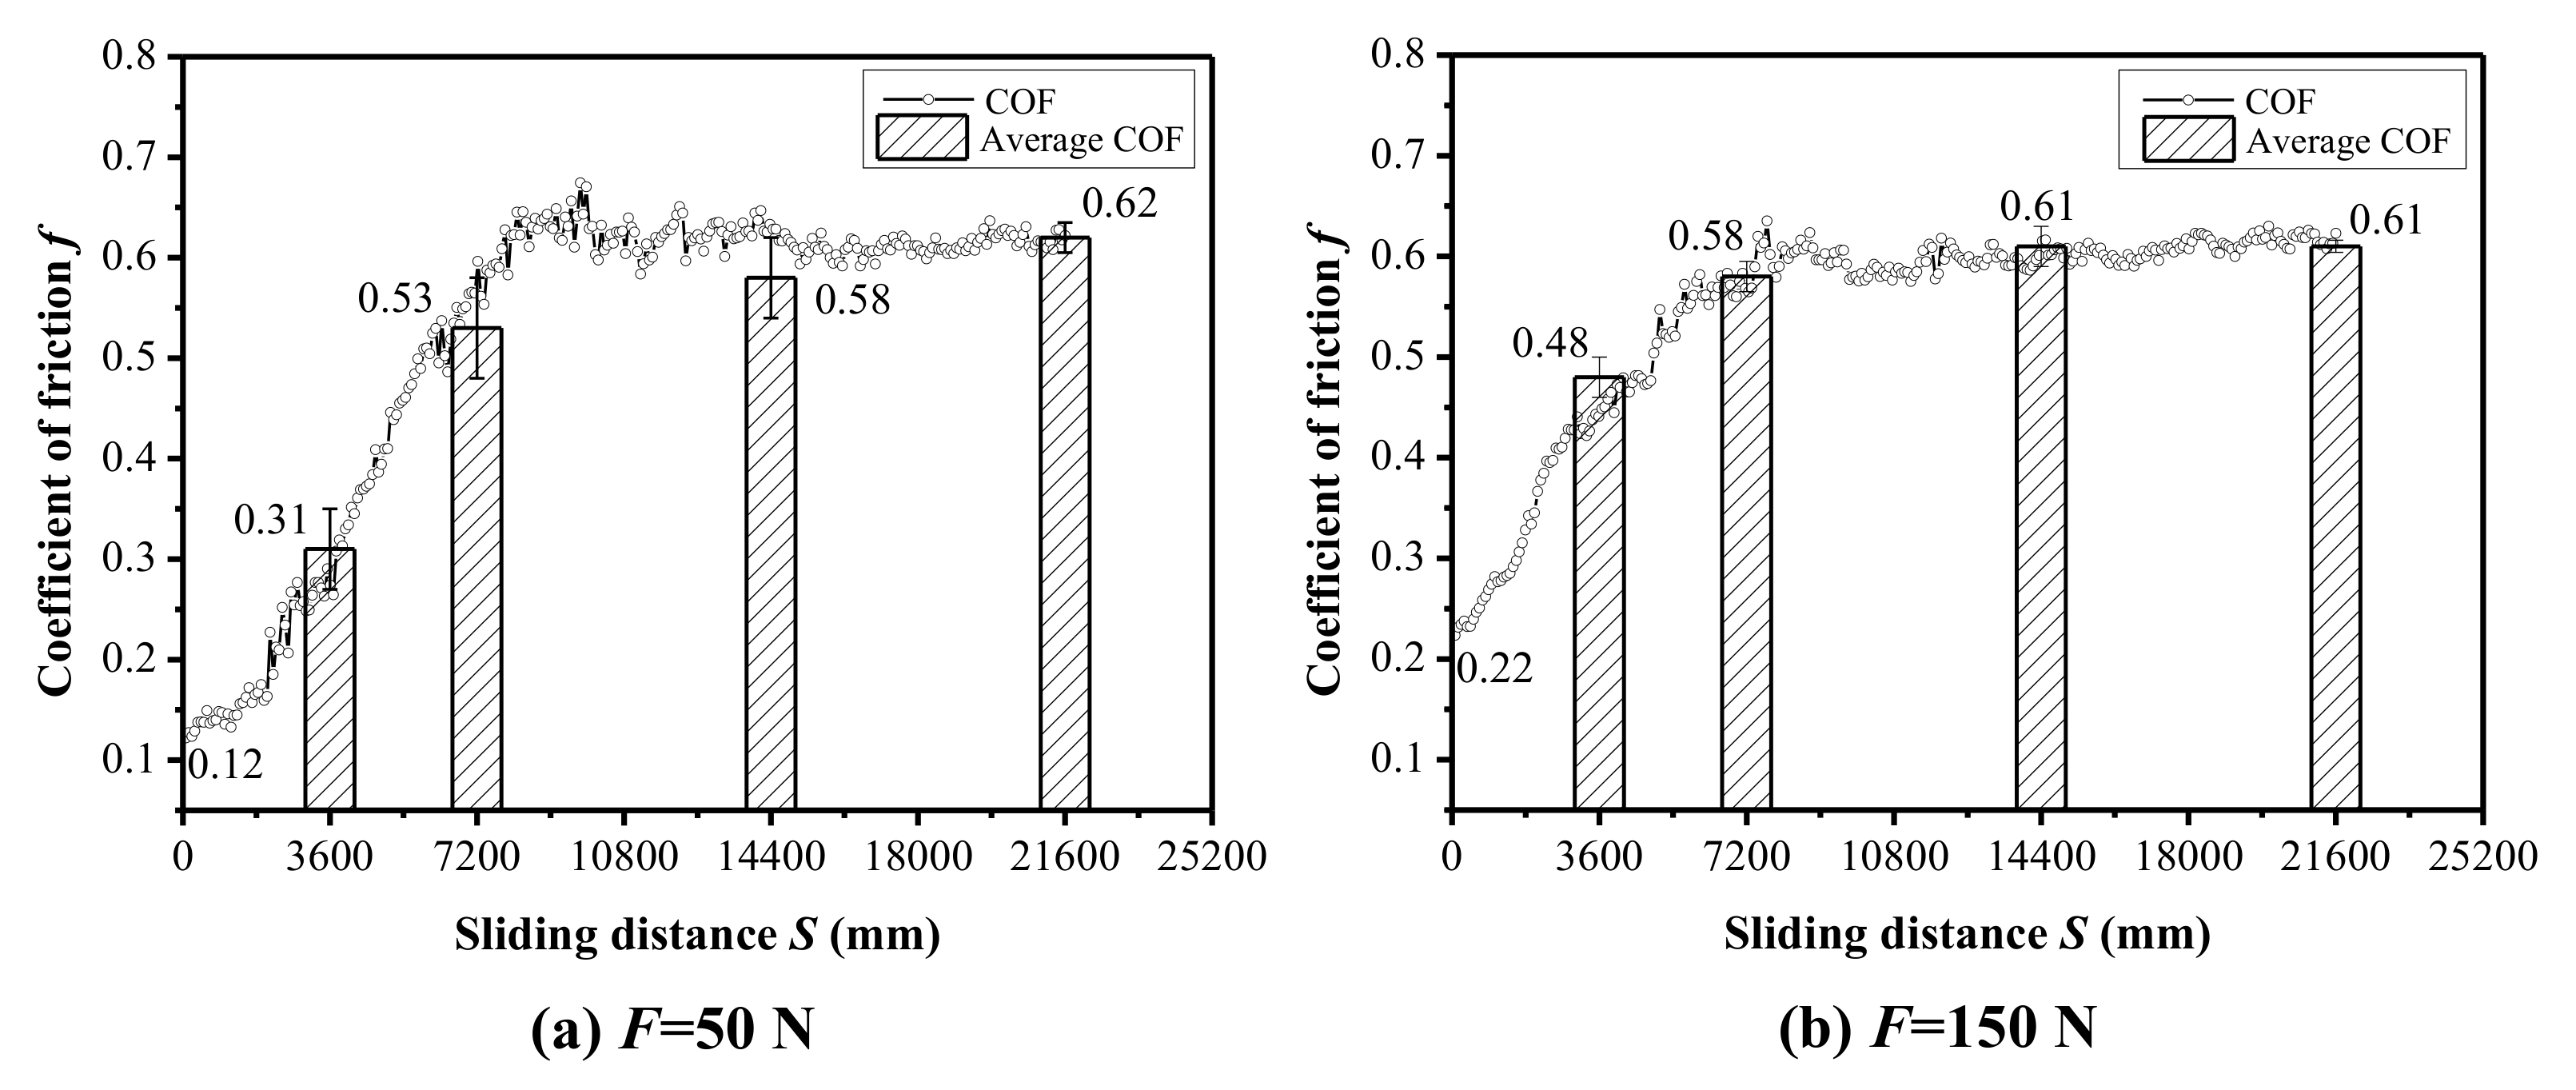
3.1. Evolution of the Coefficient of Friction under Different Strokes and Loads

Figure 3 presents the friction curves of wire ropes for one cycle at different experimental stages, which correspond to the end of the different test stages. The stroke is 30 mm in Figure 3b, which is larger than the others. Thus, although the number of stroking cycles is the same, the sliding distance in Figure 3b is greater. The data of the extending stroke are positive values and negative values in the return stroke. It can be seen that the friction force is small at the beginning of the experiment and increases with the experimental time. Additionally, the fluctuation of the curves is large in the early stage, especially when the experimental time is 20 min. This is because the damage of the rope surface is mild and the contact area is small in the initial stage. The resistance is small and the sliding is smooth. Then, continuing the test, the wear depth becomes large and more wires and strands occur in the wear region. The sliding surface is no longer smooth. There are many gaps between the wires and strands in the wear region, which leads to a larger fluctuation during the reciprocating sliding in that stage, as shown in Figure 3 (red curves at 20 min). Furthermore, in the later stage, the surface wear is severe. The gaps are smaller in the wear depth and more debris fill the gaps in the wear scar region. The sliding surface becomes smoother and more regular along the sliding trace. Thus, the friction curves at an experimental time of 30 min are very smooth for each stroke. However, the gaps between the strands are much larger than those between the wires, which causes larger fluctuation in the process of reciprocating sliding. Furthermore, when the strand lay length is 70 mm, there are two and three strands in the wear region for the lower sliding rope when the stroke is 20 mm and 30 mm, respectively. Therefore, three obvious strong fluctuation regions appear on the friction curves in Figure 3b and two strong fluctuation regions in Figure 3a,c,d. However, because the sliding contact position and the test parameters are different for each curve, the larger fluctuations are not very obvious on all the curves. When the test time is 5 min in Figure 3a, the two peak regions appear at sliding distances of approximately 29 mm and 37 mm in the return stroke. For Figure 3c, the relatively obvious peak regions appear at distances of approximately 3 mm and 17 mm in the extending stroke, respectively. Two valley regions are very obvious on the curve when the test time is 30 min, as shown in Figure 3d. Moreover, as the stroke increases from 20 mm to 30 mm under the same contact load (100 N), the amplitude of the fluctuation on the curves in different stages becomes smaller. This means a larger stroke more easily causes a smoother sliding surface. Additionally, when the load is 50 N and the stroke is 20 mm, the change of the curves at different stages is small. Then, when the load increases to 150 N, as shown in Figure 3d, the change range of the curves becomes larger and the fluctuations are more obvious. This indicates that the wear is more severe and the surfaces are more irregular under the condition of a large contact load.
To explore the changing characteristics of the coefficient of friction under different strokes, the friction coefficient curves and the average values at different stages were obtained from the experiments with different test times, as shown in Figure 4. The curves were obtained from the experiments with a test time of 30 min. It can be seen that the coefficient of friction increases quickly when the sliding distance is less than approximately 7200 mm. Then, it shows a short period of slow change and finally becomes stable after approximately 14,400 mm. As shown in Figure 4a, the coefficient of friction increases from approximately 0.15 to approximately 0.56 as the sliding distance increases from 0 to 21,600 mm. Furthermore, with the stroke increase to 30 mm, the coefficient of friction increases from approximately 0.18 to approximately 0.63 with the sliding distance. The values in the relatively stable stage are greater than those in Figure 4a. Additionally, the increase of the curve in Figure 4b is faster and the amplification is larger before the sliding distance of 14,400 mm. This indicates that it is harder for the coefficient of friction to reach a relatively stable stage when the stroke is larger. Moreover, the difference between the average COF and the values on the curve is larger in the early stages and very small at the relatively stable stage. This means the characteristics of the friction pairs of the wire rope are diverse and random at the beginning of the experiments. Then, as the friction becomes stable, the friction pairs show more similarities between the different experiments.
Figure 5 shows the evolution of the coefficient of friction under different contact loads and sliding distances. It is clear that the coefficient of friction increases from approximately 0.12 to approximately 0.62 when the contact load is 50 N and the stroke is 20 mm. The COF increases rapidly when the sliding distance is less than approximately 9000 mm. With the contact load increasing to 150 N, the COF increases from approximately 0.22 to approximately 0.58 rapidly, with the sliding distance increasing from 0 to 7200 mm. Then, the COF stabilizes at approximately 0.61 after the sliding distance is more than 14,400 mm. It can be seen that the COF in Figure 5b is much larger than that in Figure 5a when the sliding distance is 3600 mm. Furthermore, the sliding distance for the stage of rapid growth is shorter in Figure 5b. This is because the larger contact load more easily causes severe surface wear of the wire rope in the initial stage of the experiment. Thus, the wear region grows faster and friction pairs reach the relatively stable stage faster under this contact condition.

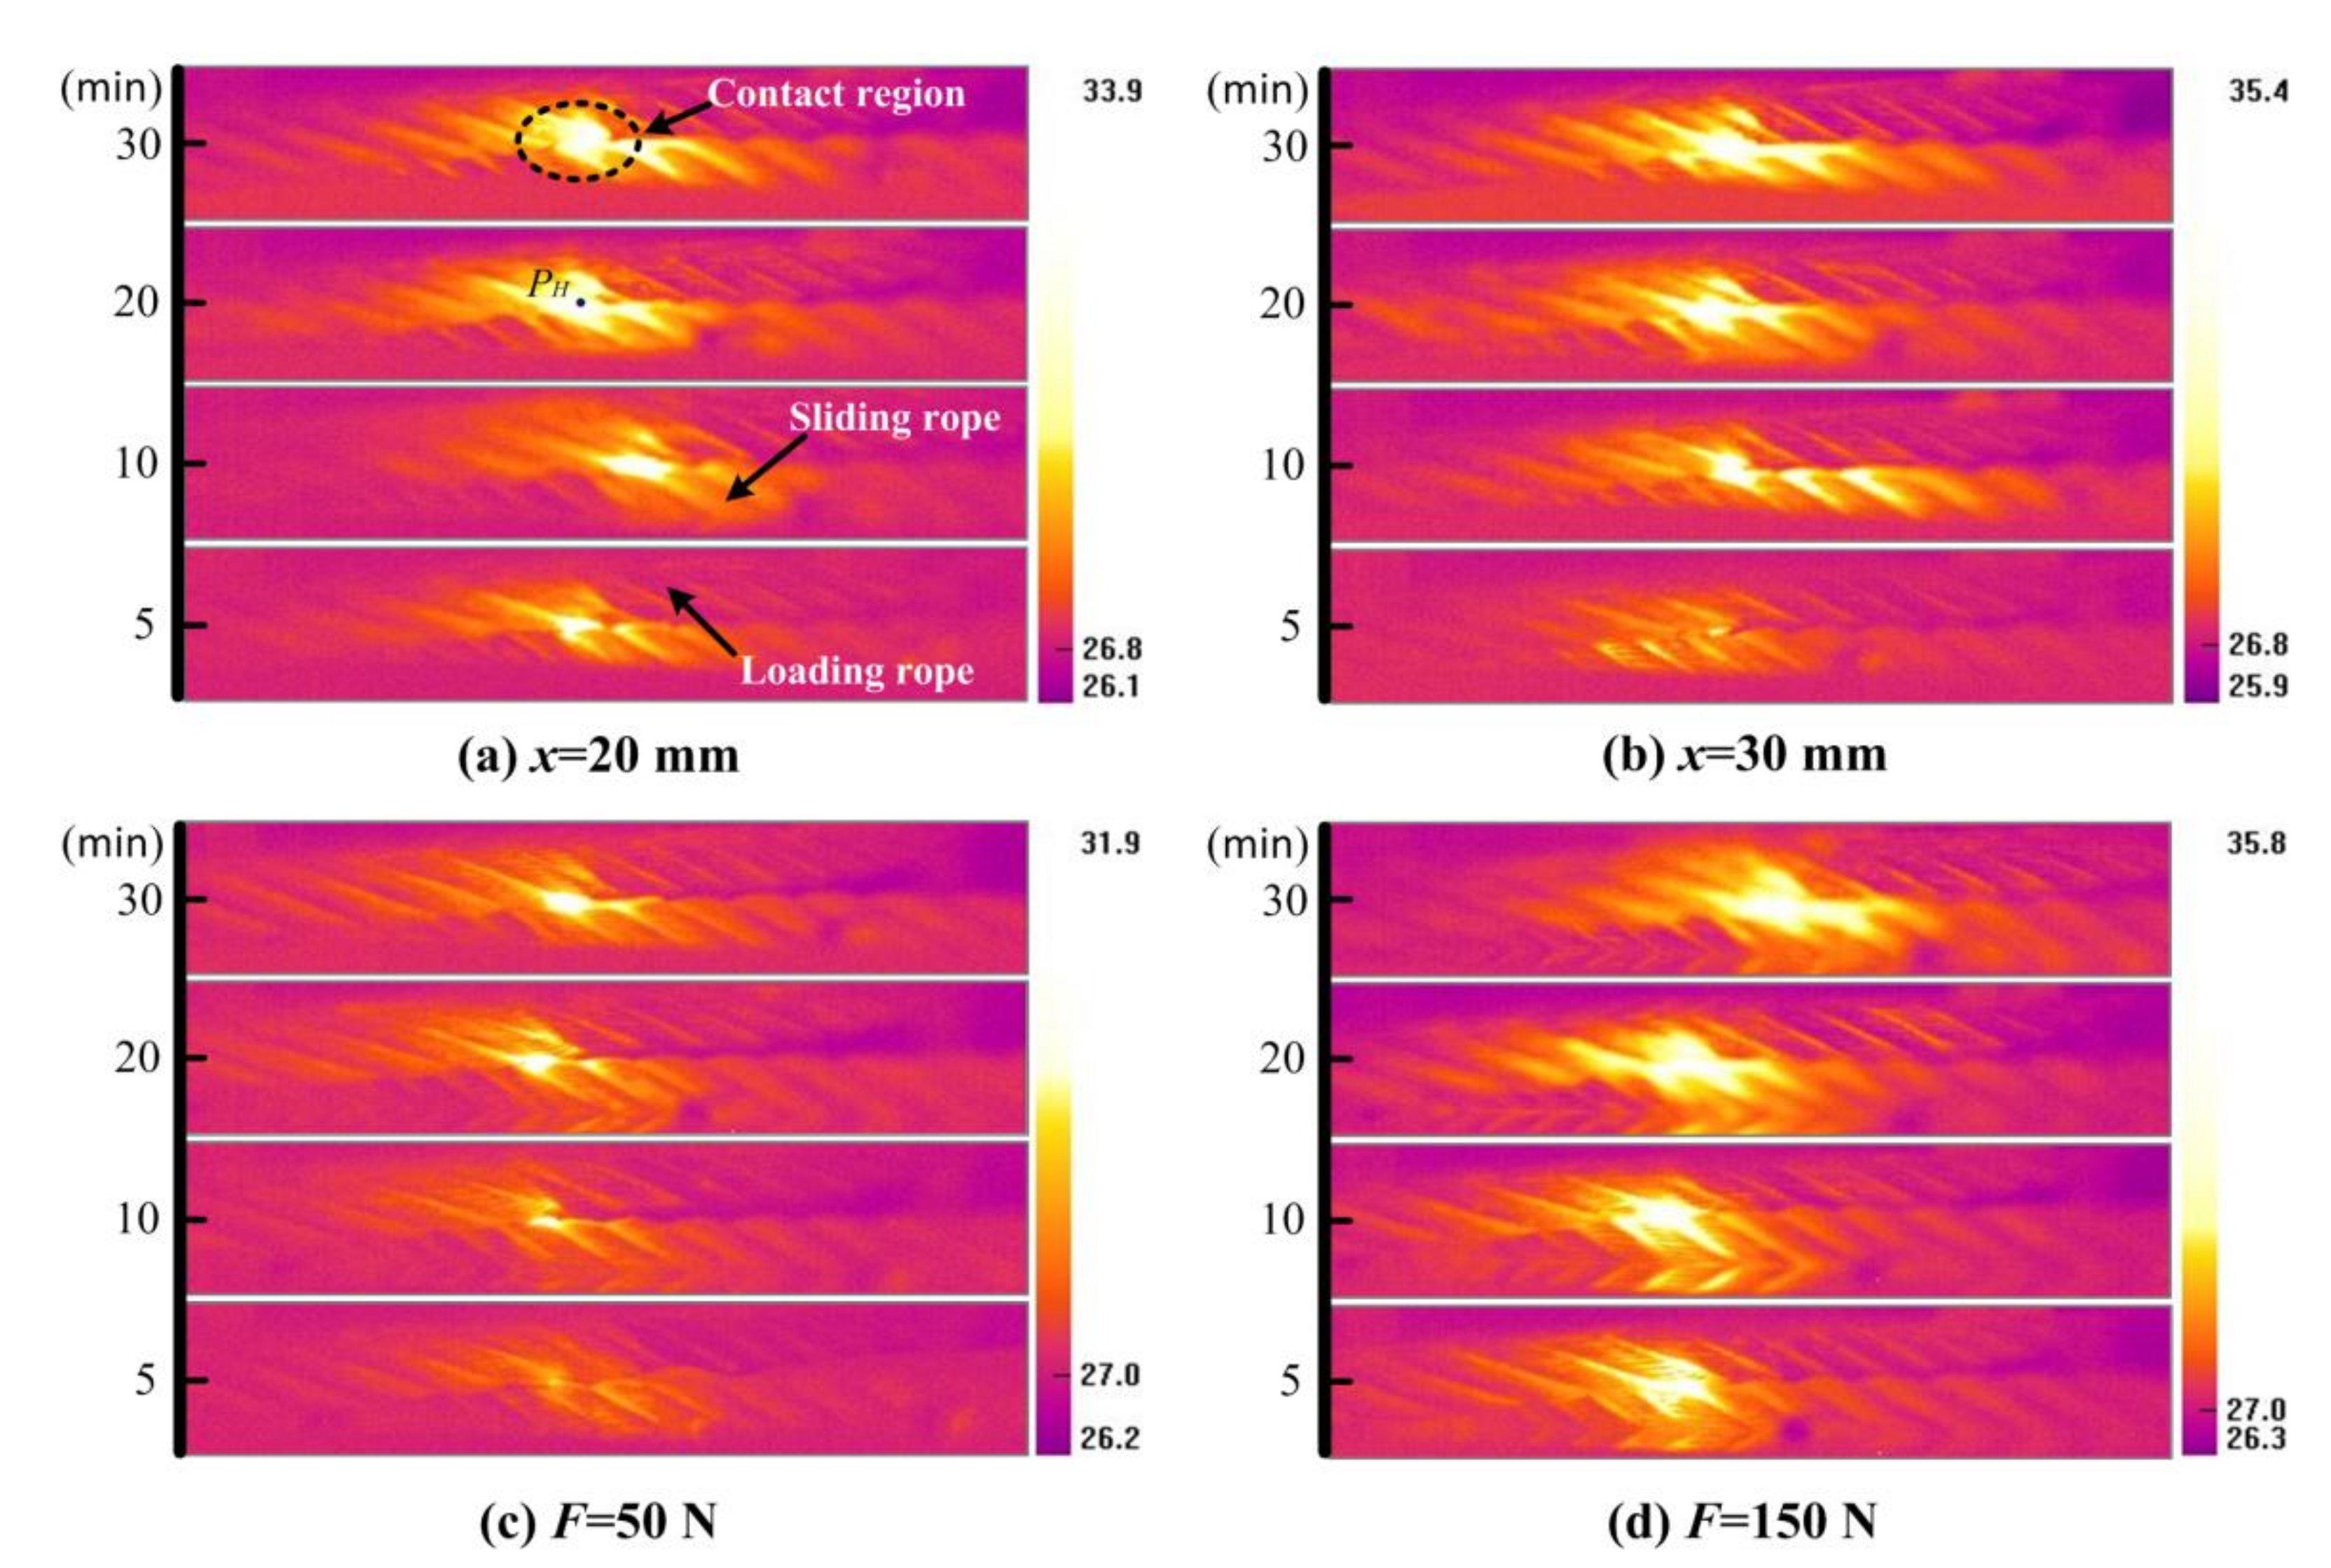
3.2. Evolution of Friction Temperature Rise

Figure 6 shows the infrared thermograms of the contacted two wire ropes under different contact conditions. Additionally, to investigate the evolution properties, the images observed at different test times are presented in Figure 6a–d, respectively. There is a clear bright area in each infrared thermogram, which indicates the sliding contact region. This means the high temperature is concentrated in the wear region. Furthermore, the color in the contact region becomes brighter when the experimental time increases from 5 min to 30 min. This indicates that the temperature in the wear region increases as the experiment proceeds. When the stroke is 20 mm, the evolution of the color is even but when the stroke increases to 30 mm, the difference in the color between the early two stages (5 min and 10 min) is very obvious, as shown in Figure 6b. This is because the friction heat produced at the beginning of the experiment is less and the heat diffuses faster under the larger sliding stroke. Then, with the wear more severe and the surface of the wear region of the sliding rope preheated when the sliding distance is more than approximately 7200 mm, the temperature rises faster in the contact region under the larger sliding stroke. Moreover, when the contact load is 50 N as shown in Figure 6c, the brighter area is smaller at different test times and the evolution is clearer. However, as the contact load changes to 150 N, the brighter areas are larger and obvious in all test stages (see Figure 6d). Therefore, the high temperature area is larger and the temperature rise is rapid under a larger contact load.
To make a quantitative analysis of the friction temperature rise of the wire ropes, the maximum temperature rise in the wear region was calculated by the thermal infrared imager with a measurement error of 2% of the measuring temperature. The evolution of the temperature rise under different strokes is presented in Figure 7. It is clear that the average temperature rise increases from approximately 0.7 °C to approximately 6.5 °C as the sliding distance changes from 0 to 21,600 mm when the stroke is 20 mm. Additionally, the evolution of the temperature rise curves is similar to that of the COF. The temperature rise increases rapidly before 7200 mm and reaches the relatively stable stage after approximately 14,400 mm. This indicates that the COF and temperature rise of the wire rope depend on the characteristics of the wear surface. In the early stage of the experiment (before 7200 mm), the contact area of the wire rope is small and the surface is more easily damaged. Thus, the contact area increases quickly and leads to rapid growth of the COF and temperature rise. However, the contact pressure will become small with the increase of wear scar. Then, the friction reaches the relatively stable stage gradually with the sliding distance. Furthermore, as the stroke increases to 30 mm, the evolution process is similar to that in Figure 7a, with a large and relatively stable average temperature rise of approximately 7.5 °C.
Figure 8 shows the variation of the temperature rise under different contact loads. It is clear that the contact load plays an important role in temperature rise of the wire rope. The average values increase from approximately 0.7 °C to approximately 4.1 °C with the sliding distance when the contact load is 50 N. However, as the contact load changes to 150 N, the temperature rise increases from approximately 0.6 °C to approximately 7.1 °C with the sliding distance. The values in the relatively stable stage are much larger under this condition. Additionally, the sliding distance for the rapid growth stage is similar (approximately 7200 mm) and it reaches the relatively stable stage faster under a small contact load. Therefore, the contact load can influence the variation range of the temperature rise at different stages, but the effect of the load on the variation tendency is small.

3.3. Wear Charcteristics

After all the friction and wear tests, the wear characteristics of the upper loading ropes were analyzed. Figure 9 presents the optical micrographs of the wear scars caused by the experiments with different sliding distances and contact loads. The evolution of the wear region with increasing sliding distance clearly appears. When the stroke is 20 mm, as shown in Figure 9a–d, the wear scar region is small before the sliding distance of 7200 mm, and the region is larger after 14,400 mm. Additionally, the wear is mild and the region is distributed on two strands when the sliding distance is 3600 mm. The wear area on one strand is divided into three parts by the gaps between the outer wires because of the low wear depth. Then, with the increase of sliding distance, the depth and area become larger, especially when the sliding distance changes from 7200 mm to 14,400 mm, and the growth of the wear scar becomes very obvious. This indicates that the wear is severe during this stage. Furthermore, in the relatively stable stage, there are two types of distribution for the wear scars and the surface wear is severe, as shown in Figure 9c,d. The wear region is distributed on two strands and the surface is relatively regular when the sliding distance is 14,400 mm. Another type is shown in Figure 9d; the wear concentrates on one strand and the surface is irregular, which is composed of many grooves caused by the wires. Moreover, the variation of the wear surface under a stroke of 30 mm is more obvious, as shown in Figure 9e–h. There are only two wires in the wear region and the surface is smooth when the sliding distance is 3600 mm. When the sliding distance increases to 7200 mm, the wear region contains four wires and the surface is rough. Further, as the distance changes to 14,400 mm and 21,600 mm, the wear on the rope surface becomes very severe. The broken wires appear clearly in the wear region. Therefore, the wear scar of the wire rope is constantly changing with the increase of sliding distance and the growth rate is different at different wear stages. The value is larger before the sliding distance of 14,400 mm. Moreover, the wear is more severe under a larger stroke.
Figure 10 presents the optical micrographs of the wear scars under different contact loads. The surfaces under different sliding distances are shown in Figure 10a–d (50 N) and Figure 10e–h (150 N), respectively. The variation tendency of the wear scar is similar to that in Figure 9. The wear area is small but grows quickly in the early stages. Then, the wear region is larger and more wires are involved in the wear scar region in the relatively stable stage. Additionally, it can also be seen that the distribution of the wear scar mainly depends on the wear depth. Because the sliding contact surface of the wire rope is a cylinder, the area is very small at the beginning of the experiment. Then, with the increase of wear depth, the wear region expands. Furthermore, as the surface of the rope consists of seven strands, the wear scar is distributed occasionally on two strands with the increase of wear depth (see Figure 10c,d). As the contact load changes to 150 N, the wear is more severe compared with that in Figure 10a–d. The damaged internal wires appear in the wear region, as shown in Figure 10h, which indicates that the wear depth is larger than the diameter of the wires. Additionally, it can also be seen in the figures that the wear scar is divided into many parts by the gaps between the wires and strands in the early stage. However, with the increase of sliding distance, the wear scar is divided into only two parts with the gap between two adjacent strands and the gap becomes small with the wear, as shown in Figure 10g,h. This indicates that the wear scar grows from the wire surface to the strand surface with the sliding distance, and the effect of the contact load on the degree of the surface wear is very obvious.
Figure 11 presents the SEM micrographs of the wear debris produced during the friction and wear tests. The micrographs with small magnification are shown in Figure 11a,b. It can be seen that the sizes of the thin flake debris are different and the debris surface is uneven. As the rope wires are galvanized and the outer surface is damaged in the early stage, the debris comes mainly from spalling of the galvanized layer, as shown in Figure 11c. The surface of the debris is smooth. Additionally, the wear surface is subjected to repeated extrusion and sliding, with many cracks on the surface of the debris, as shown in Figure 11d. Furthermore, the debris is very thin and plastic deformation occurs on the surface. This indicates that the debris is mainly produced by shear and extrusion.
To quantitatively analyze the wear process of wire ropes, the mass of debris produced by each experiment was measured. Figure 12 shows the variation of the wear mass loss with the sliding distance under different conditions. Figure 12a presents the evolution of the wear loss under different strokes. It increases from approximately 4.4 mg to approximately 37.5 mg with the sliding distance changing from 3600 mm to 21,600 mm. Additionally, the wear loss increases from approximately 6 mg to approximately 46 mg with the sliding distance when the stroke is 30 mm. It is clear that values are similar at the sliding distance of 3600 mm, but the difference becomes much larger (more than twice) as the distance increases to 7200 mm and 14,400 mm when the stroke is 30 mm. Furthermore, the wear loss increases rapidly between the distance of 7200 mm and 14,400 mm, from approximately 19.7 mg to approximately 42.1 mg. This means that for a larger stroke, wear debris is more easily produced and the growth is more obvious with the sliding distance. Moreover, the variation of the wear loss under different contact loads is shown in Figure 12b. The increase range is small for the load of 50 N (from approximately 6.8 mg to approximately 23.8 mg). As the load changes to 150 N, the wear loss increases from approximately 13.1 mg to approximately 65.5 mg. The variation is very obvious after the sliding distance of 7200 mm. Furthermore, the change is small as the sliding distance increases from 3600 mm to 7200 mm. This indicates that the wear loss is low and the increase is slow in the early stage of the experiment and the values are much larger in the relatively friction stable stage compared with that in the early stage. Therefore, the wear is an intensifying process. There is no relatively stable stage for the wear loss during the experiment.
As the wear surface of the rope consists of many surfaces of the wires, investigating the surface characteristics of the wires in the wear scar region can reveal the wear behavior and wear mechanisms of the rope. Figure 13 presents the SEM micrographs of the wear surface with different morphology features. The surface characteristics can be divided into a relatively regular surface and an irregular surface, as shown in Figure 13a–c and Figure 13d,e, respectively. The edge of the wear region is relatively flat, which more easily causes shear and plastic extrusion of the material. This is the reason why the wear debris resembles thin flakes. Additionally, the wear characteristics of the relatively regular surface are spalling and furrows. Figure 13a,b presents wear debris that is about to spall and the spalling pit. It is mainly caused by fatigue and adhesion. Furthermore, as the surface of the wire rope is very complex, uneven wear surface is more easily caused, especially under large contact load and stroke. The sliding reciprocating track is unstable under these conditions, which cause larger furrows and obvious plastic deformation, as shown in Figure 13d–f. The surface is irregular and the deformation is severe on the edge. Therefore, in this article, the major wear characteristics of the wire rope are fatigue spalling, furrows, and plastic deformation. The wear mechanisms are adhesion and fatigue.

4. Conclusions

From the above results and analysis, the following conclusions were obtained.
(1)
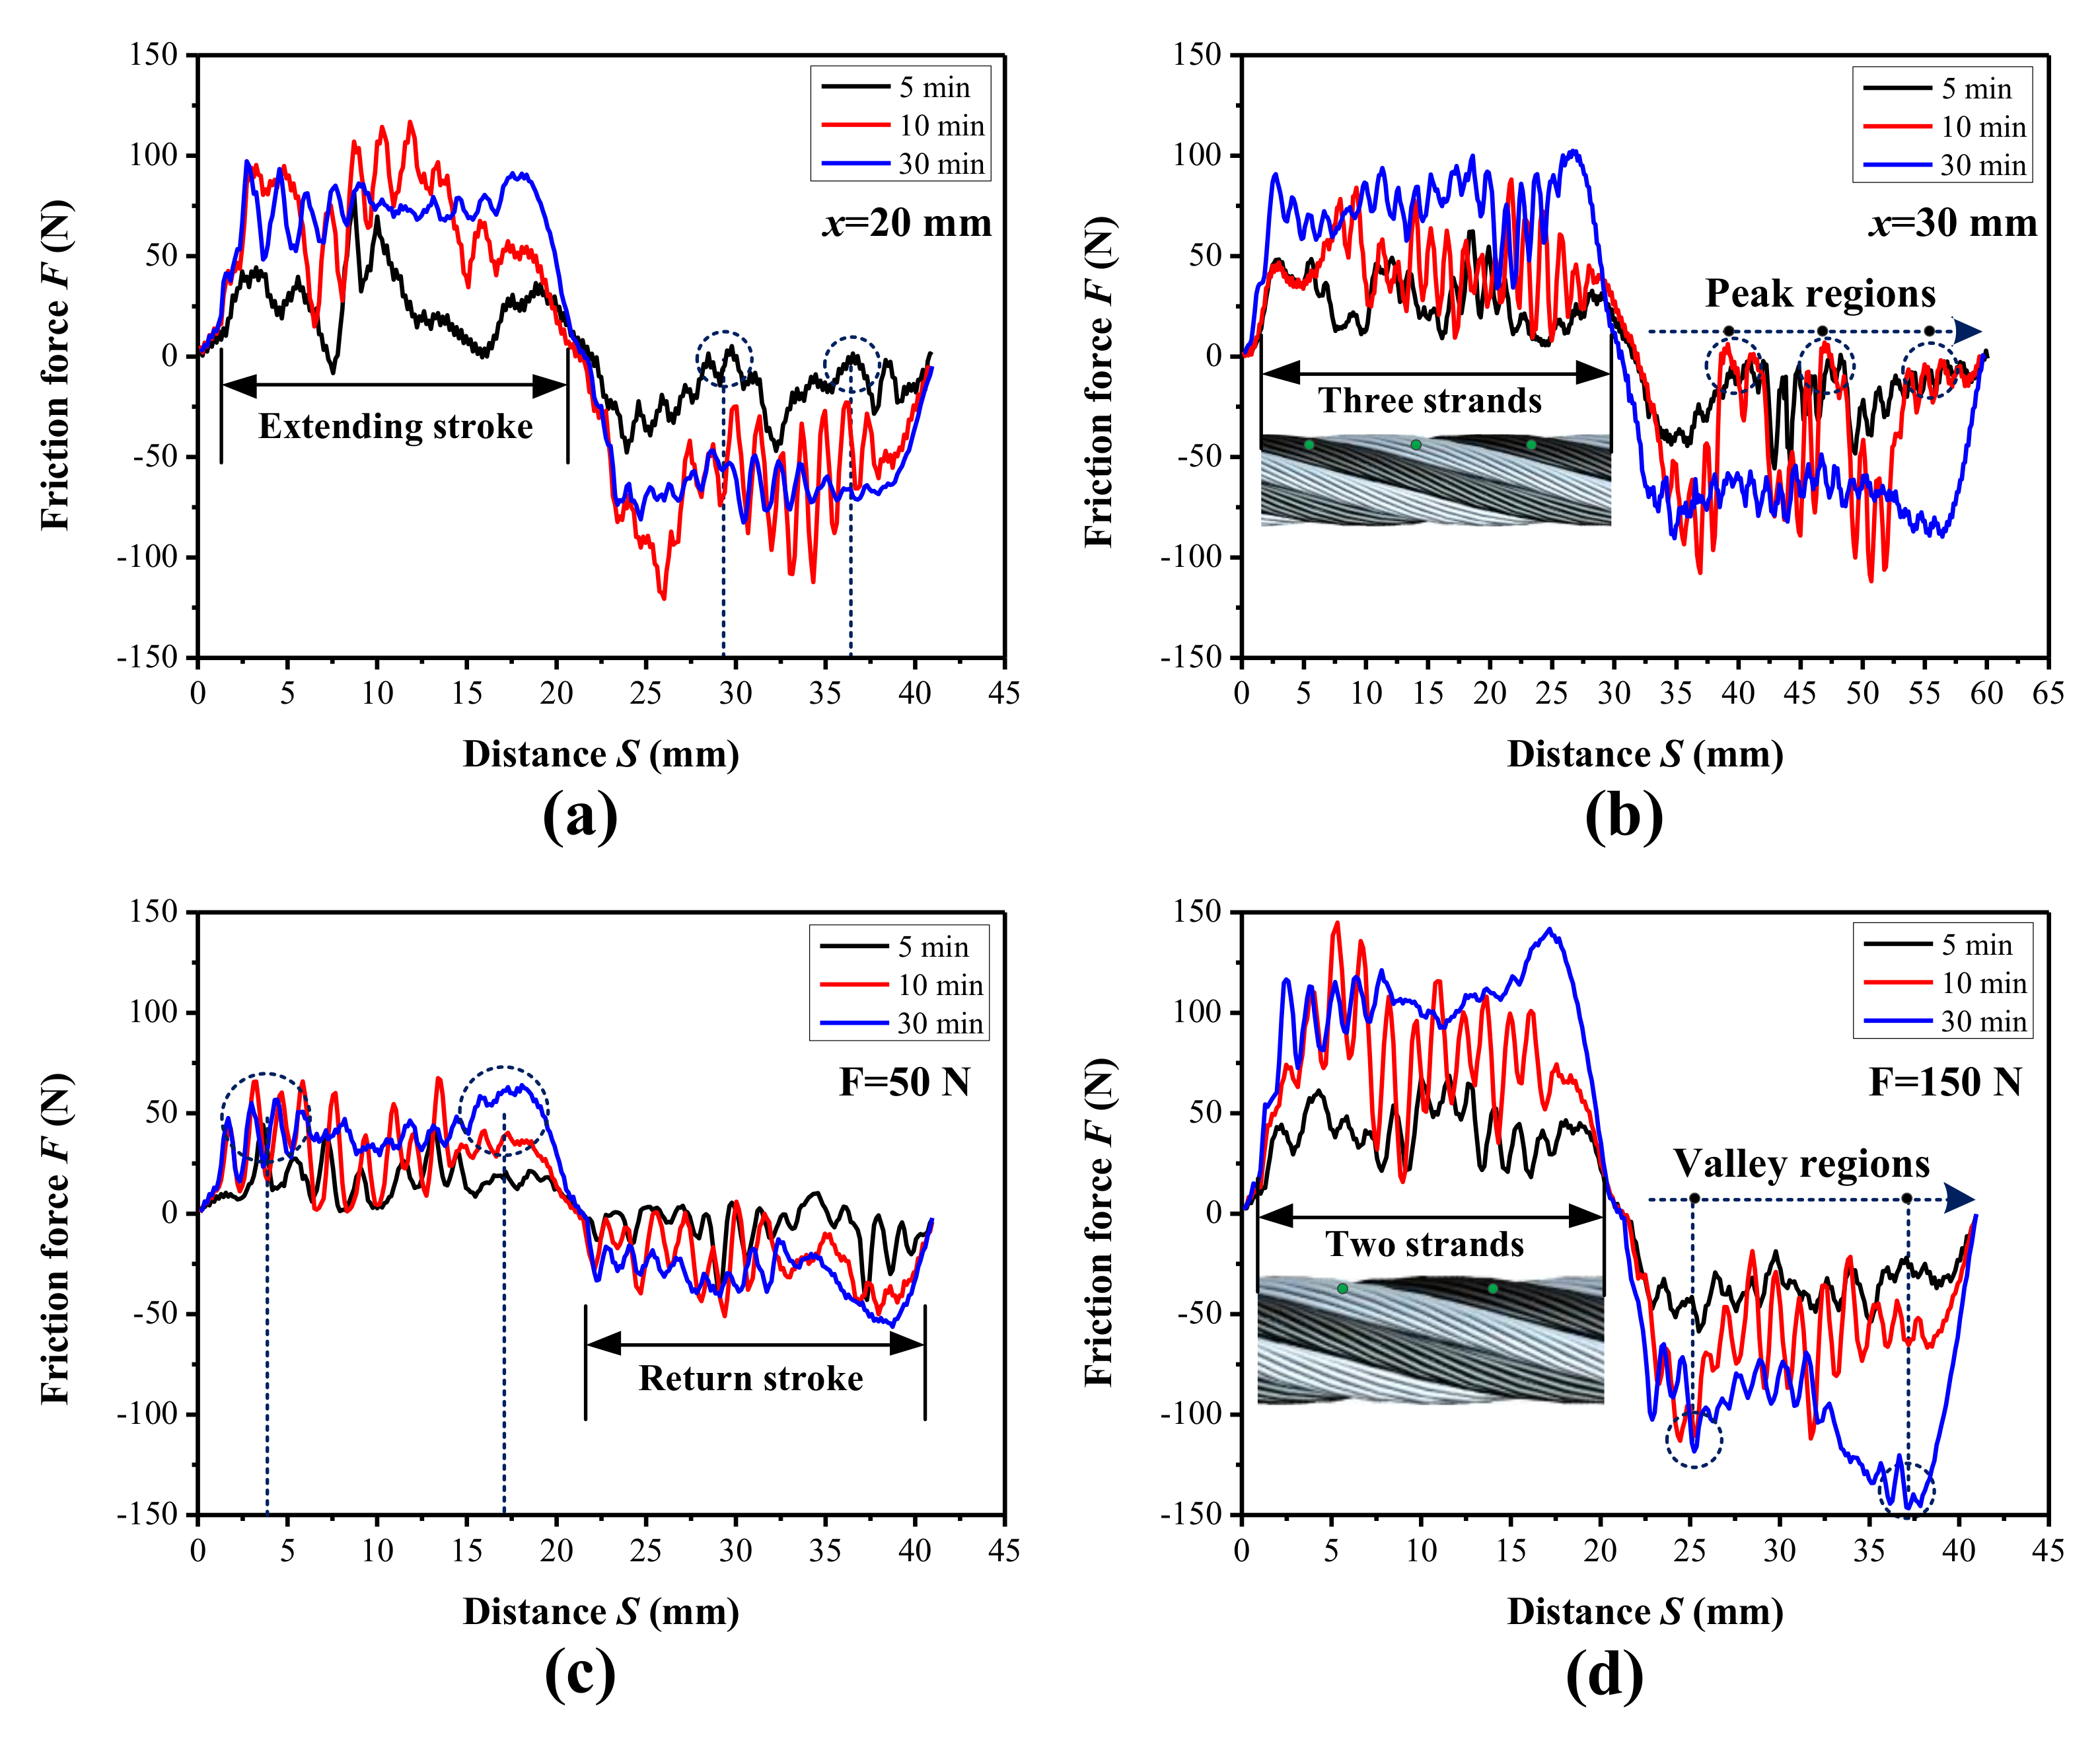
The fluctuation of the friction is larger in the early stage of the experiment, especially around 10 min. The obvious peaks of the curve mainly depend on the stroke. Additionally, there are three strong fluctuation regions for the stroke of 30 mm.
(2)
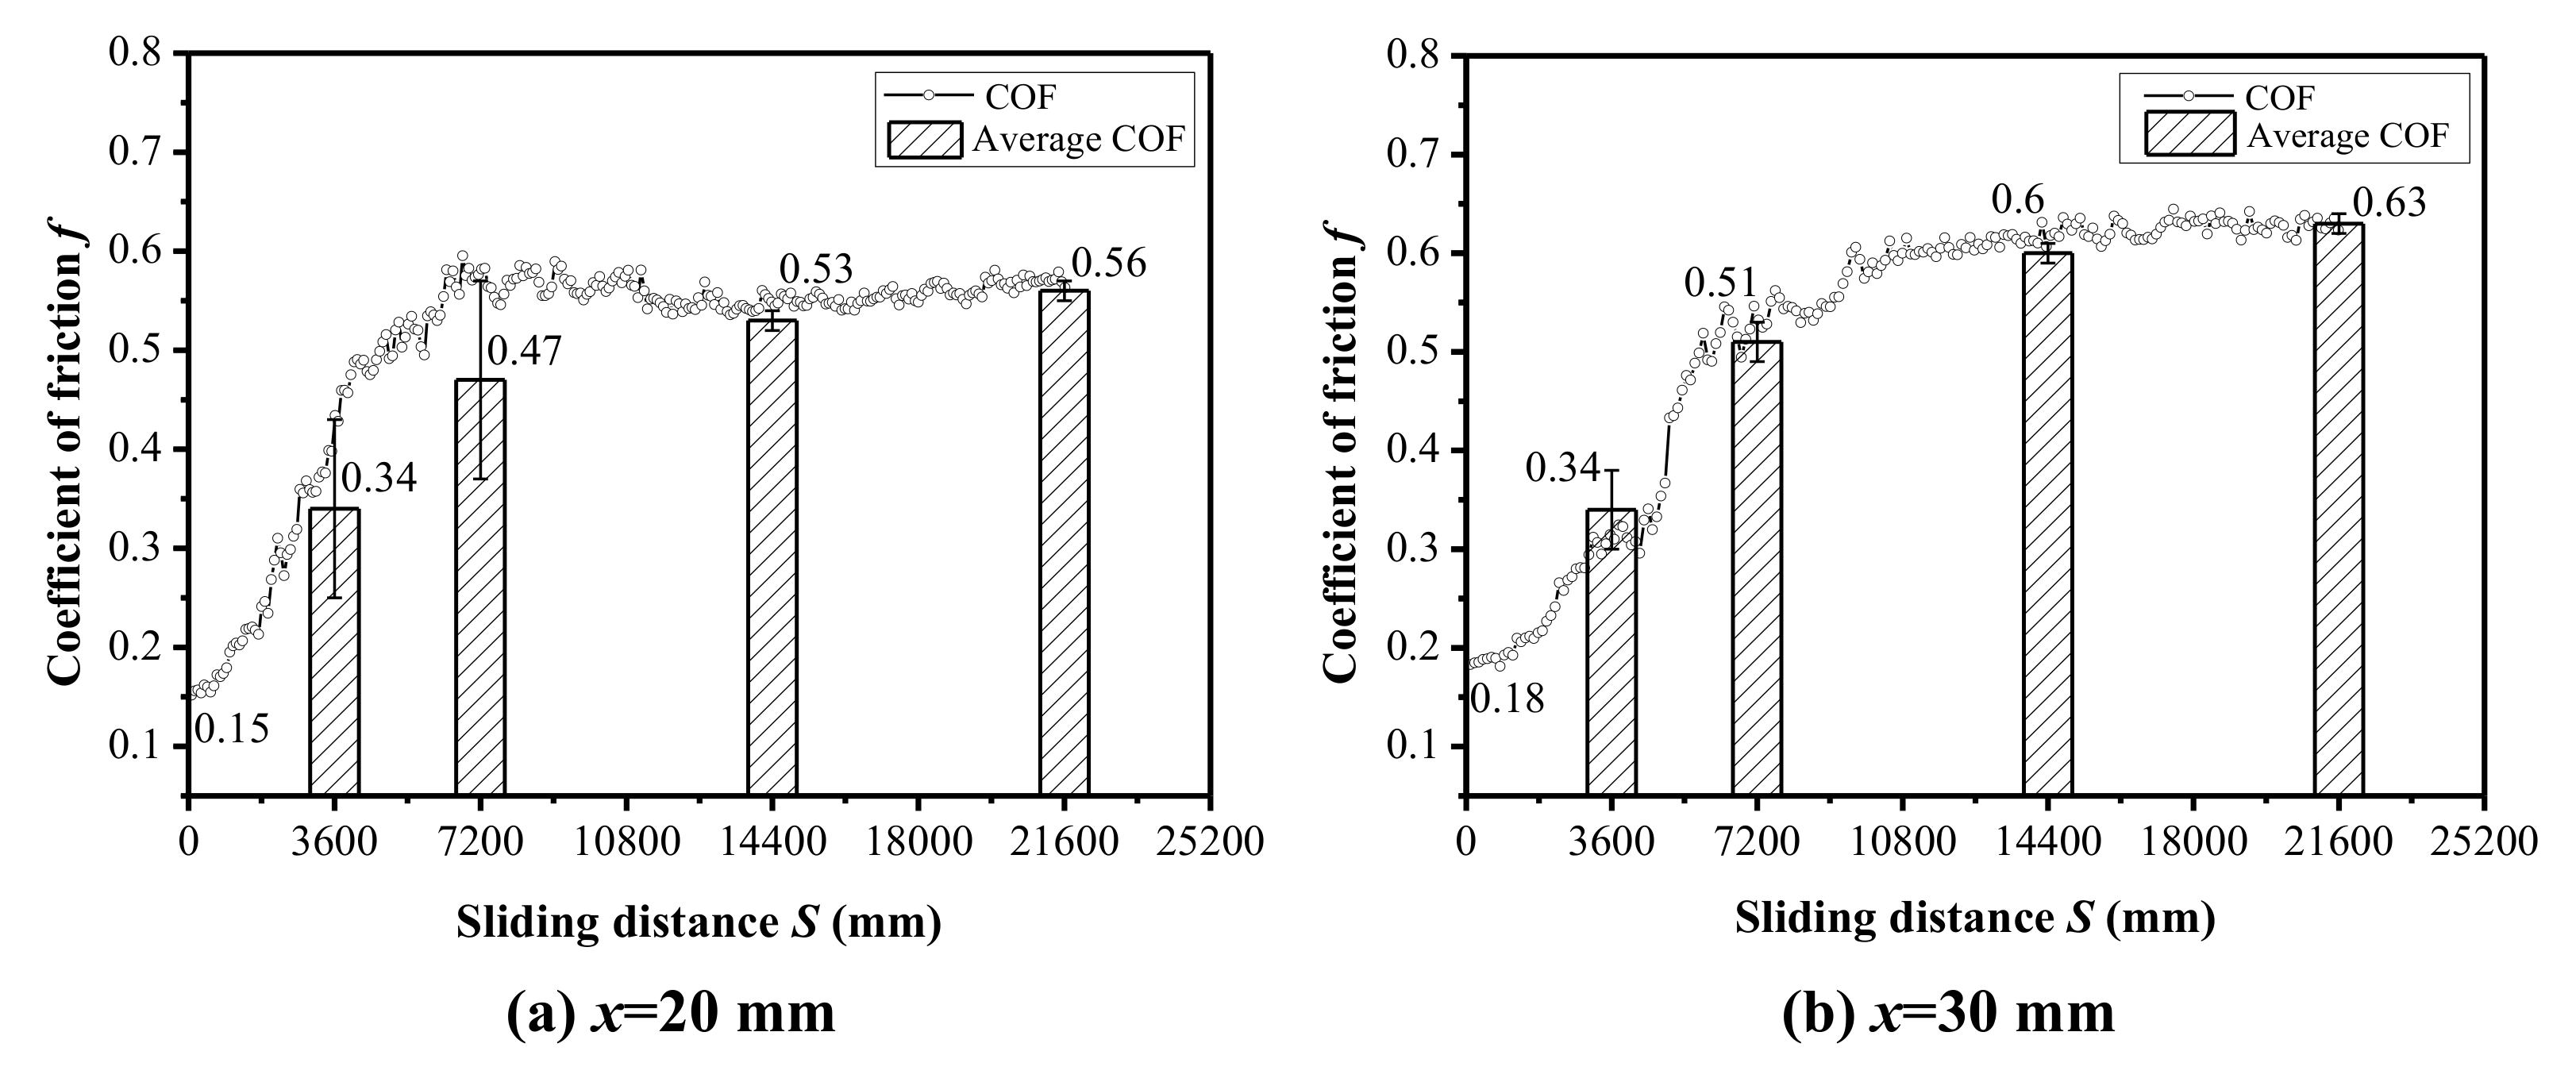
The evolution of the COF can be divided into a rapid-increase stage (before 7200 mm) and a relatively stable stage (after 14,400 mm). The COF increases from approximately 0.48 to 0.61 with the sliding distance when the contact load is 150 N, which is the most rapid growth.
(3)
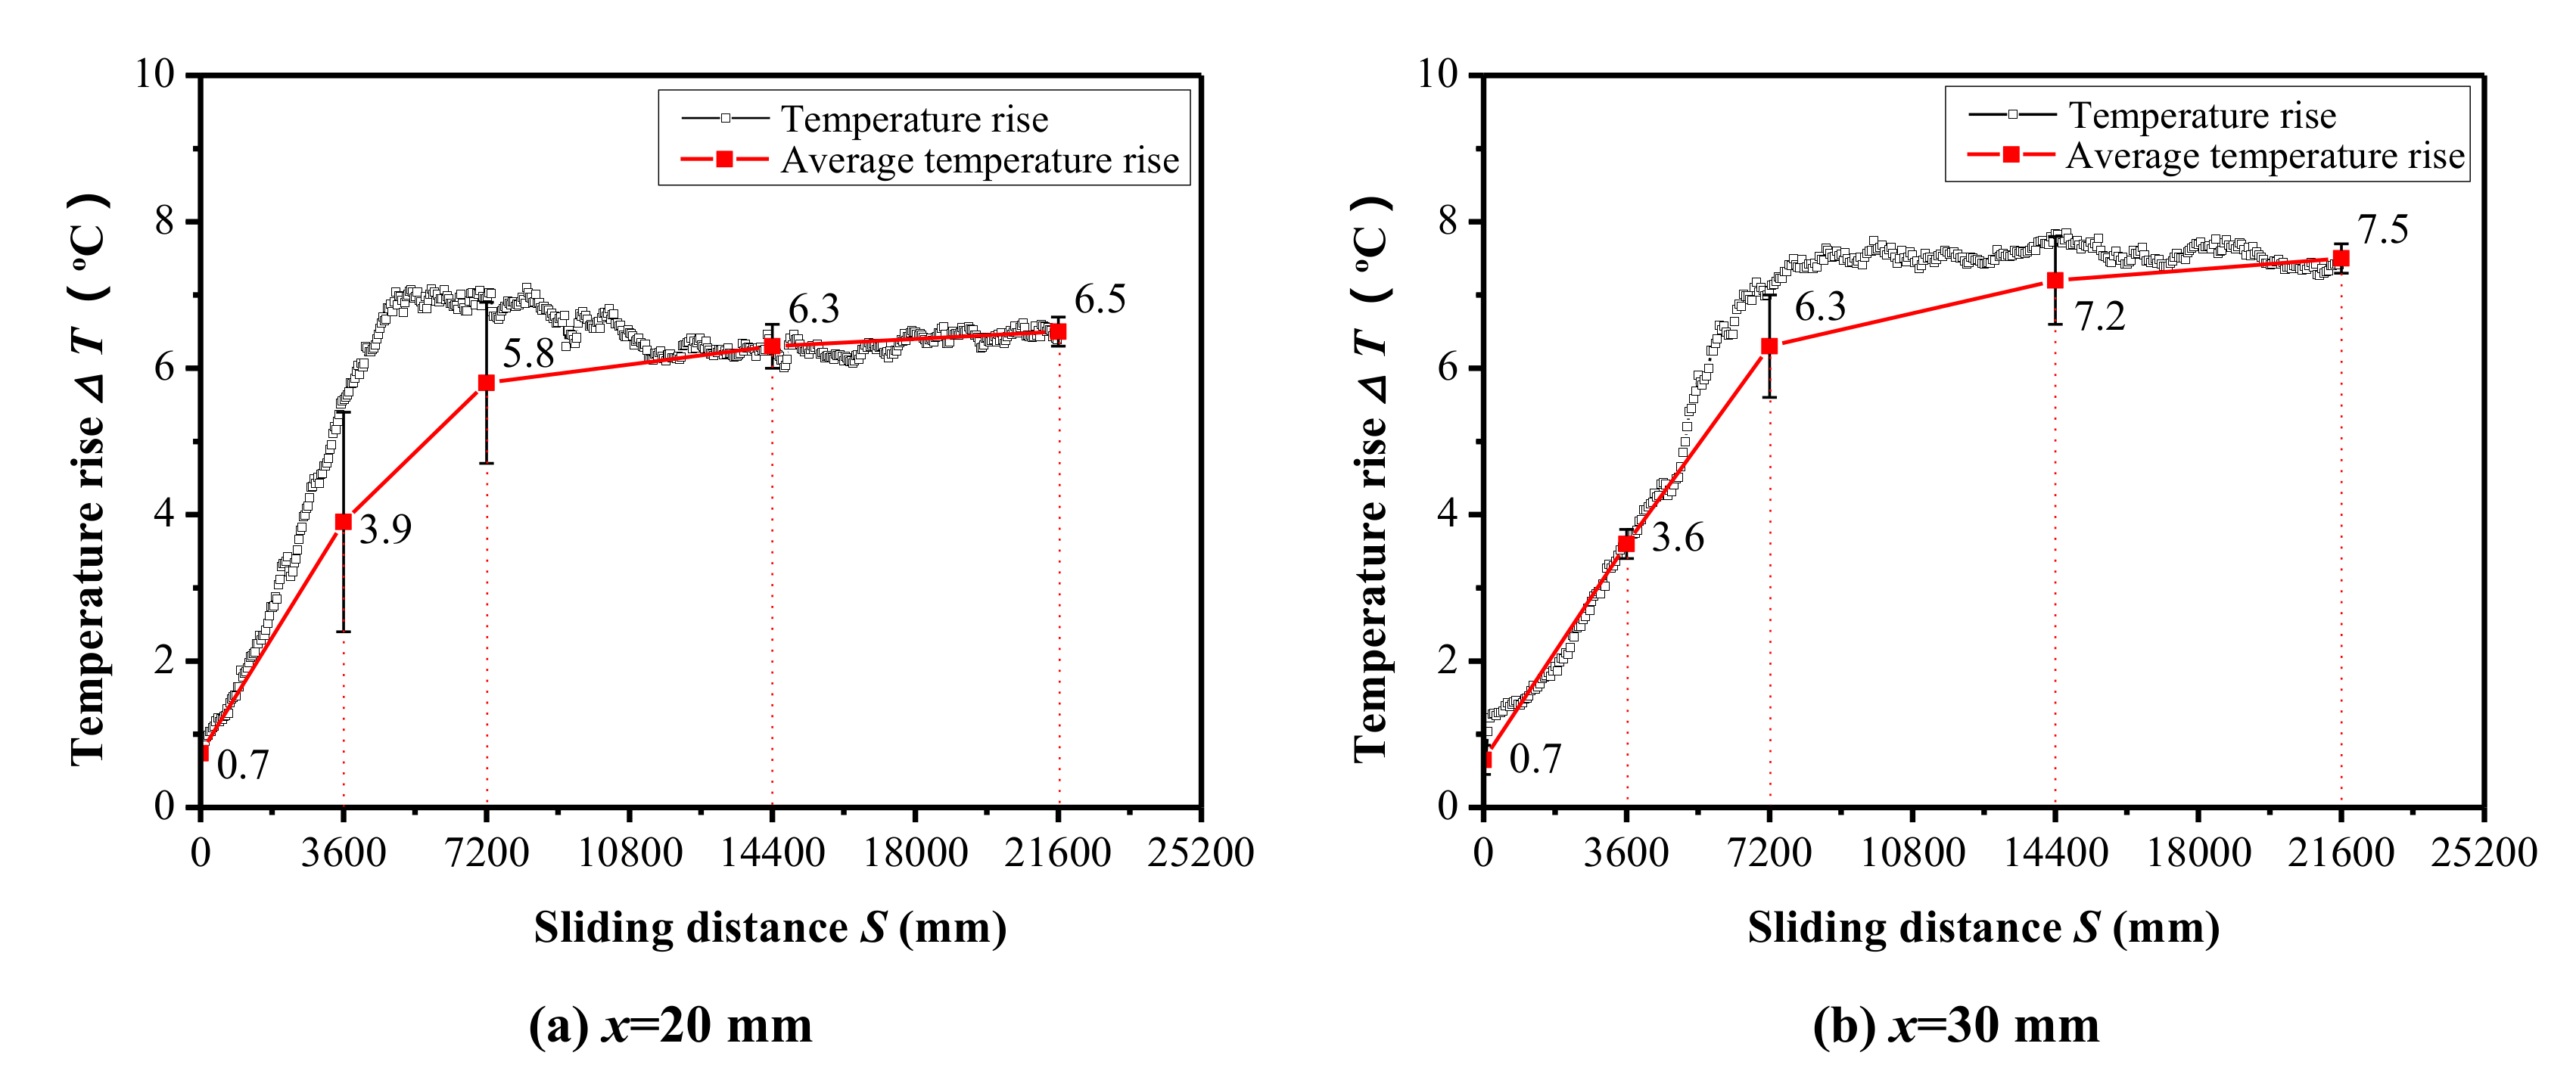
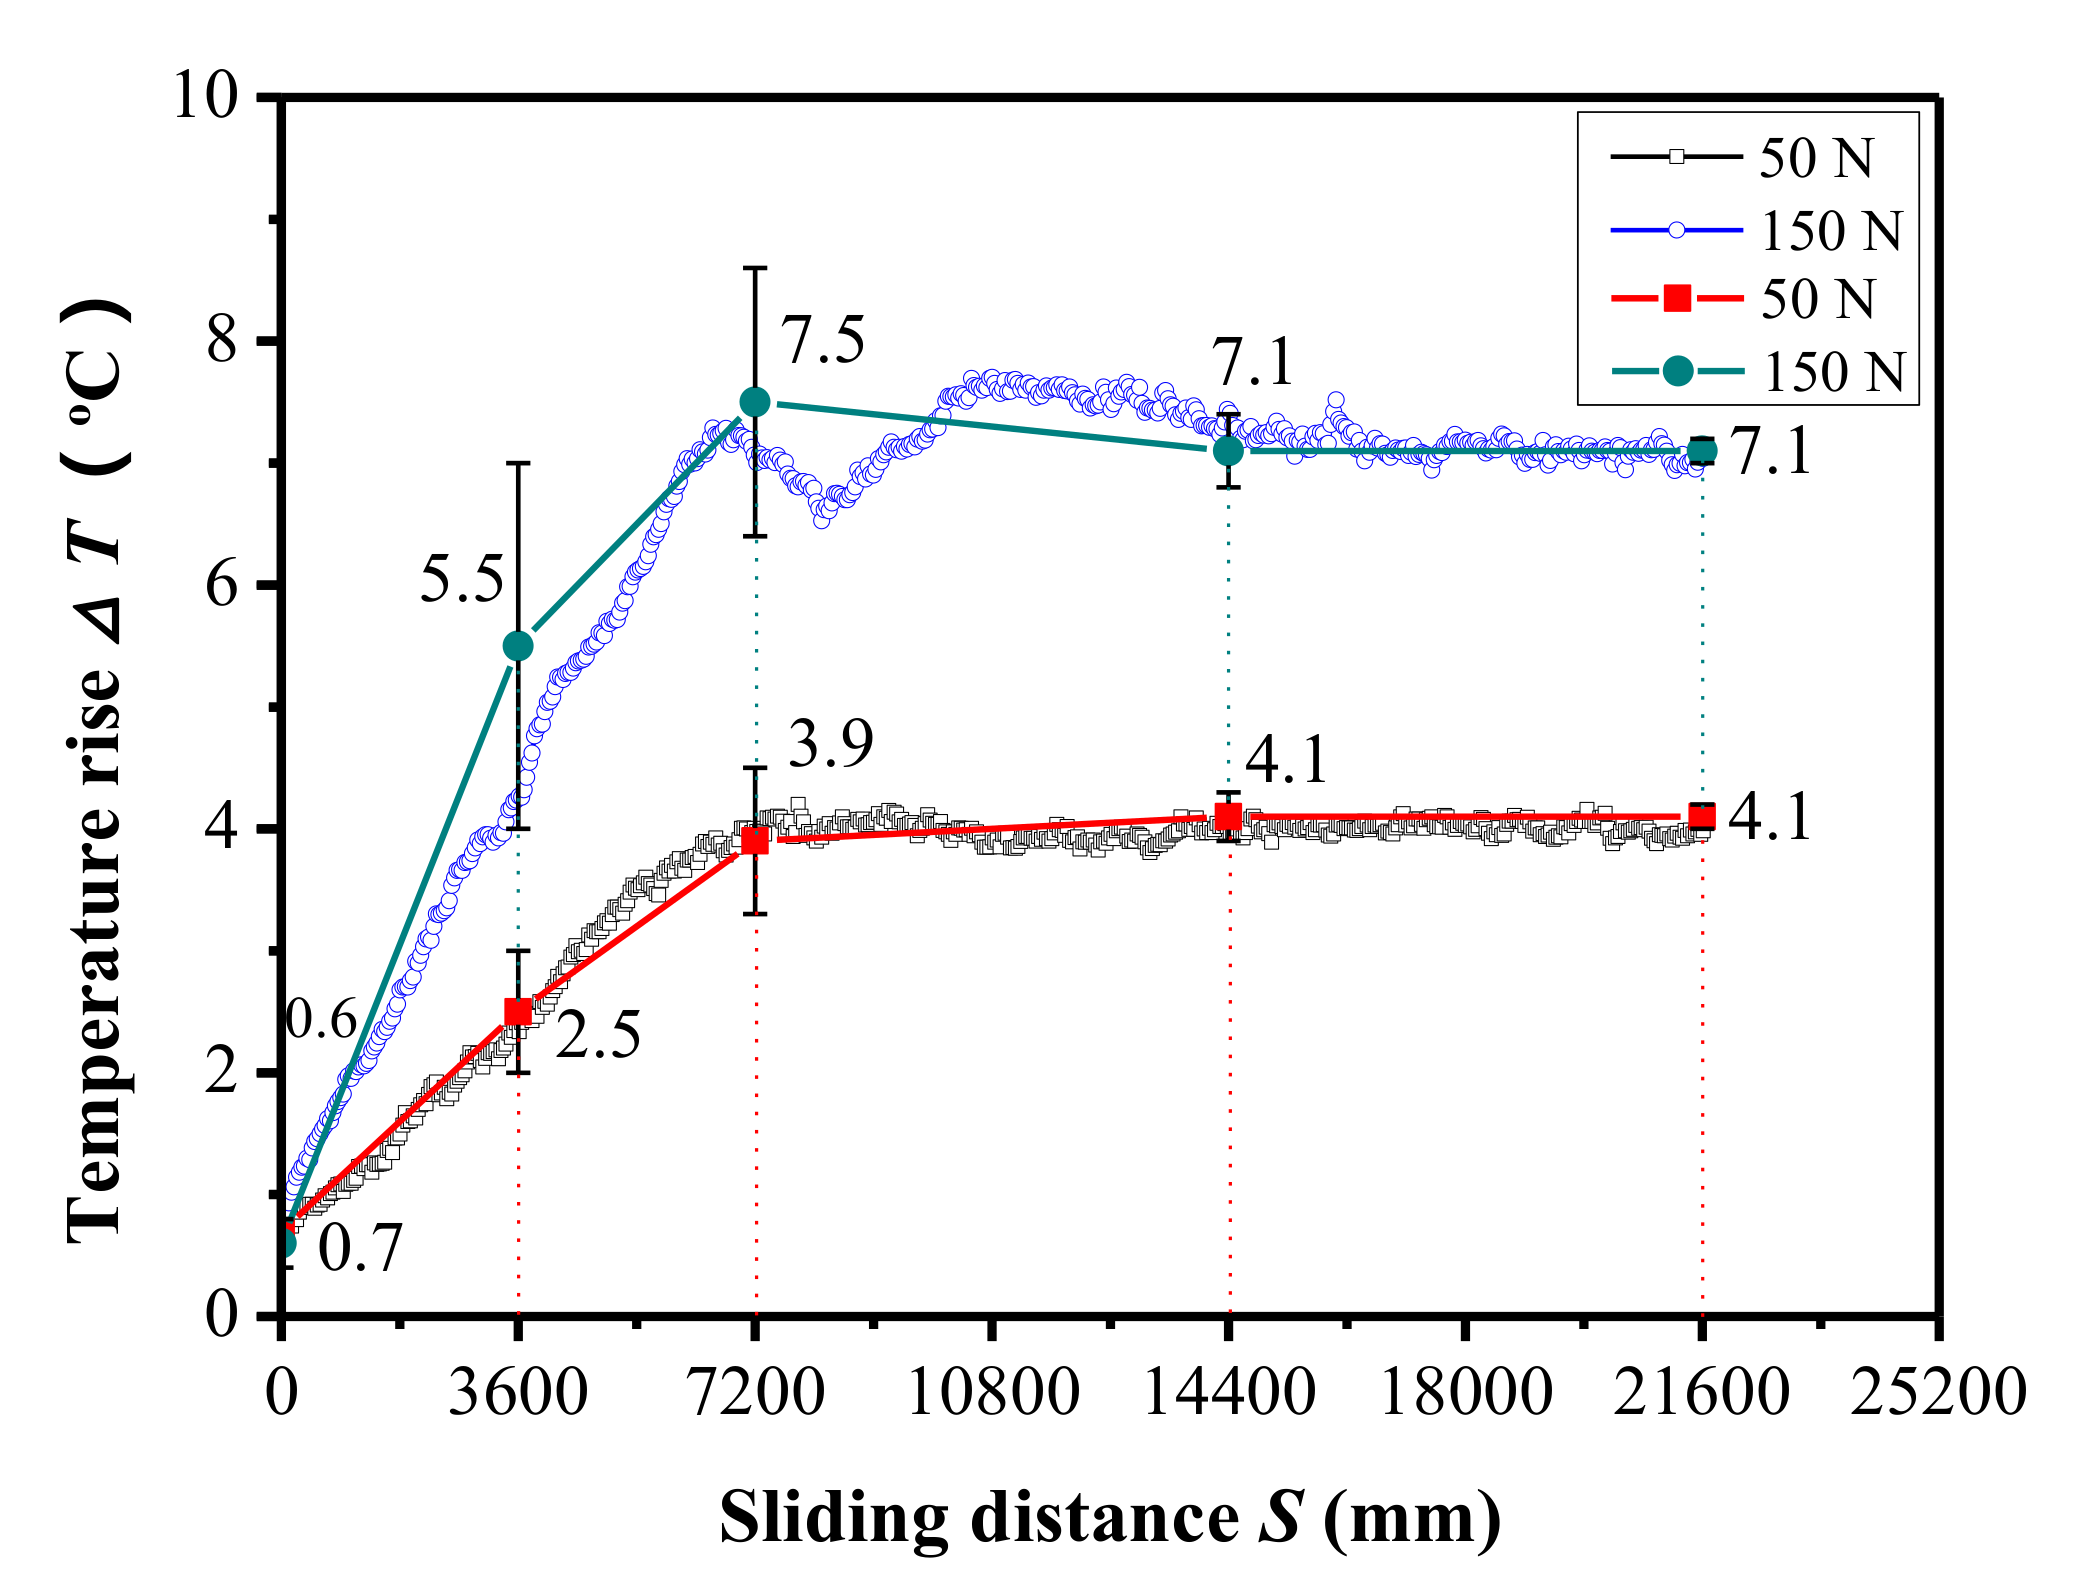
The evolution of temperature rise in the wear region with the sliding distance is obvious. The maximum temperature rises are approximately 7.5 °C and 7.1 °C under the large stroke (30 mm) and contact load (150 N), respectively, which are much larger than those under the small stroke (20 mm) and load (50 N).
(4)
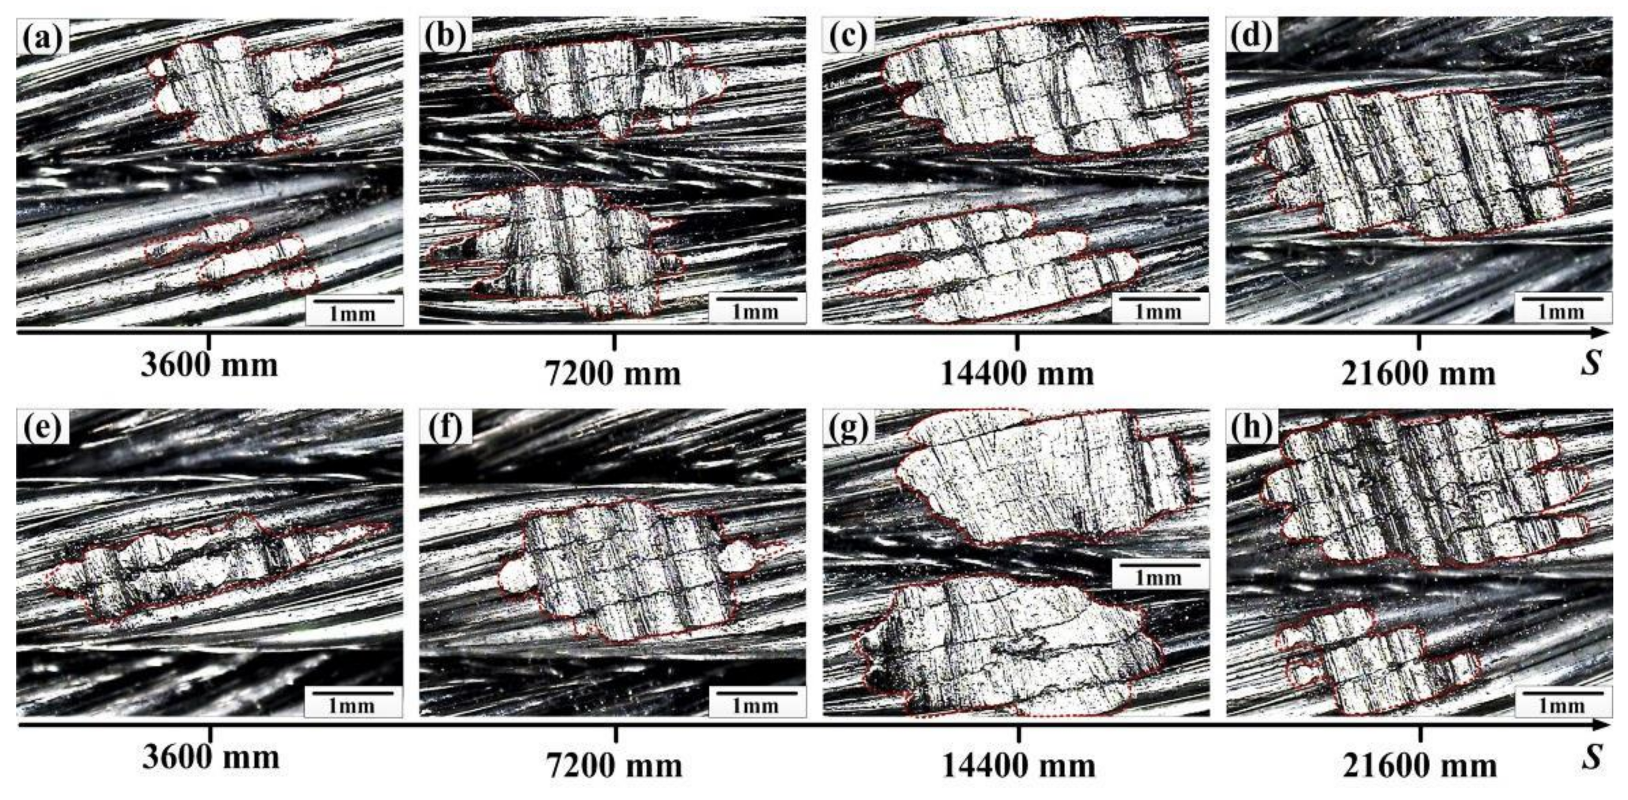
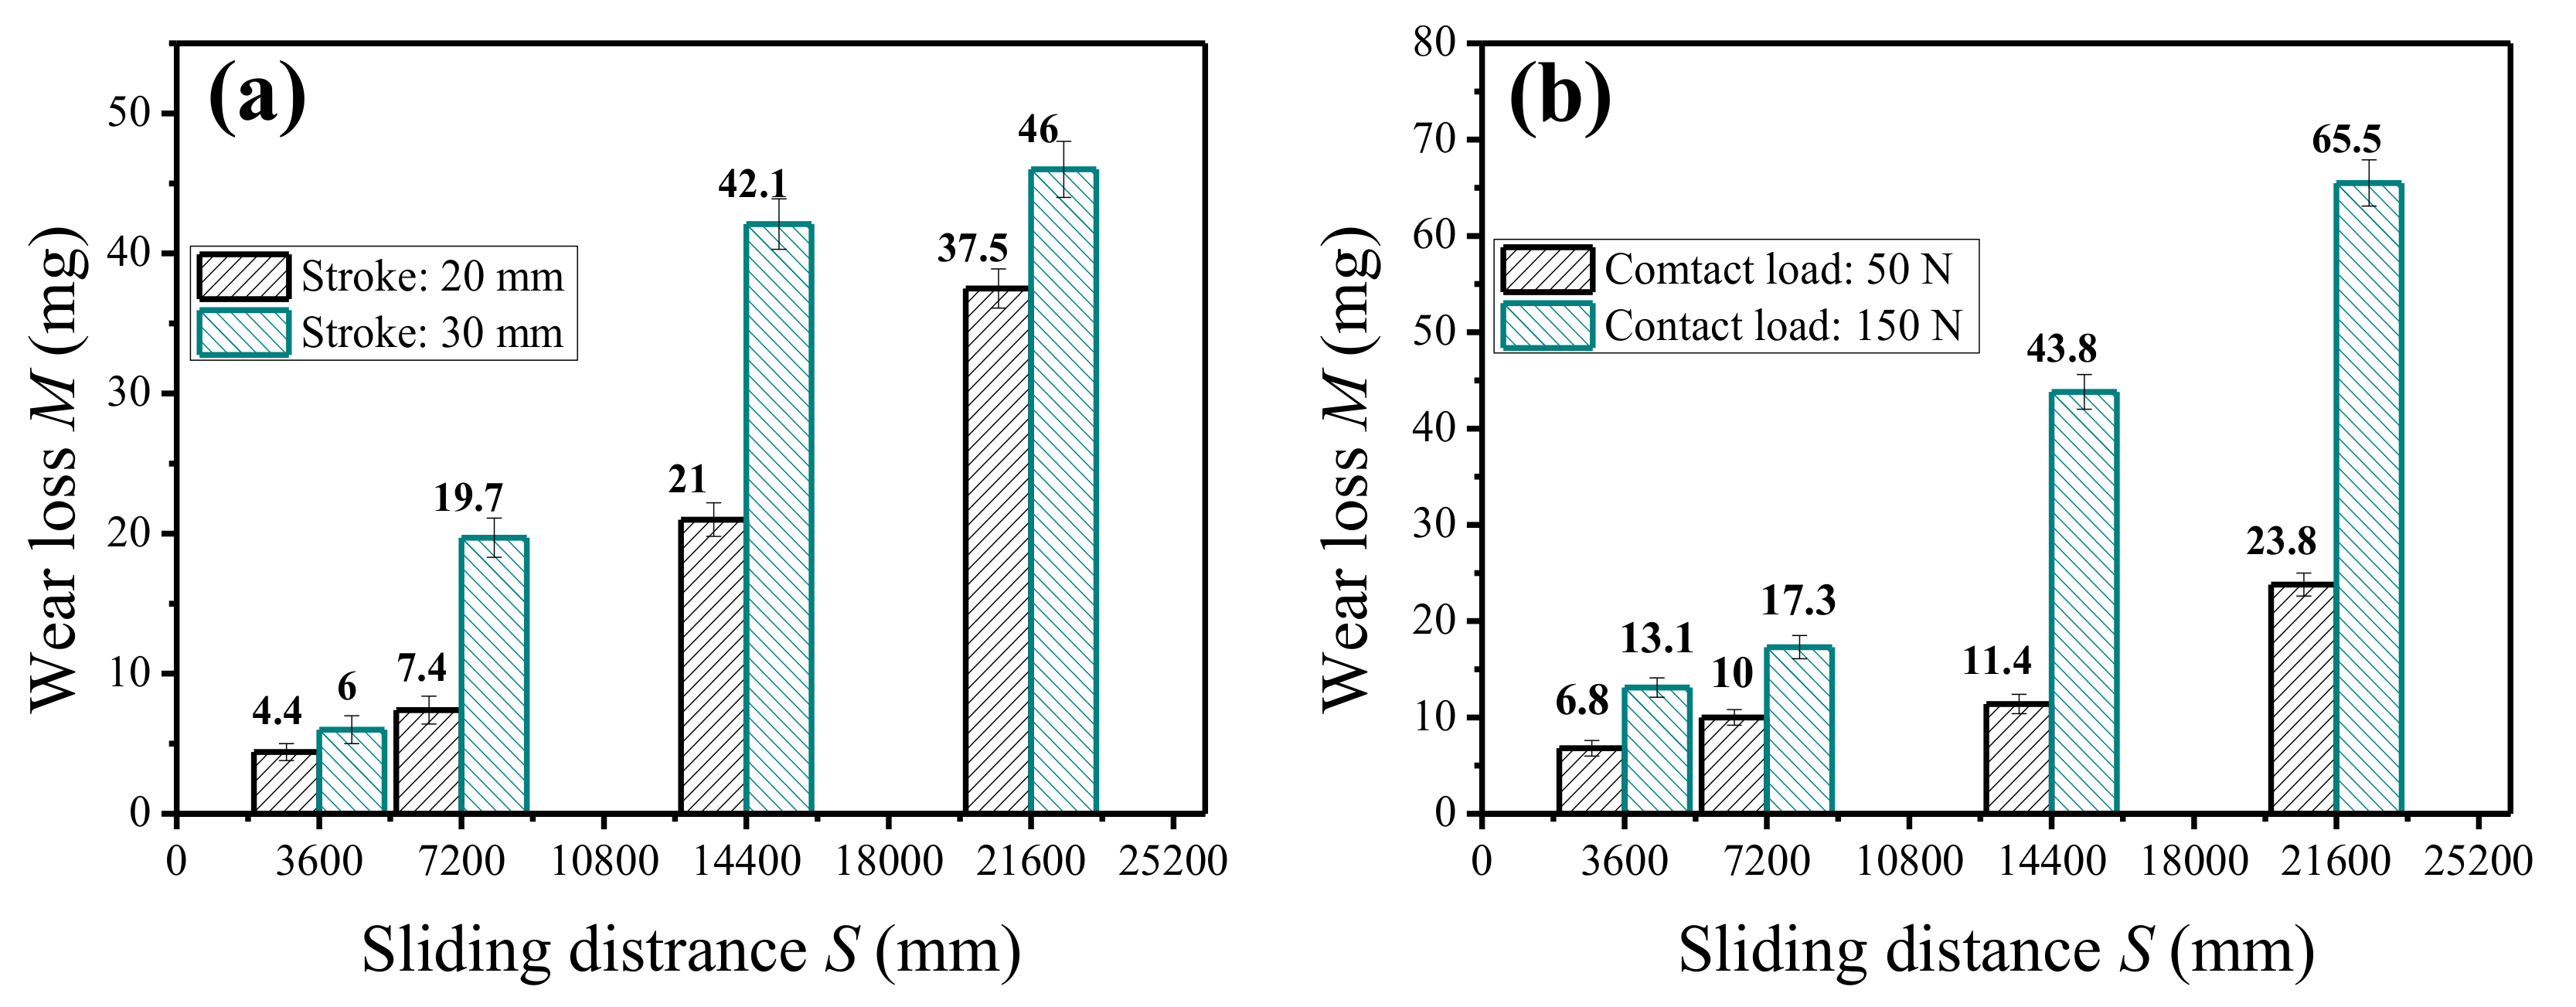
The wear scar region increases with the sliding distance, especially from 3600 mm to 14,400 mm. Additionally, the wear loss of the rope is a growing process with the sliding distance and the values under the large stroke and load are much higher. The maximum wear loss is approximately 65.5 mg at the contact load of 150 N.
(5)
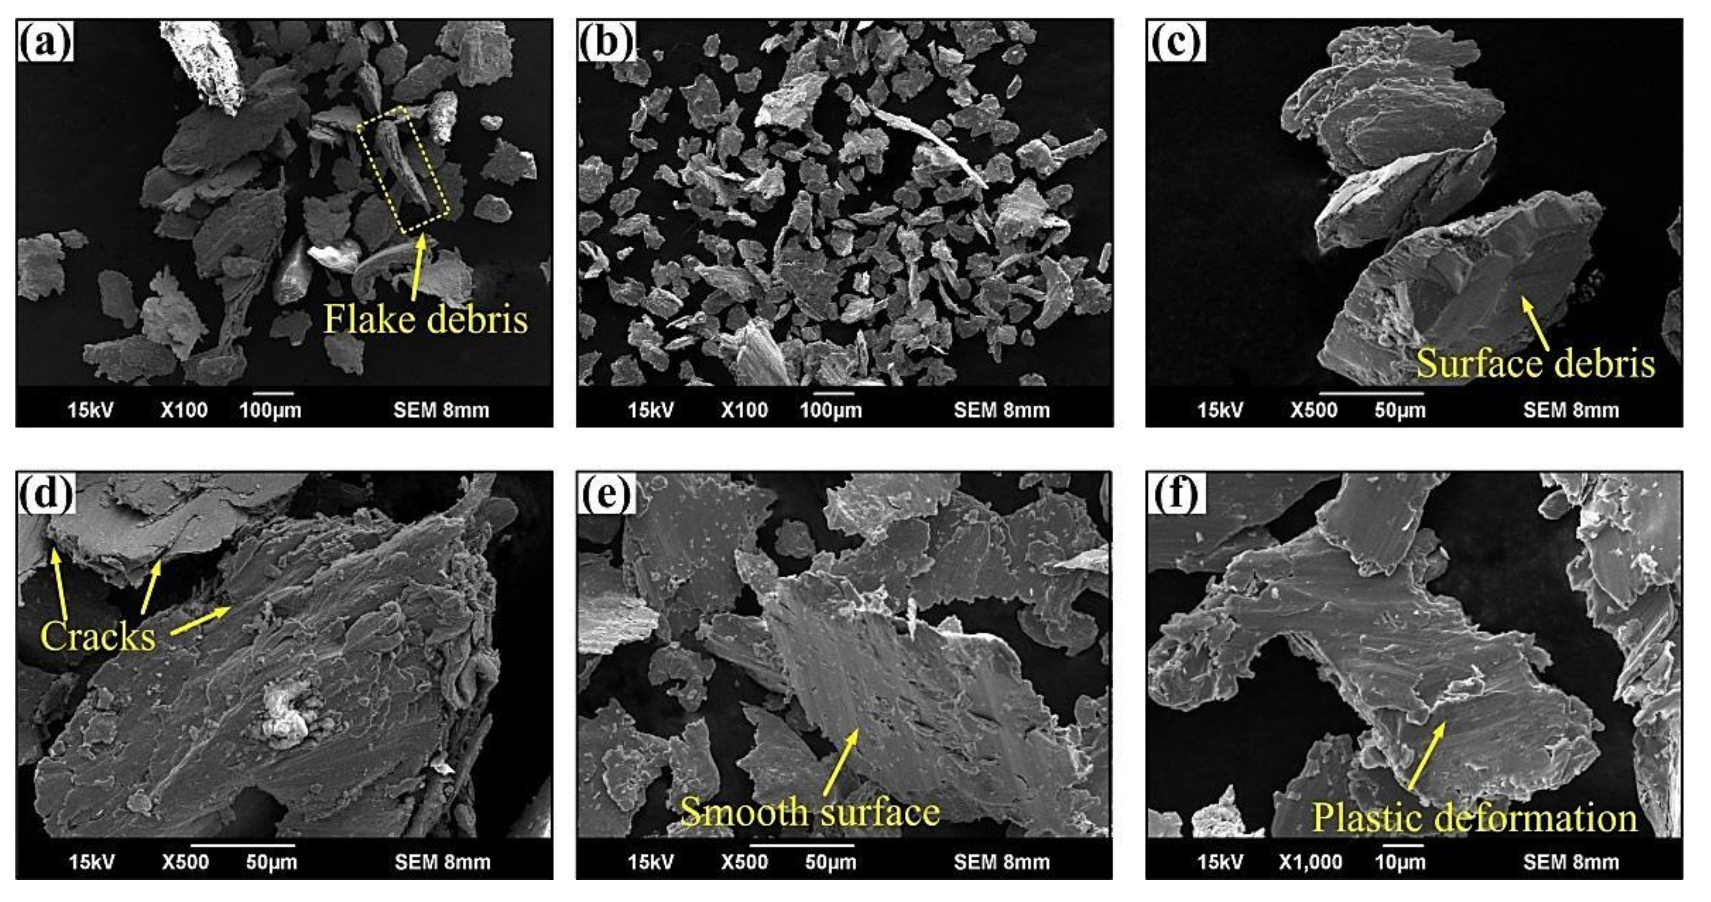
The wear debris resembles thin flakes and the wear characteristics of the wear surface are cracks, fatigue spalling, furrows, and plastic deformation. Additionally, the wear mechanisms are fatigue and adhesion.

Author Contributions

X.-D.C. and Y-X.P. conceived and designed the experiments; X.-D.C. and C.-M.X. performed the experiments; X.-D.C. and Y.-X.P. analyzed the data and wrote the paper; Z.-C.Z. and X.-S.G. provided useful comments; S.-Y.Z. contributed the materials.

Funding

This research received no external funding.

Acknowledgments

This research was funded by The Fundamental Research Funds for the Central Universities (2018BSCXA15), Postgraduate Research & Practice Innovation Program of Jiangsu Province (KYCX18_1954). The authors also wish to thank Top-notch Academic Programs Project of Jiangsu Higher Education Institutions (TAPP), and Project Funded by the Priority Academic Program Development of Jiangsu Higher Education Institutions (PAPD).

Conflicts of Interest

The authors declare no conflict of interest.

References

  1. Chang, X.D.; Peng, Y.X.; Zhu, Z.C.; Gong, X.S.; Yu, Z.F.; Mi, Z.T.; Xu, C.M. Effects of Strand Lay Direction and Crossing Angle on Tribological Behavior of Winding Hoist Rope. Materials 2017, 10, 630. [Google Scholar] [CrossRef] [PubMed]
  2. Chang, X.D.; Peng, Y.X.; Zhu, Z.C.; Gong, X.S.; Yu, Z.F.; Mi, Z.T.; Xu, C.M. Experimental investigation of mechanical response and fracture failure behavior of wire rope with different given surface wear. Tribol. Int. 2018, 119, 208–221. [Google Scholar] [CrossRef]
  3. Fontanari, V.; Benedetti, M.; Monelli, B.D. Elasto-plastic behavior of a Warrington-Seale rope: Experimental analysis and finite element modeling. Eng. Struct. 2015, 82, 113–120. [Google Scholar] [CrossRef]
  4. Wang, X.Y.; Meng, X.B.; Wang, J.X.; Sun, Y.H.; Gao, K. Mathematical modeling and geometric analysis for wire rope strands. Appl. Math. Model. 2015, 39, 1019–1032. [Google Scholar] [CrossRef]
  5. Zhang, D.K.; Ge, S.R.; Qiang, Y.H. Research on the fatigue and fracture behavior due to the fretting wear of steel wire in hoisting rope. Wear 2003, 255, 1233–1237. [Google Scholar] [CrossRef]
  6. Peng, Y.X.; Chang, X.D.; Zhu, Z.C.; Wang, D.G.; Gong, X.S.; Zou, S.Y.; Sun, S.S.; Xu, W.X. Sliding friction and wear behavior of winding hoisting rope in ultra-deep coal mine under different conditions. Wear 2016, 368, 423–434. [Google Scholar]
  7. Singh, R.P.; Mallick, M.; Verma, M.K. Studies on metallurgical properties of wire rope for safe operation in mines. J. Mines Met. Fuels 2011, 59, 224–229. [Google Scholar]
  8. Singh, R.P.; Mallick, M.; Verma, M.K. Studies on failure behavior of wire rope used in underground coal mines. Eng. Fail. Anal. 2016, 70, 290–304. [Google Scholar] [CrossRef]
  9. Ministry of Coal Industry. The Coal Mine Safety Rules; Coal Industry Publishing House: Beijing, China, 1986.
  10. Chaplin, C.R. Failure mechanisms in wire ropes. Eng. Fail. Anal. 1995, 2, 45–58. [Google Scholar] [CrossRef]
  11. Schrems, K.; Maclaren, D. Failure analysis of a mine hoist rope. Eng. Fail. Anal. 1997, 4, 25–38. [Google Scholar] [CrossRef]
  12. Peterka, P.; Krešák, J.; Kropuch, S.; Fedorko, G.; Molnar, V.; Vojtko, M. Failure analysis of hoisting steel wire rope. Eng. Fail. Anal. 2014, 45, 96–105. [Google Scholar] [CrossRef]
  13. Karabay, S.; Ertürk, A.T.; Zeren, M.; Yamanoğlu, R.; Karakulak, E. Failure analysis of wire-breaks in aluminum conductor production and investigation of early failure reasons for transmission lines. Eng. Fail. Anal. 2018, 83, 47–56. [Google Scholar] [CrossRef]
  14. Cruzado, A.; Hartelt, M.; Wäsche, R.; Urchegui, M.A.; Gómez, X. Fretting wear of thin steel wires Part 1: Influence of contact pressure. Wear 2010, 268, 1409–1416. [Google Scholar] [CrossRef]
  15. Cruzado, A.; Hartelt, M.; Wäsche, R.; Urchegui, M.A.; Gómez, X. Fretting wear of thin steel wires Part 2: Influence of crossing angle. Wear 2011, 273, 60–69. [Google Scholar] [CrossRef]
  16. Wang, D.G.; Zhang, D.K.; Ge, S.R. Effect of displacement amplitude on fretting fatigue behavior of hoisting rope wires in low cycle fatigue. Tribol. Int. 2012, 52, 178–189. [Google Scholar] [CrossRef]
  17. Xu, L.M.; Zhang, D.K.; Yin, Y. Fretting wear behaviors of hoisting rope wires in acid medium. Mater. Des. 2014, 55, 50–57. [Google Scholar] [CrossRef]
  18. Wang, D.G.; Zhang, D.K.; Zhao, W.J.; Ge, S.R. Quantitative analyses of fretting fatigue damages of mine rope wires in different corrosive media. Mater. Sci. Eng. A 2014, 596, 80–88. [Google Scholar] [CrossRef]
  19. Wang, D.G.; Li, X.W.; Wang, X.R.; Zhang, D.K.; Wang, D.A. Dynamic wear evolution and crack propagation behaviors of steel wires during fretting-fatigue. Tribol. Int. 2016, 101, 348–355. [Google Scholar] [CrossRef]
  20. Zhang, D.; Yang, X.; Chen, K.; Zhang, Z.F. Fretting fatigue behavior of steel wires contact interface under different crossing angles. Wear 2018, 400, 52–61. [Google Scholar] [CrossRef]
  21. Wang, X.R.; Wang, D.G.; Zhang, D.K.; Ge, S.R.; Araújo, J.A. Effect of torsion angle on tension-torsion multiaxial fretting fatigue behaviors of steel wires. Int. J. Fatigue 2018, 106, 159–164. [Google Scholar] [CrossRef]
  22. Wang, X.R.; Wang, D.G.; Li, X.W.; Zhang, D.K.; Ge, S.R.; Araújo, J.A. Comparative analyses of torsional fretting, longitudinal fretting and combined longitudinal and torsional fretting behaviors of steel wires. Eng. Fail. Anal. 2018, 85, 116–125. [Google Scholar] [CrossRef]
  23. Pearson, S.R.; Shipway, P.H.; Abere, J.O.; Hewitt, R.A.A. The effect of temperature on wear and friction of a high strength steel in fretting. Wear 2013, 303, 622–631. [Google Scholar] [CrossRef]
  24. Velkavrh, I.; Ausserer, F.; Klien, S.; Brenner, J.; Forêt, P.; Diem, A. The effect of gaseous atmospheres on friction and wear of steel–steel contacts. Tribol. Int. 2014, 79, 99–110. [Google Scholar] [CrossRef]
  25. Hirsch, M.R.; Neu, R.W. Temperature-dependent fretting damage of high strength stainless steel sheets. Wear 2016, 346, 6–14. [Google Scholar] [CrossRef]
  26. Velkavrh, I.; Ausserer, F.; Klien, S.; Voyer, J.; Ristow, A.; Brenner, J.; Forêt, P.; Diem, A. The influence of temperature on friction and wear of unlubricated steel/steel contacts in different gaseous atmospheres. Tribol. Int. 2016, 98, 155–171. [Google Scholar] [CrossRef]
  27. Alemani, M.; Gialanella, S.; Straffelini, G.; Ciudin, R.; Olofsson, U.; Perricone, G.; Metinoz, I. Dry sliding of a low steel friction material against cast iron at different loads: Characterization of the friction layer and wear debris. Wear 2017, 376, 1450–1459. [Google Scholar] [CrossRef]
  28. Oksanen, V.; Andersson, P.; Valtonen, K.; Holmberg, K.; Kuokkala, V.T. Characterization of the wear of nodular cast iron rollers in contact with wire ropes. Wear 2013, 308, 199–205. [Google Scholar] [CrossRef]
  29. Oksanen, V.; Valtonen, K.; Andersson, P.; Vaajoki, A.; Laukkanen, A.; Holmberg, K.; Kuokkala, V.T. Comparison of laboratory rolling–sliding wear tests with in-service wear of nodular cast iron rollers against wire ropes. Wear 2015, 340, 73–81. [Google Scholar] [CrossRef]
  30. Urchegui, M.A.; Tato, W.; Gómez, X. Wear evolution in a stranded rope subjected to cyclic bending. J. Mater. Eng. Perform. 2008, 17, 550–560. [Google Scholar] [CrossRef]
  31. Zhang, D.K.; Feng, C.A.; Chen, K.; Wang, D.G.; Ni, X. Effect of broken wire on bending fatigue characteristics of wire ropes. Int. J. Fatigue 2017, 103, 456–465. [Google Scholar] [CrossRef]
  32. Wang, D.G.; Zhang, D.K.; Wang, S.Q.; Ge, S.R. Finite element analysis of hoisting rope and fretting wear evolution and fatigue life estimation of steel wires. Eng. Fail. Anal. 2013, 27, 173–193. [Google Scholar] [CrossRef]
  33. Wang, D.G.; Zhang, D.K.; Ge, S. Finite element analysis of fretting fatigue behavior of steel wires and crack initiation characteristics. Eng. Fail. Anal. 2013, 28, 47–62. [Google Scholar] [CrossRef]
  34. Cruzado, A.; Urchegui, M.A.; Gómez, X. Finite element modeling and experimental validation of fretting wear scars in thin steel wires. Wear 2012, 289, 26–38. [Google Scholar] [CrossRef]
  35. Cruzado, A.; Urchegui, M.A.; Gómez, X. Finite element modeling of fretting wear scars in the thin steel wires: Application in crossed cylinder arrangements. Wear 2014, 318, 98–105. [Google Scholar] [CrossRef]
  36. Peng, Y.X.; Chang, X.D.; Sun, S.S.; Zhu, Z.C.; Gong, X.S.; Zou, S.Y.; Xu, W.X.; Mi, Z.T. The friction and wear properties of steel wire rope sliding against itself under impact load. Wear 2018, 400, 194–206. [Google Scholar] [CrossRef]
  37. Chang, X.D.; Peng, Y.X.; Zhu, Z.C.; Wang, D.G.; Gong, X.S.; Zou, S.Y.; Sun, S.S.; Xu, W.X. Tribological properties of winding hoisting rope between two layers with different sliding parameters. Adv. Mech. Eng. 2016, 8, 1–14. [Google Scholar] [CrossRef]
Figure 1. 6×19+FC wire rope sample. (a) wire rope; (b) cross section.
Metals 08 00743 g001
Figure 2. Sliding friction test rig of wire rope. (a) Test rig; (b) contact form; (c) wear scar.
Metals 08 00743 g002
Figure 3. The evolution of friction force over one cycle for different periods. (a) Stroke: 20 mm, load: 100 N; (b) stroke: 30 mm, load: 100 N; (c) load: 50 N, stroke 20 mm; (d) load: 150 N, stroke: 20 mm.
Metals 08 00743 g003
Figure 4. The evolution of the coefficient of friction under different strokes. (a) Stroke: 20 mm, load: 100 N; (b) stroke: 30 mm, load: 100 N.
Metals 08 00743 g004
Figure 5. The evolution of the coefficient of friction under different contact loads. (a) Load: 50 N, stroke: 20 mm; (b) load: 150 N, stroke: 20 mm.
Metals 08 00743 g005
Figure 6. Infrared thermograms of contact wire ropes at different stages. (a) Stroke: 20 mm, load: 100 N; (b) stroke: 30 mm, load: 100 N; (c) load: 50 N, stroke: 20 mm; (d) load: 150 N, stroke: 20 mm.
Metals 08 00743 g006
Figure 7. The evolution of temperature rise under different strokes. (a) Stroke: 20 mm, load: 100 N; (b) stroke: 30 mm, load: 100 N.
Metals 08 00743 g007
Figure 8. The evolution of temperature rise under different contact loads (x: 20 mm).
Metals 08 00743 g008
Figure 9. Optical micrographs of the wear scars under different strokes. (ad) Stroke: 20 mm, load: 100 N; (eh) stroke: 30 mm, load: 100 N.
Metals 08 00743 g009
Figure 10. Optical micrographs of the wear scars under different loads. (ad) Load: 50 N, stroke: 20 mm; (eh) load: 150 N, stroke: 20 mm.
Metals 08 00743 g010
Figure 11. Scanning electron microscopy (SEM) micrographs of the wear debris with different magnifications. (a,d) ×100; (ce) ×500; (f) ×1000.
Metals 08 00743 g011
Figure 12. The evolution of wear mass loss for the wire rope under different conditions. (a) Stroke: 20 mm and 30 mm, load: 100 N; (b) load: 100 N and 150 N, stroke: 20 mm.
Metals 08 00743 g012
Figure 13. SEM micrographs of the wear surfaces with different morphology properties. (ac) Relatively regular surface; (df) irregular surface.
Metals 08 00743 g013
Table 1. Parameters of the steel wire rope sample.
ParameterValue
Diameter of the rope (mm)9.3
Diameter of the wires (mm)0.6
Strand lay directionRight
Wire lay directionLeft
Strand lay angle (°)15.5
Strand lay length (mm)70
Outer wire lay length (mm)35
Internal wire lay length (mm)20
Nominal tensile strength (MPa)1570
Breaking force (kN)52.5
Table 2. Friction and wear experimental parameters.
Test ParameterValue
Contact load (P)100 N100 N50 N150 N
Stroke (x)20 mm30 mm20 mm20 mm
Test time (t/min)5; 10; 20; 305; 10; 20; 305; 10; 20; 305; 10; 20; 30
Number of cycles (n)90; 180; 360; 54060; 120; 240; 36090; 180; 360; 54090; 180; 360; 540
Sliding distance (S/mm)3600; 7200; 14,400; 21,6003600; 7200; 14,400; 21,6003600; 7200; 14,400; 21,6003600; 7200; 14,400; 21,600
Velocity (v)12 mm/s12 mm/s12 mm/s12 mm/s
Crossing angle (α)90°90°90°90°
Tensile force1000 N1000 N1000 N1000 N
Lubricant conditionDry-frictionDry-frictionDry-frictionDry-friction
Room temperature25 °C25 °C25 °C25 °C
Humidity (%)65 ± 565 ± 565 ± 565 ± 5
AtmosphereLaboratory airLaboratory airLaboratory airLaboratory air

