Article

Separation and Recovery of Iron and Rare Earth from Bayan Obo Tailings by Magnetizing Roasting and (NH4)2SO4 Activation Roasting

1
School of Metallurgy, Northeastern University, Shenyang 110819, China
2
Liaoning Key Laboratory of Recycling Science for Metallurgical Resources, Shenyang 110819, China
*
Author to whom correspondence should be addressed.
Metals 2017, 7(6), 195; https://doi.org/10.3390/met7060195
Submission received: 27 April 2017 / Revised: 22 May 2017 / Accepted: 24 May 2017 / Published: 27 May 2017
(This article belongs to the Special Issue Valuable Metal Recycling)

Abstract

:
A novel approach for recovery of iron and rare earth elements (REEs) from Bayan Obo tailings of Baotou, China, was developed by combining magnetizing roasting, magnetic separation, (NH4)2SO4 activation roasting, and water leaching. Thermodynamic analysis of carbothermal reduction was conducted to determine the temperature of magnetizing roasting, and it agreed well with the experimental results. The maximum recovery of Fe reached 77.8% at 600 °C, and the grade of total Fe in the magnetic concentrate was 56.3 wt. %. An innovative approach, using water to leach REEs after (NH4)2SO4 activation roasting, was used to extract REEs from magnetic separation tailings. The main influence factors of the leaching recovery during (NH4)2SO4 activation roasting, were investigated with the mass ratio of (NH4)2SO4 to magnetic separation tailings, roasting temperature and roasting time. The leaching recoveries of La, Ce and Nd reached 83.12%, 76.64% and 77.35%, respectively, under the optimized conditions: a mass ratio of 6:1, a roasting temperature of 400 °C and a roasting time of 80 min. Furthermore, the phase composition and reaction process during the (NH4)2SO4 activation roasting were analyzed with X-ray diffraction (XRD), energy dispersive X-ray spectroscopy & scanning electron microscopy (EDS-SEM) and thermogravimetry & differential scanning calorimetry (TG-DSC), and the leaching solution and leaching residue were also characterized.

1. Introduction

The Bayan Obo ore deposit located in Inner Mongolia of China is one of the world’s largest iron-rare earth mines, the symbiosis of rare earth elements (REEs), iron, niobium, thorium scandium, fluorine, phosphorus, and other 71 elements [1]. The rare earth minerals are mainly comprised of bastnaesite (RECO3F) and monazite (REPO4). Since 1927, the Bayan Obo mine has been mined mainly for iron ore. A large amount of REEs, niobium, scandium, thorium, and other metal elements have been mined along with iron ore mining. Although in recent decades, the recovery of REE has been performed by low intensity magnetic separation, and high intensity magnetic separation and flotation, the utilization rate of mined REEs is only 10–15% [2]. Most rare earth ore are stockpiled in a tailings dam as a secondary resource [1,3]. By 2005, more than 150 million tons of the thorium-radioactive rare earth tailings, 90–95% of which were ground to <76 μm [4,5], were stored at the tailings dam, with an area of 11 to 12 km2 near to the Yellow River, not only causing environmental pollution, but also increasing the risk of dam breakage [6,7]. The average REEs grade of the tailing has been increased from 6.8% to 8.85%, which is almost close to, or even slightly higher than the grade of raw ore, due to the low recovery of REEs [7]. Recycling of such a large amount of rare earth resources is beneficial to environmental improvement, and is worth considerable economic value.
Currently, alkali treatment and acid treatment are commonly used for REEs recovery from high-grade rare earth concentrates; however, for low-grade ore, the two treatments are not economical [8,9]. In contrast, (NH4)2SO4 activation roasting, a method used to recover valuable metals [10,11], can extract metallic elements from low-grade ore efficiently. In the process of (NH4)2SO4 activation roasting, the ore was roasted with (NH4)2SO4 at 200–600 °C. After roasting, valuable metals (such as La, Ce, Nd and etc.) were converted into corresponding sulfates, which are highly soluble in water. This method can be applied to extract metallic elements from Bayan Obo tailings, and deserves further investigation.
In this work, REEs were extracted from the Bayan Obo tailings by a combined process of magnetizing roasting, magnetic separation, (NH4)2SO4 activation roasting, and water leaching. The Baiyun Obo tailings were sampled from low-intensity magnetic separation tailings. The magnetite (Fe3O4) in the raw ore was separated during the low intensity magnetic separation process, thus the REEs grade of the tailings were slightly higher than the raw ore. Magnetizing roasting and magnetic separation processes were then conducted to remove the hematite (Fe2O3) remaining in the Bayan Obo tailings [12]. It is notable that the RECO3F and REPO4 in the Bayan Obo tailings were decomposed into rare earth oxides during the process of magnetizing roasting, which was beneficial for further leaching recovery of REEs. The dissolution of rare earth oxides was significantly strengthened in the process of (NH4)2SO4 activation roasting—La, Ce, Nd and other metallic element were converted into corresponding sulfates [13]. It was easy to obtain the rare earth sulfate solution by leaching using hot water. The main influencing factors on the leaching recovery of REEs, such as amount of (NH4)2SO4, roasting temperature and roasting time, were investigated. Furthermore, the phase compositions of the Bayan Obo tailings before and after magnetizing roasting, of the leaching residue and the leaching solution were characterized; the phases and reactions during the (NH4)2SO4 activation roasting process were analyzed. It was hoped that a novel technological process and theoretical basis for recycling REEs and iron from the Bayan Obo tailings could be developed.

2. Thermodynamic Analysis of Carbothermic Reduction

Figure 1 shows the relationship between the temperature and Gibbs free energy of formation of Fe2O3, Fe3O4, FeO, CO, and CO2 under standard conditions, which were calculated by the thermodynamic software FactSage version 7.0 (Thermfact/CRCT, Montreal, QC, Canada, 2015; GTT-Technologies, Aachen, Germany, 2015). The two intersections of the oxidation reaction line of Fe3O4 with the two lines of C indicated that Fe2O3 could be theoretically reduced to Fe3O4 by C when the temperature was above ~72 or ~322 °C, respectively. The reduction reactions of Fe2O3 are represented by Equations (1) and (2). The oxidation reaction lines of FeO, Fe and C intersect at temperatures in the range of 600–800 °C, indicating that FeO and Fe3O4 can be reduced by C, only when temperature is above ~600 °C. Therefore, it is feasible to reduce hematite (Fe2O3) to magnetite (Fe3O4) with coal (C), by controlling the temperature according to the thermodynamics of the reactions.
6 Fe 2 O 3 + C = 4 Fe 3 O 4 + CO 2 ,   Δ G 1 θ = 96734.370 277.089 T
3 Fe 2 O 3 + C = 2 Fe 3 O 4 + CO ,   Δ G 2 θ = 134314.928 226.433 T
With the generation of CO in the Equation (2) reaction, Fe2O3 can be reduced to Fe by CO following a stepwise process, as shown in Equations (3)–(6). Since the activities of Fe2O3, Fe3O4, FeO and Fe (which are solid) are 1, the reaction equilibrium of Equations (3)–(6) can be represented as Equation (8). At normal pressure (1 atm), the state to which Fe2O3 will be reduced (Fe3O4, FeO, or Fe), depends on the partial pressure of CO and CO2. The partial pressure of CO and CO2 is determined by the gasification reaction of carbon (the Boudouard reaction) shown as Equation (7), which can be calculated by the reaction of Equations (1) and (2). The reaction equilibrium of Equation (7) can also be represented as Equation (9).
3 Fe 2 O 3 + CO = 2 Fe 3 O 4 + CO 2 ,   Δ G 3 θ = 37580.593 50.656 T
1 / 4 Fe 3 O 4 + CO = 3 / 4 Fe + CO 2 ( < 570 ° C ) ,   Δ G 4 θ = 7875.232 + 9.959 T
Fe 3 O 4 + CO = 3 FeO + CO 2 ( > 570 ° C ) ,   Δ G 5 θ = 27034.414 29.618 T
FeO + CO = Fe + CO 2 ( > 570 ° C ) ,   Δ G 6 θ = 19511.797 + 23.152 T
C + CO 2 = 2 CO ,   Δ G 7 θ = 2 Δ G 2 θ Δ G 1 θ = 171895.486 175.777 T
G i = G i θ + R T ln P CO / P θ P CO 2 / P θ
G i = G i θ + R T ln ( P CO / P θ ) 2 a C × ( P CO 2 / P θ )
where ΔGi is the actual Gibbs free energy change of Equations (3)–(7); ΔGiθ is the standard Gibbs free energy change of Equations (3)–(7); T is the temperature; ai is the activity of the component i; PCO is the partial pressure of CO; Pθ is the normal pressure; and R is the universal gas constant. At normal pressure (1 atm), PCO and PCO2 have a relationship as shown in Equation (10).
P CO + P CO 2 = P θ
According to the calculations of Equations (3)–(10), the equilibrium diagram of reduction of iron oxides by CO is represented in Figure 2.
The reaction curve of Equation (3) in Figure 2 is very close to the horizontal axis; in other words, only a very low CO concentration can reduce Fe2O3 to Fe3O4, so that this reaction is actually irreversible [14]. Figure 2 shows that CO concentration control is important. At normal pressure (1 atm), when the reaction of Equation (7) reaches equilibrium, PCO in the system varies along the reaction curve of Equation (7) as temperature increases. When the temperature exceeds ~650 °C, the curve enters the stable area of FeO, which means that Fe3O4 will be reduced to FeO. Therefore, to avoid the reduction of Fe3O4, the temperature should not exceed 650 °C. Since the gas-solid reaction rate is greater than the solid-solid reaction rate, it is possible to increase the reduction efficiency by using the generated CO as a reductive agent at a suitable temperature.
Figure 3 shows the Fe–C–O predominance area diagram at 600 °C (873 K), calculated using the thermodynamic software FactSage version 7.0 [15], where the line made by “+” represents normal pressure (1 atm). The reduction of iron oxides by CO mainly depends on the partial pressure of CO and CO2, which is consistent with the analysis above. Under normal pressure, Fe3O4 could exist when the partial pressure of CO is <~0.422 atm. It is deduced that the selection of the magnetizing roasting temperature as 600 °C, is appropriate.

3. Experimental Procedures

3.1. Magnetizing Roasting and Magnetic Separation

The Bayan Obo tailings used in this study were supplied by the Ore-Dressing Plant, Baotou Steel (Group) Co. (Baotou, China). The chemical compositions of the tailing samples shown in Table 1 were analyzed by X-ray Fluorescence Spectrometer (XRF) (model: ZSX Primus II, Rigaku Corporation, Tokyo, Japan) and chemical analysis. XRF was used to identify the elements in the tailings. Thereafter, the contents of each element were measured using chemical analysis according to Chinese standards (such as GB/T 17417.1–2010 for rare earth metals). The particle size distribution of the tailings was analyzed by a laser particle size analyzer (model: BT9300H, Dandong Bettersize Instruments Ltd., Dandong, China), shown in Table 2. Industrial pulverized coal was used as reducing agent; its chemical composition is shown in Table 3.
The magnetizing roasting experiments were carried out with a muffle furnace (Shenyang Great Wall Industrial Furnace, Shenyang, China). The Bayan Obo tailings (20 g) and pulverized coal (0.8 g, <0.074 mm) were mixed and pressed into a cylinder with a size of 30 mm in diameter, 10–12 mm in height at a pressure of 40 MPa. The cylindrical sample was sealed in a capped graphite crucible (Shenyang Metallurgical Graphite Factory, Shenyang, China) and roasted at 600 °C for 60 min. The graphite crucible was then removed and cooled by water. The roasting products were ball-milled at a speed of 120 rpm for 30 min. After milling, the roasting products were separated from the milling balls by washing with water. To separate the reduced magnetite from the roasting products, magnetic separation was carried out in a magnetic separation tube (Davis tube). This is a glass tube placed obliquely between two C type electromagnets. A magnetic field with a flux density of 125 mT was generated as a current running through the electromagnet. The mixture of material and water was poured from the high end of the glass tube at a constant rate. With the rotating and reciprocating movement of the glass tube in magnetic field, the magnetic substance attached to the tube wall, and the nonmagnetic substance was washed out with water. After magnetic separation, all the products were dried using a drying oven (Gongyi Yuhua Instrument Limited Liability Company, Gongyi, China). The process flow of this experiment is shown in Area Ι of Figure 4. The magnetic substance was a magnetic separation concentrate (mainly Fe3O4), and the nonmagnetic substance was comprised of magnetic separation tailings. The total Fe content of the magnetic separation concentrate was determined by the potassium dichromate volumetric method, and the REEs content of the magnetic separation tailings was determined by inductively coupled plasma optical emission spectrometry (ICP-OES). The wavelengths for analysis of La, Ce and Nd by ICP-OES are 408.672, 413.764 and 406.109 nm, respectively.

3.2. (NH4)2SO4 Activation Roasting and Water Leaching

The (NH4)2SO4 activation experiments were carried out in a muffle furnace. The magnetic separation tailings and (NH4)2SO4 were mixed with a specific mass ratio and poured into a porcelain crucible for roasting. The roasting temperature was in the range of 300–550 °C, and roasting time varied from 20 to 100 min according, to the thermogravimetric results of (NH4)2SO4 and the literature [16,17,18]. After (NH4)2SO4 activation roasting, all of the product and deionized water (at a liquid-solid ratio of 10 mL/g) were poured into a beaker heated by a hot water bath. The temperature of the water bath was 80 °C. Then, the mixture was stirred at a speed of 400 rpm for 1 h. The leaching solution was filtered and diluted with deionized water to 500 mL. The leaching residues were dried using a drying oven. The process flow of this experiment is shown as Area II in Figure 4. The REEs content of the solutions was determined by ICP-OES.

4. Results and Discussion

4.1. Phase Change in Magnetizing Roasting

The phase composition of the Bayan Obo tailings was complex, as shown by X-ray diffraction (XRD) (PANalytical B.V., Almelo, Netherlands) in Figure 5. The peaks of fluorite (CaF2), Fe2O3 and RECO3F are clearly discernible. However, REPO4 and other phases were not distinct, due to the weak peaks and overlapping. Scanning electron microscopy (SEM) (Carl Zeiss AG, Jena, Germany) images of mineralogical phases in the tailings and the energy dispersive X-ray spectroscopy (EDS) results are shown in Figure 6 and Figure 7, and Table 4, respectively. The bright phases (marked as “A”), inlaid on a CaF2 particle (marked as “B”), were REPO4. Besides, some Fe2O3 (marked as “C”), RECO3F (marked as “D”), and dolomite (CaMg(CO3)2, marked as “E”) were observed on a micron scale.
Figure 8 shows the XRD pattern of the product after magnetizing roasting at 600 °C for 60 min, indicating that Fe2O3 was almost completely transformed to Fe3O4. The peaks of RECO3F disappeared, and the peaks of REEs oxides (Ce0.75Nd0.25O1.875, Ce7O12, Pr9O16, REOF) occurred, indicating that RECO3F was decomposed at 600 °C; the peaks of some REEs oxides and CaF2 overlapped with each other, showing strong intensity. REPO4 was still observed, indicating that REPO4 was more difficult to completely decompose at 600 °C.
The corresponding SEM images are shown in Figure 9. The EDS results of the marked points in Figure 9 are shown in Figure 10 and Table 5. Comparing with bastnaesite particles before roasting (as marked as “D” in Figure 6), cracks occurred on the surface of roasted bastnaesite particles (marked as “F” in Figure 9). This could be attributed to the fact that CO2 escapes from RECO3F during decomposition. The decomposition theory could be expressed with Equations (11)–(13) [19]. Particles of Fe3O4 (Figure 9, marked as “G”) were cracked, this could be attributed to the change in volume caused by crystal structure changes when Fe2O3 were reduced to Fe3O4.
(La, Ce, Nd, Pr)CO3F → (La, Ce, Nd, Pr)OF + CO2
(La, Ce, Nd, Pr)OF → Ce0.75Nd0.25O1.875 + (Ce, Pr)La2O3F3
(Ce, Pr)La2O3F → LaF3 + Ce2O3 + PrO1.83

4.2. Behavior of Fe and Rare Earth Elements (REEs) in the Magnetic Separation Process

The grade and recovery of total Fe in the magnetic separation concentrate prepared at various magnetizing roasting temperatures are shown in Figure 11. The variation trends of grade with roasting temperature was consistent with the one of recovery: there was an initial increase with temperature, then a reduction after the temperature exceeded a specific value. At a relatively low temperature, the reduction efficiency of Fe2O3 was low, due to the low partial pressure of CO, resulting in low recovery and grade of total Fe. When the roasting temperature reached 600 °C, the grade and recovery of Fe in magnetic separation concentrate reached maximum, being 56.3 wt. % and 77.8%, respectively. Most of the Fe was recovered from the initial tailings through magnetizing roasting and magnetic separation. When the temperature exceeded 600 °C, the grade of total Fe decreased due to the Fe3O4 being further reduced to FeO. The experimental results showed good agreement with the theoretical analysis in Section 2.
The grade and recovery of (REE)O in the magnetic separation tailings obtained at different magnetizing roasting temperatures are also shown in Figure 11. It was found that the recovery and grade of (REE)O did not change much with increasing temperature. After magnetic separation, the grade of (REE)O increased to approximately 10 wt. % from 7.09 wt. % for the initial tailing. More than 95% of REEs were recycled in all of the experiments, indicating that almost all the REE-bearing minerals were separated from magnetite (Fe3O4) by magnetic separation.

4.3. Phase Analysis and Reaction in (NH4)2SO4 Activation Roasting

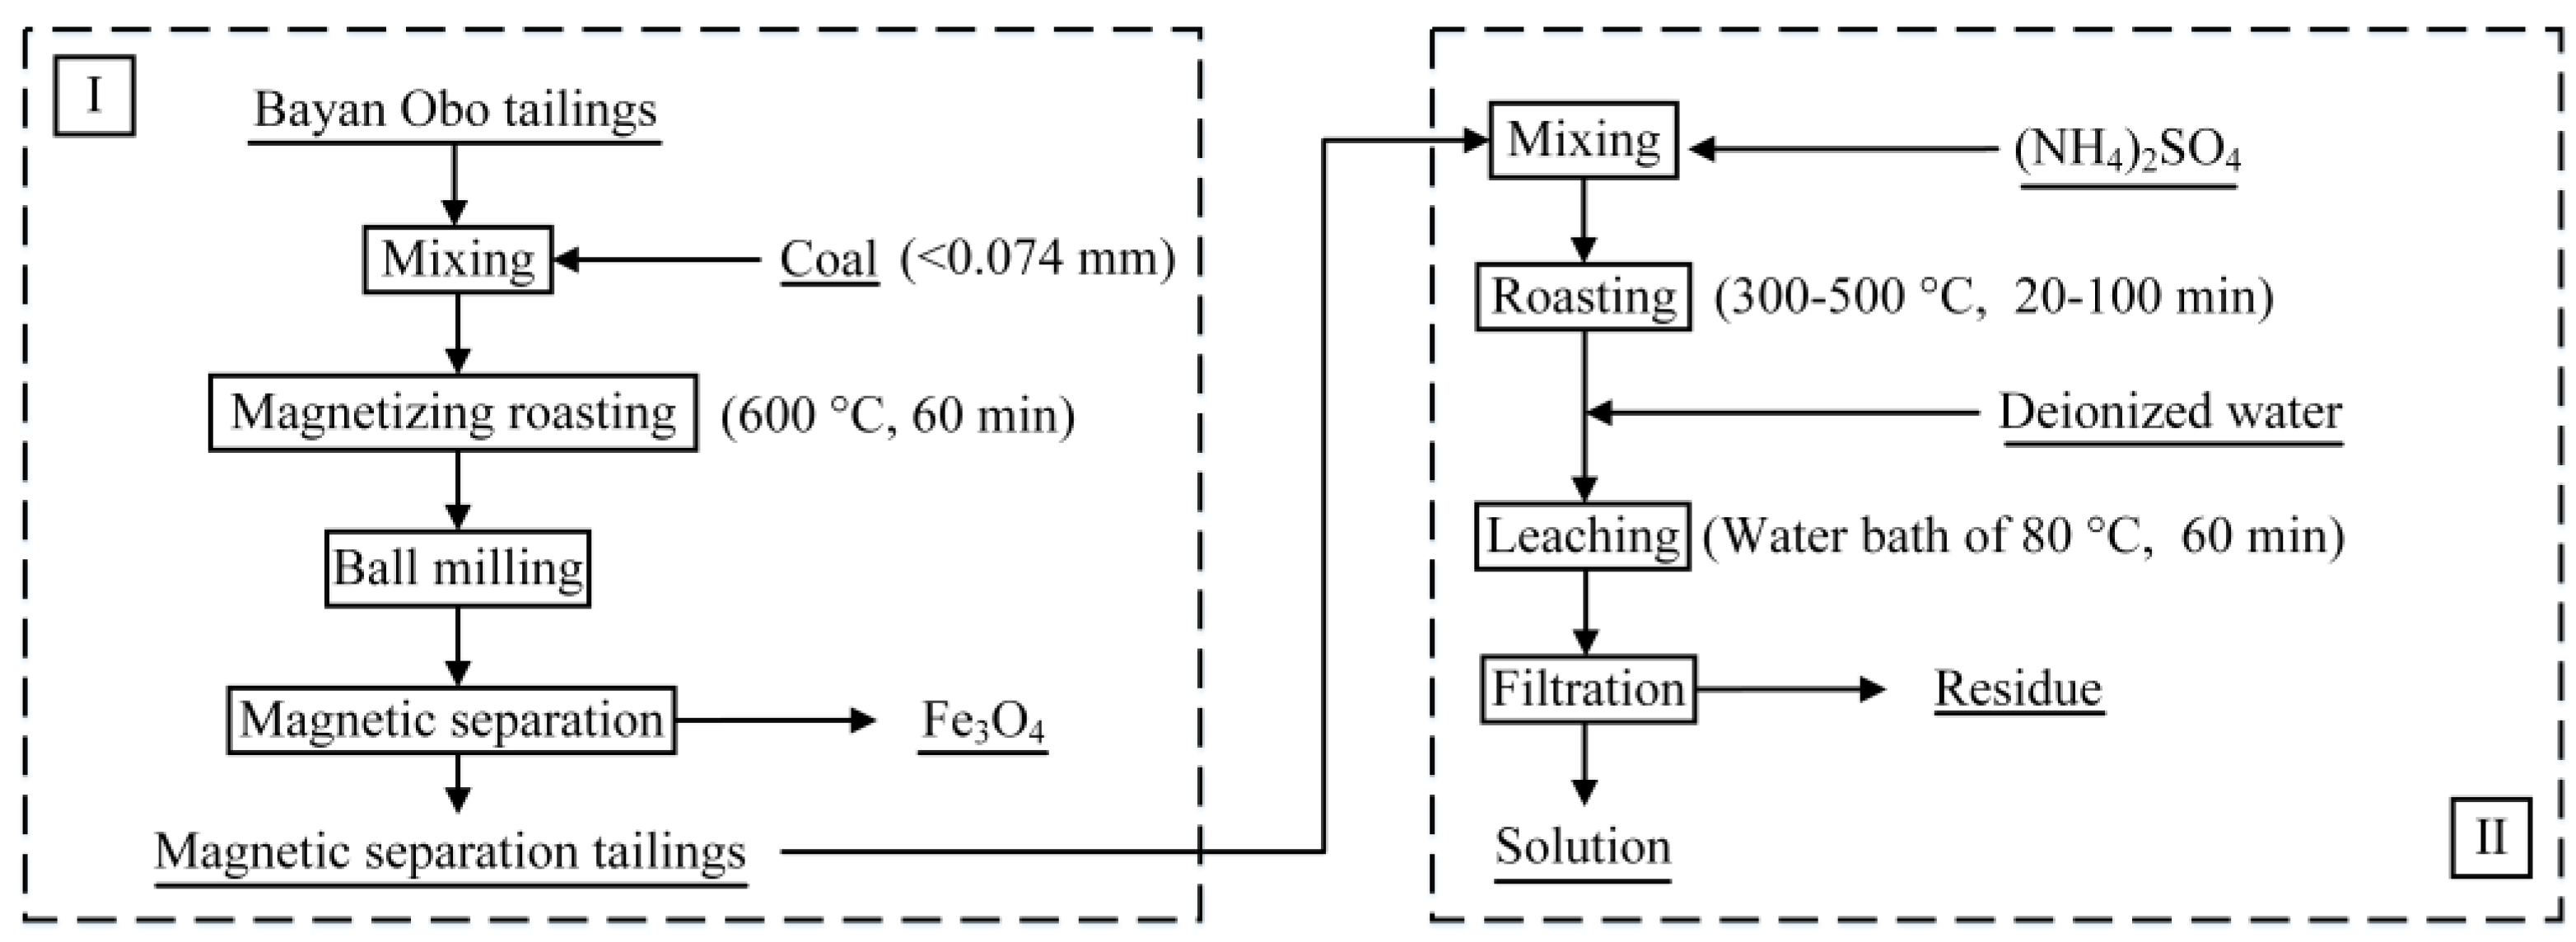
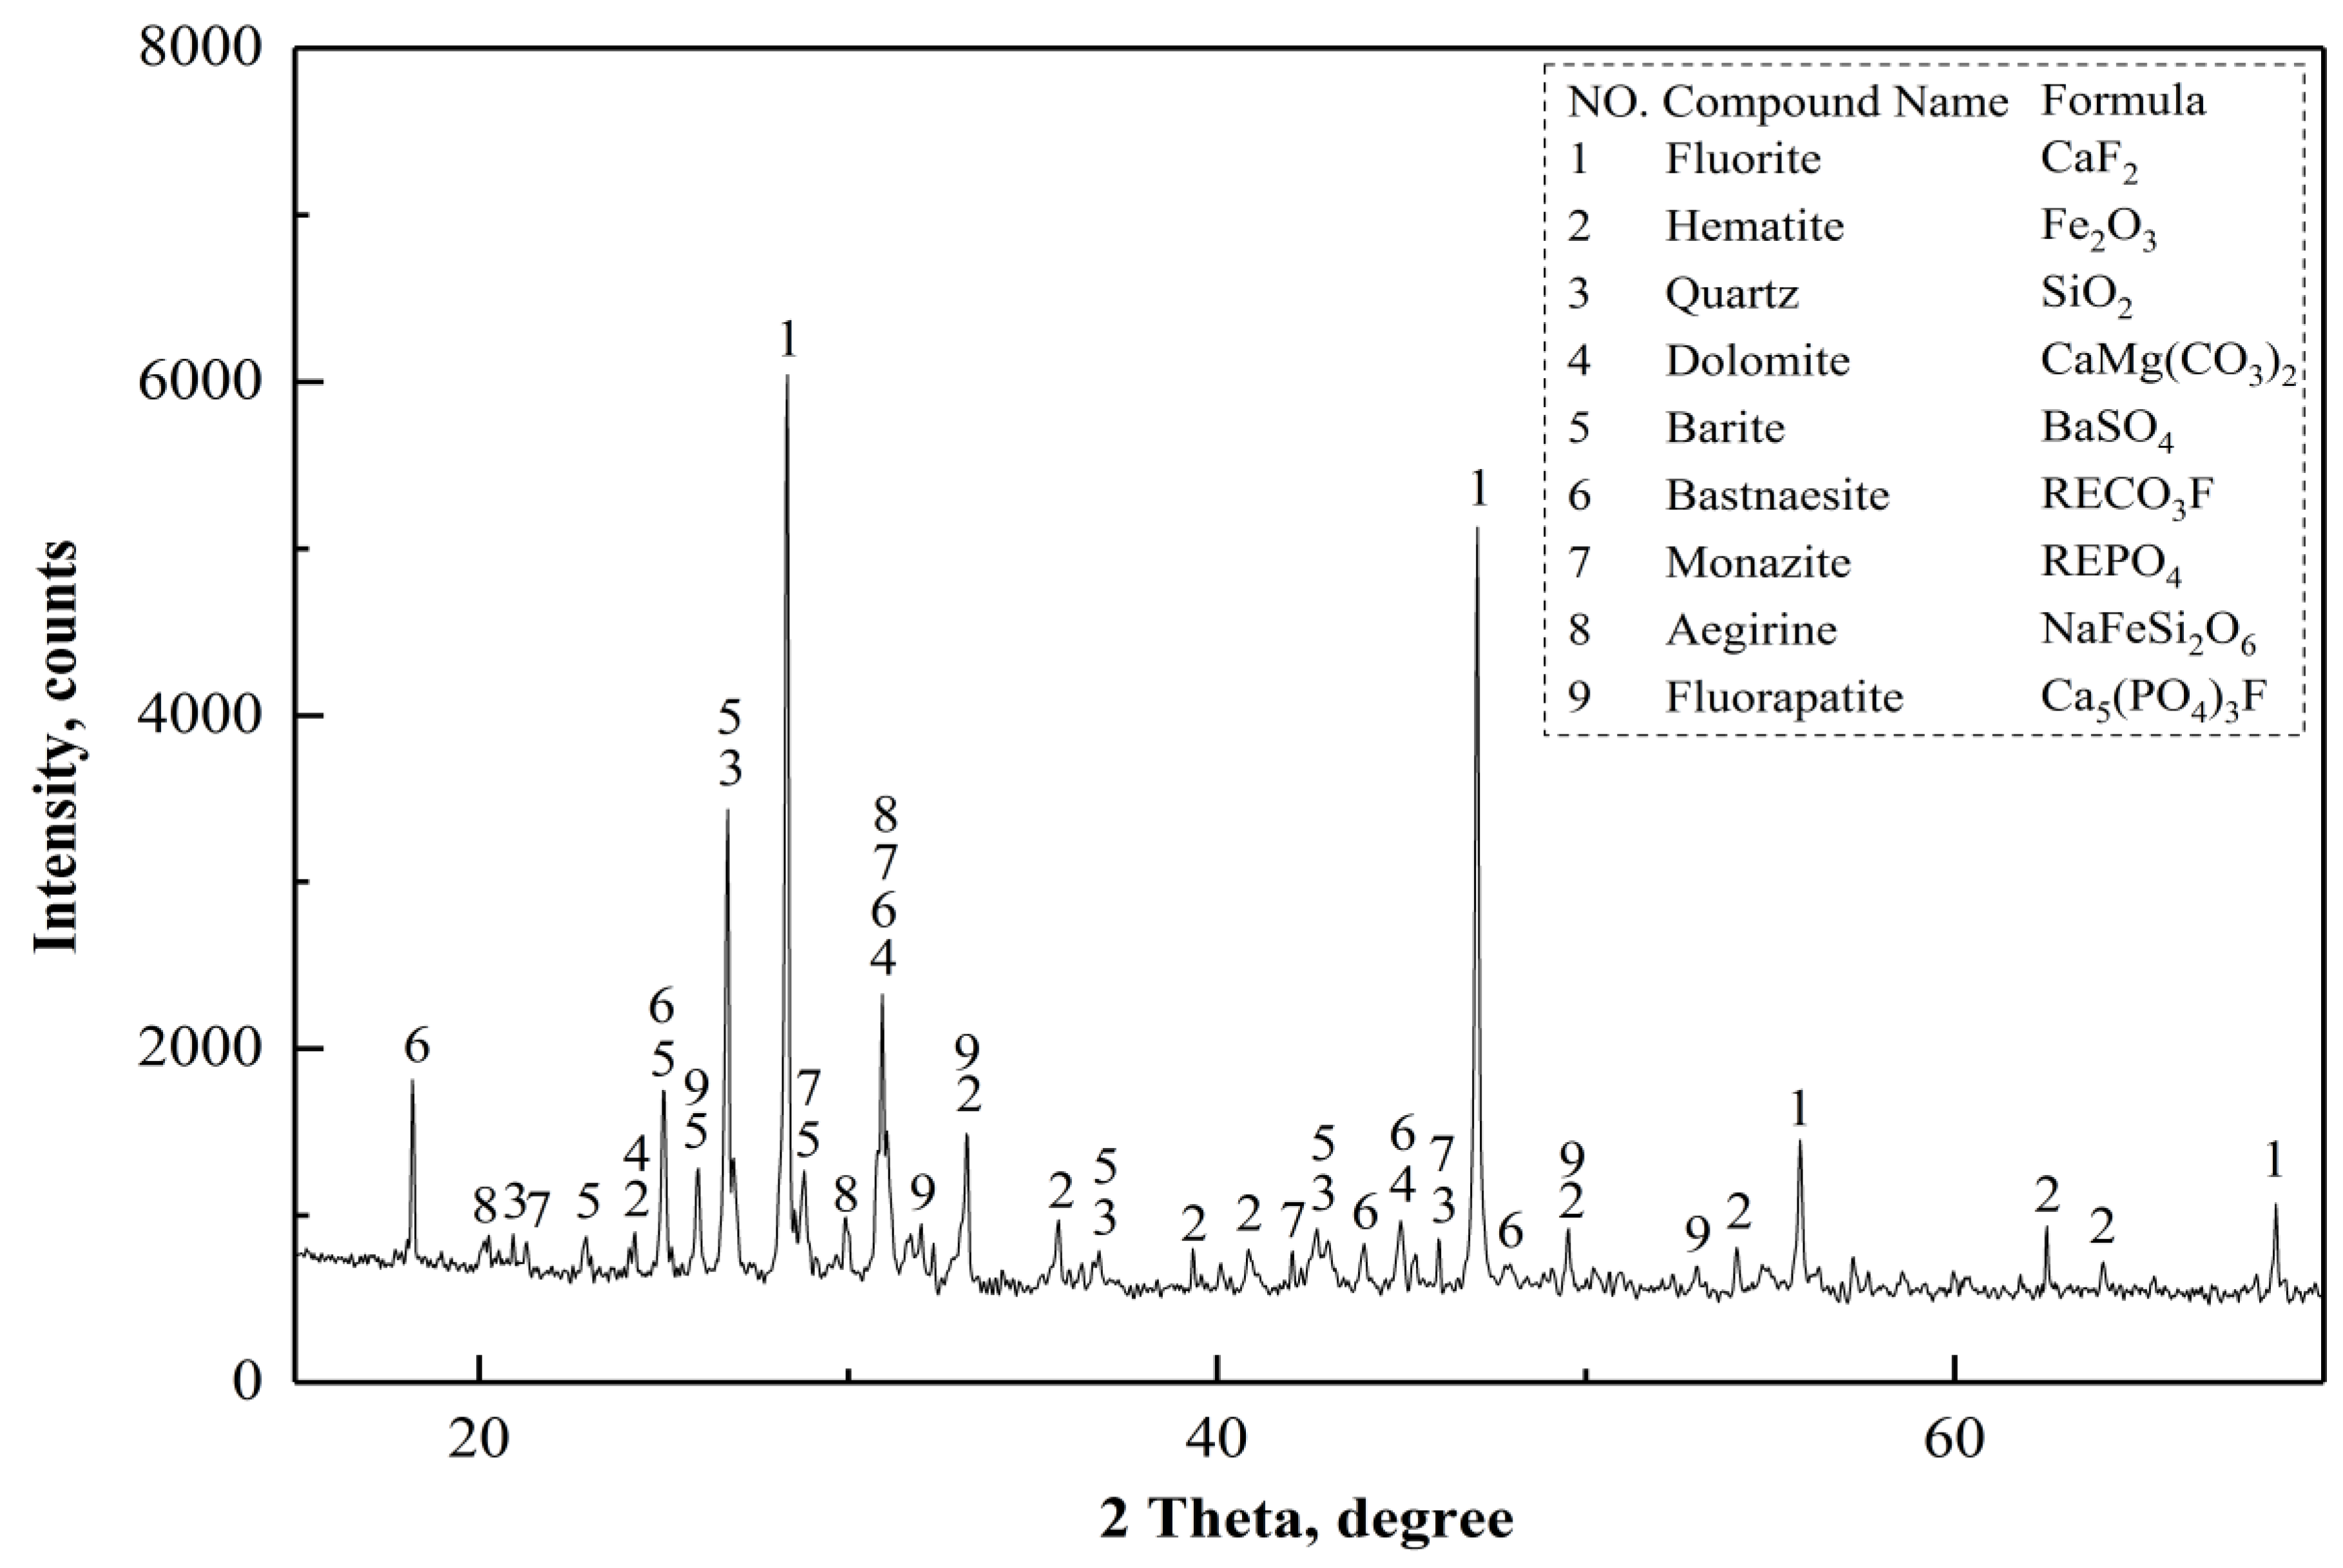
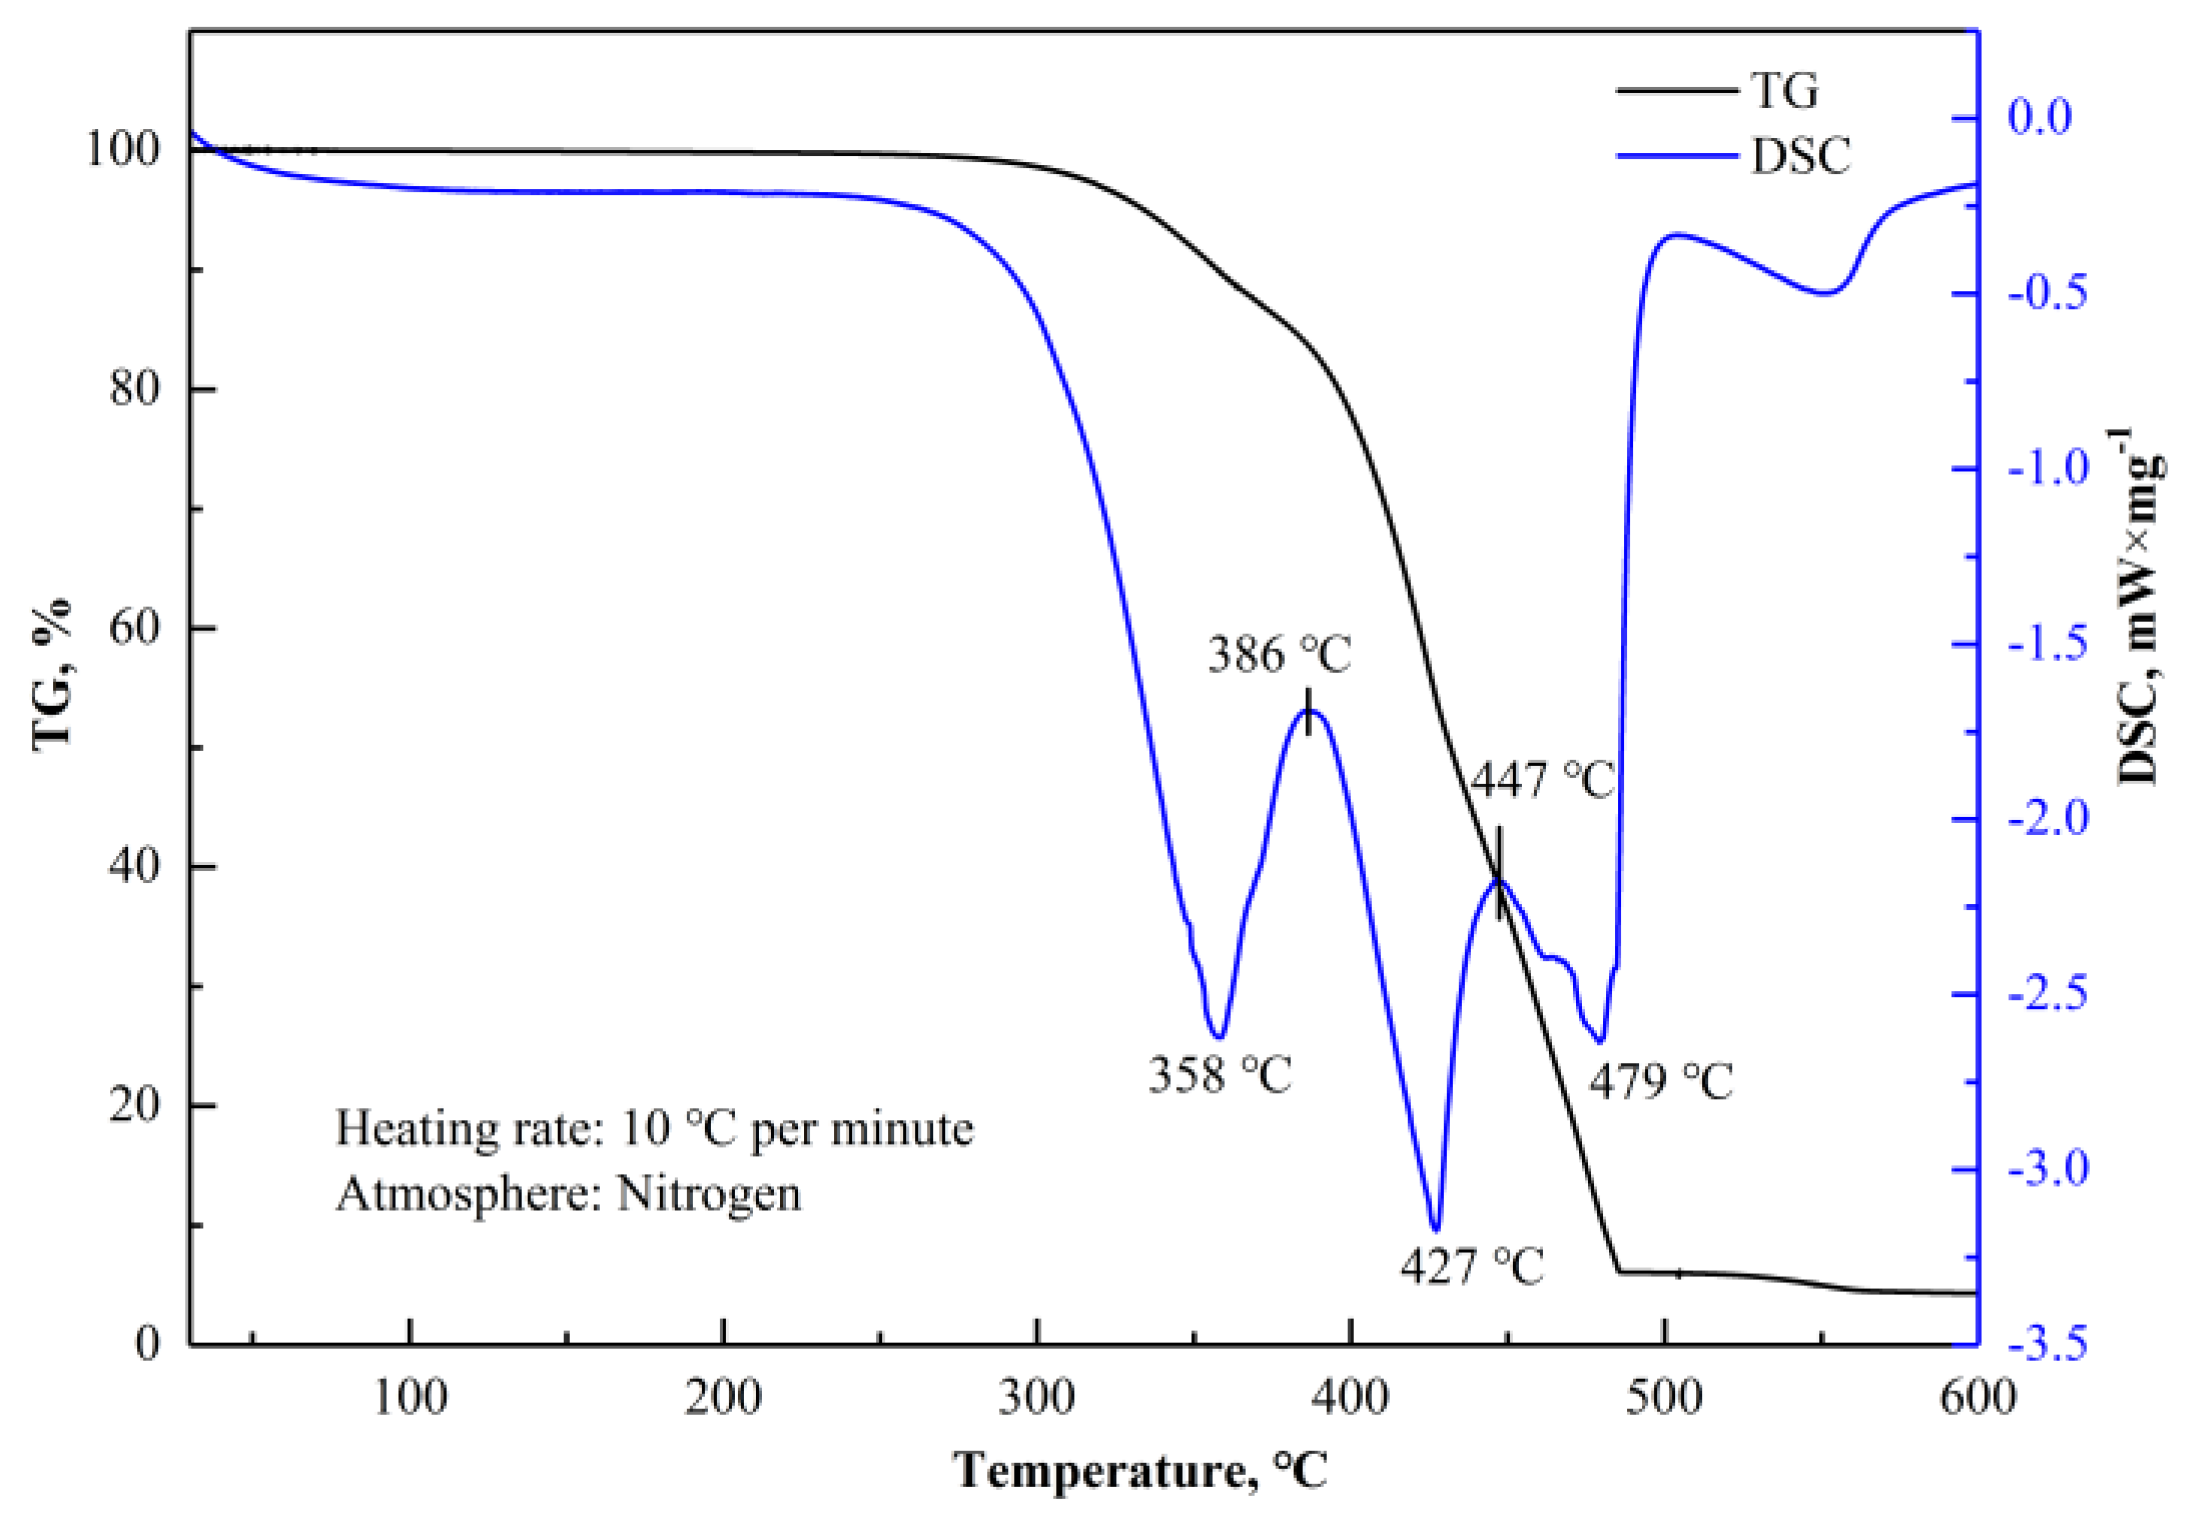
Figure 12 shows the results of thermogravimetry (TG) and differential scanning calorimetry (DSC) analysis results for (NH4)2SO4. The analytical equipment used was the SDT 2960 Simultaneous DSC-TGA manufactured by TA Instruments (New Castle,Delaware, DE, USA). The TG–DSC curve of (NH4)2SO4 indicated thermal decomposition between 200–500 °C, with the process expressed using Equations (14)–(19) [16,17,18]. Obviously, the thermal decomposition of (NH4)2SO4 is a complex process. Thermal decomposition reactions can be divided into three steps [20,21], as shown in Table 6. The intermediate products during thermal decomposition, NH4HSO4, (NH4)3H(SO4)2, NH2SO3H, and (NH4)2S2O7, are known as acidifying agents. These acidifying agents perform better under "acidification" than the aqueous solution of (NH4)2SO4. Thus, rare earth oxides can be decomposed into rare earth ions by acidifying agents within the temperature range of 200–500 °C.
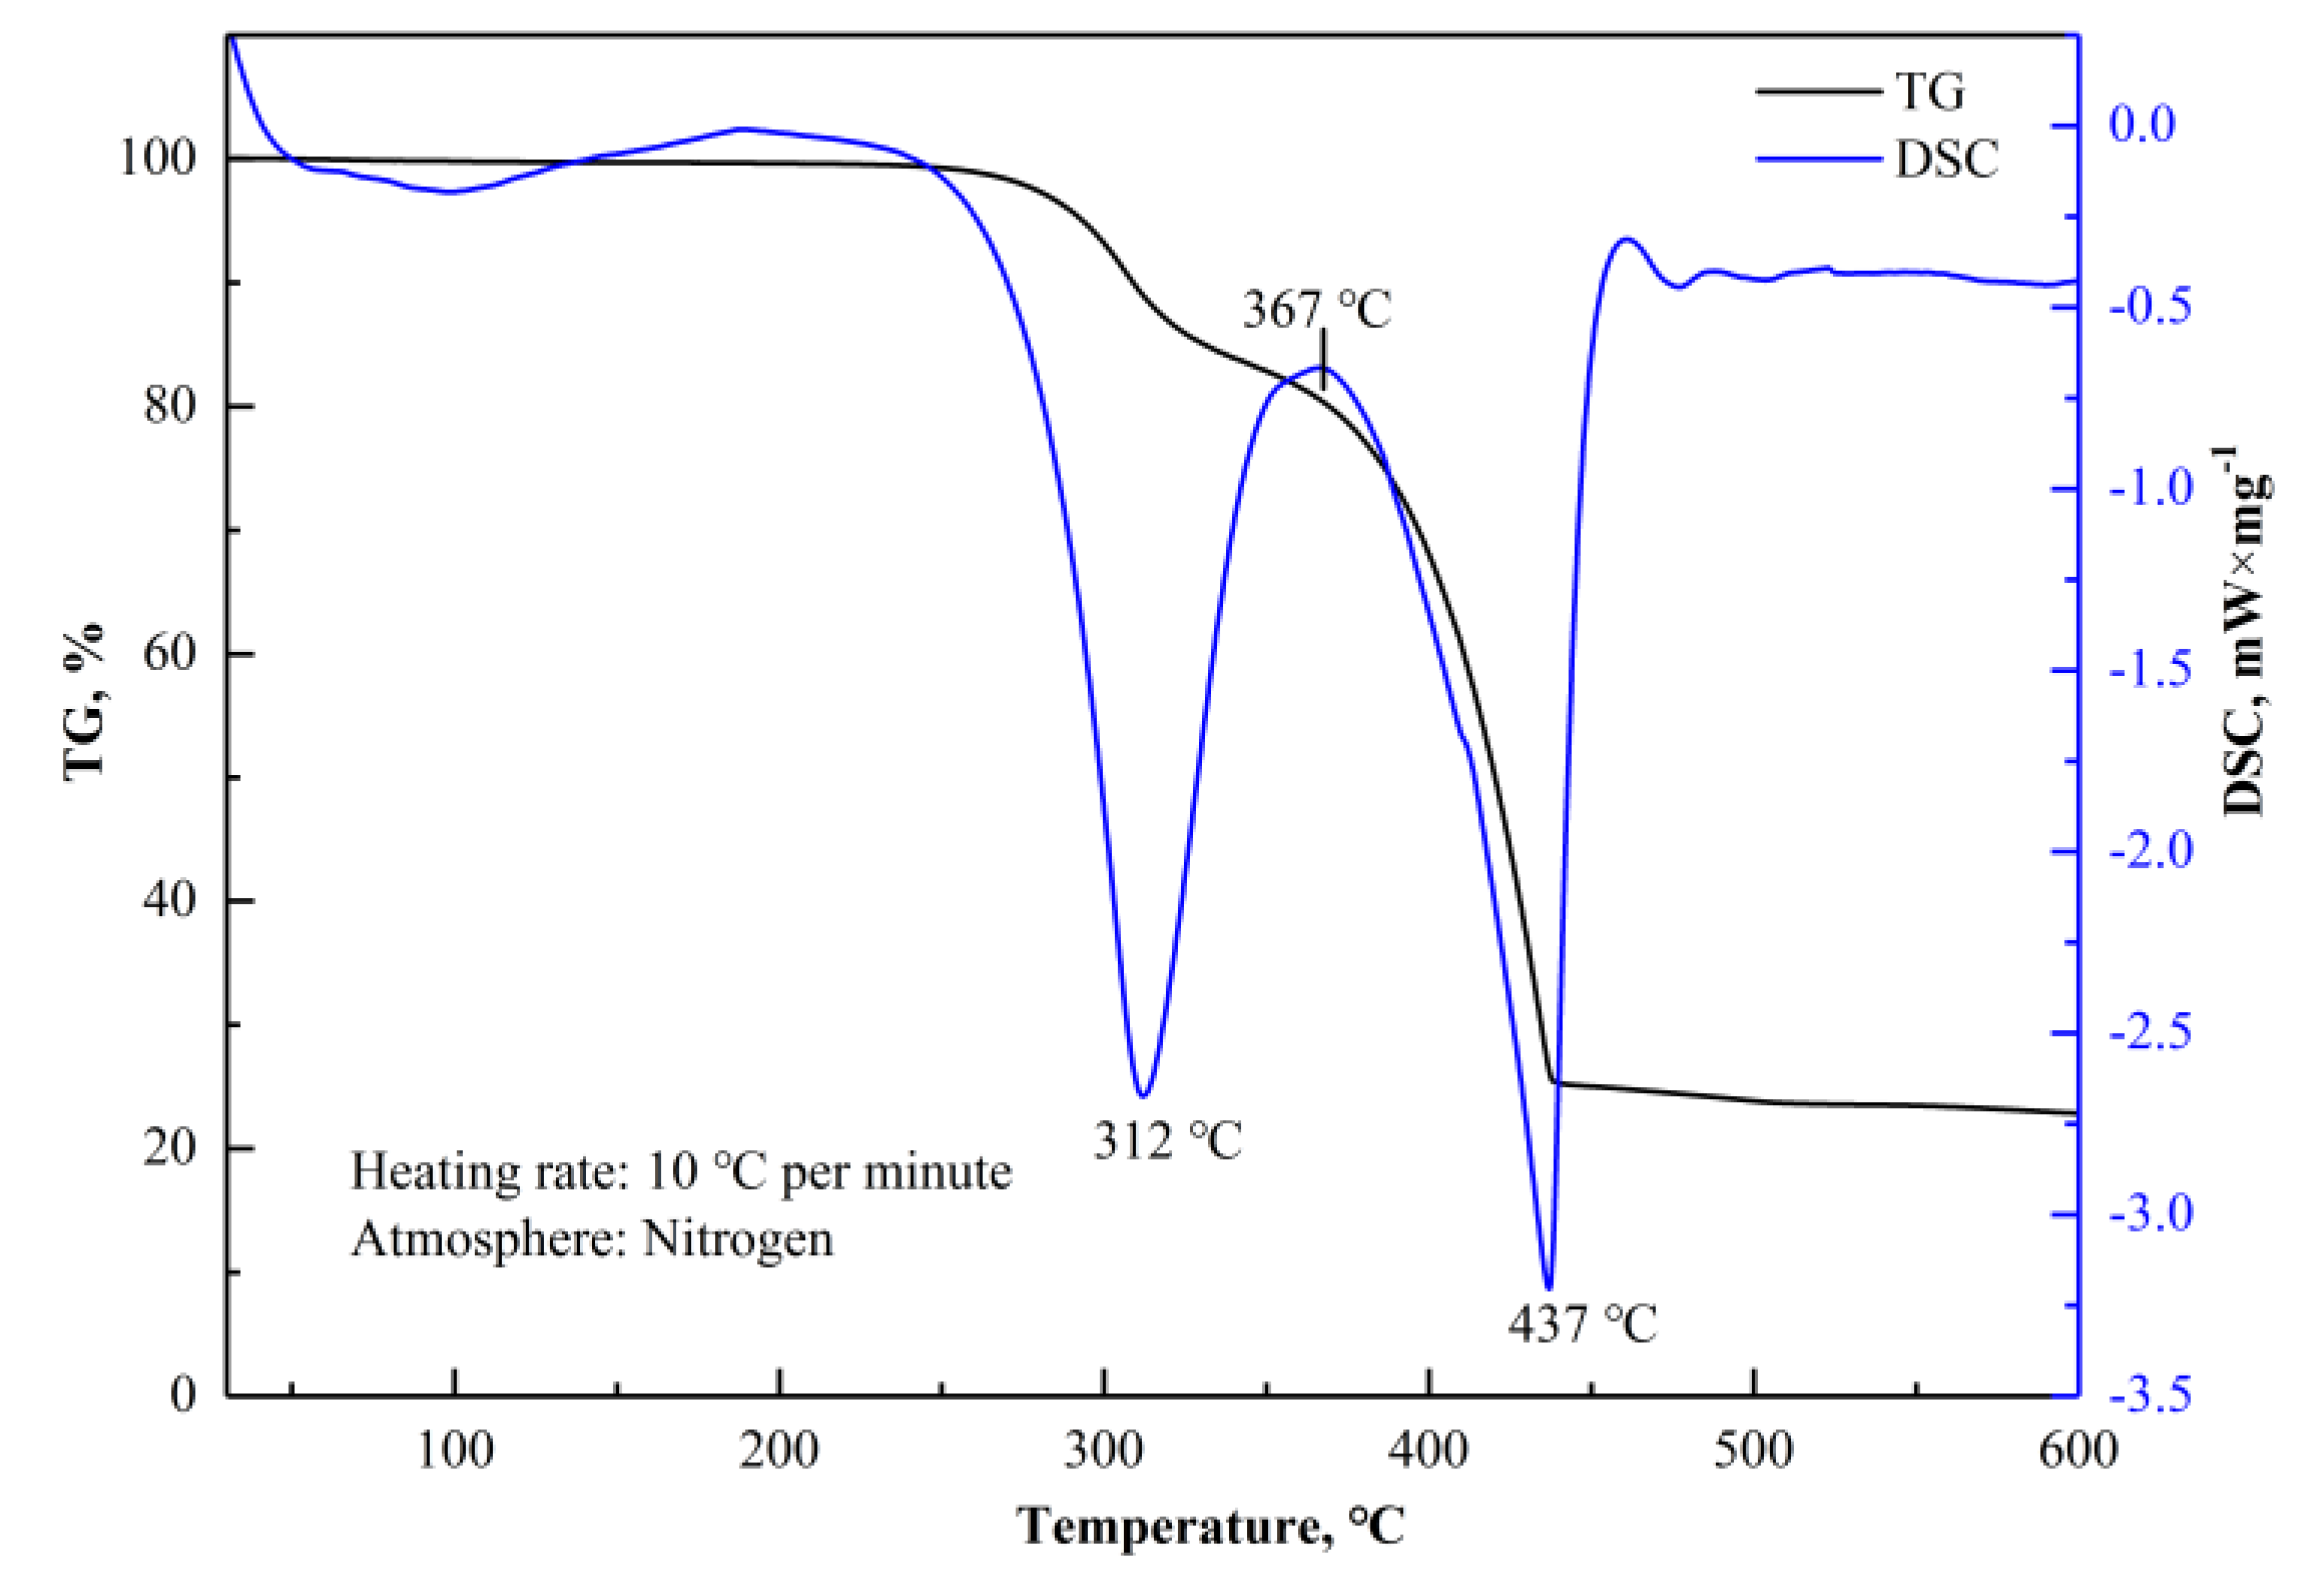
Figure 13 shows the TG–DSC curve of the mixture of the magnetic separation tailings and (NH4)2SO4 in a mass ratio of 4:1. In contrast to the TG–DSC curve of (NH4)2SO4 shown in Figure 12, the number of the endothermic peaks and the peak temperature of the endothermic peaks changed. The peak at 312 °C indicated the occurrence of thermal decomposition of (NH4)2SO4 and the formation of NH4RE(SO4)2·4H2O. The peak at 437 °C indicated the thermal decomposition of NH4RE(SO4)2·4H2O and residual acidifying agents.
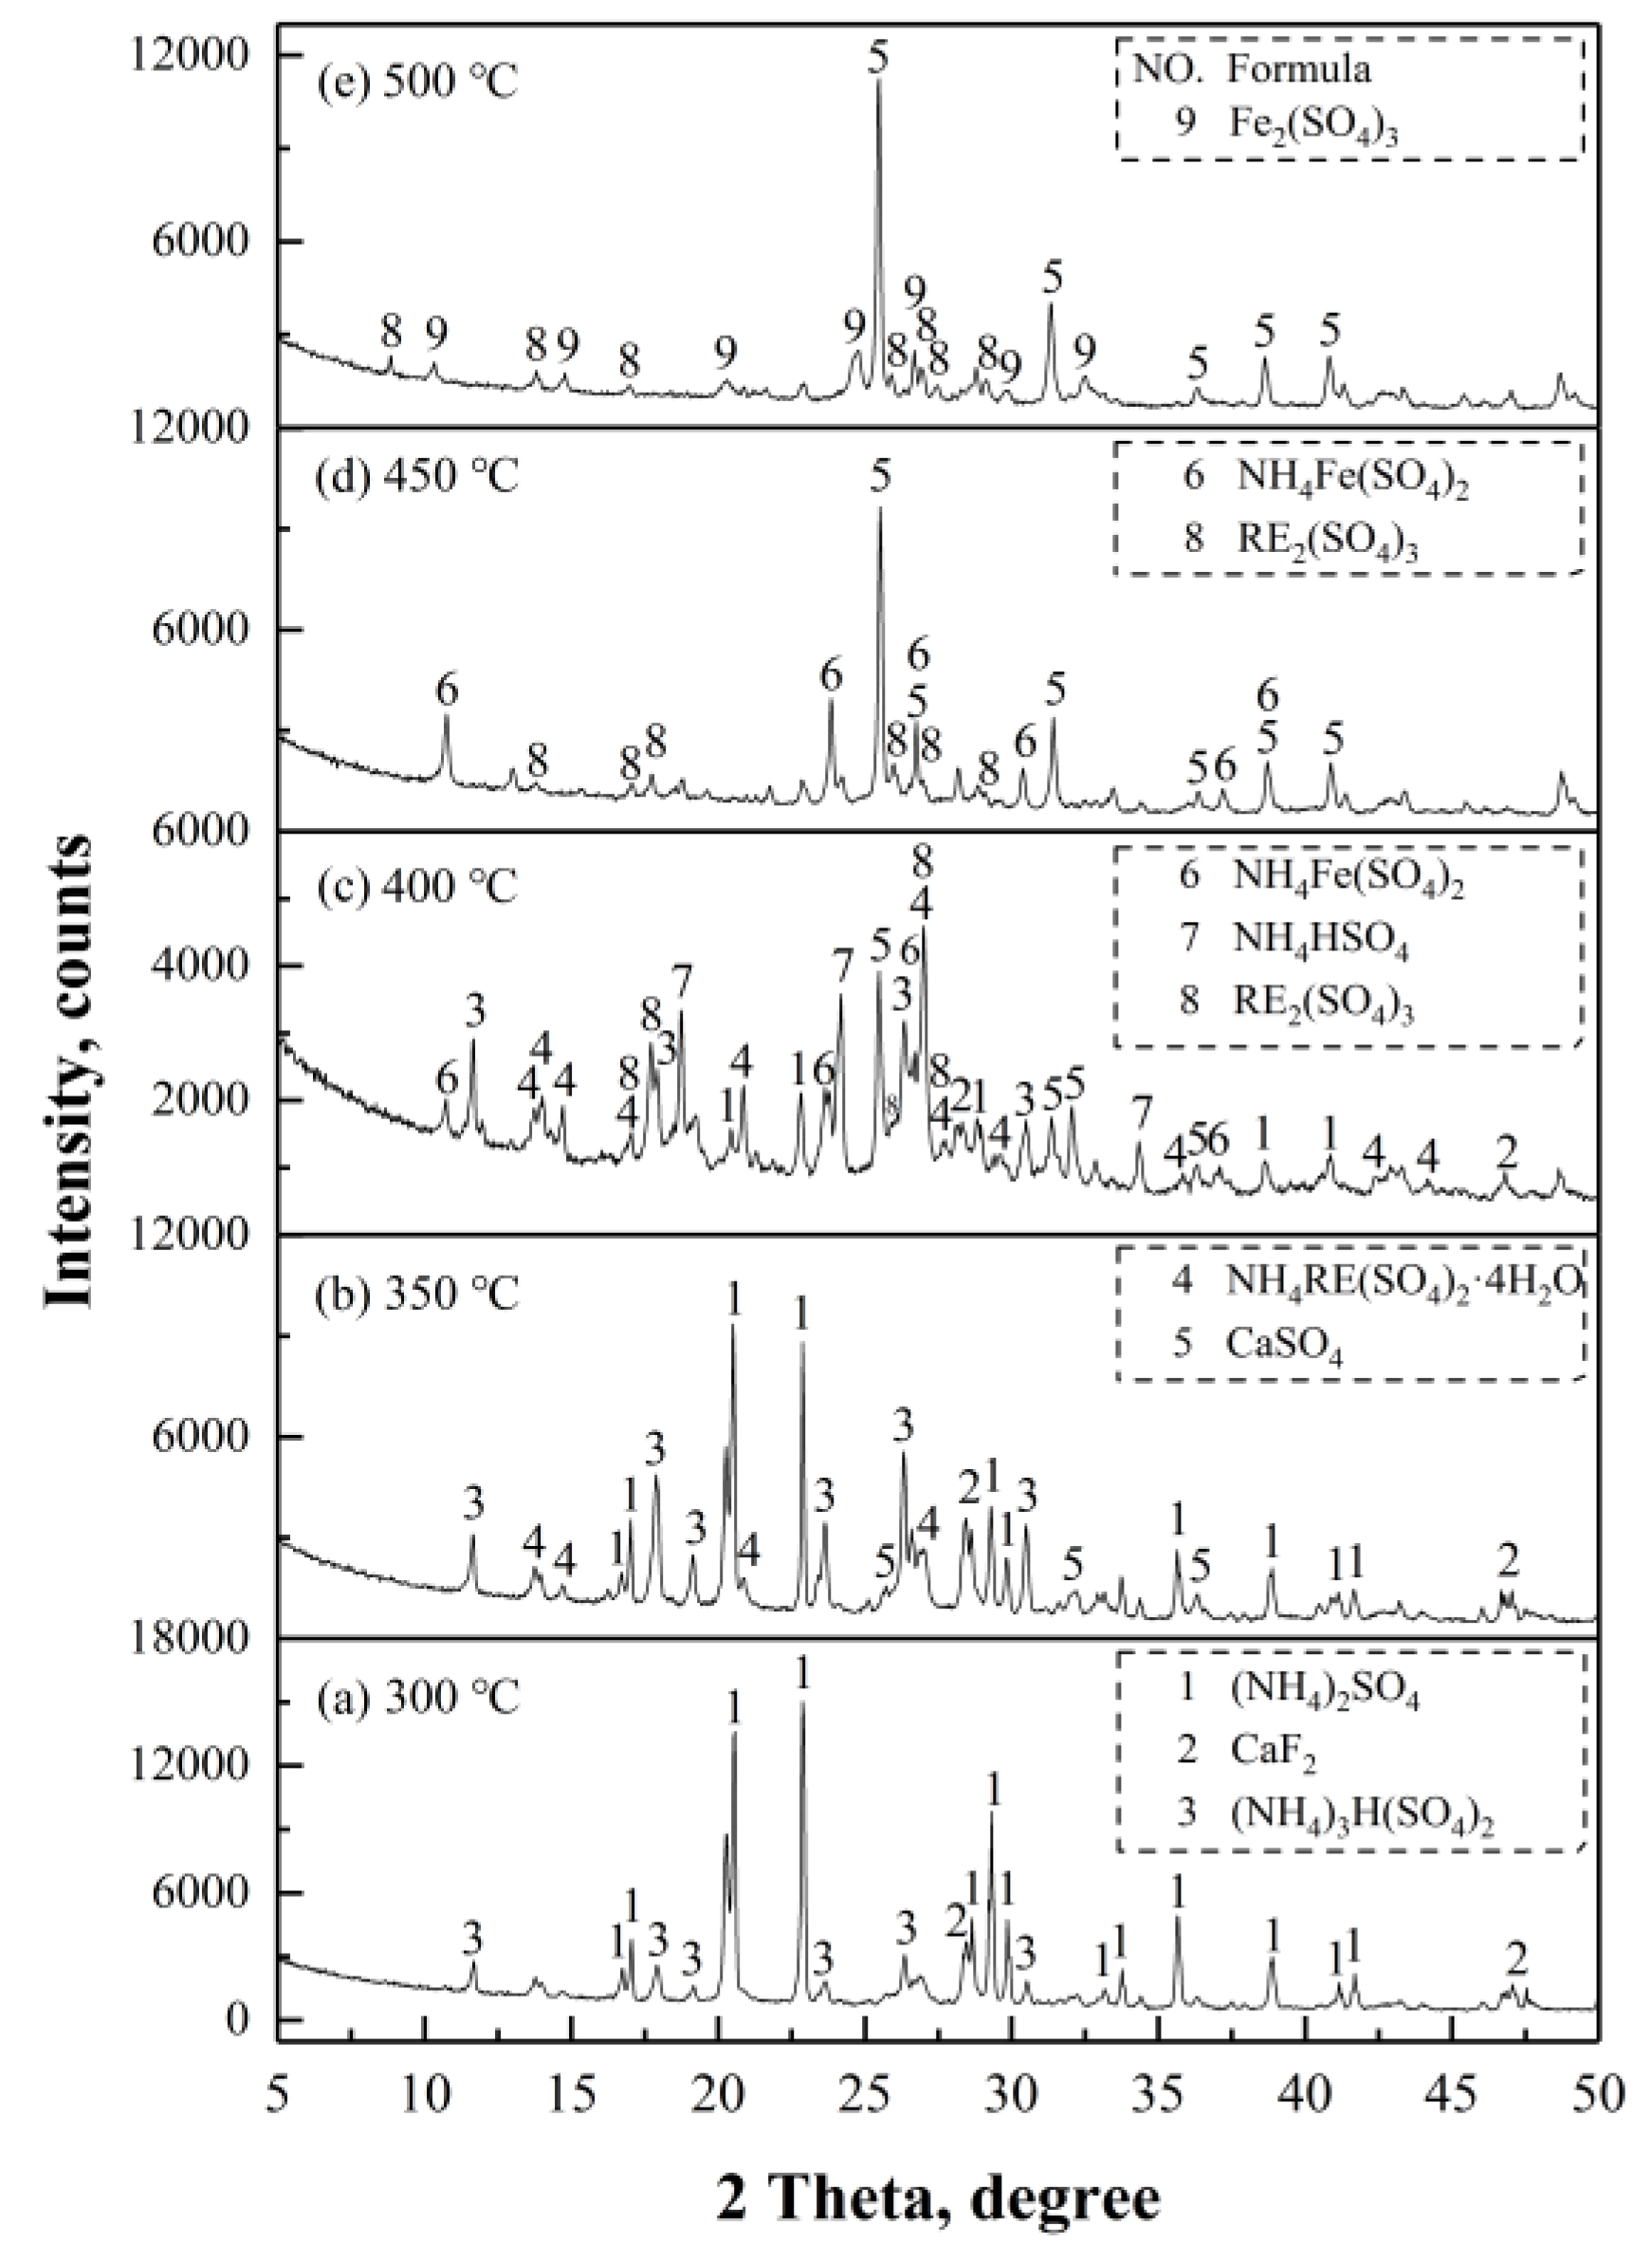
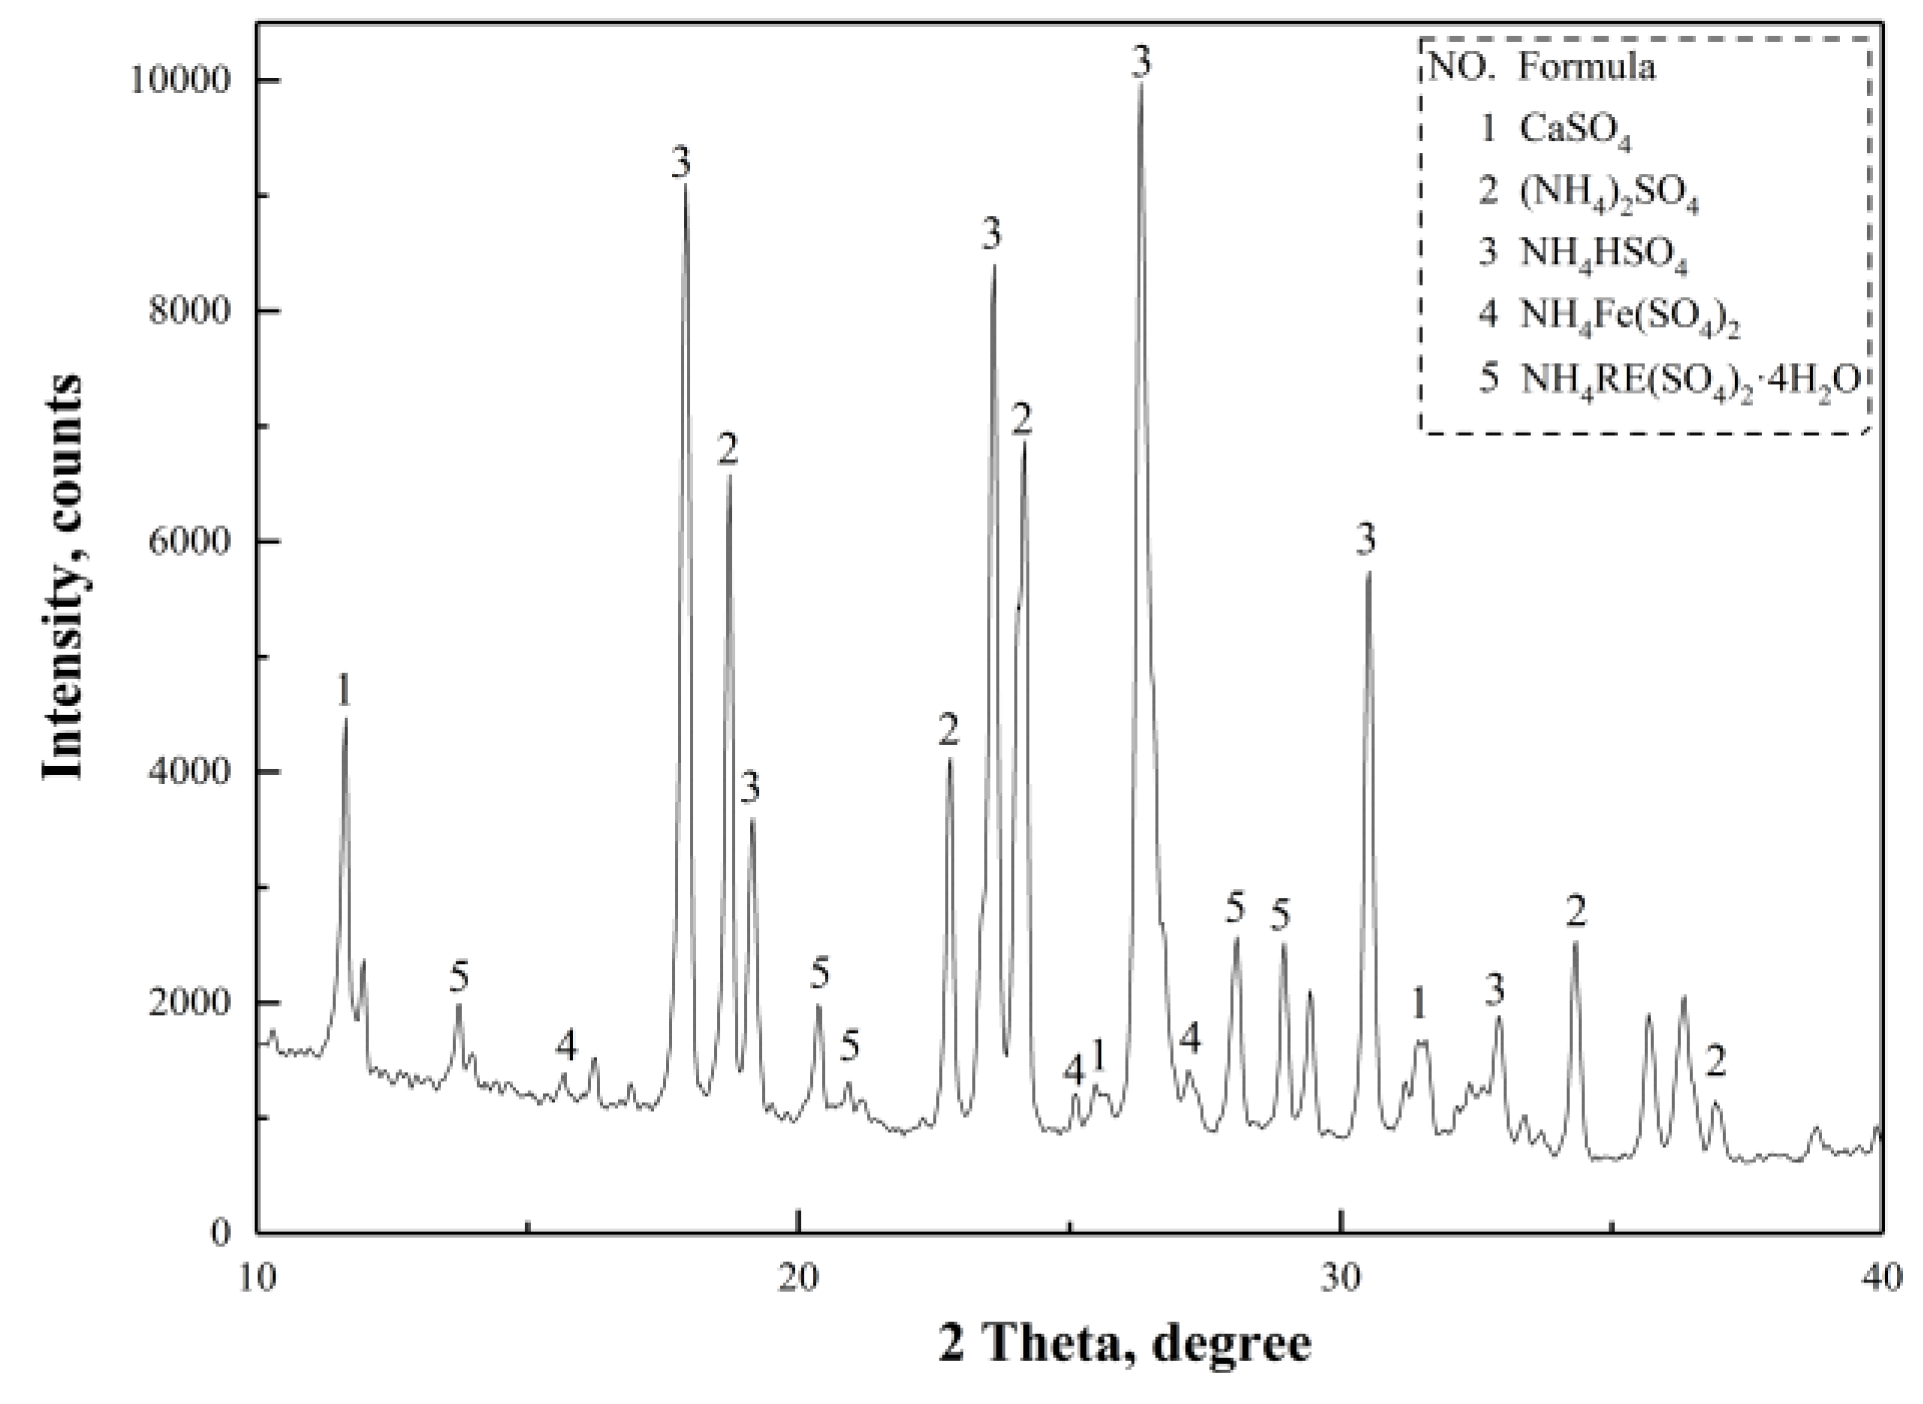
Activation roasting experiments were conducted at various temperatures, and the products were analyzed by XRD, as shown in Figure 14.
(NH4)3H(SO4)2 was the only product observed in Figure 14a, indicating that the dominant reaction was Equation (15), when the roasting temperature reached 300 °C. As for the increase of temperature, the reactions of Equations (20)–(25), (31), and (32) occurred at 350 °C, corresponding to the first endothermic peak in Figure 13, with the products of CaSO4 and NH4RE(SO4)2·4H2O as shown in Figure 14b. The formation of NH4Fe(SO4)2, NH4HSO4 and RE2(SO4)3 at 400 °C, shown in Figure 14c, implied that NH4RE(SO4)2·4H2O and (NH4)2SO4 continued to decompose, and ferruginous minerals (residual Fe2O3 and Fe3O4, NaFeSi2O6, FeS) reacted with the acidifying agents. The characteristic peaks of (NH4)2SO4, NH4HSO4 and NH4RE(SO4)2∙4H2O disappeared at 450 °C, as shown in Figure 14d, which were attributed to the complete decomposition of NH4RE(SO4)2·4H2O, (NH4)2SO4, and the residual acidifying agents, corresponding to the second endothermic peak in Figure 13. When the temperature reached 500 °C, NH4Fe(SO4)2 completely decomposed into Fe2(SO4)3, as shown in Figure 14e. The reactions between the magnetic separation tailings and (NH4)2SO4 which may occur at roasting temperatures from 200 to 500 °C, are expressed with Equations (20)–(32). In addition, the reaction (Equation (33)) between CeO2 and (NH4)2SO4 at 250 °C was also included, which is confirmed by Mudher K.D.S et al. [13].
2(NH4)2SO4 + REOF → NH4RE(SO4)2 + HF↑ + 3NH3↑ + H2O↑
4(NH4)2SO4 + RE2O3 → 2NH4RE(SO4)2 + 6NH3↑ + 3H2O↑
(NH4)3H(SO4)2 + REOF → NH4RE(SO4)2 + HF↑ + 2NH3↑ + H2O↑
2(NH4)3H(SO4)2 + RE2O3 → 2NH4RE(SO4)2 + 4NH3↑ + 3H2O↑
2NH4HSO4 + REOF → NH4RE(SO4)2 + HF↑ + NH3↑ + H2O↑
4NH4HSO4 + RE2O3 → 2NH4RE(SO4)2 + 2NH3↑ + 2H2O↑
2NH4RE(SO4)2 → RE2(SO4)3 + 2NH3↑ + SO3↑ + H2O↑
6(NH4)2SO4 + Fe2O3 → 2(NH4)3Fe(SO4)3 + 6NH3↑ + 3H2O↑
4(NH4)3Fe(SO4)3 + Fe2O3 → 6NH4Fe(SO4)2 + 6NH3↑ + 3H2O↑
6(NH4)2SO4 + Fe3O4 → 2NH4Fe(SO4)2 + (NH4)2Fe(SO4)2 + 8NH3↑ + 4H2O↑
2NH4Fe(SO4)2 → Fe2(SO4)3 + 2NH3↑ + SO3↑ + H2O↑
(NH4)2SO4 + CaCO3 → CaSO4 + 2NH3↑ + H2O↑ + CO2
CaF2 + (NH4)2SO4 → CaSO4 + 2NH3↑ + 2HF↑
CeO2 + 4(NH4)2SO4 → (NH4)4Ce(SO4)4 + 4NH3↑ + 2H2O↑
NH4RE(SO4)2·4H2O and RE2(SO4)3 are soluble in water, providing a feasible way to extract REEs by water leaching. According to the above analysis and TG-DSC curves in Figure 12 and Figure 13, the roasting temperature should be controlled below 400 °C to avoid rapid decomposition and mass loss of (NH4)2SO4, which is detrimental to the formation of NH4RE(SO4)2·4H2O.
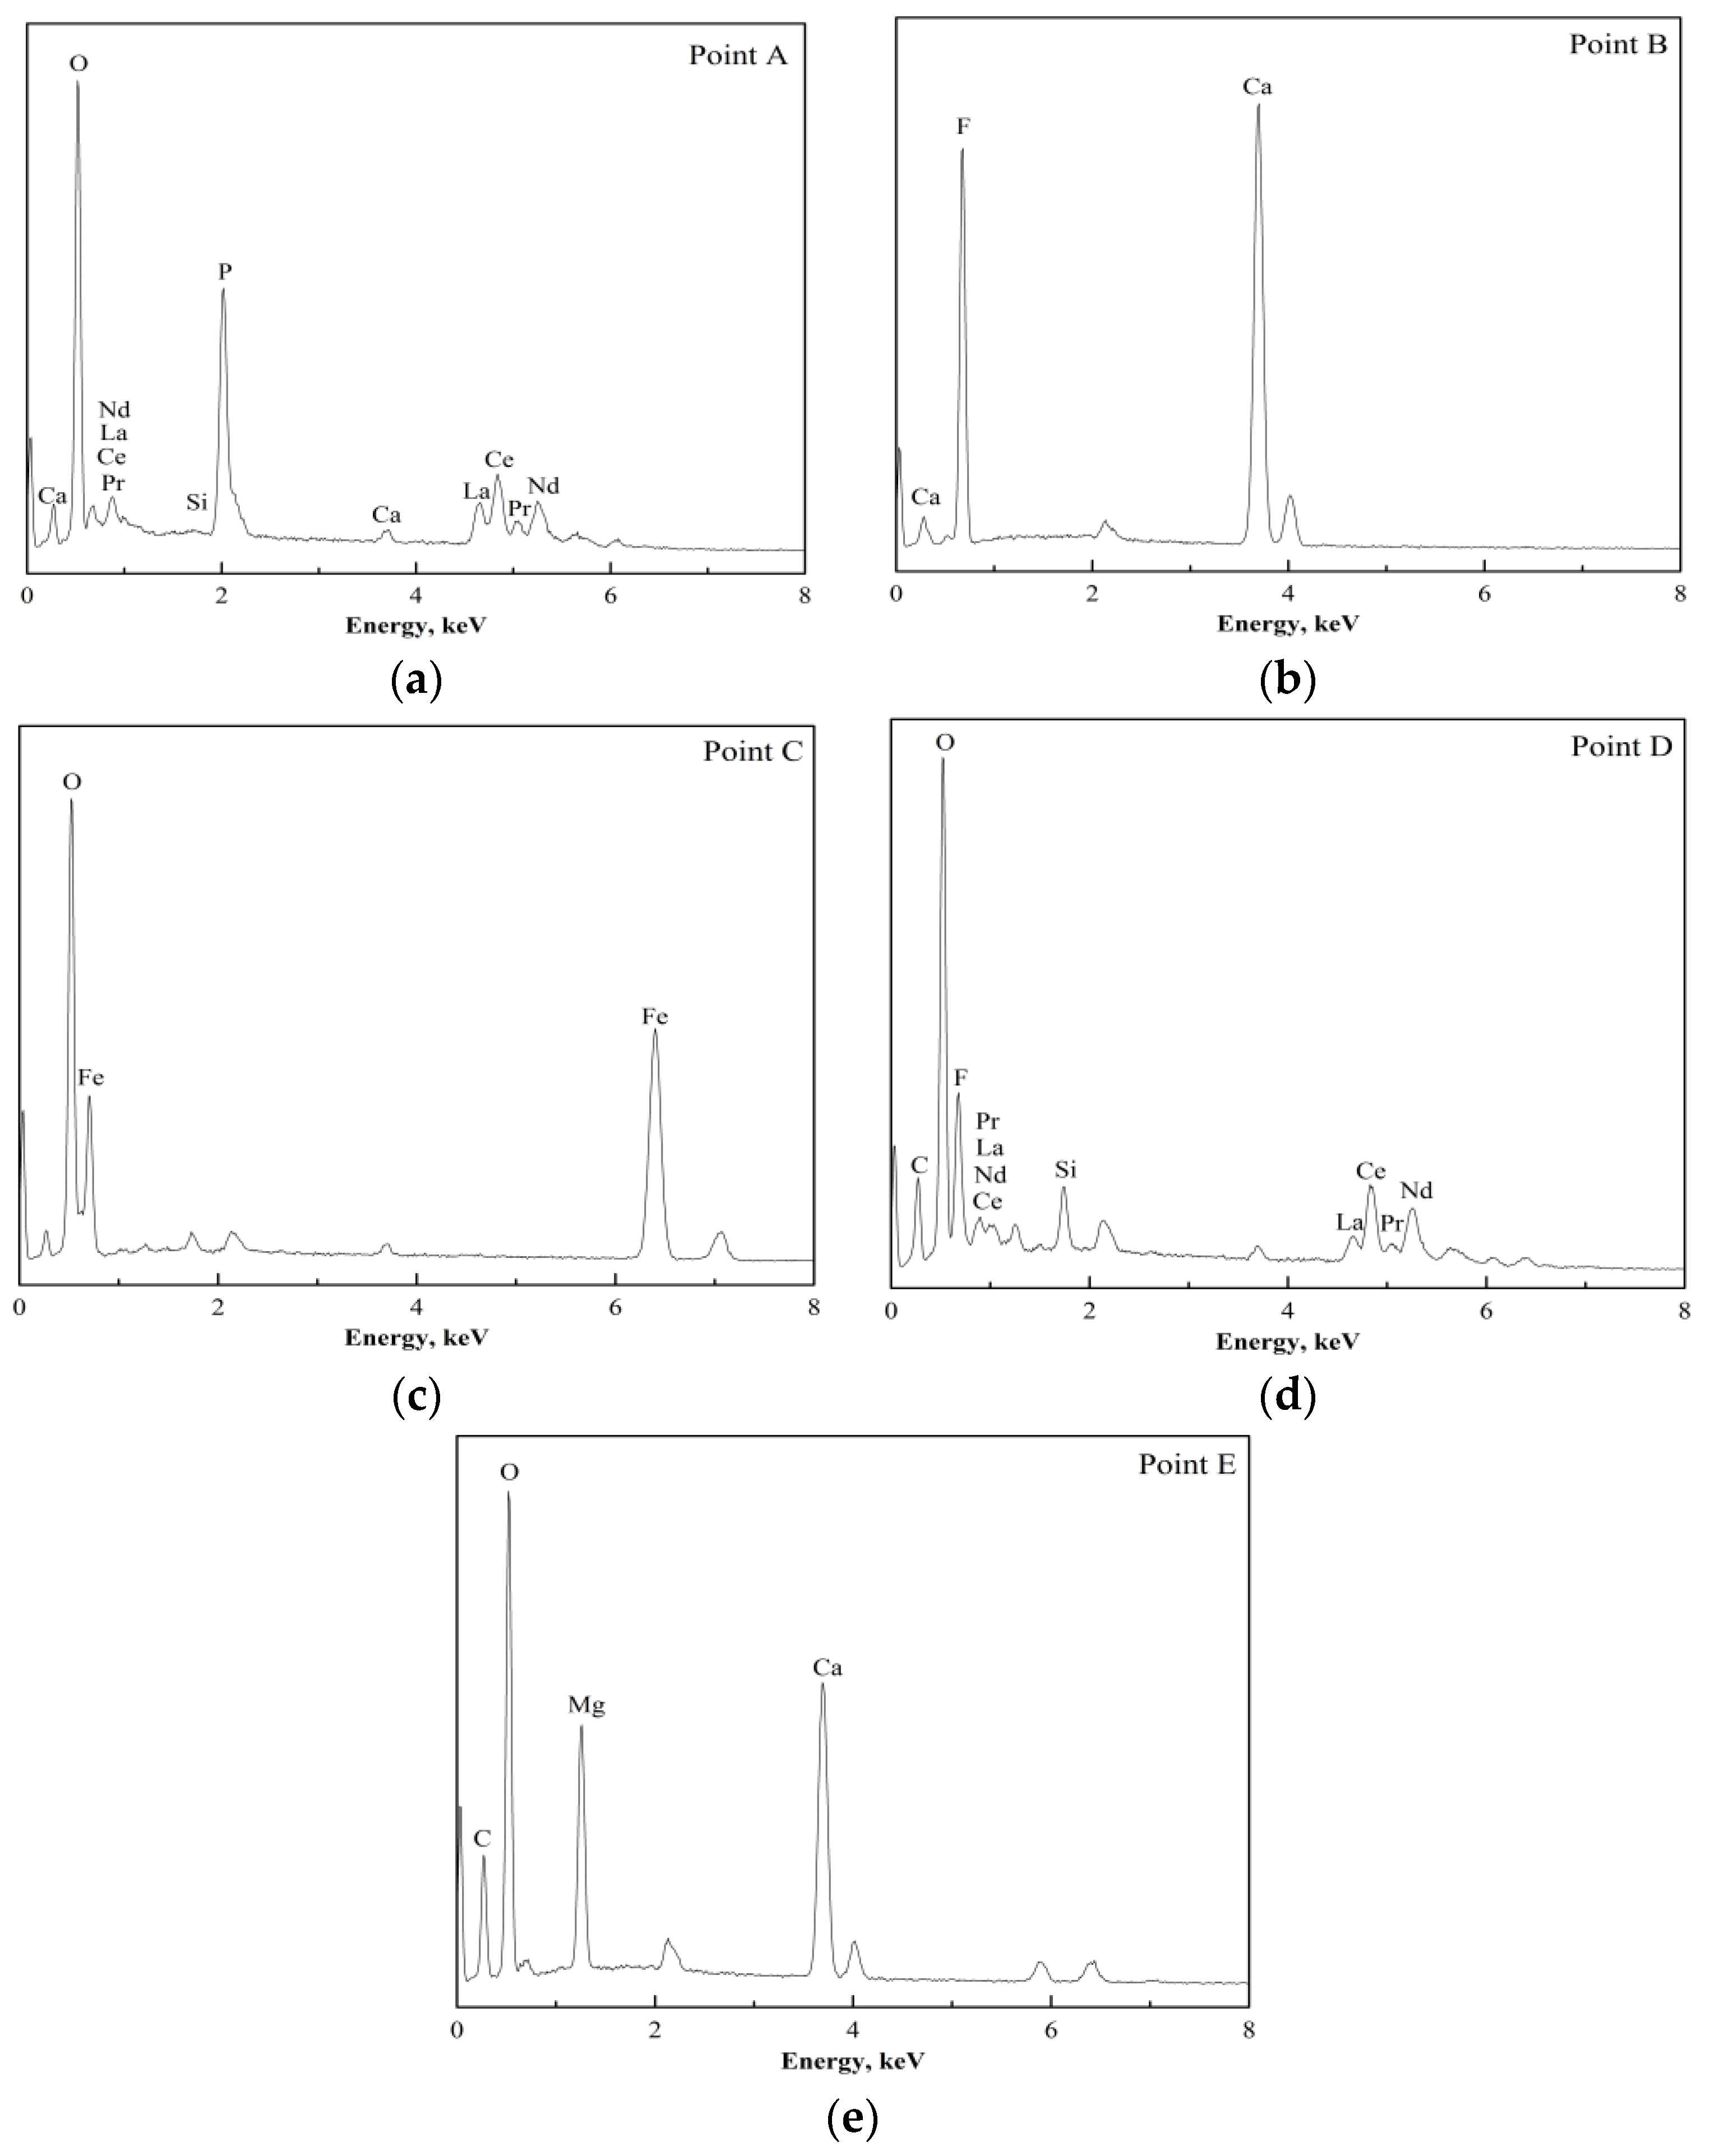
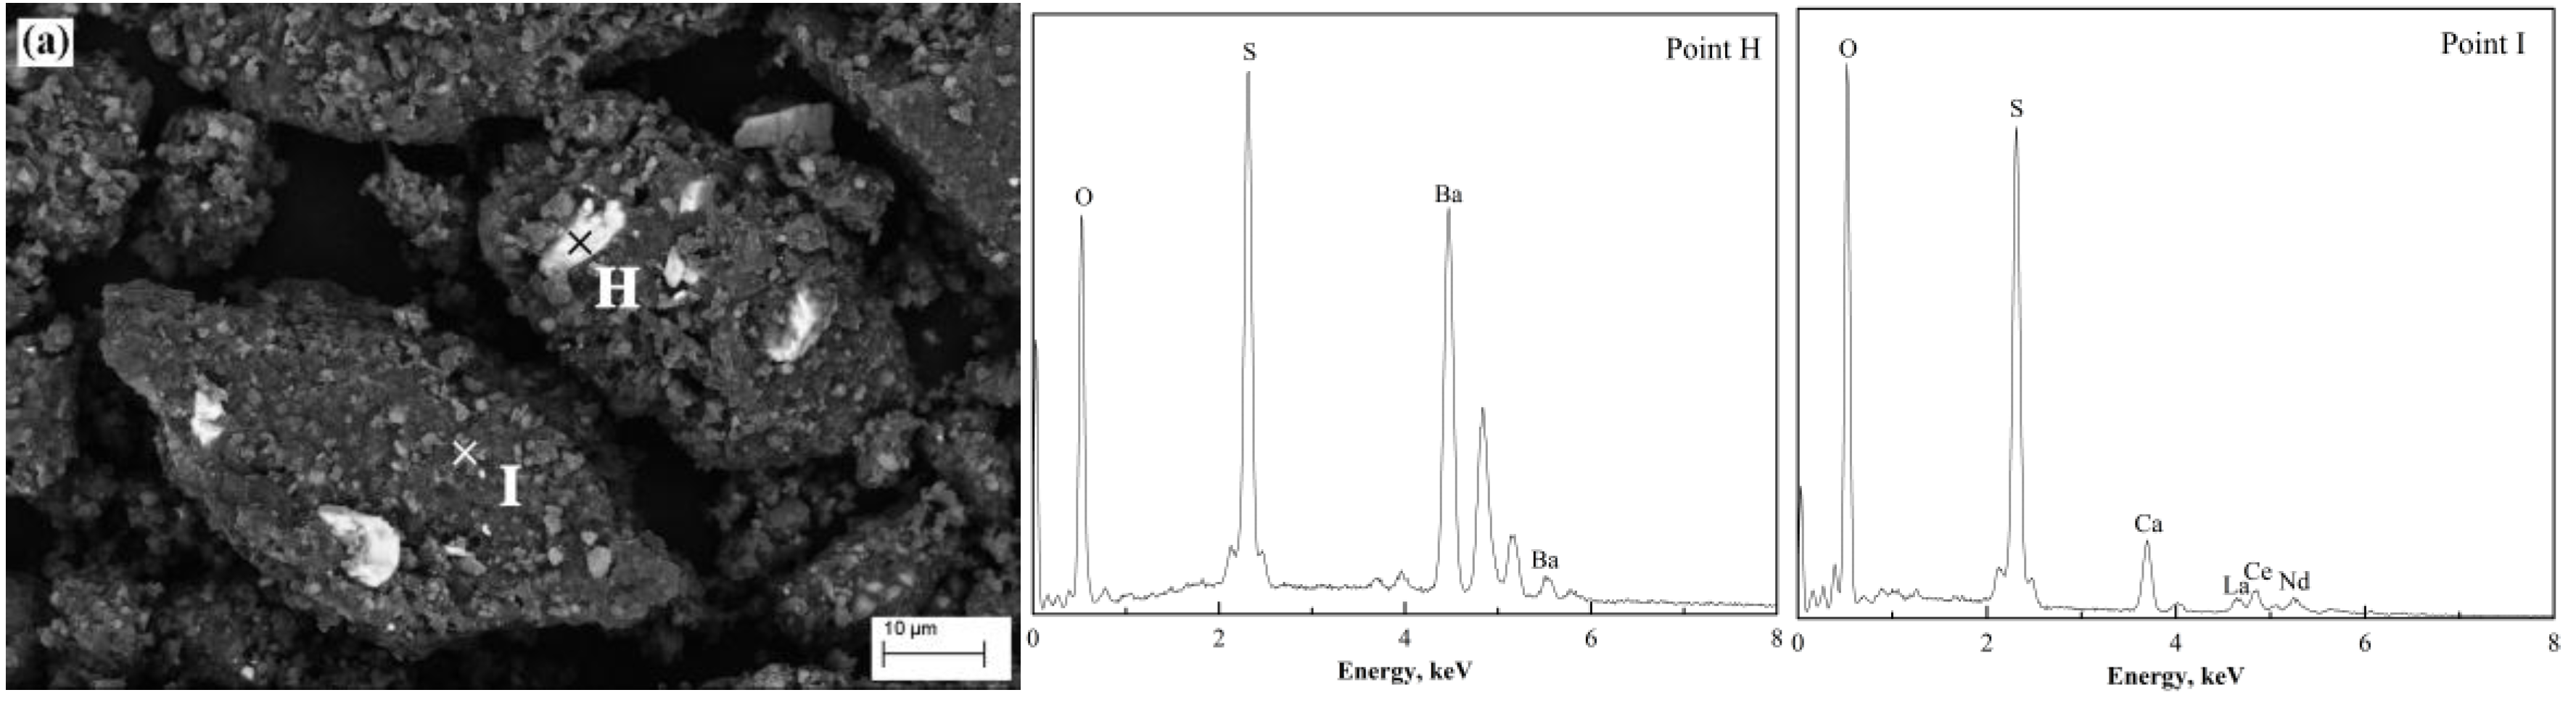
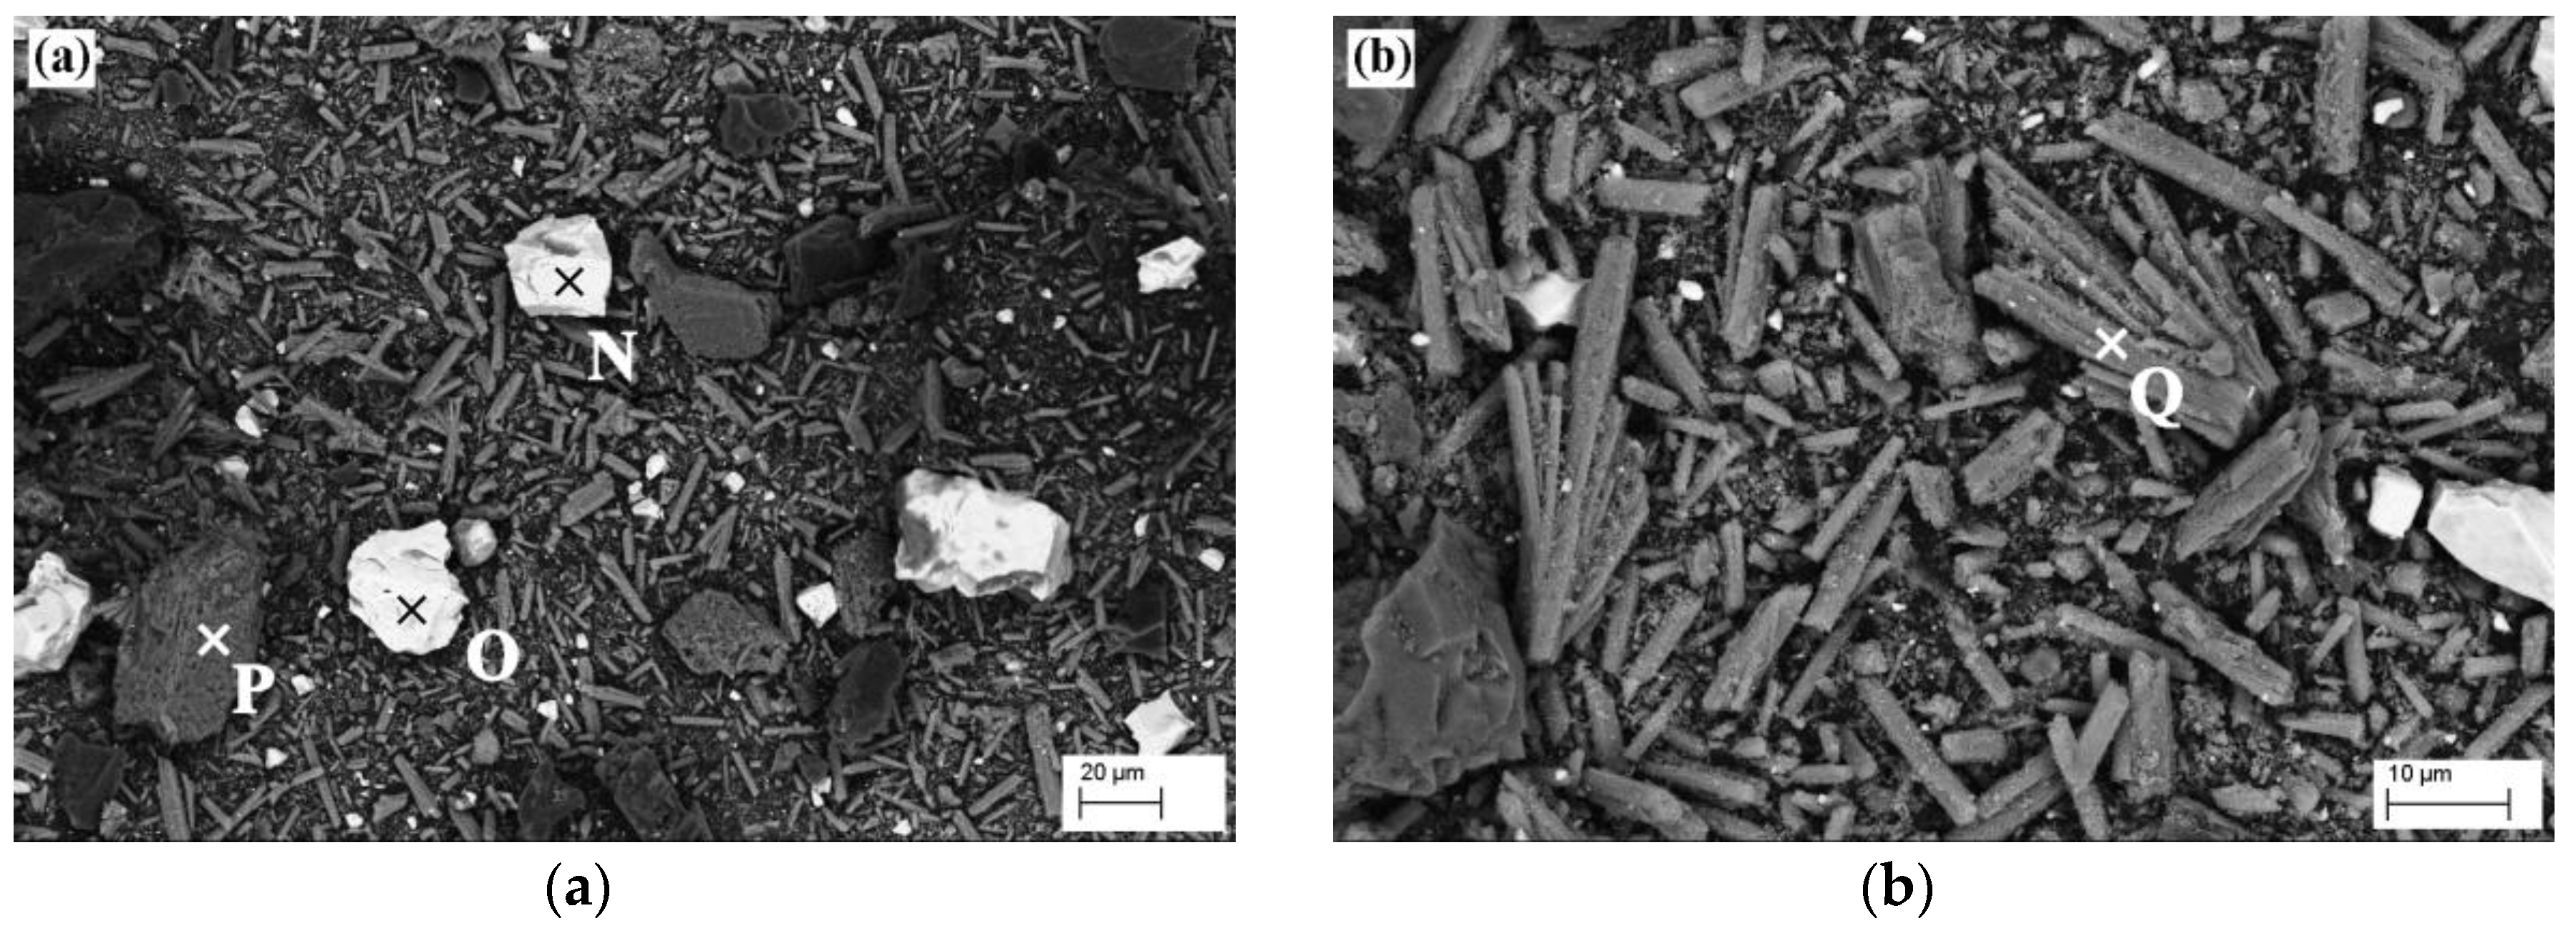
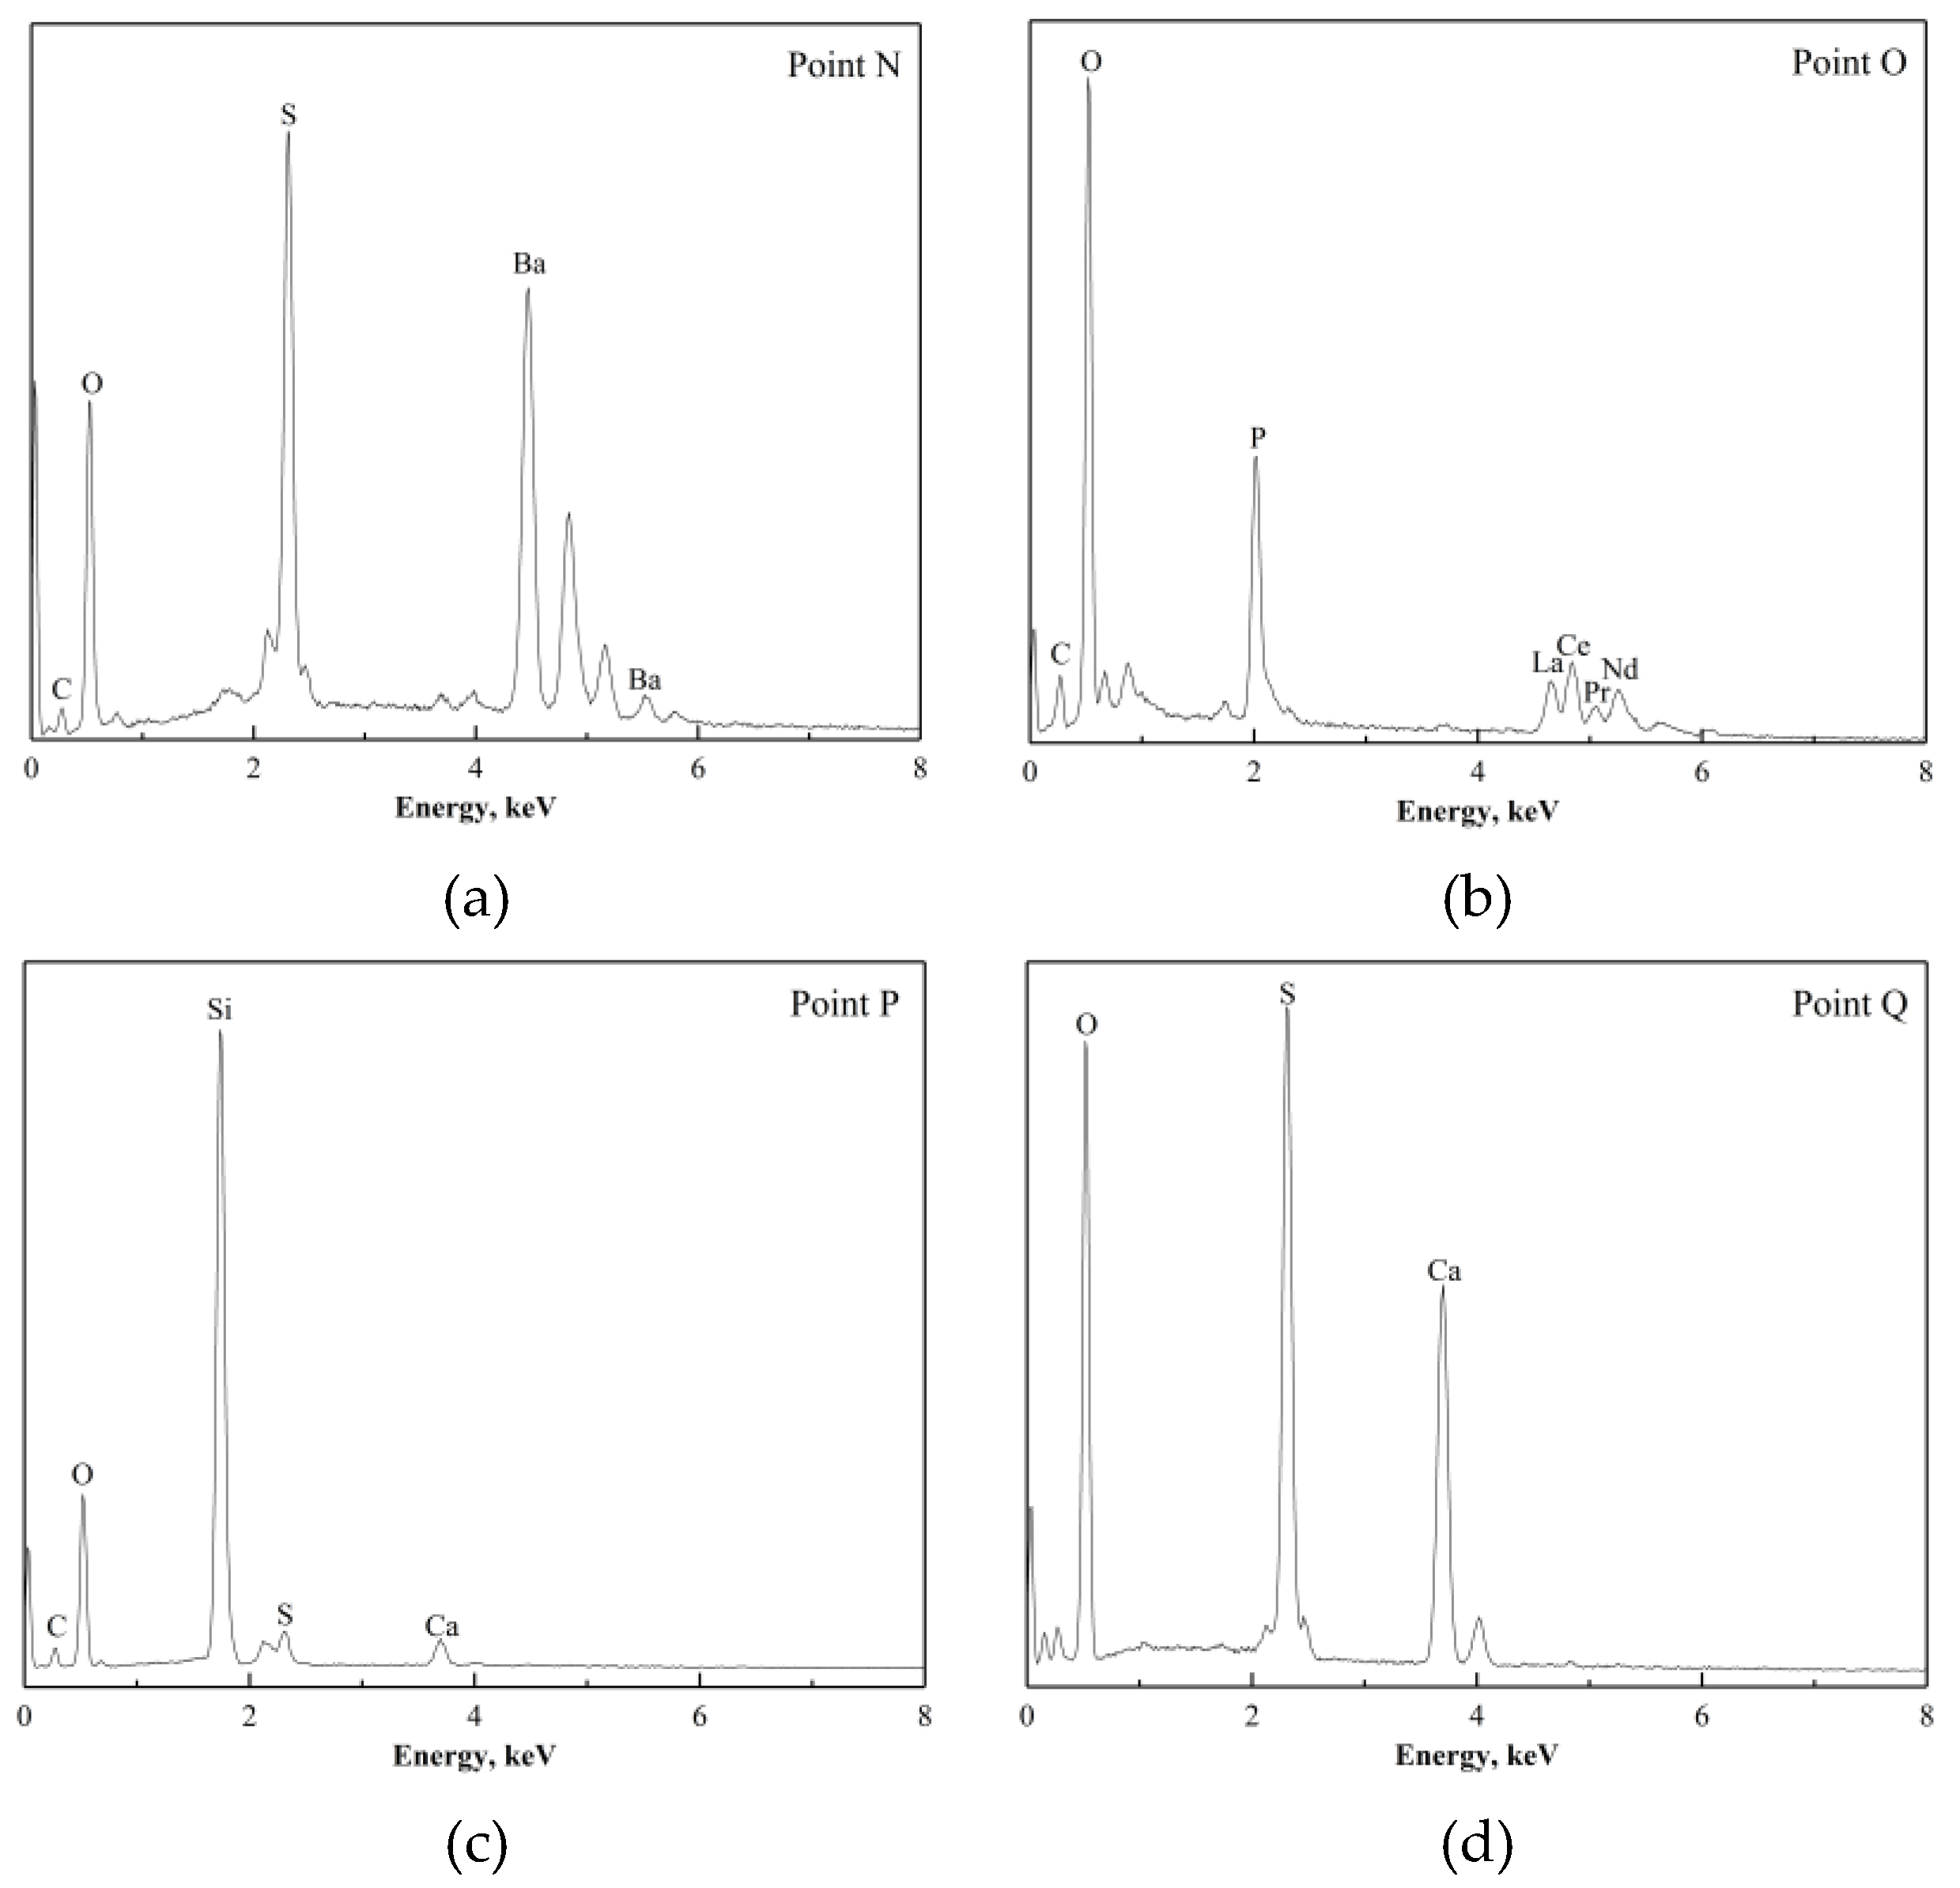
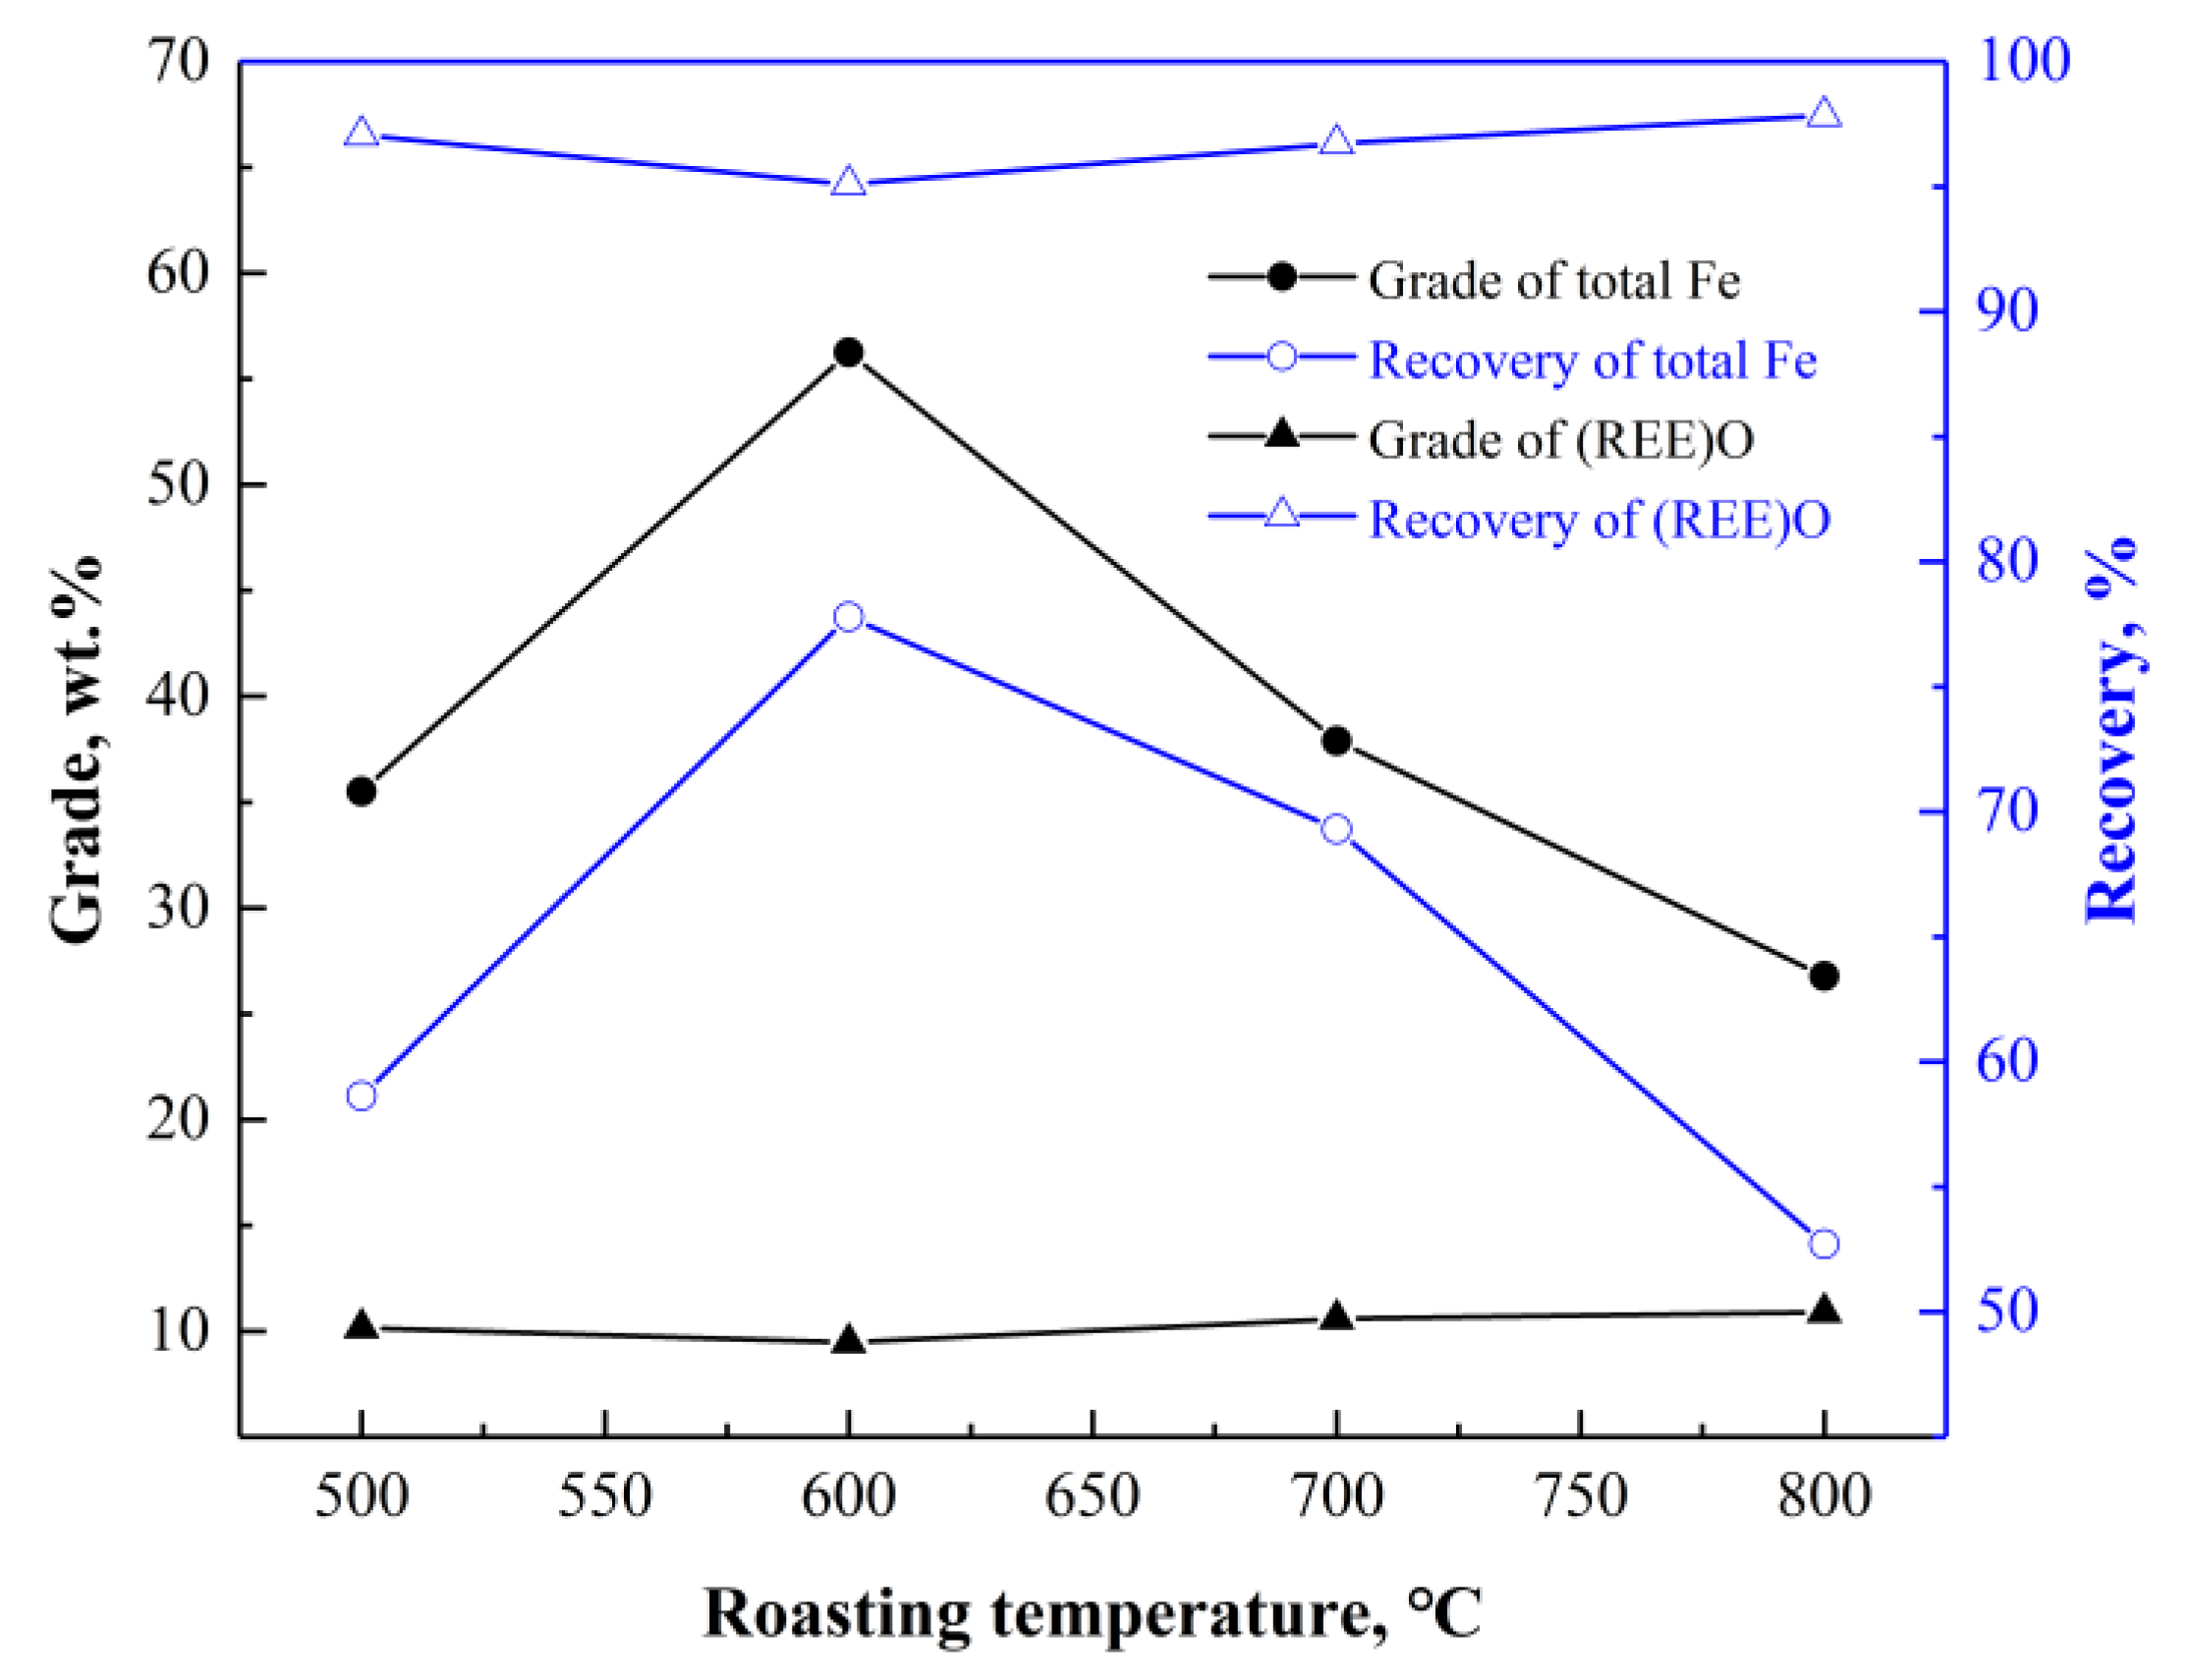
The morphology of the products after (NH4)2SO4 activation roasting at various temperatures was examined by SEM-EDS. Figure 15a shows the particles roasted at 400 °C. The particles were covered with sulfates (NH4RE(SO4)2·4H2O, CaSO4, (NH4)2SO4, etc.) as indicated by the letter I in Figure 15a. The white phase (marked as “H” in Figure 15a) on the surface of particles was identified as BaSO4.
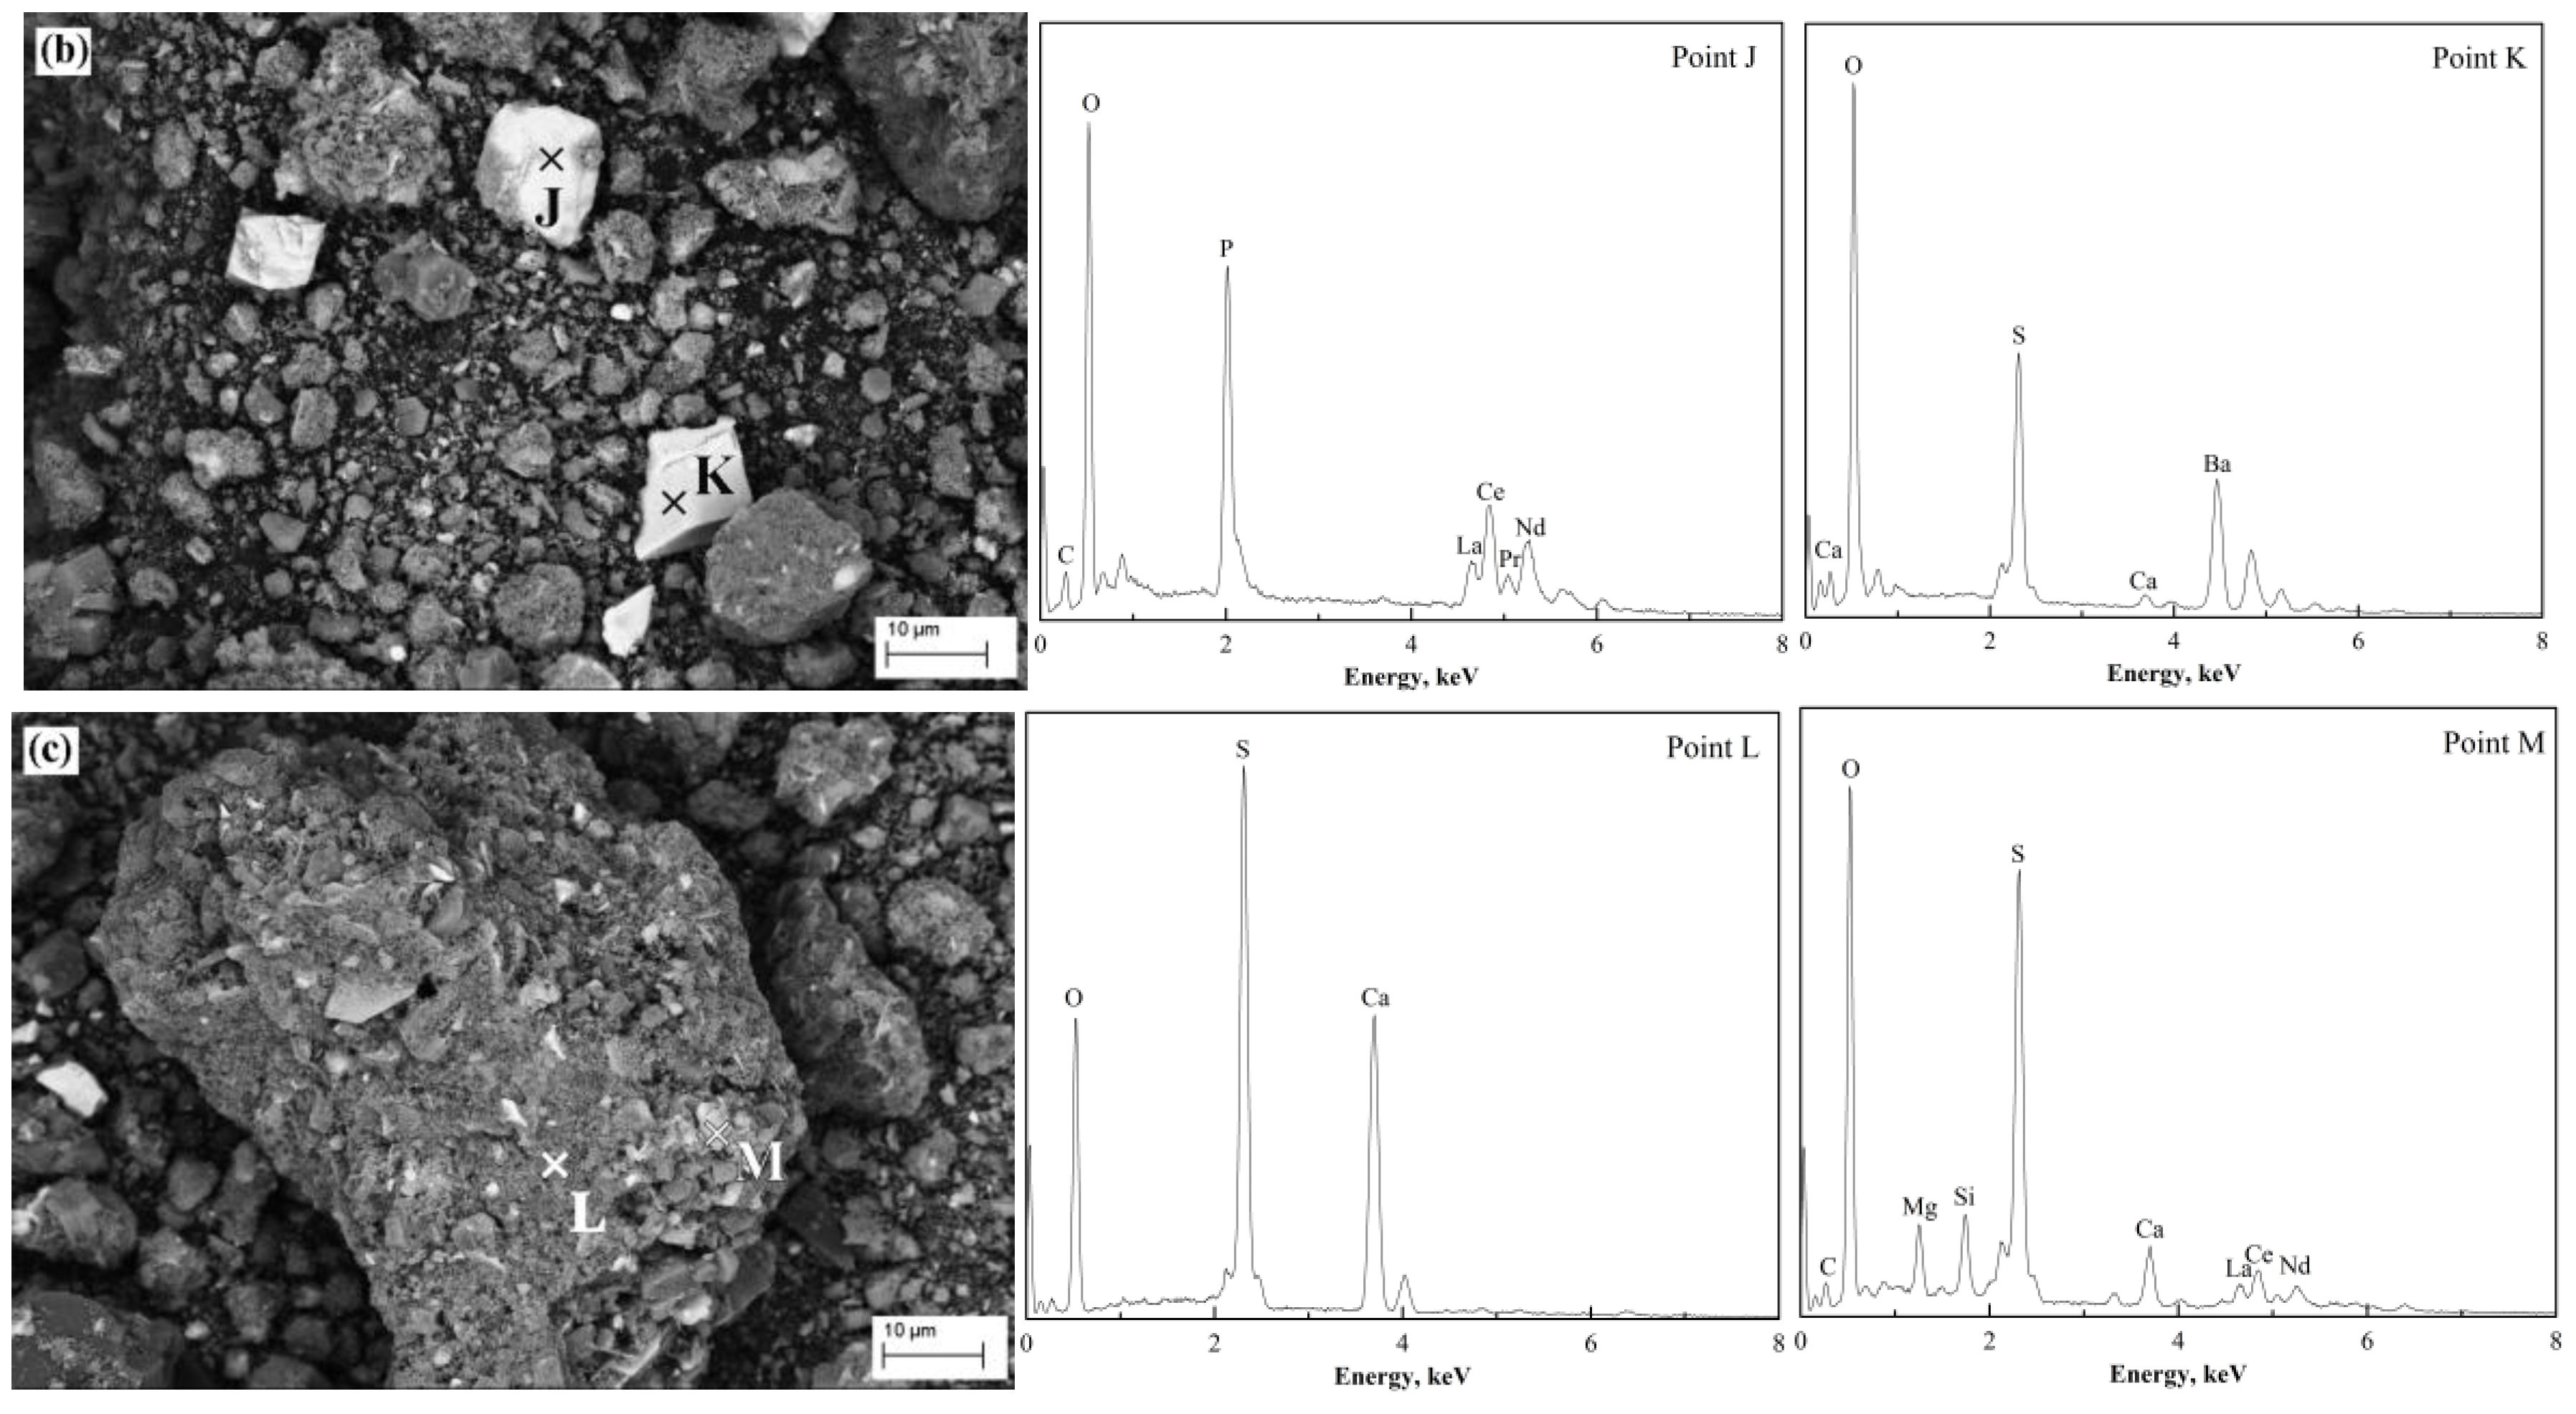
The micrograph of roasting products at 500 °C shows a non-uniform distribution in particle size, as shown in Figure 15b,c. The bright phases (marked as “J” and “K”) were REPO4 and BaSO4 respectively, indicating that they hardly reacted with (NH4)2SO4 or the acidifying agents. The larger particle in Figure 15c consisted of CaSO4 (marked as “L”) and other sulfates (marked as “M”) such as RE2(SO4)3 and MgSO4. The morphology shown in Figure 15c was different from the one shown in Figure 15a, because there was no residual (NH4)2SO4 on the surface, after roasting at 500 °C.

4.4. Effect of Temperature on the Leaching Recovery of REEs during (NH4)2SO4 Activation Roasting

The leaching recovery of REEs was defined as the ratio of the mass of REEs in the leaching solution to the mass of REEs in the tailings before leaching. Water leaching tests were carried out with different samples produced via (NH4)2SO4 activation roasting at different temperatures. The mass ratio of (NH4)2SO4 to the tailings was 4:1, and the duration of the roasting process was 60 min. The trends of leaching recovery with the roasting temperature for La, Ce and Nd are shown in Figure 16. The leaching recoveries increased sharply in the temperature range of 300–400 °C, and reached a maximum at 400 °C. The maximum values for La, Ce and Nd were 78.75%, 75.57%, and 75.89%, respectively.
According to the above analysis, (NH4)2SO4 started to become liquefied and decomposed at 300 °C. Due to the lack of molten (NH4)2SO4 and “acidifying agents”, the formation of NH4RE(SO4)2·4H2O was quite slow before 300 °C, resulting in low leaching recovery. With the rise of temperature, molten (NH4)2SO4 and the acidifying agents increased, promoting the leaching recoveries of La, Ce and Nd by generating large amounts of NH4RE(SO4)2·4H2O. However, after temperatures exceeding 400 °C, (NH4)2SO4 and the acidifying agents started to decompose rapidly, verified by the TG–DSC results in Figure 12. The generation of NH4RE(SO4)2·4H2O was cut down due to the lack of molten (NH4)2SO4 and acidifying agents, leading to a drop in leaching recovery. It was easily concluded that the optimum temperature for roasting should be 400 °C.

4.5. Effect of (NH4)2SO4 Activation Roasting Time on the Leaching Recovery of REEs

Figure 17 shows the relationship of roasting time to the leaching recoveries of La, Ce and Nd by activation roasting, under identical conditions: a roasting temperature of 400 °C, and the mass ratio of (NH4)2SO4 to magnetic separation tailings being 4:1.
Leaching recovery continued to increase as roasting time increased, and reached maximum after 80 min. The maximum leaching recoveries for La, Ce and Nd were 81.13%, 76.29% and 79.58%, respectively. Before 80 min, the roasting time was too short for (NH4)2SO4 to become completely liquefied, resulting in insufficient generation of NH4RE(SO4)2·4H2O and RE2(SO4)3. The acidity of the leaching solution was maintained with residual (NH4)2SO4, preventing hydrolysis of RE2(SO4)3 to form precipitates. When the roasting time exceeded 80 min, (NH4)2SO4 were excessively consumed and decomposed, resulting in a lack of residual (NH4)2SO4. The two phenomena all led to the decrease of leaching recovery.

4.6. Effect of the Mass Ratio on the Leaching Recovery of REEs

A series of experiments were conducted at 400 °C for 80 min, to investigate the influence of the mass ratio of (NH4)2SO4 on magnetic separation tailings for the leaching recoveries of La, Ce and Nd. The results are shown in Figure 18, showing that the leaching recoveries of La, Ce and Nd reached the maximum value of 83.12%, 76.64% and 77.35%, respectively, at a mass ratio of 6:1.
During the roasting process, the more the molten (NH4)2SO4 and the acidifying agents were, the deeper the degree of reactivity (Equations (20)–(25)). Before reaching a ratio of 6:1, the increase in mass ratio led to an increase in leaching recovery. However, a further increase in (NH4)2SO4 led to excessive NH4+ and SO42− in the leaching solution. The REEs ions then tended to precipitate with extra NH4+ and SO42−, in form of NH4RE(SO4)2, leading to the loss of REEs.

4.7. Phase Analysis of the Leaching

The phase composition of leaching residues was analyzed by XRD and EDS. The results were shown in Figure 19 and Table 7. It showed that the leaching residues were mainly composed of CaF2, CaSO4, SiO2 and BaSO4. The morphologies of the leaching residues were shown in Figure 20 and Figure 21. The bright phases as shown in Figure 20a, were BaSO4 (marked as “N”) and REPO4 (marked as “O’), respectively; the dark phases were SiO2 (marked as “P”). The rod-like phases (marked as “Q”) in Figure 20b were CaSO4, which were the new phases formed during the leaching process. The possible reason for the residual CaF2 is that CaSO4 was formed on the surface of CaF2 particles during the roasting process, preventing further reaction between (NH4)2SO4 and CaF2. The REEs in the leaching residues were mainly found in undecomposed monazite (REPO4), which is the reason why the leaching recovery of REEs was less than 90%.
Figure 22 shows the XRD pattern of the precipitated crystals obtained after drying the leaching solution, indicating that the main ion components in the leaching solution were NH4+, SO42−, HSO4, Fe3+, RE3+ and Ca2+. The concentrations of La, Ce and Nd in the leaching solution were measured by ICP-OES, which were 0.407, 0.740 and 0.232 g/L, respectively, under the optimum conditions. The REEs elements could be precipitated by adjusting the pH of the leaching solution using the ammonia gas released from the (NH4)2SO4 activation roasting process. The REEs precipitate was then dissolved in an acid solution, from which the REEs could be recycled by solvent extraction. The (NH4)2SO4 in the solution could be recycled by concentrating the solution to precipitate the crystals.

5. Conclusions

In this study, a novel approach combining magnetizing roasting, magnetic separation, (NH4)2SO4 activation roasting, and leaching using water was developed to extract REEs and iron from Bayan Obo tailings. The following are the principal conclusions drawn from the theoretical and experimental work:
(1) The magnetizing roasting temperature of 600 °C was determined through thermodynamic analysis, agreeing well with the experimental results. The maximum recovery of Fe reached 77.8% at the temperature of 600 °C, and the grade of total Fe in the magnetic concentrate was 56.3 wt. %. Higher temperatures led to the reduction of Fe3O4, and lower temperatures tended to lower the partial pressure of CO, both of which led to the loss of Fe during the magnetic separation.
(2) An innovative approach, using water to leach REEs after (NH4)2SO4 activation roasting, was used to extract REEs from magnetic separation tailings. The main influencing factors of the leaching recovery during (NH4)2SO4 activation roasting, were investigated with the mass ratio of (NH4)2SO4 to magnetic separation tailings, roasting temperature, and roasting time. It was found that:
The melting (NH4)2SO4 and acidifying agents were decomposed slowly below 400 °C, promoting the leaching recoveries of REEs by generating large amounts of NH4RE(SO4)2·4H2O. However, after temperatures exceeding 400 °C, (NH4)2SO4 and the acidifying agents started to decompose rapidly. The generation of NH4RE(SO4)2·4H2O was cut down, due to the lack of molten (NH4)2SO4 and the acidifying agents, leading to the drop in leaching recovery.
The acidity of the leaching solution was maintained with residual (NH4)2SO4, preventing hydrolysis of RE2(SO4)3 to form precipitates. If the roasting time was too long, (NH4)2SO4 would be excessively consumed and decomposed, resulting in the loss of REEs.
The increase in mass ratio of (HN4)2SO4 to magnetic separation tailings led to excessive NH4+ and SO42− in the leaching solution. The REEs ions also tended to precipitate with extra NH4+ and SO42− in form of NH4RE(SO4)2, leading to the loss of REEs.
(3) The leaching recoveries of La, Ce, and Nd reached 83.12%, 76.64%, and 77.35%, respectively. The rest of the REEs were deposited in monazite (REPO4), which was difficult to decompose during the roasting process.

Acknowledgments

Financial support to this project is provided by the National Natural Science Foundation of China (51274061) and the National Program on Key Basic Research Project of China (2012CBA01205).

Author Contributions

Yan Zhou, He Yang, and Xiang-xin Xue conceived and designed the study; Yan Zhou and Shuai Yuan performed the experiments; Yan Zhou analyzed the data; He Yang and Xiang-xin Xue contributed reagents/materials/analysis tools; Yan Zhou wrote the paper.

Conflicts of Interest

The authors declare no conflict of interest. The founding sponsors had no role in the design of the study; in the collection, analyses, or interpretation of data; in the writing of the manuscript, and in the decision to publish the results.

References

  1. Huang, X.W.; Li, H.W.; Wang, C.F.; Wang, G.Z.; Xue, X.X.; Zhang, G.C. Development Status and Research Progress in Rare Earth Industry in China. Chin. J. Rare Metals 2007, 31, 279–288. [Google Scholar]
  2. Huang, X.W.; Zhang, Y.; Li, H.W. Development Trend and Research Progress of Rare Earth Extraction in China. Bull. Natl. Nat. Sci. Found. China 2011, 3, 134–137. [Google Scholar]
  3. Cheng, J.Z.; Che, L.P. Current Mining Situation and Potential Development of Rare Earth in China. Chin. Rare Earths 2010, 31, 65–85. [Google Scholar]
  4. Yu, X.L.; Bai, L.; Wang, Q.C.; Liu, J.; Chi, M.Y.; Wang, Z.C. Recovery of Rare Earths, Niobium, and Thorium from the Tailings of Giant Bayan Obo Ore in China. Metall. Mater. Trans. B 2012, 43, 485–493. [Google Scholar] [CrossRef]
  5. Ding, Y.G.; Xue, Q.G.; Wang, G.; Wang, J.S. Recovery Behavior of Rare Earth from Bayan Obo Complex Iron Ore. Metall. Mater. Trans. B 2013, 44, 28–36. [Google Scholar] [CrossRef]
  6. Wang, L.; Zhong, B.; Liang, T.; Xing, B.; Zhu, Y. Atmospheric thorium pollution and inhalation exposure in the largest rare earth mining and smelting area in China. Sci. Total Environ. 2016, 572, 1–8. [Google Scholar] [CrossRef] [PubMed]
  7. Wang, L.; Liang, T. Accumulation and fractionation of rare earth elements in atmospheric particulates around a mine tailing in Baotou, China. Atmos. Environ. 2014, 88, 23–29. [Google Scholar] [CrossRef]
  8. Xu, G.X. Rare Earths, 2nd ed.; Metallurgical Industry Press: Beijing, China, 2012; Volume 1, pp. 364–468. [Google Scholar]
  9. Gupta, C.K.; Krishnamurthy, N. Extractive Metallurgy of Rare Earths; CRC Press: Boca Raton, FL, USA, 2005; pp. 28–56 and 133–158. [Google Scholar]
  10. Liu, X.W.; Feng, Y.L.; Li, H.R.; Yang, Z.C.; Cai, Z.L. Recovery of valuable metals from a low-grade nickel ore using an ammonium sulfate roasting-leaching process. Int. J. Miner. Metall. Mater. 2012, 19, 377–383. [Google Scholar] [CrossRef]
  11. Saleh, H.I.; Hassan, K.M. Extraction of zinc from blast-furnace dust using ammonium sulfate. J. Chem. Technol. Biotechnol. 2004, 79, 397–402. [Google Scholar] [CrossRef]
  12. Yang, H.; Rong, Y.; Han, C.; Tang, R.; Xue, X.X.; Li, Y.; Li, Y.N. Magnetizing roast and magnetic separation of iron in rare-earth tailings. J. Cent. South Univ. 2016, 23, 1899–1905. [Google Scholar] [CrossRef]
  13. Singh Mudher, K.D.; Keskar, M.; Venugopal, V. Solid state reactions of CeO2, ThO2 and PuO2 with ammonium sulphate. J. Nucl. Mater. 1999, 265, 146–153. [Google Scholar] [CrossRef]
  14. Yu, Y.F.; Qi, C.Y. Magnetizing roasting mechanism and effective ore dressing process for oolitic hematite ore. J. Wuhan Univ. Technol. Mater. Sci. Edit. 2011, 26, 176–181. [Google Scholar] [CrossRef]
  15. Bale, C.W.; Chartrand, P.; Degterov, S.A.; Eriksson, G.; Hack, K.; Ben Mahfoud, R.; Melançon, J.; Pelton, A.D.; Petersen, S. FactSage thermochemical software and databases. Calphad 2002, 26, 189–228. [Google Scholar] [CrossRef]
  16. Kiyoura, R.; Urano, K. Mechanism, Kinetics, and Equilibrium of Thermal Decomposition of Ammonium Sulfate. Ind. Eng. Chem. Proc. Des. Dev. 1970, 9, 489–494. [Google Scholar] [CrossRef]
  17. Jariwala, M.; Crawford, J.; LeCaptain, D.J. In Situ Raman Spectroscopic Analysis of the Regeneration of Ammonium Hydrogen Sulfate from Ammonium Sulfate. Ind. Eng. Chem. Res. 2007, 46, 4900–4905. [Google Scholar] [CrossRef]
  18. Kosova, D.A.; Emelina, A.L.; Bykov, M.A. Phase transitions of some sulfur-containing ammonium salts. Thermochim. Acta 2014, 595, 61–66. [Google Scholar] [CrossRef]
  19. Zhang, S.R.; Li, H.W.; Ma, X.F. Study on Decomposition of High Grade Bastnasite in Calcination. J. Guangdong Non-Ferrous Metals 1997, 7, 113–116. [Google Scholar]
  20. Liu, K.W.; Chen, T.L. Studies on the thermal decomposition of ammonium sulfate. Chem. Res. Appl. 2002, 14, 737–738 and 765. [Google Scholar]
  21. Fan, Y.Z.; Cao, F.H. Thermal Decomposition Kinetics of Ammonium Sulfate. J. Chem. Eng. Chin. Univ. 2011, 25, 341–346. [Google Scholar]
Figure 1. Relationship between temperature and Gibbs free energy of formation of oxides.
Metals 07 00195 g001
Figure 2. Equilibrium diagram of the reduction of iron oxides by CO.
Metals 07 00195 g002
Figure 3. Predominance area diagram of Fe–C–O system at 600 °C (873 K).
Metals 07 00195 g003
Figure 4. The process flow of the experiments.
Metals 07 00195 g004
Figure 5. X-ray diffraction (XRD) patterns of Bayan Obo tailings.
Metals 07 00195 g005
Figure 6. Scanning electron microscopy (SEM) images of the mineralogical phases in Bayan Obo tailings (a and b): (A) Monazite; (B) Fluorite; (C) Hematite; (D) Bastnaesite; (E) Dolomite.
Metals 07 00195 g006
Figure 7. Energy dispersive X-ray spectroscopy (EDS) results for the mineralogical phases in Bayan Obo tailings: (a) Monazite; (b) Fluorite; (c) Hematite; (d) Bastnaesite; (e) Dolomite.
Metals 07 00195 g007
Figure 8. XRD patterns of product after magnetizing roasting at 600 °C.
Metals 07 00195 g008
Figure 9. SEM images of mineralogical phases in Bayan Obo tailings after magnetizing roasting at 600 °C (a and b): (F) roasted bastnaesite; (G) Fe3O4.
Metals 07 00195 g009
Figure 10. EDS results from Bayan Obo tailings after magnetizing roasting at 600 °C: (a) roasted bastnaesite; (b) Fe3O4.
Metals 07 00195 g010
Figure 11. Grade and recovery of total Fe and (REE)O in the magnetic separation concentrate and tailings.
Metals 07 00195 g011
Figure 12. The thermogravimetry–differential scanning calorimetry (TG-DSC) curve of (NH4)2SO4.
Metals 07 00195 g012
Figure 13. The TG-DSC curve of the mixture of magnetic separation tailings and (NH4)2SO4 in mass ratio of 4:1.
Metals 07 00195 g013
Figure 14. XRD patterns of (NH4)2SO4 activation roasting products at different temperatures: (a) 300 °C; (b) 350 °C; (c) 400 °C; (d) 450 °C; (e) 500 °C.
Metals 07 00195 g014
Figure 15. SEM image and EDS spectra of the (NH4)2SO4 activation roasting products: (a) 400 °C; (b,c) 500 °C.
Metals 07 00195 g015aMetals 07 00195 g015b
Figure 16. Effect of (NH4)2SO4 activation roasting temperature on the leaching recoveries of La, Ce, and Nd.
Metals 07 00195 g016
Figure 17. Effect of (NH4)2SO4 activation roasting time on the leaching recoveries of La, Ce, and Nd.
Metals 07 00195 g017
Figure 18. Effect of the mass ratio on the leaching recoveries of La, Ce, and Nd.
Metals 07 00195 g018
Figure 19. XRD patterns of the leaching residues.
Metals 07 00195 g019
Figure 20. SEM image of the leaching residues (a and b): (N) BaSO4; (O) REPO4; (P) SiO2; (Q) CaSO4.
Metals 07 00195 g020
Figure 21. EDS spectra of the leaching residues: (a) BaSO4; (b) REPO4; (c) SiO2; (d) CaSO4.
Metals 07 00195 g021
Figure 22. XRD pattern of the crystal precipitation.
Metals 07 00195 g022
Table 1. Chemical composition of the sample of Bayan Obo tailings (wt. %).
FetotalFeOREONb2O5CaOSiO2BaOMgO
13.062.107.090.10330.3411.714.133.32
Al2O3MnOTiO2FSPNa2OK2O
1.391.150.6412.501.661.391.030.52
Table 2. Particle size distribution of the sample of Bayan Obo tailings (wt. %).
>149 μm74–149 μm58–74 μm38–58 μm<38 μm
9.2925.0530.7132.102.85
Table 3. Chemical composition of the industrial pulverized coal (wt. %).
CVolatileAshSiO2Al2O3PS
83.666.629.334.811.47<0.10.2
Table 4. Energy dispersive X-ray spectroscopy (EDS) results of the mineralogical phases in Bayan Obo tailings (wt. %).
Analysis PointCOFMgSiPCaFeLaCePrNd
A-27.61---13.421.12-16.8430.043.267.70
B--51.09---48.91-----
C-29.75-----70.25----
D9.1625.028.391.212.77-1.012.338.8028.902.829.58
E53.49--11.30--28.197.02----
Table 5. EDS results from Bayan Obo tailings after magnetizing roasting at 600 °C. (wt. %).
Analysis PointOFFeLaCePrNd
F8.9111.88-31.8037.421.688.31
G26.45-73.55----
Table 6. Thermal decomposition reaction of (NH4)2SO4.
StepTemperatureReaction
1200–386 C(NH4)2SO4 → NH4HSO4 + NH3(14)
2(NH4)2SO4 → (NH4)3H(SO4)2 + NH3(15)
2386–447 CNH4HSO4 → NH2SO3H + H2O↑(16)
NH4HSO4 + NH2SO3H → (NH4)2S2O7(17)
2NH4HSO4 → (NH4)2S2O7 + H2O↑(18)
3447–500 C3(NH4)2S2O7 → 2NH3↑ + 2N2↑ + 6SO2↑ + 9H2O↑(19)
Table 7. Chemical composition of the leaching residues (wt. %).
FeREOCaO SO 4 2 CaF2SiO2BaOPMgOAl2O3
1.103.744.6013.8629.0915.626.271.030.680.57

