Article

Experimental Investigation of Thermal Fatigue Die Casting Dies by Using Response Surface Modelling

by
Hassan Abdulrssoul Abdulhadi
1,3,*,
Syarifah Nur Aqida Syed Ahmad
1,
Izwan Ismail
2,
Mahadzir Ishak
1 and
Ghusoon Ridha Mohammed
1,3
1
Faculty of Mechanical Engineering, University Malaysia Pahang, Pekan 26600, Malaysia
2
Faculty of Manufacturing Engineering, University Malaysia Pahang, Pekan 26600, Malaysia
3
Baghdad-Institute, Foundation of Technical Education, Baghdad 10074, Iraq
*
Author to whom correspondence should be addressed.
Metals 2017, 7(6), 191; https://doi.org/10.3390/met7060191
Submission received: 7 March 2017 / Revised: 24 April 2017 / Accepted: 25 April 2017 / Published: 26 May 2017
(This article belongs to the Special Issue Fatigue Damage)

Abstract

:
Mechanical and thermal sequences impact largely on thermo-mechanical fatigue of dies in a die casting operations. Innovative techniques to optimize the thermo-mechanical conditions of samples are major focus of researchers. This study investigates the typical thermal fatigue in die steel. Die surface initiation and crack propagation were stimulated by thermal and hardness gradients, acting on the contact surface layer. A design of experiments (DOE) was developed to analyze the effect of as-machined surface roughness and die casting parameters on thermal fatigue properties. The experimental data were assessed on a thermo-mechanical fatigue life assessment model, being assisted by response surface methodology (RSM). The eminent valuation was grounded on the crack length, hardness properties and surface roughness due to thermal fatigue. The results were analyzed using analysis of variance method. Parameter optimization was conducted using response surface methodology (RSM). Based on the model, the optimal results of 26.5 μm crack length, 3.114 μm surface roughness, and 306 HV0.5 hardness properties were produced.

1. Introduction

Reducing process lead time and design time are important aspect to reduce total cost of die casting process. Minimizing the trial-and-error stage of the production can further assist in reducing the cost. The shape of the cavity and die geometry is directly related to soldering tendency of a die casting. The more complicated geometry a die has, the more likely soldering can occur. The dies of complicated geometry usually procure sharp angles, core pins, nooks, and the part that acts as hot spots. These hot spots can induce soldering, due to their higher temperatures than other areas [1]. Moreover, prolonging die service life and preventing catastrophic die failures is essential because the die cost contributes considerably to the overall process cost. Die-casting dies are subjected to high mechanical and thermal loads, which can cause appalling or delayed die failure due to mount up damages. Most failures developed gradually and can be predicted. However, ongoing failures after few cycles can root for a larger economical losses due to wrecked tools, expensive down times, and disordered delivery schedules [2].
Thermal fatigue is one of the most common complications encountered in a die casting process. It is a result of the cyclic, rapid, non-uniform heating and cooling of dies. Thermal fatigue gets amplified by mechanical loadings and other damage mechanisms, such as erosion and corrosion. Thermal fatigue is one of the major foundations of poor-quality castings and die failures. The initial phase of the thermal fatigue initiates with the formation of micro-crack networks denoted as heat checking. Heat checking results in the deterioration of die cavity surfaces. Further damage is due to heat checking leads to clasping, defective castings, and subsequently die damage and failure [3,4,5,6,7,8]. When an unconstrained object is slowly and uniformly heated or cooled, it will expand or contract proportionally to its coefficient of thermal expansion, and a temperature change will occur in relation to the mentioned temperature. However, if the body is constrained during the heating and cooling process, it will develop stresses and strains because it cannot reach its unconstrained dimensions properly. Similarly, if a body does not load and release through the same stress–strain path, repeated or cyclic heating and cooling might outcome in the build-up of inelastic deformation. If the time-varying stress within the body is tensile, accumulation may lead to a thermal fatigue. Even an unconstrained body may develop large thermal stresses if exposed to non-uniform or rapid heating and cooling.
Objects with sudden geometric and compositional variations retain internal constraints which are caused by temperature distribution. In a case of rapid surface temperature changes in a solid body, the temperature of a nearby surface layer increases and decreases promptly, whereas the rest of the body cannot react fast enough to the alterations in temperature. Different expansions and contractions within the body provide internal constraints, and various layers expand and contract at different degrees. Each region gets constrained by its neighbouring region, which results in a stress-strain field within the body [7,8,9]. Thermally induced stresses are not the only factors involved in the thermal fatigue phenomenon. Die material properties at elevated temperatures, mechanical loads from filling and locking, residual stresses, and cavity surface conditions also affect a material’s response to heat checking and a thermal fatigue. Tempering, decarburization, and phase or structure changes due to an exposure to elevated temperatures accelerate thermal fatigue.
To predict and avoid die failures and their consequences, thermal management of dies, the interactions between thermal and stress/strain fields, material properties, and the influence of all these factors on die service life must be understood. By investigating the effects of these factors on die life during the design stage of dies and the casting process, prolonged die service life can be succeeded. A reliable die service life prediction allows for accurate estimates of actual die and production cost, reduces undesired machine down times, and helps to achieve good production management during production processes [2,9,10,11]. Furthermore, thermo-mechanical fatigue (TMF) experiments on die casting require costly equipment, time consuming, and often conducted through thermal testing under the same operating conditions as that for die-casting dies; however, in fact, the temperature and number of cycles are fixed and kept constant [9,10,11,12]. The damage on the die obtained by TMF experiments is less than that obtained in isothermal fatigue (IF) experiments [13]. The purpose of this study is to fit a model of the die life by using an experimental data. Experimental procedures were designed to mimic the commercial die casting process. The thermal fatigue process was conducted in a cyclic manner with constant sample temperature during the test [14,15,16]. Analysis of dies was performed by associating several of the previously mentioned factors that influence the temperature profile and the thermal gradients with the structural state, within the tool. The step was implemented by employing the temperature profiles obtained through a previous 1D thermal analysis and imposing them on the die cavity/casting interface via 2D thermal finite element models (FEMs), respectively. Thermal finite element analysis was conducted using ABAQUS software (Version 6.13.1, ABAQUS, Johnston, RI, USA, 2013), and this analysis was followed by a sequentially coupled structural analysis. The cooling effects of the lubricants were studied through experimental and numerical investigations. The effects of initial die cavity surface temperature and spray fluid density (spray volume per-unit surface area per-unit time as defined by Lee), have been a focus of several previous researchers [3,4,5,6,17,18,19,20].
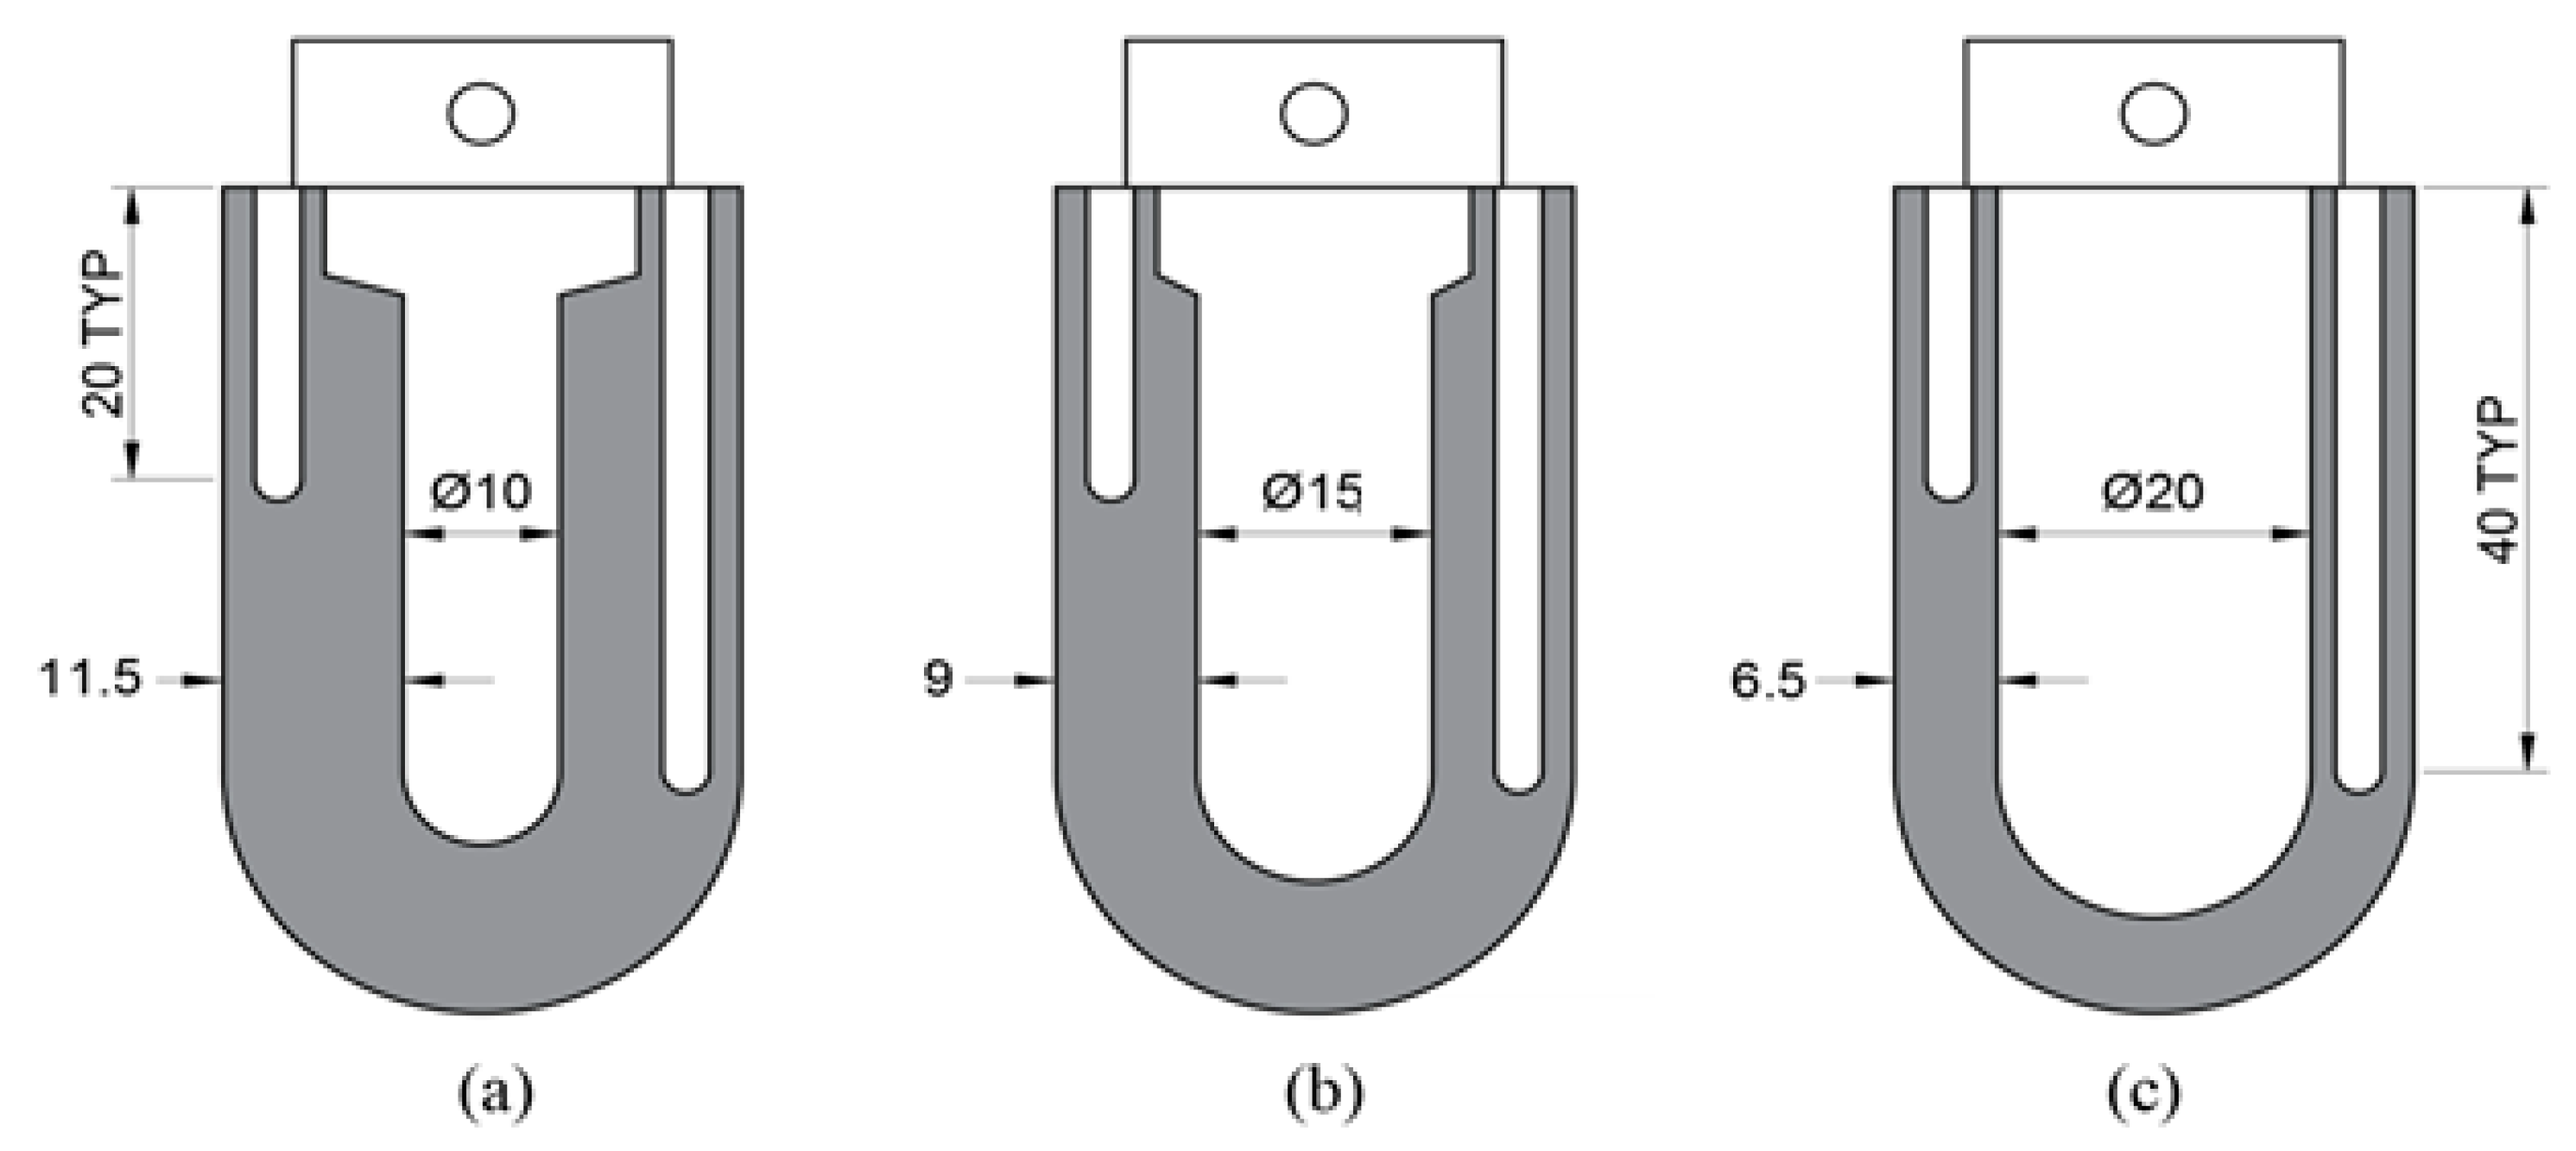
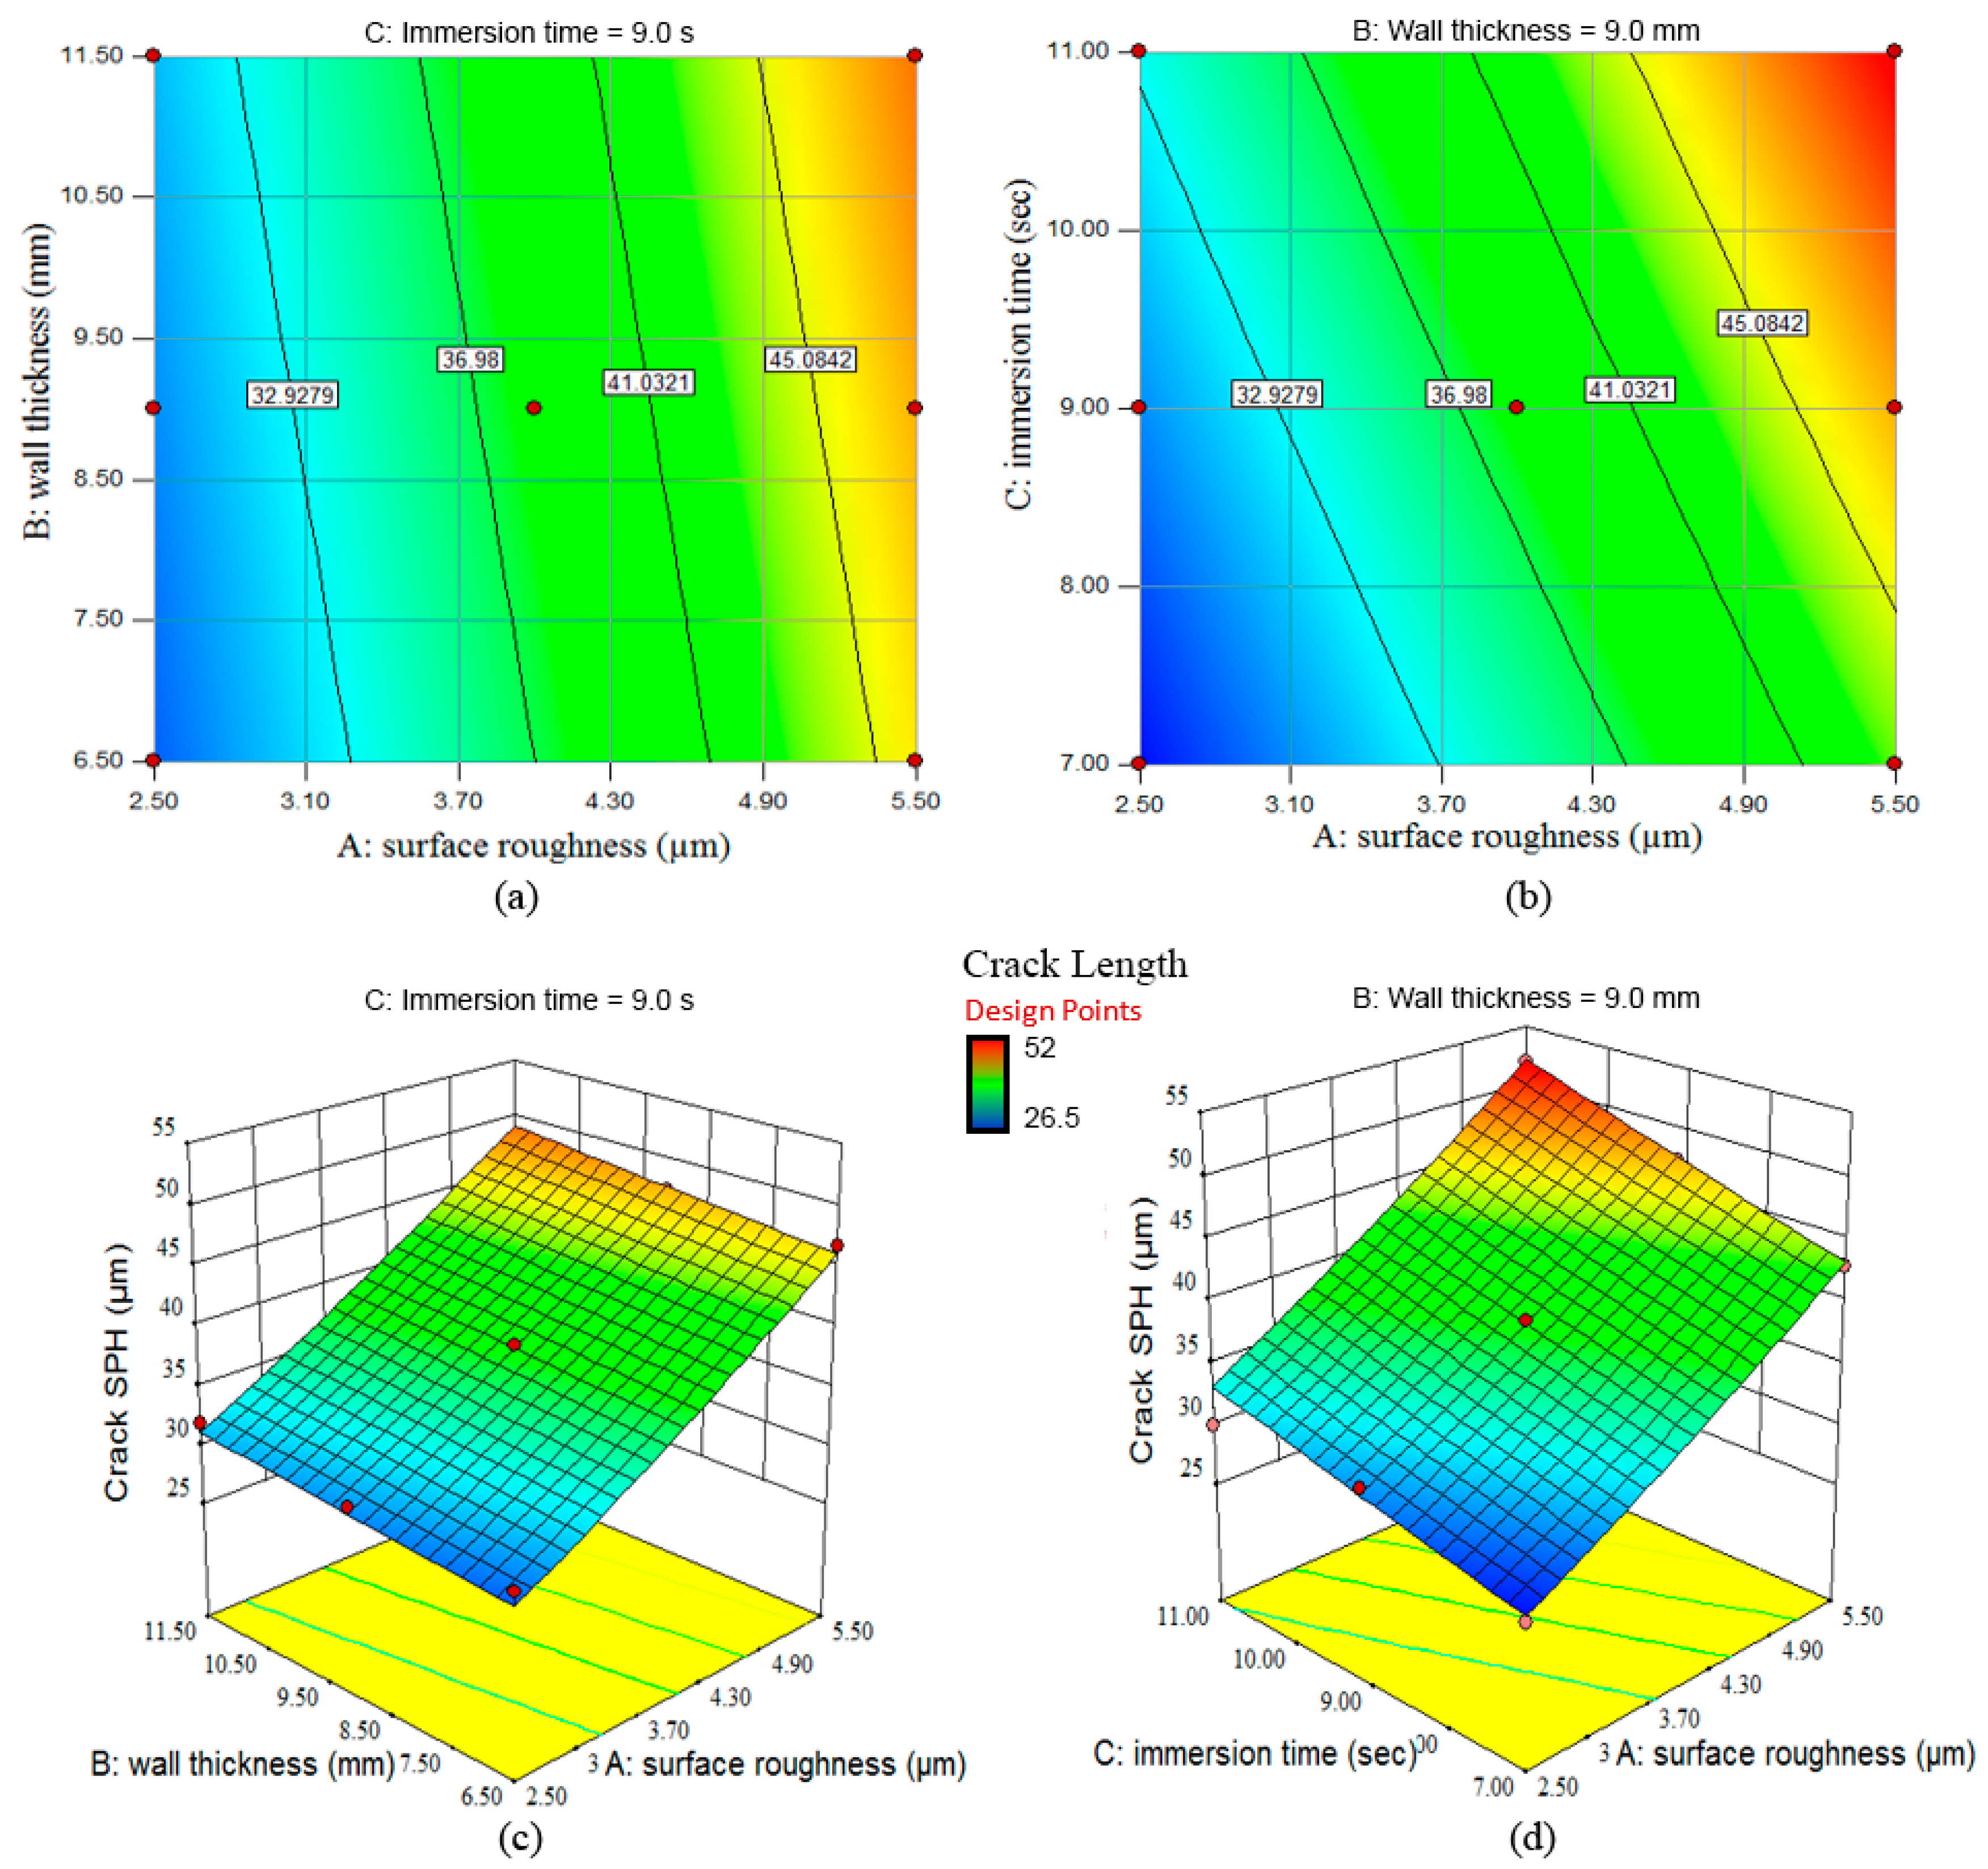
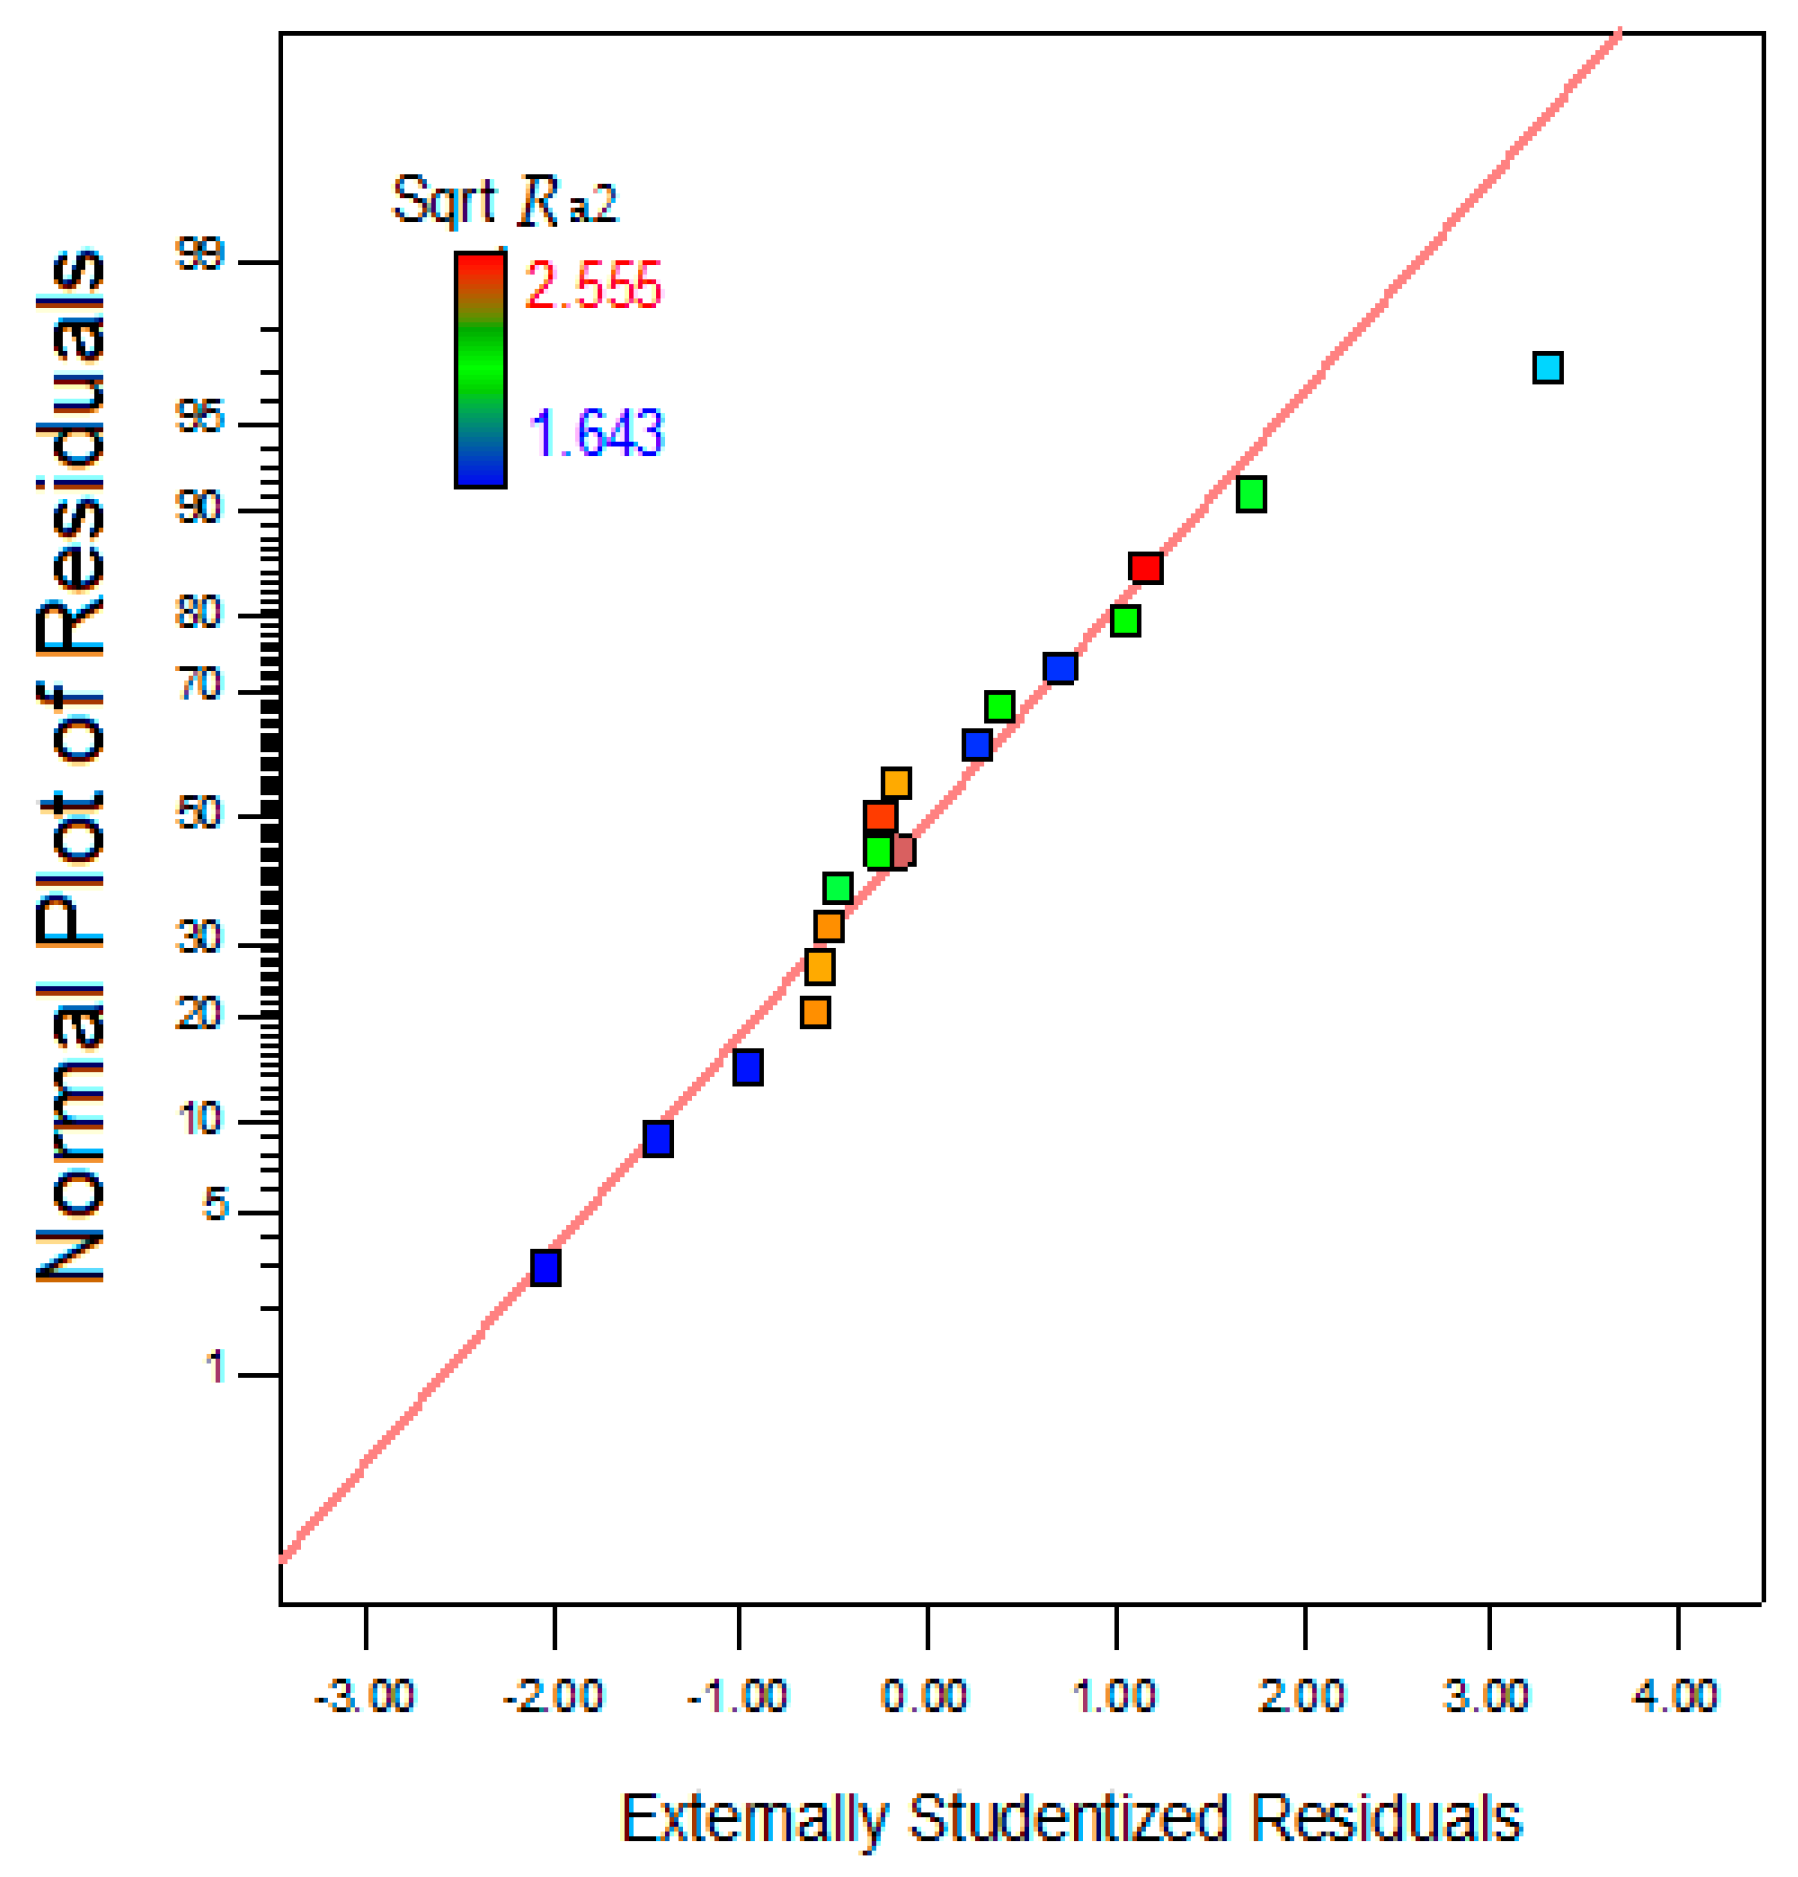
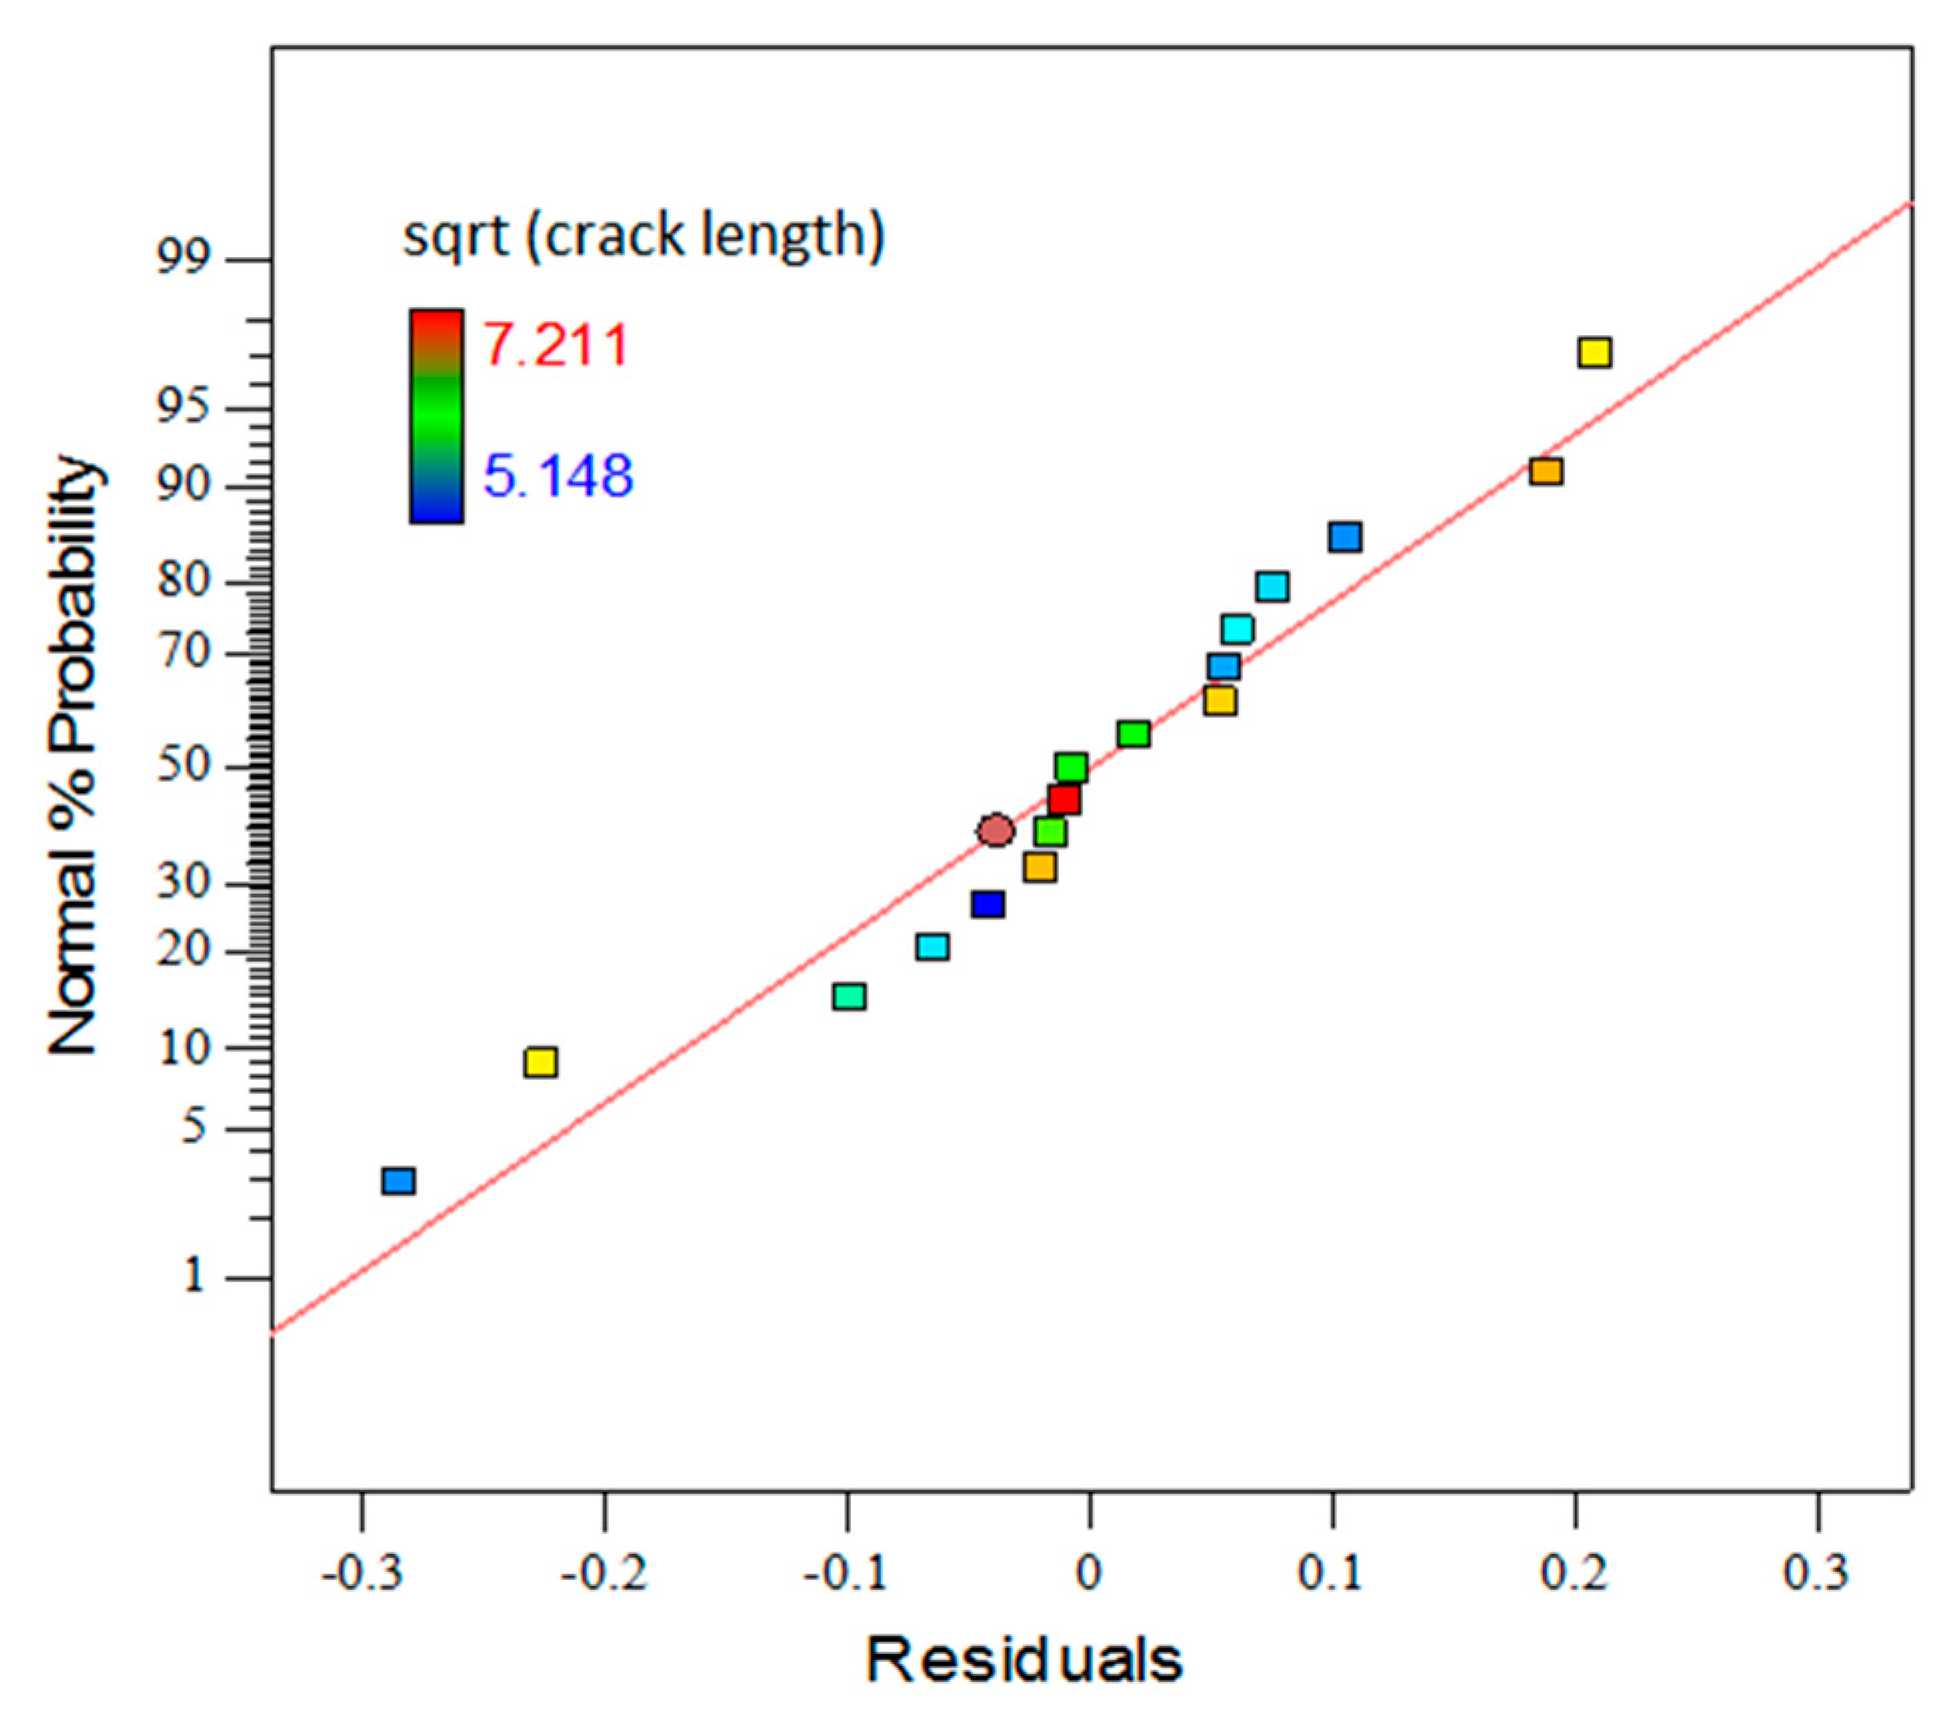
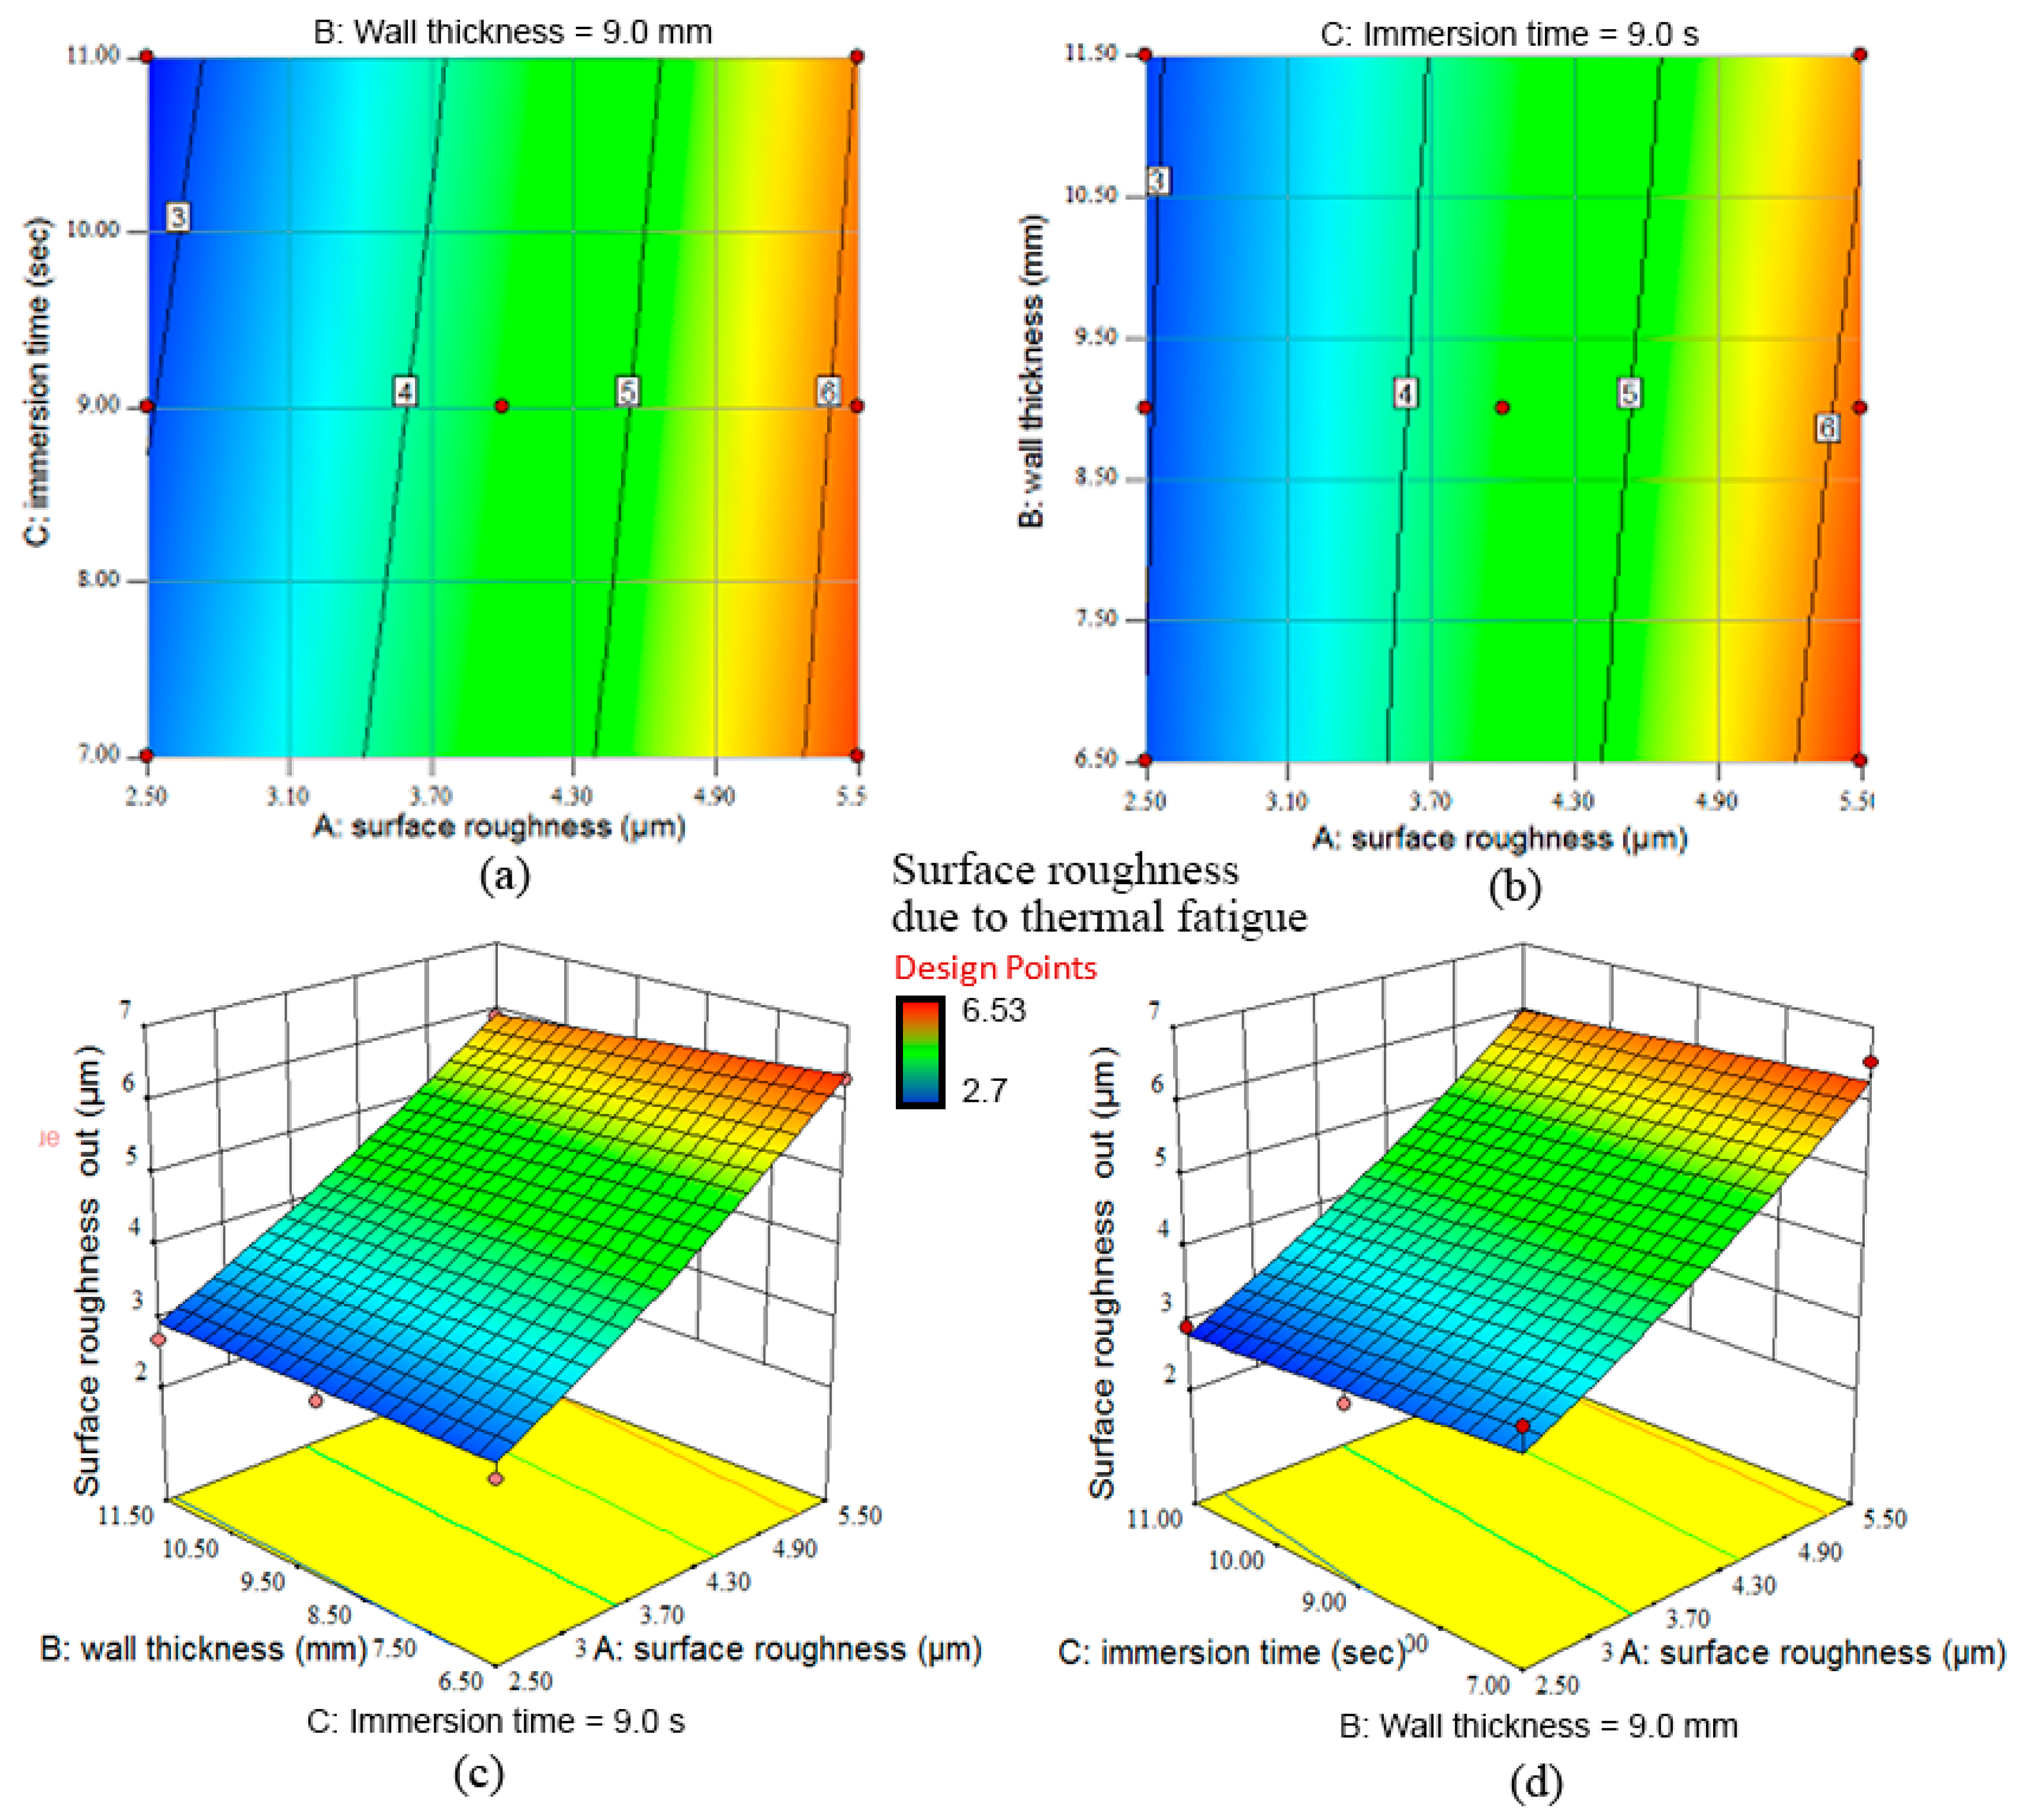
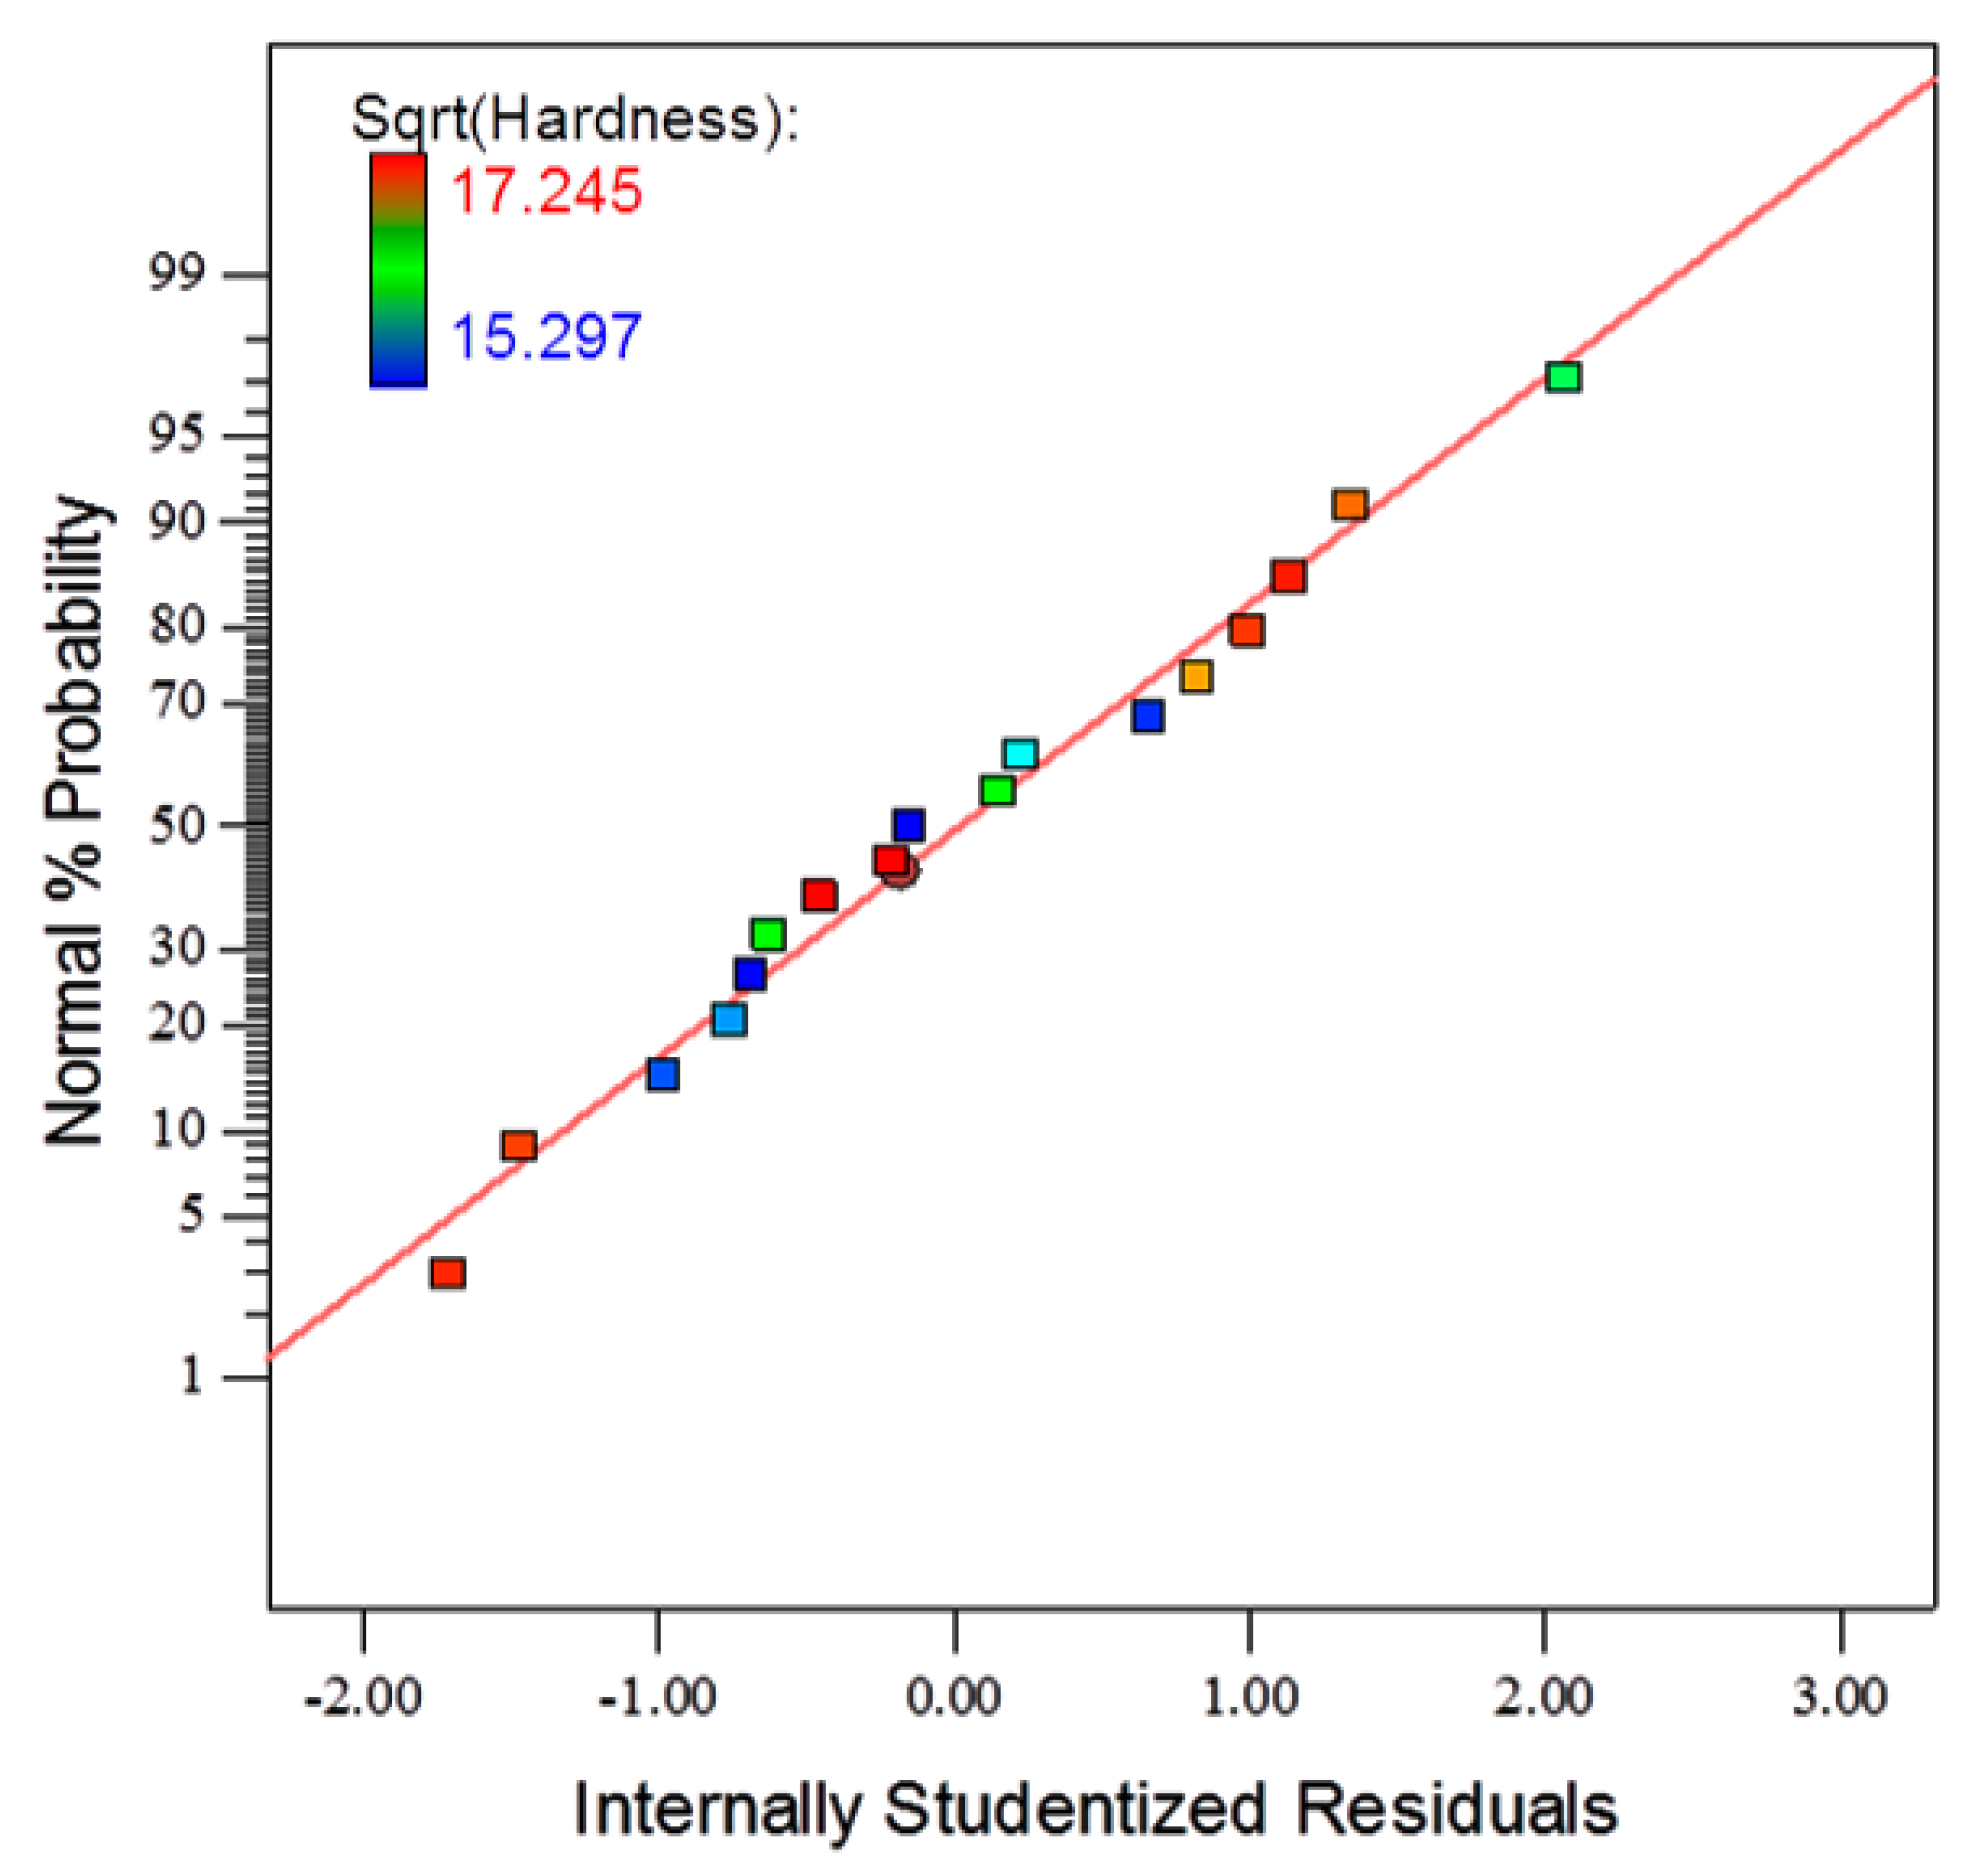
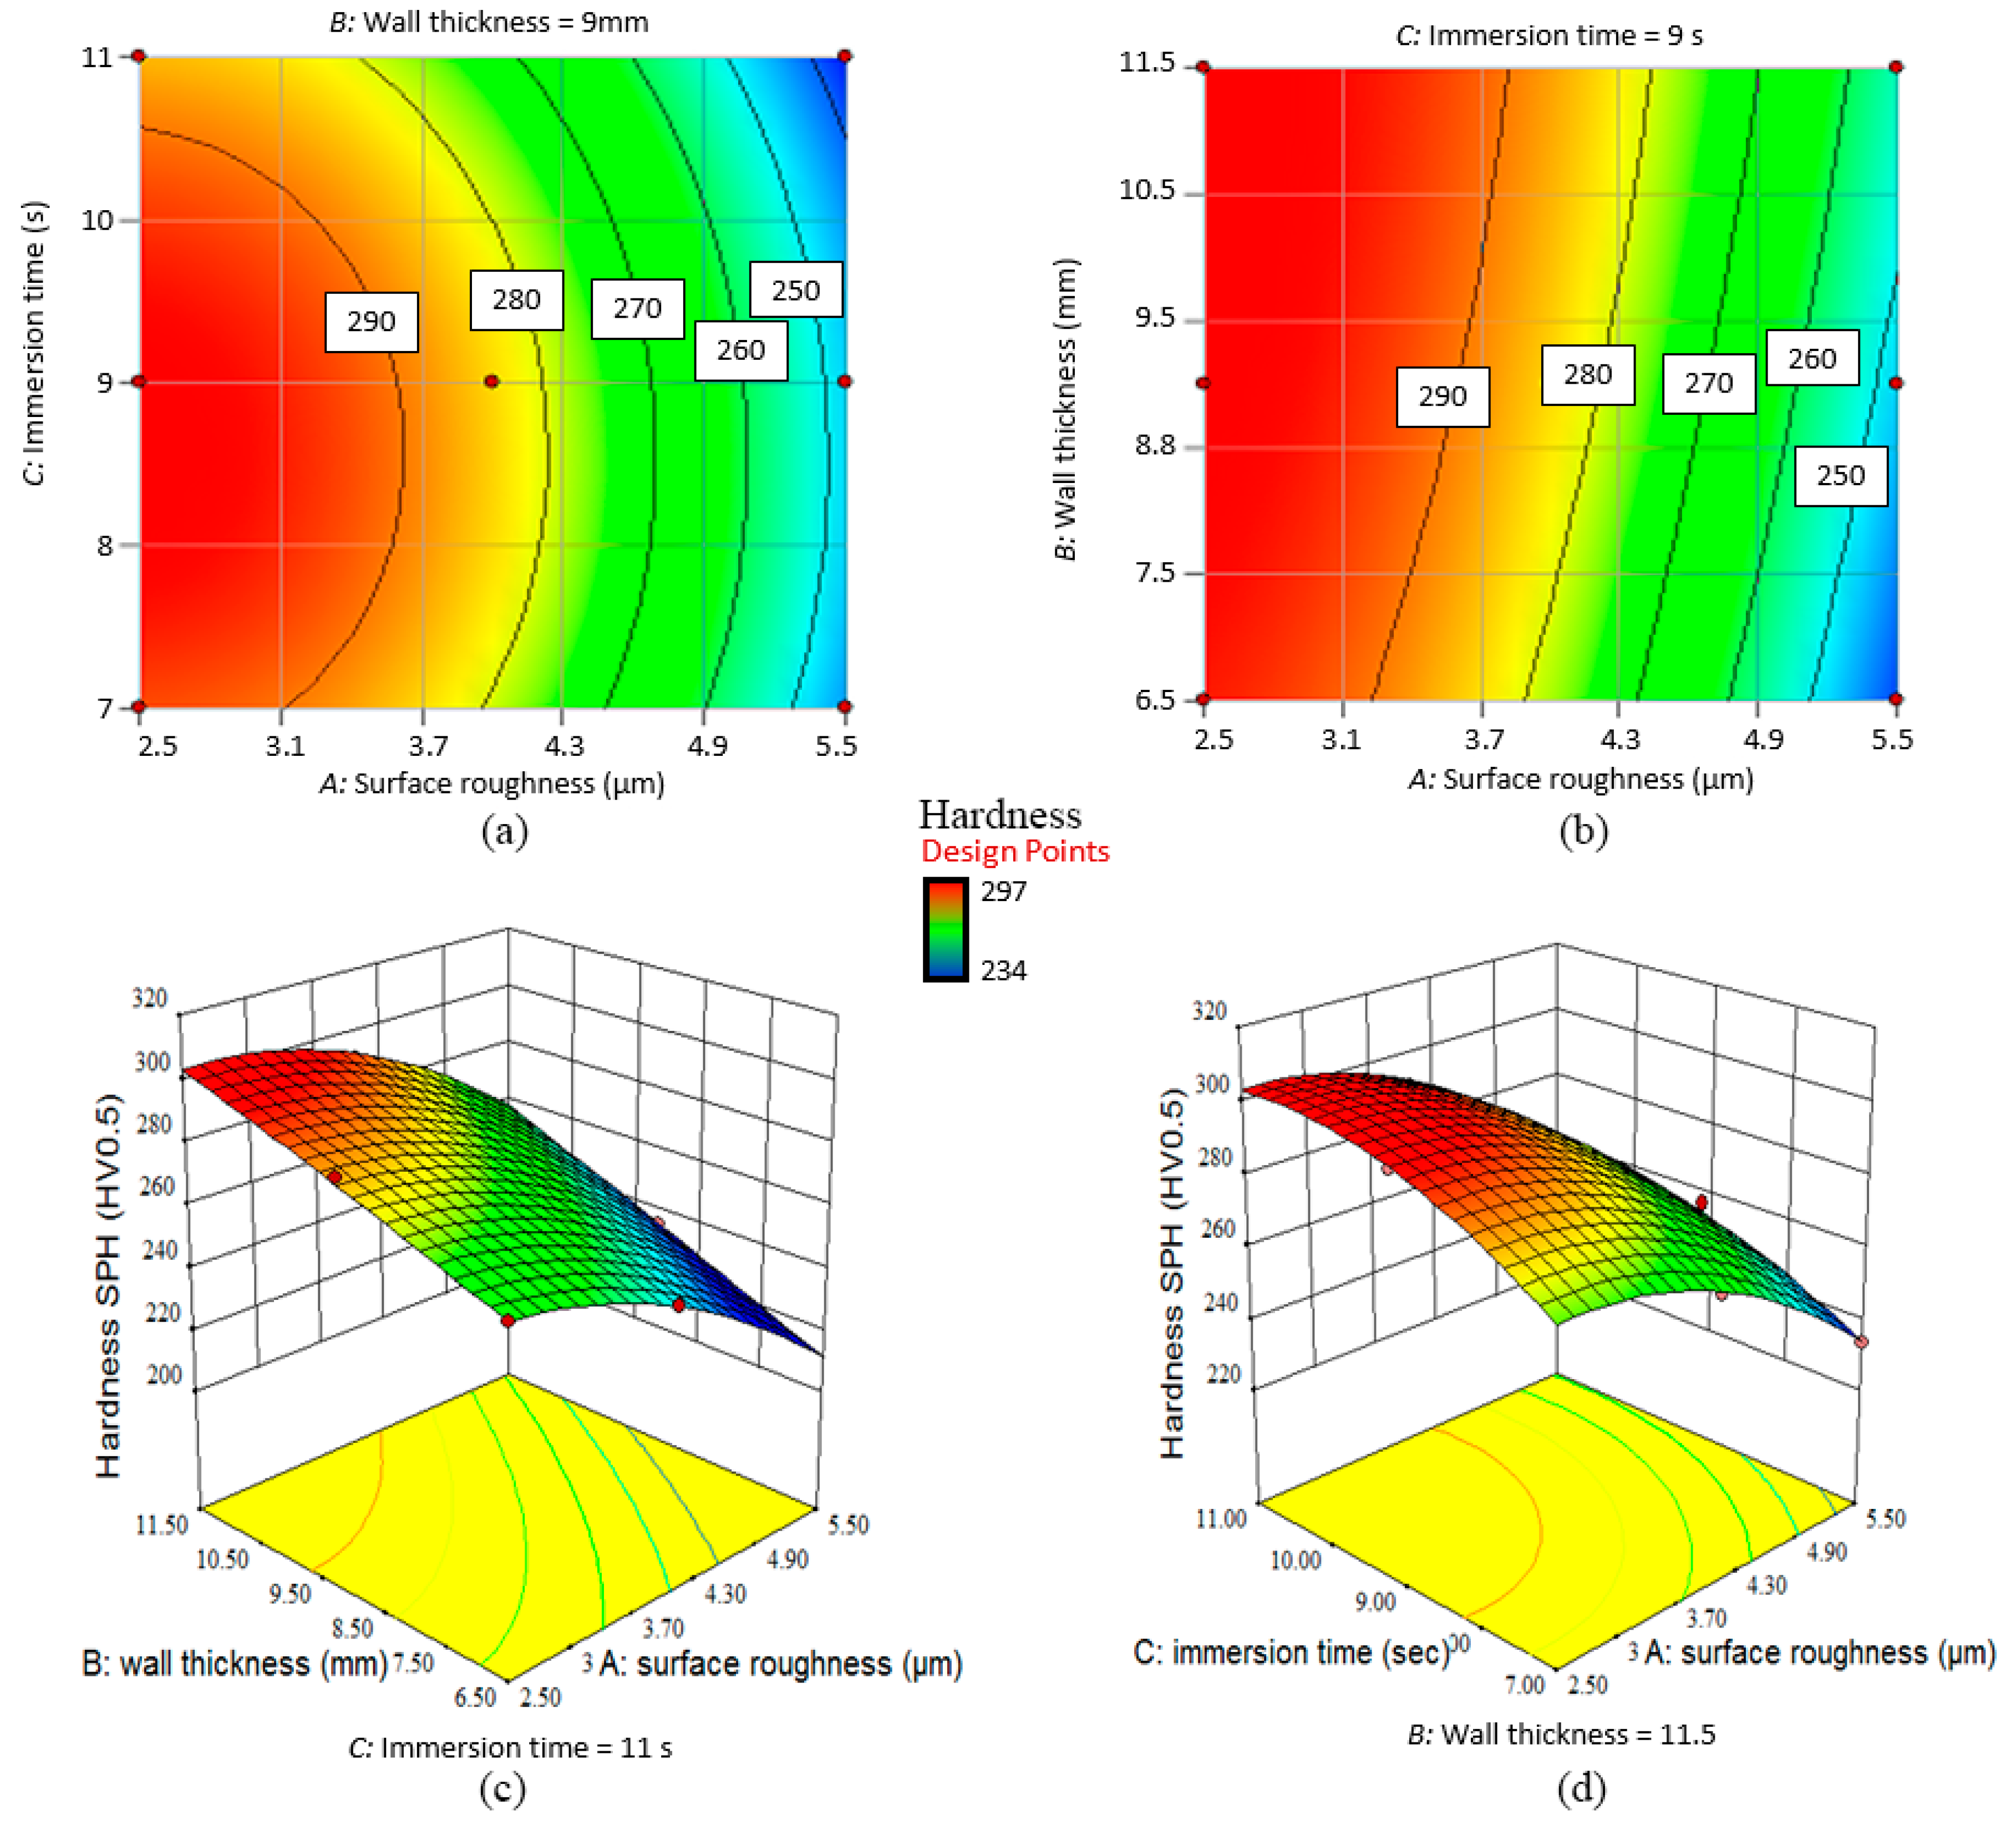
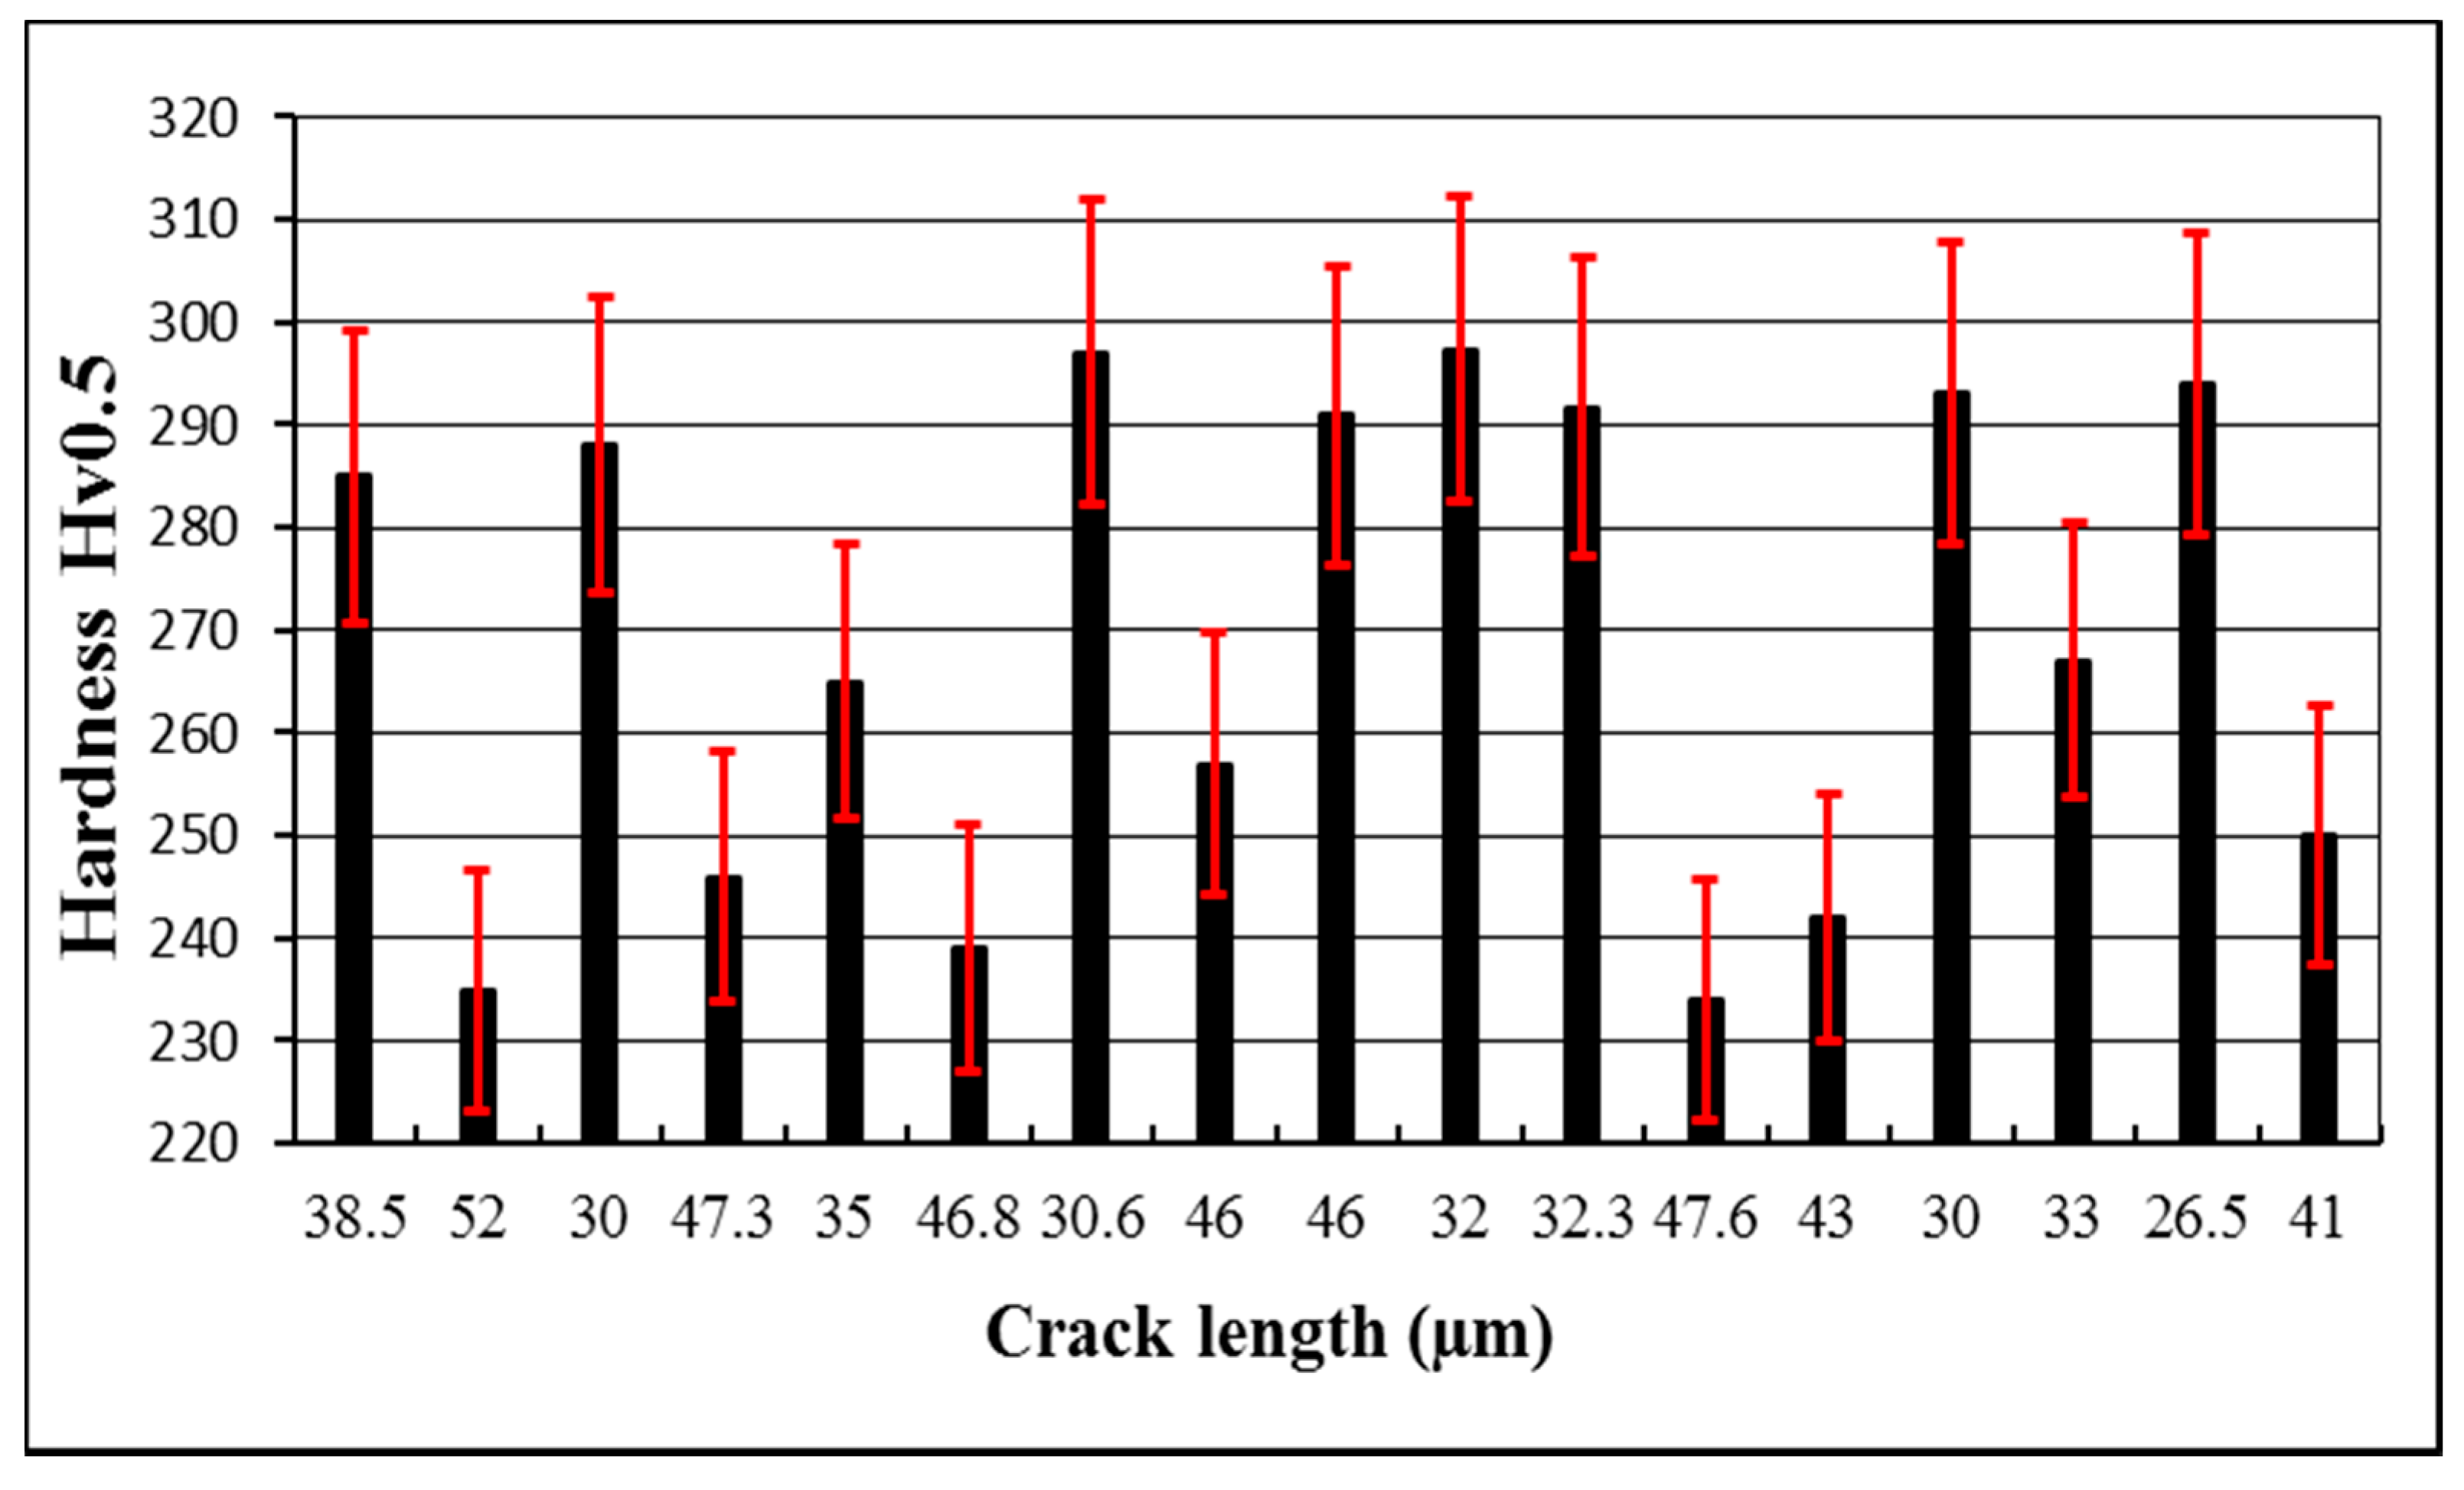
In this study the effects on service life were investigated through response surface methodology (RSM), employing a three-factor Box-Behnken design. The thermal fatigue cycle parameters were evaluated with three levels for each factor. An experimental investigation was conducted to quantify the relationship between the input factors (as-machined surface roughness, Ra1, wall thickness, and immersion time) and responses (crack length, surface roughness due to thermal fatigue, Ra2, and hardness properties). Moreover, by combining existing and new data on heat transfer in die-casting dies and die material properties with RSM modelling, a method for predicting the onset of heat checking in H13 steel dies has been proposed.

2. Experimental Procedures

2.1. Materials

The samples in this study were made from H13 tool steel .In the fatigue testing, the sample was dipped into molten A356 aluminium alloy was used in the study. Chemical configuration for both H13 tool steel and A356 aluminium alloy are shown in Table 1 and Table 2 respectively. The geometry of the samples is shown in Figure 1 with different sample wall thicknesses to analyze thermal gradient, determine efficient cooling in the central part and thermal fatigue cracks and varied surface roughness due to thermal fatigue.

2.2. Experimental Apparatus and Work Procedure

A simulative laboratory experiment was conducted to generate controlled thermo-mechanical fatigue failures. Thermal wear set-up simulates an aluminium alloy die-casting conditions with testing cycle time of 24 s, 28 s and 32 s. The samples were dipped into molten aluminium at 700 °C and quenched in water at 32 °C for 7 s, 9 s and 11 s to generate thermal gradients during cooling process. In between the heating and water quenching, the samples were air-cooled at 28 °C for 5 s before repeating the next cycle. Thermal fatigue loading was achieved by 1850 cyclic movements. The inner wall of the samples was cooled by spraying water at room temperature for 3 s.
Samples surfaces were examined through optical microscope (MT8000 Series Metallurgical Microscopes, Microscope.com, Roanoke, VA, USA) and scanning electron microscope (SEM) (HITACHI Tabletop Microscope TM3030Plus, Hitachi High Technologies America, Inc., Schaumburg, IL, USA). For each immersion experiment scheme cycle, a characteristic testing sample from the final treated sample (when the sample was clamped on the equipment), was obtained. The transverse parts of the cycled samples were investigated for the exclusive evaluation of the detrimental penetration depth, microhardness, and microstructural amendments by using (SEM) and Vickers hardness tester (Instran ITW Test & Measurement Co., Ltd., Shanghai, China), respectively. The sample surface profile was measured with a two-dimensional surface profilometer MarSurf PS1 (Mahr, Göttingen, Germany). Surface roughness were measured using MAHR parameter MarSurf PS1 (Mahr, Göttingen, Germany), before and after the process. Thermally worn samples were investigated for crack analysis, metallographic study, and hardness properties. Metallographic study and crack analysis were performed along a longitudinal cross-section through SEM and Energy-dispersive X-ray spectroscopy (EDXS) analysis. The crack length on the sample surface was measured with ImageJ software (Version 2, National Institutes of Health, Bethesda, MD, USA, 2008); an image processing software available online [21]. The crack tips were then marked manually. The hardness properties were measured across the sample thickness with Vickers indenter.

2.3. Factors and Response Surface Modeling

Among the factors that may affect the response, several were selected to be kept constant during the experiment. The selected factors included are material, cooling fluid, and the sample heat treatment. In addition, several important factors related to thermal fatigue were considered. These factors included as-machined surface roughness, sample wall thickness, and immersion time cycle, which is a parameter that depends on the amount of cracks and hardness induced in the material (Table 3). The maximum crack length, gradient hardness, and roughness after the thermal fatigue test were observed as responses in the model. Thermal-mechanical and temperature cycles are phase variations, which means that the minimum load coincides with the minimum temperature, and the maximum tensile load is applied with the maximum temperature [22,23]. The investigated material was the tool steel used in the thermal fatigue wear test (H13 tool steel).
The experimental plan and results for the crack length (CLs) of samples, surface roughness due to thermal fatigue (Ra2) and hardness properties obtained from the experimentation are presented in Table 4.

3. Results and Discussion

3.1. Effect of Surface Roughness, Wall Thickness and Immersion Time on Crack Spherical Shape (SPH)

The second-order polynomial model was used to approximate the relationship between the three factors and response crack with Equation (1) suitably. The model showed that crack increased with an increase in the immersion time and decreased with an increase in the wall thickness. Another observation indicated that these factors (as-machined surface roughness, wall thickness, and immersion time) were “significant” to crack, respectively [11]. Table 5 shows the analysis of variance indicating that the model is adequate because the p-value of the square is much more than linear.
C L s = + 2.3622 + 0.41111 × A + 0.086558 B + 0.17442 C + 7.7737 × 10 4 A B + 6.1881 × 10 3 A C 5.1788 × 10 3 B C ,
where C L s is crack length, A is as-machined surface roughness, B is wall thickness, and C is immersion time.
Crack SPH was obtained experimentally, and other values were predicted, in which the estimated regression coefficient for the second order predicted the crack and analysis of variance, as shown in Table 6. The small p-values for the linear term showed that their contribution was significant in the model. Moreover, the main effects were individually significant at the 0.05 significance level. Crack SPH was significant to the response model at α = 0.05. From the value of R1 (96.17%), the fit of data can be measured from the estimated model.
Figure 2 shows that the residuals follow a straight line, and the errors appear to be normally distributed. In such case, many parameters were carefully estimated to justify the test. Figure 3 shows that the response surface model determined above is relevant to the crack surface. The factors that are not on the plot are at their average level. The plots exhibited a square according to the surface 2FI model, and immersion time and Ra1 contribute equally to reducing crack. Meanwhile, reduced crack length extends the lifetime of dies, but this factor cannot compensate for the reverse effect due to an increase in the other factors; wall thickness and Ra1.

3.2. Effect of As-Machined Surface Roughness, Wall Thickness and Immersion Time on R a 2

To describe the effective factors, a second-order equation was established under the conditions of surface roughness due to thermal fatigue, Ra2, is expressed as follows:
R a 2 = 1.191 + 0.249 A + 0.027 B 4.274 × 10 3 A B + 4.564 × 10 3 A C 2.291 × 10 3 B C ,
where R a 2 is the surface roughness due to thermal fatigue.
Table 7 indicates that the model is adequate because the p-value of the square is much more than linear. To assess the validity of the model (Equation (2)), a probability plot (Figure 6) was used to compare the measured and predicted y2. The Ra1, wall thickness, and immersion time data are plotted in Figure 4. Figure 4 show that most value matched one another well, except that the difference between the measured and predicted values exceeded 0.6 μm. The smallest value of Ra2 was measured for H13 tool steel after thermal fatigue cycles (1850 cycles) with a constant temperature of 700 °C. The data on additional factors were used to generate the probability plot, except for two data points where the model overpredicted the measured data by over 0.6 μm. The additional test data fit the model reasonably and supports the validity of the model in predicting the values of Ra2.
Figure 5 shows a contour plot of Ra2, responding to three parameters. The increase in Ra1, and immersion time affected Ra2 dramatically. In Figure 6, the Ra2 reached the highest value when the Ra1 increases.
The response surface plots (i.e., graphing of Equation (2)) for Ra2 against Ra1 and wall thickness ratio, and for Ra2 against Ra1 and immersion time are shown in Figure 5a–d respectively. In Figure 5b, the measured Ra2 increased with Ra1 and immersion time [24,25]. Generally, the predicted Ra2 for the different samples was lower than that for steel B and C, which is consistent with the measured results (Figure 5a,b). The effect of the difference in time and wall thickness on y2 varied for the different H13 samples (Figure 5b,d). With Ra1 versus immersion time increasing from 0% to 24%, R a 2 increased for parameters A and C. With a decrease in R a 2 , the effect on tool steel also decreased.

3.3. Effect of As-Machined Surface Roughness, Wall Thickness and Immersion Time on Hardness Properties

The second-order equation was established to describe the influencing factors and conditions investigated in this study on the surface hardness. The second-order model can be expressed as
y 3 = 20.304 + 0.535 A 0.879 B + 0.159 C + 0.030 A B 4.244 × 10 3 A C + 0.102 B C 0.159 A 2 5.755 × 10 3 B 2 0.062 C 2 ,
where y3 is hardness.
The model (Equation (3)) shows that surface hardness increased with an increase in surface roughness and wall thickness [26,27]. Furthermore, the square of surface roughness, Ra1, and immersion time provided a good indication that as-machined surface roughness was a major factor in Ra2 changes. The analysis of variance as shown in Table 8 indicates that the model was adequate because the p-value of the response surface quadratic model is significant.
The hardness values for all the samples at different through-the-wall thickness increased slightly with the increasing temperature. However, compared with hardness due to thermal fatigue cycles, the HV0.5 values were much lower, when the Ra1 and immersion time increased. These tests require the error term to be normally and independently distributed with mean zero and variances. Figure 6 shows the normal probability, fitted values, and histogram of residuals, respectively.
Figure 6. Normal probability plot of residuals.
Metals 07 00191 g006
Figure 7 shows the hardness contours at three different parameters. The increase in Ra1 and immersion time clearly affected Ra2 dramatically. In Figure 5, Ra2 reached the highest value, when the Ra1 increases. Hardness properties increased more rapidly with increasing temperature in comparison to increasing time. All the empirical equations predicting change in the properties are based on the three factors, namely, as-machined surface roughness, wall thickness, and immersion time.

3.4. Influence of Cooling Rate on Hardness Properties and Crack Length

In the experiment, the maximum and the variety of temperatures reached at the surface and the difference inside the sample was investigated only as a function of the cooling system. A cooling system brought the maximum temperature at the surface. Therefore, the effect of cooling system on crack length as a function of maximum temperature at the surface of the sample. The value assessments of maximum crack length decreased with the increase in the maximum temperature. The identical trend was observed in the experiment conducted for the thermal fatigue cracking parameters. The relationship between the cracking and microhardness measured at a distance equal to the average maximum crack length, followed the temperature trend and confirmed the observation made for different immersion times, as shown in Figure 8. The longer crack is mainly because of the higher temperature at the surface, the lower is the hardness next to crack.

4. Conclusions

In the following research study, a mathematical model with second order has been employed to anticipate the crack parameters including the immersion time, surface roughness, Ra1, and wall thickness process by evaluating the surface roughness due to thermal fatigue, Ra2, and the temperature respectively, which is based on response surface methodology (RSM). The mathematical model outcomes were later equated with the experimental findings. It was observed that the immersion time, Ra1, and wall thickness affected Ra2 and temperature distribution when milling the H13 tool steel. Some important conclusions derived from the study are concluded as following:
  • The response surface methodology (RSM) resulted in an advantageous procedure for the surface roughness and temperature analysis. In addition, designing experiments are essential to produce statistics, which in turn is beneficial in expanding the calculating equations for surface roughness, crack length, and hardness properties. The investigation of variance for the second order for both the studied model displays that the immersion time is the most affected parameter which afflicted the hardness and the crack lengths followed by wall thickness.
  • Both second order models were observed to be expedient in forecasting the key effects and the square effects of diverse dominant arrangements of the machining constraints. The process was found cost-effective in shaping the effect of several parameters in a methodical way. In addition, the process for the thermal fatigue cycle of H13 tool steel, the legitimacy of the process is typically restricted to the collection of factors measured during the investigation.
  • The RSM model could effectively relate the machining parameters with the responses, crack, surface roughness due to thermal fatigue, and hardness properties. The optimal parameter setting resulted crack length of 26.5 μm, surface roughness of 3.114 μm, and hardness properties of 306 HV0.5.
  • The results generated by the predicted model are equated with the experimental results. The observed percentage error is very low, which is only 2% for both the predicted models.

Acknowledgments

The authors introduce their thanks to university Malaysia Pahang to support this project by RDU1403150.

Author Contributions

Hassan Abdulrssoul Abdulhadi designed and conducted the experiments, and analysed the results; Syarifah Nur Aqida Syed Ahmad and Izwan Ismail designed the thermal fatigue test setup; Mahadzir Ishak and Ghusoon Ridha Mohammed contributed materials and analysis tools.

Conflicts of Interest

The authors declare no conflict of interest. and the founding sponsors had no role in the design of the study; in the collection, analyses, or interpretation of data; in the writing of the manuscript, and in the decision to publish the results.

References

  1. Matiskova, D.; Gaspar, S.; Mura, L. Thermal factors of die casting and their impact on the service life of moulds and the quality of castings. Acta Polytech. Hung. 2013, 10, 65–78. [Google Scholar]
  2. Abdulhadi, H.A.; Aqida, S.N.; Ishak, M.; Mohammed, G.R. Thermal fatigue of die-casting dies: An overview. In In Proceedings of the MATEC Web of Conferences: The 3rd International Conference on Mechanical Engineering Research (ICMER 2015), Kuantan, Malaysia, 18–19 August 2015; pp. 1–6. [Google Scholar]
  3. Wang, G.; Zhao, G.; Wang, X. Effects of cavity surface temperature on reinforced plastic part surface appearance in rapid heat cycle moulding. Mater. Des. 2013, 44, 509–520. [Google Scholar] [CrossRef]
  4. Ruby-Figueroa, R. Response surface methodology (RSM). In Encyclopedia of Membranes; Drioli, E., Giorno, L., Eds.; Springer: Berlin/Heidelberg, Germany, 2016; pp. 1729–1730. [Google Scholar]
  5. Hidayanti, N.; Qadariyah, L.; Mahfud, M. Response surface methodology (RSM) modeling of microwave-assisted transesterification of coconut oil with K/γ-Al2O3 catalyst using box-behnken design method. In Proceedings of the AIP Conference, Brisbane, Australia, 4–8 December 2016. [Google Scholar]
  6. Lee, J.-H.; Jang, J.-H.; Joo, B.-D.; Son, Y.-M.; Moon, Y.-H. Laser surface hardening of AISI H13 tool steel. Trans. Nonferr. Met. Soc. China 2009, 19, 917–920. [Google Scholar] [CrossRef]
  7. Xu, W.; Li, W.; Wang, Y. Experimental and theoretical analysis of wear mechanism in hot-forging die and optimal design of die geometry. Wear 2014, 318, 78–88. [Google Scholar] [CrossRef]
  8. Altan, T.; Knoerr, M. Application of the 2D finite element method to simulation of cold-forging processes. J. Mater. Process. Technol. 1992, 35, 275–302. [Google Scholar] [CrossRef]
  9. Long, A.; Thornhill, D.; Armstrong, C.; Watson, D. Predicting die life from die temperature for high pressure dies casting aluminium alloy. Appl. Therm. Eng. 2012, 44, 100–107. [Google Scholar] [CrossRef]
  10. Chen, C.; Wang, Y.; Ou, H.; Lin, Y.-J. Energy-based approach to thermal fatigue life of tool steels for die casting dies. Int. J. Fatigue 2016, 92, 166–178. [Google Scholar] [CrossRef]
  11. Klobčar, D.; Kosec, L.; Kosec, B.; Tušek, J. Thermo fatigue cracking of die casting dies. Eng. Fail. Anal. 2012, 20, 43–53. [Google Scholar] [CrossRef]
  12. Klobčar, D.; Tušek, J. Thermal stresses in aluminium alloy die casting dies. Comput. Mater. Sci. 2008, 43, 1147–1154. [Google Scholar] [CrossRef]
  13. Fissolo, A.; Amiable, S.b.; Vincent, L.; Chapuliot, S.p.; Constantinescu, A.; Stelmaszyk, J.M. Thermal fatigue appears to be more damaging than uniaxial isothermal fatigue: A complete analysis of the results obtained on the CEA thermal fatigue device splash. In Proceedings of the ASME 2006 Pressure Vessels and Piping/ICPVT-11 Conference, Vancouver, BC, Canada, 23–27 July 2006; pp. 535–544. [Google Scholar]
  14. Aqida, S.N.; Calosso, F.; Brabazon, D.; Naher, S.; Rosso, M. Thermal fatigue properties of laser treated steels. Int. J. Mater. Form. 2010, 3, 797–800. [Google Scholar] [CrossRef]
  15. Auersperg, J.; Dudek, R.; Michel, B. Combined fracture, delamination risk and fatigue evaluation of advanced microelectronics applications towards RSM/DOE concepts. In Proceedings of the EuroSime 2006—7th International Conference on Thermal, Mechanical and Multiphysics Simulation and Experiments in Micro-Electronics and Micro-Systems, Como, Italy, 24–26 April 2006; pp. 1–6. [Google Scholar]
  16. Mohammed, G.; Ishak, M.; Aqida, S.; Abdulhadi, H. Effects of heat input on microstructure, corrosion and mechanical characteristics of welded austenitic and duplex stainless steels: A review. Metals 2017, 7, 39. [Google Scholar] [CrossRef]
  17. Box, G.E.; Draper, N.R. Empirical Model-Building and Response Surfaces; Wiley: New York, NY, USA, 1987. [Google Scholar]
  18. Giddings, J.C.; Graff, K.A.; Caldwell, K.D.; Myers, M.N. Field-Flow Fractionation; ACS Publications: Salt Lake City, UT, USA, 1993. [Google Scholar]
  19. Jayabal, S.; Natarajan, U.; Sekar, U. Regression modeling and optimization of machinability behavior of glass-coir-polyester hybrid composite using factorial design methodology. Int. J. Adv. Manuf. Technol. 2011, 55, 263–273. [Google Scholar] [CrossRef]
  20. Paul, V.T.; Saroja, S.; Vijayalakshmi, M. Microstructural stability of modified 9Cr-1Mo steel during long term exposures at elevated temperatures. J. Nuc. Mater. 2008, 378, 273–281. [Google Scholar] [CrossRef]
  21. Gallagher, S.R. Digital image processing and analysis with imagej. In Current Protocols Essential Laboratory Techniques; John Wiley & Sons, Inc.: New York, NY, USA, 2008. [Google Scholar]
  22. Aslan, N.; Cebeci, Y. Application of box-behnken design and response surface methodology for modeling of some turkish coals. Fuel 2007, 86, 90–97. [Google Scholar] [CrossRef]
  23. Dixson, R.; Fu, J.; Orji, N.; Guthrie, W.; Allen, R.; Cresswell, M. CD-AFM Reference Metrology at NIST and Sematech; The International Society for Optics and Photonics: Bellingham, WA, USA, 2005; pp. 324–336. [Google Scholar]
  24. Patel G.C., M.; Krishna, P.; Parappagoudar, M.B. Squeeze casting process modeling by a conventional statistical regression analysis approach. Appl. Math. Model. 2016, 40, 6869–6888. [Google Scholar] [CrossRef]
  25. Moverare, J.J.; Gustafsson, D. Hold-time effect on the thermo-mechanical fatigue crack growth behaviour of inconel 718. Mater. Sci. Eng. A 2011, 528, 8660–8670. [Google Scholar] [CrossRef]
  26. Ammar, O.; Haddar, N.; Remy, L. Numerical computation of crack growth of low cycle fatigue in the 304l austenitic stainless steel. Eng. Fract. Mech. 2014, 120, 67–81. [Google Scholar] [CrossRef]
  27. Hafiz, A.M.K.; Bordatchev, E.V.; Tutunea-Fatan, R.O. Influence of overlap between the laser beam tracks on surface quality in laser polishing of AISI H13 tool steel. J. Manuf. Process. 2012, 14, 425–434. [Google Scholar] [CrossRef]
Figure 1. Samples with different wall thickness of (a) 11.5 mm (b) 9.0 mm and (c) 6.5 mm.
Metals 07 00191 g001
Figure 2. Normal probability plot of residuals.
Metals 07 00191 g002
Figure 3. Contour plot of crack length responding to (a) Ra1 and wall thickness, (b) Ra1 and immersion time. (c,d) a 3D view of crack length interaction with the respective parameters.
Metals 07 00191 g003
Figure 4. Normal residual probability.
Metals 07 00191 g004
Figure 5. Contour plot of surface roughness due to thermal fatigue, Ra2, responding to (a) Ra1 and immersion time, (b) Ra1 and wall thickness. (c,d) a 3D view of Ra2 interactions with the respective parameters.
Metals 07 00191 g005
Figure 7. Contour plots of hardness properties responding to (a) Ra1 and immersion time, (b) Ra1 and wall thickness. (c,d) a 3D view of hardness properties, interaction with the respective parameters.
Metals 07 00191 g007
Figure 8. Relation between hardness HV0.5 and crack length.
Metals 07 00191 g008
Table 1. Chemical composition of American Iron and Steel Institute (AISI) H13.
ElementCSiMnCrMoVW
wt (%)0.511.260.4135.51.521.00.02
Table 2. Chemical composition of Al 356.
ElementCuMgMnSiZnTiFe
wt (%)0.250.450.357.50.350.250.2
Table 3. Surface design factor levels.
FactorNameLowHigh
ASurface roughness (µm)2.55.5
BWall Thickness (mm)6.511.5
CImmersion Time (s)711
Table 4. Outcome of defect thermal fatigue cycles.
Input FactorsOutcome (Response)
Std R a 1 (µm)Wall Thickness (wt) (mm)Immersion Time (T) (s) CL s (µm) R a 2 (µm)Hardness ( HV 0.5 )
12.56.59302.8293
25.56.5946.86.3239
32.511.59322.7297.4
45.511.59465.9257
52.59726.53.5294
65.597436.53242
72.5911302.9288
85.5911525.9235
946.5732.34.6291.7
10411.57354.6265
1146.511414.6250
12411.511464.35291
1349938.54.3285
145.59947.36246
152.59930.62.8297
165.511.5747.66234
172.56.511332.9267
Table 5. Response surface 2FI model for crack length.
SourceSum of SquaresDfMean SquareF Valuep-Value Prob > F
Model6.4261.0741.91<0.0001
A—surface roughness, Ra15.7215.72224.21<0.0001
B—wall thickness0.1110.114.260.0660
C—immersion time0.8710.8734.200.0002
A × B4.196 × 10−514.196 × 10−51.644 × 10−30.9685
A × C1.701 × 10−311.701 × 10−30.0670.8016
B × C3.311 × 10−313.311 × 10−30.130.7263
Residual0.26100.026
Cor Total6.6716
Table 6. Analysis of variance for crack.
Standard Deviation (Std. Dev)0.16Adeq Precision19.815
Mean6.19Pred R-Squared0.8678
Coefficient of Variation (C.V. %)2.58Adj R-Squared0.9388
PRESS0.88R-Squared0.9617
Table 7. Estimated regression coefficients for surface roughness due to thermal fatigue, Ra2.
SourceSum of SquaresDfMean SquareF Valuep-Value Prob > F
Model1.7560.2988.40<0.0001
A—surface roughness, Ra11.6111.61488.86<0.0001
B—wall thickness6.229 × 10−316.229 × 10−31.890.1995
C—immersion time0.01510.0154.470.0605
A × B1.268 × 10−311.268 × 10−30.380.5492
A × C9.257 × 10−419.257 × 10−40.280.6080
B × C6.479 × 10−416.479 × 10−40.200.6672
Residual0.033103.301 × 10−3
Cor Total1.7816
Table 8. Response Surface Quadratic model by the analysis of variance (ANOVA).
SourceSum of SquaresdfMean SquareF Valuep-Value Prob > F
Model8.8790.99235.55<0.0001
A—surface roughness, Ra16.6616.661591.11<0.0001
B—wall thickness0.1910.1945.010.0003
C—immersion time0.1110.1126.970.0013
A × B0.05810.05813.860.0074
A × C7.642 × 10−417.642 × 10−40.180.6820
B × C1.2411.24295.20<0.0001
A20.3410.3481.02<0.0001
B24.378 × 10−314.378 × 10−31.050.3404
C20.2110.2149.970.0002
Residual0.02974.185 × 10−3
Cor Total8.9016

