Abstract
Biomaterial surface functionalization remains of great interest in the promotion of cell osteogenic induction. Previous studies highlighted the positive effects of porous Ti-6Al-4V and phospholipid coating on osteoblast differentiation and bone remodeling. Therefore, the first objective of this study was to evaluate the potential synergistic effects of material porosity and phospholipid coating. Primary human osteoblasts and Saos-2 cells were cultured on different Ti-6Al-4V specimens (mirror-like polished or porous specimens) and were coated or not with 1-palmitoyl-2-oleoyl-sn-glycero-3-phosphoethanolamine (POPE) for three weeks or five weeks. Selected gene expressions (e.g., classical bone markers: alkaline phosphatase, osteocalcin, osteoprotegerin (OPG), receptor activator of nuclear factor kappa-β ligand (RANKL) and runt-related transcription factor 2) were estimated in vitro. Furthermore, the expressions of osteocalcin and osteopontin were examined via fluorescent microscopy at five weeks (immunocytochemistry). Consequently, it was observed that phospholipid coating potentiates preferences for low and high porosities in Saos-2 and primary cells, respectively, at the gene and protein levels. Additionally, RANKL and OPG exhibited different gene expression patterns; primary cells showed dramatically increased RANKL expression, whereas OPG expression was decreased in the presence of POPE. A synergistic effect of increased porosity and phospholipid coating was observed in primary osteoblasts in bone remodeling. This study showed the advantage of primary cells over the standard bone cell model.
1. Introduction
A report published in January 2014 stated that the global orthopedic devices market, valued at 29.2 billion United States Dollars (USD) in 2012, will rise to 41.2 billion USD in 2019 [1]. One major type of metal biomaterial used in orthopedic applications is titanium and titanium-based alloys. Permanent metallic implant materials have been successfully applied in medicine for decades, but their life span remains limited, possibly due to septic and aseptic loosening, which often warrants surgical revision [2]. To increase implant life span, several optimization approaches are under consideration, such as mechanical properties and microstructure improvements [3,4]. Another method involves surface modification to enhance cell adhesion and/or cell matrix production and, therefore, bone formation. Several coatings have been developed in recent years, such as coatings made of calcium phosphate [5], hydroxyapatite [6], proteins [7], growth factors [8], collagen [9], and peptides [10].
In this study, the synergistic effect of different material porosities and phospholipid coating on osteogenic differentiation was examined.
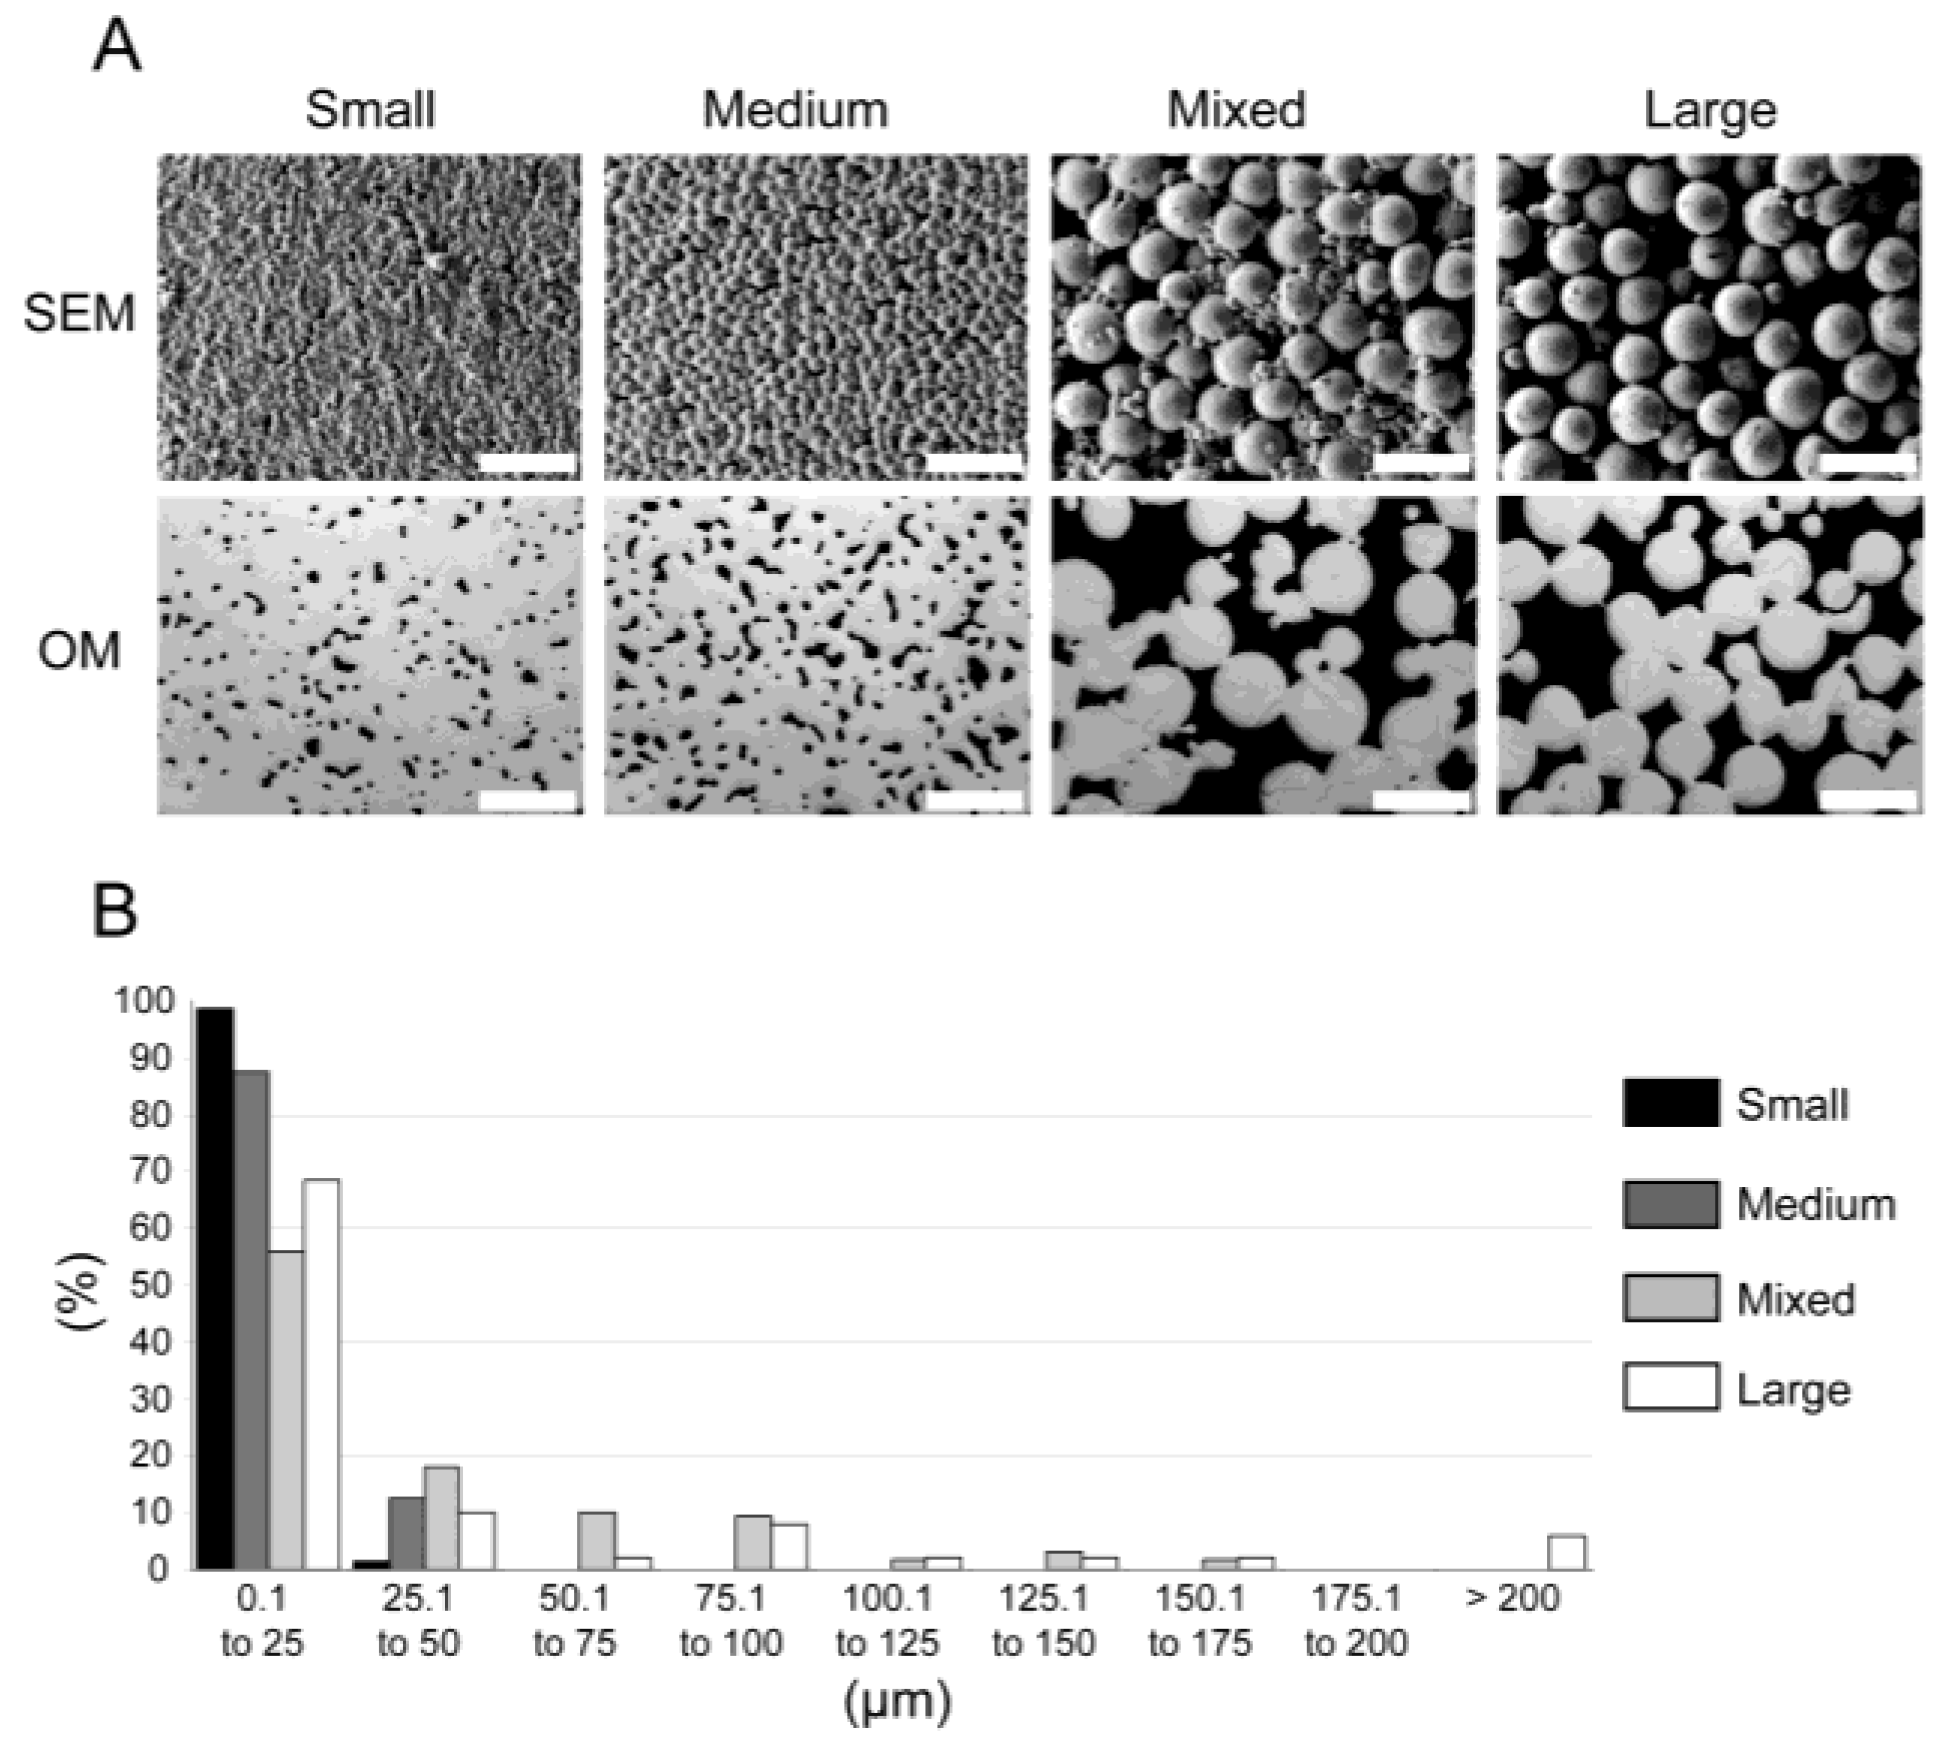
Previously characterized [11] materials (see scanning electron microscopy (SEM) and optical microscopy (OM) photographs in Figure 1A) were produced by metal injection molding (MIM) and exhibited various mechanical properties ranging from solid Ti-6Al-4V to bone-like properties that diminished stress shielding effects [12] (see Table 1). Two-dimensional (2D) pore analysis via optical microscopy indicated pore volumes of 5% ± 1%, 11% ± 1%, 33% ± 5%, and 34% ± 1%, which were named Small, Medium, Mixed, and Large, respectively (see Table 1). The pore diameters were further clustered in 25 µm steps (see Figure 1B).

Figure 1.
Material characterization (adapted from [11]). (A) Material Images. Scanning electron microscopy (SEM) and optical microscopy photographs (OM) of Small, Medium, Mixed, and Large materials (scale bar 200 µm). (B) Pore sizes. Distribution of the pore sizes (in µm) for each material: Small, Medium, Mixed, and Large in black, dark grey, light grey, and white, respectively.

Table 1.
Material properties, mechanical properties, pore volumes, and oxygen contents of the different porous Ti-6Al-4V materials (adapted from [11]). The results of tensile, compression, and resonant ultrasound spectroscopy (RUS) tests are displayed in Palatino Linotype, bold, and in italic font, respectively.
Furthermore, the scaffolds offered a structure mimicking bone architecture, enabling bone-cell colonization, biological anchorage and, therefore, osseointegration [20]. The material names were assigned according to increasing porosity (mirror polished (“MP”), “Small”, “Medium”, “Mixed”, and “Large”). Titanium scaffolds are already successfully employed in preclinical and clinical studies for bone regeneration [21]. However, the application of MIM remains rather rare compared with other more classical metalworking processes, such as selective electron beam melting [22], 3D fiber (3DF) deposition [23], and the space holder method [24]. MIM allows tailoring of material porosity (and, therefore, the E modulus) by adjusting, for example, the sizes and shapes of metal powder particles [25]. Furthermore, MIM permits production of numerous complex parts in a single operation.
Phospholipids are a promising coating material that should mimic natural cell membranes, hide artificial implant material, and strengthen the intimate interface between metallic implant surfaces and bone tissue [26,27].
Phospholipids are the most abundant eukaryotic membrane lipid. Phospholipids are asymmetrically distributed in plasma membranes, of which the majority are phosphatidylserine (PS) and phosphatidylethanolamine (PE), which are mainly located in the cytoplasmic leaflet, and phosphatidylcholine (PC), sphingomyelin (SM), and glycosphingolipids, which are mostly found in the exoplasmic leaflet [28]. Biological membranes are crucial for molecular functions [29], and membrane lipids are essential for proper protein interactions [30]. Phospholipids account for 20% to 30% of total lipids [31] in bone and cartilage tissues and are, thus, excellent candidates for biomimetic coatings. PS, due to its ability to bind calcium phosphate and its indirect role in bacterial adhesion inhibition [32,33,34,35], and PC are able to reduce platelet adhesion [36,37] and are the main phospholipids studied. However, few studies are available on the biological applications of these lipids (for more details refer to [27]). It has been shown that PE is essential for cytokinesis [38]. Furthermore, POPE has an inductive effect on osteogenic differentiation in human mesenchymal stem cells and can promote extracellular matrix mineralization [27,39].
Human bone derived cells (HBDCs) and the osteosarcoma cell line Saos-2 were cultured on these materials with and without POPE coating to study a possible synergistic effect on osteogenic differentiation. To monitor these effects, the expressions of six target genes (i.e., alkaline phosphatase (ALPL), osteocalcin (OC), osteopontin (OPN), osteoprotegerin (OPG), receptor activator of nuclear factor kappa-β ligand (RANKL) and runt-related transcription factor 2 (RUNX2)) and two target proteins (osteocalcin (OC) and osteopontin (OPN)) were studied via real-time polymerase chain reaction (PCR) and immunocytochemistry, respectively, for up to five weeks (5 W).
2. Experimental Section
2.1. Sample Preparation
Disk-shaped samples (10 mm diameter × 2 mm height) were prepared via metal injection moulding (MIM), as described in [11]. To obtain different porosities, Ti-6Al-4V powders (TLS Technik Spezialpulver, Bitterfeld, Germany) with different particle diameters were used. Ti-6Al-4V powder was mixed with binder, injected into a mound, debound chemically and thermally, and finally sintered at 1300 °C. The samples were designated as follows (powder particle sizes in brackets): Small (<45 µm), Medium (45–63 µm), Large (125–180 µm) and Mixed (90% 125–180 µm + 10% <45 µm). Mirror-like polished (“MP”) solid material of the same alloy was used as a control. Control samples were cut from a round bar (F. W. Hempel Legierungsmetall GmbH and Co. KG, Oberhausen, Germany) and polished by conventional procedures, followed by a final manual polishing with a Struers oxide polish suspension (OPS) compound (Struers GmbH, Hannover-Garbsen, Germany). Prior to the biological tests, culture substrates were cleaned by immersing them in 2% Hellmanex solution (Hellma, Mühlheim, Germany) and ultrasonication at room temperature for 20 min. These steps were repeated by replacing the Hellmanex solution with chloroform (Sigma-Aldrich Chemie GmbH, Munich, Germany), ethanol (Sigma-Aldrich Chemie GmbH, Munich, Germany), chloroform/methanol (80/20; optional), and deionized water to remove cell debris (if the samples were used before). The samples were then sterilized (autoclaved for 20 min at 121 °C).
2.2. Phospholipid Coating
POPE (Avanti Polar Lipids, Inc., Alabaster, AL, USA) was prepared at a concentration of 1 mM in chloroform/methanol (80:20, Sigma-Aldrich Chemie GmbH, Munich, Germany). A drop of 50 µL was applied to each sample, and the solvent was allowed to evaporate for 30 min. Subsequently, specimens were incubated for two hours in cell-type corresponding cell culture medium prior to cell seeding. Coating characteristics, such as stability, were previously studied [40].
2.3. Cell Culture
HBDCs: HBDC isolation was performed on bone fragments obtained from total hip replacements, and the procedure was approved by the local ethics committee [41,42]. Adapted from Gartland et al. [42], cancellous bone pieces of approximately 5 mm were cut and cultured in Dulbecco’s modified eagle medium (DMEM) Glutamax-I (Invitrogen Corporation, Karlsruhe, Germany) supplemented with 10% foetal bovine serum (FBS, PAA Laboratories GmbH, Linz, Austria), 1% penicillin and streptomycin (Invitrogen Corporation, Karlsruhe, Germany) for approximately 10 days without a medium change. Upon visibility of the outgrowing HBDCs, the medium was changed every three days. Passaging was performed when the cells achieved 80% confluence. Cells in the second passage were used for the experiments. The osteoblastic potentials, phenotypes, and genotypes of HBDCs were studied and validated previously [11,43].
Saos-2 cells: The human osteosarcoma cell line Saos-2 was purchased from the European collection of cell cultures (ECACC, Salisbury, UK). Saos-2 cells were cultured in McCoy's 5A (Invitrogen Corporation, Karlsruhe, Germany) supplemented with 10% FBS (PAA Laboratories GmbH, Linz, Austria). Passaging was conducted at approximately 80% confluence.
All cells were cultivated at 37 °C under 5% CO2 and 95% humidity.
Differentiation assay: HBDCs and Saos-2 cells were seeded on different specimens (placed beforehand in agarose coated 24-well plates) at a density of 5 × 10⁴ cells/sample in 50 µL of medium. Three biological and three technical replicates were performed. After 40 min (to allow cell adhesion), 1 mL of the appropriate cell medium was added. The differentiation assay was performed as described in Willumeit [39]. Thus, the medium was supplemented with dexamethasone (10−8 M, Sigma-Aldrich Chemie GmbH, Munich, Germany), l-ascorbic acid (5 mM, Sigma-Aldrich Chemie GmbH, Munich, Germany) and 1α,25 dihydroxyvitamin D3 (10−8 M, Sigma-Aldrich Chemie GmbH, Munich, Germany) from day 7 to day 14. From day 14 on, the medium was additionally supplemented with β-glycerolphosphate (10 mM, Sigma-Aldrich Chemie GmbH, Munich, Germany). The medium was replaced every 2–3 days with freshly prepared medium. The cells were then further cultured for up to five weeks. After three and five weeks (3 and 5 W, respectively) ribonucleic acid (RNA) extraction was performed, and after 5 W, additional immunocytochemical staining of osteocalcin, osteopontin, and nuclei (4′,6-diamidino-2-phenylindole, DAPI) was performed.
2.4. Ribonucleic Acid (RNA) Extraction—Reverse Transcription Real-Time Polymerase Chain Reaction (RT-qPCR)
The samples were washed twice with phosphate-buffered saline (PBS) prior to performing total RNA extraction with an RNeasy Mini Kit (Qiagen, Hilden, Germany; a typical RNA purification method using a silica-gel column and centrifugation steps). As outlined in the manufacturer’s protocol, the cells were lysed in a buffer containing guanidine isothiocyanate, a non-ionic detergent. Homogenization was performed via centrifugation through a QIAshredder column (Qiagen, Hilden, Germany). Ethanol (Sigma-Aldrich Chemie GmbH, Munich, Germany) was added to the flow-through which was, in turn, applied to the silica-gel membrane. After several washing steps, total RNA was eluted. RNA concentrations (optical density—OD—at 260 nm) and purity (OD260/280) were measured by a NanoDrop 2000c (Thermo Scientific, Bonn, Germany). More stable complementary deoxyribonucleic acid (cDNA) was synthesized with a Sensiscript reverse transcription kit from Qiagen (Hilden, Germany) following the manufacturer’s protocol, with previous incubation with Dnase I (Thermo Scientific, Bonn, Germany; one hour incubation at 37 °C). cDNA was then stored at −20 °C until use. Semi-quantitative RT-qPCR was performed using SsoFast EvaGreen® Supermix (Bio-Rad Laboratories, Inc., Hercules, CA, USA), 10 pmol of each primer and cDNA. The thermal cycling conditions were defined as follows: (I) initial denaturation for 30 s at 95 °C; (II) 60 cycles with denaturation for 5 s at 95 °C, primer-annealing for 15 s at a primer specific temperature and elongation for 30 s at 72 °C; and (III) an additional melt-curve step: 65 to 95 °C at 0.5 °C per step. To avoid intrinsic biological variability, three biological and three technical copies were performed. Samples were monitored using a CFX96 Touch real-time PCR system (Bio-Rad Laboratories, Munich, Germany) and analyzed with CFX Manager Software 3.1 (Bio-Rad Laboratories, Munich, Germany). Primers (Table 2) were carefully designed to ensure specific and efficient amplification and were purchased from Eurofins MWG Operon (Ebersberg, Germany). The target genes (i.e., ALPL, OC, OPN, OPG, RANKL and RUNX2) were normalized by the reference genes β-Actin (ACTB) and ribosomal protein L10 (RPL10). The suitability of the reference genes was confirmed by the geNorm algorithm method [44] and was automatically calculated by CFX Manager Software 3.1 (Bio-Rad Laboratories, Munich, Germany). An additional non-template control (NTC) per 96-PCR plate was also included. As an analysis method, a normalized gene expression methods were chosen (ΔCt normalization via reference genes and ΔΔCt normalization via reference genes and a control) [45]. Differential expression between two conditions (MP vs. porous material and uncoated vs. coated material) was then statistically analyzed using t-tests via CFX Manager Software 3.1. The regulation threshold (expression fold-change) and p-values (a measure of the evidence against the null hypothesis according to the statistical test) were set to 1.2 and 0.05, respectively.
Table 2.
Real-time PCR primers. For each official gene name and abbreviation (Human Genome Organization, HUGO) and corresponding trivial synonym (in italics), the accession number (from the National Center for Biotechnology information (NCBI) reference sequence collection database), primers and amplicon sizes are indicated.
2.5. Statistical Analyses
Differential gene expression was statistically analyzed with a t test (CFX Manager Software 3.1; Bio-Rad Laboratories, Munich, Germany). The regulation threshold (expression fold change) and p values (measure of the evidence against the null hypothesis in a statistical test) were set as 2 and 0.05, respectively.
2.6. Immunocytochemistry
Immunocytochemistry was performed to target secreted OC and OPN from HBDCs and Saos-2 cells on different materials after 5 W of culture. After fixation in 3.7% formaldehyde (Sigma-Aldrich Chemie GmbH, Munich, Germany), permeabilization was carried out in 0.5% Triton-X (Sigma-Aldrich Chemie GmbH, Munich, Germany) in PBS. Non-specific binding sites were blocked with 1% Triton-X and 2% bovine serum albumin (BSA; Sigma-Aldrich Chemie GmbH, Munich, Germany) in PBS solution for 2 h at 37 °C. Then, this blocking solution was replaced with primary antibody solutions (mouse monoclonal anti-OC and rabbit anti-OPN (Dianova GmbH, Hamburg, Germany)). Subsequently, the specimens were washed twice with PBS (5 min) and incubated with a secondary antibody solution (goat anti-mouse FITC and goat anti-rabbit Texas Red-Dianova GmbH, Hamburg, Germany) for 1 h at 37 °C. Finally, a DAPI (Sigma-Aldrich Chemie GmbH, Munich, Germany) nuclear counterstain was performed (1 mL of DAPI solution (1 mg/mL in methanol (Sigma-Aldrich Chemie GmbH, Munich, Germany) for 15 min). Samples were observed with a Nikon Eclipse Ti-S (Nikon, Düsseldorf, Germany) fluorescent microscope.
3. Results
3.1. RT-qPCR
The influence of material porosity on gene expression is presented in Table 3 and Table 4 (MP sample gene expressions were used as a control). For HBDCs, the expressions of ALPL, OPN, and RANKL were downregulated at 3 W and 5 W for all materials. This downregulation was even more pronounced at 5 W for OPN, whereas it was slightly less negative for ALPL and RANKL (for significance, please refer to corresponding table). No significant difference was observed for OC and RUNX2. For OPG, only Small and Medium exhibited significantly downregulated expression at 3 W. ALPL expression in Saos-2 cells was significantly upregulated in Small and Medium after 3 W and 5 W. However, ALPL expression was downregulated at 3 W for Large. Similarly, OC Saos-2 expression was significantly upregulated for all materials, except at 3 W for Mixed and Large, at which time it was downregulated. For OPG, Small and Medium exhibited statistically significant upregulation at 3 W. For Saos-2 cells, Small and Medium exhibited several gene expressions that were significantly upregulated at 3 W and/or 5 W (i.e., all except OPN, in which expression was not affected). Saos-2 cells cultured on Mixed material exhibited significantly decreased OPG expression at 3 W and 5 W and increased OPN and RANKL expression at 3 W and 5 W, respectively. OC expression was first decreased at 3 W and then increased at 5 W for Mixed and Large samples. For Large materials, ALPL, OC and RANKL expressions were downregulated, whereas OPN was upregulated at 3 W. At 5 W, only OC and RUNX2 expressions were upregulated. Complete gene expression patterns over time for all samples can be found in the supplementary material.
Table 3.
The influence of porosity on HDBC gene expression was determined via real-time PCR analyses by normalising each material (Small, Medium, Mixed, and Large) to the mirror polished (MP) sample (control) (ΔΔCt) after three weeks (3 W) and five weeks (5 W). Regulation: fold expression values are compared to regulation threshold (↑ up regulation, ↓ down regulation, and ↔ no change). p-value given are absolute values and significance levels where * ≤ 0.05, ** ≤ 0.01, and *** ≤ 0.001.
Table 4.
The influence of porosity on Saos-2 gene expression was determined via real-time PCR analyses by normalizing each material (Small, Medium, Mixed, and Large) to the mirror polished (MP) sample (control) (ΔΔCt) after three weeks (3 W) and five weeks (5 W). Regulation: fold expression values are compared to regulation threshold (↑ up regulation, ↓ down regulation, and ↔ no change). p-values given are absolute values and significance levels where * ≤ 0.05, ** ≤ 0.01, and *** ≤ 0.001.
The influence of POPE on gene expression for the different samples (i.e., normalization of each POPE coated material to the corresponding material without) is presented in Table 5 and Table 6. For the HBDCs, although OPN was downregulated after 3 W of culture on all materials, OC, OPG, and OPN expressions were significantly upregulated after 5 W of culture. ALPL, RANKL, and RUNX2 were significantly upregulated after 3 W and 5 W (except for RUNX2 3 W “MP” and Large). For Saos-2, the cells cultured for 3 W on the Small POPE coating expressed less RUNX2, RANKL, and OPG. However, RANKL and OPG were upregulated after 5 W in all materials (except Mixed and Large). OPN expression was upregulated on the 5 W Small samples but was downregulated on the Medium 3 W and Large 3 W and 5 W samples. For all materials, ALPL expression was upregulated after 5 W (but also after 3 W for “MP” samples). Although OC expression was downregulated after 3 W of culture for all samples (statistically significant for “MP”, Medium, and Large), it remained downregulated for Large samples at 5 W but was upregulated for “MP” and Mixed at 5 W.
Table 5.
The influence of POPE on HDBC gene expression was determined via real-time PCR analyses by normalizing each POPE-coated material to the corresponding material without phospholipids (ΔΔCt) after three weeks (3 W) and five weeks (5 W). Regulation: fold expression values are compared to regulation threshold (↑ up regulation, ↓ down regulation, and ↔ no change). p-values given are absolute values and significance levels where * ≤ 0.05, ** ≤ 0.01, and *** ≤ 0.001.
Table 6.
The influence of POPE on Saos-2 gene expression was determined via real-time PCR analyses by normalizing each POPE-coated material to the corresponding material without phospholipids (ΔΔCt) after three weeks (3 W) and five weeks (5 W). Regulation: fold expression values are compared to regulation threshold (↑ up regulation, ↓ down regulation, and ↔ no change). p-values given are absolute values and significance levels where * ≤ 0.05, ** ≤ 0.01, and *** ≤ 0.001.
3.2. Immunocytochemistry
Parallel stainings; i.e., OC (green), OPN (red), and nuclei (blue), were performed with both cell types on all coated or not coated carriers after 5 weeks of osteogenic differentiation promotion (Figure 2). Cells were found on all materials. On bare material (−POPE), OC was barely detectable for HBDCs, whereas a homogeneous distribution was observed for Saos-2. With POPE coating, OC expression was upregulated: nodules and a denser green layer were observed for HBDCs and Saos-2 cells, respectively. OPN was barely detectable for Saos-2 cells, whereas it was found in HBDC nodules on native and coated surfaces.
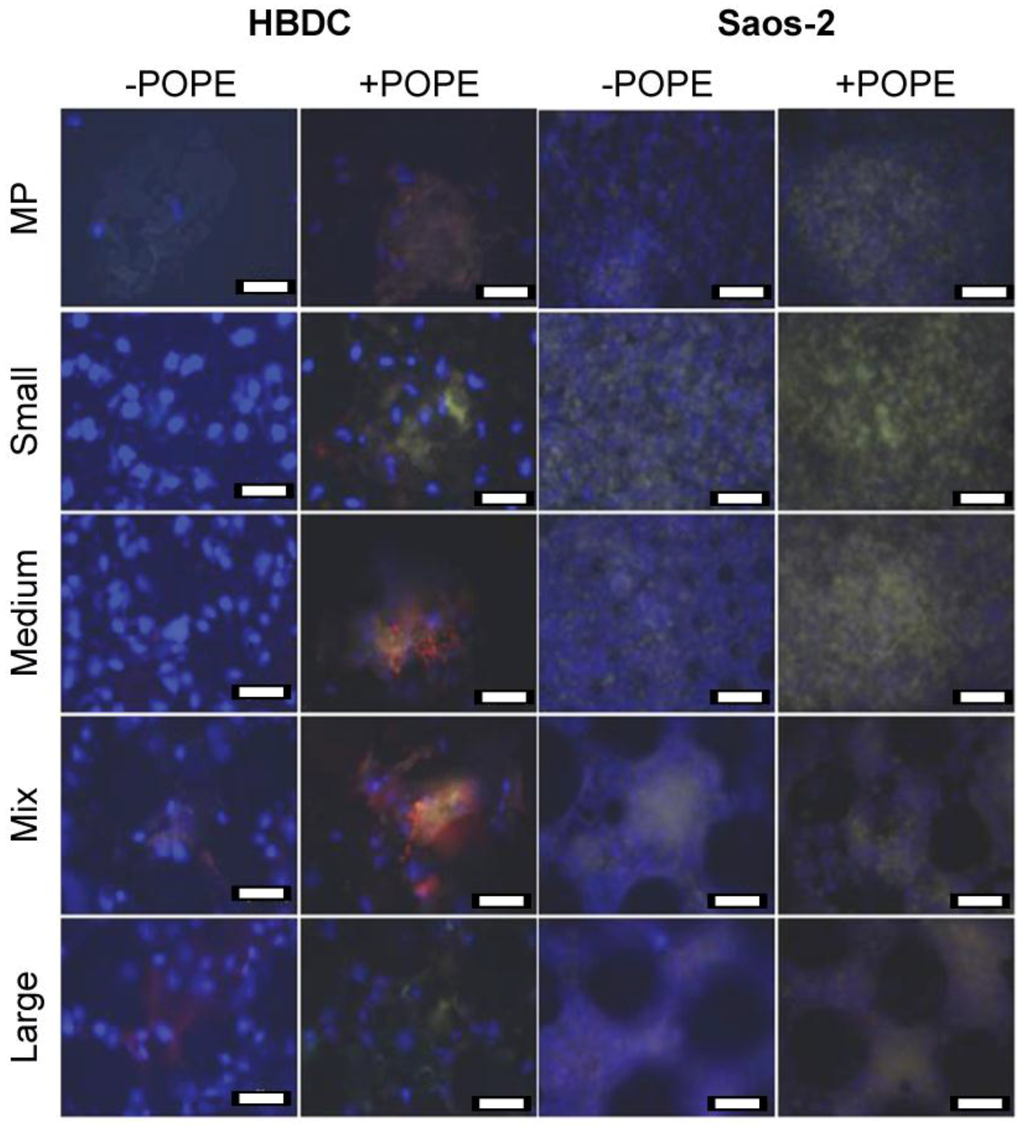
Figure 2.
Immunocytochemistry. OC (green) and OPN (red) were targeted in HBDCs and Saos-2 cells on different POPE coated (+POPE) or not coated (−POPE) materials after 5 W. Due to the merged pictures, OC appears yellow. Nuclei were DAPI-stained and appear blue (scale bar 50 µm).
4. Discussion
A previous study indicated that porous Ti-Al6-V4 processed by MIM may be a well-suited net-shaped material for medical applications and osseointegration (e.g., a completely interconnected pore volume of approximately 30% and pore diameters up to 175 µm, allowing cell ingrowth) [11]. Furthermore, improved OPN and collagen I (COL1A1) gene expressions and bone nodule formation (OC immunocytochemistry) were observed for human mesenchymal stem cells (MSCs) only on POPE-coated surfaces [39]. Further investigation on POPE coating demonstrated that this phospholipid was able to potentiate MSC differentiation and accelerate their mineralization process [27]. Therefore, primary cells (i.e., HBDCs) and an osteoblast cell model (i.e., Saos-2 cells) were cultured on native or POPE-coated surfaces of different porous materials and driven towards an osteoblastogenesis pathway for up to 5 W to further study the influence of material porosity on bone cells and a possible synergistic effect of POPE coating.
Osteogenesis is characterized by decreased proliferation and increased differentiation. The osteoblastic differentiation time course started with the commitment of MSCs to preosteoblasts. Then, the number of committed cells increased (condensation phase), and the preosteoblasts started to transform into osteoblasts. Afterwards, extracellular matrix (ECM) deposition began, followed by terminal differentiation and mineralization. The expression of six classical bone markers was studied: RUNX2, OPN, OC, ALPL, OPG, and RANKL. RUNX2 is a key multifunctional transcription factor involved in osteoprogenitor commitment [46,47]. Its expression is upregulated in immature osteoblasts and is required for osteoblast lineage determination [48]. RUNX2 induces the expression of several bone matrix genes, such as collagen 1a1 (COL1a1), bone sialoprotein (BSP), OPN, and OC [49]). During osteogenesis, the organic component of the ECM, of which approximately 90% was composed of COL1a1 [50], was first synthesized by osteoblasts and was then colonized by other proteins secreted by osteoblasts (e.g., OC, BSP, and OPN; [51]). OC regulated osteoblast and osteoclast activity, participating in the mineralization [52]. OC is highly expressed in mature (post-proliferative phase) osteoblasts (i.e., “late marker”) [53,54,55]. OPN belongs to the small integrin binding ligand N-linked glycoprotein (SIBLING), which is a mediator of environmental stress and a potential chemoattractant for osteoclasts [56] and is considered an inhibitor of mineralization [57]. Expression of RANKL is also influenced by RUNX2 [58]. RANKL is a cytokine responsible for osteoclast recruitment and is necessary for osteoclast differentiation (via its binding to osteoclast receptor RANK or tumor necrosis factor receptor superfamily member 11a (TNFRSF11A), an NFKB activator). Its soluble decoy receptor, OPG, is also mainly secreted by osteoblasts and inhibits osteoclastogenesis [59]. ALPL, another marker of bone formation, is an early marker of mineralization [57].
At the gene level (Table 2 and Table 3), it is rather difficult to see a clear effect of porosity on HBDC and Saos-2 osteoblastogenesis. For HBDCs, OPG, and OC were upregulated at 3 W and 5 W only on Mixed samples, RUNX2 was upregulated on Mixed and Large samples, and OPN was downregulated on Mixed samples. It may be that, for HBDCs, to a certain extent, increased porosity (bell-shape distribution showing a maximum with a Mixed sample) tended to facilitate osteoblastogenesis (RUNX2) and OC collagen matrix colonization and to decrease osteoclast-mediated bone remodeling via OPN downregulation and OPG upregulation. Furthermore, ALPL expression was downregulated on all porous samples, except for Large, compared with MP samples. Previous data showed that the metabolic activities of the HBDCs were highest on mixed and Large samples after one day [11]; therefore, porosity may positively affect osteogenesis but may delay the final step of differentiation and decrease cell proliferation. However, Saos-2 cells exhibited the opposite trend, preferring the lowest porosities (highest gene upregulations (except OPN) on Small and Medium). Moreover, these observations were seen via immunocytochemistry, in which slightly more fluorescence could be seen on Medium and Mixed samples for HBDCs and on Small and Medium samples for Saos-2 cells without POPE coating (Figure 2). These porosity preferences may be explained by general inherent differences between cell lines and primary cells [43,60,61], cell relative sizes (mean diameters of approximately 6500 µm2 and 1000 µm2 for HBDCs and Saos-2 cells, respectively; differences in cell nuclei sizes can also be appreciated in Figure 2) and the shorter cell doubling time of Saos-2 cells compared with HBDCs [61]. Primary cell sizes would allow them to bridge the pore’s rims, and their low proliferation rate would also allow other bone remodeling processes, such as vascularization, thus diminishing nutrient source hindrance. The previously described trends (i.e., HBDC gene upregulation for higher porosities or higher downregulation for less porous material and vice-versa for Saos-2 cells) are more pronounced with POPE coating (Table 4 and Table 5), especially when analyzing immunocytochemistry images (Figure 2).
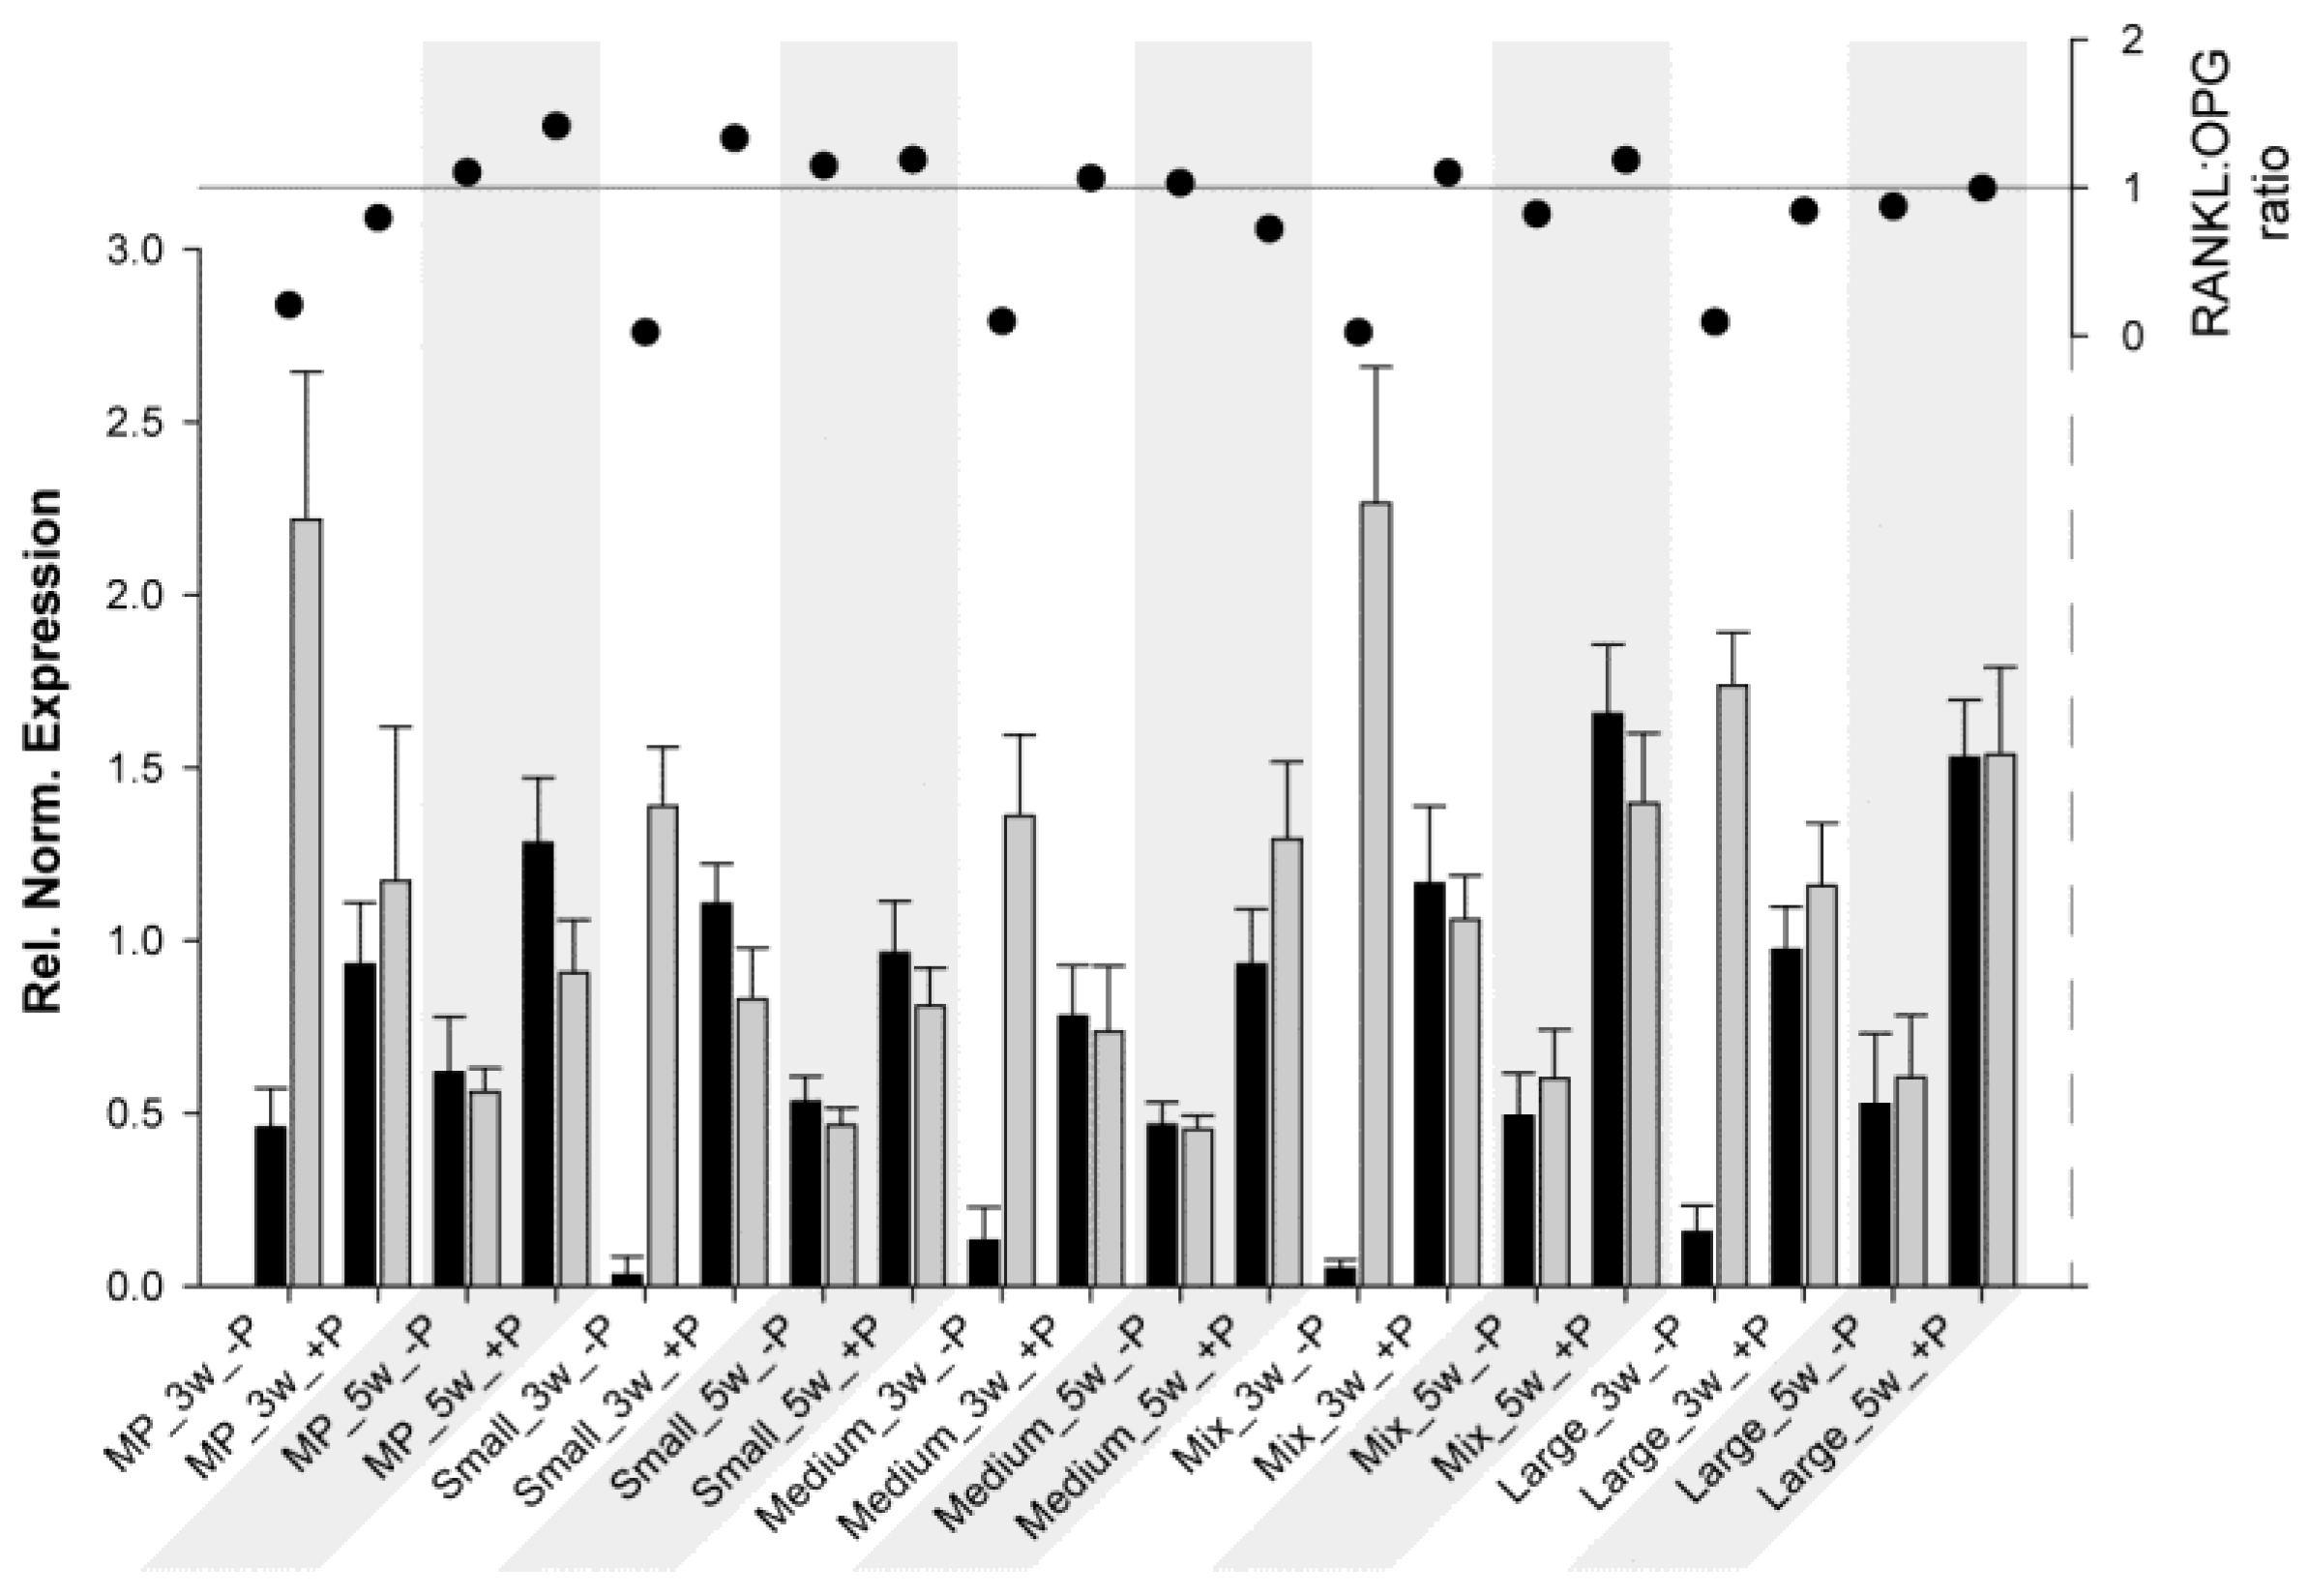
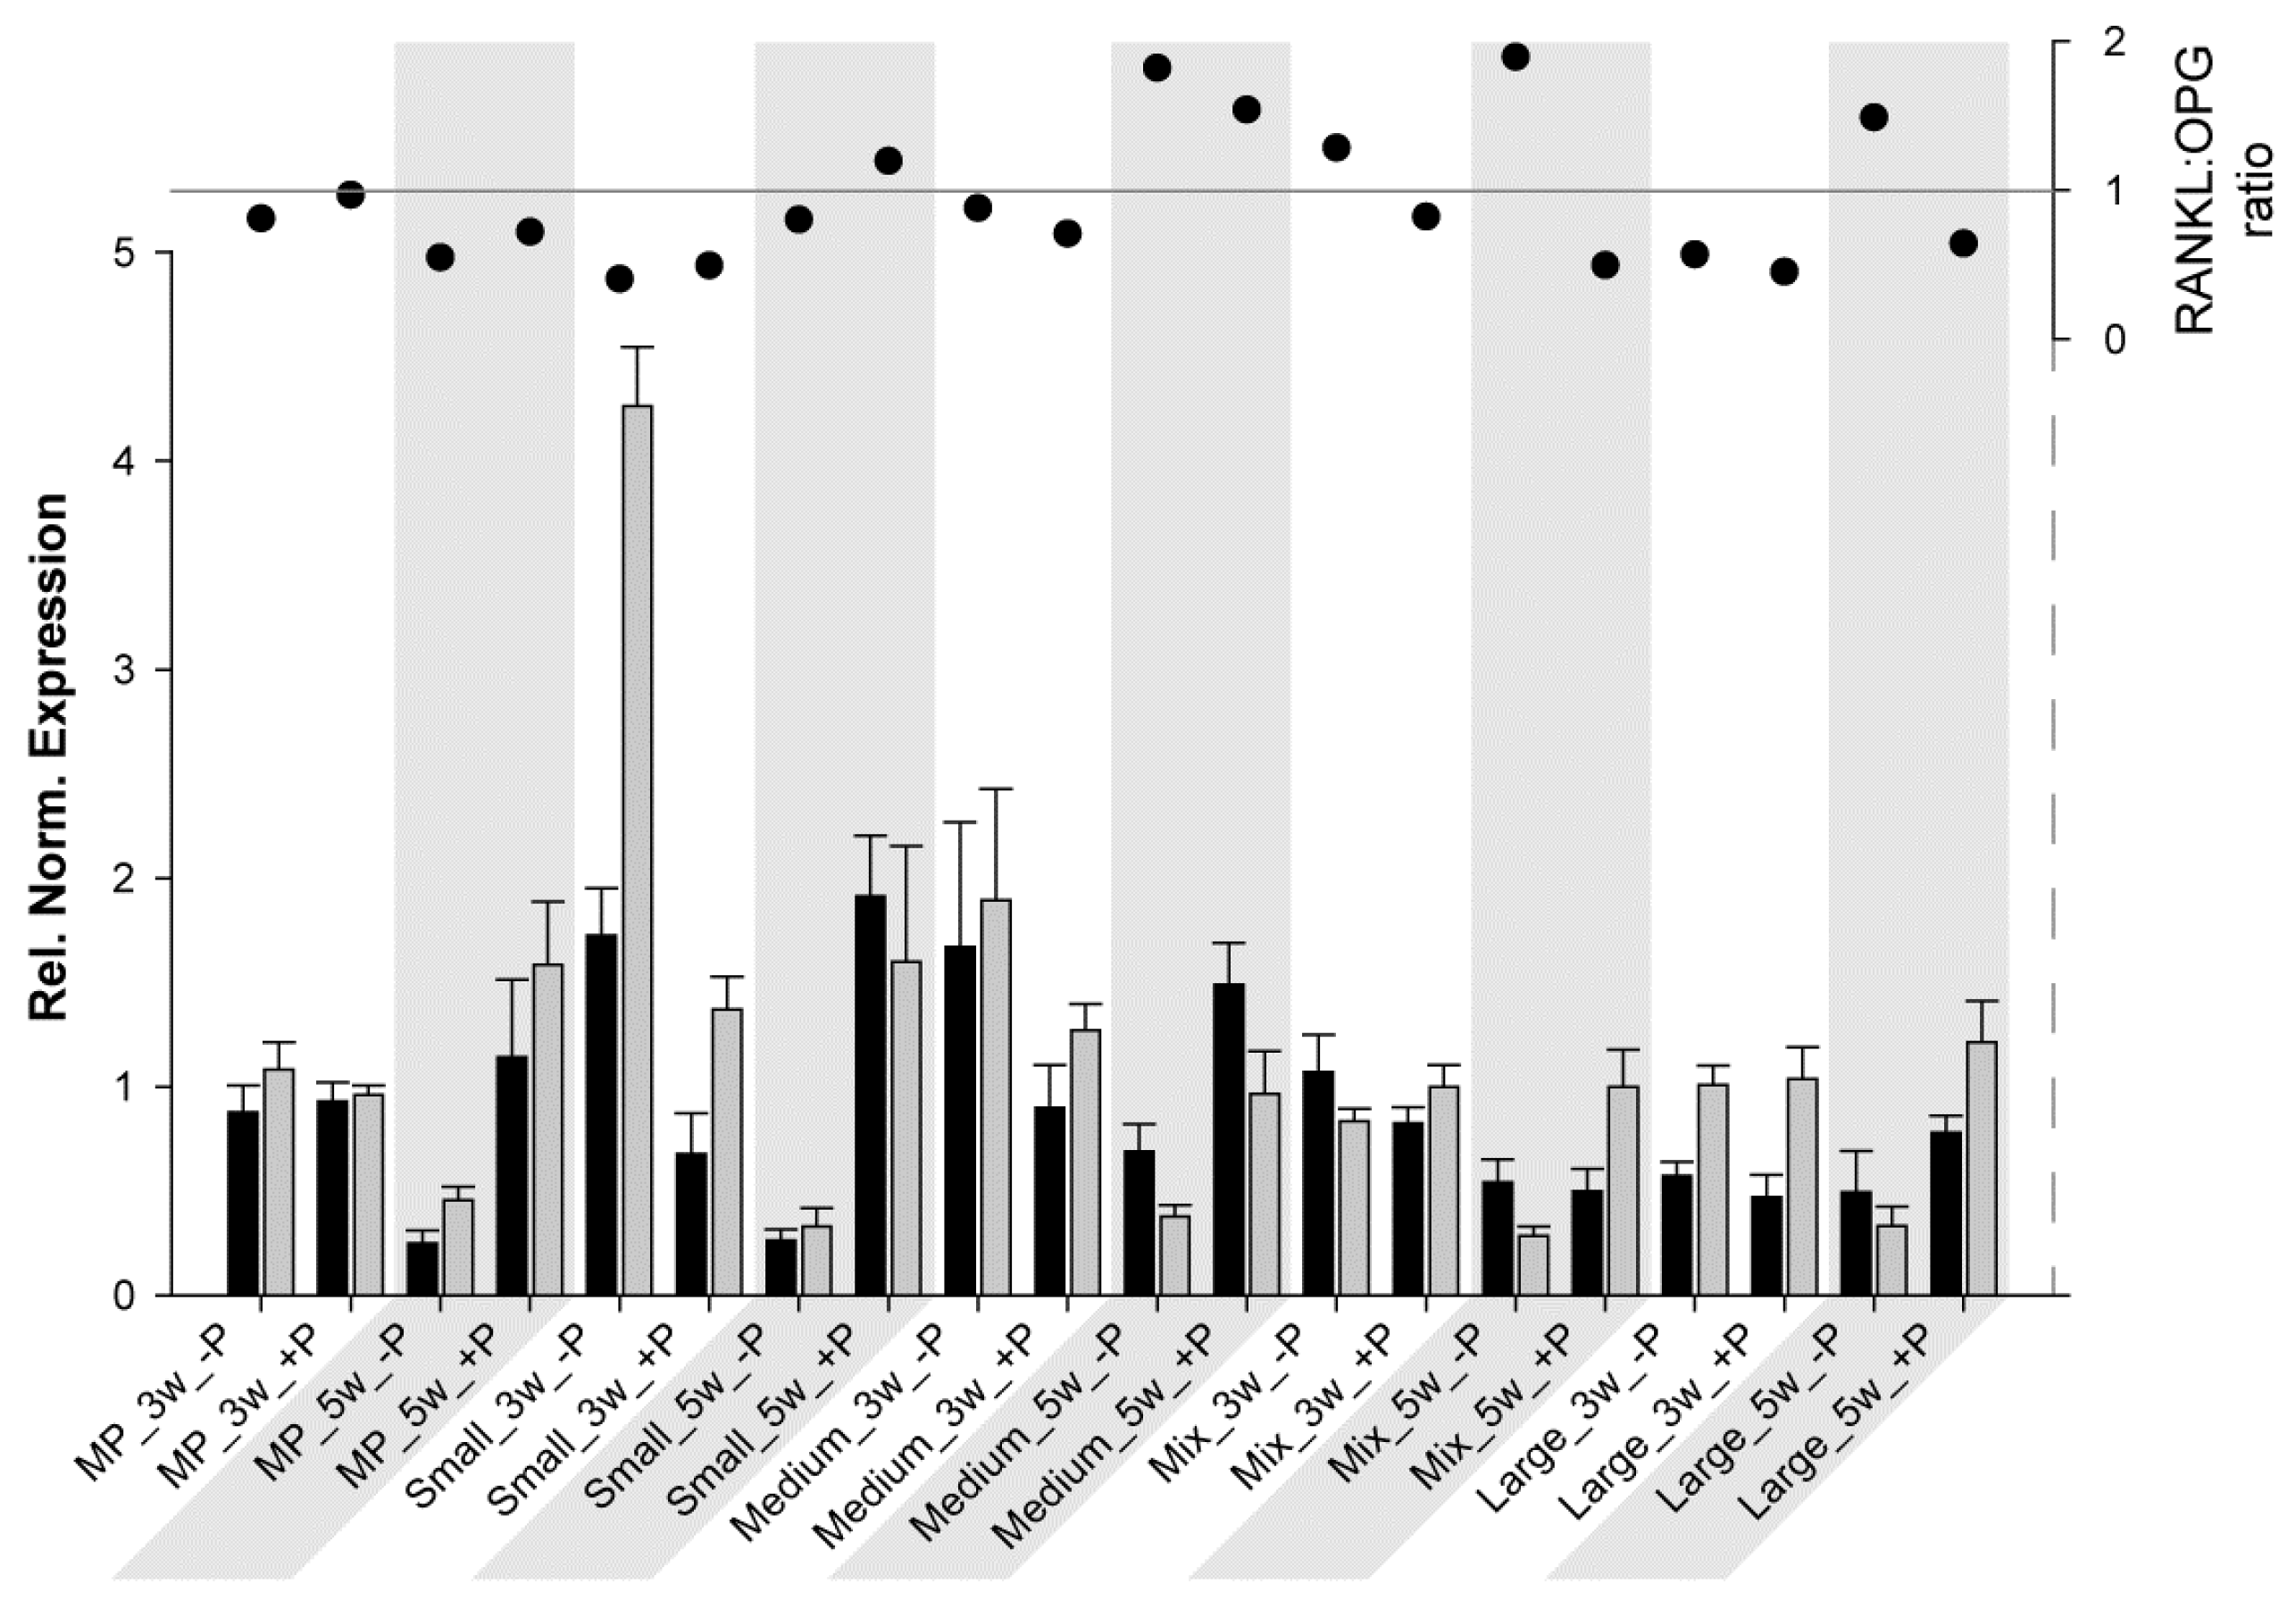
Another interesting aspect is the RANKL:OPG ratio. This ratio is a useful marker for monitoring fracture healing [62] and, thus, bone turnover and mineralization [63]. As previously described, RANKL potentiates osteoclastogenesis, whereas OPG prevents the RANKL effect; therefore, when the ratio is above 1, bone resorption/osteoclast activation predominates, and when it is below 1, bone formation/osteoclast inhibition predominates. For HBDCs (Figure 3) at 3 W and for all samples without coating, OPG expression was much higher than RANKL expression, resulting in a really low ratio. At 5 W (without coating), RANKL and OPG expressions tended to be at the same level, and the ratio was approximately 1. However, at 3 W with POPE coating, RANKL increased drastically, whereas OPG decreased (ratio ≥ 1), and at 5 W, both expressions were higher with POPE than without POPE, but resulted in a ratio oscillating at approximately 1 (except for MP, 1.4). From these results, it may be concluded that POPE coating potentiates and accelerates osteoblastogenesis and, therefore, likely assists bone remodeling. For Saos-2 cells (Figure 4), the results were very different, and it is difficult to find a common trend. It could be said for MP and Small that POPE coating potentiates (increases) the ratio; however, (via an OPG increase), for the other materials, contrasting results (decreases) were observed. However, no special tendency was observed to explain this phenomenon.

Figure 3.
Relative normalized expression (ΔCt) of RANKL (black) and OPG (grey) in HUCPV cells (column chart, left axis) grown on different substrates at 3 W and 5 W (grey areas). The RANKL:OPG ratio is presented on the right axis (scatter chart).

Figure 4.
Relative normalized expression of (ΔCt) RANKL (black) and OPG (grey) in Saos-2 cells (column chart, left axis) grown on different substrates at 3 W and 5 W (grey areas). The RANKL:OPG ratio is presented on the right axis (scatter chart).
In conclusion, it can be said that a preference for lower porosity was seen for Saos-2 cells, whereas primary cells, i.e., HBDCs, preferred higher porosity. However, POPE coating increased this trend. Furthermore, RANKL/OPG expressions and ratio analyses were able to highlight a special effect of POPE on faster bone remodeling/turnover for HBDCs. Here, Saos-2 cells exhibited a completely different behavior pattern than HBDCs, supporting that primary cells should be preferred relative to cell lines. Porous material could improve tissue implantation via cell colonization and POPE coating could further strengthen the intimate interface between tissue and material via faster mineralization and tissue remodeling.
Acknowledgments
The authors would like to thank Gabriele Salamon for performing the cell isolation of the human bone derived cells.
Author Contributions
Bérengère J.C. Luthringer and Axel Deing conceived and designed the experiments; Axel Deing performed the experiments; Bérengère J.C. Luthringer and Axel Deing analysed the data; Bérengère J.C. Luthringer and Axel Deing wrote the paper; Bérengère J.C. Luthringer, Axel Deing, Regine Willumeit-Römer and Thomas Ebel contributed to the revision of the manuscript.
Conflicts of Interest
The authors state that they have no conflict of interest.
References
- Orthopedic devices market—global industry analysis, size, share, growth, trends and forecast, 2013–2019; ID: 2759691; Transparency Market Research: Albany, NY, USA, 2014.
- Wooley, P.H.; Schwarz, E.M. Aseptic loosening. Gene Ther. 2004, 11, 402–407. [Google Scholar] [CrossRef] [PubMed]
- Okulov, I.V.; Pauly, S.; Kuhn, U.; Gargarella, P.; Marr, T.; Freudenberger, J.; Schultz, L.; Scharnweber, J.; Oertel, C.G.; Skrotzki, W.; et al. Effect of microstructure on the mechanical properties of as-cast Ti-Nb-Al-Cu-ni alloys for biomedical application. Mater. Sci. Eng. C Mater. Boil. Appl. 2013, 33, 4795–4801. [Google Scholar] [CrossRef] [PubMed]
- Niinomi, M.; Akahori, T. Improvement of the fatigue life of titanium alloys for biomedical devices through microstructural control. Expert Rev. Med. Devices 2010, 7, 481–488. [Google Scholar] [CrossRef] [PubMed]
- Surmenev, R.A.; Surmeneva, M.A.; Ivanova, A.A. Significance of calcium phosphate coatings for the enhancement of new bone osteogenesis—a review. Acta Biomater. 2014, 10, 557–579. [Google Scholar] [CrossRef] [PubMed]
- Thorfve, A.; Lindahl, C.; Xia, W.; Igawa, K.; Lindahl, A.; Thomsen, P.; Palmquist, A.; Tengvall, P. Hydroxyapatite coating affects the Wnt signaling pathway during peri-implant healing in vivo. Acta Biomater. 2014, 10, 1451–1462. [Google Scholar] [CrossRef] [PubMed]
- Pei, X.; Pan, L.; Cui, F.; He, R.; Bao, H.; Wan, Q.; Wang, J. The recombinant human dentin matrix protein 1-coated titanium and its effect on the attachment, proliferation and ALP activity of MG63 cells. J. Mater. Sci. Mater. Med. 2012, 23, 2717–2726. [Google Scholar] [CrossRef] [PubMed]
- Tan, X.W.; Lakshminarayanan, R.; Liu, S.P.; Goh, E.; Tan, D.; Beuerman, R.W.; Mehta, J.S. Dual functionalization of titanium with vascular endothelial growth factor and β-defensin analog for potential application in keratoprosthesis. J. Biomed. Mater. Res. Part B Appl. Biomater. 2012, 100B, 2090–2100. [Google Scholar] [CrossRef] [PubMed]
- Schulz, M.C.; Korn, P.; Stadlinger, B.; Range, U.; Möller, S.; Becher, J.; Schnabelrauch, M.; Mai, R.; Scharnweber, D.; Eckelt, U.; et al. Coating with artificial matrices from collagen and sulfated hyaluronan influences the osseointegration of dental implants. J. Mater. Sci. Mater. Med. 2013, 25, 247–258. [Google Scholar] [CrossRef] [PubMed]
- Lu, Y.; Lee, J.S.; Nemke, B.; Graf, B.K.; Royalty, K.; Illgen, R., 3rd; Vanderby, R., Jr.; Markel, M.D.; Murphy, W.L. Coating with a modular bone morphogenetic peptide promotes healing of a bone-implant gap in an ovine model. PLoS ONE 2012, 7, e50378. [Google Scholar] [CrossRef] [PubMed]
- Deing, A.; Luthringer, B.; Laipple, D.; Ebel, T.; Willumeit, R. A porous Ti-6Al-4V implant material for medical application. Int. J. Biomater. 2014, 2014. [Google Scholar] [CrossRef] [PubMed]
- Van der Stok, J.; Van der Jagt, O.P.; Amin Yavari, S.; De Haas, M.F.; Waarsing, J.H.; Jahr, H.; Van Lieshout, E.M.; Patka, P.; Verhaar, J.A.; Zadpoor, A.A.; et al. Selective laser melting-produced porous titanium scaffolds regenerate bone in critical size cortical bone defects. J. Orthop. Res. 2013, 31, 792–799. [Google Scholar] [CrossRef] [PubMed]
- Bandyopadhyay, A.; Espana, F.; Balla, V.K.; Bose, S.; Ohgami, Y.; Davies, N.M. Influence of porosity on mechanical properties and in vivo response of Ti6Al4V implants. Acta Biomater. 2010, 6, 1640–1648. [Google Scholar] [CrossRef] [PubMed]
- Spoerke, E.D.; Murray, N.G.; Li, H.; Brinson, L.C.; Dunand, D.C.; Stupp, S.I. A bioactive titanium foam scaffold for bone repair. Acta Biomater. 2005, 1, 523–533. [Google Scholar] [CrossRef] [PubMed]
- Staiger, M.P.; Pietak, A.M.; Huadmai, J.; Dias, G. Magnesium and its alloys as orthopedic biomaterials: A review. Biomaterials 2006, 27, 1728–1734. [Google Scholar] [CrossRef] [PubMed]
- Yoon, H.S.; Katz, J.L. Ultrasonic wave propagation in human cortical bone—П. Measurements of elastic properties and microhardness. J. Biomech. 1976, 9, 459–464. [Google Scholar] [CrossRef]
- Lee, T.; Lakes, R.S.; Lal, A. Investigation of bovine bone by resonant ultrasound spectroscopy and transmission ultrasound. Biomech. Model. Mechanobiol. 2002, 1, 165–175. [Google Scholar] [CrossRef] [PubMed]
- Turner, C.H.; Wang, T.; Burr, D.B. Shear strength and fatigue properties of human cortical bone determined from pure shear tests. Calcif. Tissue Int. 2001, 69, 373–378. [Google Scholar] [CrossRef] [PubMed]
- Kemper, A.; McNally, C.; Kennedy, E.; Manoogian, S.; Duma, S. The material properties of human tibia cortical bone in tension and compression: Implications for the tibia index. In Proceedings of the 20th International Technical Conference on the Enhanced Safety of Vehicles Conference (ESV), Lyon, France, 2007.
- Matassi, F.; Botti, A.; Sirleo, L.; Carulli, C.; Innocenti, M. Porous metal for orthopedics implants. Clin. Cases Miner. Bone Metab. 2013, 10, 111–115. [Google Scholar] [PubMed]
- Alvarez, K.; Nakajima, H. Metallic scaffolds for bone regeneration. Materials 2009, 2, 790–832. [Google Scholar] [CrossRef]
- Ponader, S.; Von Wilmowsky, C.; Widenmayer, M.; Lutz, R.; Heinl, P.; Korner, C.; Singer, R.F.; Nkenke, E.; Neukam, F.W.; Schlegel, K.A. In vivo performance of selective electron beam-melted Ti-6Al-4V structures. J. Biomed. Mater. Res. A 2009, 92, 56–62. [Google Scholar]
- Li, J.P.; Habibovic, P.; van den Doel, M.; Wilson, C.E.; de Wijn, J.R.; Van Blitterswijk, C.A.; De Groot, K. Bone ingrowth in porous titanium implants produced by 3D fiber deposition. Biomaterials 2007, 28, 2810–2820. [Google Scholar] [CrossRef] [PubMed]
- Faria, P.E.; Carvalho, A.L.; Felipucci, D.N.; Wen, C.; Sennerby, L.; Salata, L.A. Bone formation following implantation of titanium sponge rods into humeral osteotomies in dogs: A histological and histometrical study. Clin. Implant. Dent. Relat. Res. 2008, 12, 72–79. [Google Scholar] [CrossRef] [PubMed]
- Da Silva Jorge, H. Compounding and processing of a water soluble binder for powder injection moulding. Ph.D. Thesis, Universidade do Minho, Braga, Portugal, 2008. [Google Scholar]
- Willumeit, R.; Schuster, A.; Iliev, P.; Linser, S.; Feyerabend, F. Phospholipids as implant coatings. J. Mater. Sci. Mater. Med. 2007, 18, 367–380. [Google Scholar] [CrossRef] [PubMed]
- Luthringer, B.J.; Katha, U.M.; Willumeit, R. Phosphatidylethanolamine biomimetic coating increases mesenchymal stem cell osteoblastogenesis. J. Mater. Sci. Mater. Med. 2014, 25, 2561–2571. [Google Scholar] [CrossRef] [PubMed]
- Zachowski, A. Phospholipids in animal eukaryotic membranes: Transverse asymmetry and movement. Biochem. J. 1993, 294, 1–14. [Google Scholar] [CrossRef] [PubMed]
- Kung, C. A possible unifying principle for mechanosensation. Nature 2005, 436, 647–654. [Google Scholar] [CrossRef] [PubMed]
- Sprong, H.; Van der Sluijs, P.; Van Meer, G. How proteins move lipids and lipids move proteins. Nature 2001, 2, 504–513. [Google Scholar] [CrossRef] [PubMed]
- Wuthier, R.E. Lipid composition of isolated epiphyseal cartilage cells, membranes and matrix vesicles. Biochim. Biophys. Acta 1975, 409, 128–143. [Google Scholar] [CrossRef]
- Camolezi, F.L.; Daghastanli, K.R.; Magalhaes, P.P.; Pizauro, J.M.; Ciancaglini, P. Construction of an alkaline phosphatase-liposome system: A tool for biomineralization study. Int. J. Biochem. Cell Boil. 2002, 34, 1091–1101. [Google Scholar] [CrossRef]
- Eanes, E.D. Mixed phospholipid liposome calcification. Bone Miner. 1992, 17, 269–272. [Google Scholar] [CrossRef]
- Letellier, S.R.; Lochhead, M.J.; Campbell, A.A.; Vogel, V. Oriented growth of calcium oxalate monohydrate crystals beneath phospholipid monolayers. Biochim. Biophys. Acta 1998, 1380, 31–45. [Google Scholar] [CrossRef]
- Santin, M. Calcium-binding phospolipids as a coating material for implant osteointergration. Interface 2006, 3, 277–281. [Google Scholar] [PubMed]
- Ishihara, K.; Nakabayashi, N.; Fukumoto, K.; Aoki, J. Improvement of blood compatibility on cellulose dialysis membrane. I. Grafting of 2-methacryloyloxyethyl phosphorylcholine on to a cellulose membrane surface. Biomaterials 1992, 13, 145–149. [Google Scholar] [CrossRef]
- Krishna, O.D.; Kim, K.; Byun, Y. Covalently grafted phospholipid monolayer on silicone catheter surface for reduction in platelet adhesion. Biomaterials 2005, 26, 7115–7123. [Google Scholar] [CrossRef] [PubMed]
- Emoto, K.; Inadome, H.; Kanaho, Y.; Narumiya, S.; Umeda, M. Local change in phospholipid composition at the cleavage furrow is essential for completion of cytokinesis. J. Boil. Chem. 2005, 280, 37901–37907. [Google Scholar] [CrossRef] [PubMed]
- Willumeit, R.; Schossig, M.; Clemens, H.; Feyerabend, F. In vitro interactions of human chondrocytes and mesenchymal stem cells, and of mouse macrophages with phospholipid-covered metallic implant materials. Eur. Cell Mater. 2007, 13, 11–25. [Google Scholar] [PubMed]
- Golub, M.; Lott, D.; Watkins, E.; Garamus, V.; Luthringer, B.; Stoermer, M.; Schreyer, A.; Willumeit, R. X-ray and neutron investigation of self-assembled lipid layers on a titanium surface. Biointerphases 2013, 8, 21. [Google Scholar] [CrossRef] [PubMed]
- Gallagher, J.A. Human osteoblast culture. Methods Mol. Med. 2003, 80, 3–18. [Google Scholar] [PubMed]
- Gartland, A.; Rumney, R.M.; Dillon, J.P.; Gallagher, J.A. Isolation and culture of human osteoblasts. Methods Mol. Biol. 2012, 806, 337–355. [Google Scholar] [PubMed]
- Burmester, A.; Luthringer, B.; Willumeit, R.; Feyerabend, F. Comparison of the reaction of bone-derived cells to enhanced MgCl2-salt concentrations. Biomatter 2014, 4, e967616. [Google Scholar] [CrossRef] [PubMed]
- Hellemans, J.; Mortier, G.; De Paepe, A.; Speleman, F.; Vandesompele, J. Qbase relative quantification framework and software for management and automated analysis of real-time quantitative PCR data. Genome Biol. 2007, 8, R19. [Google Scholar] [CrossRef] [PubMed]
- Schefe, J.H.; Lehmann, K.E.; Buschmann, I.R.; Unger, T.; Funke-Kaiser, H. Quantitative real-time RT-PCR data analysis: Current concepts and the novel “gene expression’s CT difference” formula. J. Mol. Med. 2006, 84, 901–910. [Google Scholar] [CrossRef] [PubMed]
- Crockett, J.C.; Rogers, M.J.; Coxon, F.P.; Hocking, L.J.; Helfrich, M.H. Bone remodelling at a glance. J. Cell Sci. 2011, 124, 991–998. [Google Scholar] [CrossRef] [PubMed]
- Franceschi, R.T.; Ge, C.; Xiao, G.; Roca, H.; Jiang, D. Transcriptional regulation of osteoblasts. Cells Tissues Organs 2009, 189, 144–152. [Google Scholar] [CrossRef] [PubMed]
- Komori, T. Regulation of osteoblast differentiation by transcription factors. J. Cell. Biochem. 2006, 99, 1233–1239. [Google Scholar] [CrossRef] [PubMed]
- Komori, T. Regulation of bone development and extracellular matrix protein genes by RUNX2. Cell Tissue Res. 2010, 339, 189–195. [Google Scholar] [CrossRef] [PubMed]
- Niyibizi, C.; Eyre, D.R. Bone type V collagen: Chain composition and location of a trypsin cleavage site. Connect. Tissue Res. 1989, 20, 247–250. [Google Scholar] [CrossRef] [PubMed]
- Rho, J.Y.; Kuhn-Spearing, L.; Zioupos, P. Mechanical properties and the hierarchical structure of bone. Med. Eng. Phys. 1998, 20, 92–102. [Google Scholar] [CrossRef]
- Marom, R.; Shur, I.; Solomon, R.; Benayahu, D. Characterization of adhesion and differentiation markers of osteogenic marrow stromal cells. J. Cell. Physiol. 2005, 202, 41–48. [Google Scholar] [CrossRef] [PubMed]
- Maruyama, Z.; Yoshida, C.A.; Furuichi, T.; Amizuka, N.; Ito, M.; Fukuyama, R.; Miyazaki, T.; Kitaura, H.; Nakamura, K.; Fujita, T.; et al. RUNX2 determines bone maturity and turnover rate in postnatal bone development and is involved in bone loss in estrogen deficiency. Dev. Dyn. 2007, 236, 1876–1890. [Google Scholar] [CrossRef] [PubMed]
- Aubin, J.E. Regulation of osteoblast formation and function. Rev. Endocr. Metab. Disord. 2001, 2, 81–94. [Google Scholar] [CrossRef] [PubMed]
- Liu, F.; Malaval, L.; Aubin, J.E. Global amplification polymerase chain reaction reveals novel transitional stages during osteoprogenitor differentiation. J. Cell Sci. 2003, 116, 1787–1796. [Google Scholar] [CrossRef] [PubMed]
- Gross, T.S.; King, K.A.; Rabaia, N.A.; Pathare, P.; Srinivasan, S. Upregulation of osteopontin by osteocytes deprived of mechanical loading or oxygen. J. Bone Miner. Res. 2005, 20, 250–256. [Google Scholar] [CrossRef] [PubMed]
- Millán, J.L. Chapter 9—alkaline phosphatases. In Dynamics of bone and cartilage metabolism, 2nd ed.; Seibel, M.J., Robins, S.P., Bilezikian, J.P., Eds.; Academic Press: Burlington, MA, USA, 2006; pp. 153–164. [Google Scholar]
- Kitazawa, R.; Mori, K.; Yamaguchi, A.; Kondo, T.; Kitazawa, S. Modulation of mouse RANKL gene expression by Runx2 and vitamin D3. J. Cell. Biochem. 2008, 105, 1289–1297. [Google Scholar] [CrossRef] [PubMed]
- Kawana, F.; Sasaki, T. Osteoclast differentiation and characteristic trabecular bone formation during growth plate destruction in osteoprotegerin-deficient mice. J. Electron. Microsc. 2003, 52, 515–525. [Google Scholar] [CrossRef]
- Lidington, E.A.; Moyes, D.L.; McCormack, A.M.; Rose, M.L. A comparison of primary endothelial cells and endothelial cell lines for studies of immune interactions. Transpl. Immunol. 1999, 7, 239–246. [Google Scholar] [CrossRef]
- Pautke, C.; Schieker, M.; Tischer, T.; Kolk, A.; Neth, P.; Mutschler, W.; Milz, S. Characterization of osteosarcoma cell lines MG-63, Saos-2 and U-2 Os in comparison to human osteoblasts. Anticancer Res. 2004, 24, 3743–3748. [Google Scholar] [PubMed]
- Wang, X.F.; Zhang, Y.K.; Yu, Z.S.; Zhou, J.L. The role of the serum RANKL/OPG ratio in the healing of intertrochanteric fractures in elderly patients. Mol. Med. Reports 2013, 7, 1169–1172. [Google Scholar]
- Van Tuyl, L.H.; Voskuyl, A.E.; Boers, M.; Geusens, P.; Landewe, R.B.; Dijkmans, B.A.; Lems, W.F. Baseline RANKL:OPG ratio and markers of bone and cartilage degradation predict annual radiological progression over 11 years in rheumatoid arthritis. Ann. Rheum. Dis. 2010, 69, 1623–1628. [Google Scholar] [CrossRef] [PubMed]

© 2016 by the authors; licensee MDPI, Basel, Switzerland. This article is an open access article distributed under the terms and conditions of the Creative Commons by Attribution (CC-BY) license (http://creativecommons.org/licenses/by/4.0/).