
Synthesis and Characterization of 4-Benzyloxybenzaldehyde-4-methyl-3-thiosemicarbazone (Containing Sulphur and Nitrogen Donor Atoms) and Its Cd(II) Complex

Abstract
:
1. Introduction
2. Experimental
2.1. Reagents
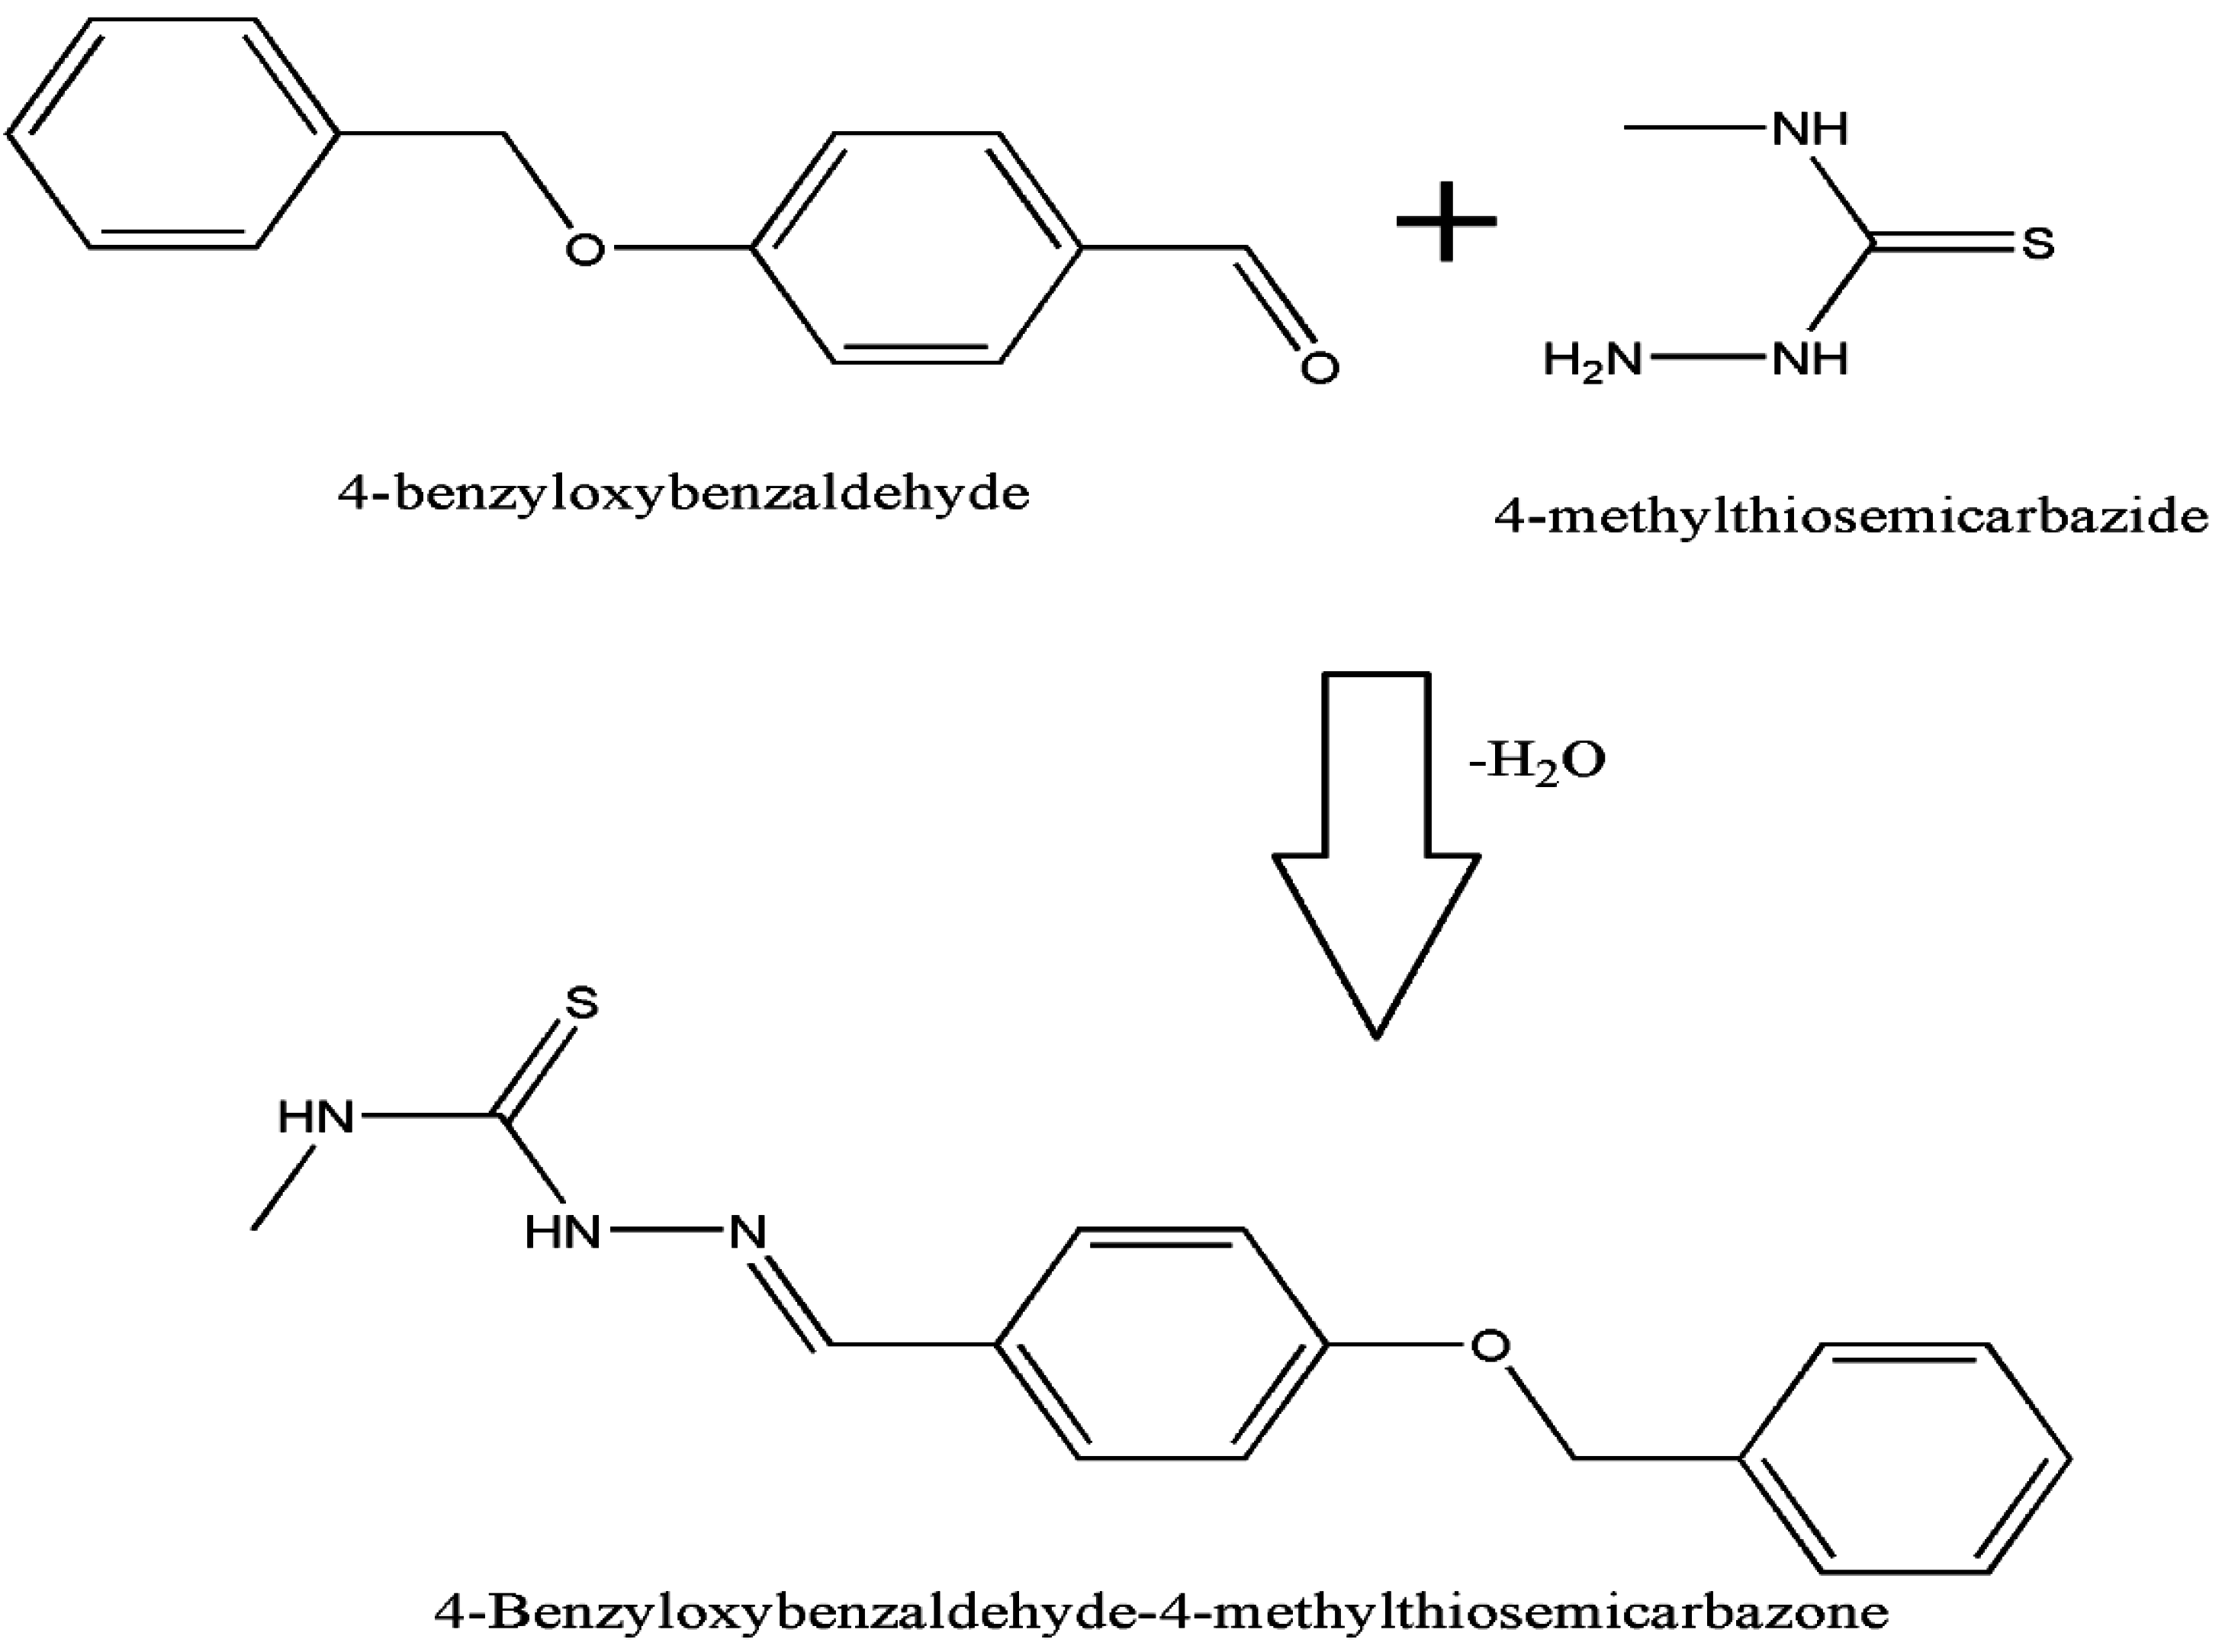
2.2. Synthesis of 4-Benzyloxybenzaldehyde-4-Methylthiosemicarbazone (BBMTSC)
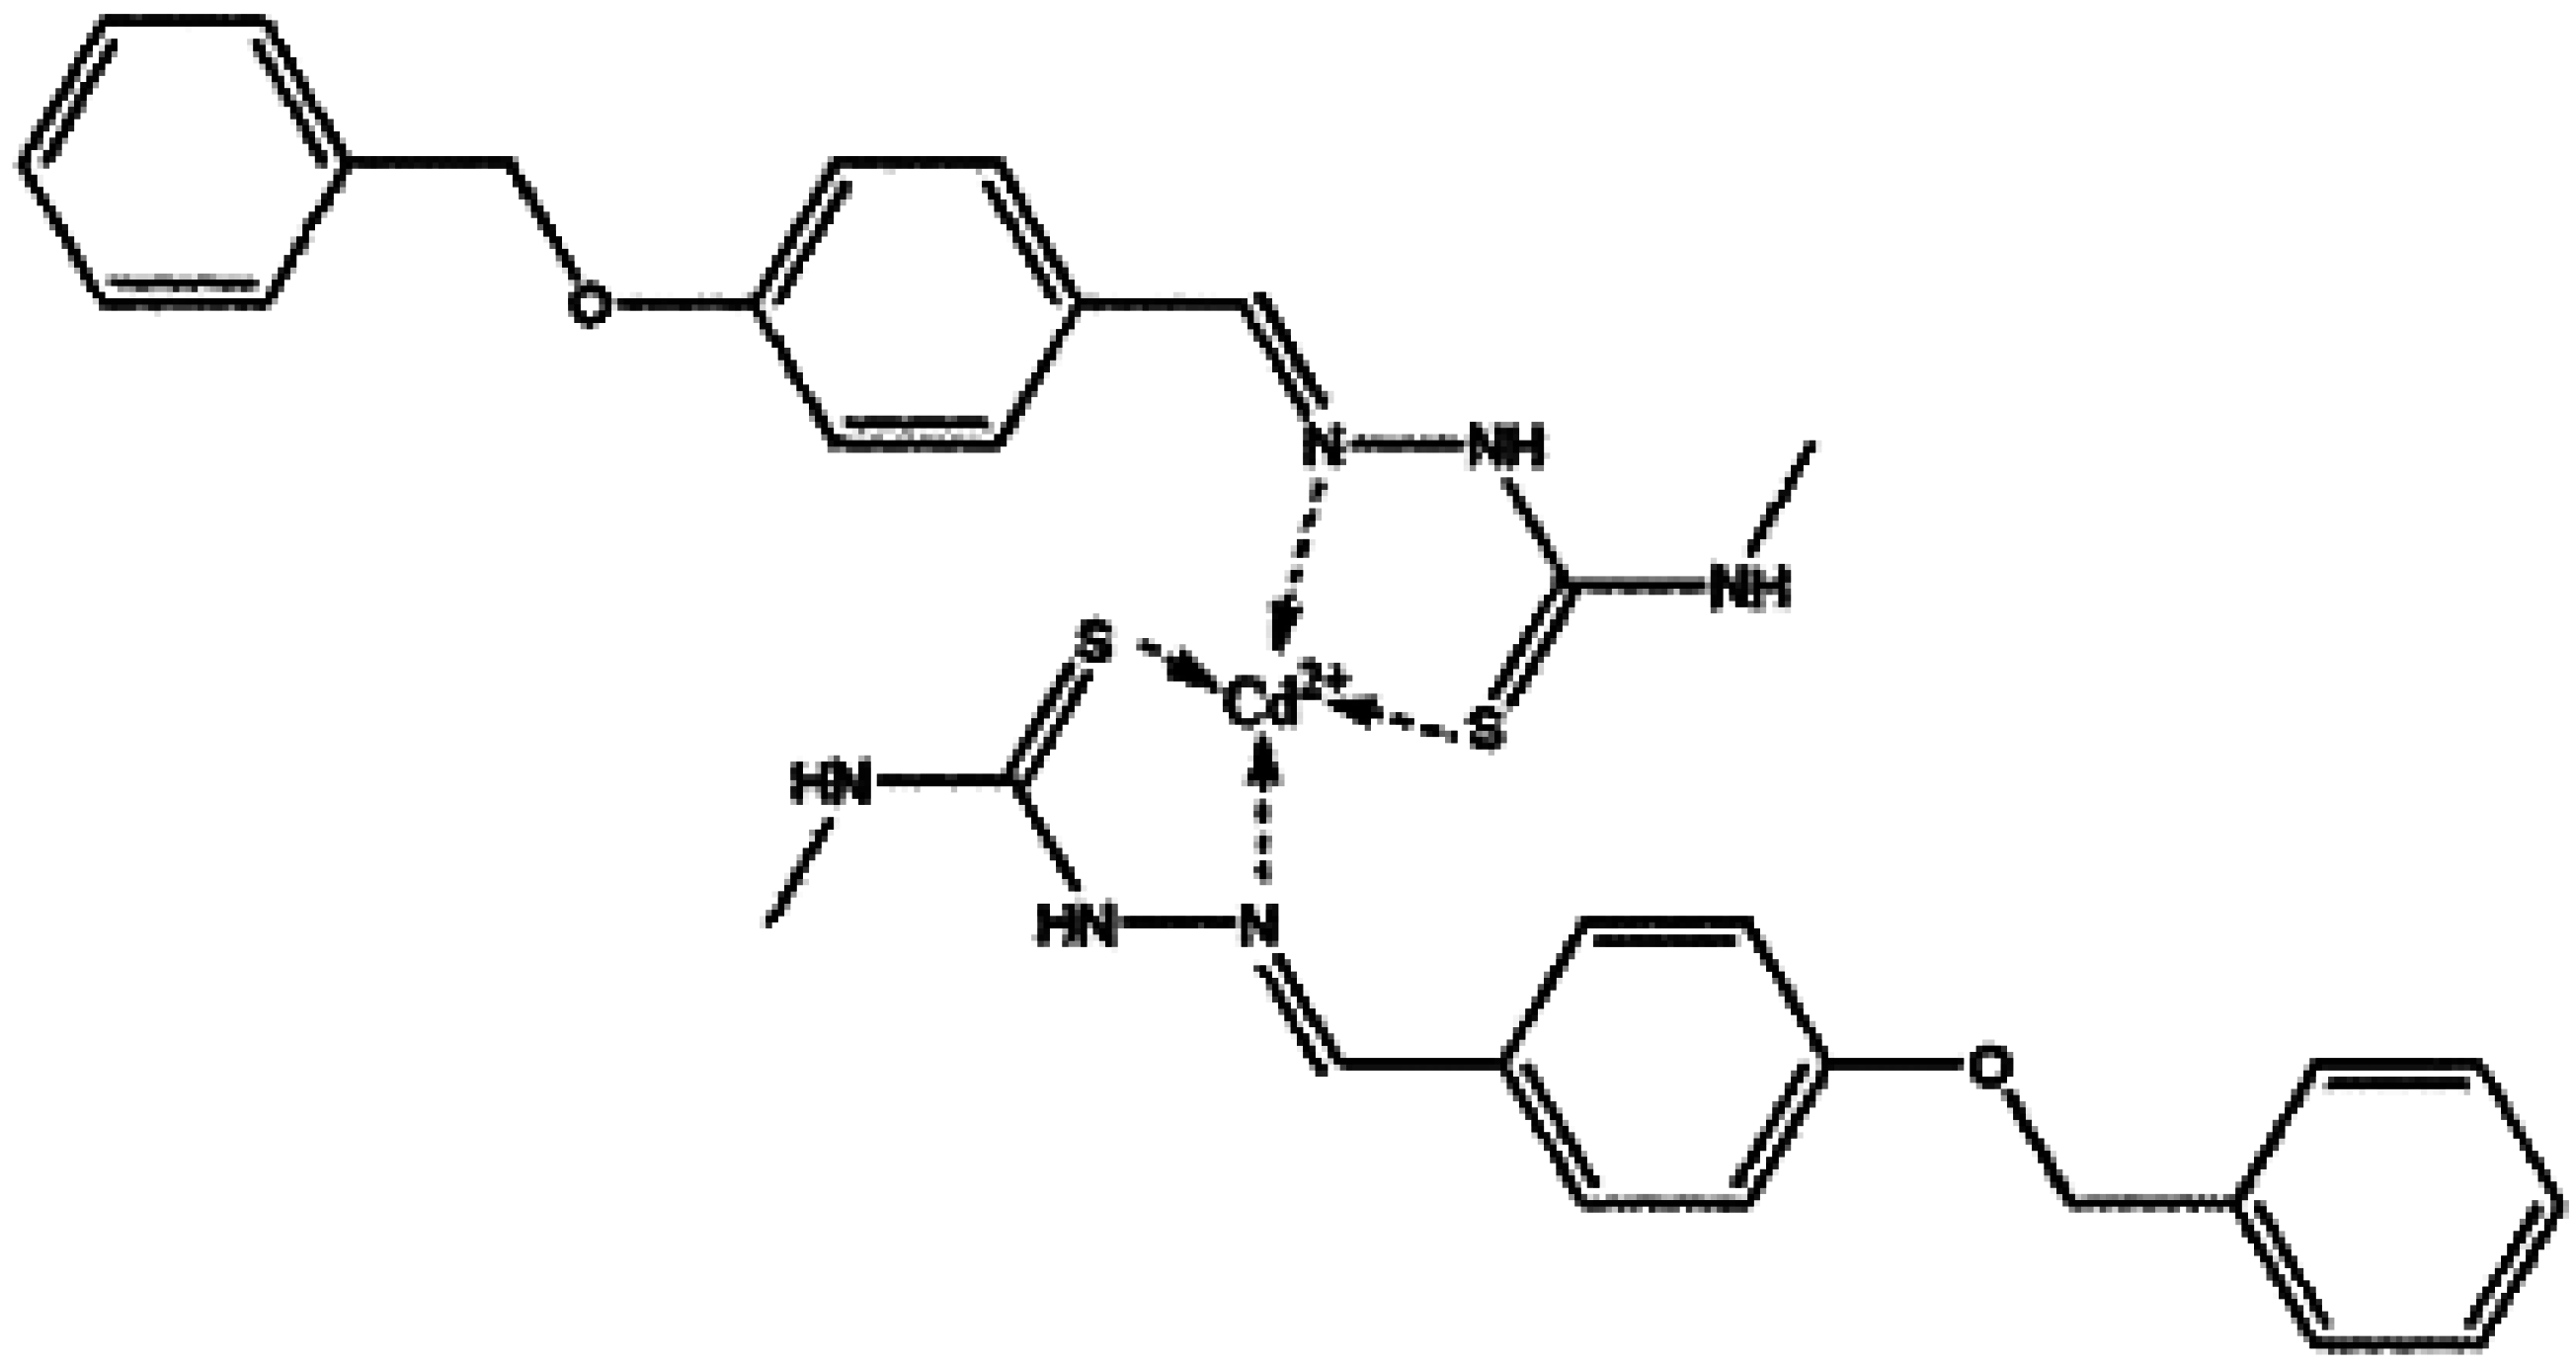
2.3. Preparation of the Cd(II)-4-Benzyloxybenzaldehyde-4-Methylthiosemicarbazone Complex
2.4. Characterization with Elemental Analysis, FT-IR, Mass Spectra, NMR, XRD and SEM
3. Results and Discussion
3.1. Characterization of BBMTSC and Its Cd Complex
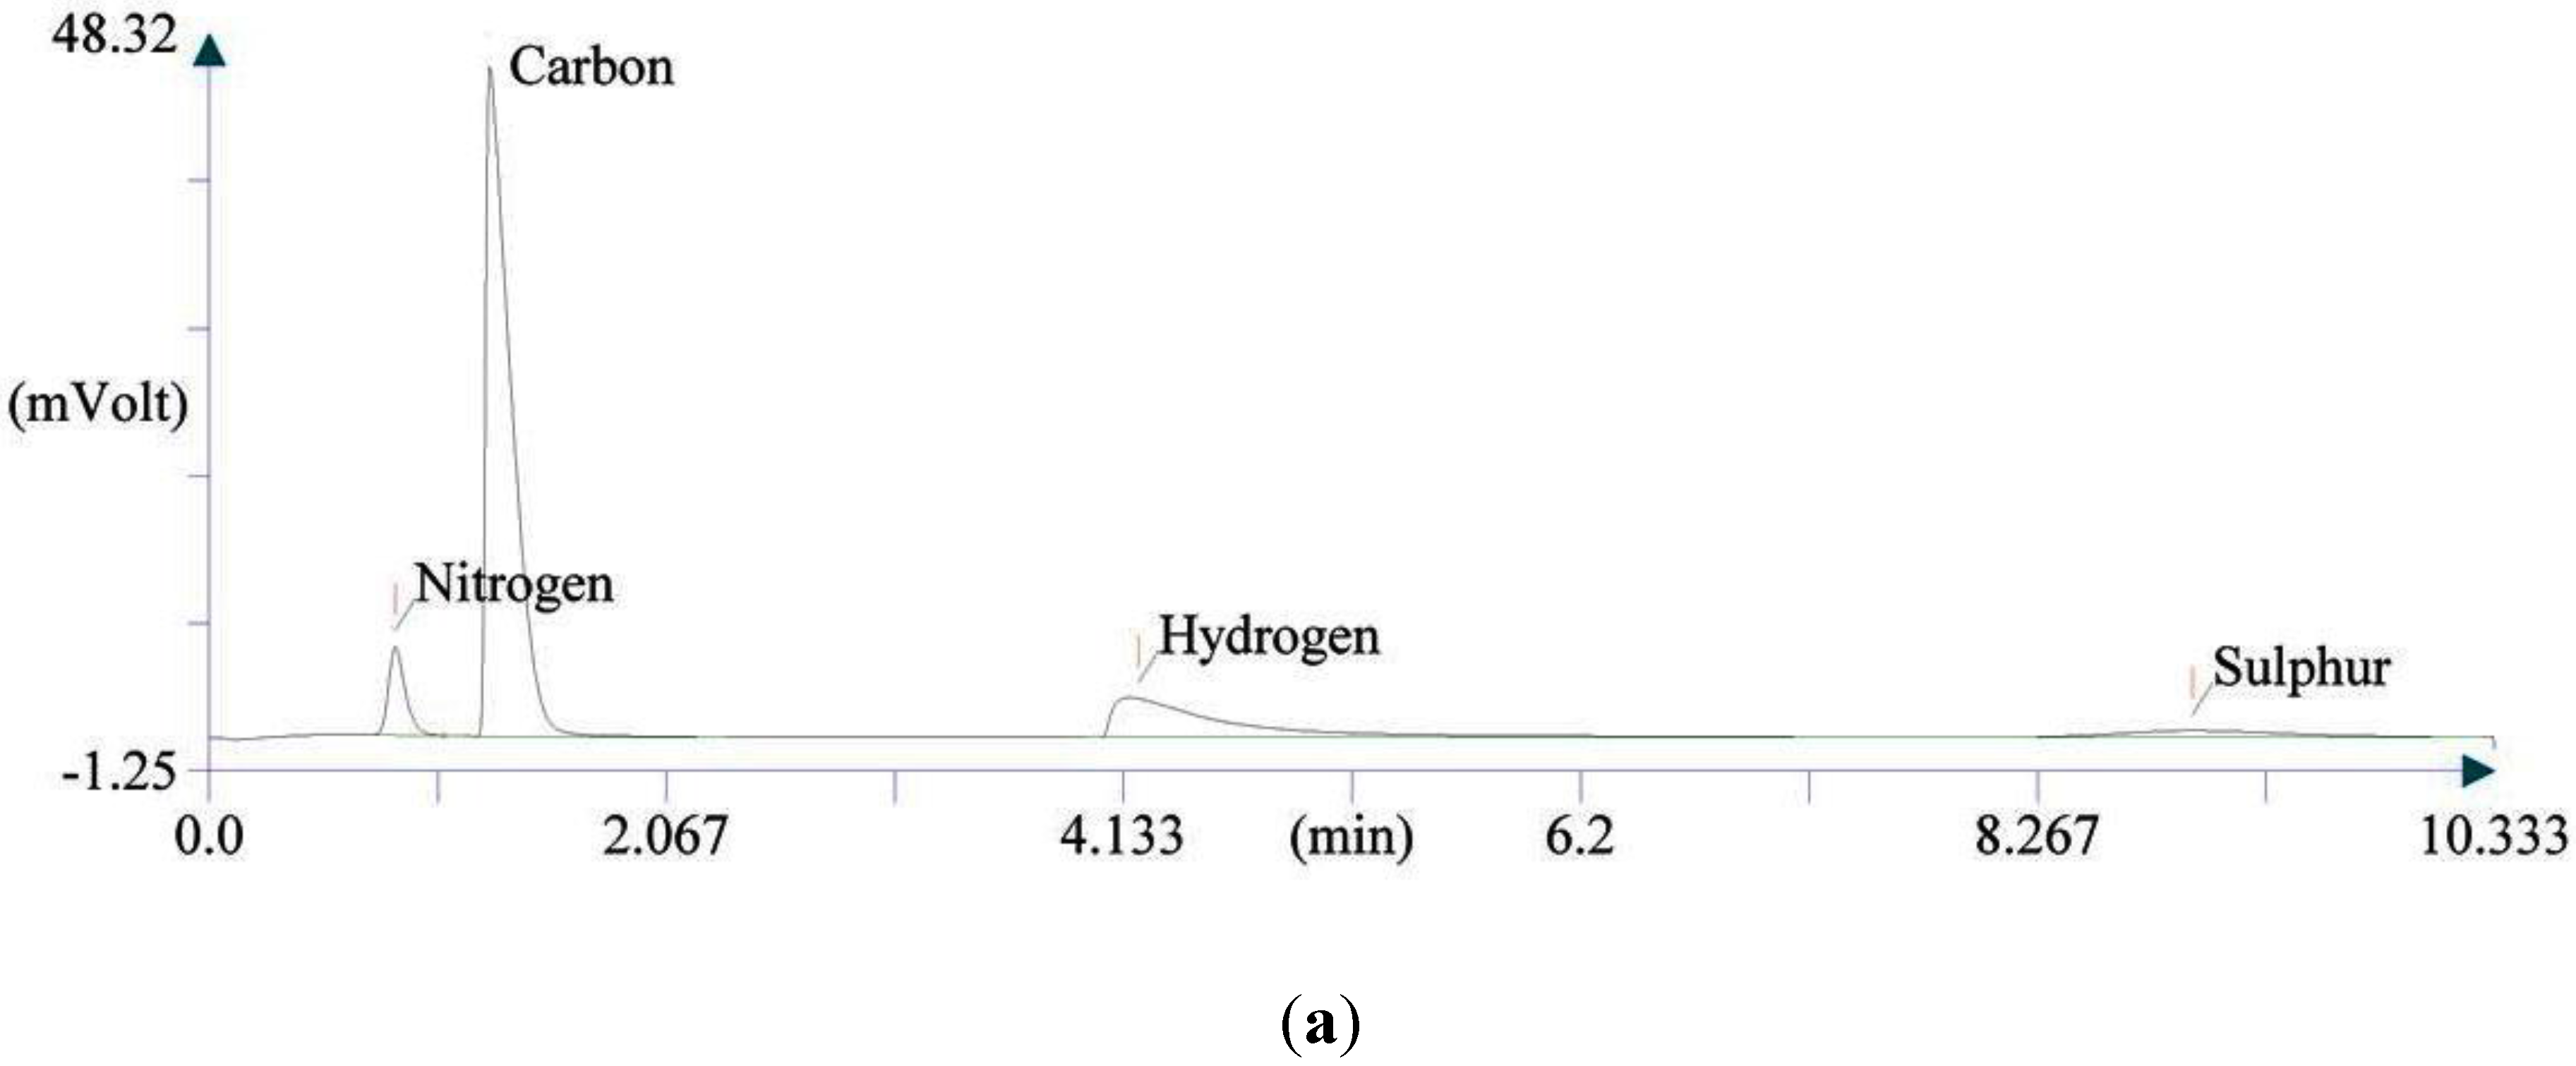
3.1.1. Elemental Analysis

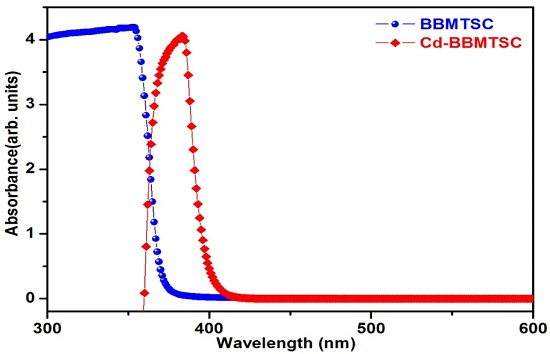
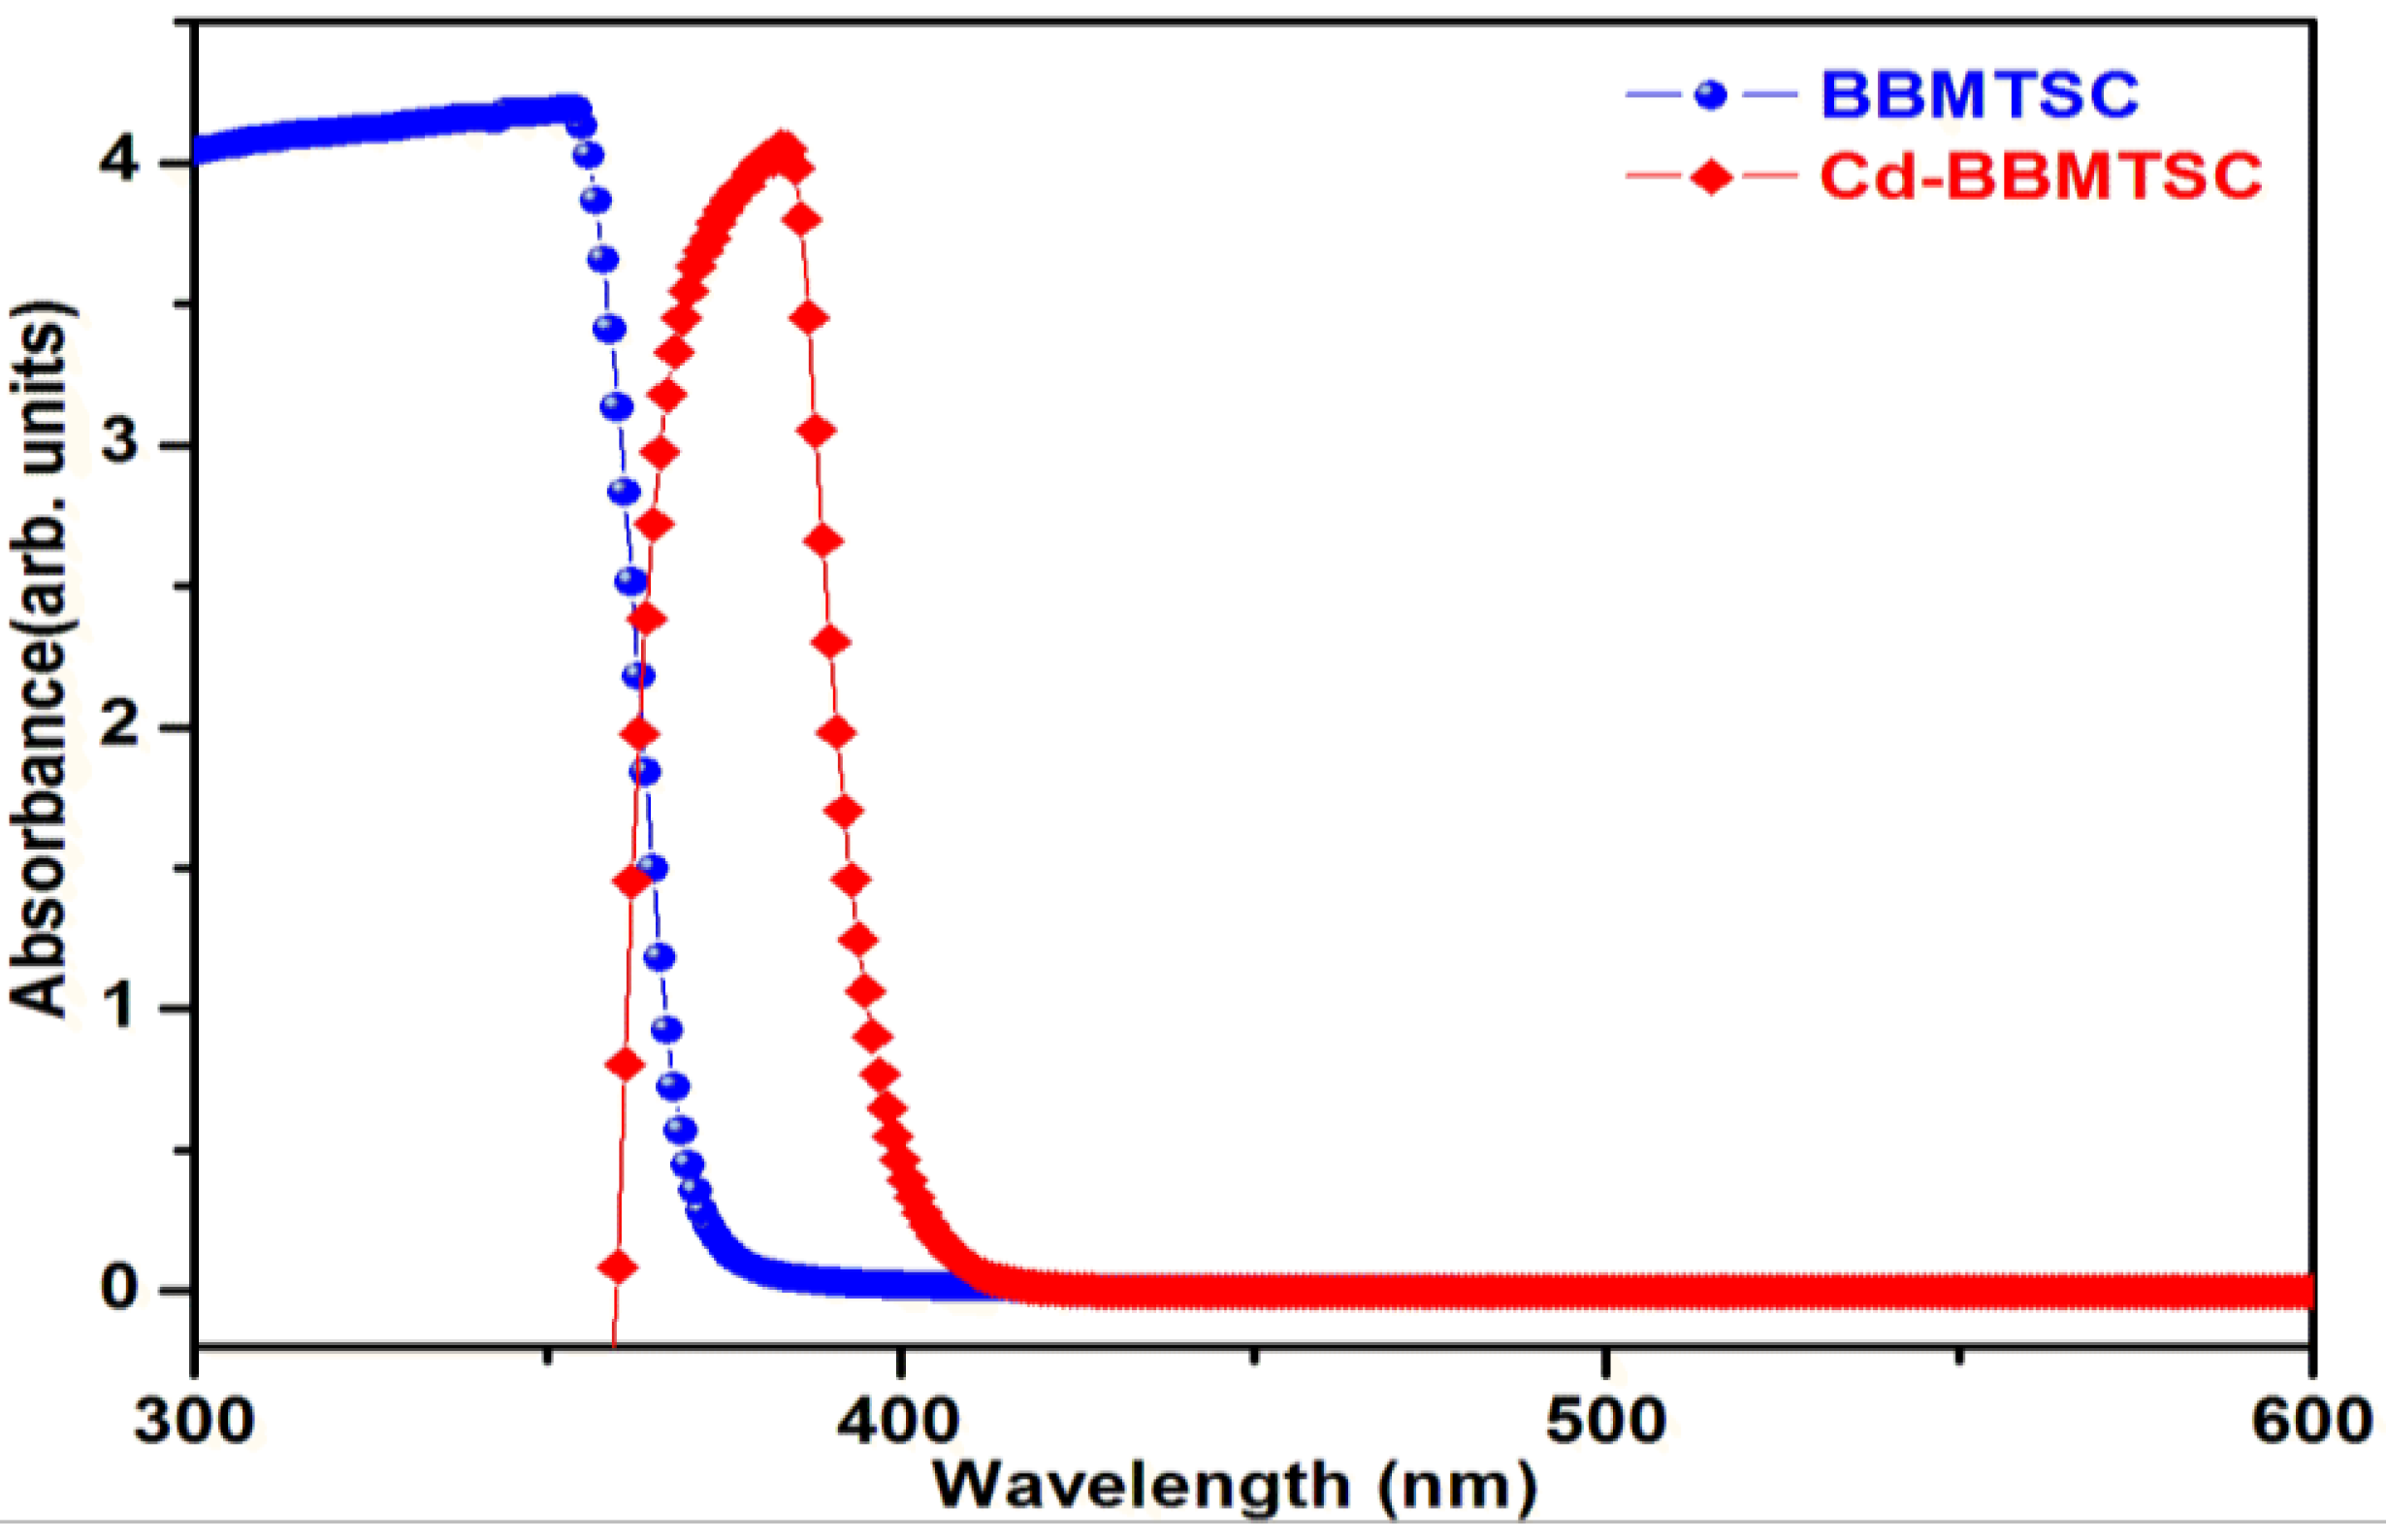
3.1.2. UV-Vis Absorption Spectra
3.1.3. FT-IR Analysis

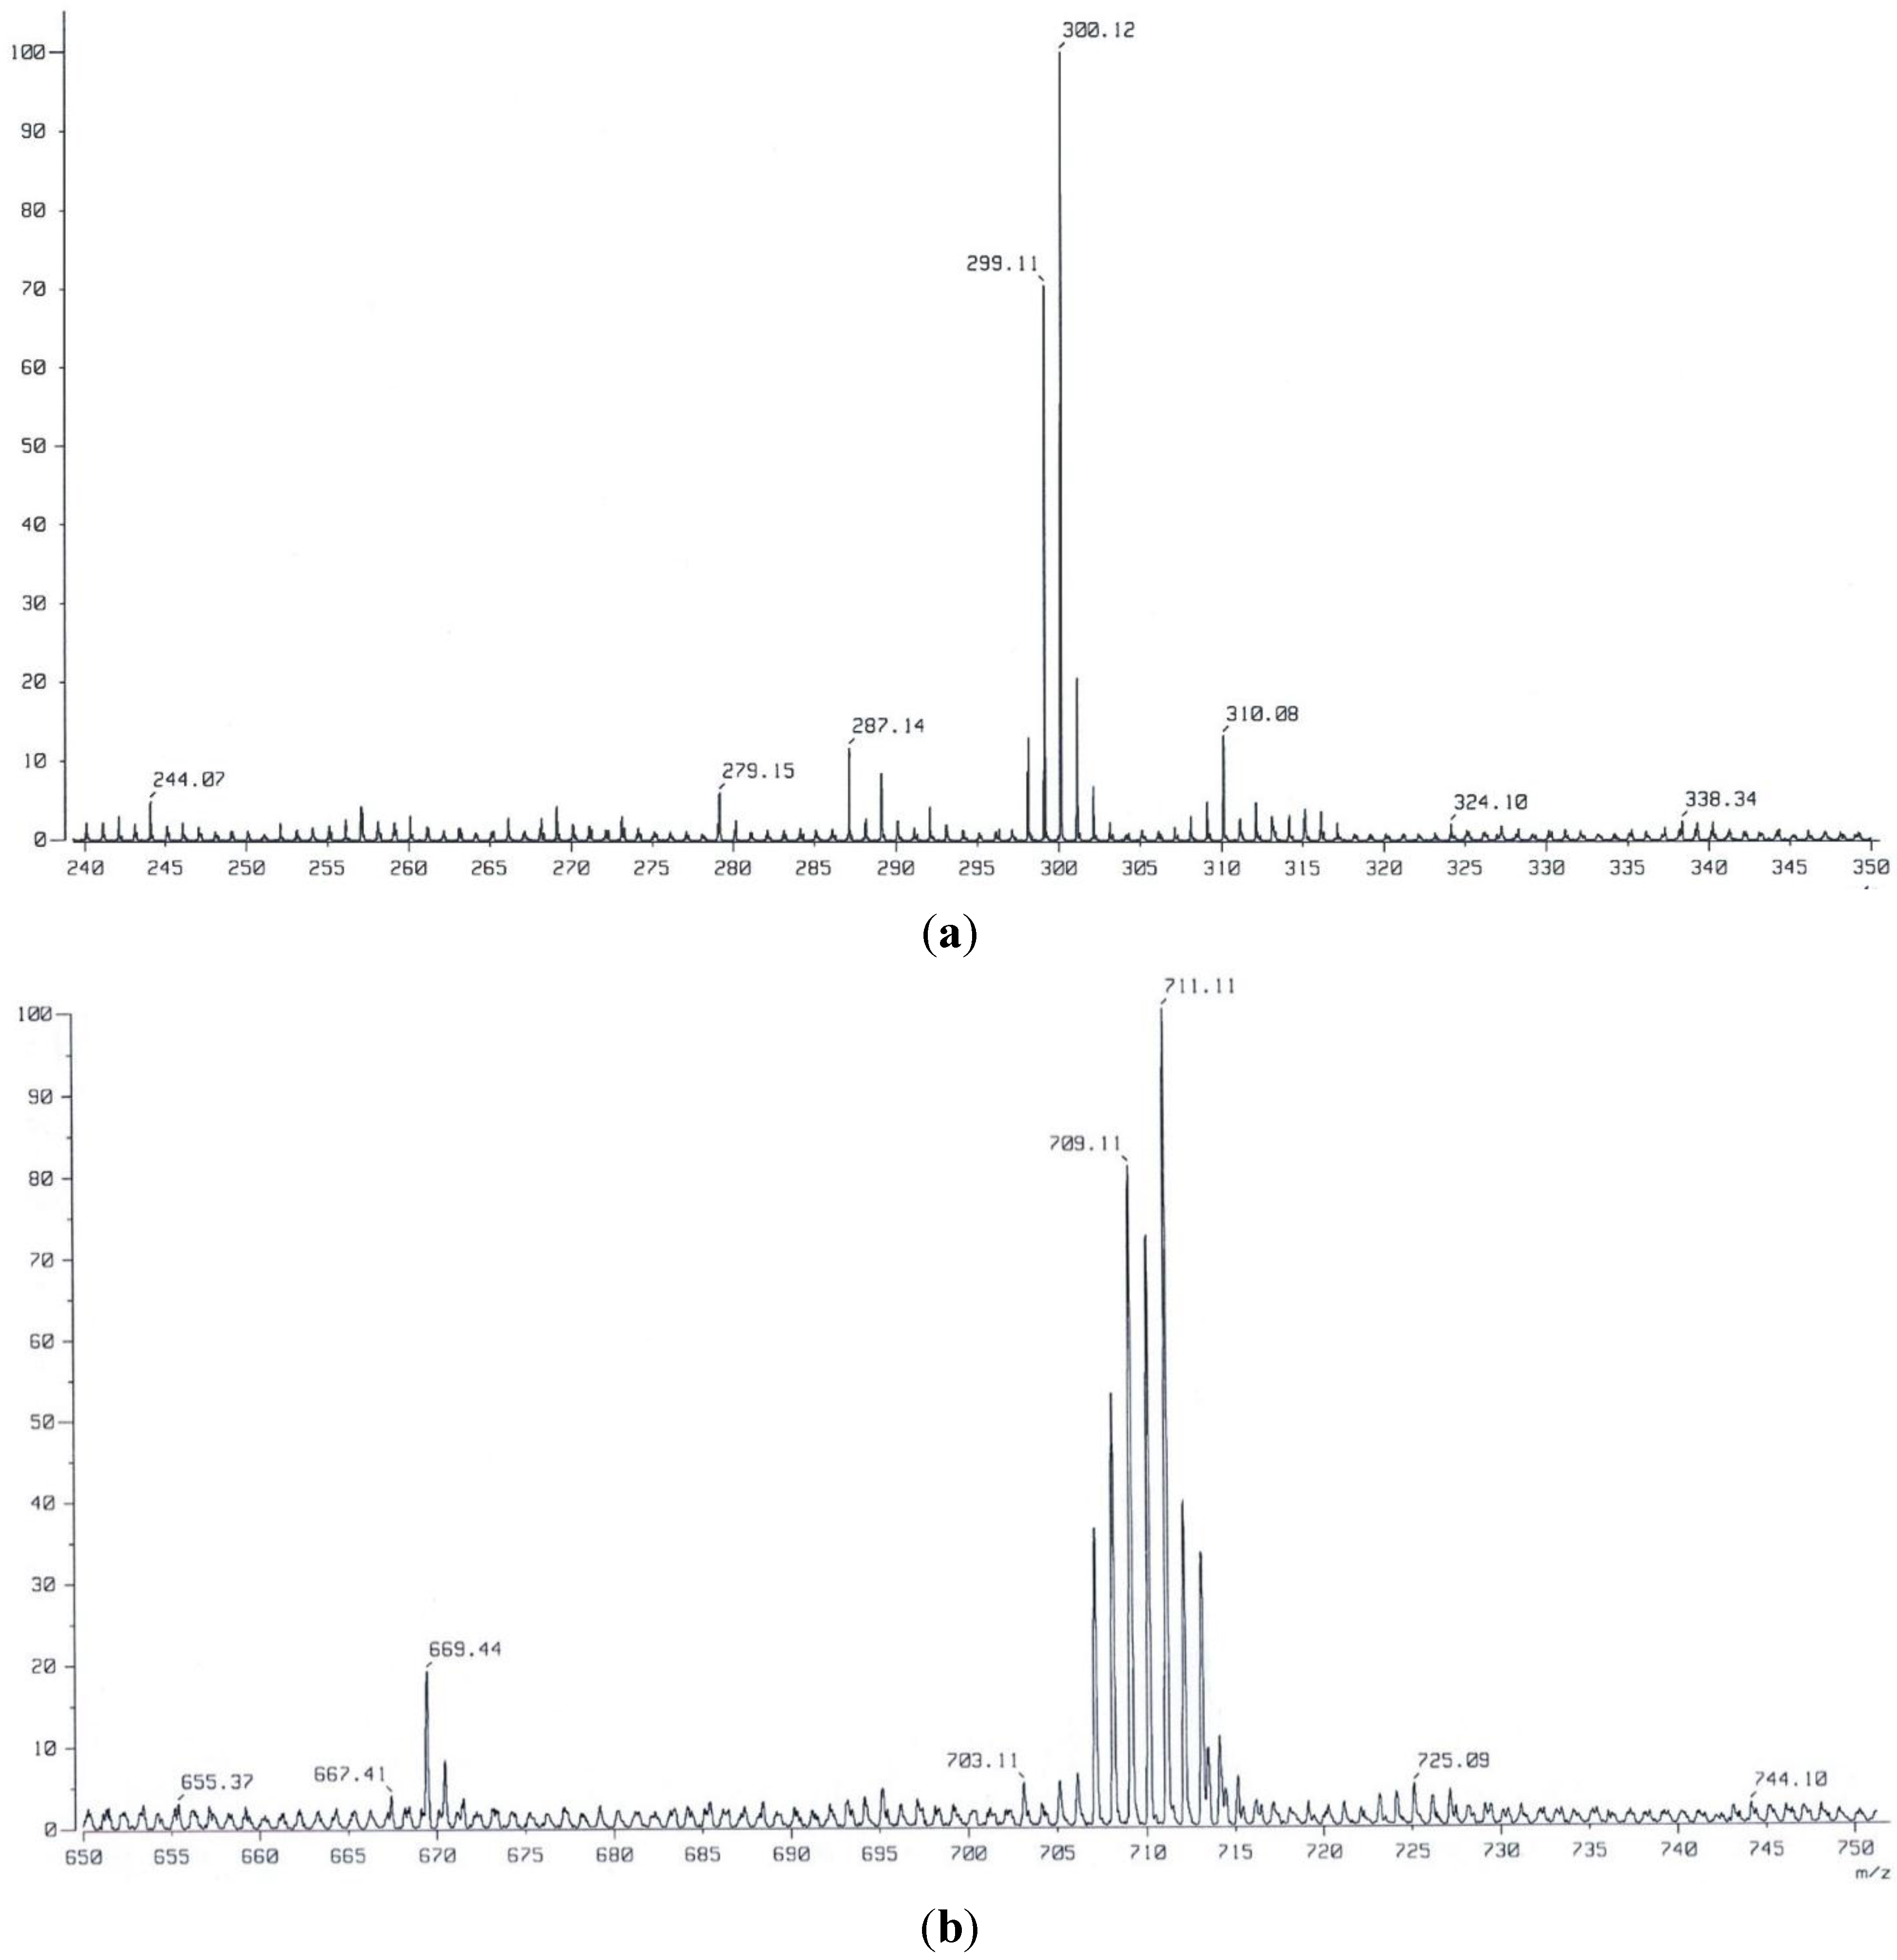
3.1.4. Mass Spectral Analysis

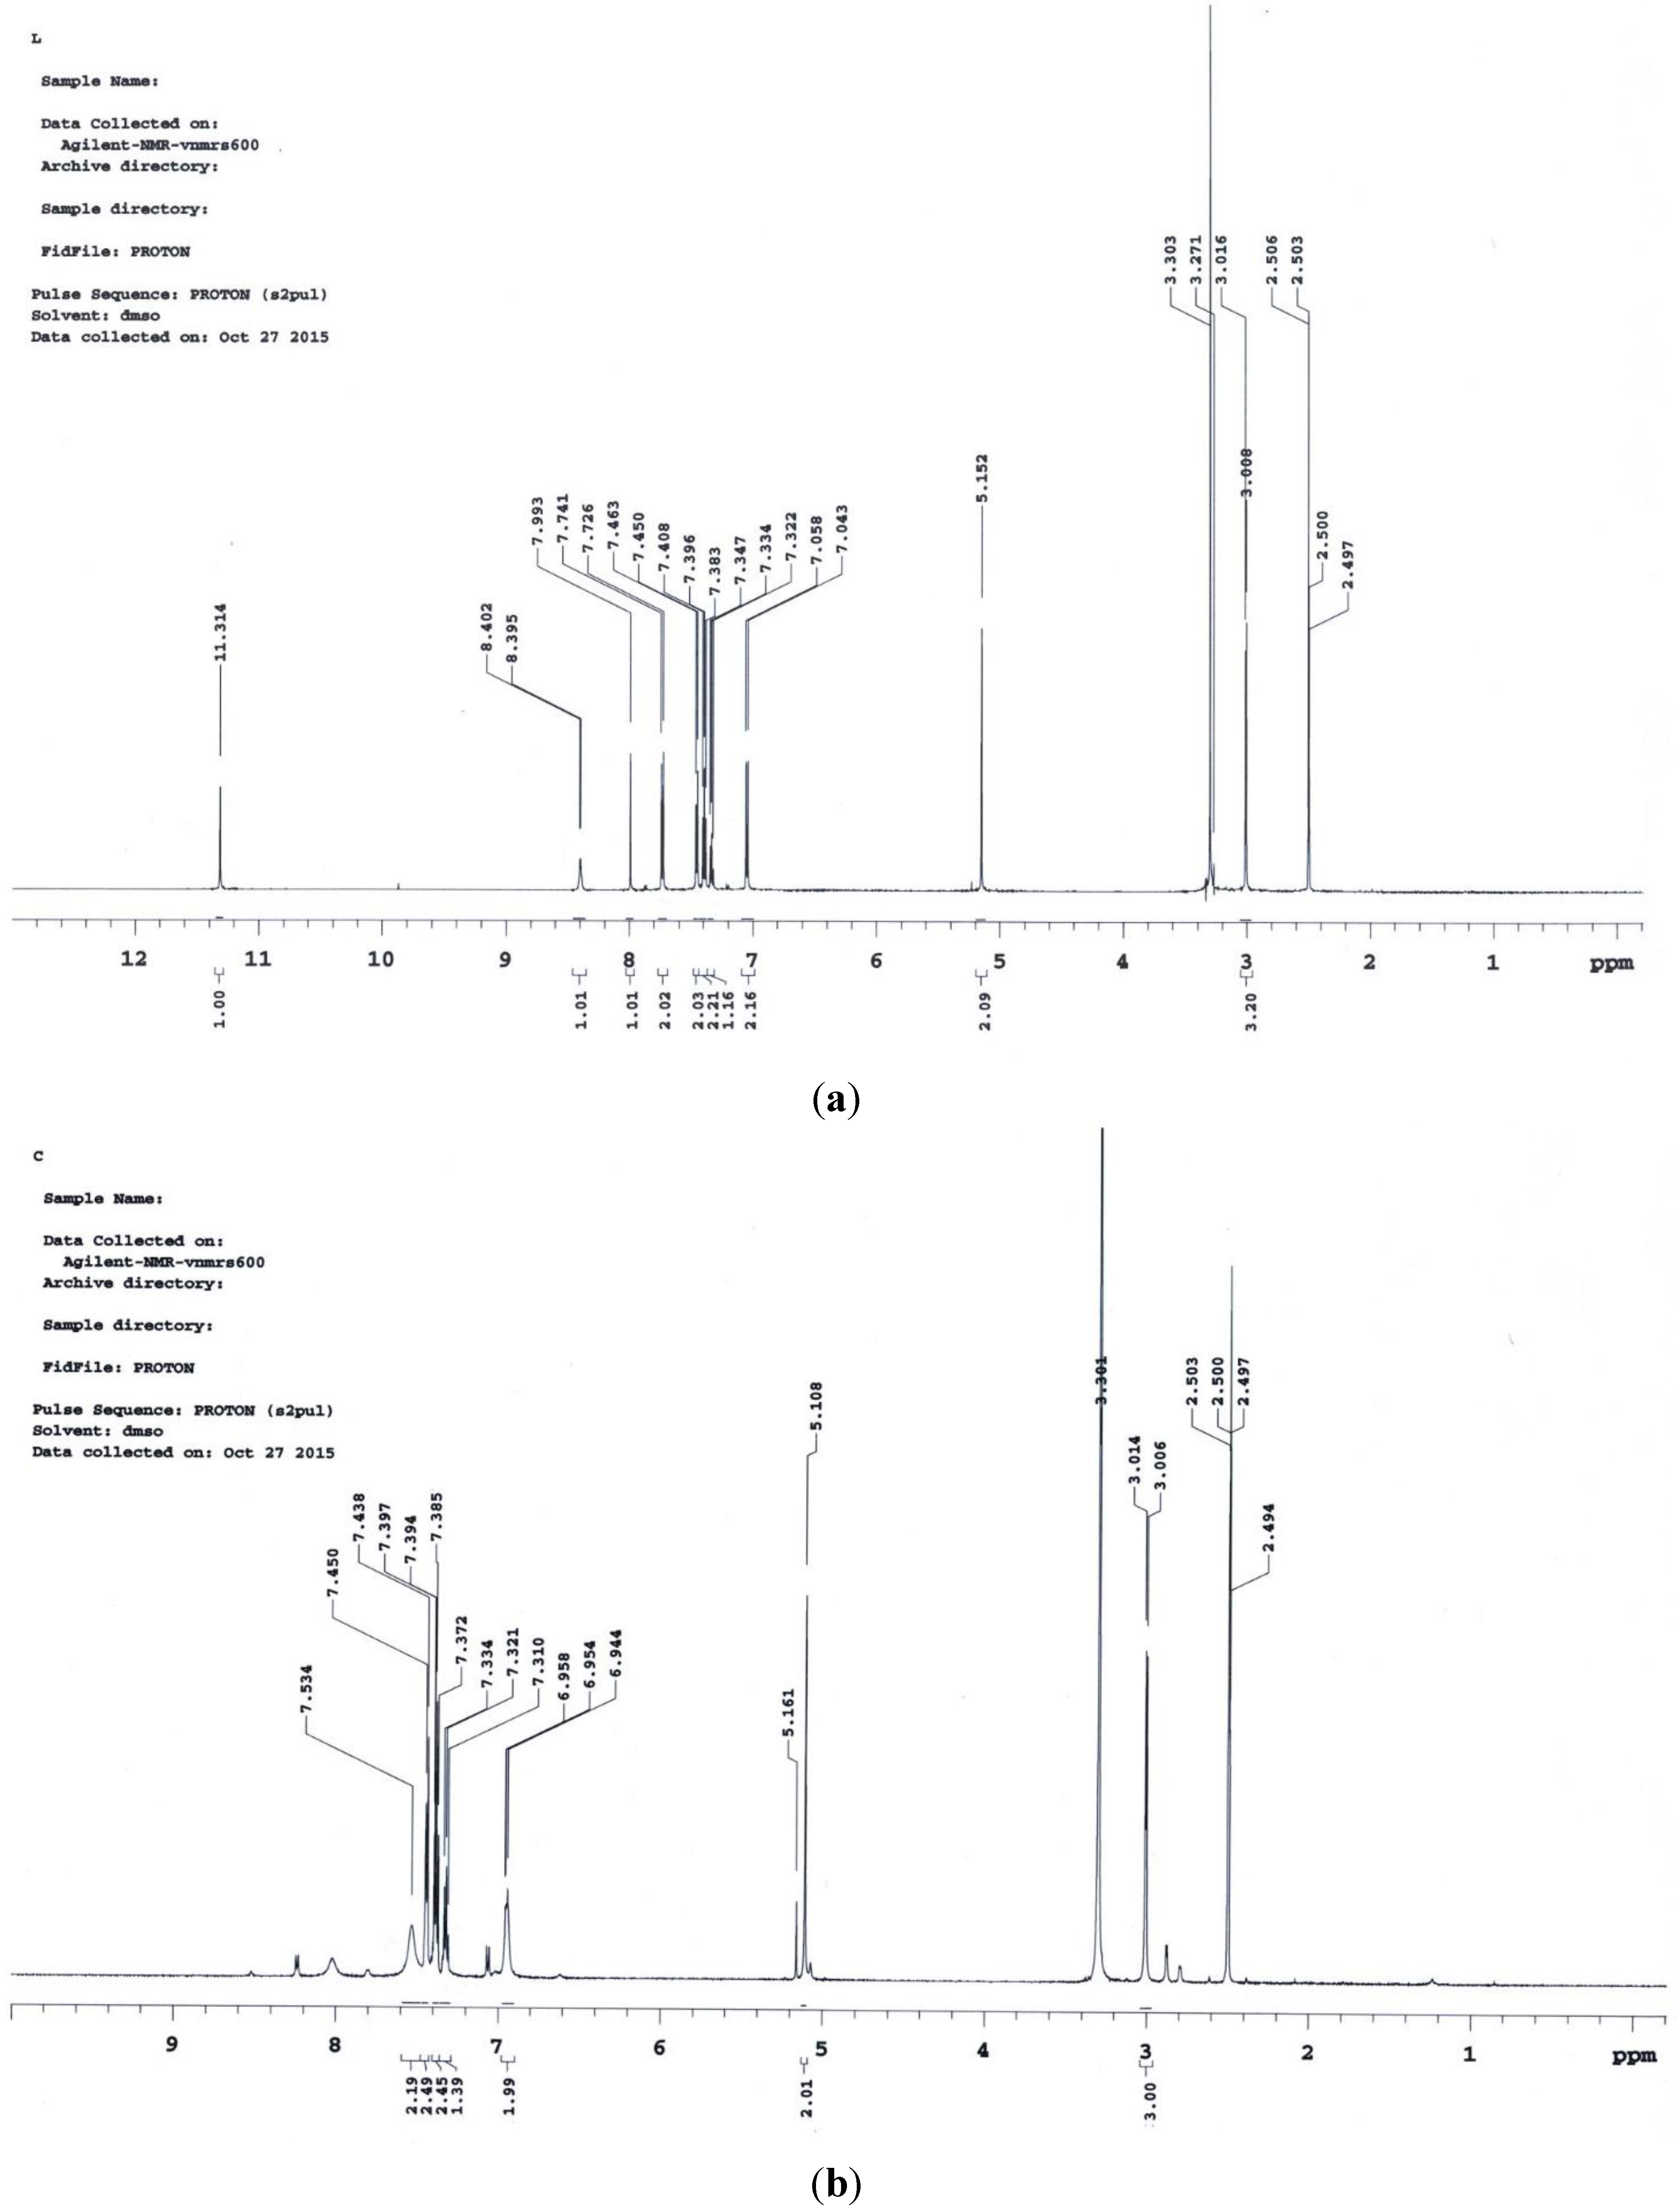
3.1.5. 1HNMR Spectral Analysis

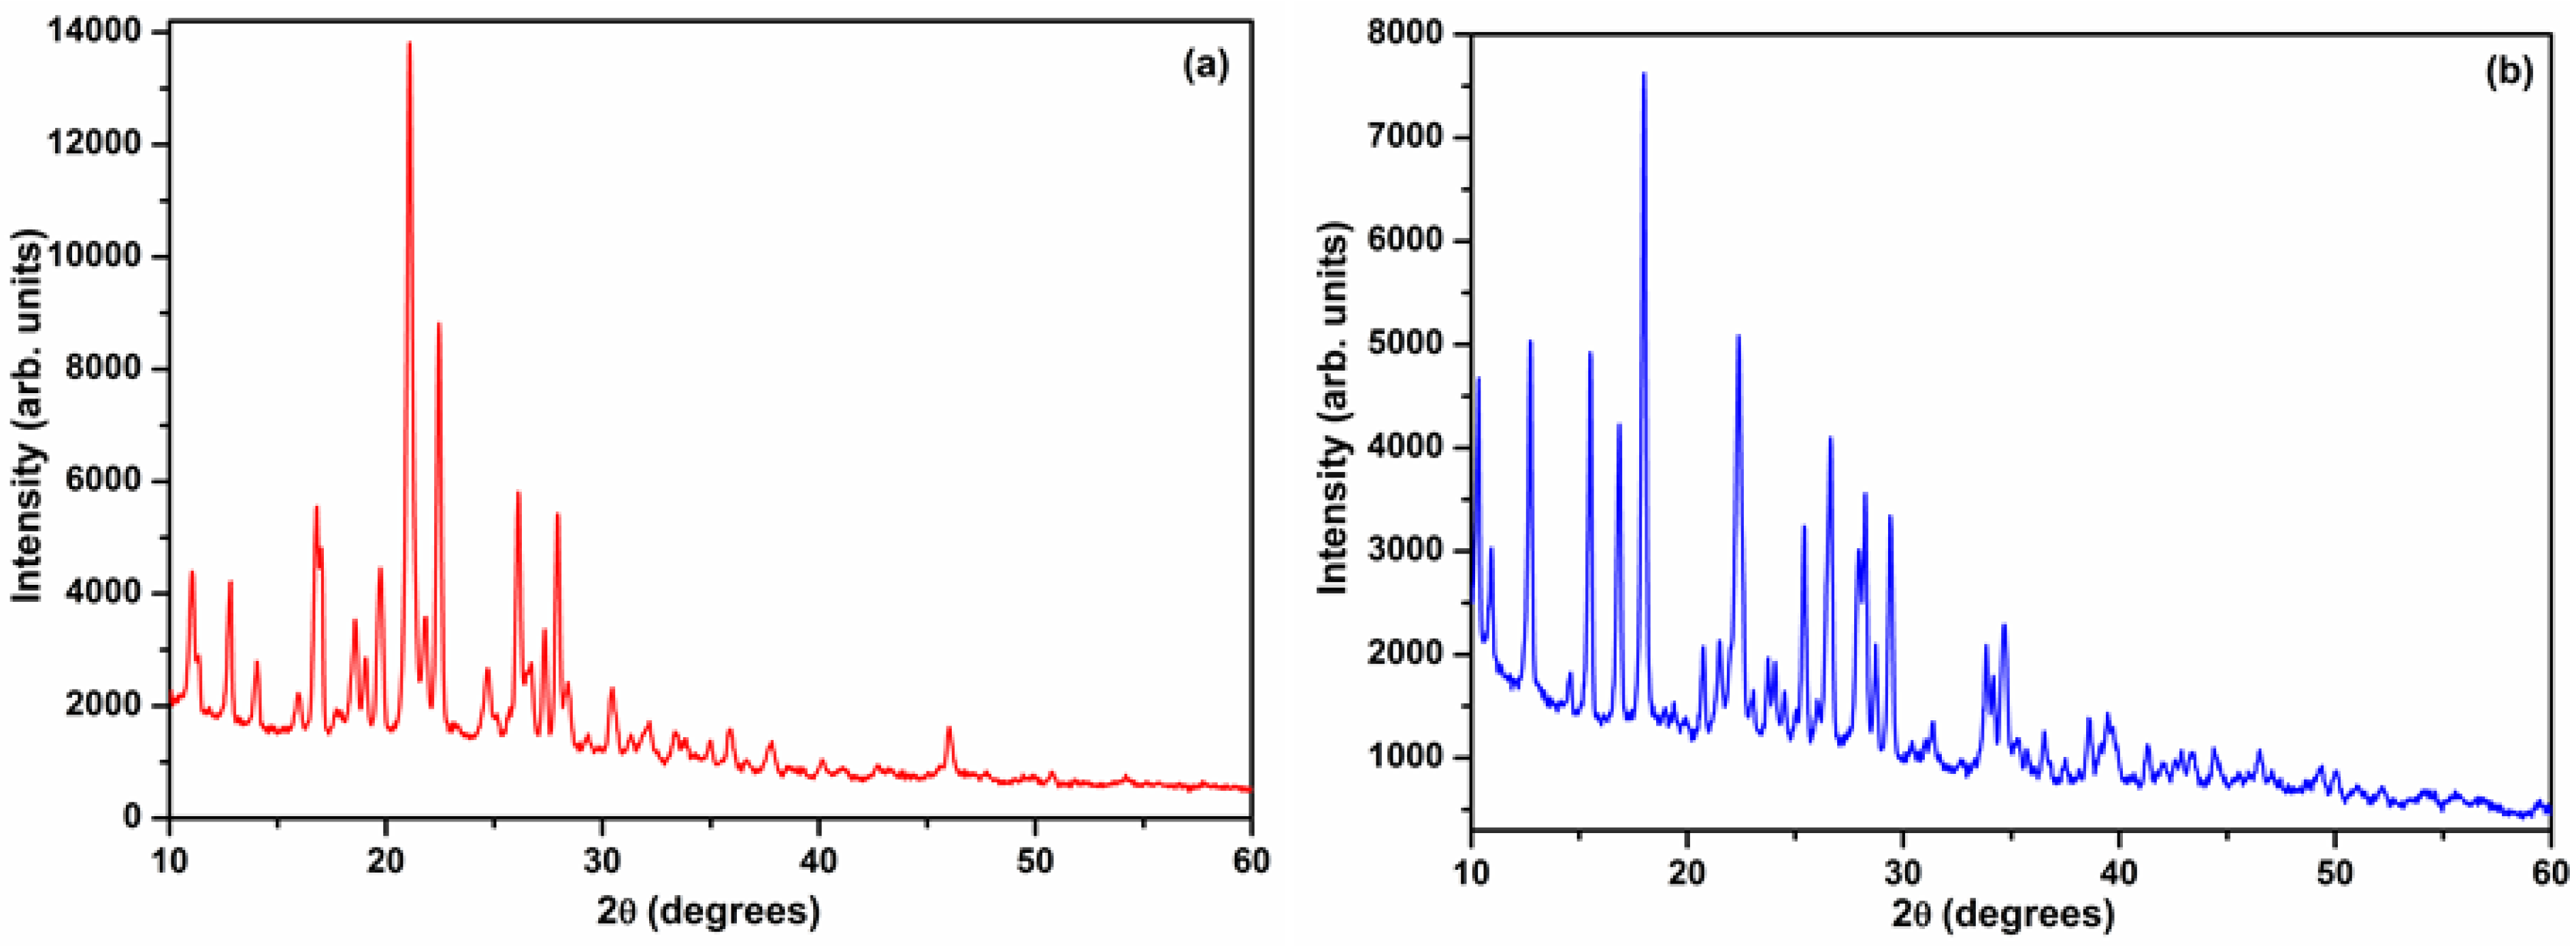
3.1.6. XRD Analysis
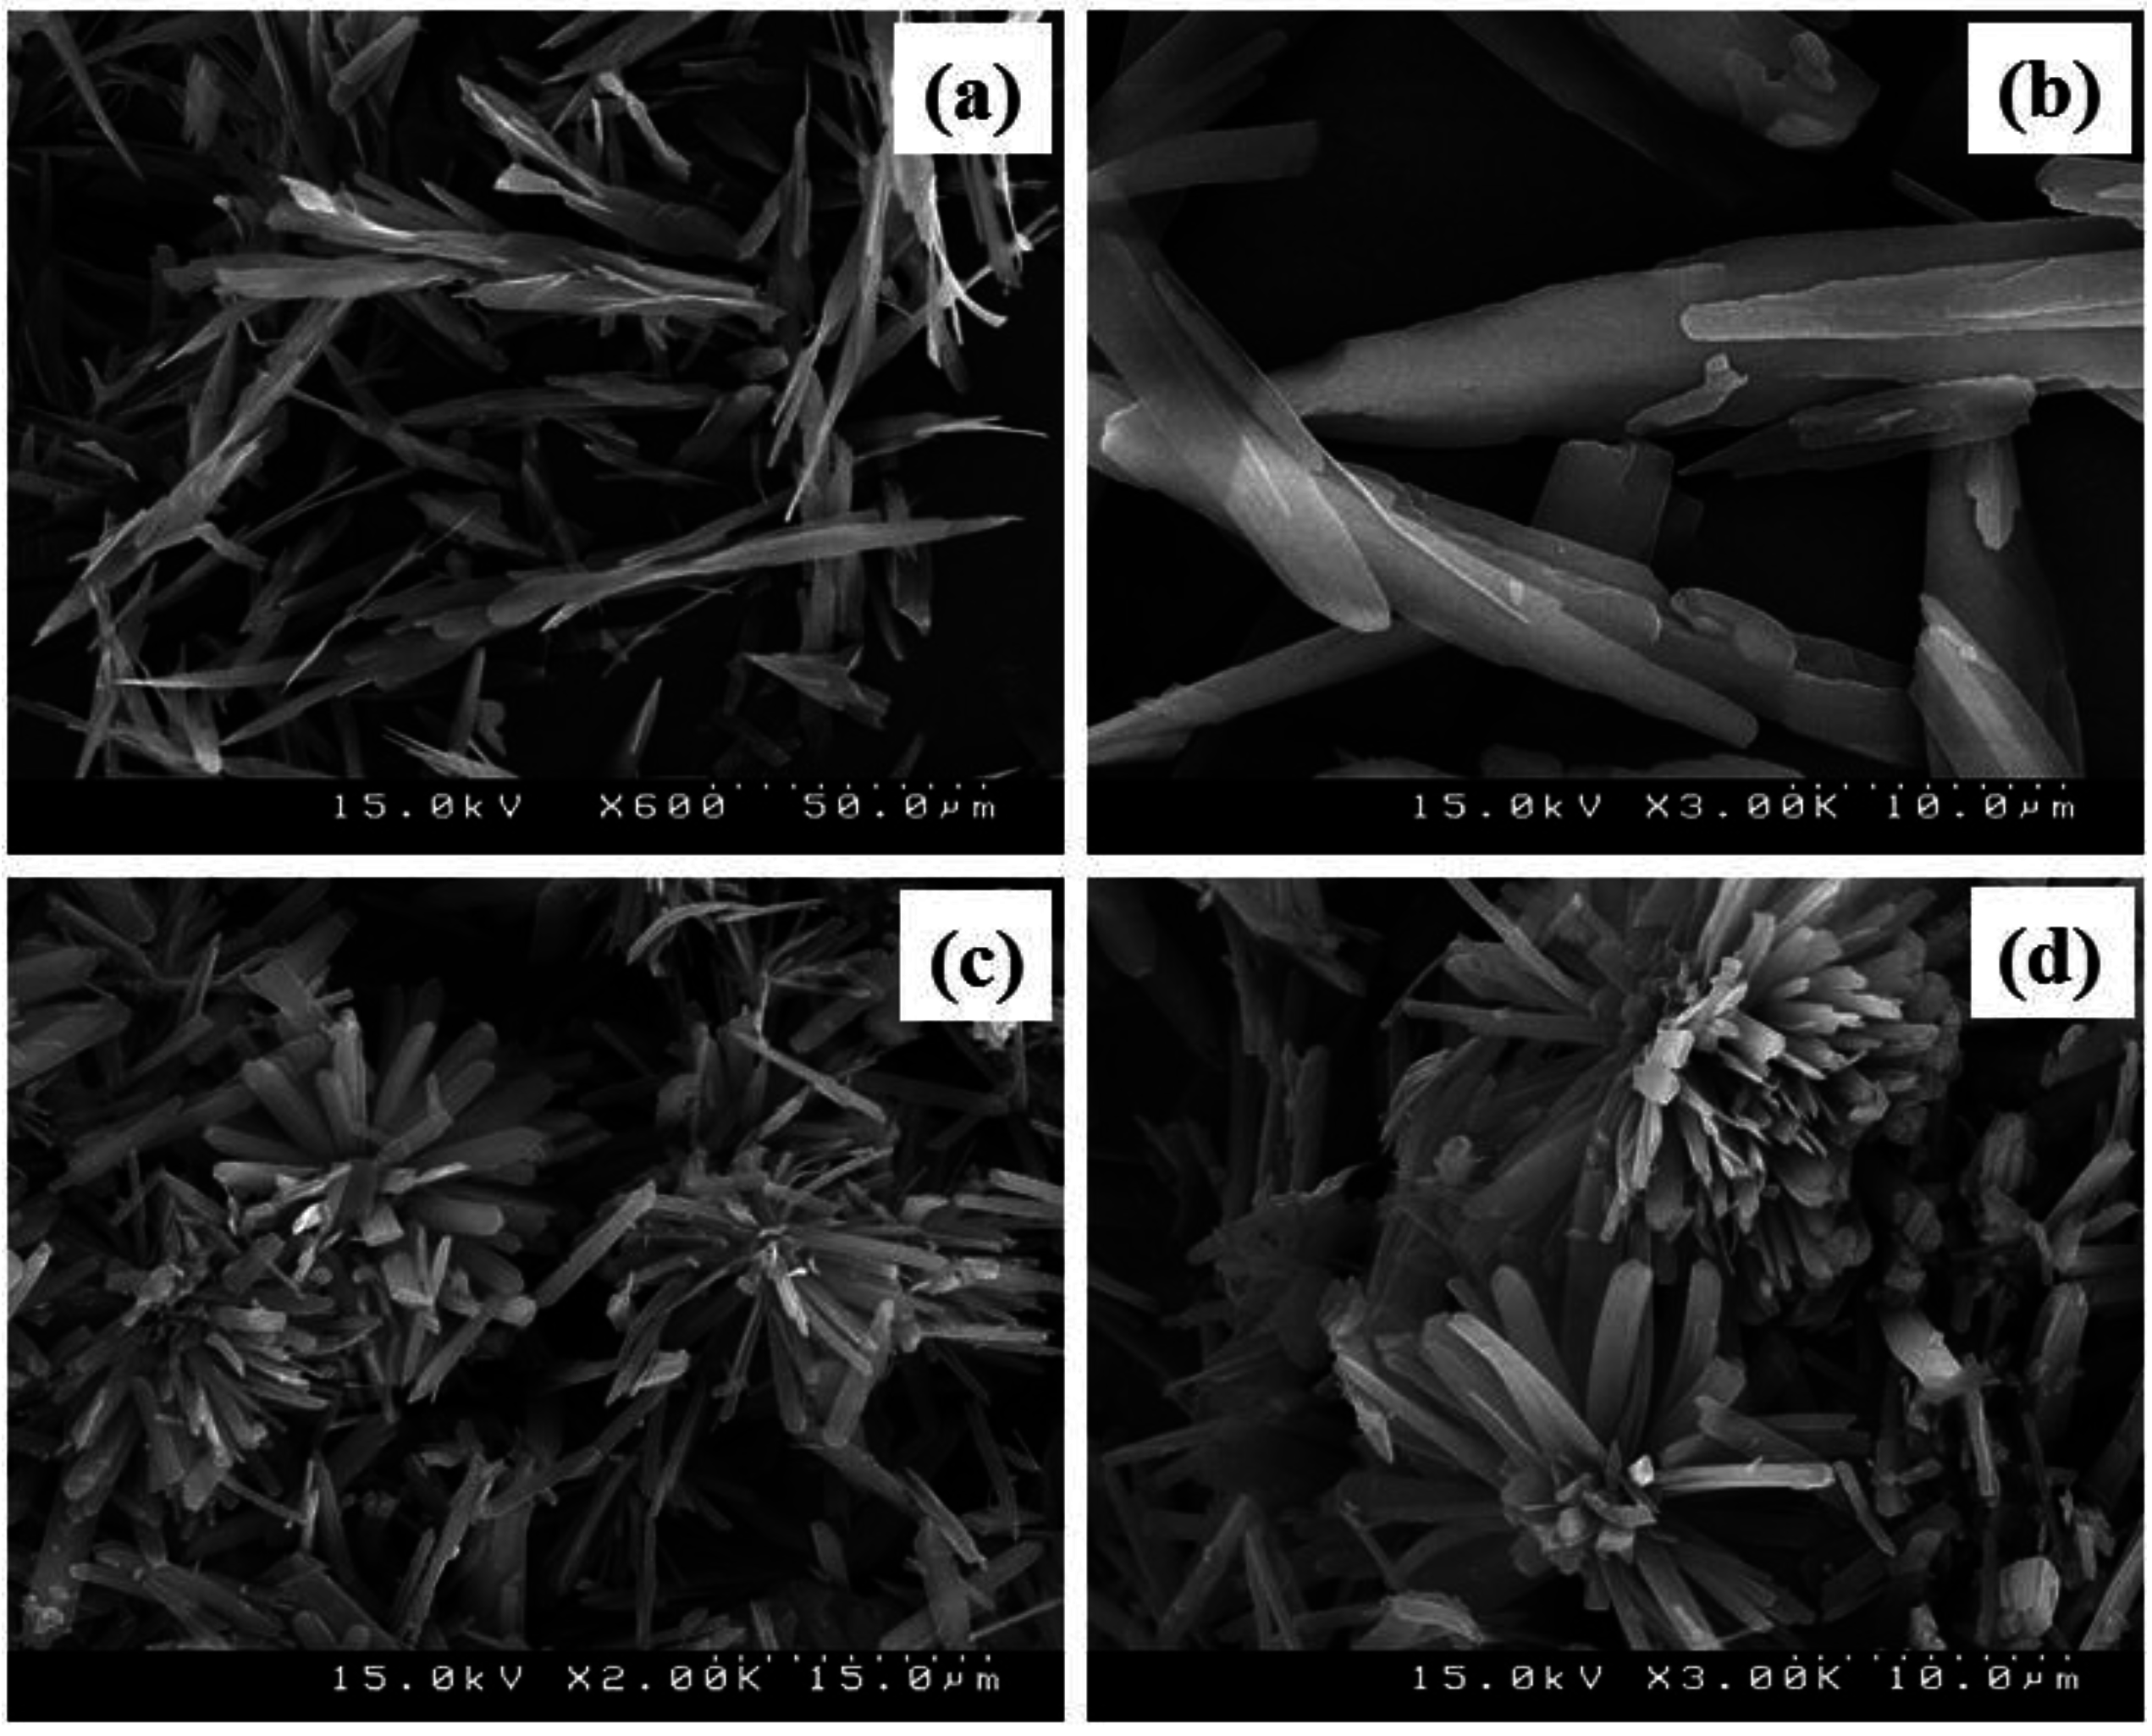
3.1.7. SEM Analysis

4. Conclusions
Author Contributions
Conflicts of Interest
References
- Suvarapu, L.N.; Somala, A.R.; Koduru, J.R.; Baek, S.O.; Ammireddy, V.R. A critical review on analytical and biological applications of thio- and phenyl-thiosemicarbazones. Asian J. Chem. 2012, 24, 1889–1898. [Google Scholar]
- Matesanz, A.I.; Hernandez, C.; Souza, P. A new organometallic palladium(II) compound derived 2,6-deacetylpyridine mono (thiosemicarbazone): Synthesis, spectroscopic properties and crystal structure of two solvatomorphic forms. J. Organomet. Chem. 2014, 751, 374–378. [Google Scholar] [CrossRef]
- Gaal, A.; Orgovan, G.; Polgari, Z.; Reti, A.; Mihucz, V.G.; Bosze, S.; Streli, C. Complex forming competition and in vitro toxicity studies on the applicability of di-2-pyridylkethone- 4,4-dimethyl-3-thiosemicarbazone (Dp44mT) as a metal chelator. J. Inorg. Biochem. 2014, 130, 52–58. [Google Scholar] [CrossRef] [PubMed]
- Koduru, J.R.; Lee, K.D. Evaluation of thiosemicarbazone derivatives as chelating agent for the simultaneous removal and trace determination of Cd(II) and Pb(II) in food and water samples. Food Chem. 2014, 150, 1–8. [Google Scholar] [CrossRef] [PubMed]
- Moghadam, M.R.; Jahromi, S.M.P.; Darehkordi, A. Simultaneous spectrophotometric determination of copper, cobalt, nickel and iron in food stuffs and vegetables with a new bis thiosemicarbazone ligand using chemometric approaches. Food Chem. 2016, 192, 424–431. [Google Scholar] [CrossRef] [PubMed]
- Nguyen, T.B.Y.; Pham, C.T.; Trieu, T.N.; Abram, U.; Nguyen, H.H. Synthesis, structures and biological evaluation of some transitional metal complexes with a tetradentate benzamidine/thiosemicarbazone ligand. Polyhedron 2015, 96, 66–70. [Google Scholar] [CrossRef]
- Bal-Demirci, T.; Sahin, M.; Kondakci, E.; Ozyurek, M.; Ulkuseven, B.; Apak, R. Synthesis and antioxidant activities of transition metal complexes based 3-hydroxysalicylaldehyde-S-methylthiosemicarbazone. Spectrochim. Acta A 2015, 138, 866–872. [Google Scholar] [CrossRef] [PubMed]
- Kumar, D.; Singh, V.K. Application of metal complexes of Schiff bas with special reference to thiosemicarbazone: A review. J. Drug Discov. Therap. 2014, 2, 24–32. [Google Scholar]
- Cadmium. Available online: https://en.wikipedia.org/wiki/Cadmium (accessed on 28 July 2015).
- Ninkov, M.; Aleksandrov, A.P.; Demenesku, J.; Mirkov, I.; Mileusnic, D.; Petrovic, A.; Grigorov, I.; Zolotarevski, L.; Tolinacki, M.; Kataranovski, D.; et al. Toxicity of oral cadmium intake: Impact on gut immunity. Toxicol. Lett. 2015, 237, 89–99. [Google Scholar] [CrossRef] [PubMed]
- Demenesku, J.; Mirkov, I.; Ninkov, M.; Aleksandrov, A.P.; Zolotarevski, L.; Kataranovski, D.; Kataranovski, M. Acute cadmium administration to rats exerts both immunosuppressive and proinflammatory effects in spleen. Toxicology 2014, 326, 96–108. [Google Scholar] [CrossRef] [PubMed]
- Kresovich, J.K.; Argos, M.; Turyk, M.E. Associations of lead and cadmium with sex hormones in adult males. Environ. Res. 2015, 142, 25–33. [Google Scholar] [CrossRef] [PubMed]
- West, D.X.; Albert, J.N. Transitional metal ion complexes of thiosemicarbazones derived from 2-acetylpyridine N-oxide. Part III. Spectral and thermal studies of the metal complexes of 2-acetylpyridine N-oxide thiosemicarbazone. Transit. Metal Chem. 1991, 16, 1–4. [Google Scholar] [CrossRef]
- Garg, B.S.; Kurup, M.R.P. Spectroscopic studies on copper(II) complexes derived from a substituted 2-acetylpyridine thiosemicarbazone. Transit. Metal Chem. 1988, 13, 309–312. [Google Scholar] [CrossRef]
- Gujarathi, J.R.; Pawar, N.S.; Bendre, R.S. Synthesis, spectral and biological study of four and five co-ordinate copper(II) complexes derived from 5-chloro-2-hydroxy acetophenone N(4)-methyl thiosemicarbazone. Der Pharma Chem. 2013, 5, 111–117. [Google Scholar]
© 2015 by the authors; licensee MDPI, Basel, Switzerland. This article is an open access article distributed under the terms and conditions of the Creative Commons Attribution license (http://creativecommons.org/licenses/by/4.0/).
Share and Cite
Suvarapu, L.N.; Baek, S.-O. Synthesis and Characterization of 4-Benzyloxybenzaldehyde-4-methyl-3-thiosemicarbazone (Containing Sulphur and Nitrogen Donor Atoms) and Its Cd(II) Complex. Metals 2015, 5, 2266-2276. https://doi.org/10.3390/met5042266
Suvarapu LN, Baek S-O. Synthesis and Characterization of 4-Benzyloxybenzaldehyde-4-methyl-3-thiosemicarbazone (Containing Sulphur and Nitrogen Donor Atoms) and Its Cd(II) Complex. Metals. 2015; 5(4):2266-2276. https://doi.org/10.3390/met5042266
Chicago/Turabian StyleSuvarapu, Lakshmi Narayana, and Sung-Ok Baek. 2015. "Synthesis and Characterization of 4-Benzyloxybenzaldehyde-4-methyl-3-thiosemicarbazone (Containing Sulphur and Nitrogen Donor Atoms) and Its Cd(II) Complex" Metals 5, no. 4: 2266-2276. https://doi.org/10.3390/met5042266
APA StyleSuvarapu, L. N., & Baek, S.-O. (2015). Synthesis and Characterization of 4-Benzyloxybenzaldehyde-4-methyl-3-thiosemicarbazone (Containing Sulphur and Nitrogen Donor Atoms) and Its Cd(II) Complex. Metals, 5(4), 2266-2276. https://doi.org/10.3390/met5042266