Article

The Effect of Nb on the Continuous Cooling Transformation Curves of Ultra-Thin Strip CASTRIP© Steels

by
Kristin R. Carpenter
1,* and
Chris R. Killmore
2
1
School of Mechanical, Materials & Mechatronic Engineering, University of Wollongong, Northfields Ave, Wollongong 2500, Australia
2
Manager Hot Rolled Product Development, Sales and Marketing, BlueScope Steel, Five Islands Road, Port Kembla 2505, Australia
*
Author to whom correspondence should be addressed.
Metals 2015, 5(4), 1857-1877; https://doi.org/10.3390/met5041857
Submission received: 3 September 2015 / Revised: 18 September 2015 / Accepted: 25 September 2015 / Published: 9 October 2015
(This article belongs to the Special Issue Microalloyed Steel)

Abstract

:
The effect of Nb on the hardenability of ultra-thin cast strip (UCS) steels produced via the unique regime of rapid solidification, large austenite grain size, and inclusion engineering of the CASTRIP© process was investigated. Continuous cooling transformation (CCT) diagrams were constructed for 0, 0.014, 0.024, 0.04, 0.06 and 0.08 wt% Nb containing UCS steels. Phase nomenclature for the identification of lower transformation product in low carbon steels was reviewed. Even a small addition of 0.014 wt% Nb showed a potent effect on hardenability, shifting the ferrite C-curve to the right and expanding the bainitic ferrite and acicular ferrite phase fields. Higher Nb additions increased hardenability further, suppressed the formation of ferrite to even lower cooling rates, progressively lowered the transformation start and finish temperatures and promoted the transformation of bainite instead of acicular ferrite. The latter was due to Nb suppressing the formation of allotriomorphic ferrite and allowing bainite to nucleate at prior austenite grain boundaries, a lower energy site than that for the intragranular nucleation of acicular ferrite at inclusions. Strength and hardness increased with increasing Nb additions, largely due to microstructural strengthening and solid solution hardening, but not from precipitation hardening.

Graphical Abstract

1. Introduction

The role of Nb in thermo-mechanical processing (TMP) in conventional hot rolling has long been established [1,2,3], but due to the unique processing conditions of the CASTRIP© process, the role of Nb is not as well understood. The behaviours of Nb in conventional TMP of plate and hot rolled strip is first briefly reviewed, in order to establish differences in the behaviour of Nb in the CASTRIP practice.
The role of Nb in TMP was reviewed by Tanaka [1], modelled on a three stage process, where stages 1 and 2 involve hot rolling in the austenite region, but are separated into the recrystallization region and non-recrystallization region, while stage 3 is rolling in the two-phase, austenite and ferrite, region. Niobium is used due to its excellent ability to retard recrystallization and thus widen the non-recrystallization region. The strong influence of Nb as a solute on retarding austenite recrystallization has been attributed to its relatively large atomic size and electronic structure difference to Fe [4]. Niobium is known to be a powerful hardenability agent, lowering the temperature of austenite to ferrite transformation, further widening the non-recrystallization region and promoting the transformation of lower transformation products, such as bainite. Consequently, Nb is regarded as the most effective grain refiner of hot rolled products [2,5,6].
It is important to make it clear that Nb only acts as a hardenability agent while it is in solution [7,8,9,10,11,12,13,14,15]. This introduces a number of challenges during conventional processing, namely, the loss of solute Nb via precipitation during hot rolling, difficulty to dissolve all the Nb precipitates during reheating, which generally remain as coarse particles that do not contribute to the strengthening of the steel. This necessitates high reheating temperatures leading to undesirable large austenite grain sizes. To help combat the requirement for high reheating temperatures, low carbon levels (≤0.06 wt%) and Ti treatment are used to fix the nitrogen and limit niobium carbide formation to allow lower reheating temperatures [16,17]. Furthermore, Nb can co-precipitate on TiN [18], decreasing the effective amount of Nb available during further processing.
The CASTRIP twin-roll strip casting process utilises two counter rotating rolls to form two individual shells that are formed into a continuous sheet at the roll nip. This leads to a processing history that is significantly different to conventional processes. Thin strip is directly produced from liquid steel, with a rapid solidification rate [19], an ideal situation to keep the entire Nb addition (up to 0.08 wt%) in solution. Combine this with relatively rapid cooling of the thin strip before and after rolling, Nb precipitation can be suppressed, locking Nb in solution in both austenite and ferrite. Higher cooling rates suppress Nb precipitation with insufficient time for the diffusion-controlled process to proceed [9]. These unique, favourable conditions available with the CASTRIP process allows the complete Nb addition to be utilised as solute, maximising niobium’s potential for retarding austenite recrystallization, providing potent hardenability and subsequent age hardening treatments become available.
Dilatometry tests for Ultra-Thin Strip (UCS) CASTRIP were developed to investigate the effects of Nb and Mn on the hardenability of low carbon, low alloy UCS steels. Continuous Cooling Transformation (CCT) diagrams were constructed; metallography, Vickers hardness and Transmission Electron Microscopy (TEM) were used to evaluate UCS specimens. Mechanical properties from production trials are related back to the influence of Nb on hardenability.

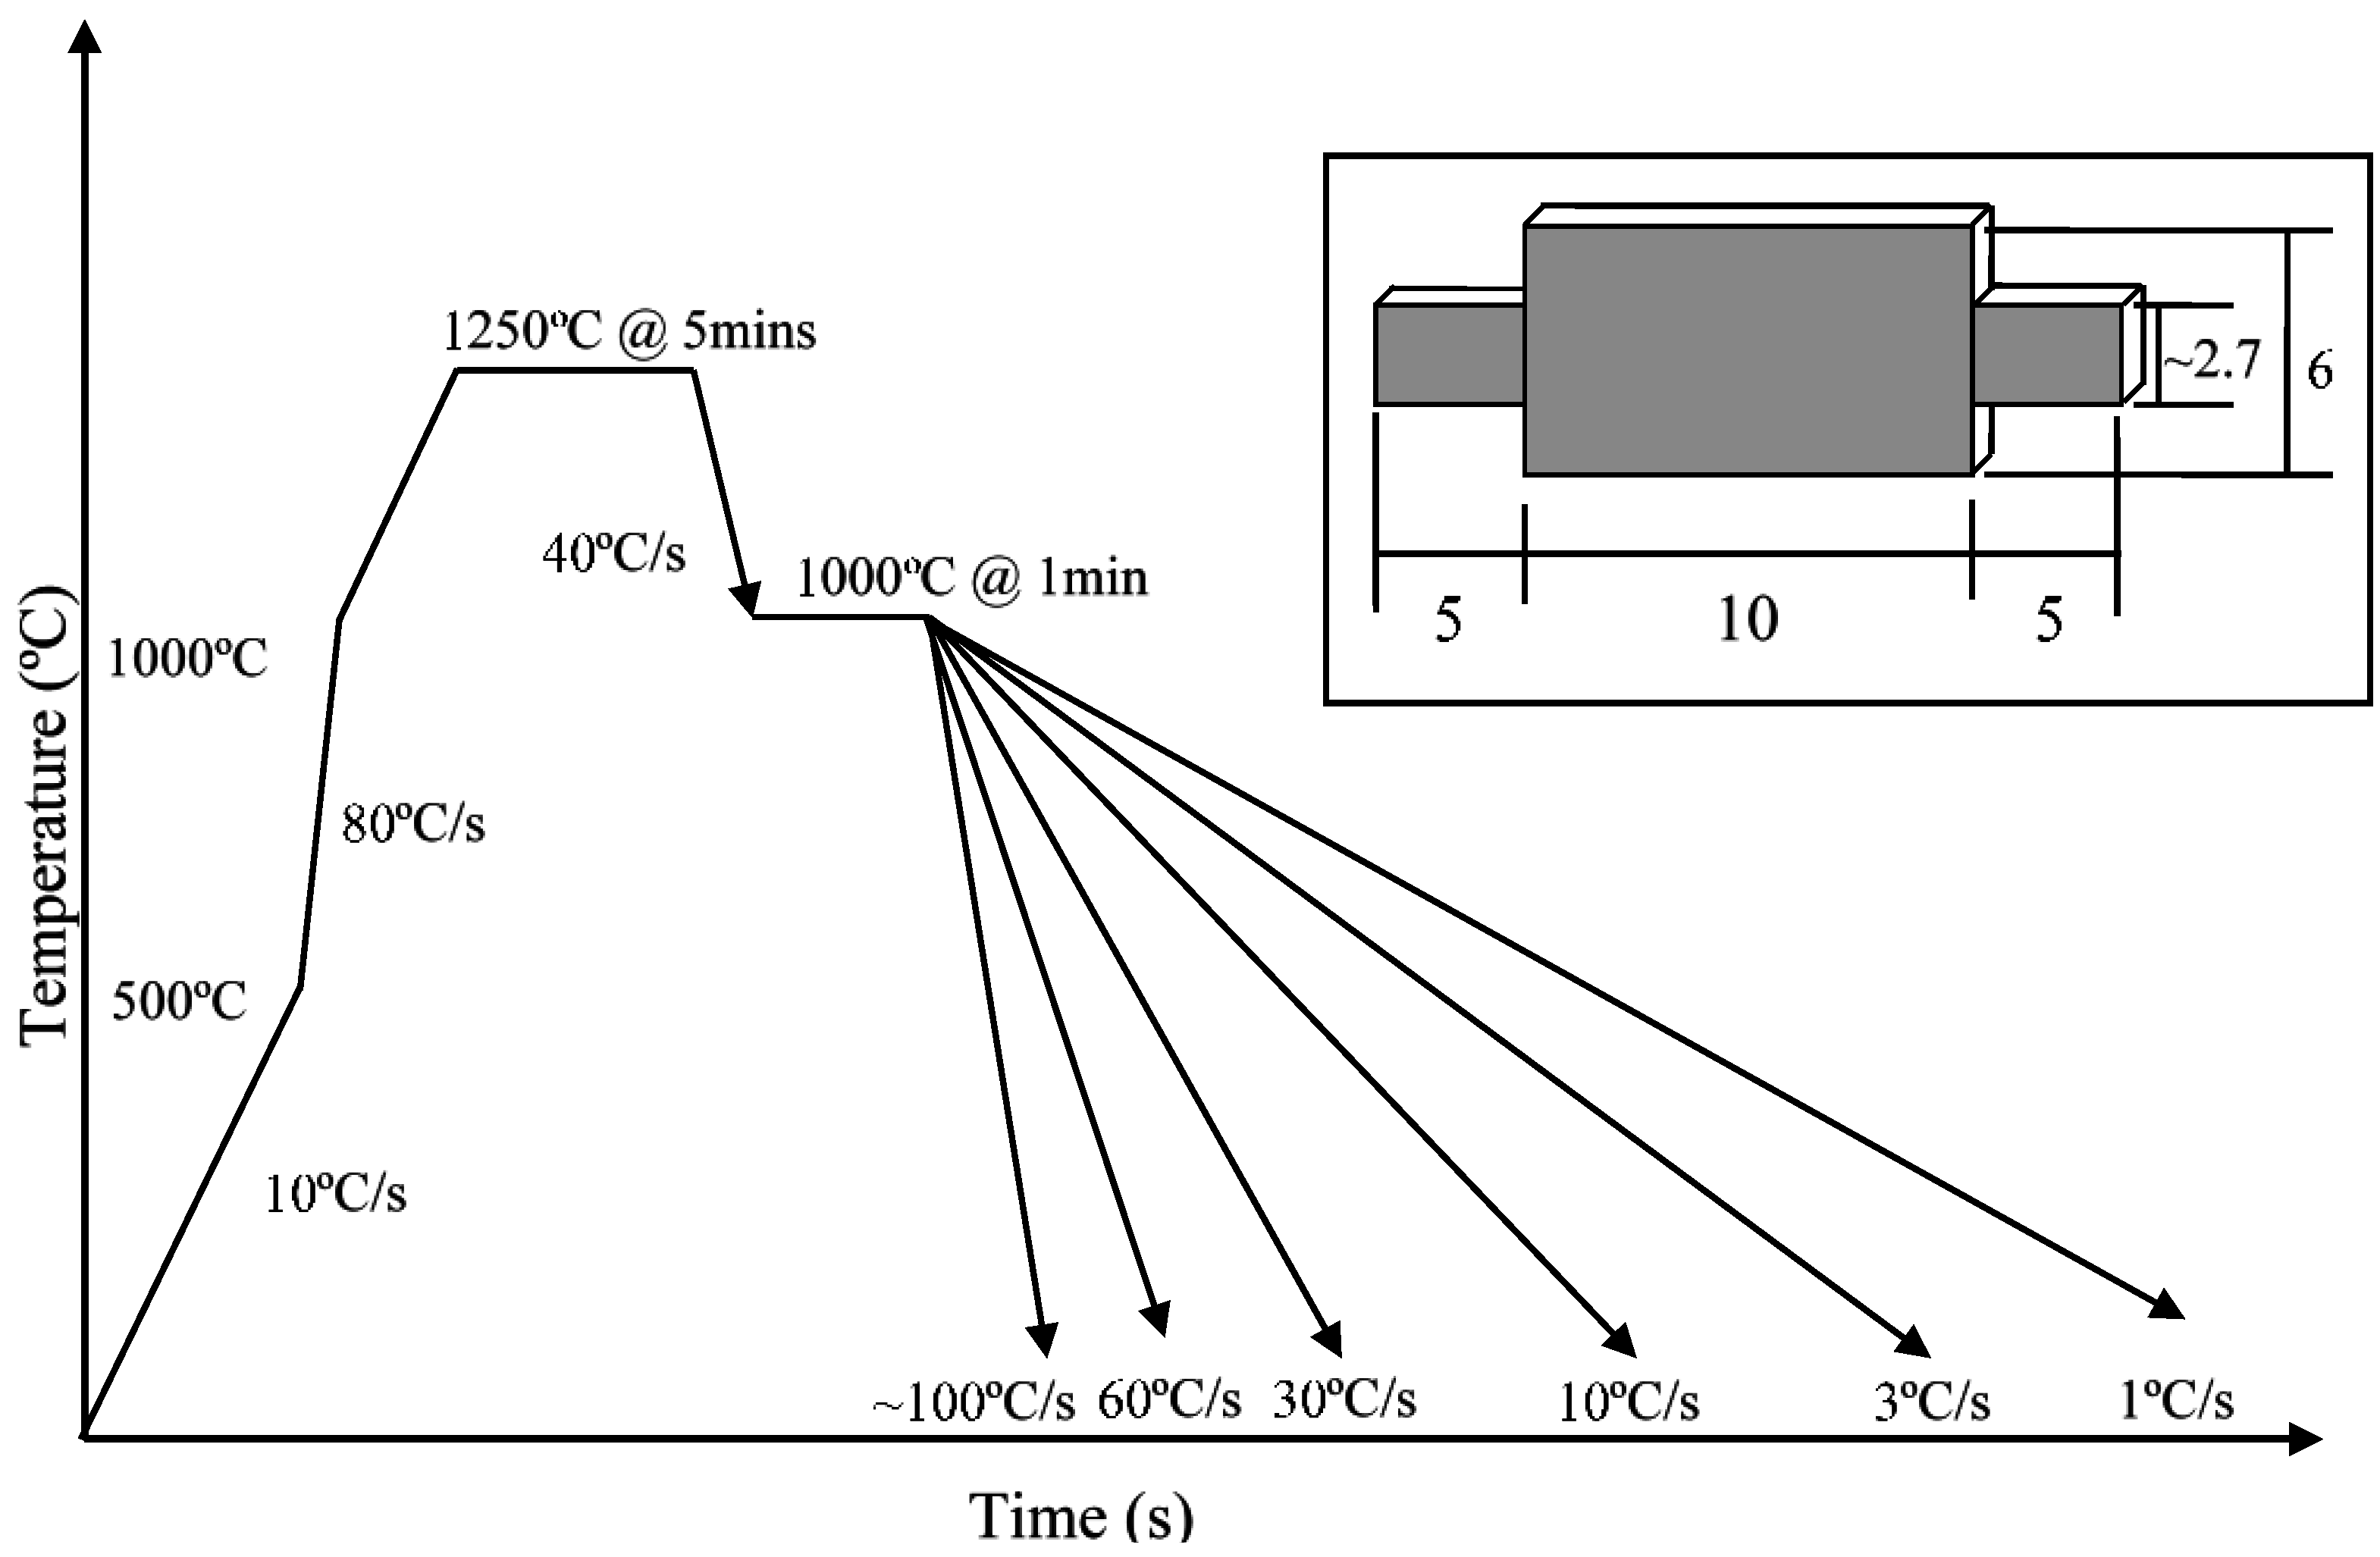
2. Experimental Section

Specimens for this work were wire cut from hot-rolled UCS product produced from the CASTRIP process with a range of Nb additions, as listed in Table 1. The steels used were production trial grades and there was some variation in the Mn content that must be taken into account when comparing the effects of the different Nb additions. A feature of the CASTRIP process is its high tolerance for using high residual scrap without detrimental effects on mechanical properties. The higher residual would have a small contribution to the base-level hardenability, but this influence was consistent across the sample range.
Due to the thinness of UCS product, 1.5–1.0 mm, standard dilatometer specimens could not be made so an alternative design was developed. Tests were conducted on a Theta Industries-Dialatronic Dilatometer, Theta Industries Inc., New York, NY, USA, located at The University of Wollongong. A rectangular sample, as depicted in the inset of Figure 1, was designed with ‘arms’ on each end that slot inside the quartz holding cylinders to hold the sample in place, but allow the expansion/contraction of the rectangular section to be measured.
Table 1. Chemical composition of the tested CASTRIP ultra-thin cast strip (UCS) products.
(wt%)Base0.014% Nb0.024% Nb0.04% Nb0.06% Nb0.08% Nb
C0.0270.0320.0290.0360.0310.031
P0.0090.0120.0130.0130.0140.015
Mn0.6930.6860.7300.8700.7380.830
Si0.1890.1800.1750.2100.1590.200
S0.0020.0030.0020.0020.0030.002
Ni0.0100.0280.0360.0390.0470.029
Cr0.0270.0410.0450.0430.0570.037
Mo0.0060.0100.0140.0110.0170.008
Cu0.0400.0700.0840.0830.0950.054
Nb0.0000.0140.0240.0400.060.080
N0.0040.0060.0040.0070.0050.006
The test schedule for the determination of the CCT curves is shown schematically in Figure 1. Samples were heated at 10 °C/s to 1250 °C, with a rapid heating segment of ~80 °C/s (maximum controllable rate for dilatometer) between 500–1000 °C and held at 1250 °C for 5 min. The rapid heating rate between 500–1000 °C was used to minimise precipitation of Nb on heating and aid subsequent dissolution of Nb precipitation at 1250 °C.
The initial cooling rate of 40 °C/s from 1250 °C to 1000 °C was used to inhibit Nb precipitation on cooling and to simulate the average cooling rate experienced by UCS steel. Samples were held for 1 min to stabilise the temperature and then were controlled cooled at 1, 3, 10, 30, 60 and 100 °C/s through the austenite-to-ferrite transformation temperature range using helium gas. An intermediate cooling rate of 20 °C/s was required to refine the CCT curve for most of the sample sets. Optical metallography was used to identify microstructural evolution after a 1 µm polish and 3% Nital etch. Prior austenite grain boundaries were revealed with saturated aqueous solution of picric acid (SASPA), which consisted of 100 mL SASPA, 1 mL of HCl (32%) and 2 drops of Teepol™ (wetting agent), the solution was filtered prior to etching.
Niobium precipitation was investigated at 200 kV using a JEOL© Scanning Transmission Electron Microscope (STEM, JEOL Inc., Tokyo, Japan). Hardness was measured as an average of three tests taken by a Vickers hardness indenter, Armstrongs (Engineers) Ltd. (Kent, UK), using a 5 kg load.
Tensile tests were carried out using an Instron machine, Intron Pty. Ltd., Melbourne, Australia with a 100 KN load cell in accordance with Australian Standard “AS1391-2007: Metallic Materials—Tensile Testing at ambient Temperature”. The specimen size was 20 mm (w) by 80 mm (l). All tensile specimens were taken in the longitudinal direction at the quarter width position of a coil.
Figure 1. Schematic of dilatometer test program for determination of continuous cooling transformation (CCT) diagrams. Inset: Schematic of a typical thin strip dilatometer sample (dimensions in mm).
Metals 05 01857 g001

3. Results and Discussion

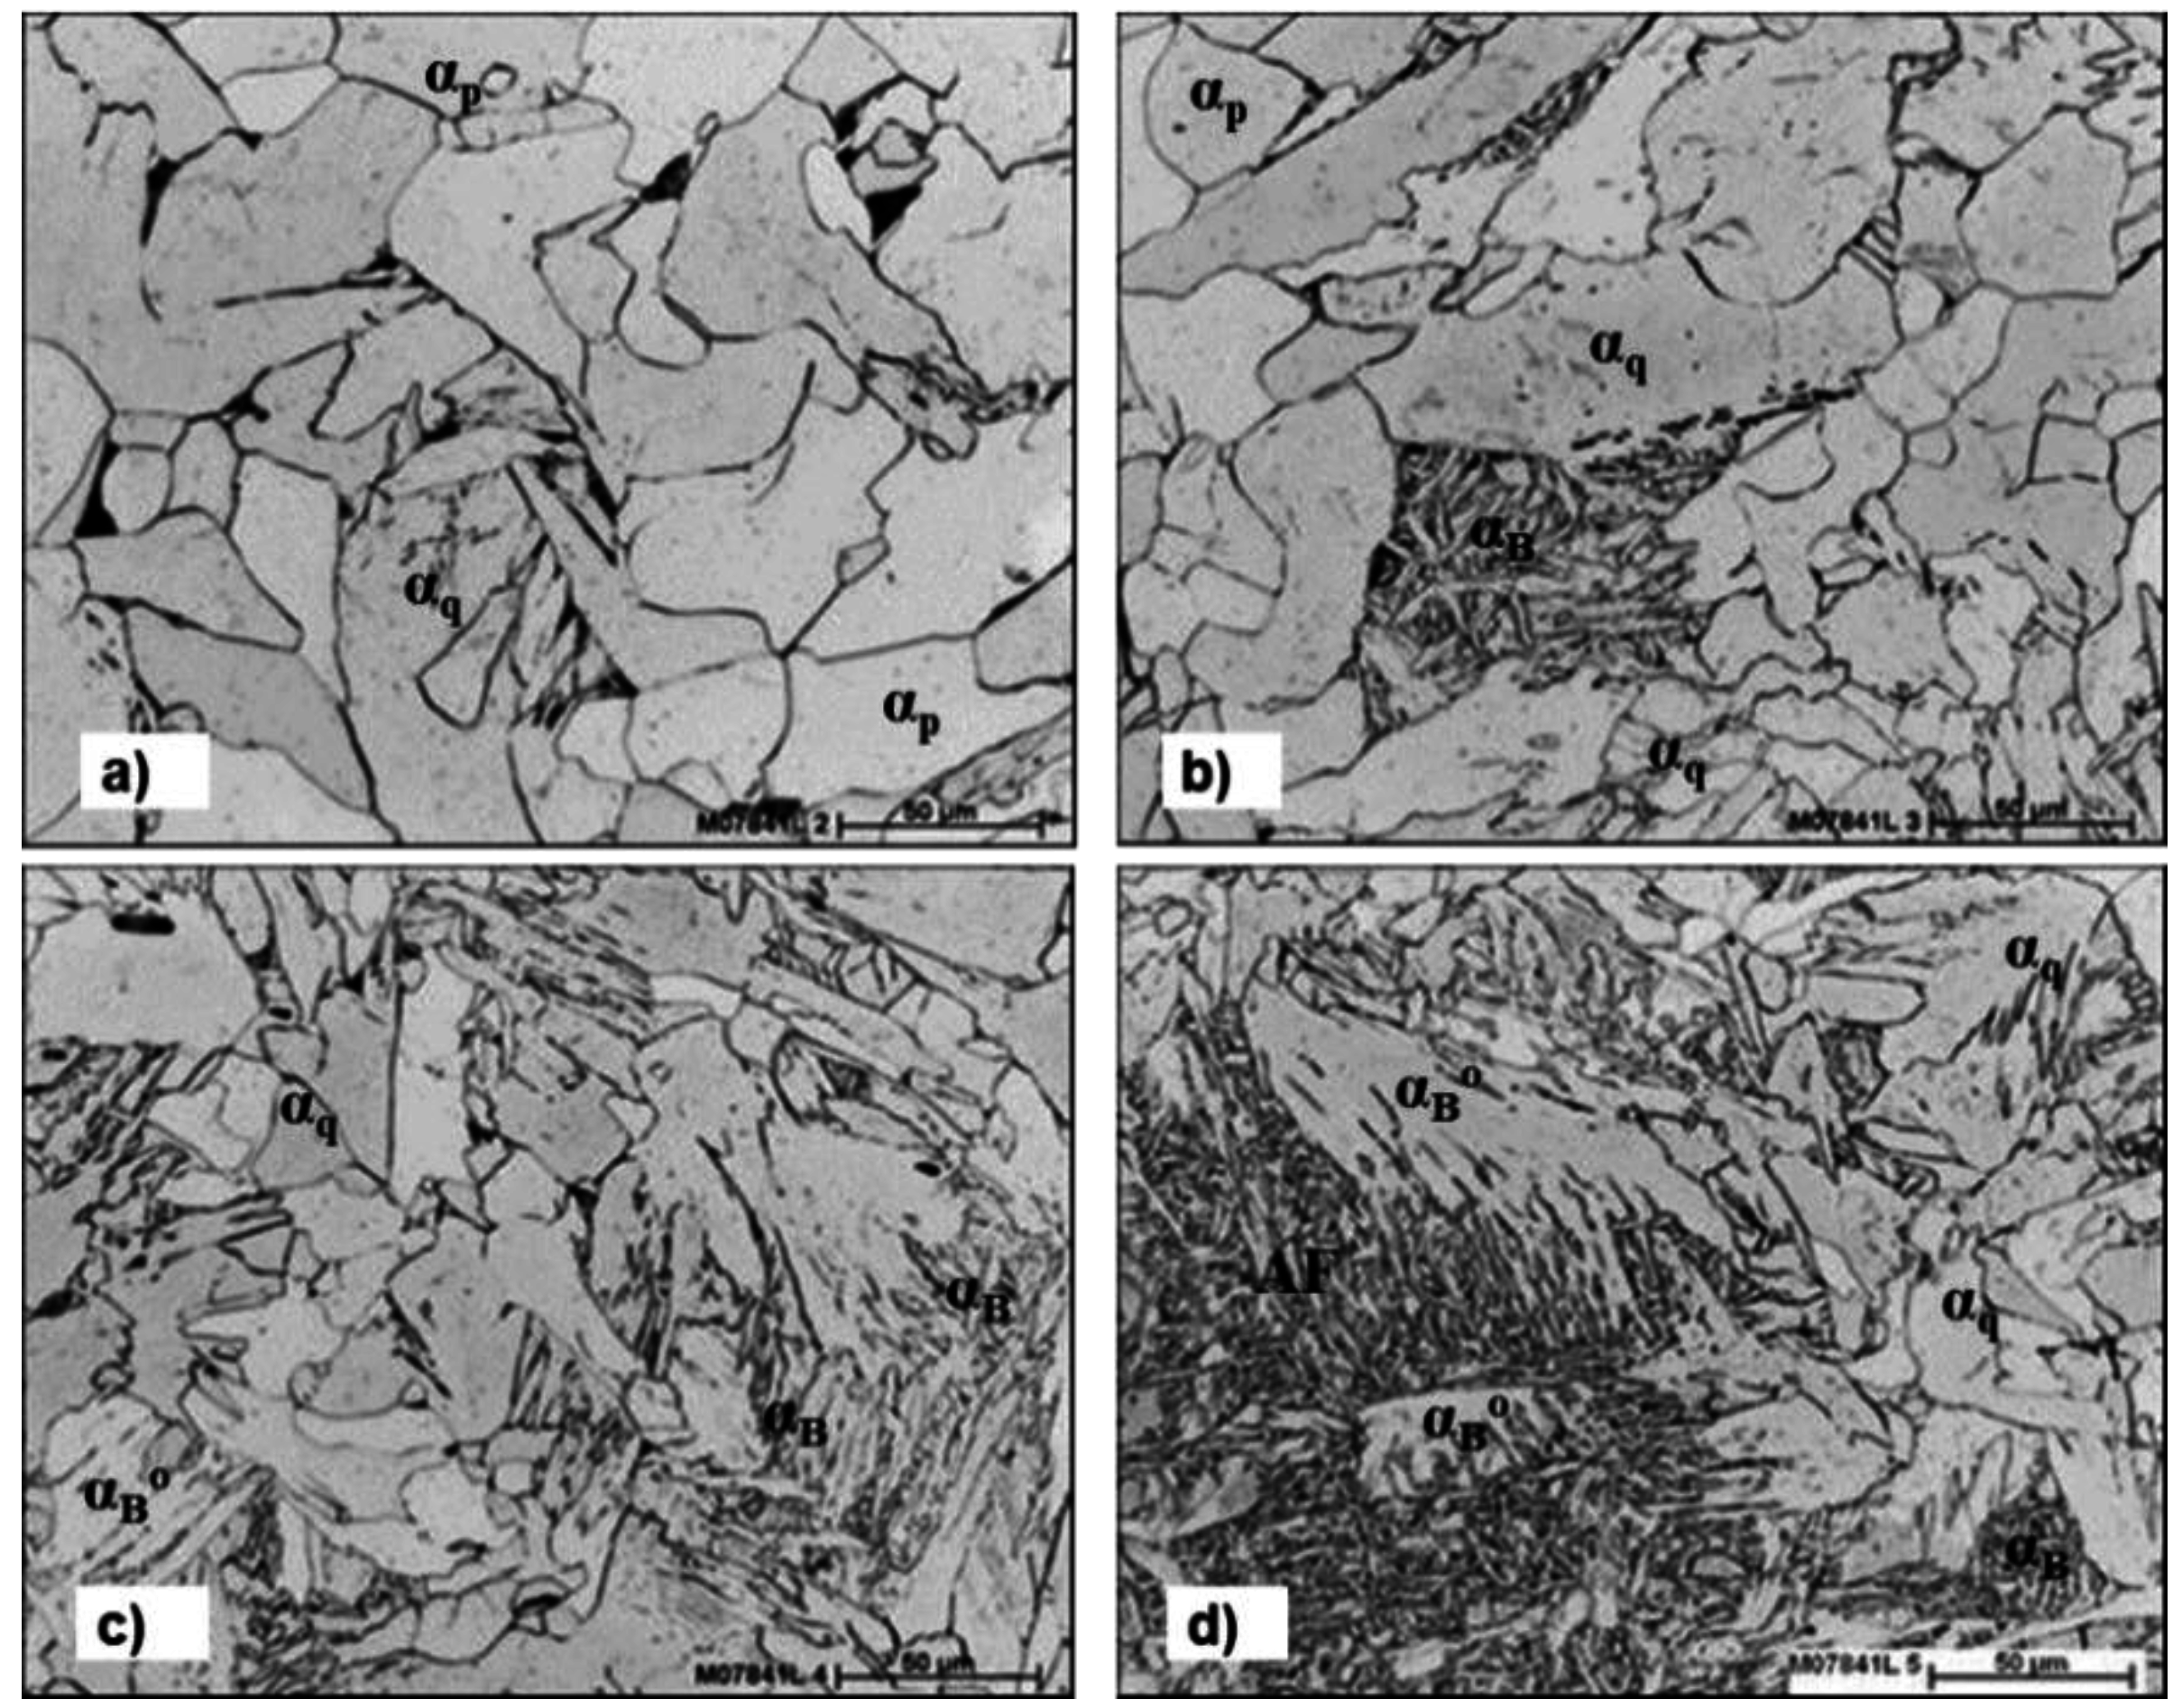
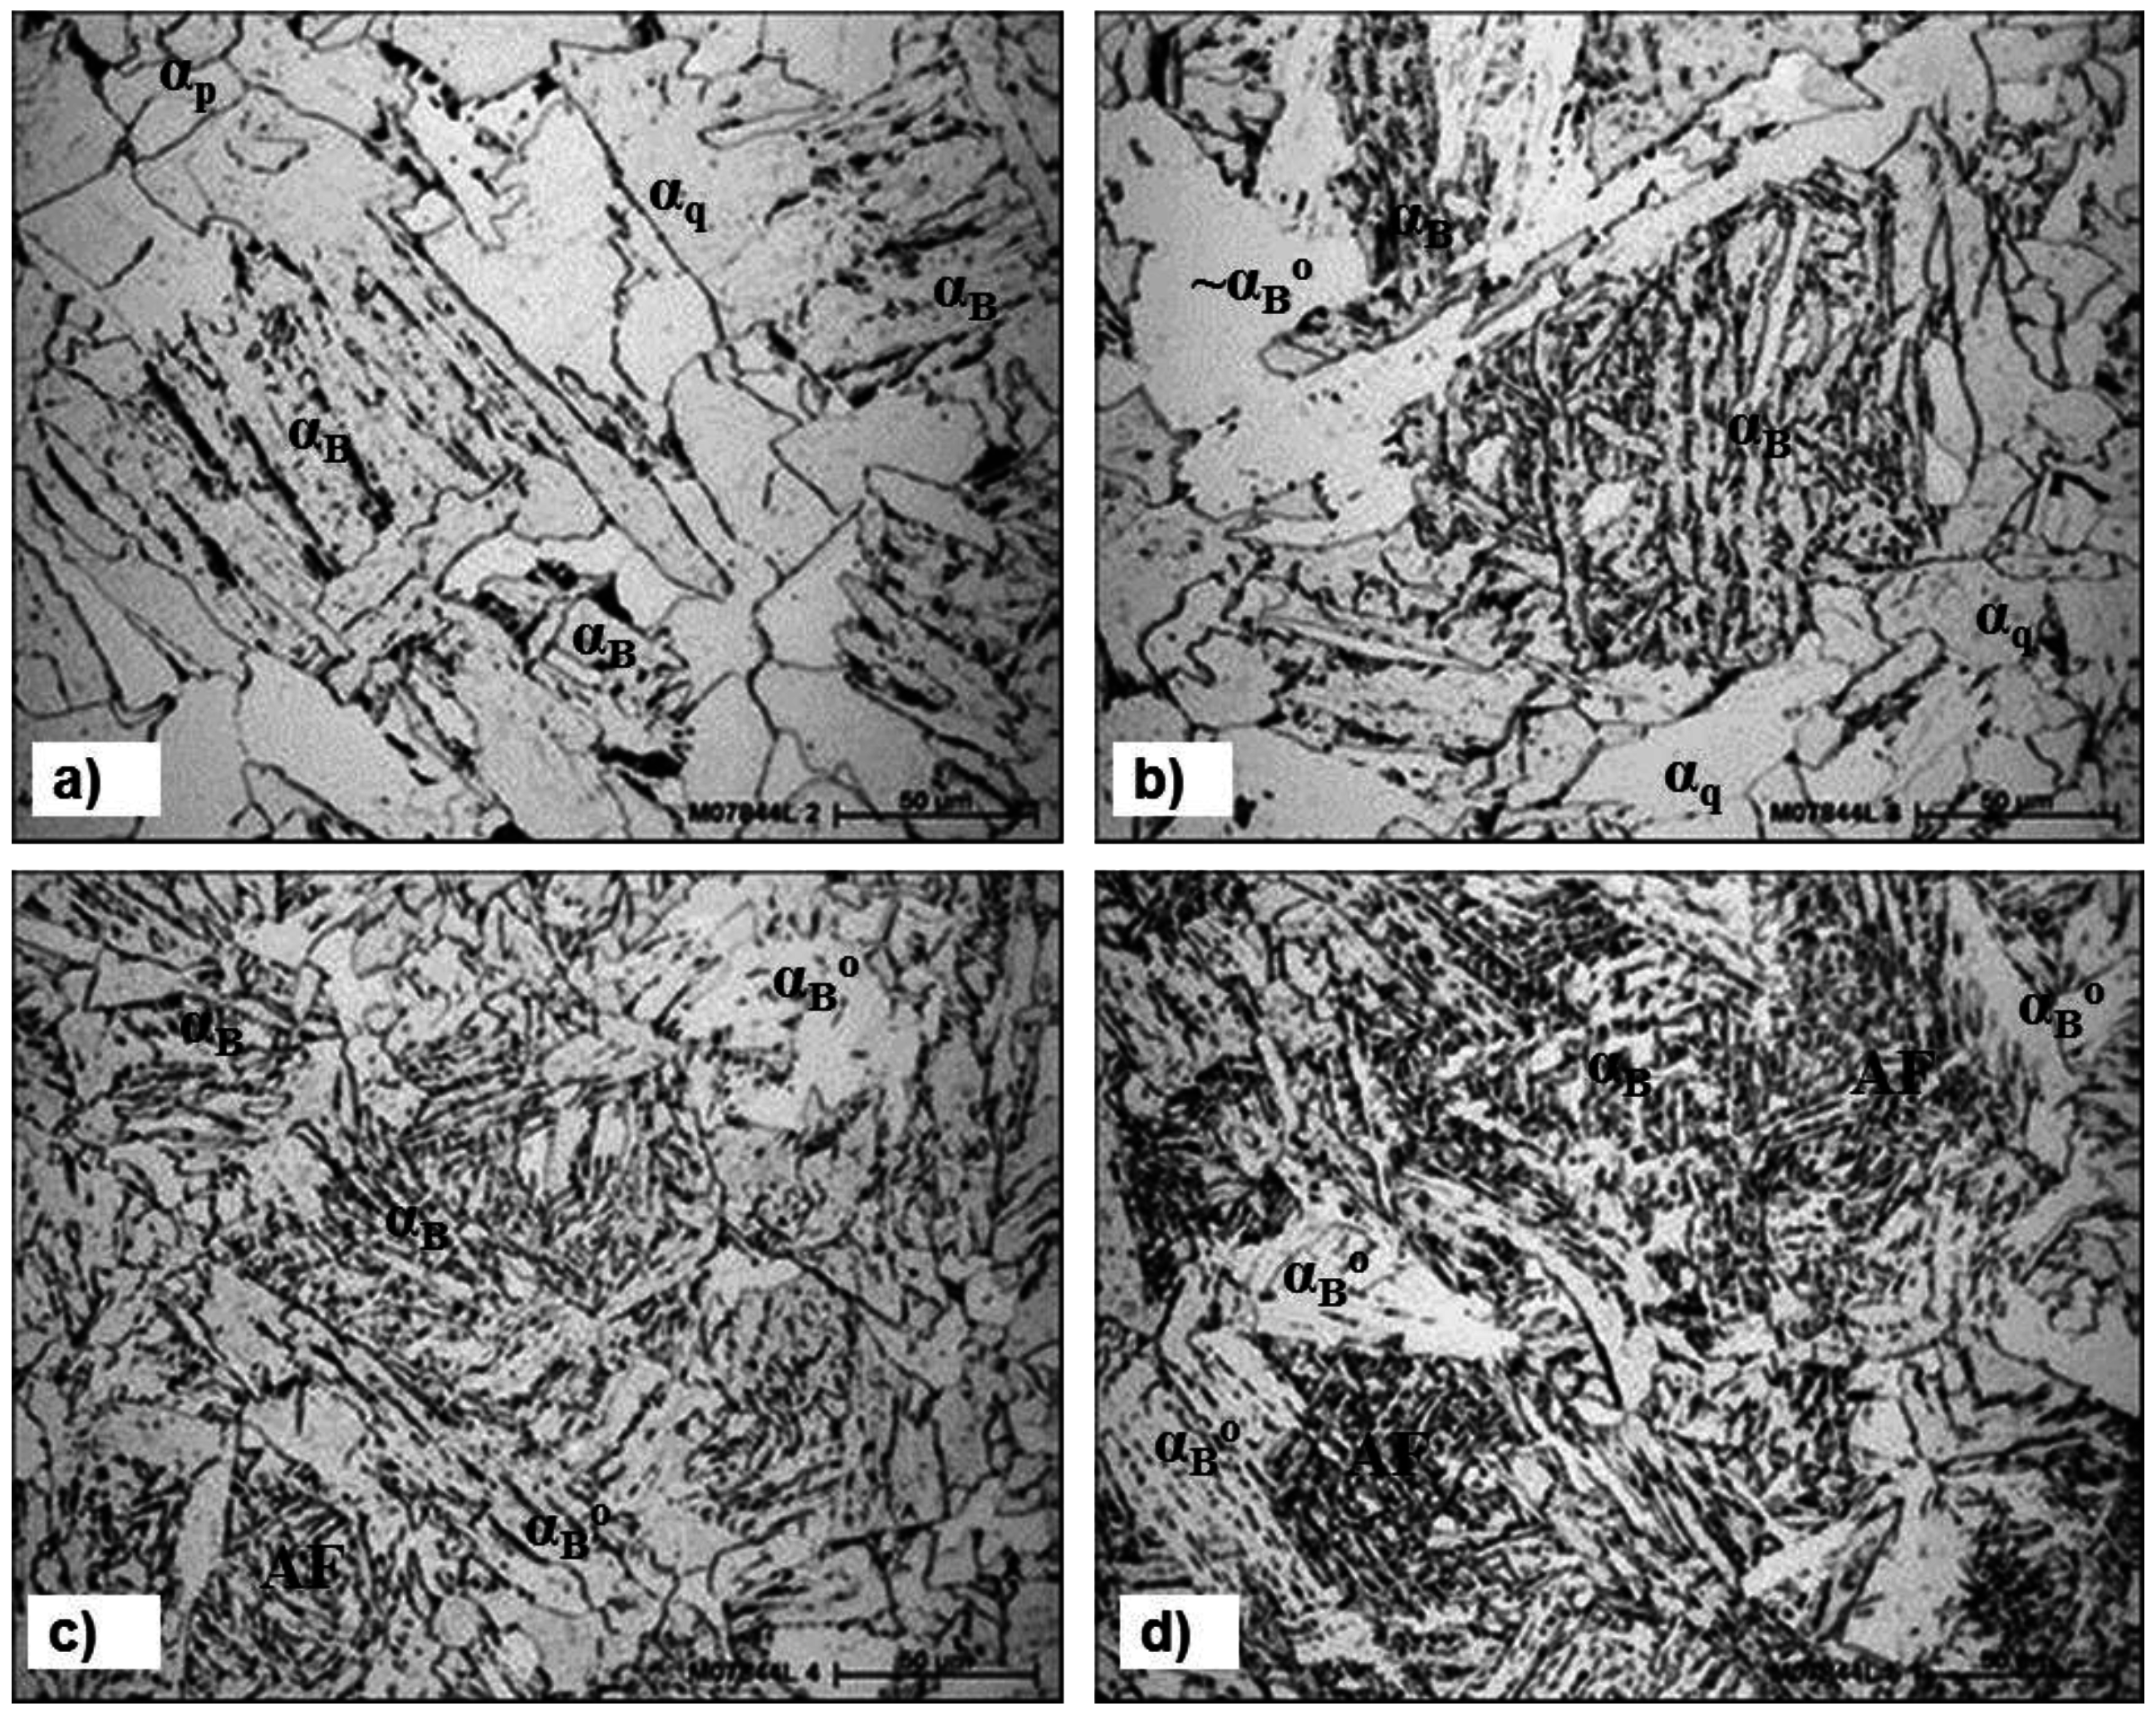
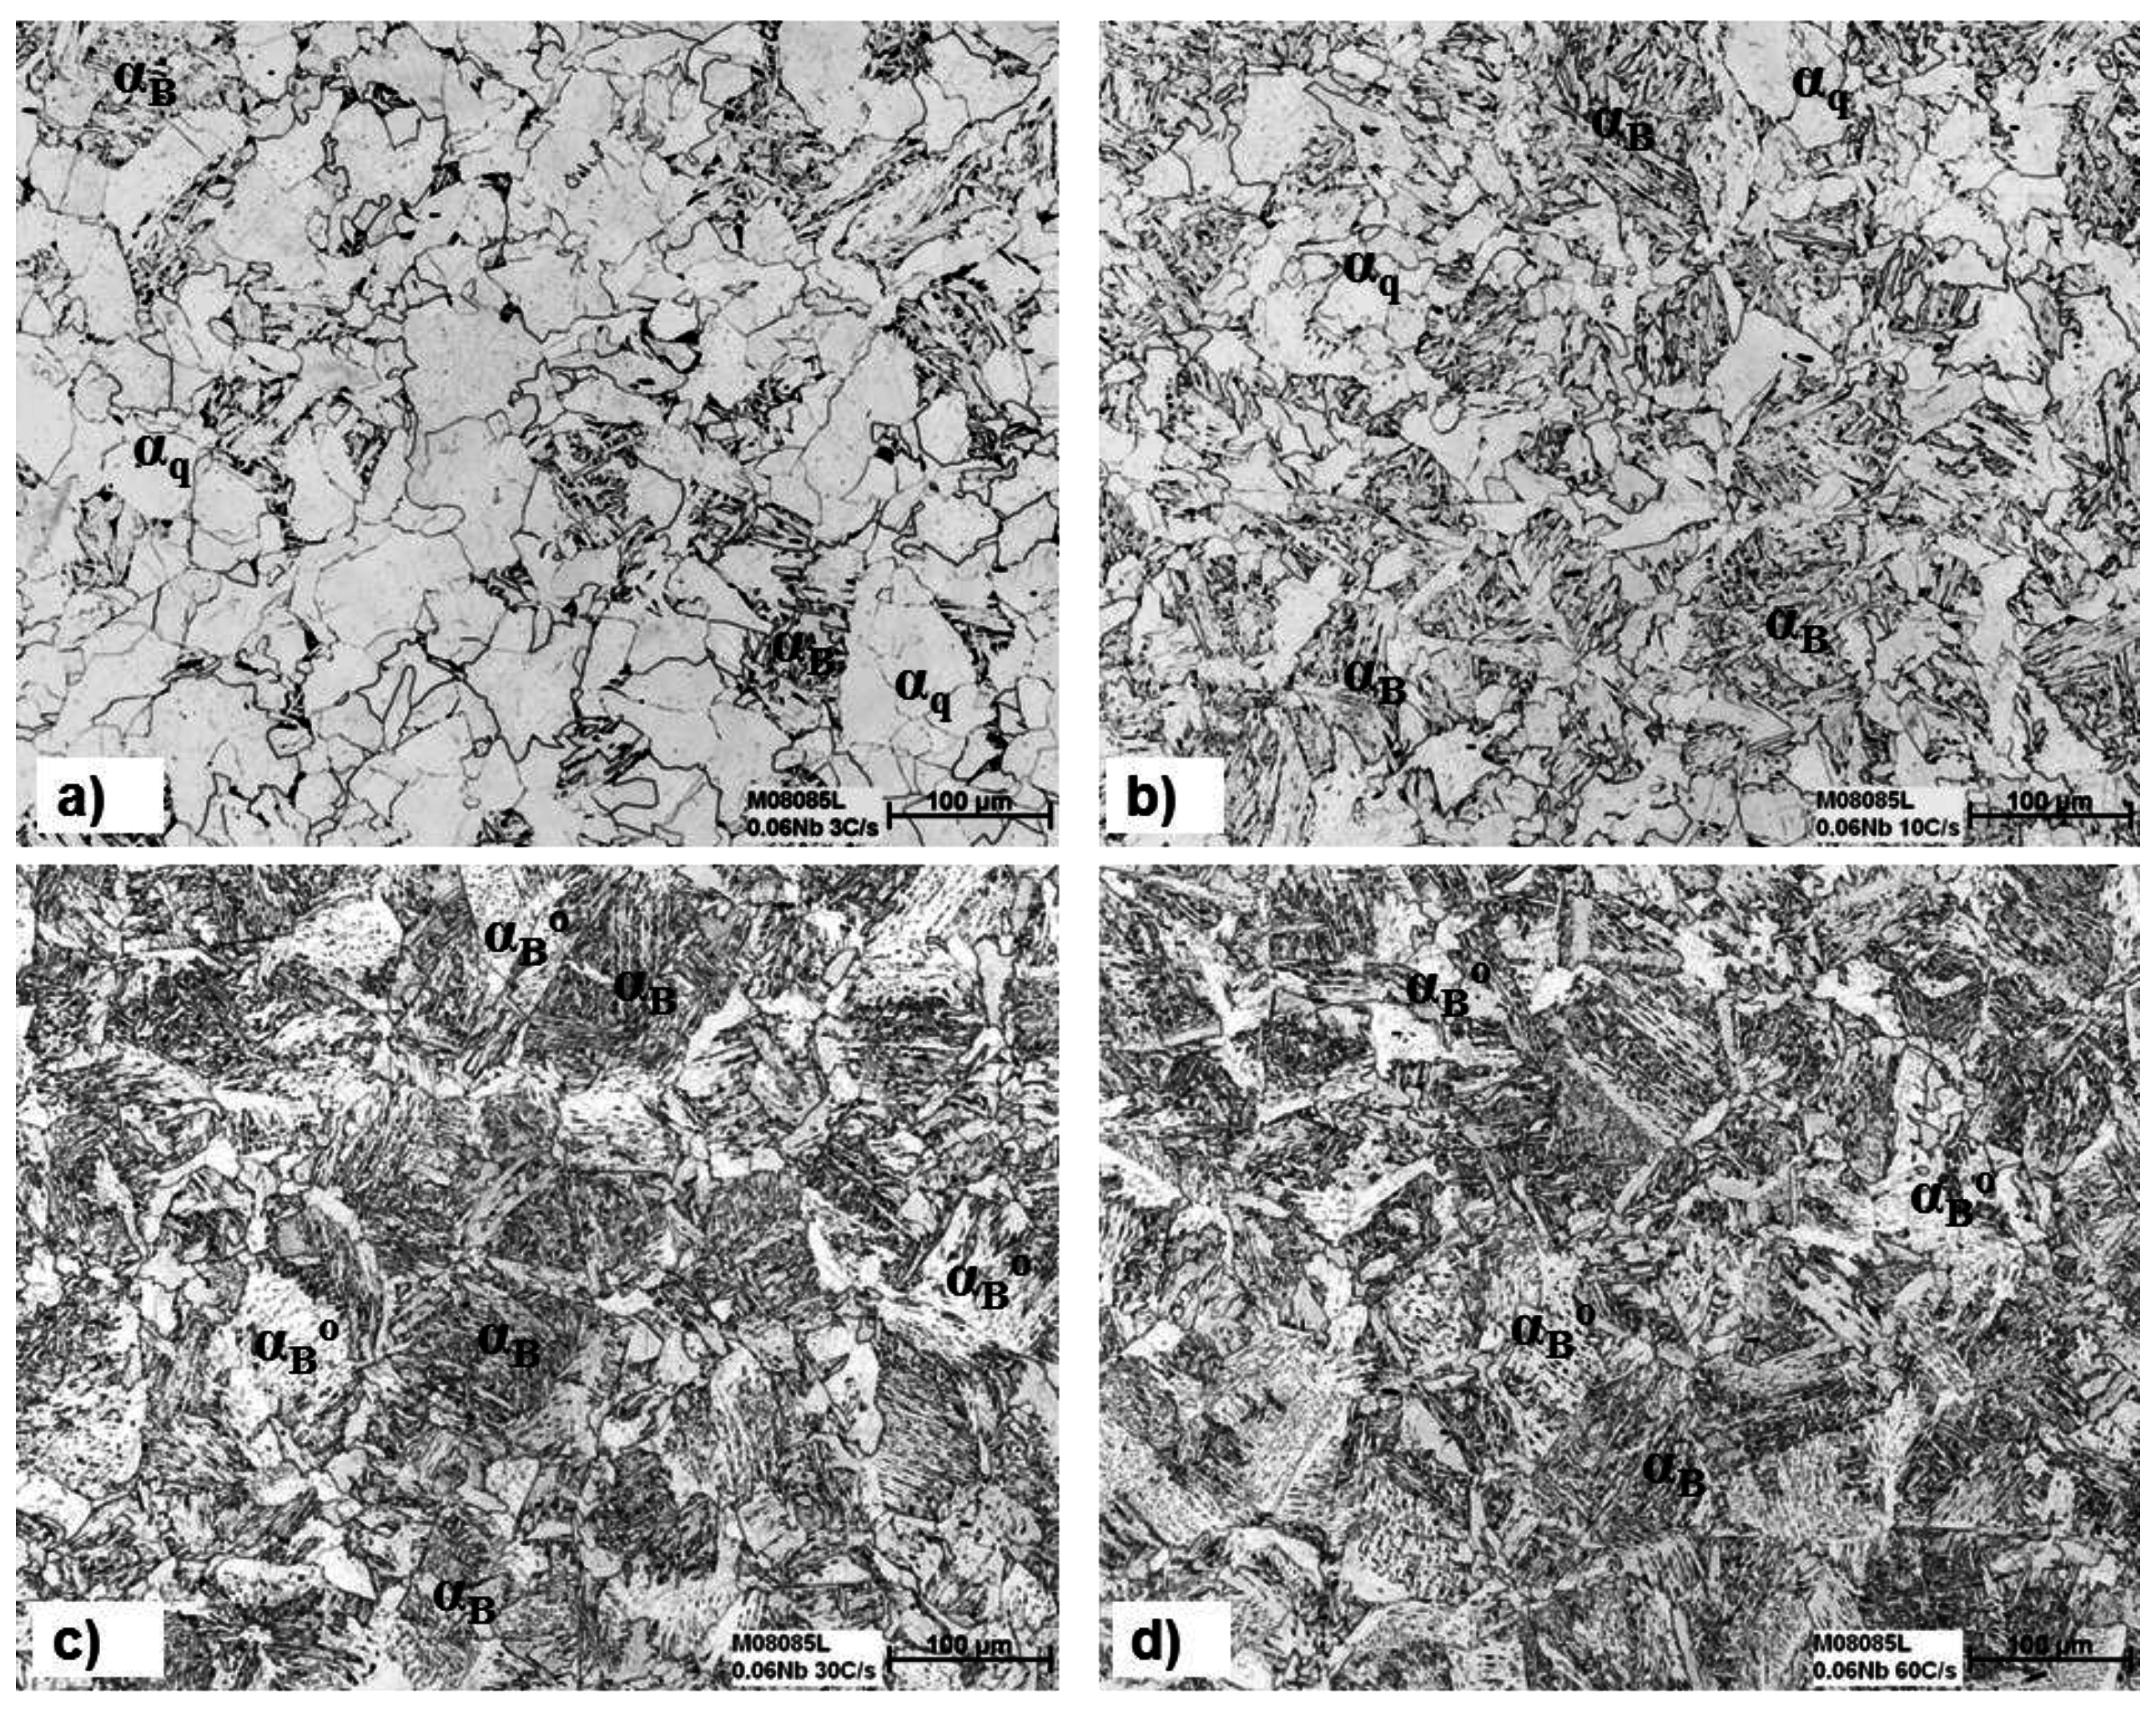
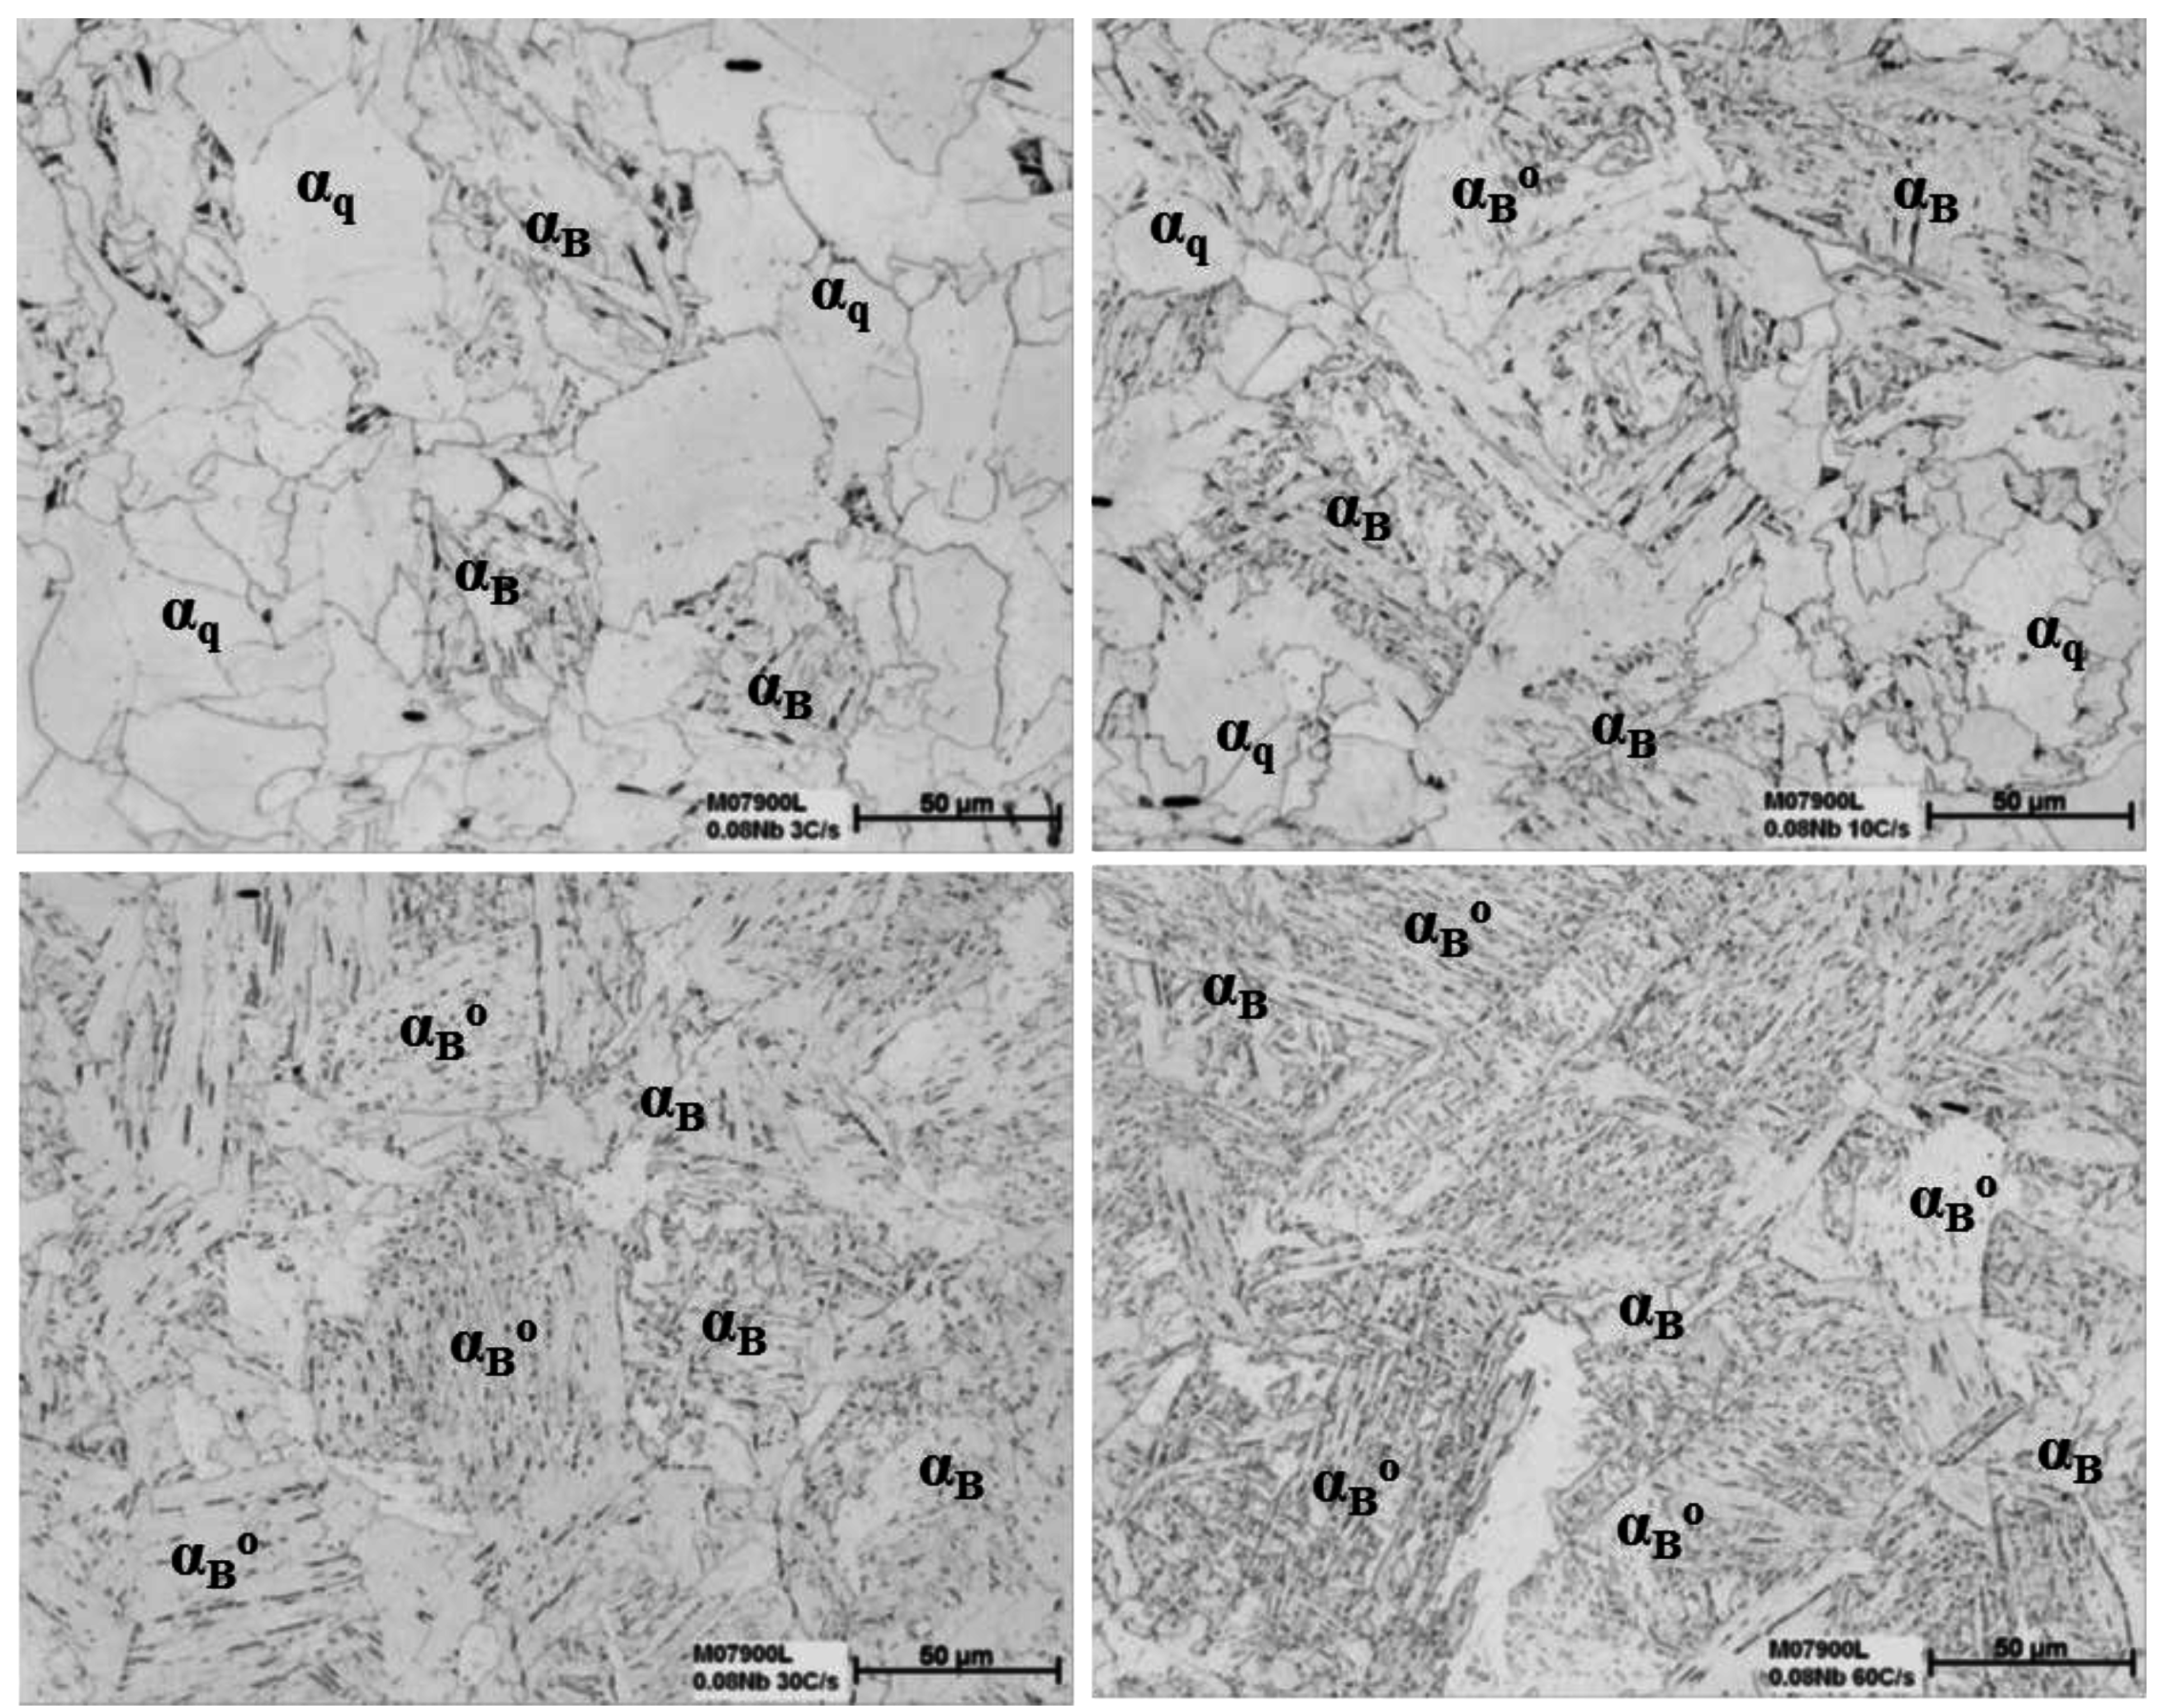
3.1. Phase Nomenclature for Low Carbon Steels

Due to the nature of continuous cooled experiments, austenite transformation takes place over a range of cooling rates and temperatures. This can lead to a wide variety of ‘lower transformation products’, which transform between the phases polygonal ferrite (PF) and martensite. In general, as the cooling rate increases, transformation products become finer, more plated-like, more dislocated and as a consequence, harder and stronger [20]. These mixed microstructures can be difficult to interpret and different nomenclatures have been developed to identify different phases. As mechanical properties are strongly related to microstructure, i.e., grain size, morphology, dislocations, grain boundary phases and second phase products, carefully defining different phases is important as phases with different morphology denote different mechanical properties.
For low carbon, low alloy steels, classical interpretations of lower transformation products, such as by Bhadeshia [21], Bramfitt and Speer [22] and Ohtani and Ohmori [23], are somewhat inadequate as carbides and retained austenite often do not form in low carbon steels. All of the above systems heavily rely on carbides, where the dominate phase is cementite, in defining bainitic morphology. For example; upper bainite consists of fine plates of ferrite that grow in parallel clusters, called sheaves, which are separated by cementite particles. Lower bainite has similar morphology to upper bainite but is distinguished by the presence of aligned cementite particles within the ferrite plates/laths. The classification that best reflects the low carbon requirements of UCS steel is the ISIJ nomenclature from the “Atlas for Bainitic microstructures”, [24] and was adopted for this work, where Table 2, reproduces the relevant phase descriptions. The only phase not specifically covered in the ISIJ nomenclature, but required for UCS steels, was acicular ferrite (AF). UCS steels feature large prior austenite grain sizes and the inclusion engineering practices provides suitable non-metallic inclusions for the nucleation of ferrite laths at intragranular locations, that is, AF [25,26,27].
Table 2. ISIJ Transformation Products Nomenclature and Classification [24].
SymbolNomenclatureCharacteristics—Major Matrix phases
αpPolygonal FerriteEquiaxed, polyhedral shaped, mostly recrystallized
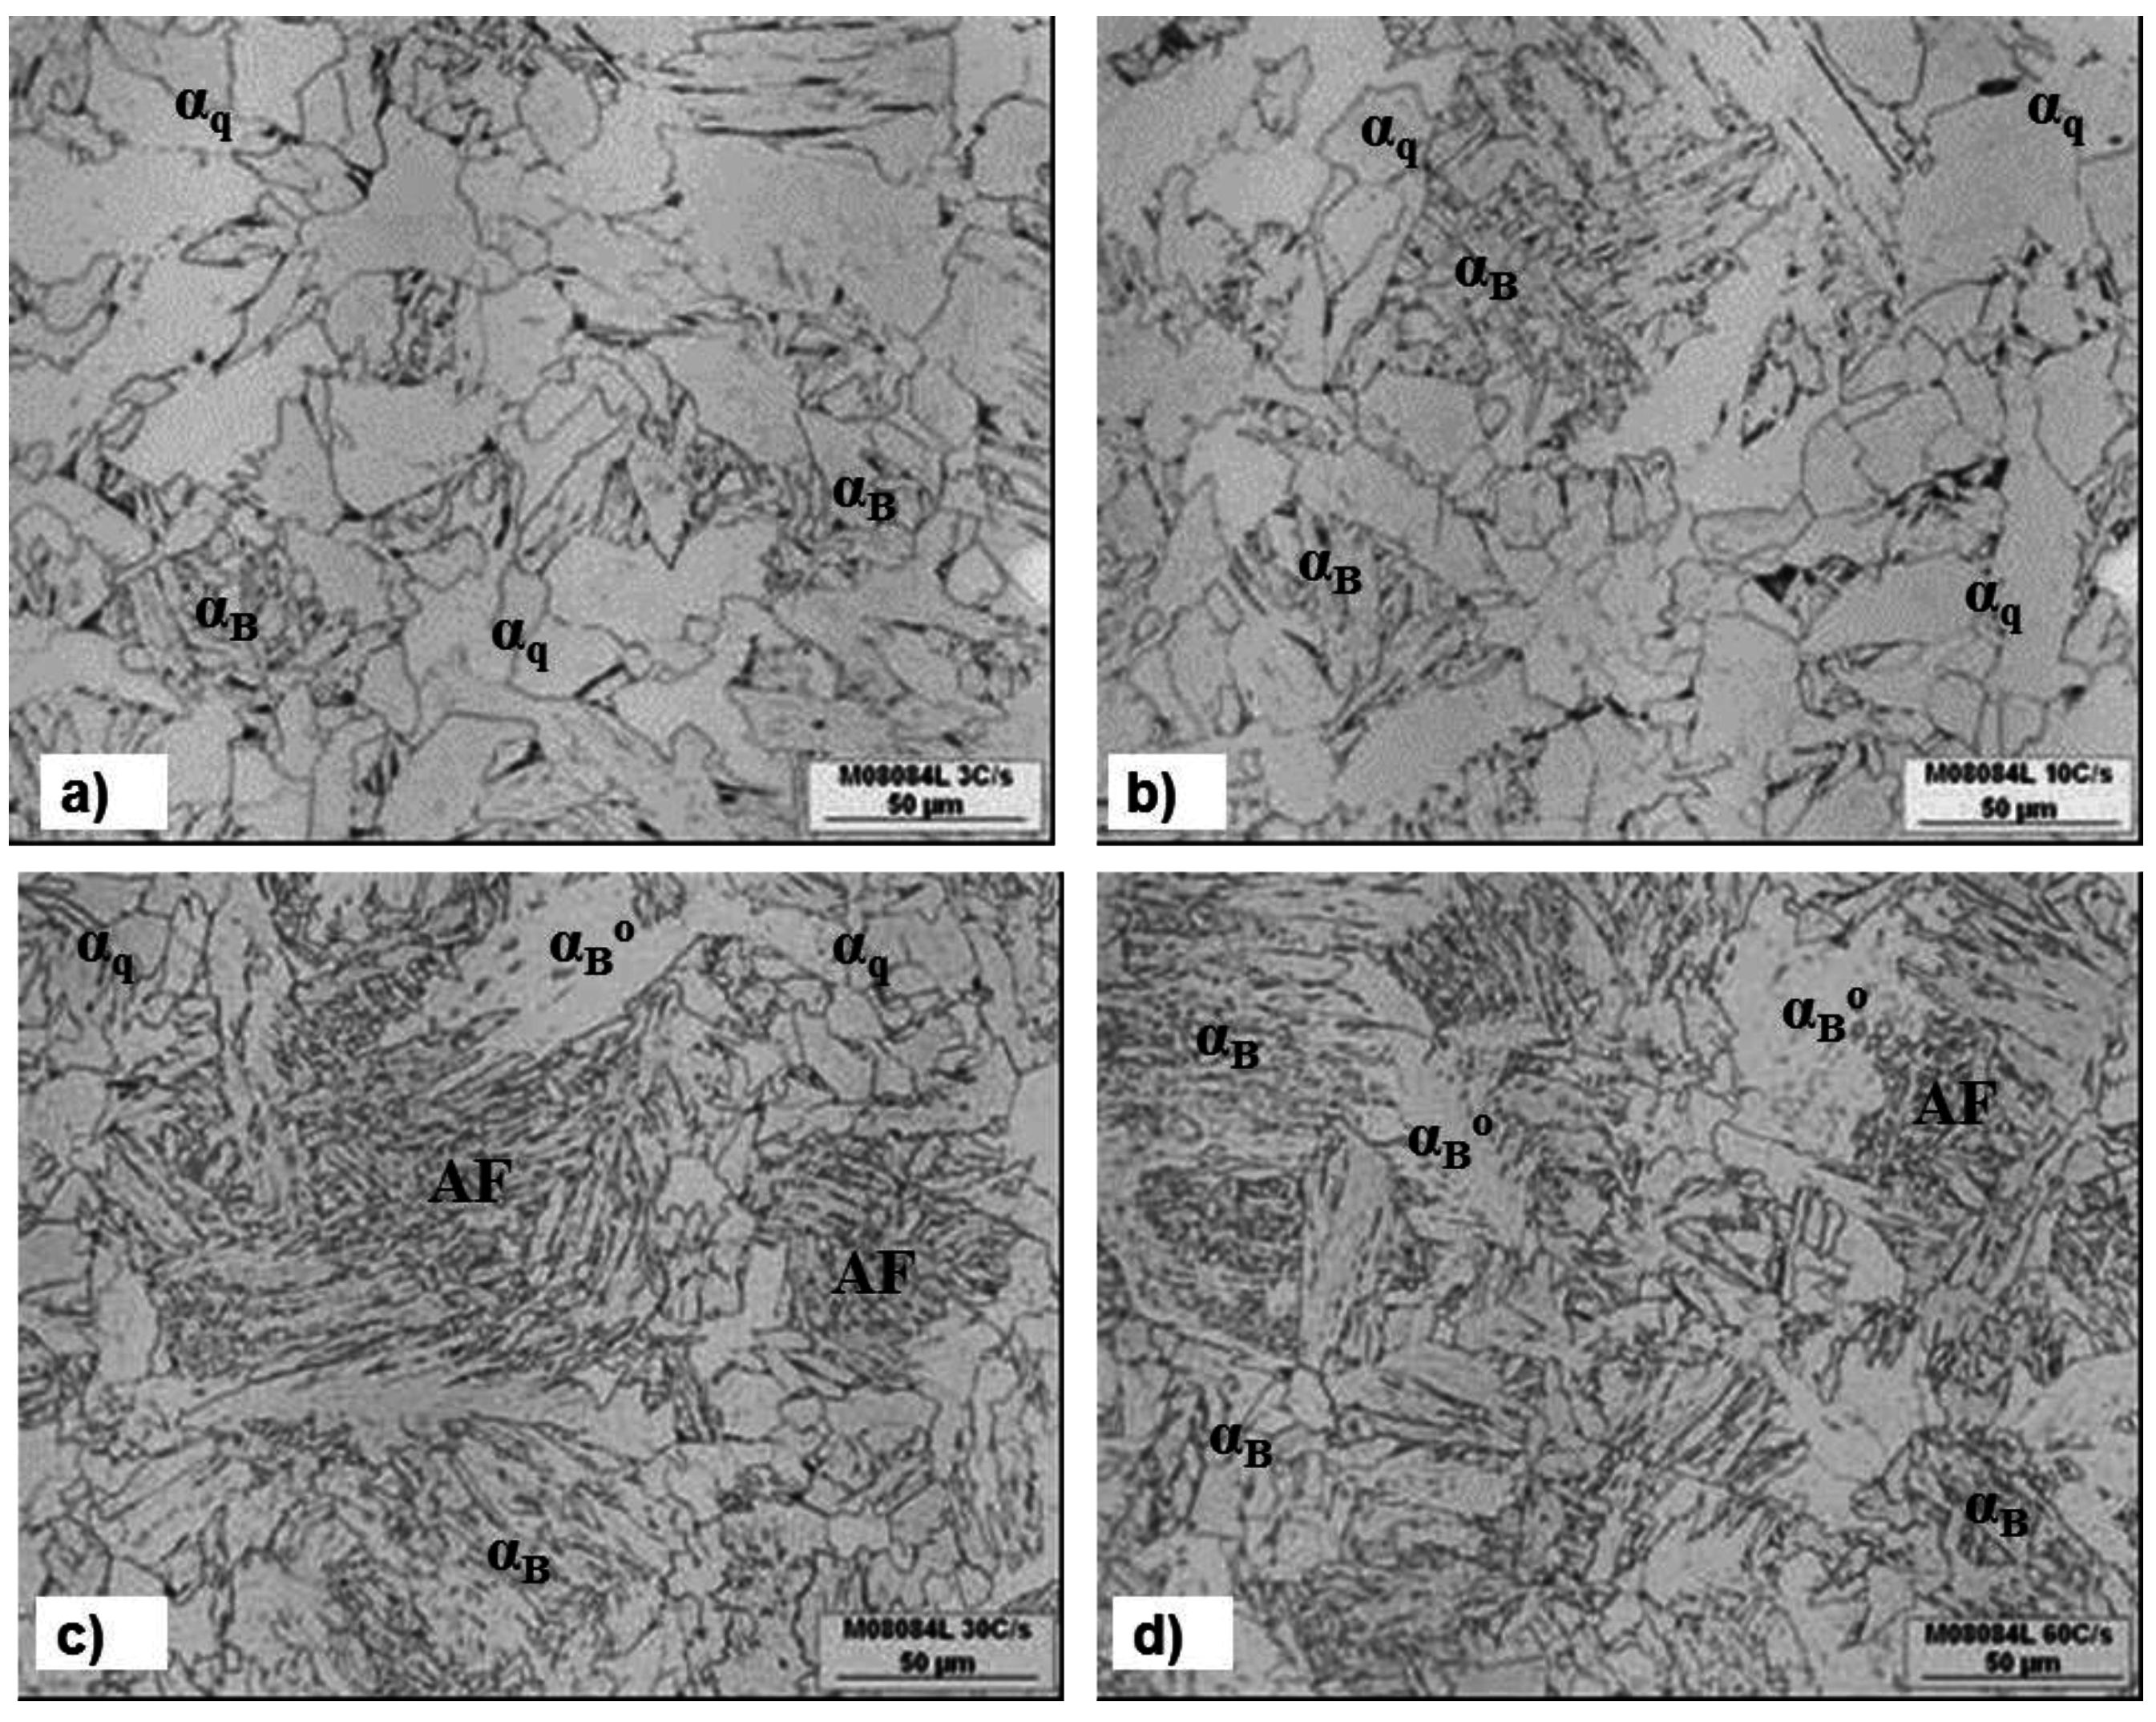
αqQuasi-polygonal αIrregular changeful shape, formed at lower temperature crossing over γ-grain boundary, mostly recovered
αwWidmanstätten αCharacteristic lath/plate-like shape; not usual in very low-C steels, mostly recovered
αB (Zw)(Granular bainitic) αGranular bainitic ferritic Zw structure; dislocated substructure but fairly recovered like “lath-less”
αB°Bainitic FerriteSheaf-like with laths but no carbide; conserving the prior γ-grain boundary, generally enough dislocated
Minor Secondary PhasesC-enriched and scattered in Islands or films
PPearliteEutectoidal reaction product

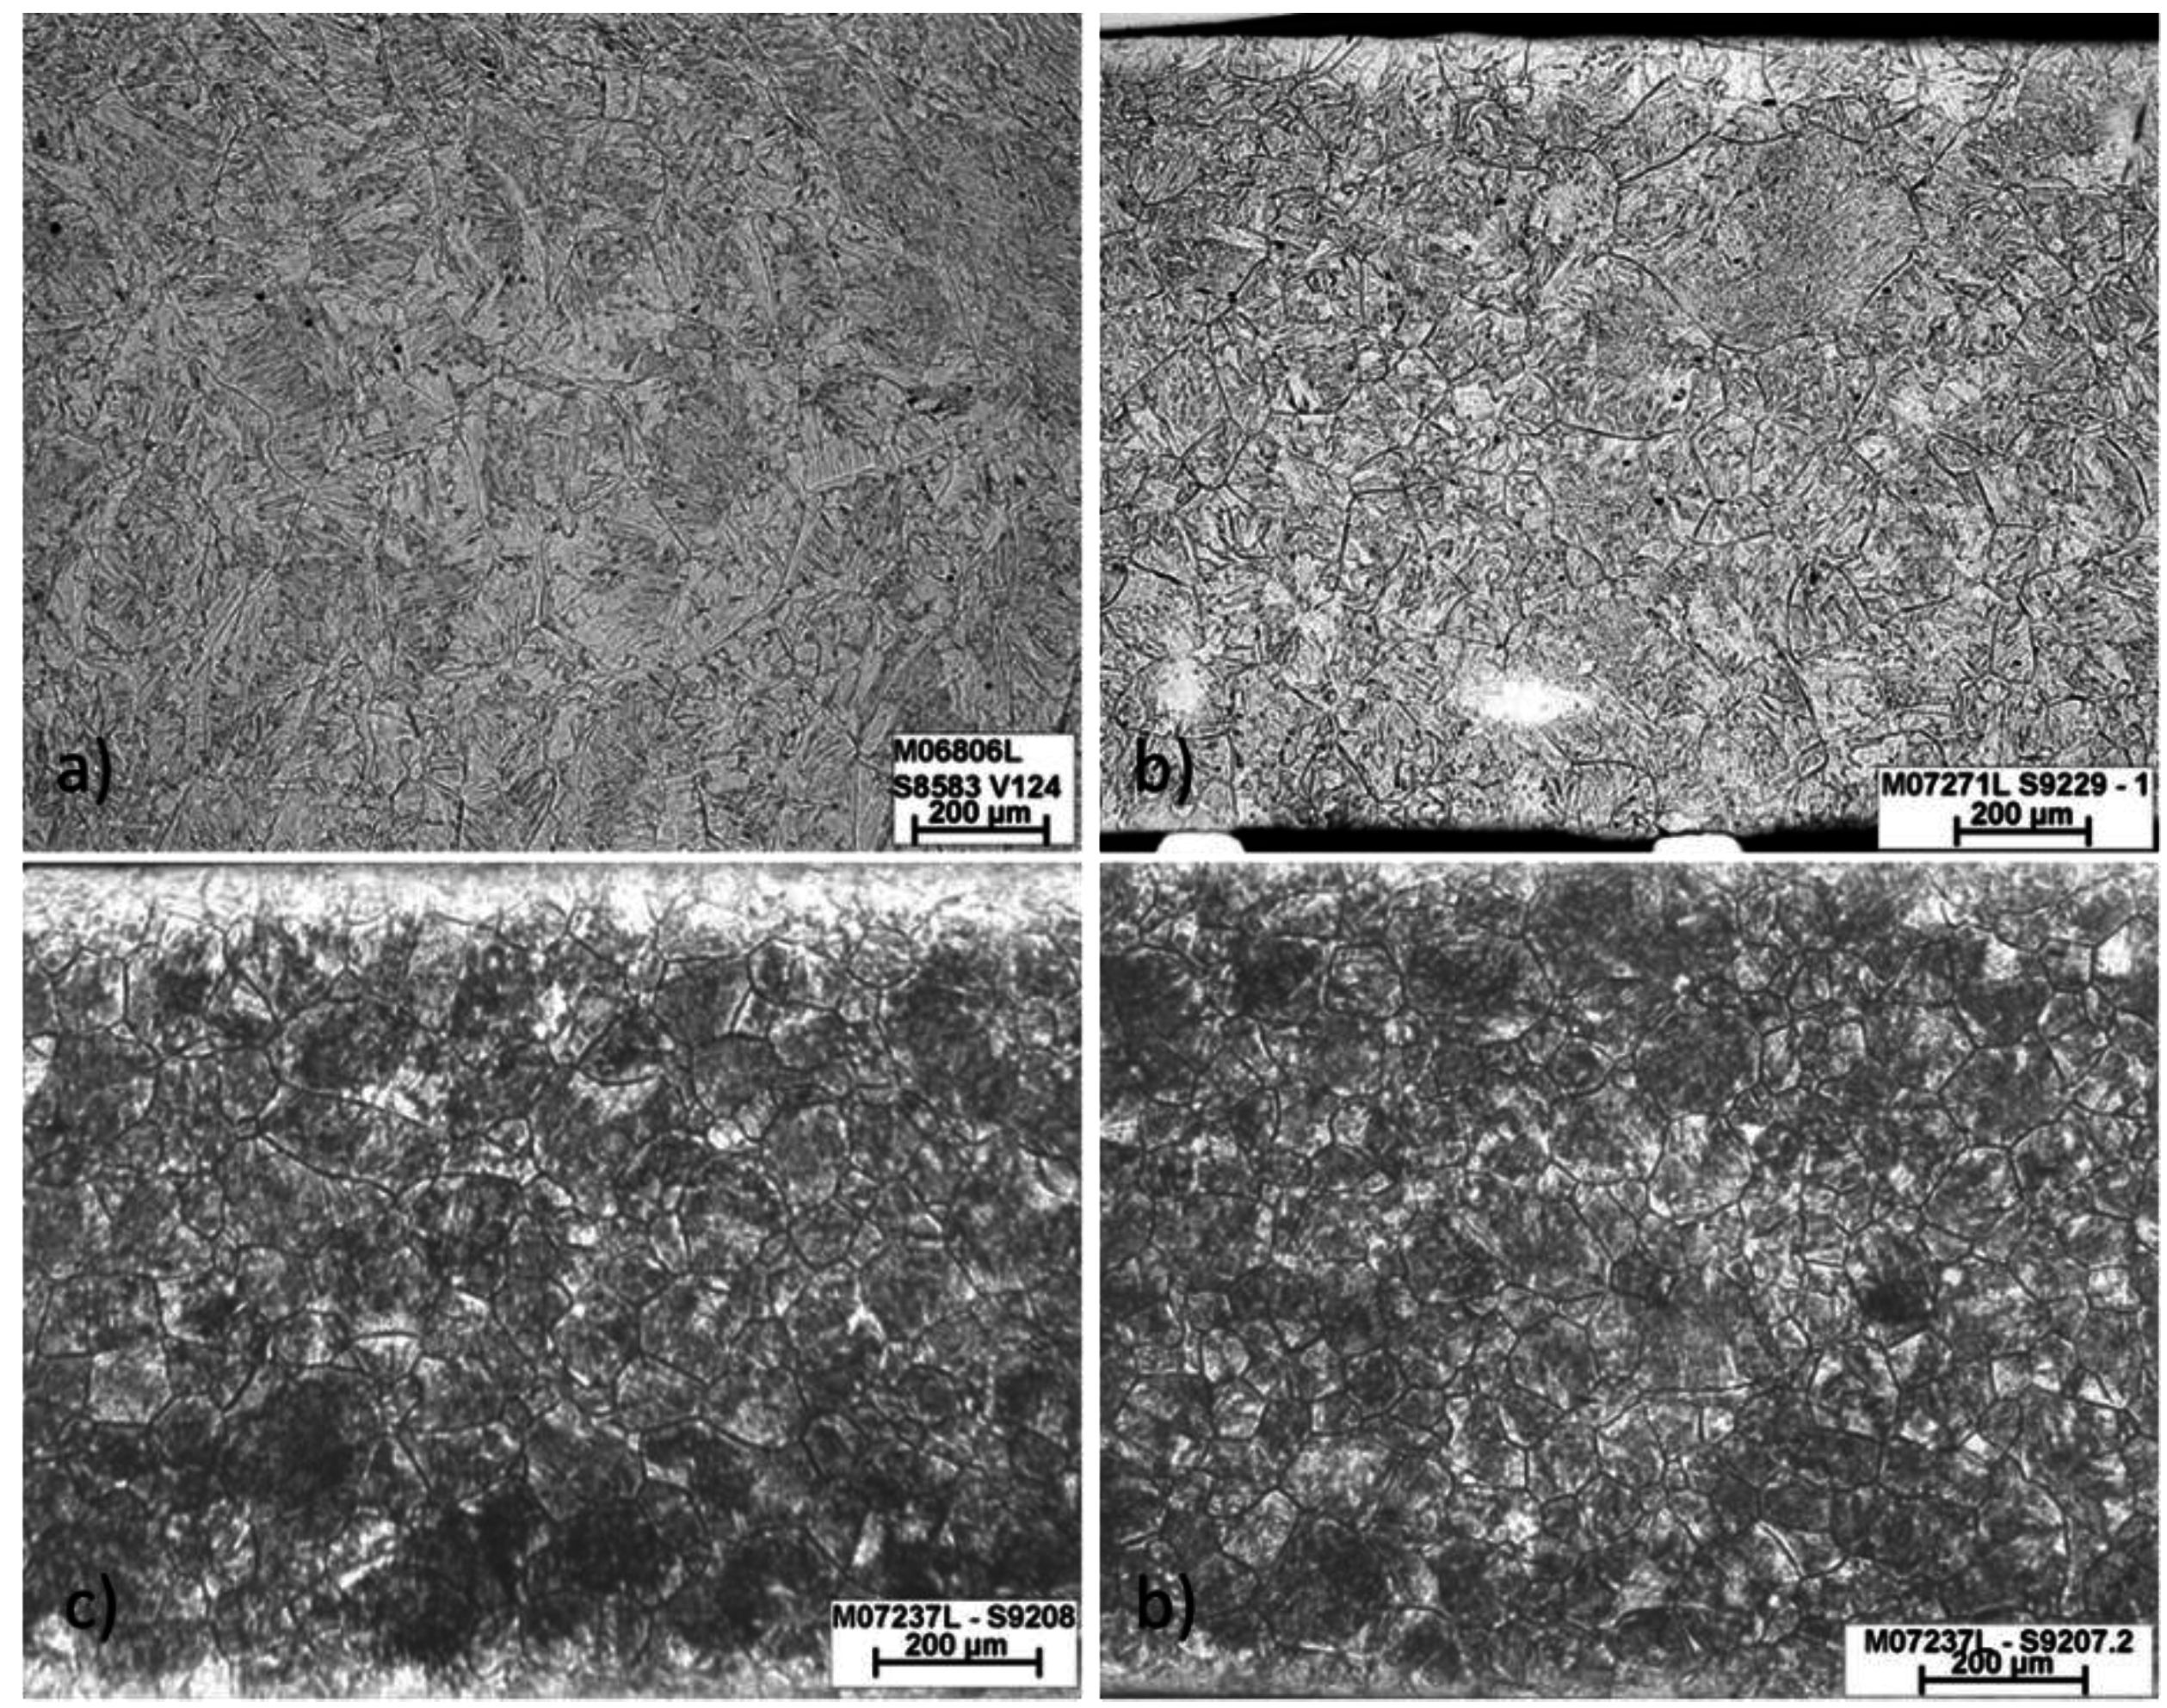
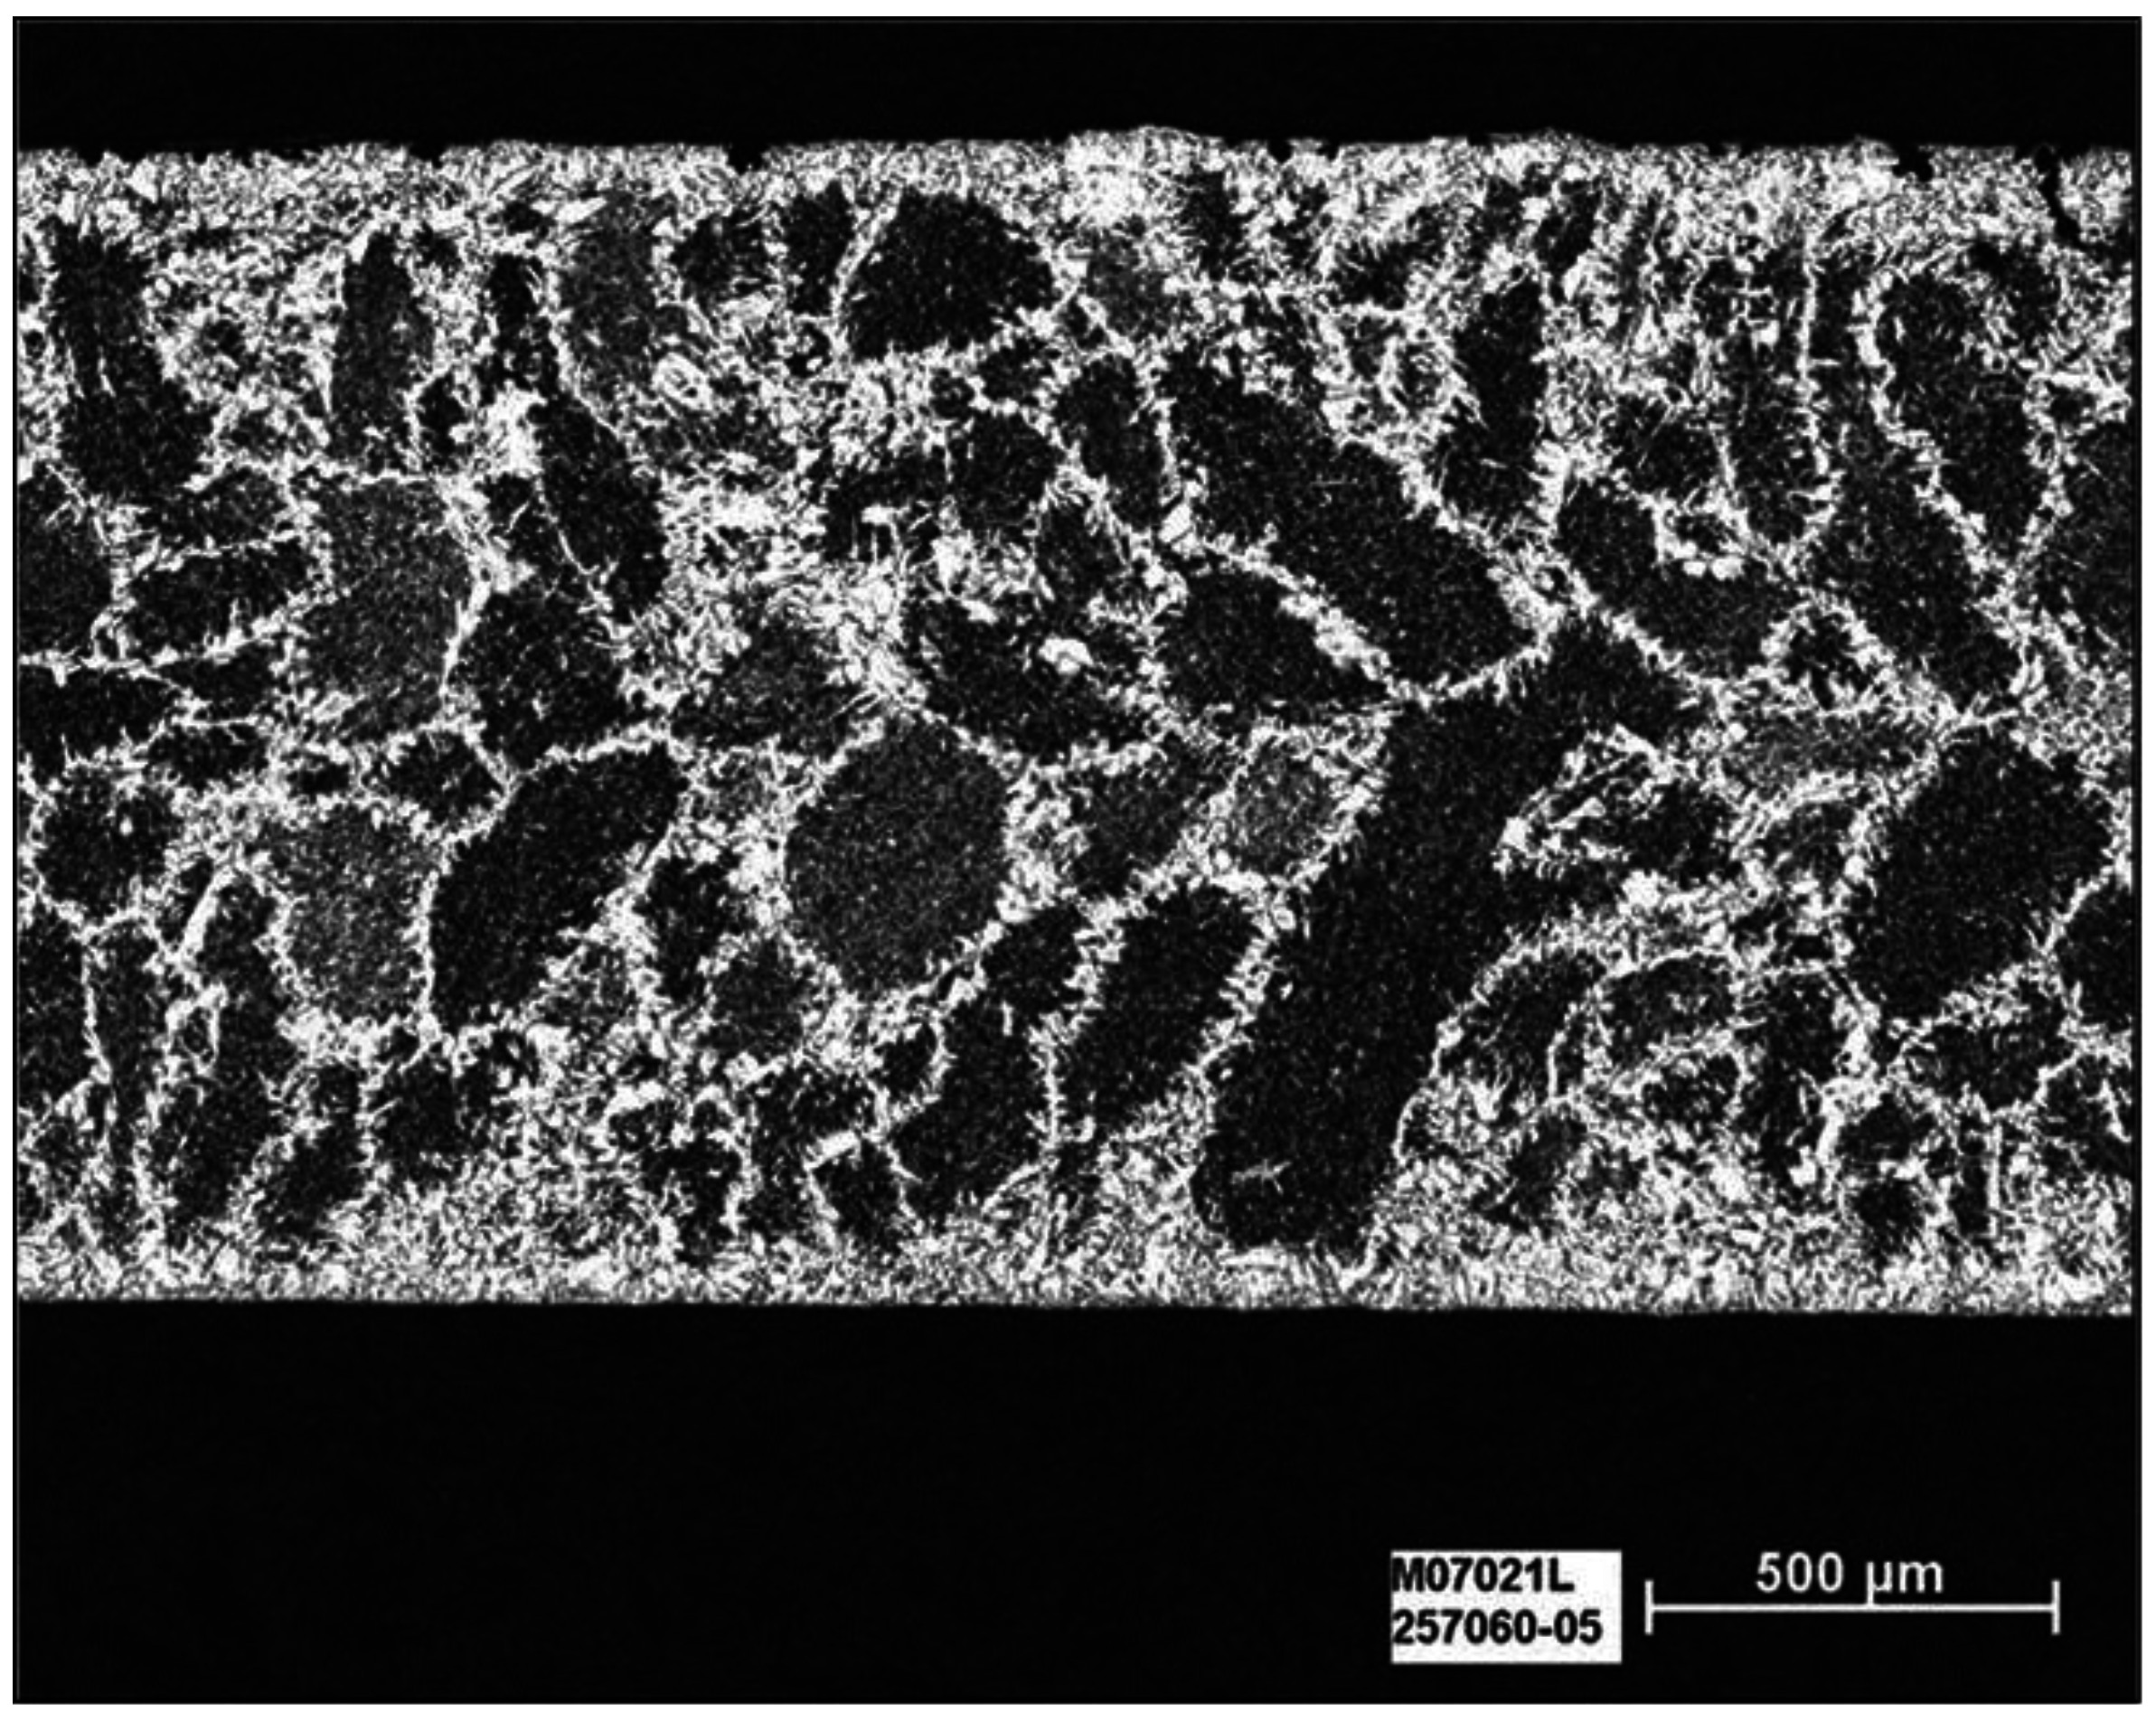
3.2. Prior Austenite Grain Size

The prior austenite grain size (PAGS), was examined for selected chemistries, Base, 0.04% Nb and 0.08% Nb, and the results are shown in Table 3. The austenite grain size was of the order of 70–120 µm, relatively large, but still smaller than the coarse austenite grain size produced by the CASTRIP process. Prior austenite grain sizes produced in production are typically 150–200 µm when equiaxed, but can typically reach 450–500 µm long, when columnar grains are produced [25]. Higher holding temperatures, to increase austenite grain size, were not possible using the current machine setup. Consequently, the dilatometer CCT work may underestimate the hardenability effect of Nb during production due to the smaller starting austenite grain size, but was considered suitably large for hardenability studies.
Table 3. Prior austenite grain size (PAGS), for base, 0.04% Nb and 0.08% Nb CASTRIP Steel.
GradeBase0.04% Nb0.08% Nb
PAGS (µm)1248174
An example of large columnar austenite grains for a C-Mn base grade CASTRIP steel is shown in Figure 2. In Figure 3a, the PAGS of a production base grade is compared to the simulated PAGS (Dilatometer tests) for (b) the base grade, (c) 0.04% Nb grade and (d) 0.08% Nb grade.
Figure 2. Prior austenite grains are clearly delineated with proeutectoid ferrite in a production CASTRIP, Base grade.
Metals 05 01857 g002
Figure 3. PAGB’s revealed by saturated aqueous solution of picric acid for (a) Production produced Base CASTRIP, (b) base grade (CCT work), (c) 0.04% Nb (CCT work) and (d) 0.08% Nb (CCT work).
Metals 05 01857 g003

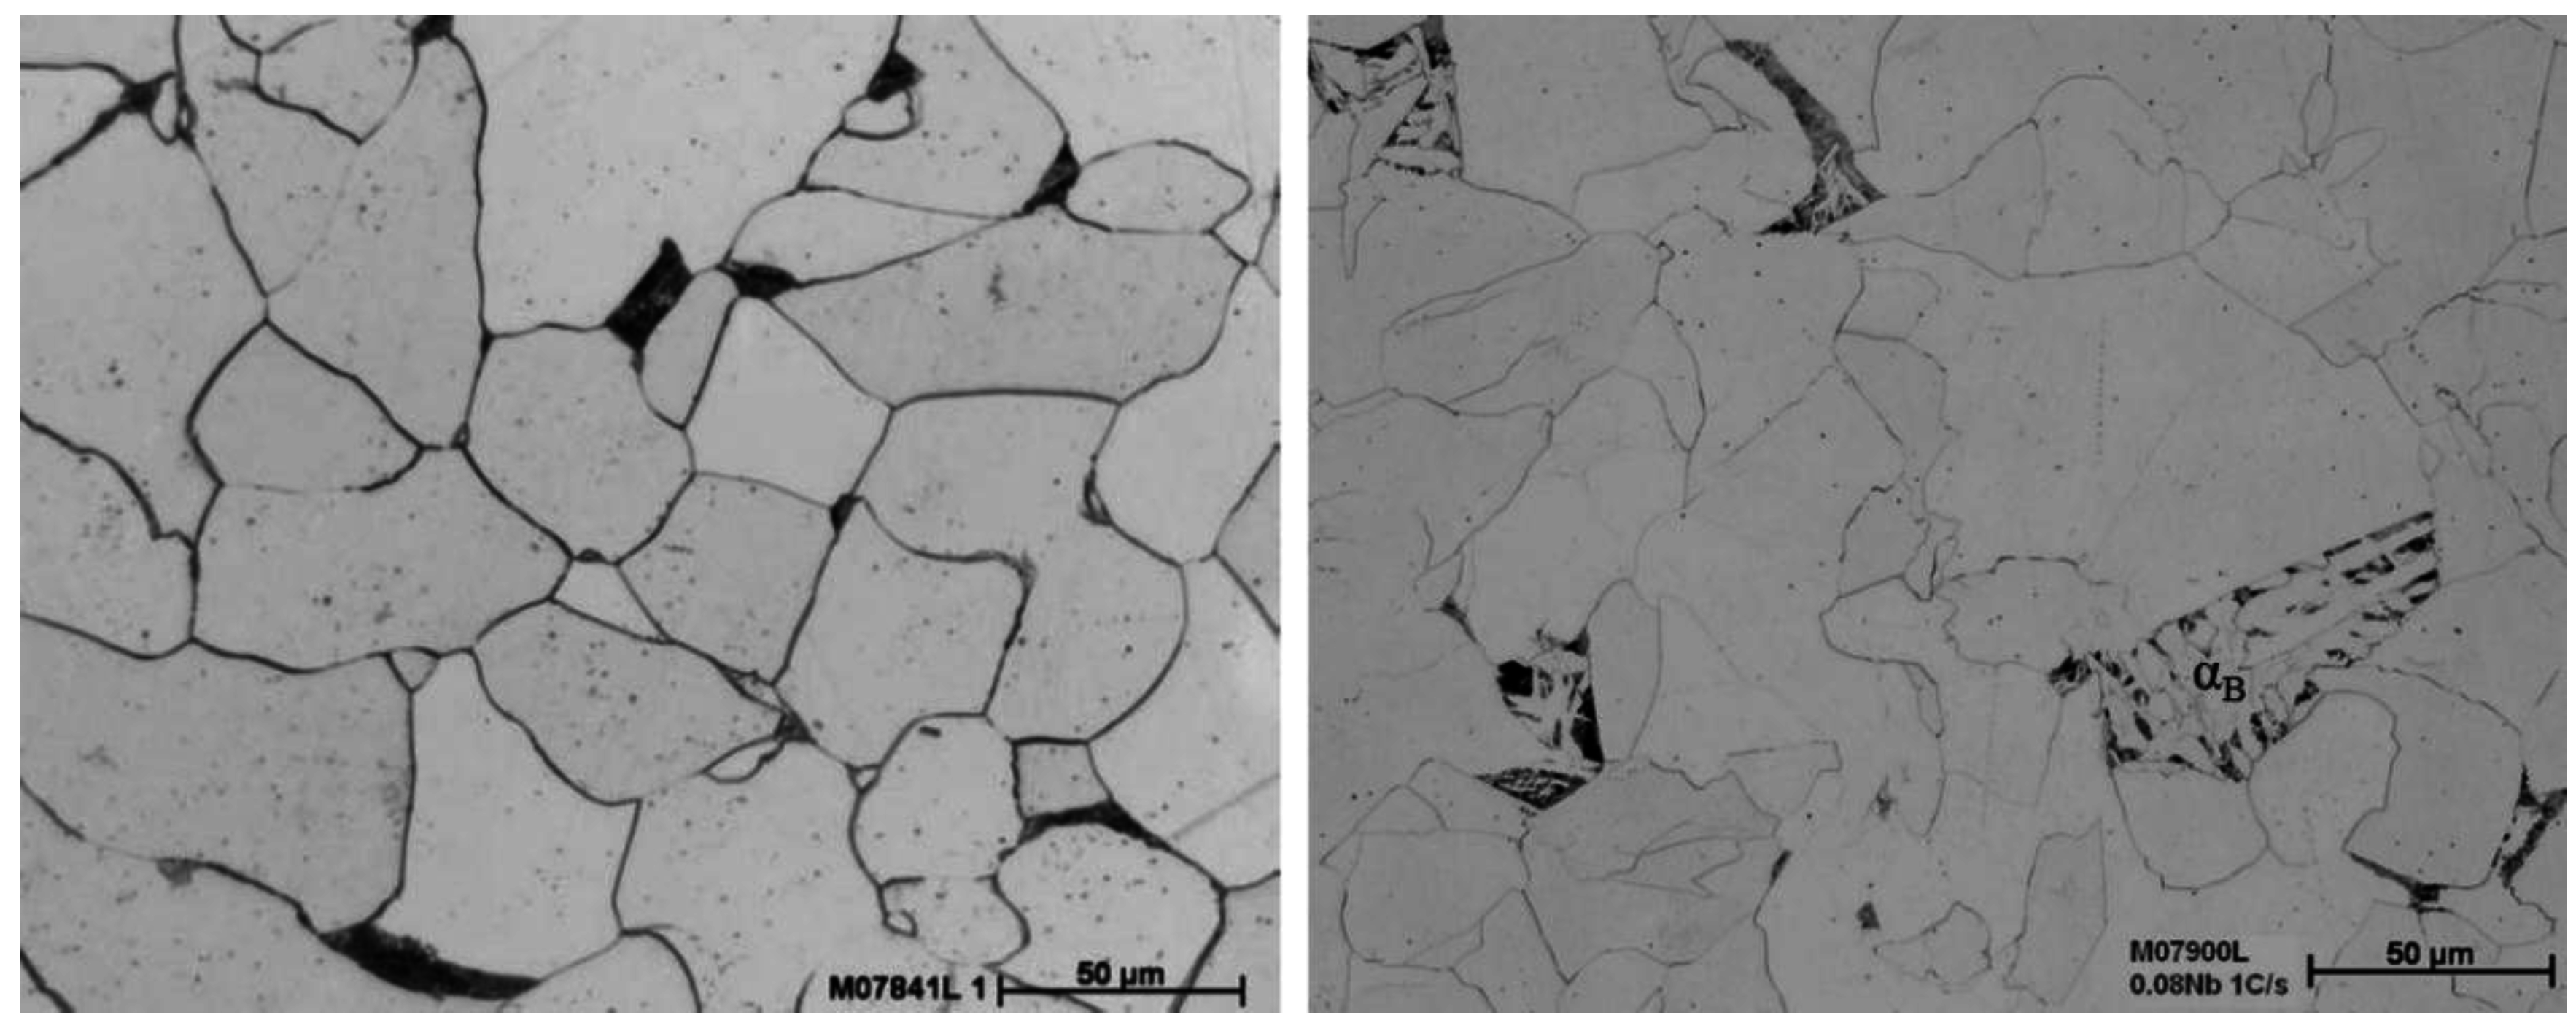
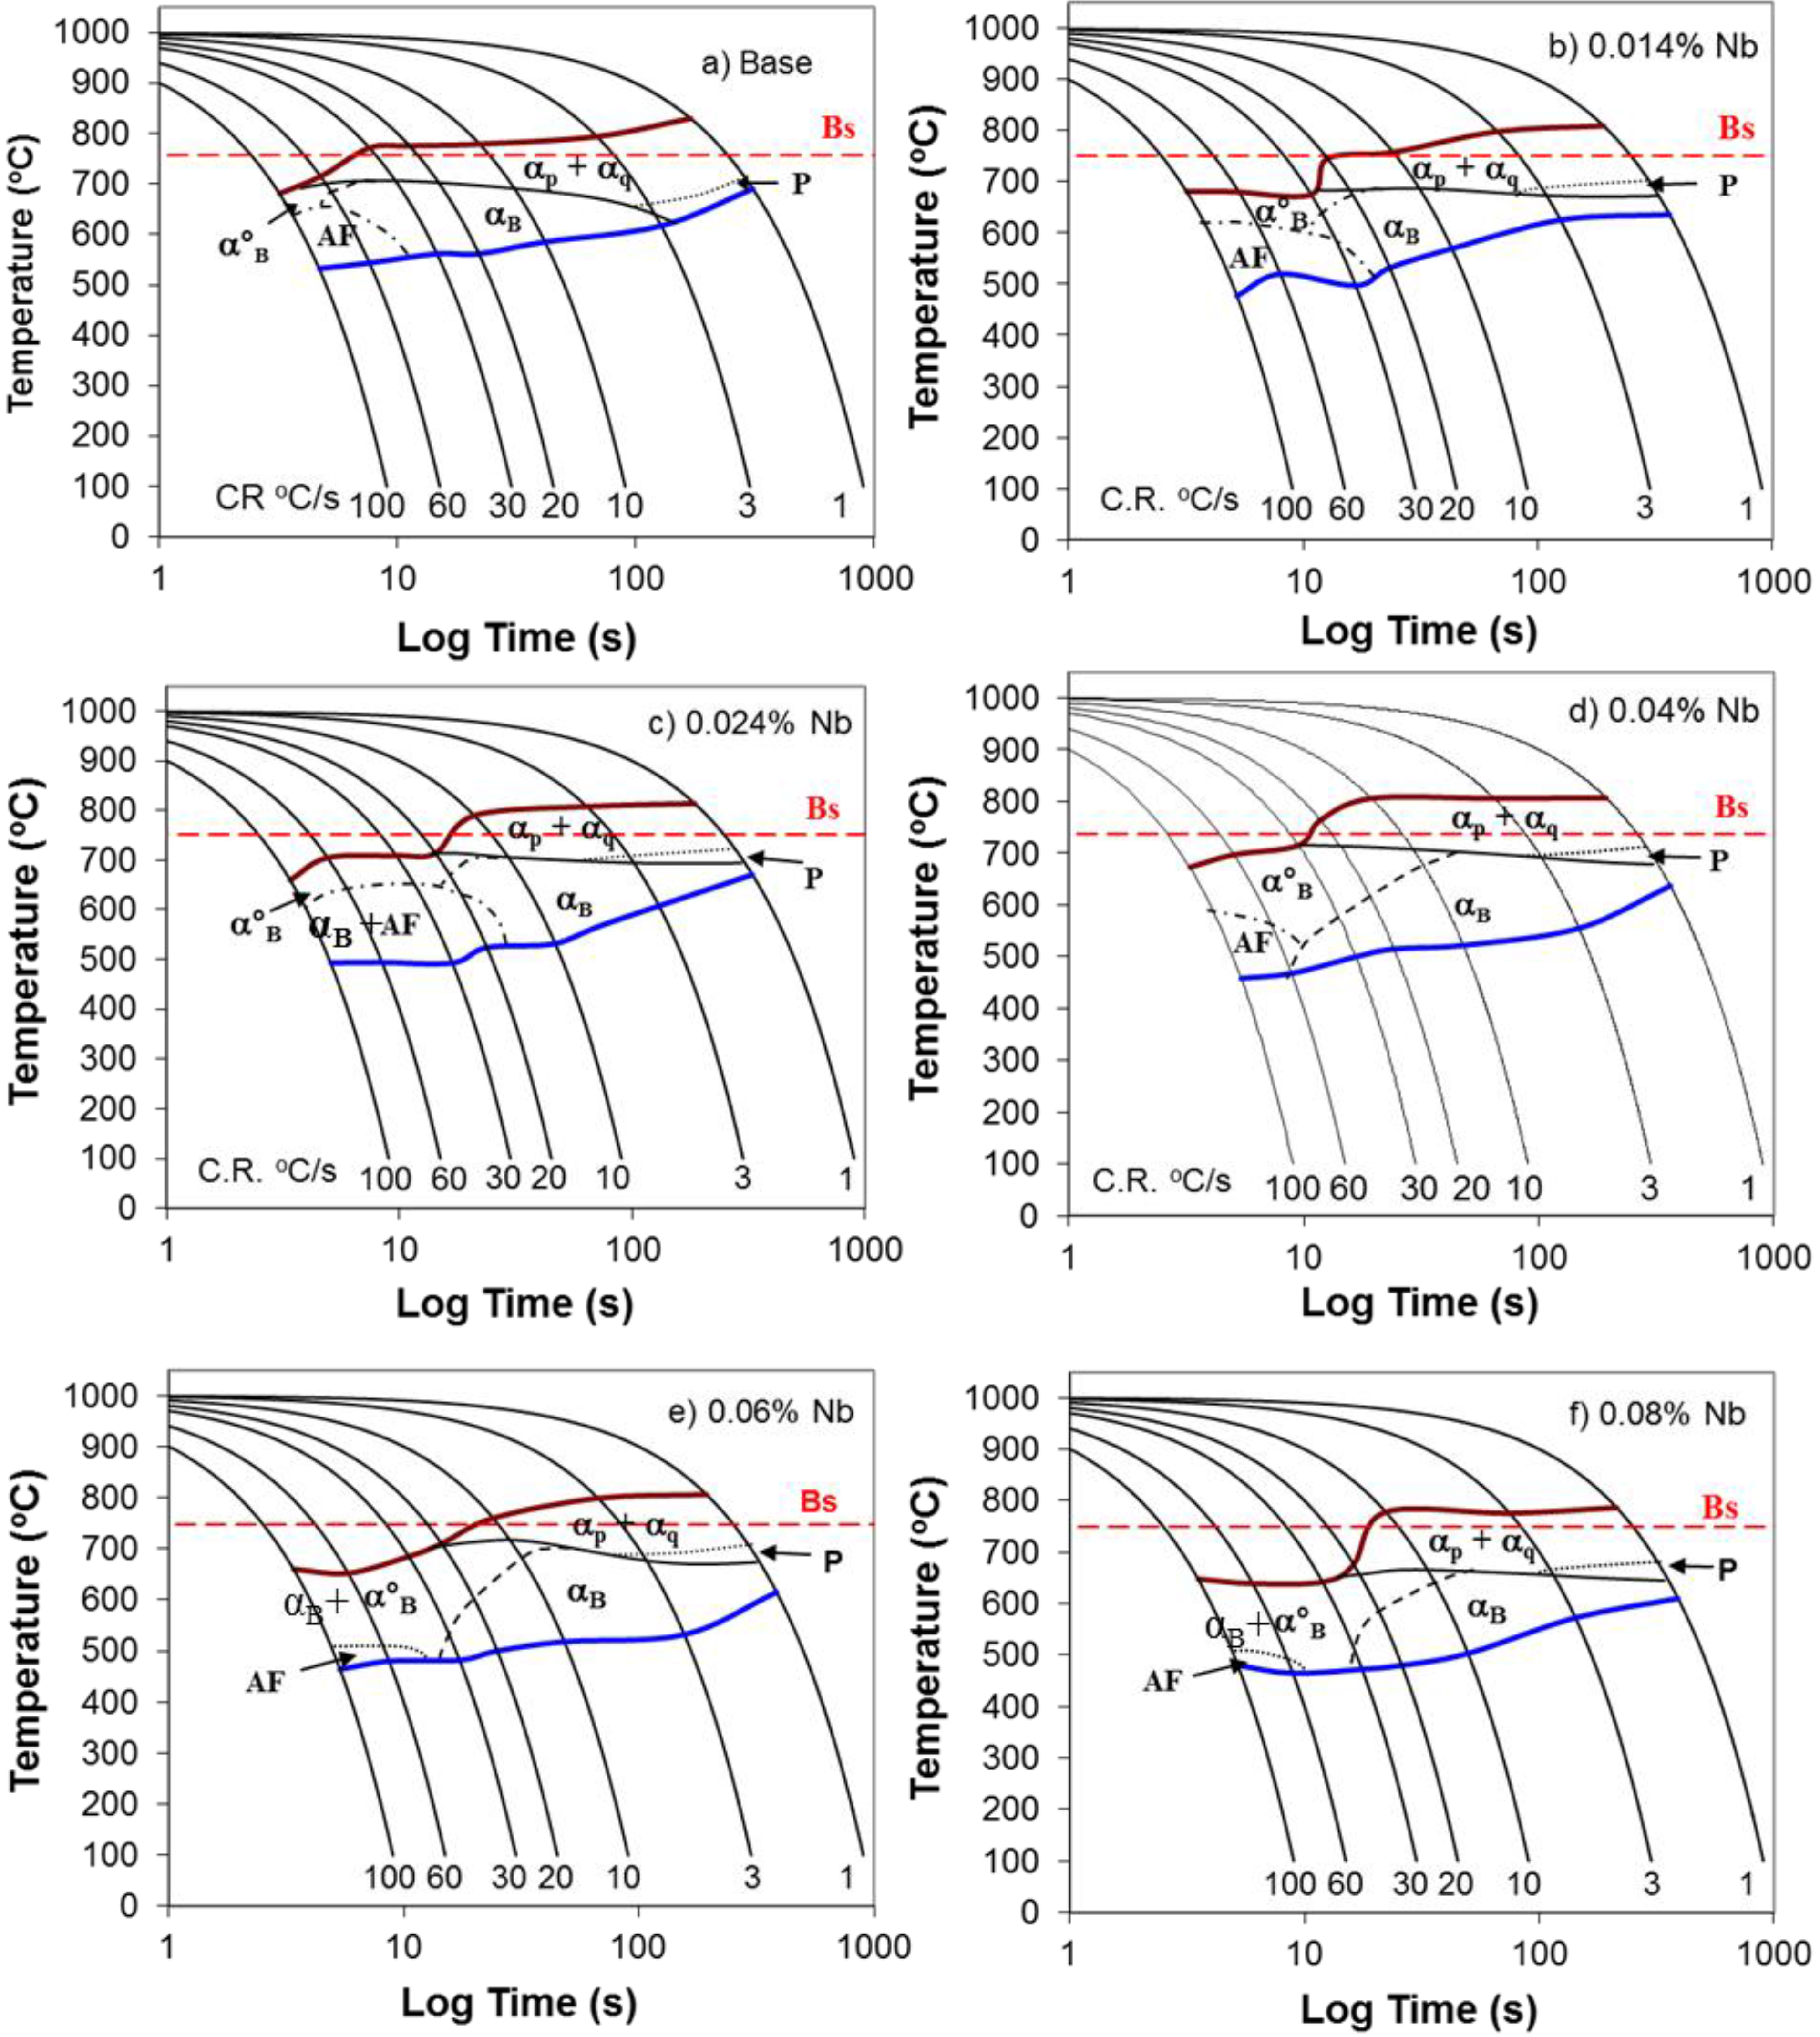
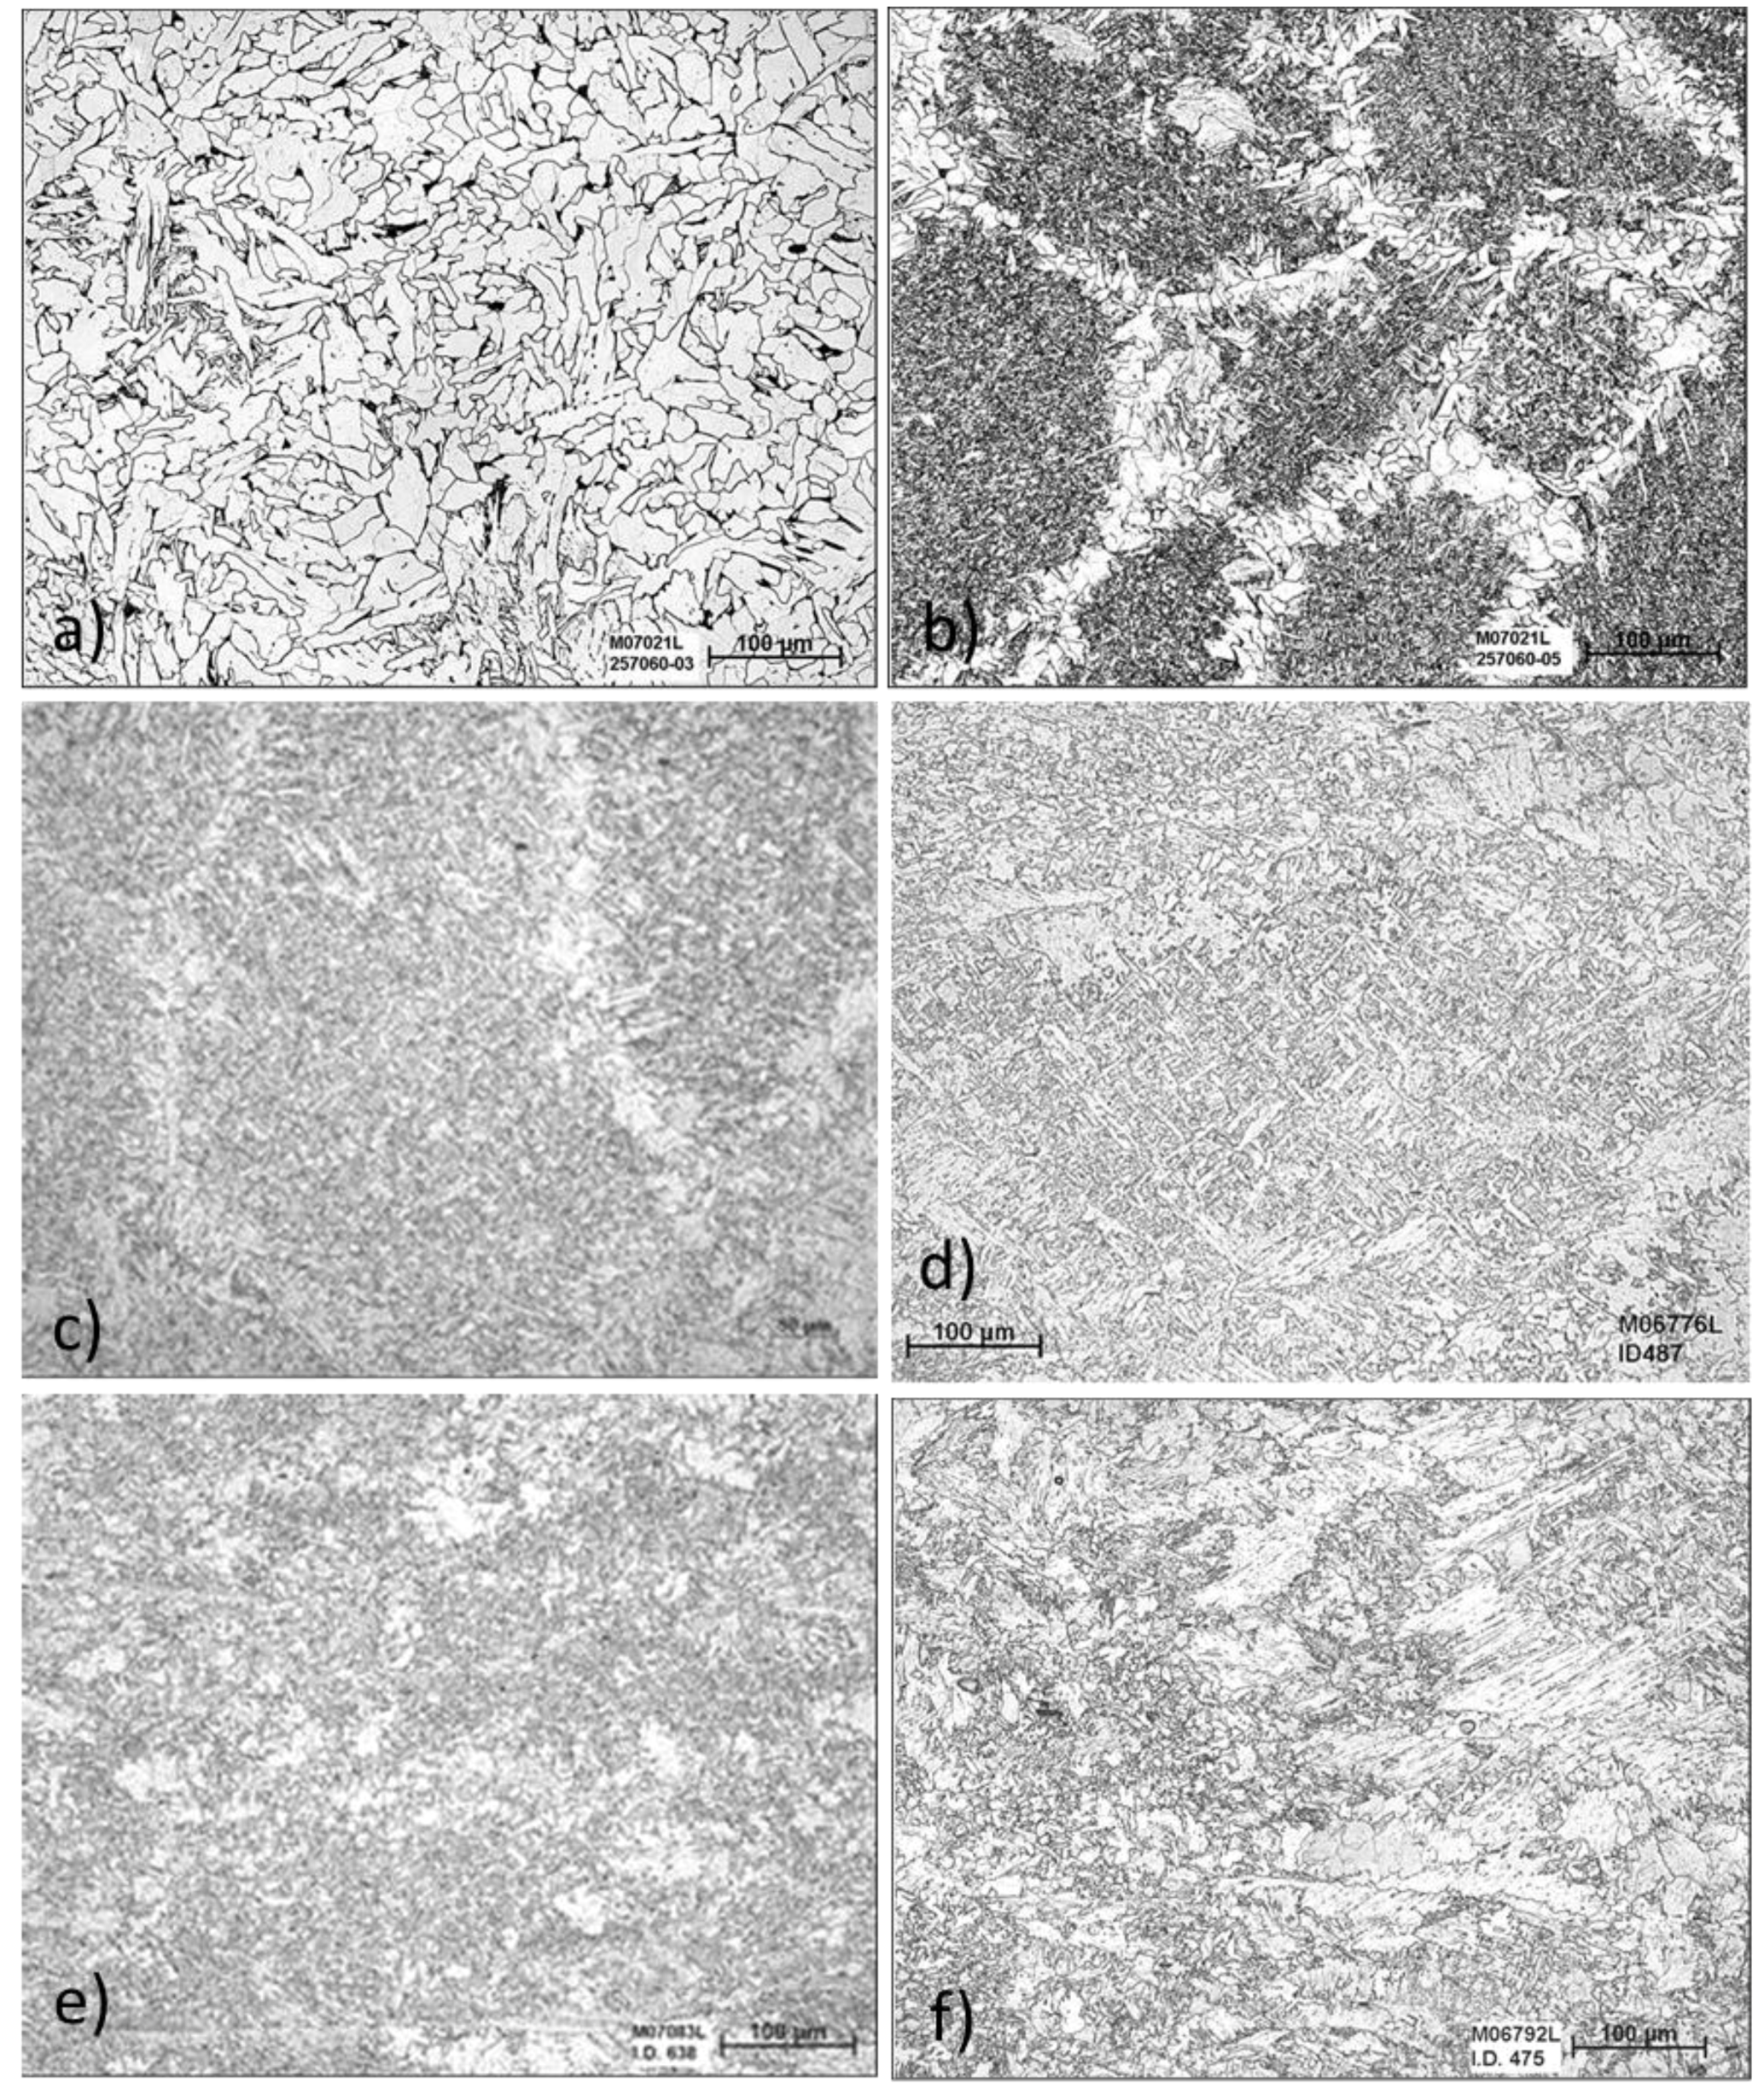
3.3. The Effect of Cooling Rate on Transformed Microstructures

At the slowest cooling rate of 1 °C/s, polygonal ferrite was the dominate phase but the effect of adding Nb can be readily observed, the polygonal ferrite showed a greater degree of irregularity and there were several small regions of intragranular coarse ferrite laths mixed with carbides (can also be referred to as coarse acicular ferrite), as shown in Figure 4. These intragranular regions corresponded to the final regions of austenite which transformed via a displacive mechanism to an intermediate phase once the transformation temperature was too low for the reconstructive polygonal ferrite transformation to continue. Even at a cooling rate of 1 °C/s, the addition of 0.08% Nb delayed the transformation of ferrite, which evidences the potent effect on hardenability of solute niobium.
Figure 4. Optical micrographs for a cooling rate of 1 °C/s, showing the effect of Nb, where (a) base grade (0% Nb), consisting of regular ferrite and pearlite and (b) 0.08% Nb Steel, showing a greater degree of irregularity of the ferrite plus regions of granular bainite, αB.
Metals 05 01857 g004
Figure 5. Optical microstructures for base UCS dilatometer samples cooled at (a) 3 °C/s, predominately αp with αq, (b) 10 °C/s, some αp, predominately αq, plus αB (c) 30 °C/s, ~αq + αB + αB° and (d) 60 °C/s, ~αq + αB + αB° + AF.
Metals 05 01857 g005
The optical micrographs of the six steels for the cooling rates of 3 °C/s to 60 °C/s are shown in Figure 5, Figure 6, Figure 7, Figure 8, Figure 9 and Figure 10. At 100 °C/s, in this study, the microstructures were essentially the same as at 60 °C/s, only finer and more plate-like. A wide range of transformation products can be observed over the cooling rate range. The ISIJ nomenclature was used at the main standard for identifying these various phases.
For the base CASTRIP grade, Figure 5, polygonal ferrite (αp) dominated the microstructure at 1 °C/s but progressively decreased in amount as the cooling rate increased until 60 °C/s, where polygonal ferrite was fully suppressed. Irregular ferrite (αq) was first observed at 3 °C/s and persisted to 100 °C/s. As the cooling rate increased, from 10 °C/s and above, intragranular regions (of the prior austenite) transformed progressively from an intermediate Zw phase, αB, to acicular ferrite (AF) and small patches of bainite, αB°, were observed at the highest cooling rates.
For the 0.014% Nb grade, Figure 6, polygonal and irregular ferrite dominate the microstructure at 1 and 3 °C/s. The αB phase was evidenced in small regions starting at 3 °C/s, had increased significantly by 10 °C/s, but at higher cooling rates, was progressively replaced by αB° and AF. Due to the chaotic microstructure, it is difficult to clearly distinguish between αB, αB° & AF. Regions with multi-direction lenticular morphology were considered to be AF, which became more pronounced at the higher cooling rates. Bainitic sheaves that showed clear parallel directionality were labeled bainitic ferrite, αB°.
Figure 6. Optical microstructures for 0.014% Nb UCS dilatometer samples cooled at (a) 3 °C/s some αq, predominately αB, (b) 10 °C/s ~αq, predominately αB + ~αB°, (c) 30 °C/s, αB + αB° + AF and (d) 60 °C/s αB + αB° + AF.
Metals 05 01857 g006
For the 0.024% Nb grade, Figure 7, polygonal and irregular ferrite continues to dominate the microstructure at 1 and 3 °C/s, but the αB phase was now evidenced at the slowest cooling rate of 1 °C/s. At cooling rates above 20 °C/s, αB and αB° dominate the microstructure and compared with the 0.014% Nb level, there was less AF present.
Figure 7. Optical microstructures for 0.024% Nb UCS dilatometer samples cooled at (a) 3 °C/s αq + αB, (b) 10 °C/s αq + αB, (c) 30 °C/s αB + αB° + AF and (d) 60 °C/s αB + αB° + AF.
Metals 05 01857 g007
At the 0.04% Nb level, Figure 8, the amount of polygonal and irregular ferrite was reduced substantially. The αB phase was present at 1 °C/s and a significant amount of bainite, αB and αB° were present by 3 °C/s. Note in Figure 8b, a prior austenite boundary is observable (arrowed), with bainite nucleating away from the boundary. The microstructure was predominately bainitic at 10 and 30 °C/s, and some AF was also observed at the higher cooling rates.
Figure 8. Optical microstructures for 0.04% Nb UCS dilatometer samples cooled at (a) 3 °C/s αq + αB, (b) 10 °C/s αq + αB + αB° (arrows point out PAGB), (c) 30 °C/s αB + αB° + AF and (d) 60 °C/s αB + αB° + AF.
Metals 05 01857 g008
The microstructural evolution for 0.06% and 0.08% Nb levels, shown in Figure 9 and Figure 10, respectively, was very similar to that described for the 0.04% Nb grade; only the amount of bainitic phases increased at the lower cooling rates and AF was almost completely suppressed.
Figure 9. Optical microstructures for 0.06% Nb UCS flat dilatometer samples cooled at (a) 3 °C/s αq + αB, (b) 10 °C/s αq + αB + ~αB°, (c) 30 °C/s αB + αB°, and (d) 60 °C/s αB + αB°.
Metals 05 01857 g009
Figure 10. Optical microstructures for 0.08% Nb UCS flat dilatometer samples cooled at (a) 3 °C/s αq + αB, (b) 10 °C/s αq + αB + ~αB°, (c) 30 °C/s αB + αB°, and (d) 60 °C/s αB + αB°.
Metals 05 01857 g010
An intermediate transformation product, “Granular Bainitic Ferrite”, αB, also referred to as “Zw” (Zwischen-Stufe) in the ISIJ nomenclature, is essentially a lower transformation product with a morphology that does not fit the classical definition of bainite, i.e., lath-less. This phase is used to identify the coarse, intragranular plates of ferrite that are observed to be associated with relatively coarse carbides and/or fine pearlite, in between the laths/plates, at slow to intermediate cooling rates. The αB phase was typically observed at the intragranular regions for cooling rates of 1–30 °C/s, see Figure 5, Figure 6, Figure 7, Figure 8, Figure 9 and Figure 10, but can persist at higher cooling rates, particularly for the base grade. The plates generally have a lenticular appearance with a somewhat chaotic, or “lath-less”, optical appearance. This phase is most similar to acicular ferrite, and at higher cooling rates, it is not easy to distinguish between the two phases.
A similar phase was reported by Zajac [28] and also Schwinn [29], in low C pipeline steels, where granular bainite was defined as; “composed of irregular ferrite with second phases (Martensite-Austenite (MA), pearlite or bainite) distributed between irregular ferrite grains”. This same morphology has been termed “coarse acicular ferrite” by Zhao [30], also in pipeline steels. Graf [17], has noted that the term AF can be applied to different microstructures, such as for intra-granular nucleated needles of widmanstätten ferrite (typical to weld metal) and as a carbide-free bainite phase, otherwise known as bainitic ferrite. In this study, AF terminology was reserved for fine, lenticular interlocking laths that have nucleated intragranularly.
As the cooling rate increases, bainitic ferrite, αB° or low carbon bainite can form and is described as sheaf-like laths in parallel clusters, but with no carbides. An absence of carbides distinguishes αB° from classical upper bainite, where carbides are part of the definition [21]. Bainitic ferrite is essentially a low carbon variant of bainite. Due to the lack of carbides, bainitic ferrite can be mistaken for irregular ferrite, or vice versa, typically irregular ferrite will have distinct boundaries between grains, whereas bainitic ferrite has a sheaf appearance. Alternative definitions of low C bainite are ferrite with a second phase, where the second phase can be either aligned, FS(A), or non-aligned, FS(NA) [20].
Bainitic ferrite is regarded as being more highly dislocated than granular bainite and can be associated with minor constituents such as carbides, auto-tempered martensite (aTM), or MA constituent [24]. These second phase constituents form subsequently in time, rather than simultaneously [20]. The parallel appearance of the laths of bainitic ferrite in optical microscopy is a distinguishing feature. As αB° forms via a displacive mechanism, the prior austenite boundaries are persevered as αB° cannot cross austenite boundaries [21,31].
A significant drop in the transformation start temperature, or the Ar3, is an important indicator of when bainitic ferrite transforms in place of polygonal ferrite. The transformation start temperature must be below the bainite start (Bs) temperature.

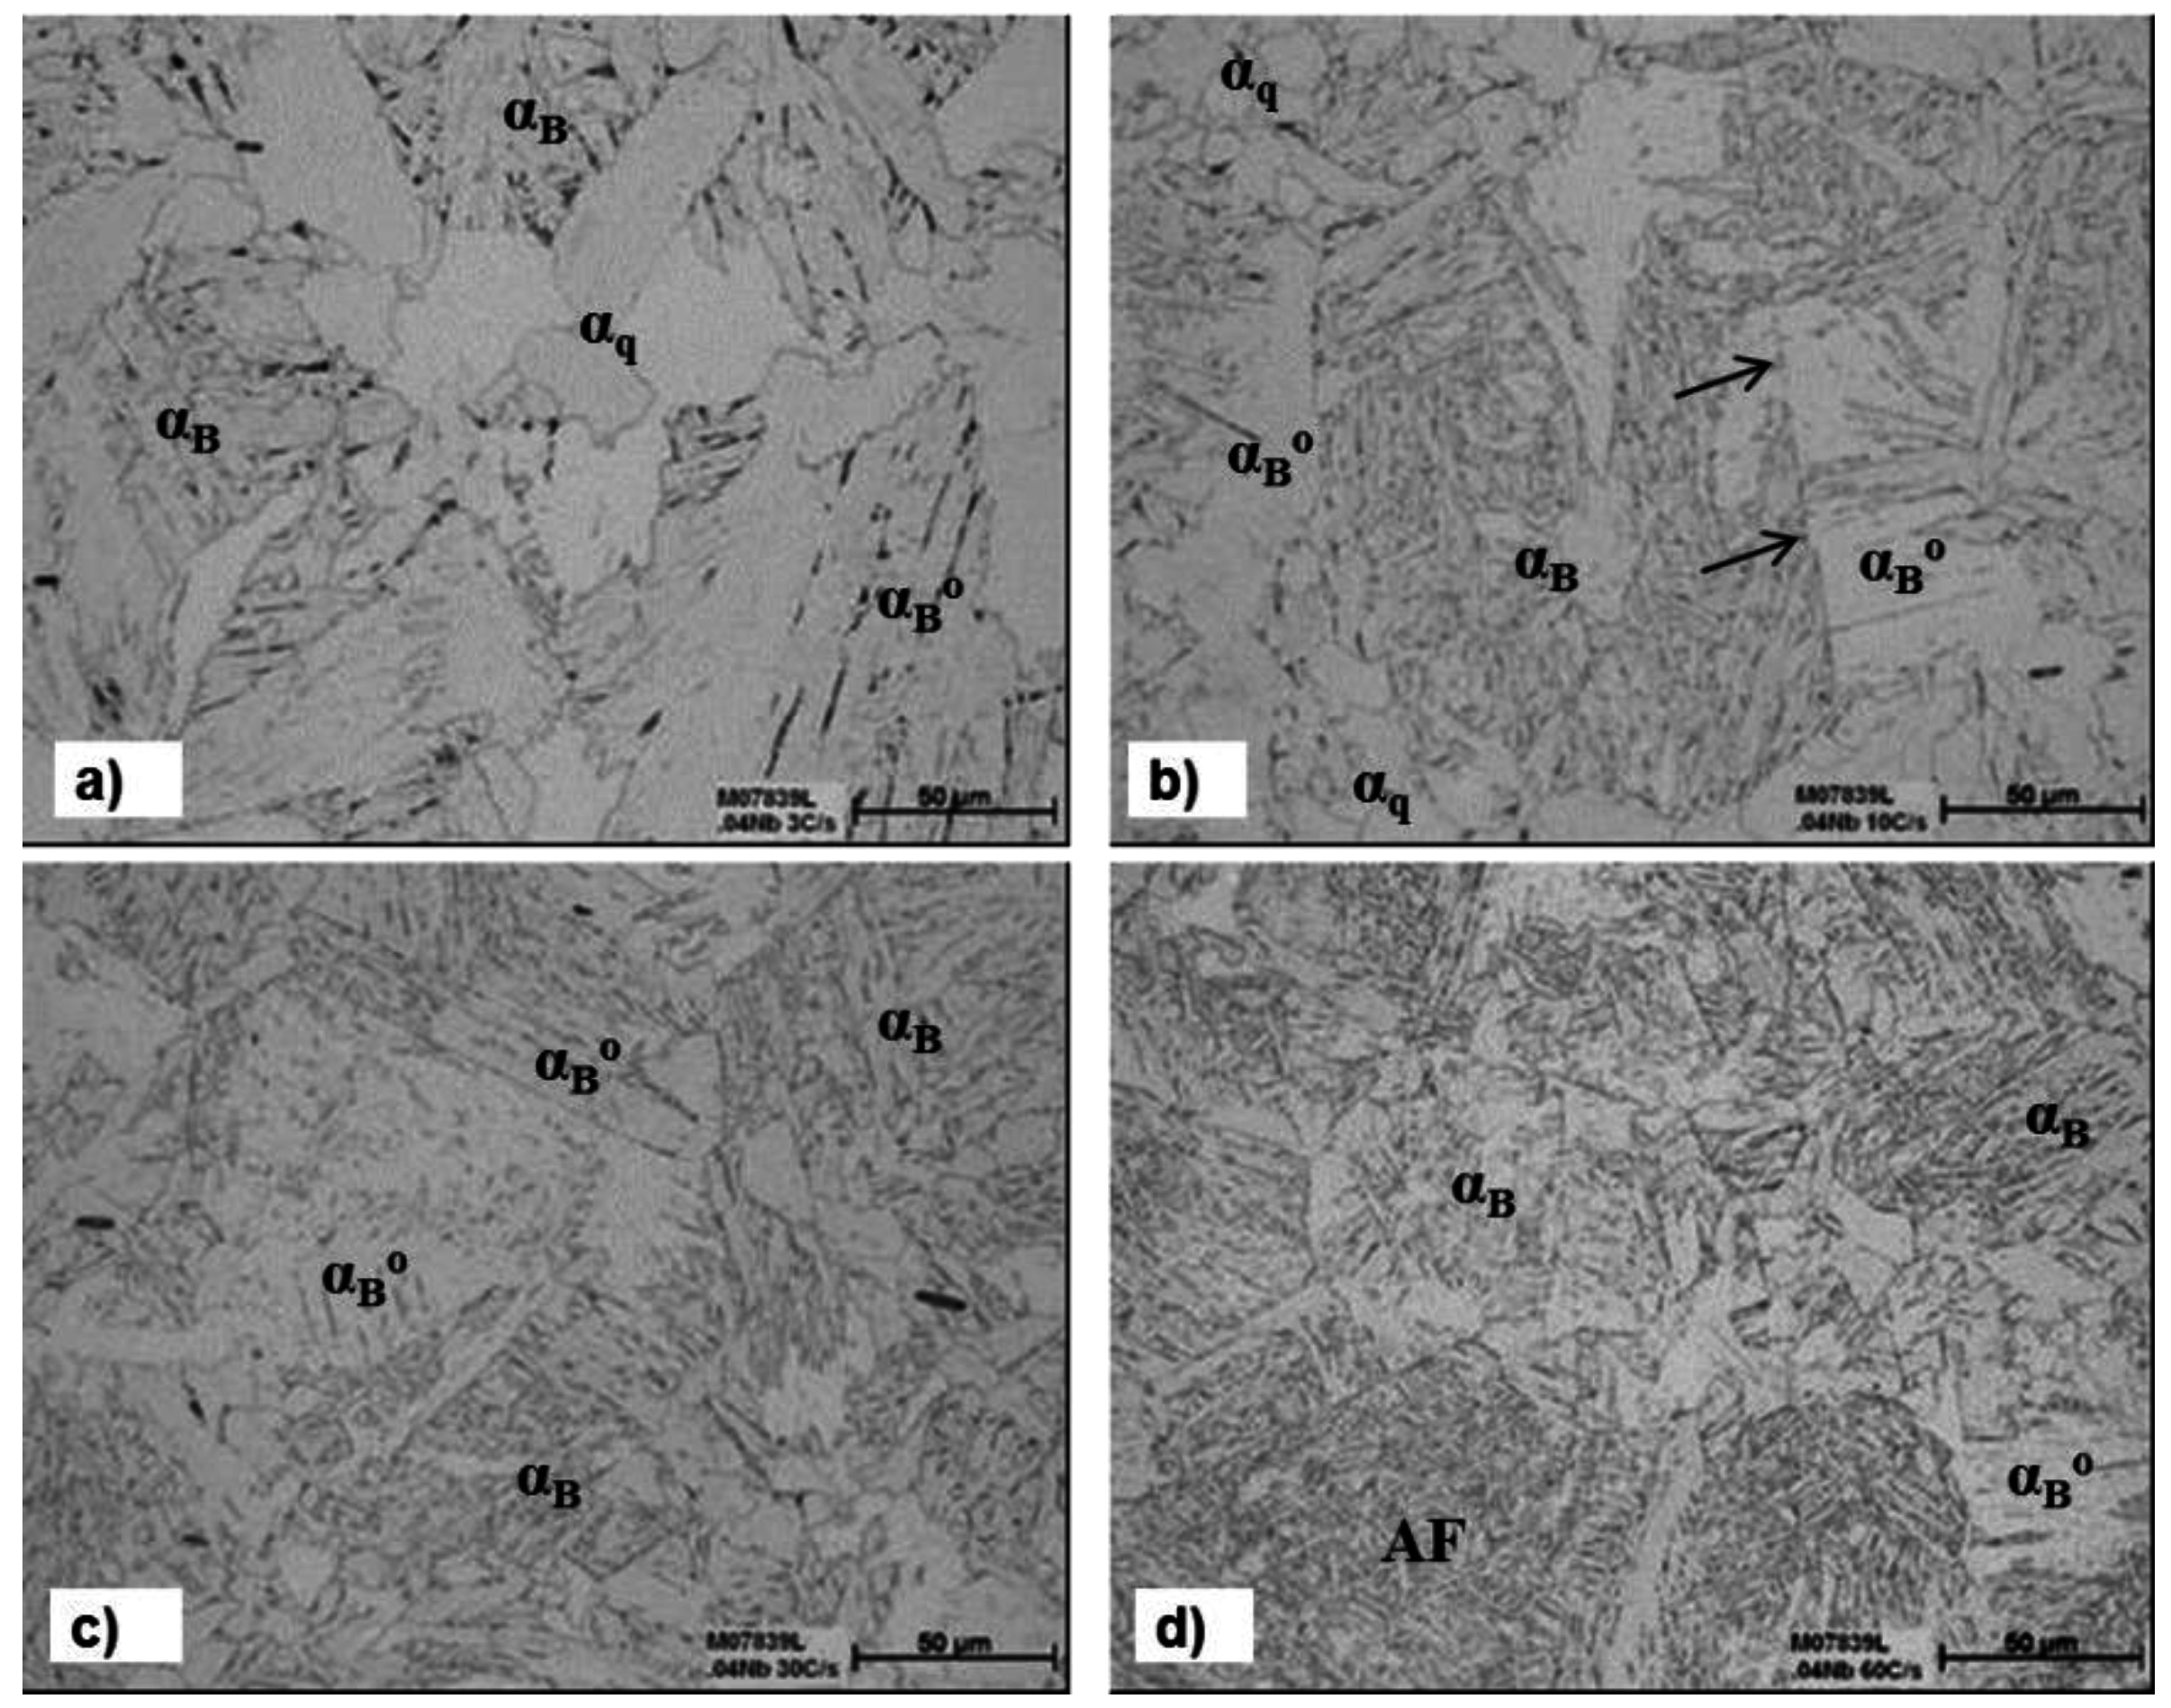
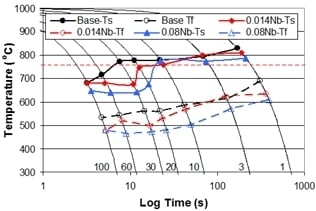
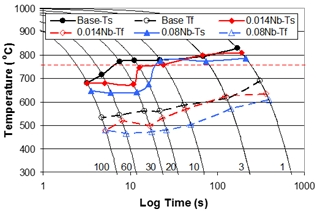
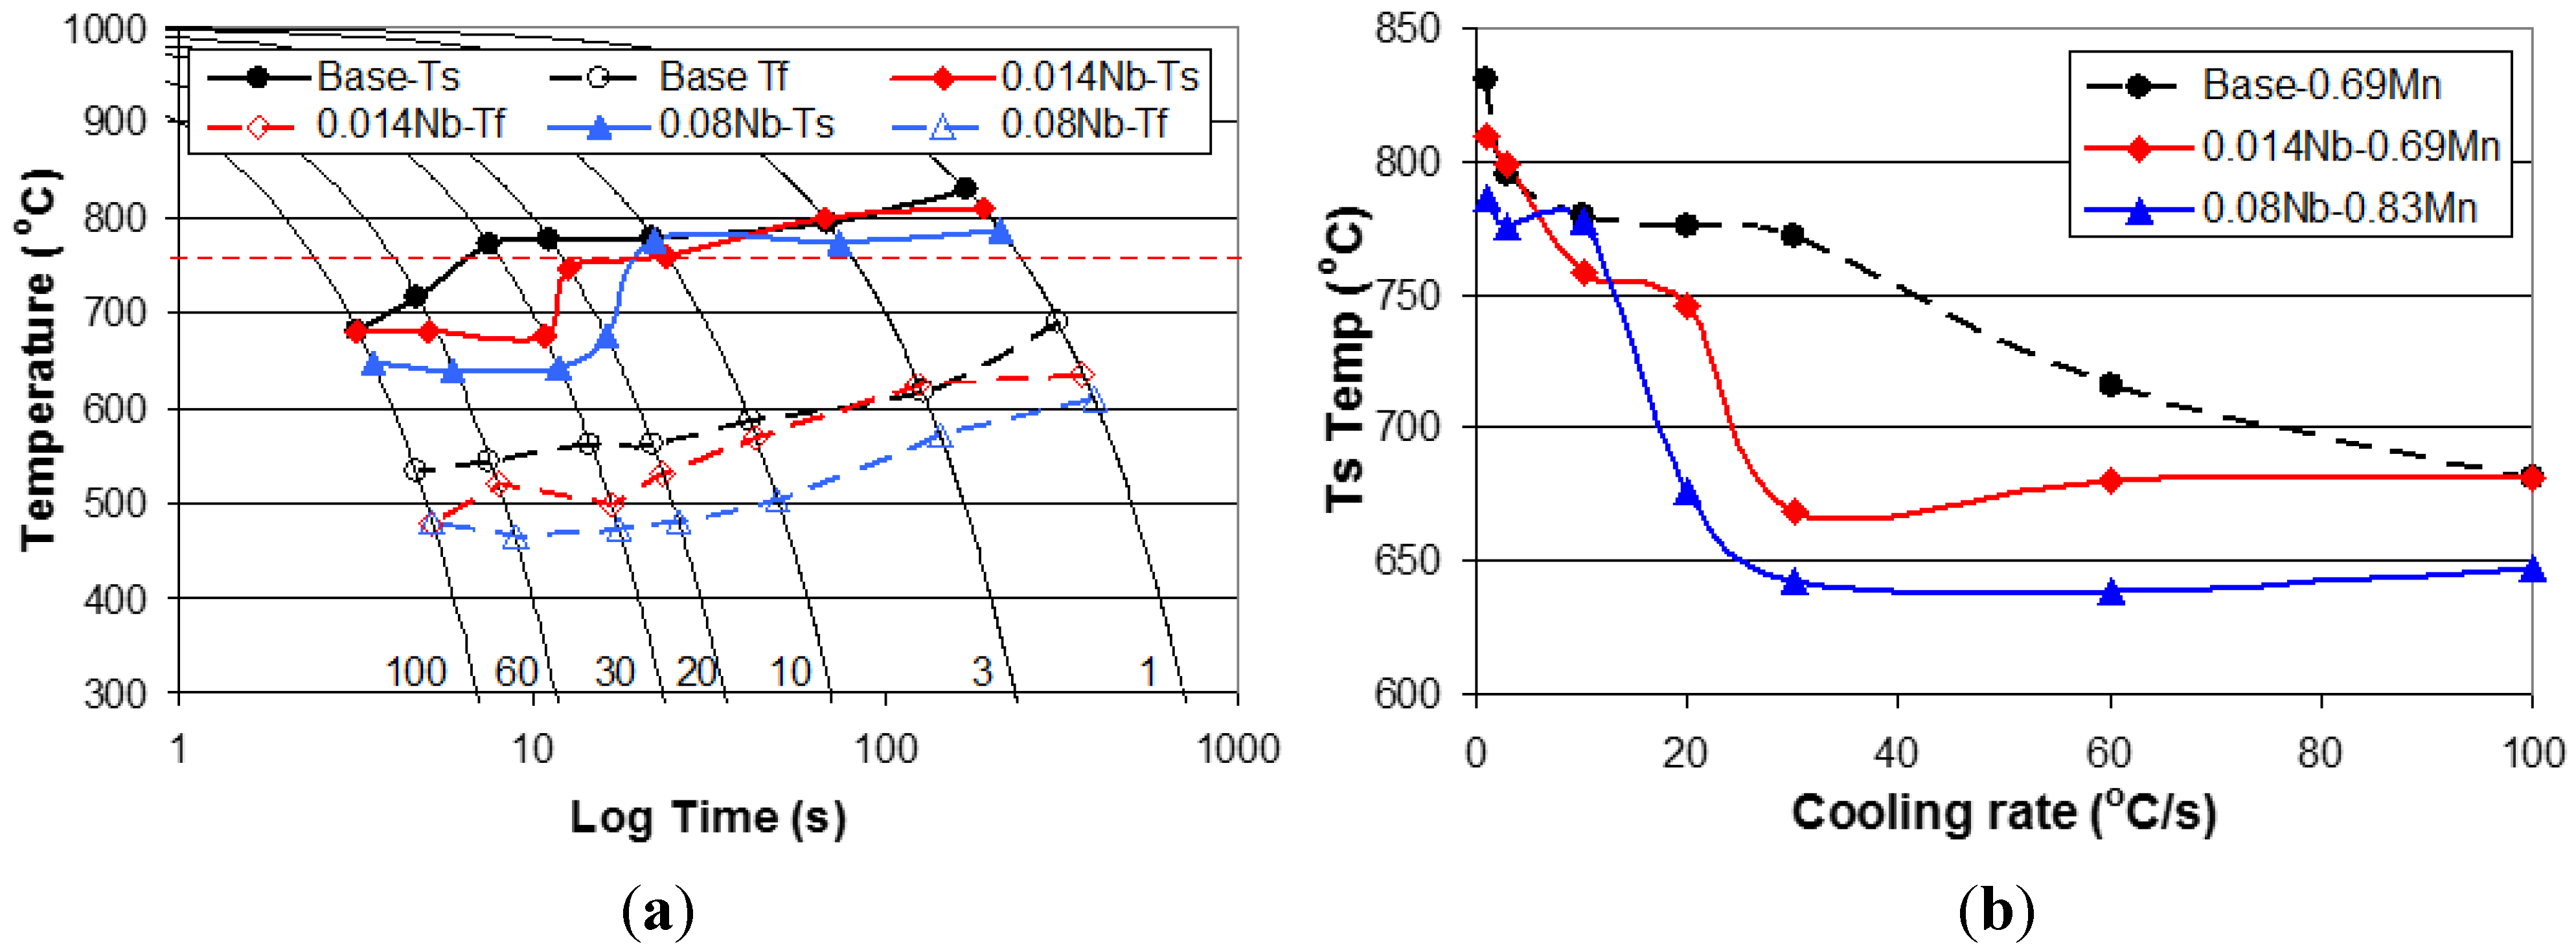
3.4. Effect of Nb on Hardenability

The CCT diagrams are shown in Figure 11a–f for the steels listed in Table 1. The transformation start (Ts) and finish (Tf) temperatures recorded on the graphs were determined from the changes in slope of the dilation curves. Metallography was used to identify and estimate the percentage of microstructural phases at each cooling rate and this is reflected by the lines separating the phases in the CCT diagrams. The Bs temperature, calculated from an empirical formula based on the steel composition [21] (Equation (1)), is included in the CCT diagrams; indicates the maximum temperature at which lower transformation products can form.
Bs (°C) = 830 − 270C − 90Mn − 37Ni − 70Cr − 83Mo
Figure 11. CCT diagrams for (a) base UCS steel and for different Nb levels, (b) 0.014% Nb, (c) 0.024% Nb, (d) 0.04% Nb, (e) 0.06% Nb and (f) 0.08% Nb.
Metals 05 01857 g011
The CCT diagram for the base composition is shown in Figure 11a and the metallography was shown in Figure 5. Polygonal ferrite dominated the microstructure at 1 °C/s and was progressively replaced by irregular ferrite as the cooling rate increased to 60 °C/s, where perhaps a small amount of irregular ferrite persisted. The hardenability provided by Mn was not able to completely suppress ferrite until the cooling rate was greater than 60 °C/s. At 60 °C/s and above, the matrix was dominated by AF and relatively coarse bainite, often elongated along prior austenite boundaries. The coarse, intermediate phase, αB, was first detected at 3 °C/s and progressively increased until it was considered replaced by AF at cooling rates of 60 °C/s and higher. Granular bainitic ferrite forms from the remaining austenite once the temperature becomes too low for the reconstructive transformations (αp + αq) to continue, so the microstructure was a mixture of these three phases.
The influence of Nb on hardenability was readily evident even at 0.014% Nb, Figure 11b. Polygonal ferrite was suppressed at 30 °C/s, the AF phase region was expanded and small regions of αB began to form at 1 °C/s. The suppression of polygonal ferrite coincided with the transformation of bainite and AF at lower cooling rates (~30 °C/s) compared to the base grade(~60 °C/s), which is consistent with the influence of Nb on shifting the C-curve of polygonal ferrite to the right.
On increasing the Nb to 0.024%, hardenability increased, shifting the polygonal ferrite C-curve further to the right and ferrite was suppressed at 20 °C/s. Accordingly, bainite and AF phase boundaries shifted right, extending to at least 20 °C/s, but there was no clear evidence of lath bainite (αB°) forming at 10 °C/s, only granular bainite (αB).
Further increases in Nb, 0.04%, 0.06% and 0.08% Nb (Figure 11d–f), did not shift the polygonal ferrite C-curve further back from 20 °C/s, but an increase in hardenability was clearly observed from changes in the microstructure, where polygonal ferrite was progressively replaced by more lower transformation products. The Ts temperatures, for these Nb levels, at 10 °C/s, were close to, but still above the Bs temperature, indicating that polygonal ferrite should be the first phase to transform, as was confirmed by metallography. Pockets of polygonal ferrite were observed in the microstructure, but the dominated phase nucleating at the prior austenite boundaries were laths of bainite.
A second effect of increasing the Nb addition was an observed increase in the amount of bainite formed at the expense of AF. According to current understanding, solute niobium is considered to “poison” the prior austenite grain boundaries, suppressing the nucleation of allotriomorphic ferrite, thereby enabling bainite to nucleate from the austenite grain boundaries. The exact mechanism of how solute Nb retards the recrystallization of ferrite is still under debate, Yan [15] argues for solute Nb lowering the austenite grain boundary energy, while Jia [32] suggest it is due to the solute drag mechanism.
Increased Nb levels more effectively suppress ferrite transformation, leading to the bainitic phase dominating the microstructure. As austenite grain boundaries are a lower energy site [21] for nucleation than intra-granular nucleation of acicular ferrite at inclusions [33], bainite would be expected to progressively displace acicular ferrite with increasing Nb content. The formation of AF in CASTRIP product is due to the large prior austenite grain size, where due to the constantly decreasing temperature making the progress of allotriomorphic/polygonal ferrite more difficult, the nucleation of AF at inclusions becomes possible. The microstructures shown in Figure 3b and Figure 4b (both for cooling rate of 10 °C/s), shows this most clearly, where coarser ferrite/irregular ferrite decorates the prior austenite boundaries and the finer, more chaotic AF phase was at the centre. This increasing proportion of bainite and reduced proportion of AF has been observed for UCS products produced by the CASTRIP process and has been reported elsewhere [25,26].
The influence of Nb on the Ts and Tf temperatures are summarised in a combined CCT diagram, Figure 12a, and the Ts temperatures are replotted as a function of cooling rate in Figure 12b, to more clearly show the effect of Nb on depressing the Ts temperature [27]. For ease of interpretation, only the C-Mn base UCS steel and the 0.014% Nb and 0.084% Nb experimental microalloyed UCS steels were plotted. The results for the other Nb levels were within the range for these two Nb levels. From Figure 12a,b, it can be seen that the Nb additions had a small influence on the Ts at cooling rates up to 10 °C/s, where sufficient time was available for the transformation of allotriomorphic ferrite at the prior austenite boundaries to occur. At higher cooling rates, a substantial influence of Nb on hardenability was recorded, even for a small Nb addition; where a significant decrease in the transformation temperature occurred at 30 °C/s for the 0.014% Nb UCS steel and at 20 °C/s for the 0.084% Nb UCS steel. As discussed previously, this decrease in Ts temperatures can be attributed to solute Nb suppressing the transformation of allotriomorphic ferrite at the prior austenite grain boundaries, leading to fully bainitic microstructure. Such cooling rates are readily achievable for the cooling of thin strip on the ROT of the CASTRIP process. Importantly, these cooling rates are likely to underestimate the actual hardenability of the of the Nb UCS steels, as although the austenite grain size in the dilatometery specimens was relatively large at 80–100 µm, it was still finer than the actual as-cast austenite grain size (typically 150–200 µm and around 450 µm long, when columnar).
Figure 12. The effect of Nb on (a) the CCT diagram and (b) the Ts temperature as a function of cooling rate (Reproduced with permission from Killmore, Development of a Family of High Strength Low Carbon Microalloyed Ultra-Thin Cast Strip Products Produced by the CASTRIP® Process, MS&T 2010 Proceedings, AIST, Houston, TX, USA, 17–21 October 2010) [27].
Metals 05 01857 g012
The Ts temperature for the Nb grades were relatively constant at cooling rates at and above 30 °C/s, indicating that the nose of the ferrite C-curve was missed (shifted to the right) and the bainite C-curve was relatively flat for this cooling rate range. Bainite typically has a flat-topped C-curve with a sharp nose as the martensitic transformation is approached. The UCS steels in this study are low alloy, low C steels and as such, martensite was not observed with optical microscopy, even at a cooling rate of 100 °C/s.
The addition of Nb depressed the Tf temperatures in comparison to the plain C base grade, especially at intermediate to high cooling rates; this essentially correlated with the delayed Ts temperatures. This indicates that not only does Nb delay the onset of transformation it also delayed the kinetics of transformation [12]. It is believed that solute Nb that has segregated to the austenite/ferrite boundary delays ferrite growth kinetics due to the solute drag effect [10]. The 0.084% Nb UCS steel predominantly displayed lower Ts and Tf temperatures compared to the 0.014% Nb steel. The Mn content was however, slightly higher in the 0.084% Nb steel, so this effect was due to a combination of a small increase in Mn as well as the increase in Nb. Based upon Equation 1, the Mn increase would account for about half the difference in the Ts temperatures, with solute Nb accounting for the remainder.
Considering the alloy content and austenite grain size of the UCS steels investigated, a relatively small addition of Nb produced a significant increase in hardenability, while increasing Nb levels resulted in only a modest further increase in hardenability. This will be shown to correspond to the effect of Nb on mechanical properties, as detailed in section 3.6.

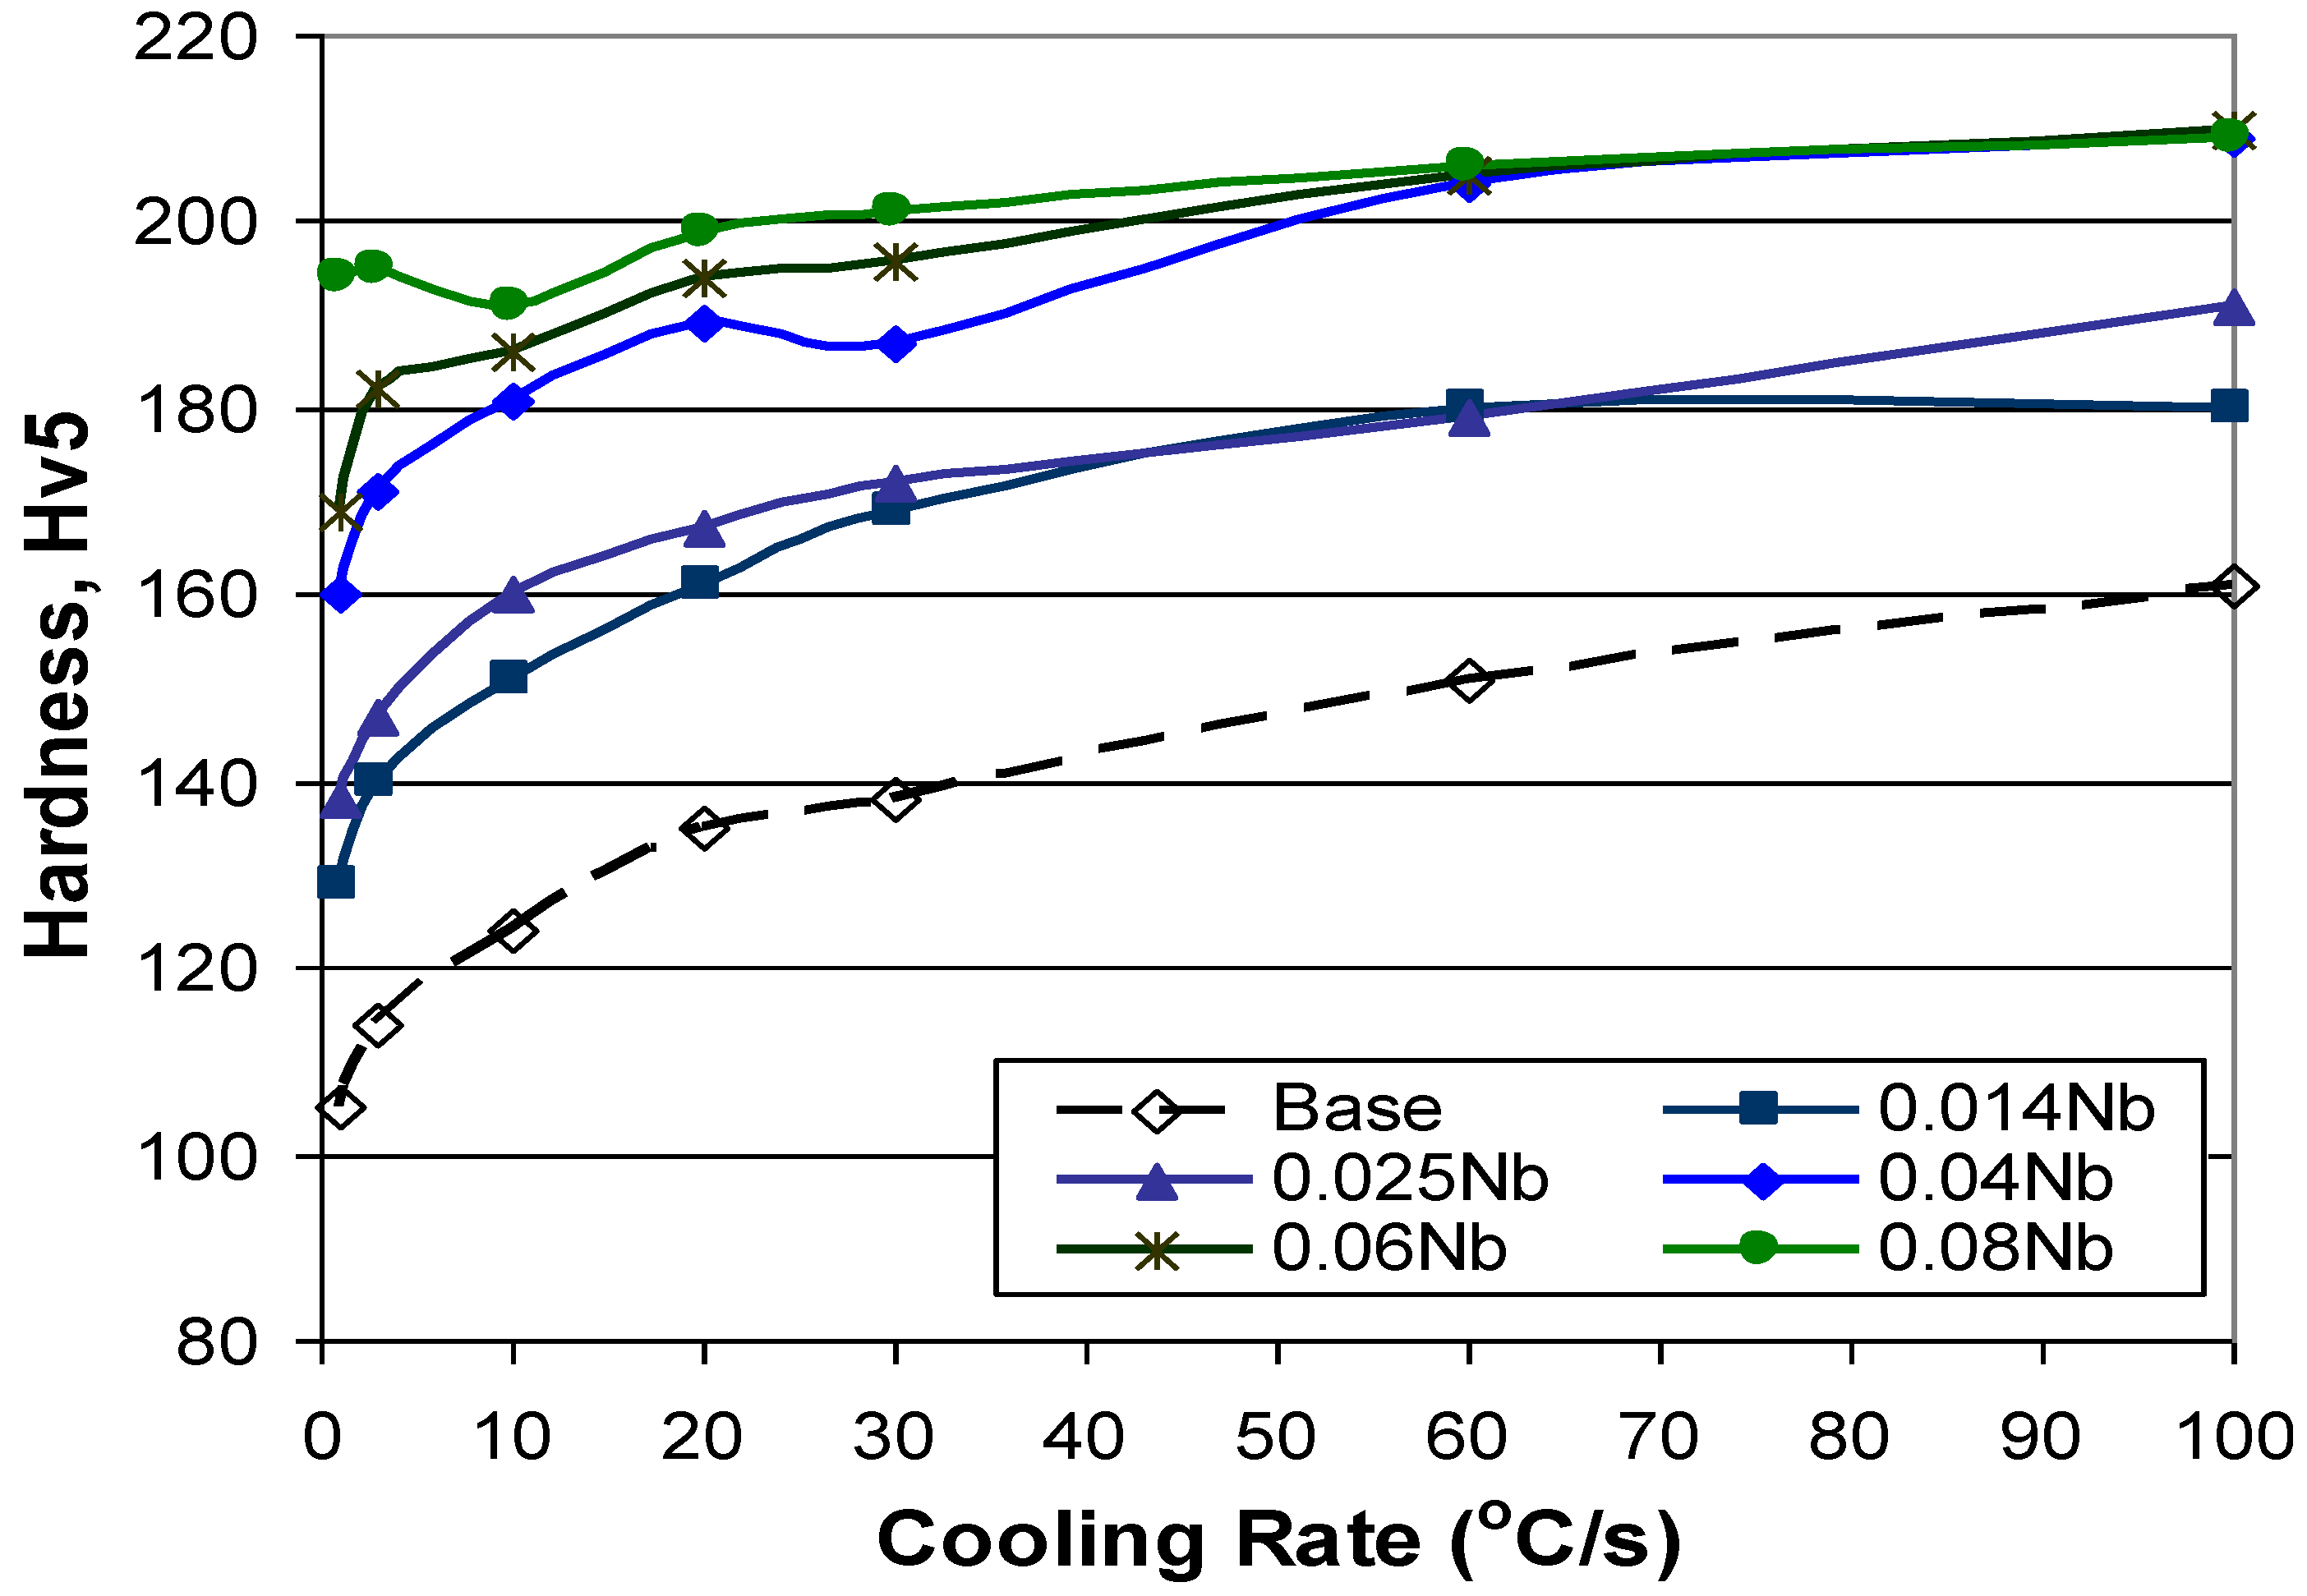
3.5. Effect of Cooling Rate and Increasing Nb Additions on Hardness of Dilatometry Samples

As the cooling rate through the austenite to ferrite transformation increases, lower transformation products are promoted, which become finer, more heavily dislocated and harder. Figure 13 displays the increase in hardness as the cooling rate increases for the base and Nb UCS grades. The greatest change in hardness was from 1 °C/s to 30 °C/s, corresponding to the microstructure changing from polygonal to bainitic ferrite. Increasing the cooling rate further resulted in more modest increase in the hardness as the microstructure remained similar, only progressively finer and more dislocated.
The addition of Nb significantly increased the hardness compared to the base steel, even at 0.014% and even at the slowest cooling rate. This is due to the effect of Nb on increasing the hardenability of the microstructure, plus a small contribution from solute Nb strengthening. For cooling rates at 30 °C/s and below, the hardness at each cooling rate generally increased as the Nb addition increased, although the effect of Nb is complicated by increased Mn levels in the 0.04% and 0.08% Nb steels, which would increase hardness further. This was indeed the case, as the 0.04% Nb steel has a hardness profile much closer to the 0.06% Nb steel compared to the 0.024% Nb steel.
Compared to the other Nb levels, the 0.08% Nb steel showed considerably higher hardness at cooling rates of 1 and 3° C/s, where a significant amount of the structure was polygonal ferrite, notionally a soft phase. TEM investigation using carbon replicas found fine niobium rich precipitates, approximately <10 nm in size, in the sample taken at 1 °C/s but not at 3 °C/s. The hardness results and Nb particles found via the TEM indicate that precipitation hardening occurred for the 0.08% Nb steel, at least at these slower cooling rates. The absence of precipitation at 3 °C/s could be explained due to the faster cooling rate leaving insufficient time for Nb particles to coarsen, or if particles remained coherent, they would be difficult to detect using TEM. Figure 14 shows a typical bright field image of Nb precipitation and the corresponding EDS spectra. The absence of any other peaks associated with the niobium suggests that the particles were most likely NbC.
Figure 13. Vickers hardness, Hv5, as a function of increasing cooling rate and increasing Nb addition.
Metals 05 01857 g013
Figure 14. Bright field TEM image of fine Nb-rich particles in the 0.08% Nb sample cooled at 1 °C/s with the corresponding EDS spectra.
Metals 05 01857 g014

3.6. Comparison of CCT Microstructures with Production Produced Grades

A summary of the average mechanical properties from production coils is presented in Table 4. Data from Table 4 indicates that microstructural strengthening, imparted from Nb increasing the hardenability, plateaus above 0.04% Nb, which is in agreement with the microstructural findings. Similar hot rolling reductions and moderate coiling temperatures, 560–590 °C, for the 0.04 to 0.08% Nb specimens, minimise the influence of processing conditions on strength, thus supporting the above finding. Further details on the properties of Nb containing CASTRIP steels can be found in [26,27].
Table 4. Average mechanical properties from production coils produced from the CASTRIP process, with the percentage hot rolling (%HR) and average coiling temperature.
GradeNb (wt%)Mn (wt%)YS (Mpa)TS (Mpa)TE%%HRCoil Temp
Base00.69379.2482.62134%646°C
0.015 Nb0.0140.69434.4517.11735%495°C
0.024 Nb0.0240.73420.6515.717.642%492°C
0.04 Nb0.0410.87472.3562.614.336%590°C
0.06 Nb0.0590.74479.9553.014.335%570°C
0.08 Nb0.0840.83480.9575.716.440%560°C
Figure 15. Microstructures from CASTRIP production samples for (a) Base grade at high coiling temperature (air cooled on run-out-table), showing ferritic microstructure, (b) Base grade at high cooling rate on the run-out-table, coiled at 505 °C, showing allotriomorpic ferrite at PAGB and AF, (c) 0.015% Nb coiled at 515 °C, very little allotriomorpic ferrite at PAGB and AF, (d) 0.024% Nb coiled at 534 °C, bainite, (e) 0.04% Nb coiled at 590 °C, bainite and (f) 0.08% Nb coiled at 560 °C, bainite.
Metals 05 01857 g015
Figure 15 displays several microstructures for production samples, all taken from the quarter width position and several wraps in from the end of the coil (tail out material is scrapped after coiling). The effect of cooling rate on the run-out-table, on the base grade is shown by Figure 15a,b, where a significant increase in the cooling rate changed the microstructure from irregular ferrite to predominately acicular ferrite, with allotriomorpic ferrite at the prior austenite grains. This compares with the microstructures found in the CCT work for 1 and 3 °C/s and 60 and 100 °C/s, respectively. For 0.014% Nb, Figure 15c, AF is more dominated, compared to the CCT work, which is likely due to the larger austenite grain size in production increasing hardenability. Fully bainitic microstructures were obtained for for Nb grades with ≥0.024% Nb, Figure 15d–f. This corresponded well with the CCT curves for these Nb levels, where fully bainitic structures are formed at cooling rates >30 °C/s, which are readily achieved under the run-out-table cooling sprays of the CASTRIP process.

4. Conclusions

The hardenability potency of Nb in UCS steels produced by the unique regime of rapid solidification rates, large austenite grain size, Nb retained as a solute and inclusion engineering of the CASTRIP process was investigated. The construction of CCT diagrams for UCS steels with five Nb levels by dilatometery and metallography exhibited multilayer transformations involving the evolution of polygonal and quasi-polygonal ferrite, an intermediate coarse granular bainite (αB), bainitic ferrite (αB°) and acicular ferrite (AF).
The addition of Nb to the CASTRIP base steel was found to:
(1) Sharply suppress the transformation of polygonal ferrite at low Nb additions (0.014% Nb) and then more modestly suppress the transformation at higher Nb additions by sifting the ferrite C-curve to the right.
(2) Retard transformation kinetics as evidenced by progressively lowering the Ar3 and Ar1 temperatures.
(3) Increase specimen hardness and strength via microstructural hardening and solid solution hardening from Nb; precipitation hardening was only evidenced for the 0.08% Nb addition at low cooling rates.
(4) As the Nb addition increased, bainitic ferrite was preferred over acicular ferrite due to the suppression of allotriomorphic ferrite allowing the preferential nucleation of bainitic ferrite at prior austenite grain boundaries, which is thermodynamically favourable over intragranular nucleation of acicular ferrite on inclusions.

Acknowledgments

The authors wish to thank the University of Wollongong for the use of their experimental facilities.

Author Contributions

Kristin Carpenter and Chris Killmore conceived and designed the experiments; Kristin Carpenter conducted the experiments, analyzed the data and wrote the paper. Chris Killmore edited the paper.

Conflicts of Interest

The authors declare no conflict of interest.

References

  1. Tanaka, T.; Tabata, N.; Hatomura, T.; Shiga, C. Three Stages of the Controlled-Rolling Process. In Proceedings of Conference on Microalloying, New York, NY, USA, 1–3 October, 1975; pp. 107–119.
  2. DeArdo, A.J. Niobium in modern steels. Int. Mater. Rev. 2003, 48, 371–402. [Google Scholar] [CrossRef]
  3. Gladman, T. The Physical Metallurgy of Microalloyed Steels; Institute of Materials: London, UK, 1996; pp. 213–260. [Google Scholar]
  4. Akben, M.G.; Weiss, I.; Jonas, J.J. Dynamic precipitation and solute hardening in AV microalloyed steel and two Nb steels containing high levels of Mn. Acta Metall. 1981, 29, 111–121. [Google Scholar] [CrossRef]
  5. Dutta, B.; Palmiere, E.J. Effect of prestrain and deformation temperature on the recrystallization behavior of steels microalloyed with niobium. Metall. Mater. Trans. 2003, 34, 1237–1247. [Google Scholar] [CrossRef]
  6. Klinkenberg, C. Niobium in Microalloyed Structural and Engineering Steels. Mater. Sci. Forum 2007, 539–543, 4261–4266. [Google Scholar] [CrossRef]
  7. Tanaka, T. Controlled Rolling of Steel Plate and Strip. Int. Met. Rev. 1981, 4, 185–212. [Google Scholar]
  8. Abe, T.; Tsukada, K.; Kozasu, I. Role of Interrupted Accelerated Cooling and Microalloying on Weldable HSLA Steels. In HSLA Steels: Metallurgy and Applications; Gray, J.M., Ko, T., Zhang, S., Wu, B., Xie, X., Eds.; ASM International Publication: Beijing, China, 1985; pp. 103–112. [Google Scholar]
  9. Subramanian, S.V.; Zeng, X.; Collins, L.E.; Bucholtz, M.; Kostic, M. Effect of Niobium on the Transformation Behaviour of Nb-Ti Microalloyed Steels. In Proceedings of the International Symposium on Low-Carbon Steels for the 90’s, Pittsburgh, PA, USA, 18–21 October 1993; Asfahani, R., Tither, G., Eds.; Minerals, Metals & Materials Society (TMS): Warrendale, PA, USA; pp. 313–322.
  10. Fossaert, C.; Rees, G.; Maurickx, T.; Bhadeshia, H.K.D.H. The effect of niobium on the hardenability of microalloyed austenite. Metall. Mater. Trans. 1995, 26, 21–30. [Google Scholar] [CrossRef]
  11. Thomas, M.H.; Michal, G.M. The Influence of Niobium and Nb(C,N) Precipitation on the Formation of Proeutectic Ferrite in Low-Alloy Steels. In Proceedings of the Solid to Solid Phase Transformation, Pittsburgh, PA, USA, 10–14 August, 1981; pp. 469–473.
  12. Manohar, P.A.; Chandra, T.; Killmore, C.R. Continuous Cooling Transformation Behaviour of Microalloyed Steels Containing Ti, Nb, Mn and Mo. ISIJ Int. 1996, 36, 1486–1493. [Google Scholar] [CrossRef]
  13. DeArdo, A.J.; Gray, J.M.; Meyer, L. Fundamental Metallurgy of Niobium in Steel. In Niobium-Proceedings of the International Symposium, San Francisco, CA, USA, 8–11 November 1981; Stuart, H., Ed.; Metallurgical Society of AIME: Warrendale, PA, USA; pp. 685–759.
  14. Felfer, P.J.; Killmore, C.R.; Williams, J.G.; Carpenter, K.R.; Ringer, S.P.; Cairney, J.M. A quantitative atom probe study of the Nb excess at prior austenite grain boundaries in a Nb microalloyed strip-cast steel. Acta Mater. 2012, 60, 5049–5055. [Google Scholar] [CrossRef]
  15. Yan, P.; Bhadeshia, H.K.D.H. Austenite-ferrite transformation in enhanced niobium, low carbon steel. Mater. Sci. Technol. 2015, 31, 1066–1076. [Google Scholar] [CrossRef]
  16. Hulka, K.; Gray, J.M.; Heisterkamp, F. High Temperature Thermomechanical Processing of Pipe Steel—Technical Basis and Production Experience. In Proceedings of the 3rd International Pipeline Technology Conference, Vol II, Brugge, Belgium, 21–24 May 2000; pp. 291–306.
  17. Graf, M.; Schroder, J.; Schwinn, V.; Hulka, K. Production of Large Diameter Pipes Grade X 70 with High Toughness Using Acicular Ferrite Microstructures. In Proceedings of the International Conference on Application and Evaluation of High Grade Linepipes in Hostile Environments, Yokohama, Japan, 8–9 November, 2002; pp. 1–13.
  18. DeArdo, A.J.; Marraccini, R.; Hua, M.J.; Garcia, C.I. Optimization of Nb HSLA Microstructure Using Advanced Thermomechanical Processing in a CSP Plant. Mater. Sci. Forum 2007, 539–543, 28–35. [Google Scholar] [CrossRef]
  19. Blejde, W.; Mahapatra, R.; Fukase, H. Application of Fundamental Research at Project ‘M’. In Proceedings of the Belton Memorial Symposium Proceedings, Sydney, Australia, 10–11 January 2000; pp. 253–261.
  20. Dunne, D.P. Ferrite Morphology and residual phases in continuously cooled low carbon steels. Mater. Forum 1999, 23, 63–76. [Google Scholar]
  21. Bhadeshia, H.K.D.H. Bainite in Steels; Institute of Materials: Cambridge, UK, 1992. [Google Scholar]
  22. Bramfitt, B.L.; Speer, J.G. A perspective on the morphology of Bainite. Met. Trans. A 1990, 21, 817–829. [Google Scholar] [CrossRef]
  23. Ohtani, H.; Okaguchi, S.; Fujihiro, Y.; Ohmori, Y. Morphology and properties of low-carbon bainite. Met. Trans. A 1990, 21, 877–887. [Google Scholar] [CrossRef]
  24. Araki, T.; Kozasu, I.; Takechi, H.; Shibata, K.; Enomoto, M.; Tamehiro, H.; Yamamoto, S.; Katumata, M.; Okaguchi, H.; Amao, K.; et al. Atlas For Bainitic Microstructures. Iron Steel Inst. Jpn. 1992, 1, 1–20. [Google Scholar]
  25. Killmore, C.R.; Creely, H.; Phillips, A.; Kaul, H.; Campbell, P.; Schueren, M.; Williams, J.G.; Blejde, W. Development of Ultra-Thin Cast Strip Products by the CASTRIP Process. In Proceedings of the AISTech 2007 Proceedings of the Iron and Steel Technology Conference, Indianapolis, IN, USA, 7–10 May 2007; p. 465.
  26. Killmore, C.R.; Kaul, H.R.; Burg, J.R.; Carpenter, K.R.; Williams, J.G.; Edelman, D.G.; Campbell, P.C.; Blejde, W.N. Development of Plain Carbon and Niobium Microalloyed Ultra-Thin Cast Strip Products Produced by the CASTRIP Process. In Proceedings of the 3rd International Conference on ThermoMechanical Processing of Steels, Padova, Italy, 10–12 September 2008; p. 16.
  27. Killmore, C.; Carpenter, K.; Kaul, H.; Williams, J.; Edelman, D.; Campbell, P.; Blejde, W. Development of a Family of High Strength Low Carbon Microalloyed Ultra-Thin Cast Strip Products Produced by the CASTRIP® Process. In Proceedings of the Materials Science & Technology Conference, Houston, TX, USA, 17–21 October 2010; pp. 1711–1726.
  28. Zajac, S.; Schwinn, V.; Tacke, K.H. Characterisation and Quantification of Complex Bainitic Microstructures in High and Ultra-High Strength Linepipe Steels. Mater. Sci. Forum 2005, 500–501, 387–394. [Google Scholar] [CrossRef]
  29. Schwinn, V.; Fluess, P.; Ormston, D. Low Carbon Bainitic TMCP Plate tor Structural and Line-Pipe Application. In Recent Advances of Niobium Containing Materials in Europe; Hulka, K., Klinkenburg, C., Mohrbacher, H., Eds.; Verlag Stahleisen GmbH: Dusseldorf, Germany, 2005; pp. 45–57. [Google Scholar]
  30. Zhao, M.; Yang, K.; Xiao, F.; Shan, Y. Continuous cooling transformation of undeformed and deformed low carbon pipeline steels. Mater. Sci. Eng. 2003, 355, 126–136. [Google Scholar] [CrossRef]
  31. Araki, T.; Enomoto, M.; Shibata, K. Bainitic and Similar Microstructures of Modern Low Carbon HSLA Steels. In Proceedings of the International Conference on Processing, Microstructure and Properties of Microalloyed and Other Modern High Strength Low Alloy Steels, Pittsburgh, PA, USA, 3–6 June 1991; pp. 249–255.
  32. Jia, T.; Militzer, M. The effect of solute Nb on the austenite-to-ferrite transformation. Metall. Mater. Trans. 2015, 46, 614–621. [Google Scholar] [CrossRef]
  33. Garcia, C.I.; Hua, M.; DeArdo, A.J. Steel Processing. In Proceedings of the Product and Applications Symposium, Pittsburgh, PA, USA, 25–29 October 2009; pp. 1591–1602.

