Abstract
The increased attention ultrafine grained (UFG) materials have received over the last decade has been inspired by their high strength in combination with a remarkable ductility, which is a promising combination for good fatigue properties. In this paper, we focus on the effect of different carbide morphologies in the initial microstructure on the fatigue behavior after high pressure torsion (HPT) treatment of SAE 1045 steels. The two initial carbide morphologies are spheroidized as well as tempered states. The HPT processing increased the hardness of the spheroidized and tempered states from 169 HV and 388 HV to a maximum of 511 HV and 758 HV, respectively. The endurance limit increased linearly with hardness up to about 500 HV independent of the carbide morphology. The fracture surfaces revealed mostly flat fatigue fracture surfaces with crack initiation at the surface or, more often, at non-metallic inclusions. Morphology and crack initiation mechanisms were changed by the severe plastic deformation. The residual fracture surface of specimens with spheroidal initial microstructures showed well-defined dimple structures also after HPT at high fatigue limits and high hardness values. In contrast, the specimens with a tempered initial microstructure showed rather brittle and rough residual fracture surfaces after HPT.
1. Introduction
Despite the progress achieved over the last fifty years in the development of new steel grades and thermal- and thermomechanical treatments, the quest for novel processing routes allowing further enhancement of mechanical properties remains of great current interest. Furthermore, the field of nanostructuring has not been extensively explored in mainstream steel research. It was proposed that grain size refinement could be the most promising way to improve the fatigue life of steel because it allows obtaining high strength in combination with good ductility values [1,2]. Severe plastic deformation (SPD) of metals and alloys is a well-established method to obtain ultrafine-grained structures, or phase compositions that are impossible to obtain by conventional thermal treatment. Essential for SPD is the combination of a high hydrostatic pressure, to avoid crack initiation, and an enormous shear strain. At present, the most developed SPD techniques are Equal Channel Angular Pressing (ECAP) [3], High Pressure Torsion (HPT) [4] and accumulated Roll Bonding (ARB) [5]. The possibility of producing bulk nanostructured metals with grain sizes in the nanometre to submicrometre ranges has been demonstrated using these methods [6]. In the case of multiphase alloys and intermetallic compounds, SPD not only leads to grain refinement but can also lead to the formation of non-equilibrium solid solutions [2,7], disordering [8], or amorphization [9].
Recent investigations of the mechanical behaviour of ultrafine-grained materials (nano- and submicrocrystalline) processed by severe plastic deformation have demonstrated a significant improvement of their strength compared to their coarse-grained counterparts [6,10,11]. Furthermore, high cycle fatigue properties were substantially improved in several face centered cubic (fcc) metals with grain reduction down to UFG and nanoscopic scales [12,13]. Similar results were also obtained for ferritic and low carbon steels [14,15,16]. In particular, in low carbon steel C15 processed by ECAP, the increase of the endurance limit by a factor of two has been reported [17]. Nevertheless, the fatigue properties characteristic for martensitic or bainitic steels have not been achieved yet. One of the major problems associated with UFG structures produced by SPD is their inherent thermal, structural, and mechanical instability, caused by the high dislocation density, local internal stresses created during cold working, and limited hardenability. For example, a large amount of low angle boundaries introduced by ECAP processing led to cyclic instability in low carbon steel C10 [18].
In this paper, we present fatigue properties of ultrafine-grained medium carbon steels with two different carbide morphologies. In order to obtain microstructures with a high fraction of high angles grain boundaries and low levels of internal stress, we applied HPT processing at elevated temperatures–warm HPT [19]. First, the paper offers an intensive characterization of the resulting microstructure after HPT treatment. Automated crystal orientation mapping in a transmission electron microscope (ACOM-TEM) was used in addition to standard scanning electron microscopy (SEM). In the fatigue tests, use was made of electro-dynamic test equipment for micro-bending. We can show a correlation of the hardness, which is affected by the grain refinement during HPT, with the endurance limits, which were determined in the fatigue tests. Fractographic investigations helped to interpret and analyze the results.
2. Experimental Section
The investigations were conducted with commercial medium carbon steel SAE 1045 (Fe-balance, 0.46 C, 0.64 Mn, 0.17 Si, 0.011 P, 0.009 S, all in wt. %) delivered as rods with a normalized ferritic-pearlitic microstructure. The rods were heat treated to obtain two different carbide morphologies: In order to obtain spheroidized carbides, part of the rods was annealed at 680 °C for 40 h (initial state S). The remaining rods were annealed at 850 °C, quenched to room temperature and tempered for 1 h at 450 °C (initial state T). Subsequently, the thermally treated rods were cut into 0.8 mm thin discs and processed by high pressure torsion under a pressure of 6 GPa for six and ten rotations at a temperature of 380 °C. The shear strain γ experienced by HPT processed specimens can be calculated using Equation (1):
with r, n, and t as the distance from the axis of rotation, the number of HPT revolutions, and the thickness of the disc, respectively. The shear strain is 141 after six and 236 after ten rotations at a distance of 3 mm from the center of the disk. This 3 mm distance is also the location of the specimen extraction for structural characterization and hardness measurements.
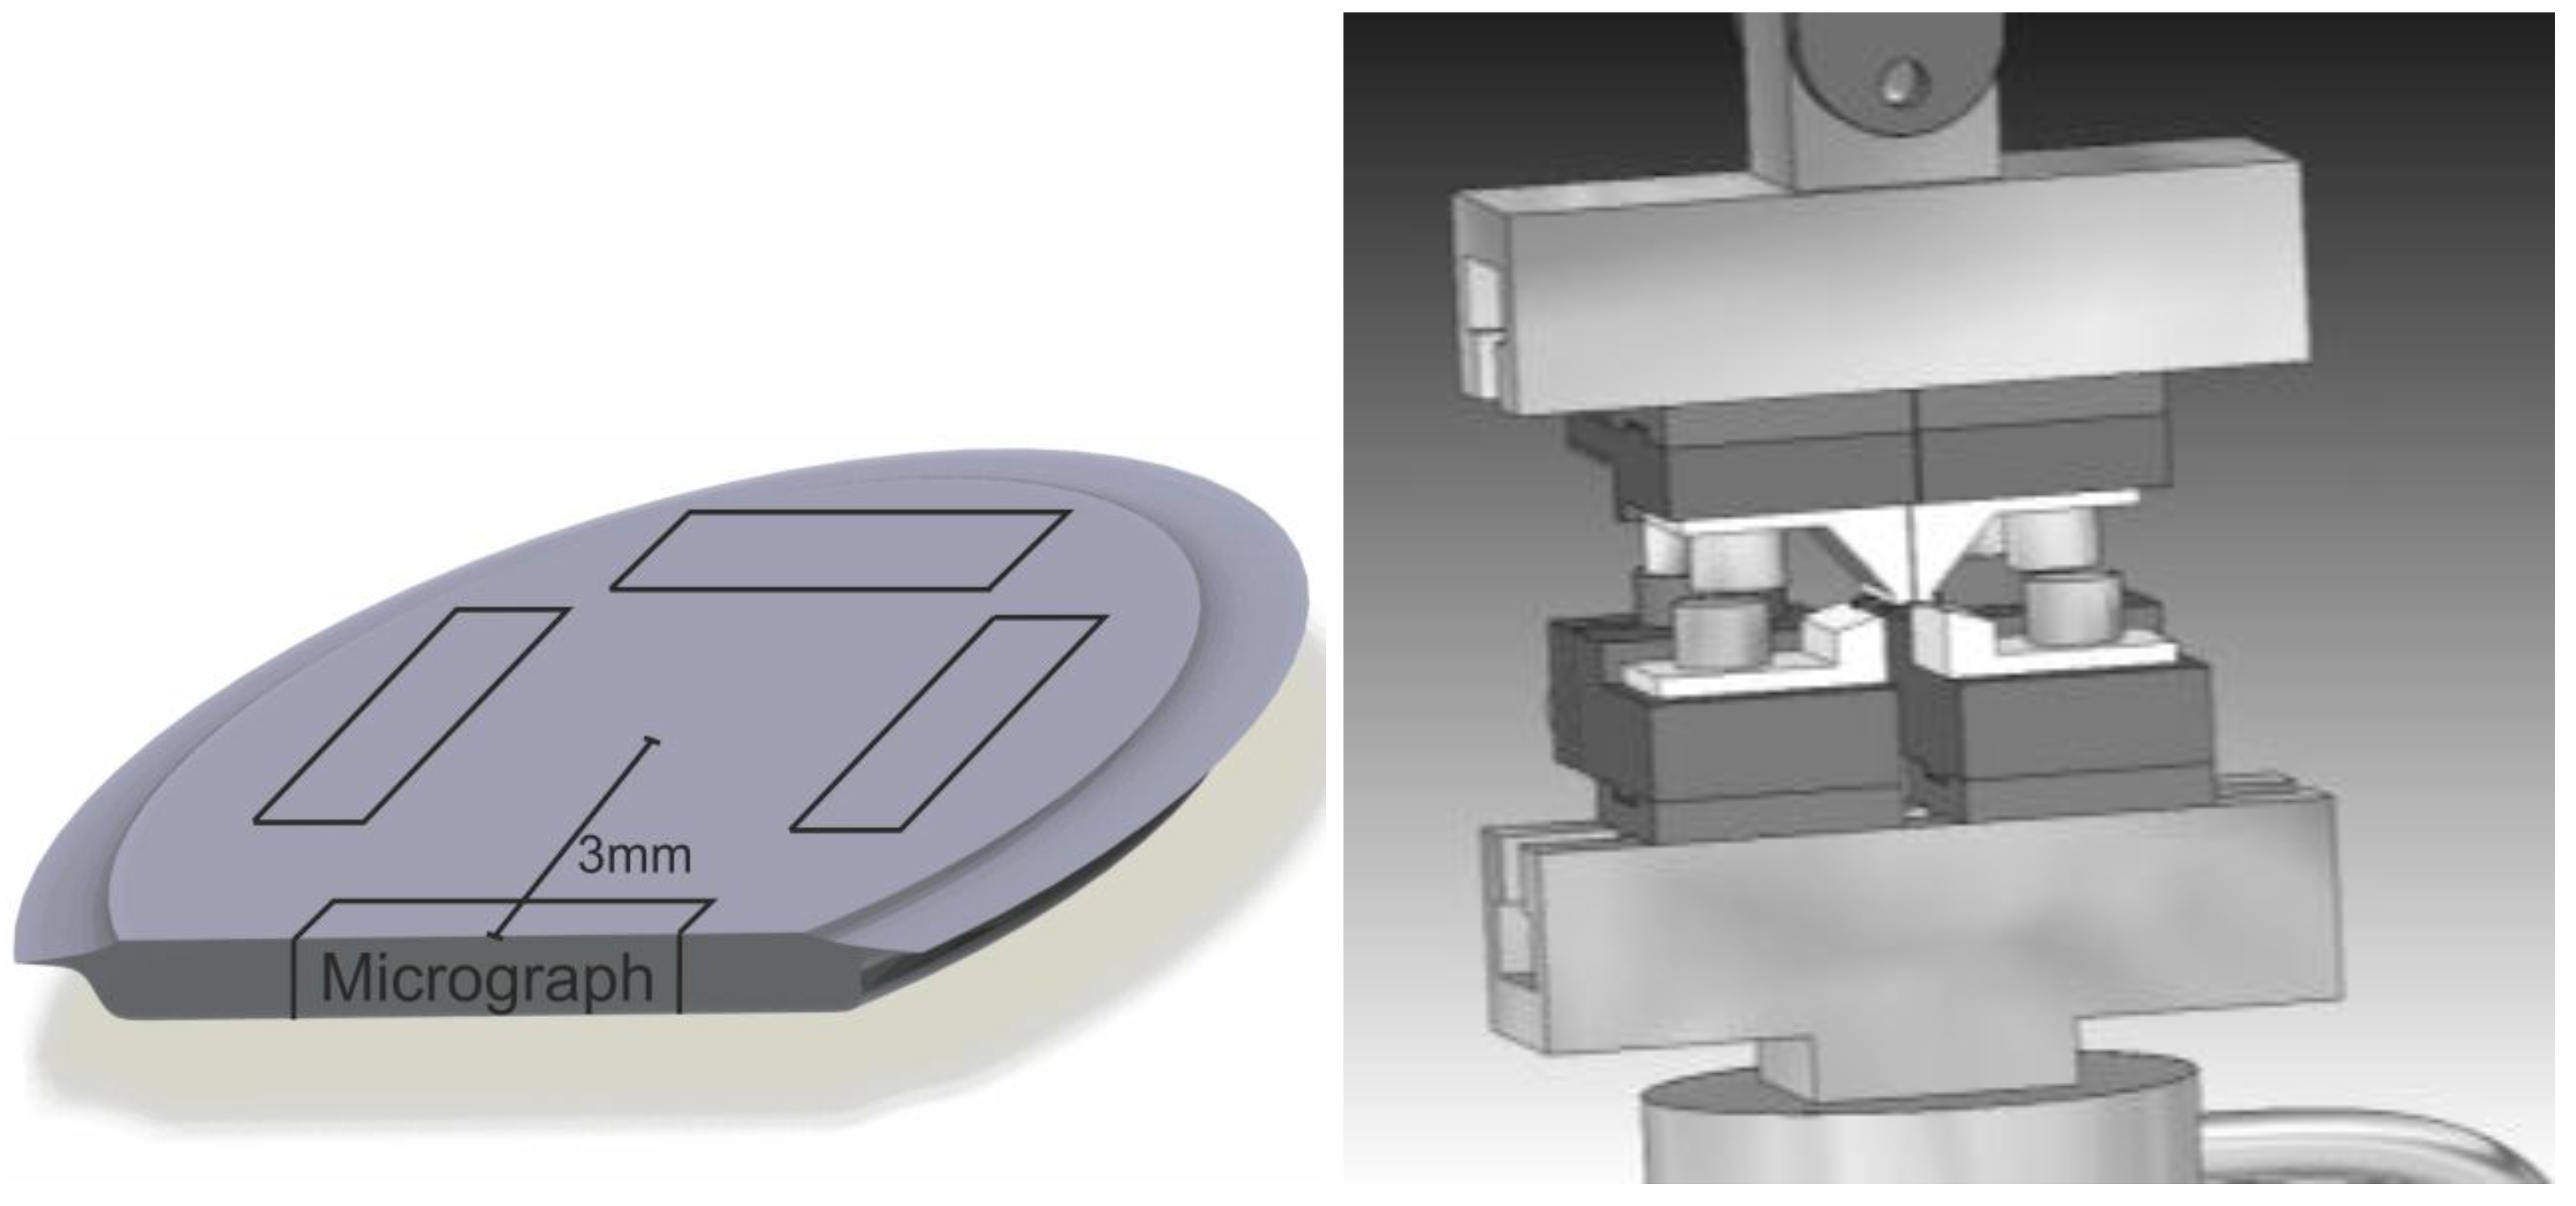
Four rectangular fatigue samples with dimensions of 4 mm × 1 mm (w) × 0.6 mm (h) were cut with their center at a distance of 3 mm from the center of every 10 mm × 0.6 mm cylindrical HPT disk as illustrated in Figure 1a. The fatigue samples were ground into the final shape and polished to 1 µm grid size. Hardness measurements were carried out with an ASMEC UNAT 2 Nanoindenter (ASMEC GmbH, Radeberg, Germany) and a proof force of 200 mN on a surface polished with colloidal SiO2.
Cyclic four-point-bending tests were performed on a BOSE ELECTROFORCE 3230 electrodynamic testing machine at a frequency of 40 Hz under stress control. They were conducted with a load ratio of R = 0.1 at room temperature. The mountings are shown in Figure 1b with a lower mounting distance of 3.2 mm and an upper one of 1.6 mm. To determine the endurance limits, the staircase method [20] was used with different step sizes, depending on the fatigue limit to be expected by a linear correlation with the hardness. Stress calculations were carried out for the controlled force F considering the specimen geometry, using Equation (2):
In this case, d = 0.8 mm is the distance between the upper and lower mounting rollers. The parameter σedge specifies the edge stress as real stress in longitudinal direction in the lowest tension fiber when linear-elastic material behavior is assumed.

Figure 1.
(a) HPT disc with indicated specimen extraction areas. (b) cyclic four-point-bending test fixture.
Figure 1.
(a) HPT disc with indicated specimen extraction areas. (b) cyclic four-point-bending test fixture.
A PHILIPS XL40 scanning electron microscope (SEM, Philips, Eindhoven, The Netherlands) was used for fractographic investigations and low magnification microstructure investigations at a voltage of 20 kV. For SEM investigations with higher magnification, a ZEISS Supra 40VP (Carl Zeiss Microscopy GmbH, Oberkochen, Germany) was used at a voltage of 5 kV. The microstructure of the HPT processed samples was further investigated by transmission electron microscopy (TEM). TEM lamellas were cut from the HPT deformed discs at the position where the SEM investigations had been carried out. These areas are located approximately 3 mm from the center (Figure 1). The lamellae were prepared by FIB lift-out using a FEI Strata 400S (FEI, Hillsboro, OR, USA) with the final polishing performed with a 5kV Ga+-ion beam. The TEM lamellas of samples after fatigue fractures were taken from the location of the fracture initiation site.
Automated crystal orientation mapping (ACOM-TEM) was conducted using a Tecnai F20 ST (FEI, Hillsboro, OR, USA) equipped with an ASTAR DigiStar (Nanomegas, Brussels, Belgium) system and operated at 200 kV in µp-STEM mode with spot size 7, camera length 150 mm, condenser aperture 20 µm, gun lens 6 and extraction voltage 4.5 kV [21]. Orientation maps have been obtained with an acquisition speed of 100 frames per second. Data processing for area weighted grain size determination consisted of the following steps:
Crystallite/grain recognition in the orientation maps with an extended version of Mtex 3.4.2 [22]. The chosen disorientation between neighbors for the recognition was 5°.
Pixel filtering of the orientation maps was performed with a median filter of the combined Euler angles, weighted by the phase [23].
Crystallites that exhibit a 180° orientation ambiguity to their neighbors were corrected [24].
- Small grains and grains with a bad reliability and index were removed.
- No re-filling of any of the removed pixels was undertaken.
BF/DF-TEM analysis was carried out with the help of an image corrected FEI Titan 80-300 (FEI, Hillsboro, OR, USA), equipped with a Gatan US1000 (Gatan, Pleasanton, CA, USA) slow scan CCD camera operated at 300 kV.
3. Results and Discussion
3.1. Materials and Microstructure
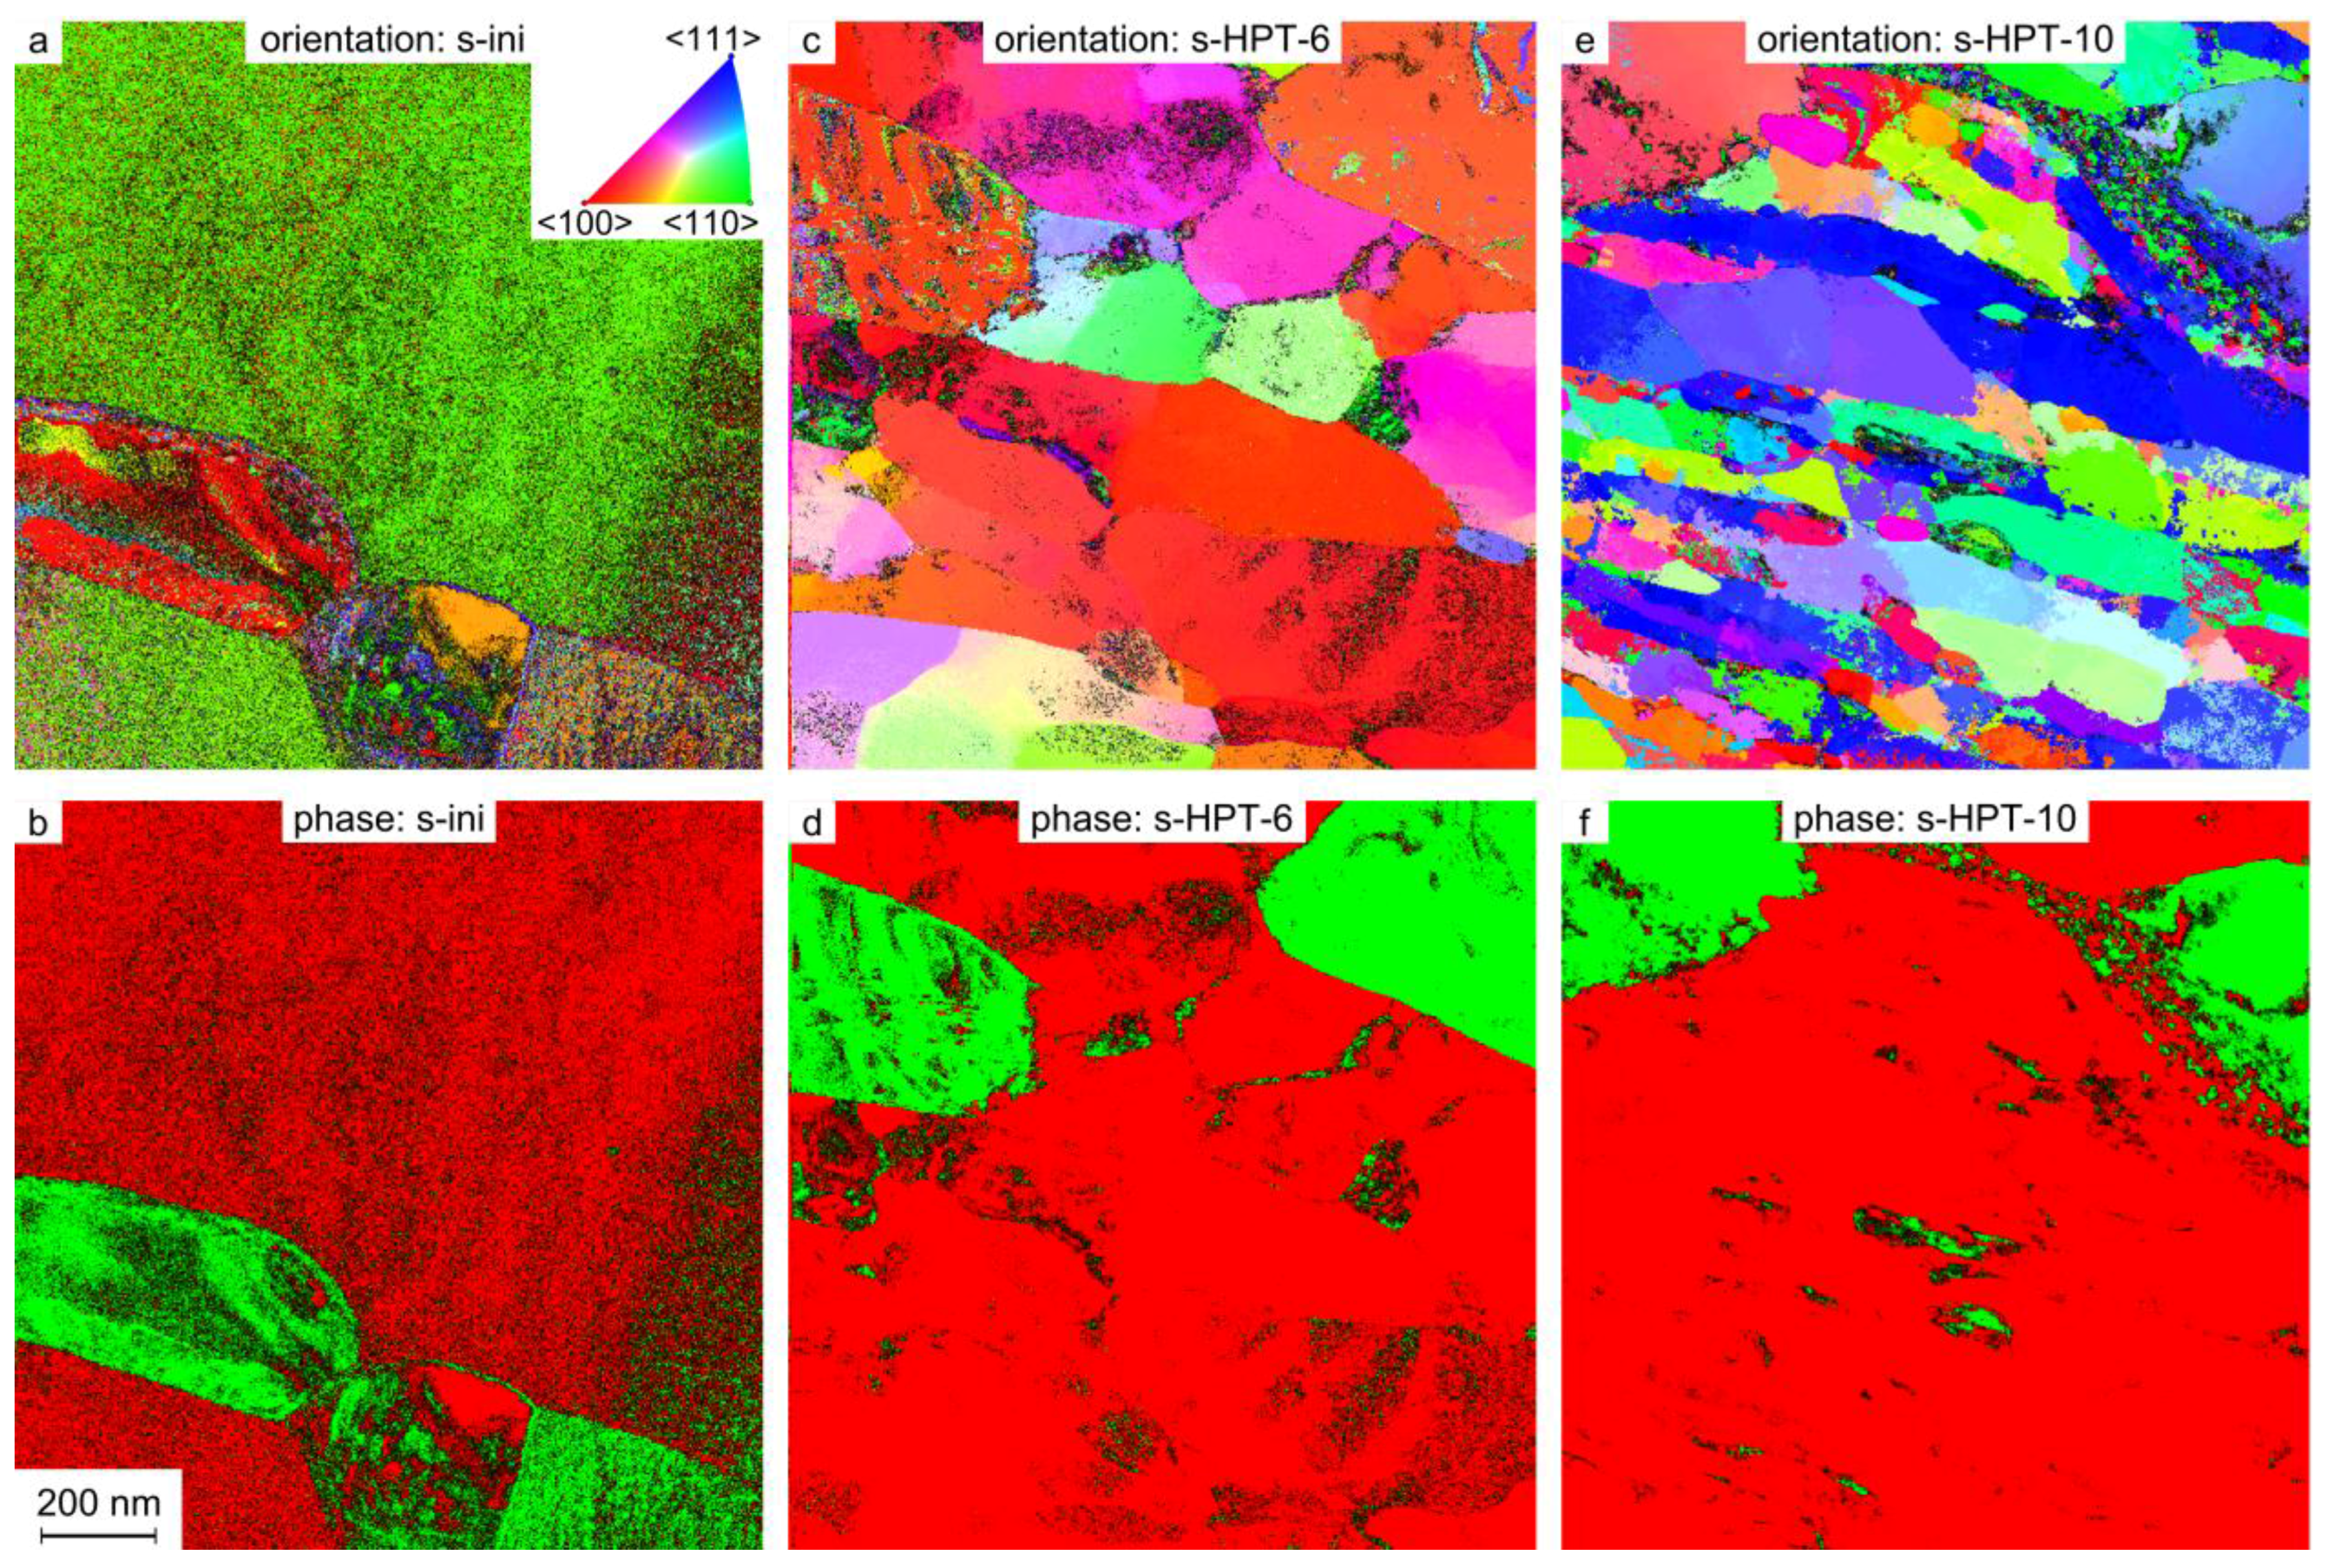
The microstructure of C45 steel after spheroidizing annealing (S state) is shown in Figure 2a and Figure 3a,b.
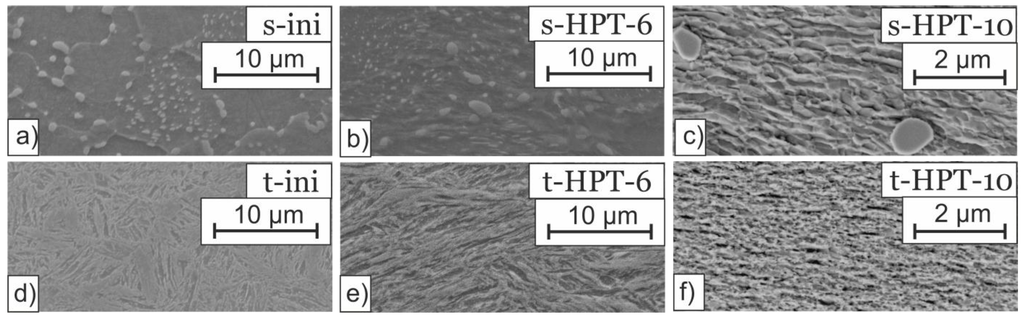
Figure 2.
Etched surface microstructures prior to the fatigue tests (a) initial state after soft annealing containing spheroidal carbides (b) after 6 HPT rotations (c) after 10 HPT rotations (d) initial state with tempered microstructure (e) after 6 rotations (f) after 10 rotations.
Figure 2.
Etched surface microstructures prior to the fatigue tests (a) initial state after soft annealing containing spheroidal carbides (b) after 6 HPT rotations (c) after 10 HPT rotations (d) initial state with tempered microstructure (e) after 6 rotations (f) after 10 rotations.

The soft annealed state contains spheroidal carbides distributed in a uniform coarse grained microstructure with well-defined grain boundaries (Figure 2a and Figure 3b). The grains are micrometer sized (~15 µm) and initial hardness is 169 HV. This state will be referred to as s-ini. Typical images of the S state after warm HPT for six and ten rotations (these states will be referred to as s-HPT-6 and s-HPT-10) are shown in Figure 2b,c and Figure 3c–f. After six rotations, the microstructure is refined and new grain boundaries appear (Figure 2b and Figure 3c). The grain size shrinks to approximately 0.8 µm and the grains show a slight elongation along the HPT shear direction (Figure 3c) with a hardness of 289 HV. After ten rotations, the ferrite grain size decreases further to approximately 0.2 µm and the elongation is more pronounced (Figure 3e,f). Hardness rises to 511 HV. The continuous grain refinement is best visible in Figure 3a,c,e.
The spheroidal carbides are still clearly visible in s-HPT-10, but the larger ones in Figure 3e are partially fragmented and appear blurred. In addition, an increasing number of small carbides are distributed between the ferrite grains.

Figure 3.
Orientation (a,c,e) and phase (b,d,f) maps (ACOM-TEM) overlaid with the reliability of the spheroidized microstructures (a,b), after 6 (c,d) and 10 HPT rotations (e,f) all prior to the fatigue tests. The color code of the orientation maps is given in (a). The projection direction is normal to the paper plane. The Fe phase is given in red and green represents the carbide phase. The reliability is given in black for both types of maps.
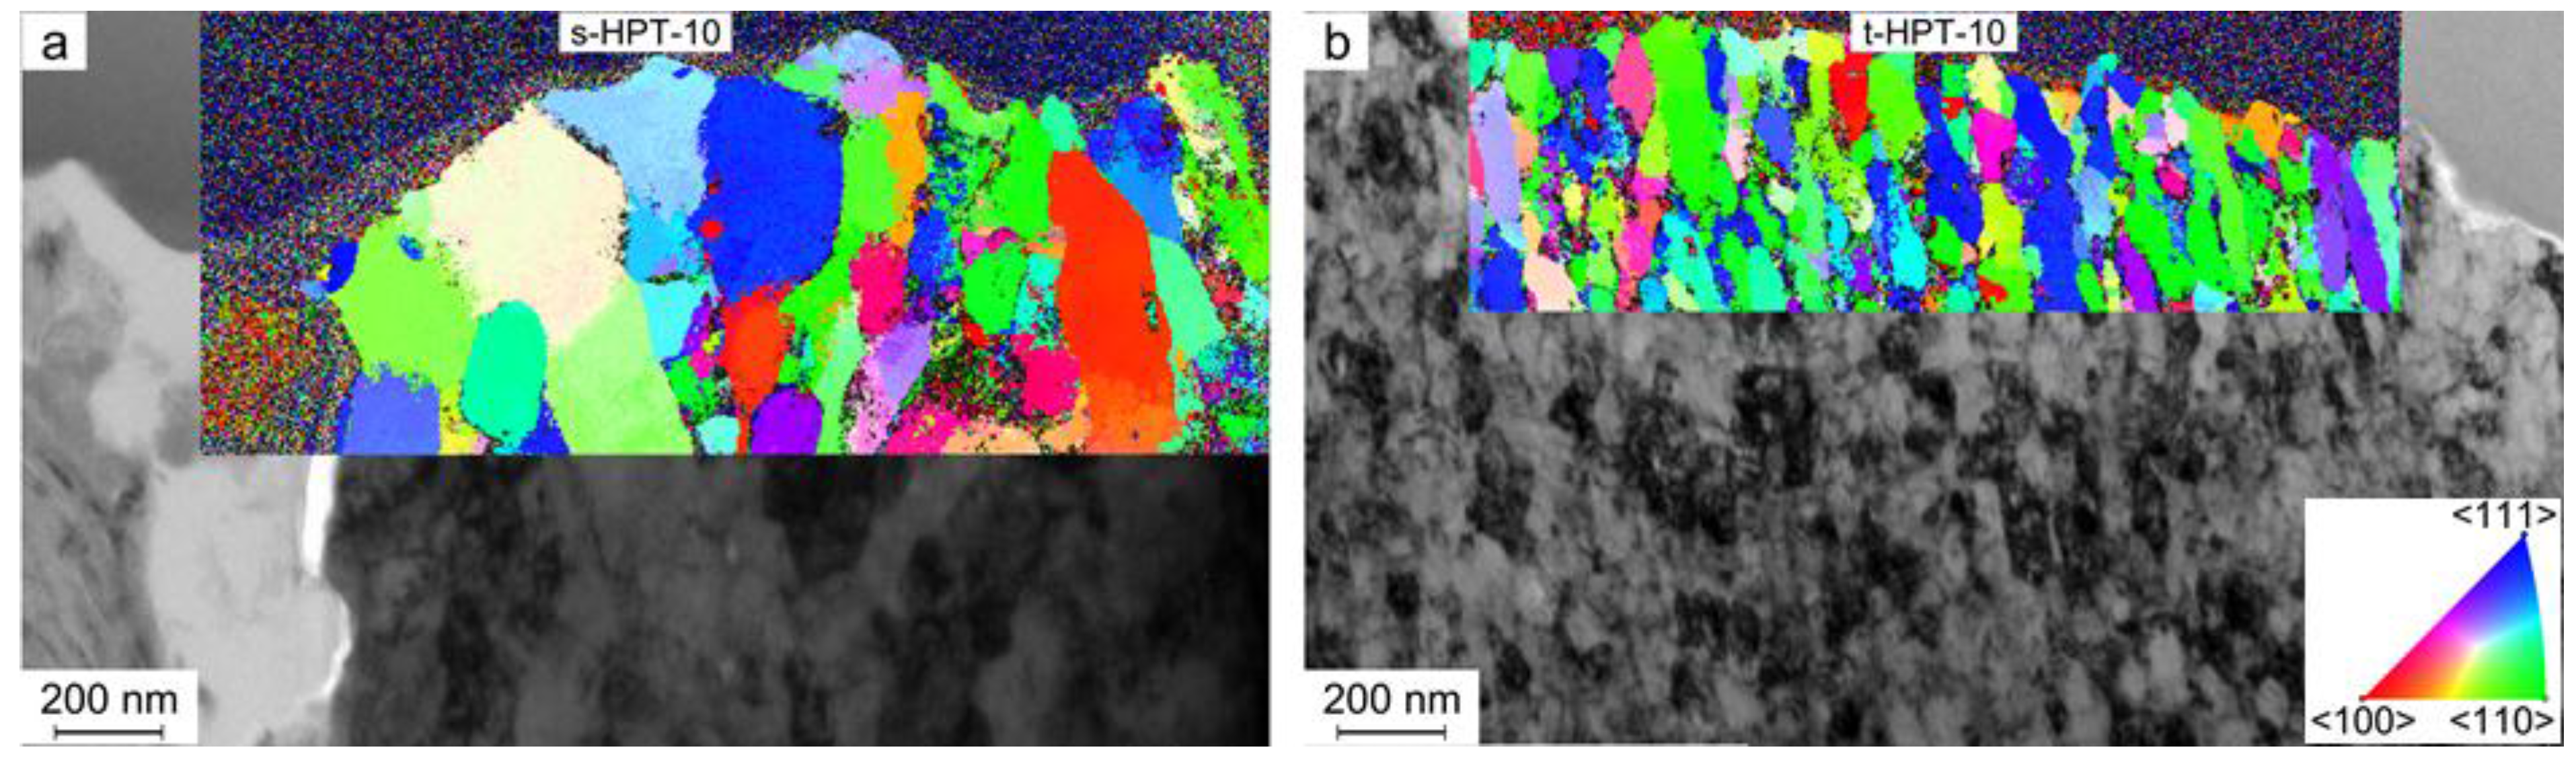
Needle-shaped microstructures are visible in Figure 2d and Figure 4a,b for C45 steel after tempering (T state). Carbides are finely dispersed between the needles (Figure 4b). The samples have an initial hardness of 388 HV before HPT. This state will be referred to as t-ini. After six HPT rotations (t-HPT-6), the needles become slightly refined (Figure 2e and Figure 4c), their long axis is oriented along the shear direction and the formation of new low and high angle grain boundaries is visible. The hardness increases to 457 HV in t-HPT-6. After ten rotations (t-HPT-10), the microstructure shows strong refinement by SEM (Figure 2f) with no visible needles anymore. ACOM-TEM reveals an ultrafine grained structure with elongated grains and the cementite is finely dispersed in the ferrite matrix. The final hardness at the fatigue samples extraction point is 758 HV. However, the microstructure and hardness show variations along the radius of the HPT disk due to the shear strain variation (compare Equation (1)). The cementite distribution is most homogeneous after 10 rotations.
After HPT, shear bands are visible by optical microscopy on the surface, fracture surface, and cross section of all specimens. Such shear bands have been reported earlier for HPT processed nanocrystalline metals such as palladium [25]. Interesting to notice is that, in the present case of the C45 steel, non-metallic inclusion were sometimes sheared by the shear bands as seen in the FIB cross-section in Figure 5.

Figure 4.
Orientation (a,c,e) and phase (b,d,f) maps (ACOM-TEM) overlaid with the reliability of the tempered microstructures (a,b), after 6 (c,d) and 10 HPT rotations (e,f) all prior to the fatigue tests. The color code of the orientation maps is given in (e). The projection direction is normal to the paper plane. The Fe phase is given in red and green represents the carbide phase. The reliability is given in black for both types of maps.
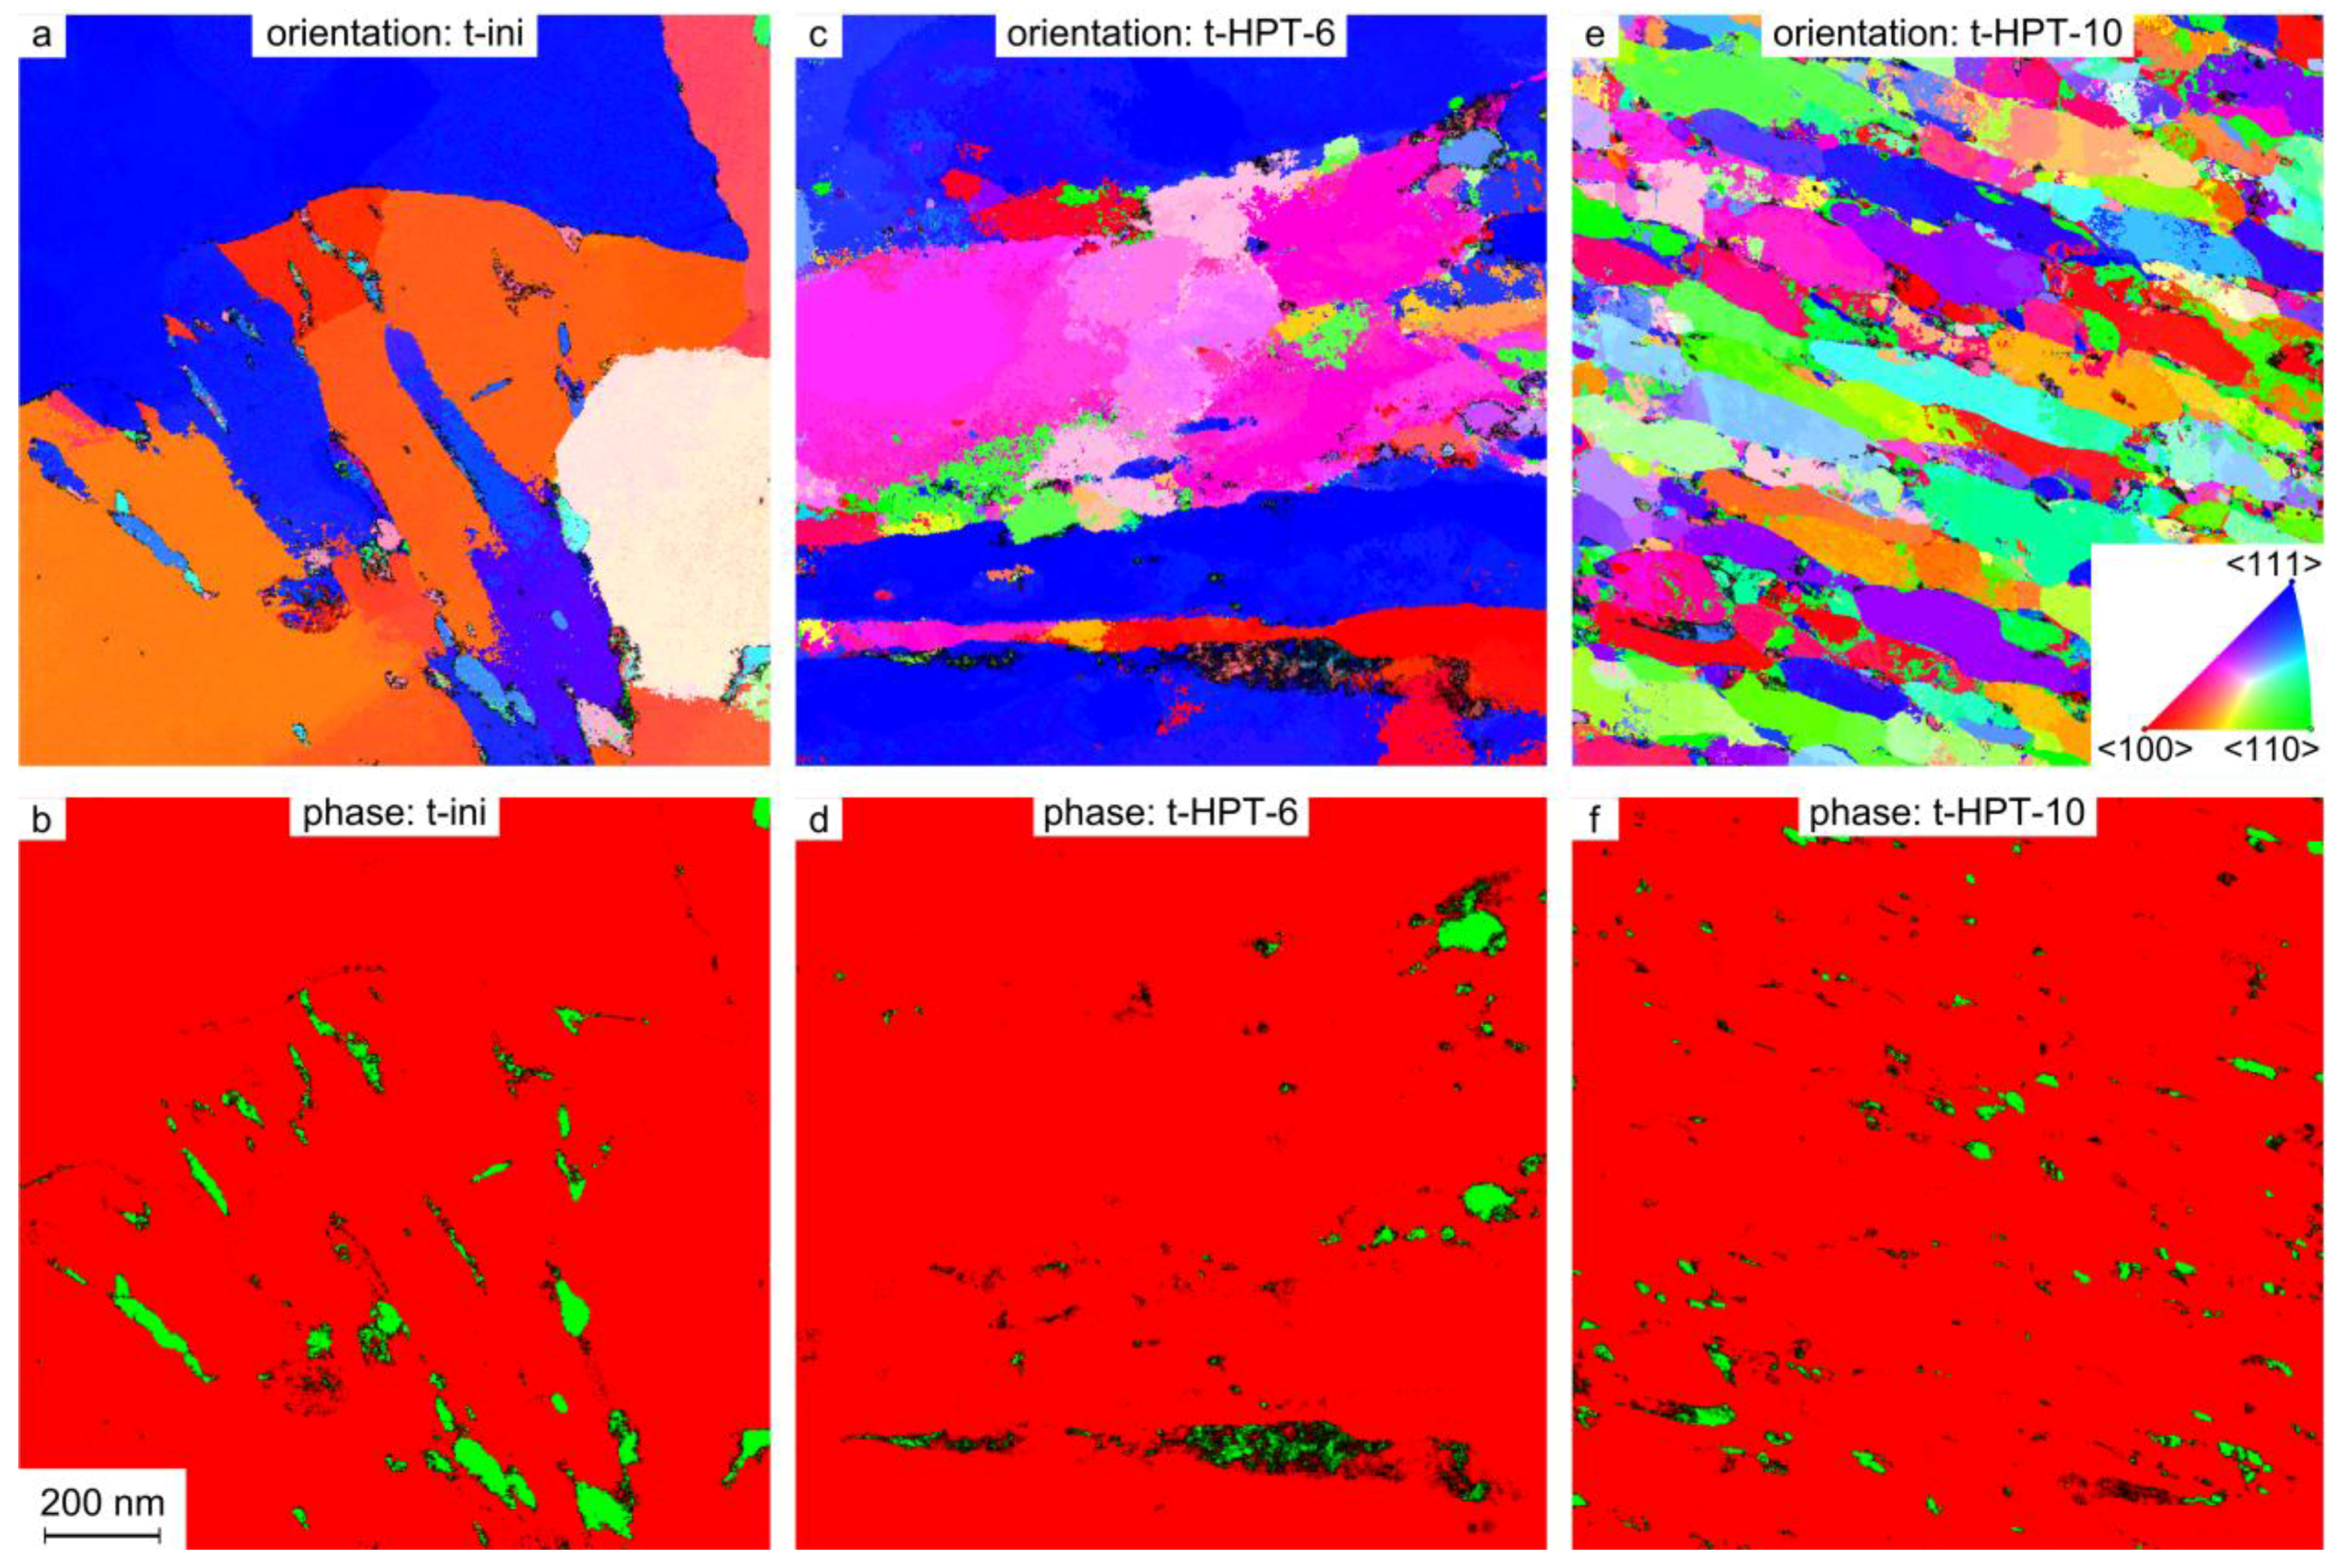
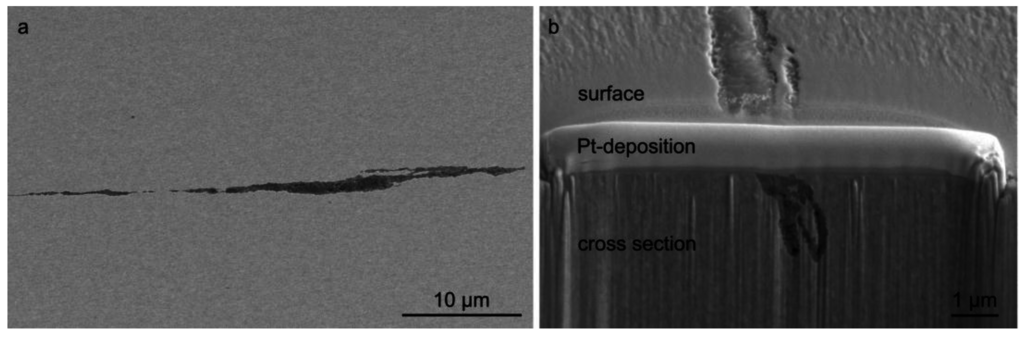
Figure 5.
SEM images of a sheared non-metallic inclusion on the (non-etched) surface of t-HPT-10: (a) top view; (b) FIB cut through the inclusion.
Figure 5.
SEM images of a sheared non-metallic inclusion on the (non-etched) surface of t-HPT-10: (a) top view; (b) FIB cut through the inclusion.

3.2. S-N-Curves
Four-point-bending fatigue tests were carried out with both carbide morphologies in the initial coarse grained (CG) and the HPT deformed states (Figure 6). The edge stress amplitude was plotted against the number of cycles to fracture for both initial carbide morphologies. The arrows in the squares indicate runouts after 107 cycles. The small numbers beside the arrows show the number of overlapping runout-points. The crack initiation site type is indicated on top of the diagrams. A few specimens could not be investigated (n.I.) after fatigue, e.g., because they did not break completely.

Figure 6.
S-N curves of (a) CG and UFG spheroidized SAE 1045 revealing endurance limits of 316 MPa, 493 MPa and 837 MPa and of (b) UFG and CG tempered SAE 1045 showing endurance limits of 640 MPa, 769 MPa and 850 MPa.
Figure 6.
S-N curves of (a) CG and UFG spheroidized SAE 1045 revealing endurance limits of 316 MPa, 493 MPa and 837 MPa and of (b) UFG and CG tempered SAE 1045 showing endurance limits of 640 MPa, 769 MPa and 850 MPa.
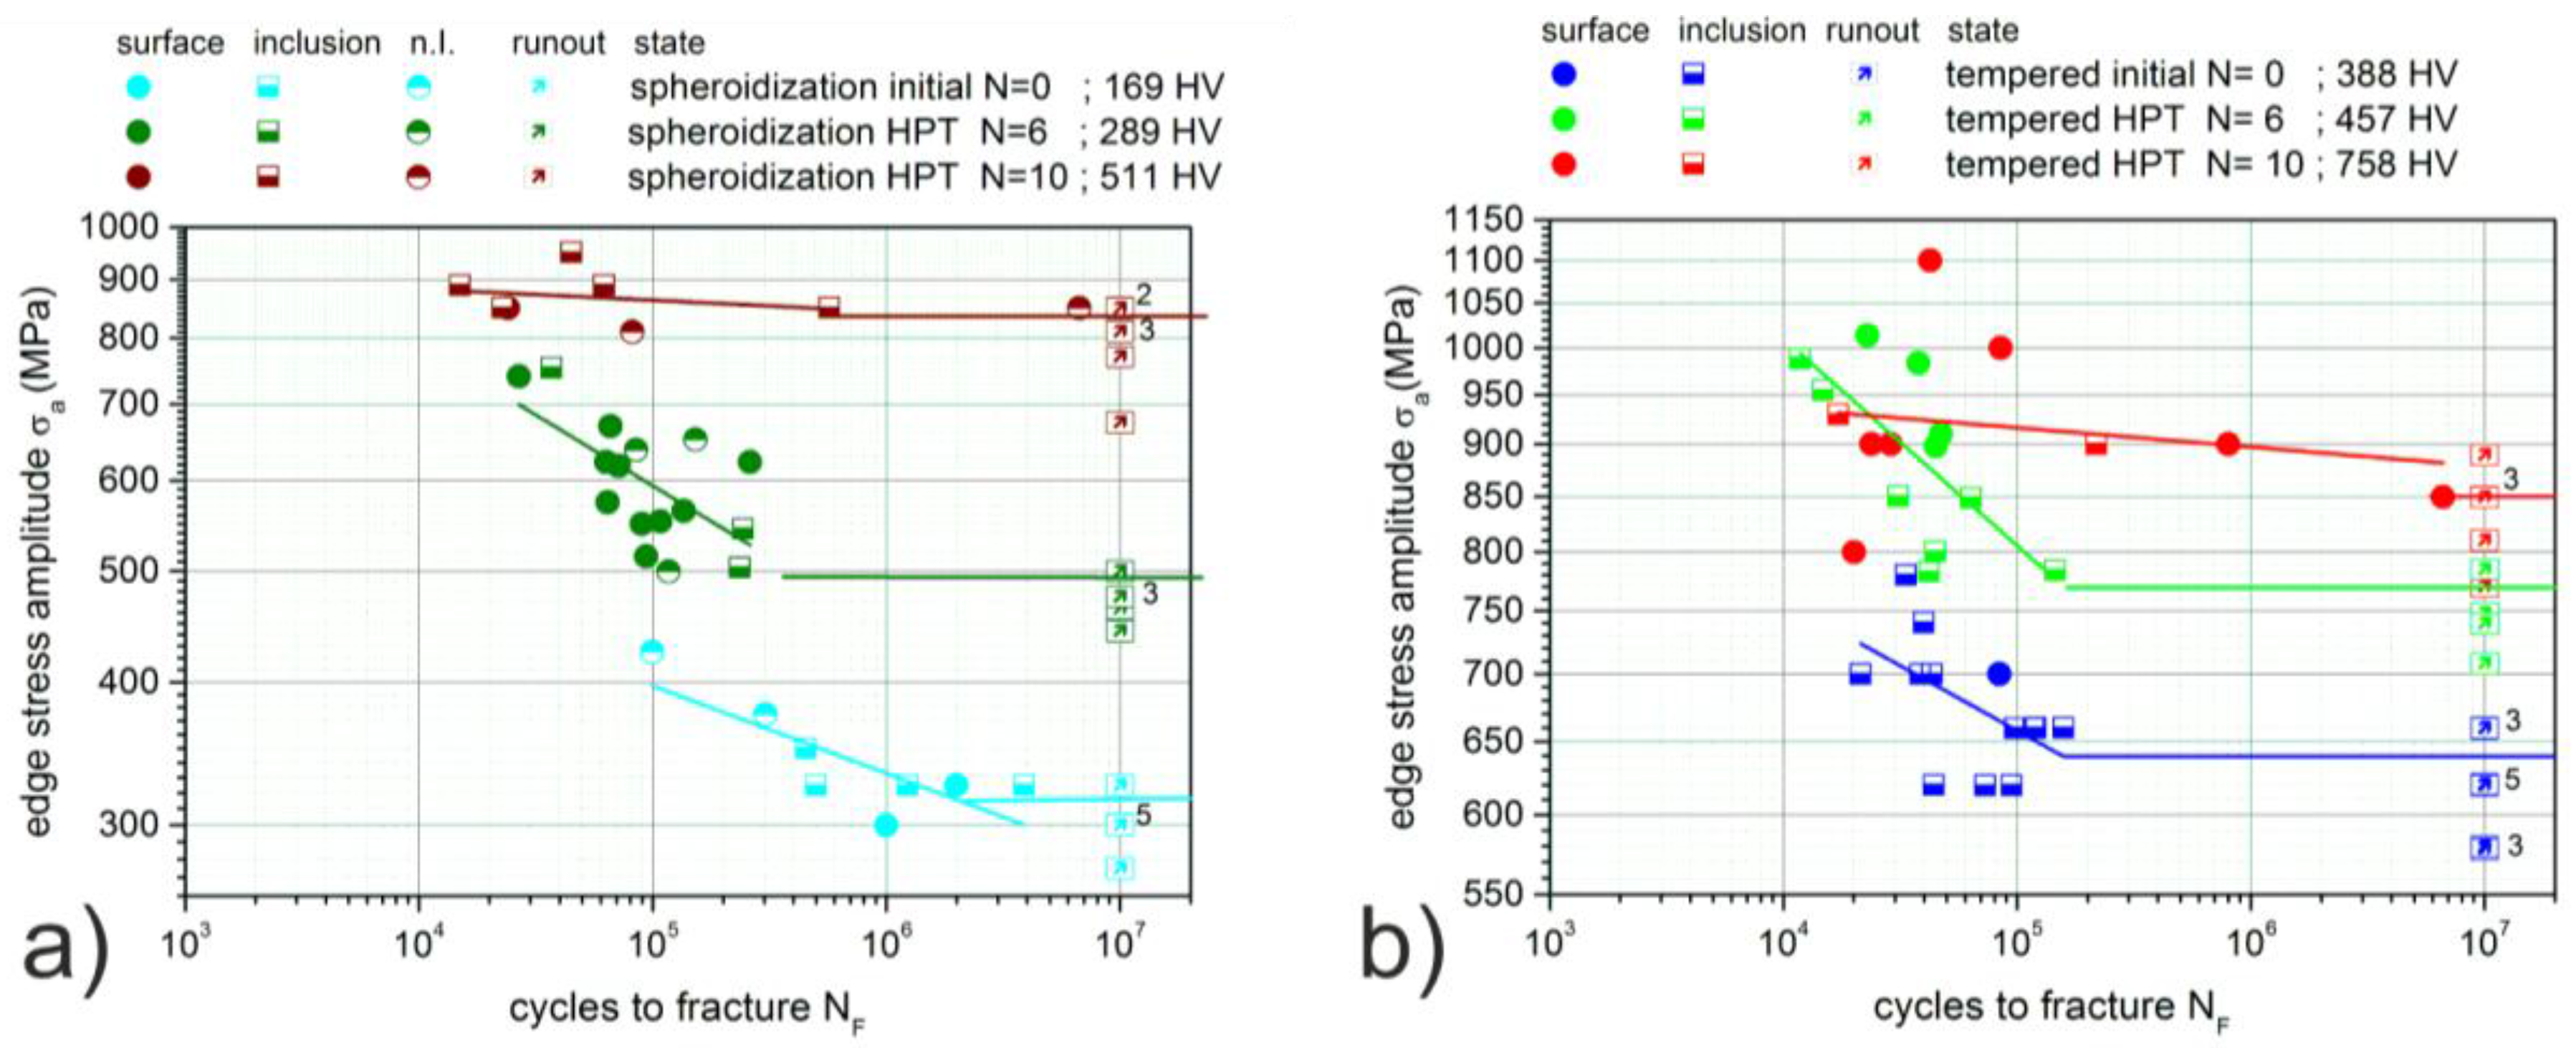
Figure 6a shows the values for the spheroidizing annealed state in the CG (s-ini) and the UFG (s-HPT-6 and s-HPT-10) condition. For the s-ini state, a fatigue limit of 316 MPa was determined by the staircase method. Fractured specimens were observed after more than 10,000,000 cycles at stress amplitude of 325 MPa, while at stress amplitude of 300 MPa only one specimen fractured. In contrast, s-HPT-6 with a hardness of 289 HV showed fatigue fracture at lifetimes below about 400,000 cycles. The endurance limit (494 MPa) was significantly higher compared to s-ini. Crack initiation was mainly at the surface as indicated in the diagram. After 10 HPT rotations, resulting in a hardness of 511 HV, the fatigue limit further increased to 837 MPa. One specimen failed at 800,000 cycles, all other either failed within the first 80,000 cycles or ran out. Below 800 MPa, no fatigue failure was observed for s-HPT-10. The crack initiation site changed with an increasing number of HPT-rotations from the surface without non-metallic inclusions for s-HPT-6 to crack initiation at non-metallic inclusions at the surface in s-HPT-10 (see also Figure 7).
Figure 6b shows the S-N-curves for t-ini, t-HPT-6 and t-HPT-10. A fatigue limit of 640 MPa was determined for t-ini, corresponding to a hardness of 388 HV. In this case, crack initiation mostly occurred at non-metallic inclusions at the surface. With an increased hardness of 457 HV, the fatigue limit of t-HPT-6 rose to 769 MPa. For higher fatigue loads, a specific crack initiation location could not be identified. The exceptions are cyclic edge stresses between 780 MPa and 900 MPa, where all cracks initiated at non-metallic inclusions. For the t-HPT-10 specimens, offering the highest shear strain and hardness, the S-N curves and the crack behavior seem to be completely different. In contrast to the initial state and t-HPT-6, where specimens either failed before 200,000 cycles or ran out, many t-HPT-10 samples failed at a higher number of cycles. In addition, this state also revealed a number of very early cracks, which reduced the fatigue limit to a value of 850 MPa, lower than expected for a hardness of 758 HV, when considering a linear correlation between hardness and fatigue limit. Cracks were mostly initiated at the surface of the t-HPT-10 specimens.
3.3. Fractographic Investigations
All fracture surfaces of the broken specimens were investigated by SEM after the bending fatigue tests. In bending specimens, a stress gradient over the thickness leads to tension on one side, a neutral plane, and compression on the other side. The tension side, where fatigue cracks always start in this kind of material, is always shown at the bottom for the SEM images in this paper.
In the following fractographic investigations, only the HPT-10 states are included because of their large scatter in lifetime compared to all other states.
Figure 7a shows the fracture surface of one of the s-HPT-10 specimens after a fatigue load of 850 MPa. A large fatigue fracture surface (Figure 7b) is visible, which is larger than typically found in conventional high strength materials. The fatigue fracture surface shown in Figure 7b is very homogeneous and appears smooth. The crack initiation occurred at a non-metallic inclusion. In the transition area between fatigue and residual fracture surface, some short cave-like shear bands are visible. Such shear bands are observed in fracture surfaces of HPT processed materials, for example in nanocrystalline palladium after HPT [25]. In this specimen, shear bands seem not to have influenced the crack initiation or early fatigue crack growth because they are observed only in the late fatigue crack growth areas well as in the residual fracture area.

Figure 7.
Fracture surface of s-HPT-10 (a) whole fracture surface (b) fatigue fracture surface; some shear bands resulting from HPT are shown with arrows.
Figure 7.
Fracture surface of s-HPT-10 (a) whole fracture surface (b) fatigue fracture surface; some shear bands resulting from HPT are shown with arrows.
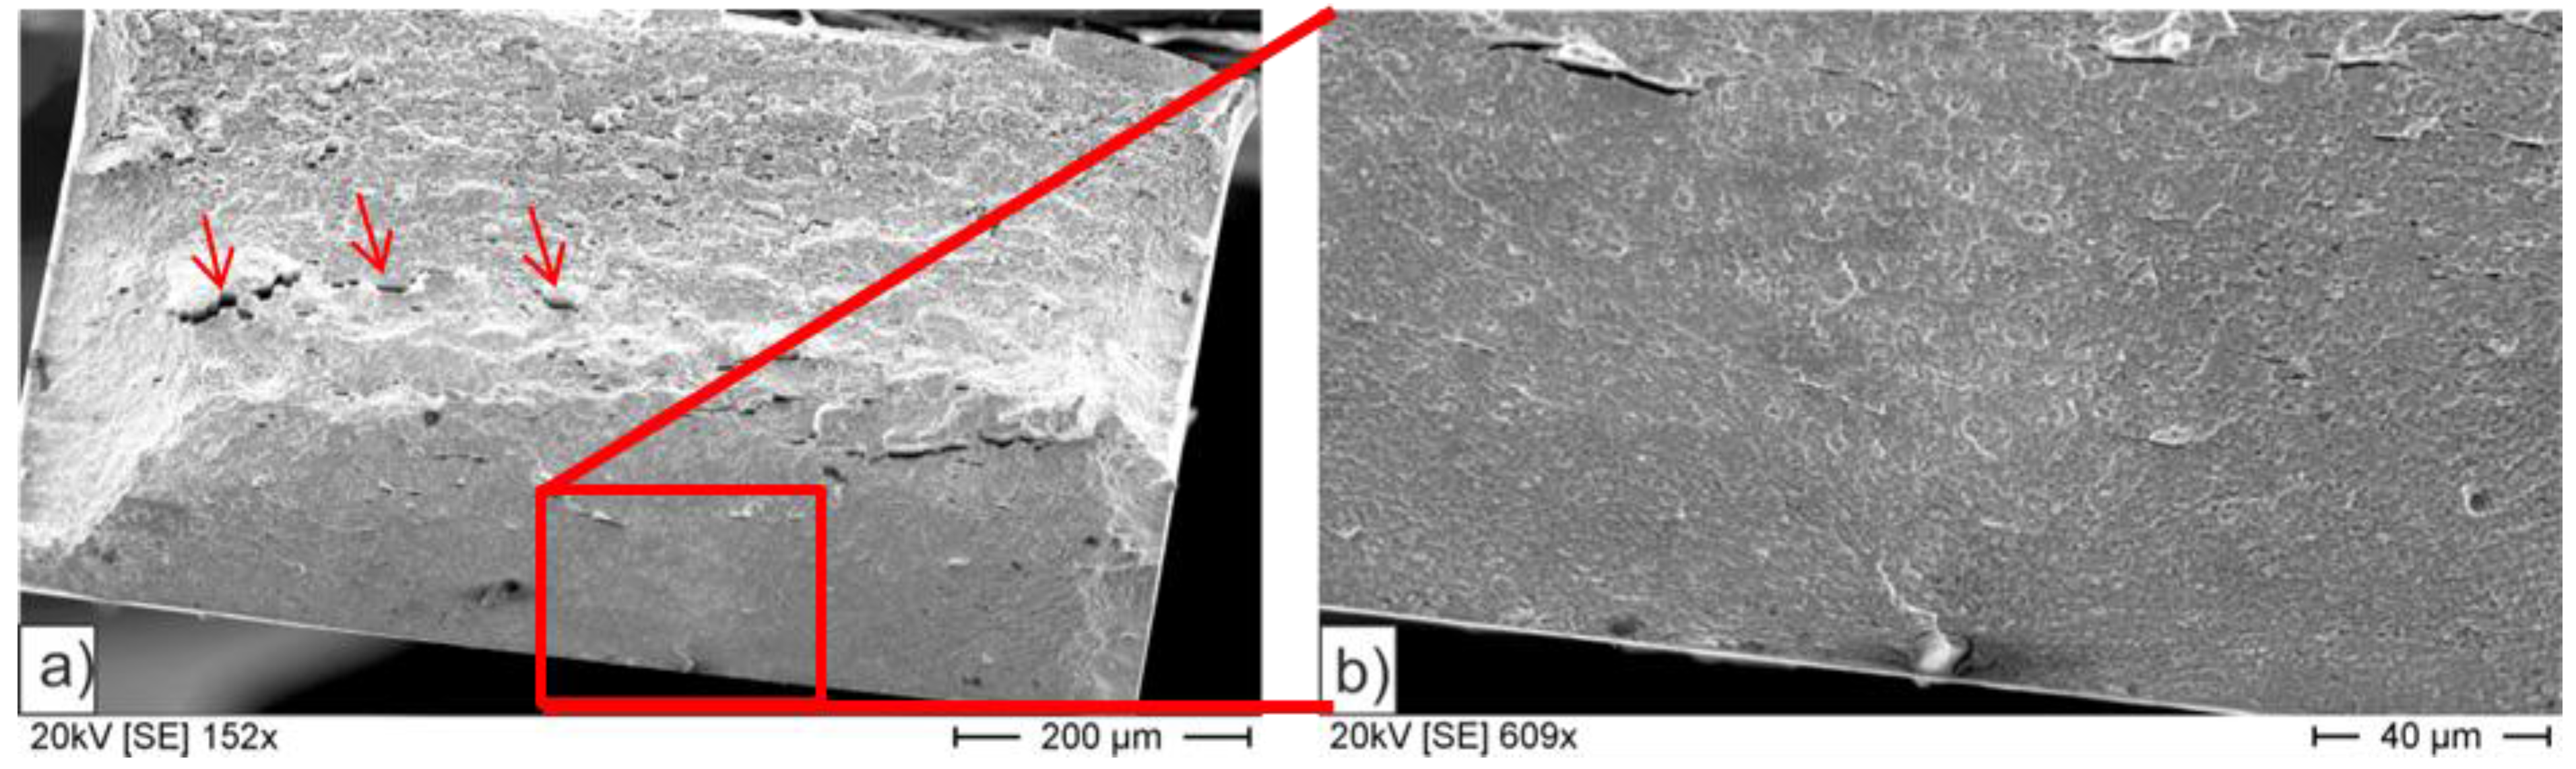
Figure 8 illustrates the fracture surface of a t-HPT-10 sample loaded at a stress of 900 MPa. SEM investigations reveal shear bands in the fracture surface. The cave-like characteristics appear over the whole residual fracture surface. With a length of up to 200 µm, they seem to be larger than those in the spheroidizing annealed state, which are only up to 40 µm long. The fatigue fracture surface in Figure 8b is smaller than in the s-HPT-10 state although the sample was loaded at nearly the same stress level. We also observe crack initiation at a non-metallic inclusion. The fracture appearance is rather homogenous with a flat fatigue fracture surface. In addition, some shear bands are visible in the fatigue fracture surface but similar to the spheroidizing annealed state, they do not influence the crack initiation or propagation.

Figure 8.
Fracture surface of t-HPT-10 (a) whole fracture surface (b) crack initiation area at the surface without nonmetallic inclusion and fatigue fracture surface.
Figure 8.
Fracture surface of t-HPT-10 (a) whole fracture surface (b) crack initiation area at the surface without nonmetallic inclusion and fatigue fracture surface.
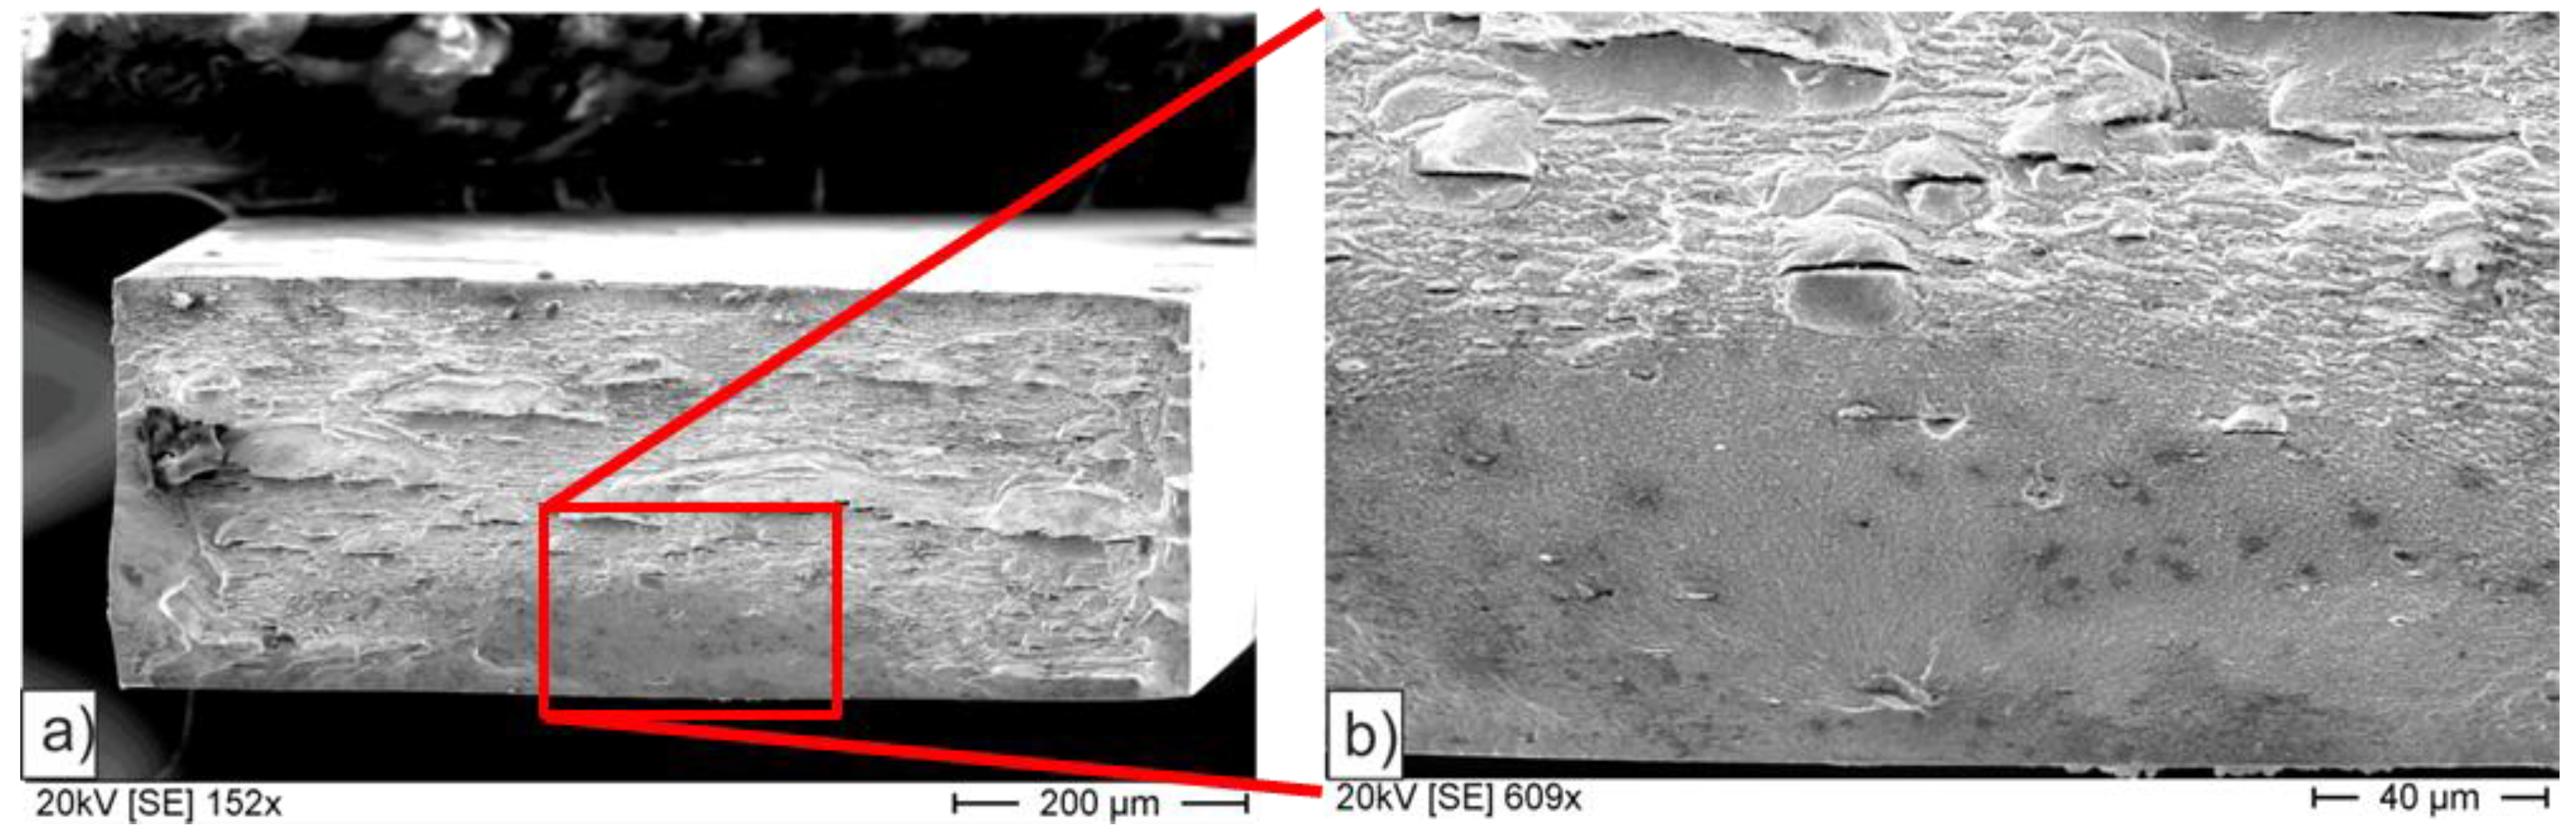
Figure 9 shows a comparison of the residual fracture surfaces of the two states with tempered and spheroidizing annealed microstructure after HPT. There are significant differences in the morphology. In Figure 9a, s-HPT-10 shows well-defined dimples, which indicate a homogeneous ductile fracture behavior.
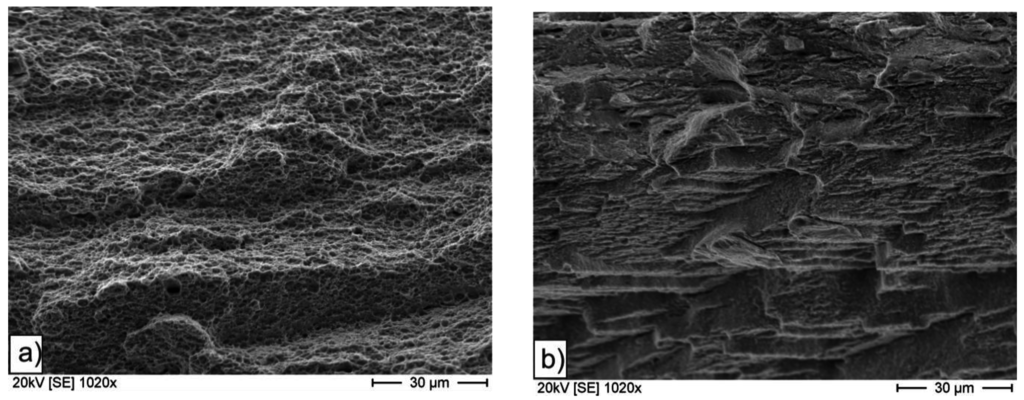
Figure 9.
Residual fracture surface of (a) s-HPT-10 and (b) t-HPT-10.
Figure 9.
Residual fracture surface of (a) s-HPT-10 and (b) t-HPT-10.

In contrast, Figure 9b reveals a rather rough residual fracture surface with sharp edges, which are common for this material state and indicate a brittle material behavior. Most likely, these sharp edges are shear steps from shear banding. Figure 10a,b show an FIB cross-section of the t-HPT-residual fracture surface at a characteristic cave, which was formed by a shear band. This indicates a correlation between shear bands observed at the fracture surface and the microstructure underneath. The shear band at the fracture surface is connected to a line-shaped inhomogeneity inside the microstructure. A similar line pattern is also visible in a polished and Nital-etched cross section of the HPT specimen in Figure 10c prior to fatigue loading. These lines are extended along the shear direction during HPT and become visible after etching in SEM in this case in the t-HPT-10 state. However, similar shear bands can also be seen in the micrographs of the s-HPT-10 states.

Figure 10.
SEM images of shear bands in t-HPT-10 samples (a,b) inside the residual fracture surface and (c) on the polished and etched cross section.
Figure 10.
SEM images of shear bands in t-HPT-10 samples (a,b) inside the residual fracture surface and (c) on the polished and etched cross section.
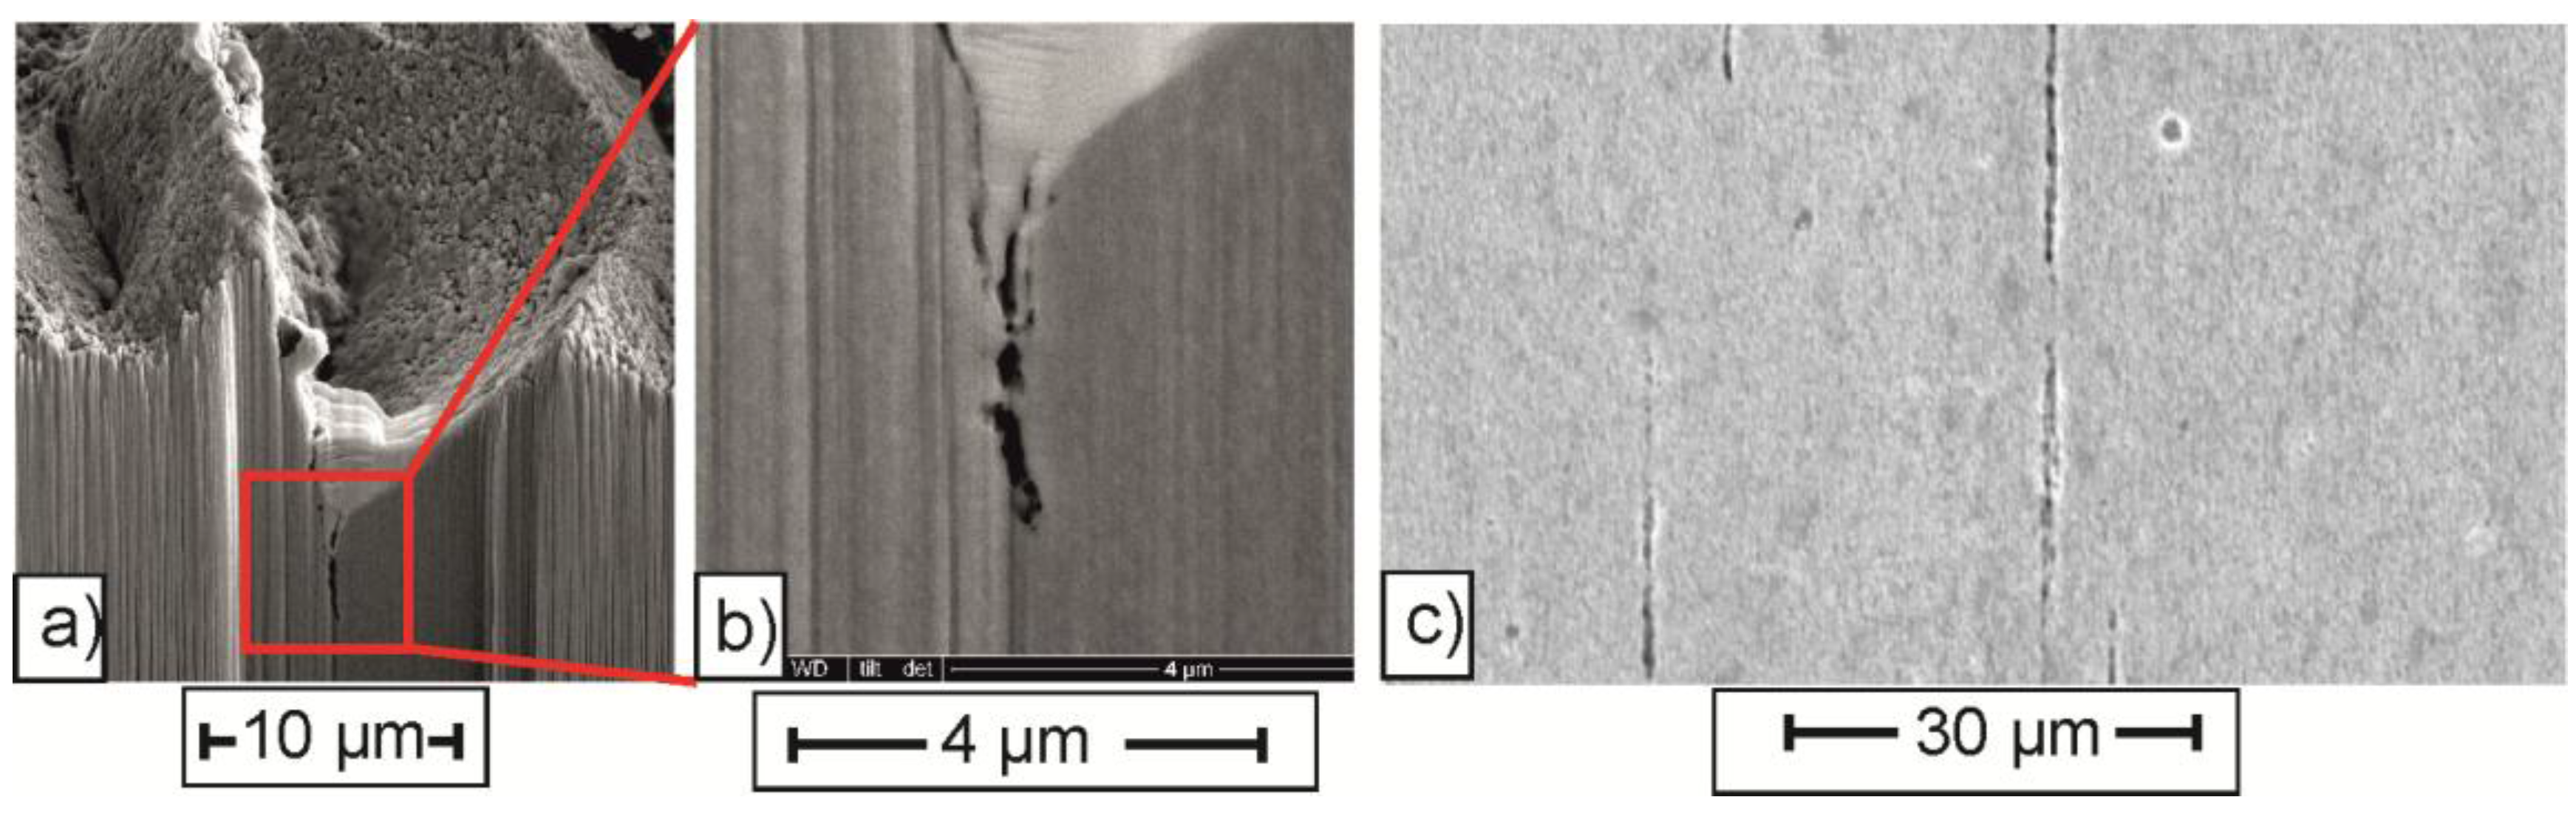

Figure 11.
Fracture surface of t-HPT-10 state which shows shear bands (a,b) loaded at 900 MPa and (c,d) loaded at 850 MPa (red open arrows at the top indicate the direction of shear bands in correlation to the specimens surface indicated by the yellow open arrows. The crack initiation site is always at the bottom of the pictures).
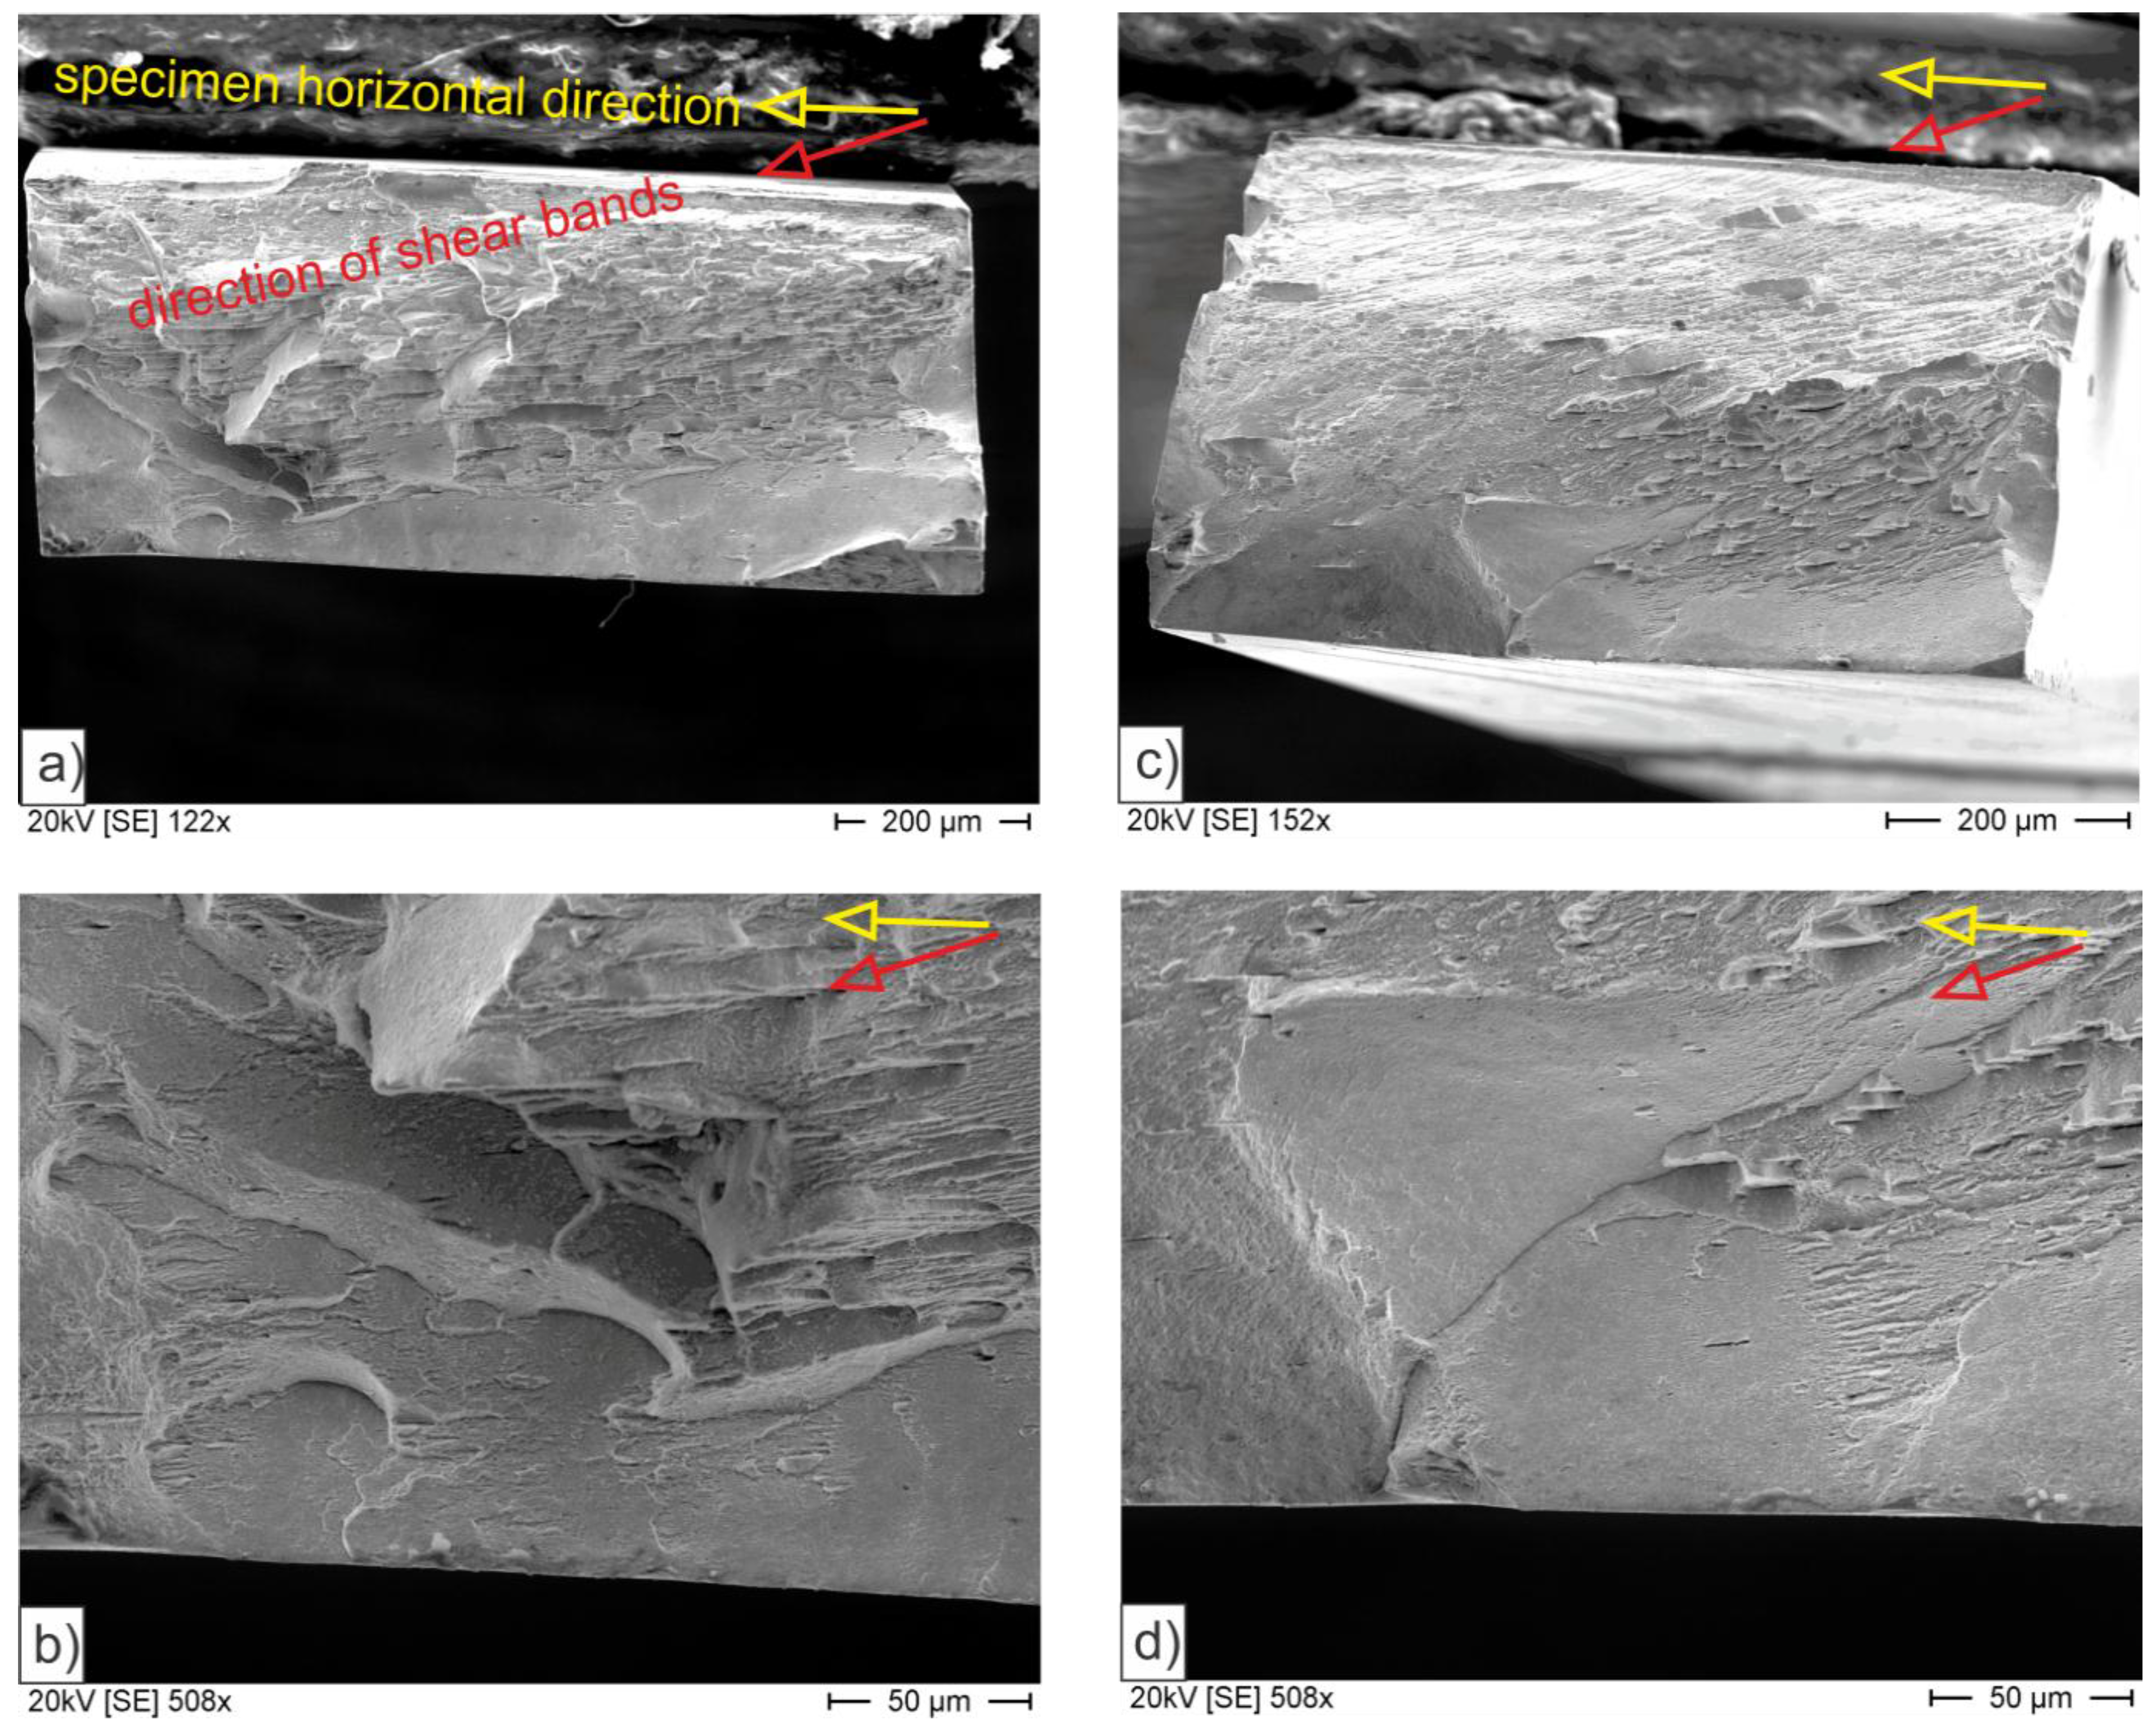
The fracture surface of a tempered specimen after HPT, which failed very early at 900 MPa, is shown in Figure 11a,b. The picture shows a cliff-like fracture surface with a high topology in the residual and also in the fatigue fracture surface. The fatigue crack seems to change direction and jump between different levels. Usually, fatigue cracks grow mostly perpendicular to the tensile stress in one defined direction, as visible in Figure 7 and Figure 8. The fact that this is not the case here is an indication of some inhomogeneities inside the material prior to fatigue loading which affected the crack initiation site and the crack path. The whole fracture surface offers different characteristics of the shear bands compared to the fatigue samples with higher endurance limits. The shear bands seem to influence the crack growth and the lifetime of the fatigue sample because there is a link between the shear bands inside the residual fracture surface and the different levels and layers in the fatigue fracture surface.
A similar behavior is presented in Figure 11c,d, showing the fracture surface of a t-HPT-10 state sample, which cracked after 6,000,000 cycles. It is obvious that shear bands are present in the area of fatigue crack growth, especially at the crack initiation site, where an extension of a shear bands are points of multiple crack initiation. These shear bands have been produced during HPT and seem to have promoted the crack initiation during fatigue load. Further crack growth in the fatigue fracture surface is similar to that shown in Figure 11a,b, exhibiting a high topology. The fatigue crack growth is dominated by the shear bands (marked with red arrows in all pictures). The two arrows in each part of Figure 11 indicate that there is an angle of misorientation between the expected shear plane at HPT (yellow arrows) and the shear band plane in the respective specimen (red arrows). This is the case for both specimens, which both exhibited early failure during fatigue testing, and it establishes a significant difference in contrast to samples in the spheroidization annealed or tempered state, which offer a homogeneous fracture behavior in the S-N curve without early cracks (t-HPT-6). For both specimens shown in Figure 11, a complex structure of different fracture planes is visible in the fatigue fracture surface. The surface of each single plane itself seems to be very flat, as expected for fatigue failure in ultrafine grained materials, resulting in a strong topology with clustering in different spatial directions.
Figure 12 shows the crack initiation site marked in Figure 11c,d in higher magnification after rotating the specimen by 20° out of plane. Some penetration lines are visible at the specimen surface where shear bands from HPT deformation seem to have been re-activated during fatigue loading. The assumed path of the shear bands inside the specimen is indicated by parallel lines, which fits the direction estimated from the overall fracture surface in Figure 11.

Figure 12.
Shear bands visible at the sample’s surface in the area of the crack initiation site.
Figure 12.
Shear bands visible at the sample’s surface in the area of the crack initiation site.
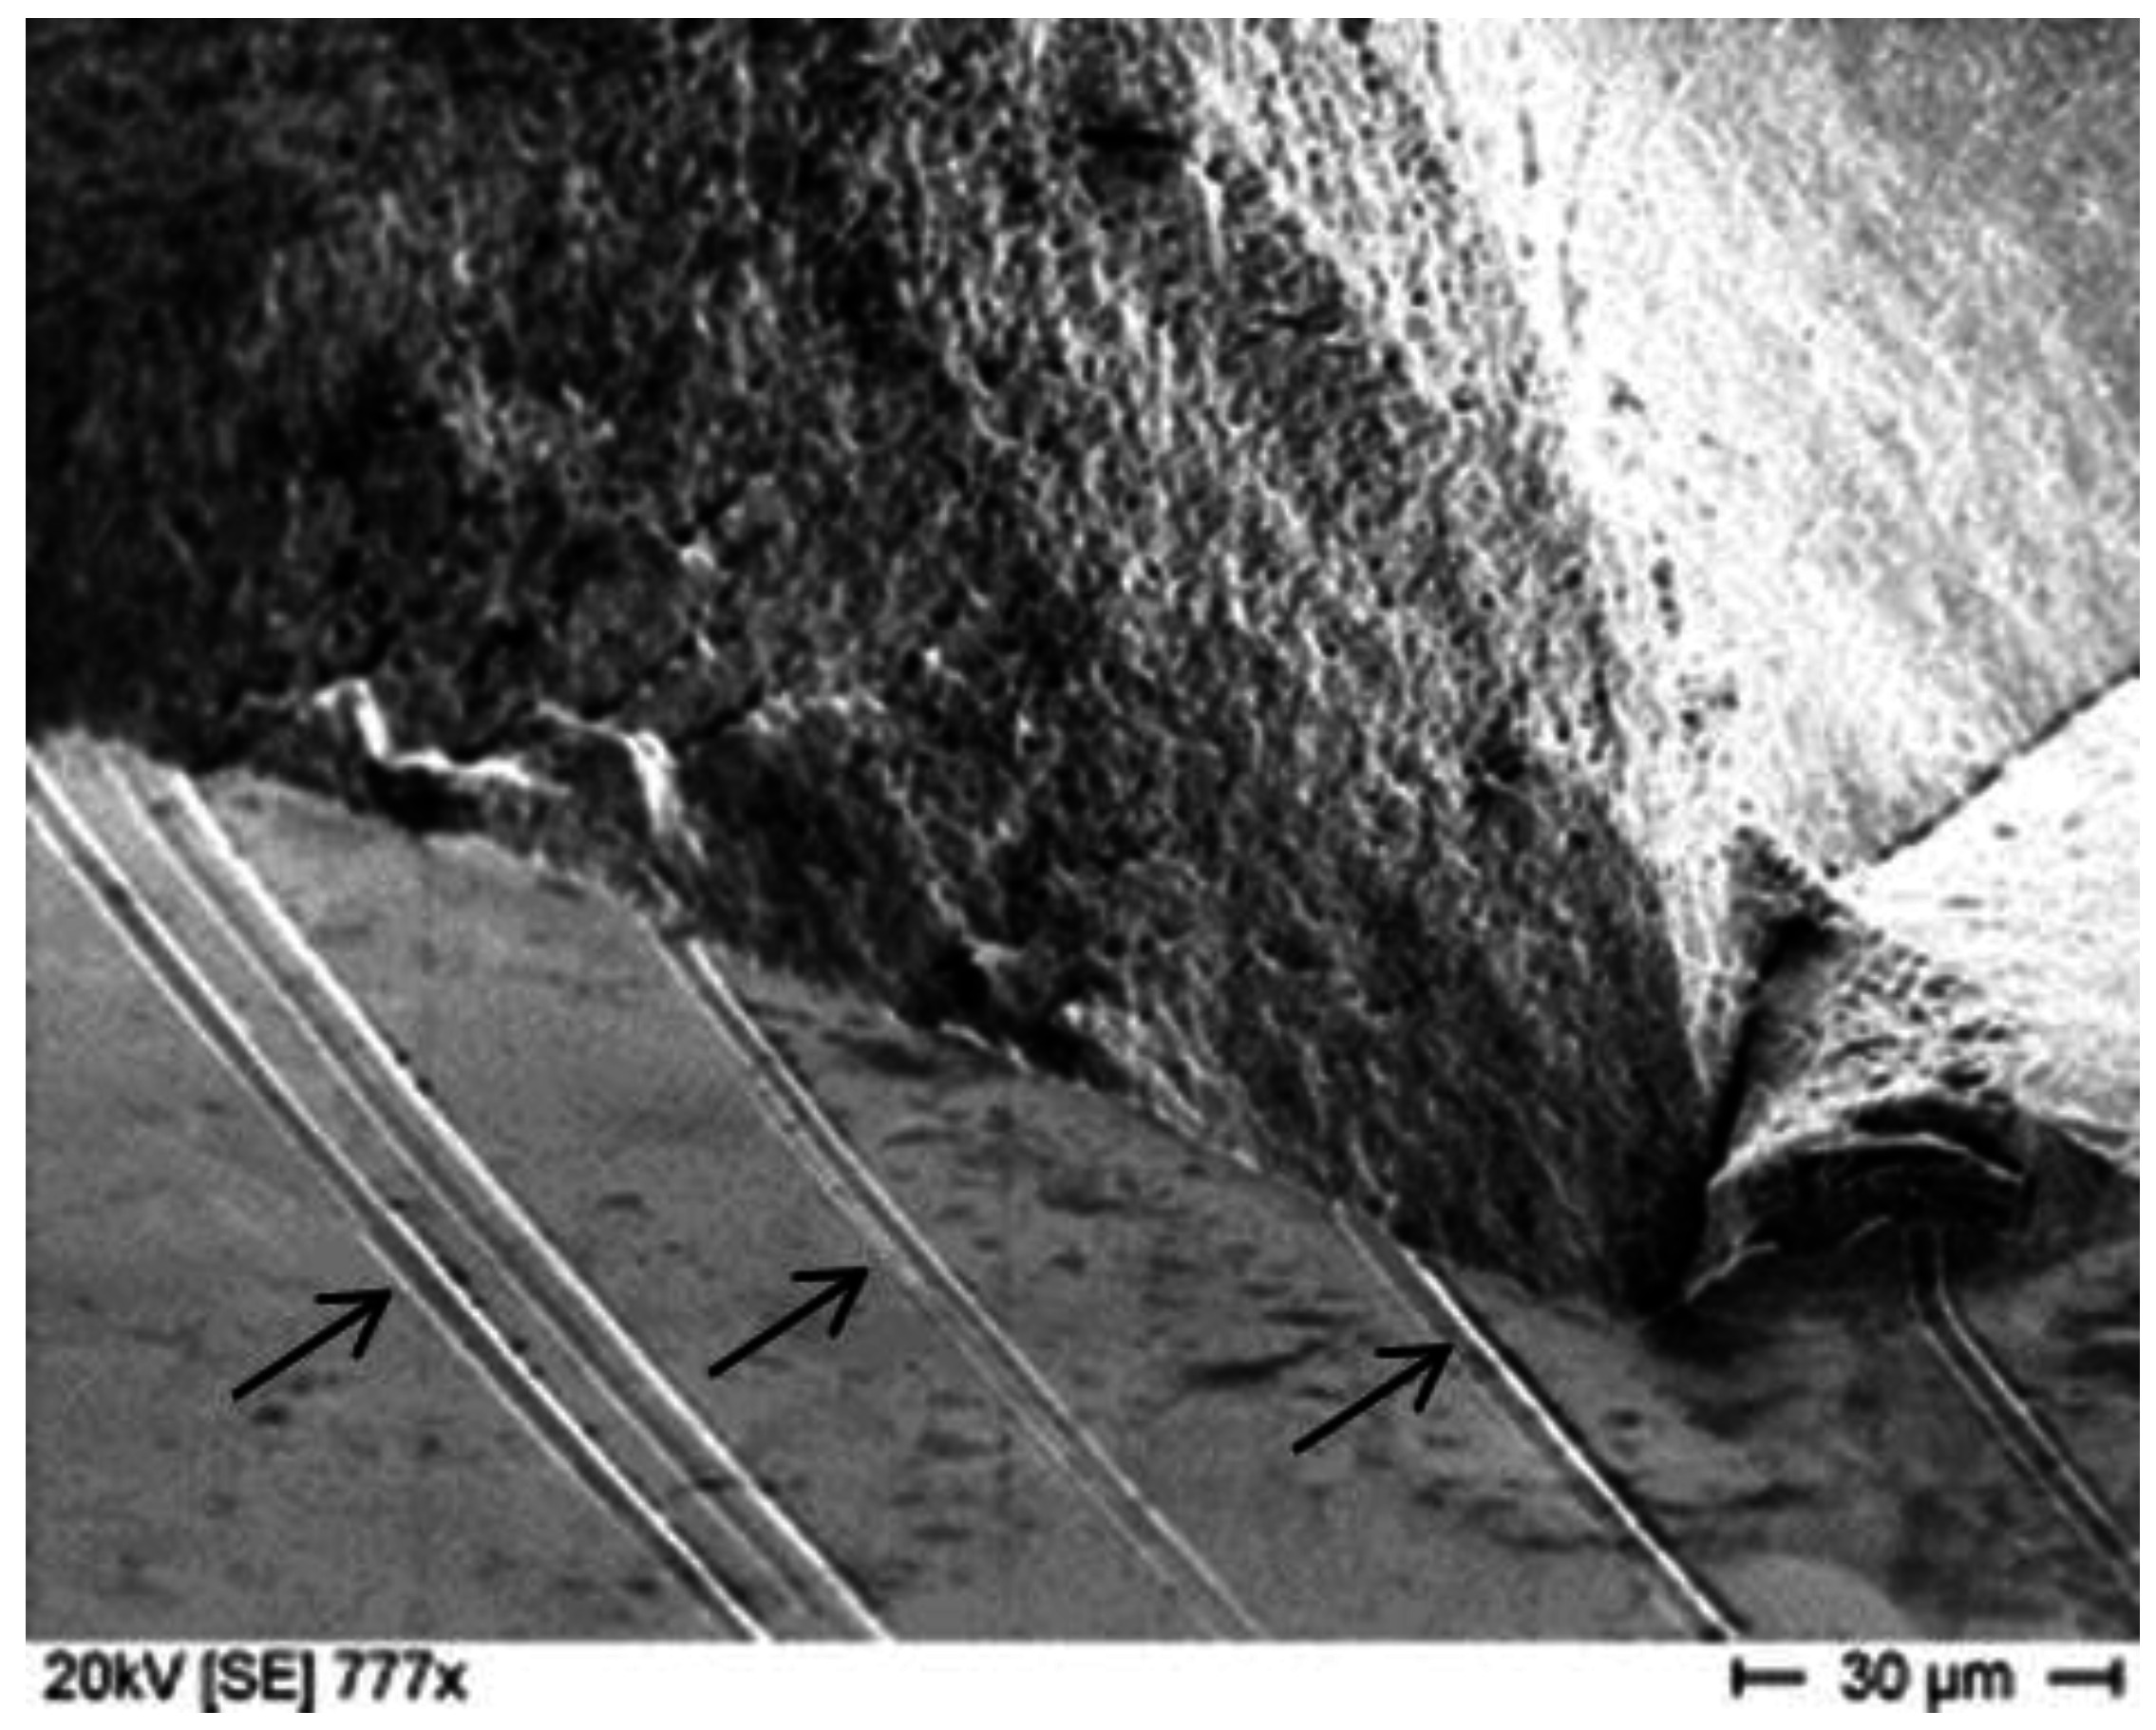
Figure 13 shows cross sections of typical crack initiation sites for the HPT states after ten HPT rotations. BF-TEM and ACOM-TEM images were obtained to correlate the crack path, which is in both cases horizontal in the upper part of the images, with the microstructure underneath. In Figure 13a, a non-metallic inclusion, located on the left side of the shown area, was responsible for crack initiation in the s-HPT-10 state. Grain size and morphology close to the crack do not differ significantly from the pre-fatigue s-HPT-10 state.

Figure 13.
Cross section of the crack initiation (a) non-metallic inclusion for s-HPT-10 and (b) crack path near crack initiation from the surface for t-HPT-10. The overlays are orientation maps in projection direction normal to the paper plane with the reliability in black. The color code of the orientation maps is given in (Figure 3a).
Similarly, no significant grain coarsening or grain refinement has been observed for the t-HPT-10 state in Figure 12b. Nevertheless, in both cases, the crack path is influenced by the microstructure as it (partly) deviates from a straight crack front when crossing grain boundaries.
3.4. Discussion
The present investigation of CG and UFG medium carbon steels shows a correlation between hardness and endurance limit in bending fatigue tests. Four material states with ultrafine grained microstructure (s-HPT-6, s-HPT-10, t-HPT-6, and t-HPT-10), produced from two different initial carbide morphologies (s-ini + t-ini), were investigated. The refinement of the microstructure during HPT was in accordance with hardness measurements. Both s-ini and t-ini samples revealed a finer grain size and higher hardness with increasing shear strain due to torsional deformation. However, for the samples prepared by six rotations of HPT, the increase in hardness or grain refinement is not as high as expected from the applied shear strain. Nevertheless, it cannot be excluded that the anvils might have been partially sliding over the specimen during HPT deformation, which would explain the limited hardness increase between the initial states and the HPT-6 states.
Figure 14 indicates the relationship between hardness and endurance limit in our investigations. It was created on the basis of the endurance limits presented in Figure 6. A linear correlation can be seen for the hardness range up to about 500 HV. The fatigue limit primarily correlates with the hardness which itself is strongly affected by the microstructure such as the carbide and grain morphologies. The initial and HPT-6 states fit this correlation very well. Following the investigation by Murakami [26], there must be a decrease of the fatigue limit with increasing hardness values over about 500 HV. McGreevy analyzed this behavior in [27] considering the competing roles of microstructure and flaw size.
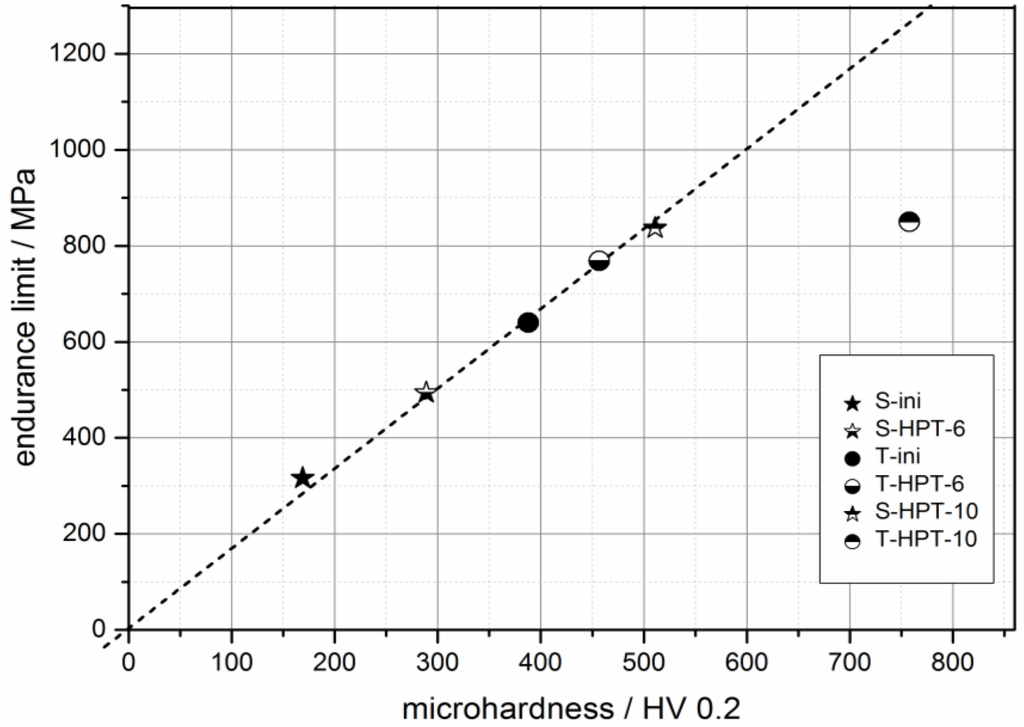
Figure 14.
Relationship between hardness and endurance limit revealing a linear correspondence.
Figure 14.
Relationship between hardness and endurance limit revealing a linear correspondence.

Responsible for a deviation from the linear relationship are inherent material flaws such as non-metallic inclusions, which become more and more dominant at higher hardness. The subsequent decrease of the endurance limit, as suggested in Figure 14, depends on the material state and processing route. In high strength steels, the so-called process flaws resulting from the respective treatment are responsible for such behavior. For conventional steels, it is mostly the heat treatment which leads to process flaws. In our case, the HPT treatment replaces heat treatment for reaching a high strength. Thus, instead of the traditional process, flaws known from the literature, such as micro-cracks or weakened former austenite grain boundaries in carburized steels [28], here we are confronted with shear bands or cracks created during HPT, which act as process flaws. Other possible process flaws could not be clearly identified in the metallographic sections after the fatigue testing. Nevertheless, one result of the present investigation is that, in contrast to a material that only exhibits inherent or intrinsic flaws, here the process flaws in the material state with the highest hardness (t-HPT-10) lower the fatigue limit. The S-N curves already provide evidence for this, as contrary to our expectation, no non-metallic inclusions were responsible for crack initiation in the t-HPT-10 state, but the cracks mostly initiated from the surface. This is untypical for high strength steels and indicates that there must be something inside the microstructure that is more inhomogeneous or detrimental than the non-metallic inclusions.
A more detailed investigation of the fracture surfaces confirms that the s-HPT-state exhibits a very homogenous and typical fracture appearance for high strength steels with flat fatigue fracture surfaces. The dimples that are present on the residual fracture surface indicate a ductile fracture behavior. This is known from ultrafine-grained materials and has been linked to good fatigue properties [29].
Comparing Figure 8 and Figure 11, the fracture surfaces of t-HPT-10 do not appear as uniform as those of s-HPT-10. The main difference is that while the fatigue fracture surface in Figure 8 is not affected by inhomogeneities, Figure 11 reveals a strong topology with fracture planes of different directions covering the whole surface, including the fatigue fracture surface. In both cases shown in Figure 11, the residual fracture surface has shear steps and no dimples indicating a brittle fracture behavior. In this context, Figure 10 provides an opportunity to understand the morphology of the shear bands prior to fatigue testing. Figure 10a shows an FIB cross-section of one of these cavities, which exhibits the typical fracture appearance of the shear bands [25]. There is a narrow plane-shaped inhomogeneity beneath the surface inside the microstructure. This could be a link to shear bands generated during HPT as similar stripes are present throughout the microstructure before fatigue loading, as visible in the optical micrograph in Figure 10c. This observation can be made not only in the brittle tempered state but similarly also in the ductile spheroidizing annealed microstructure with excellent fatigue properties. It follows that s-HPT-10 and t-HPT-10 do contain shear bands prior to fatigue testing but only in the tempered state they affect the fatigue properties. Therefore, the brittle behavior is the main reason for fatigue limits which are lower than expected in consideration of the hardness, because the brittle material has a more limited ability to reduce stress around process flaws owing to plastic flow. In this context, the s-HPT-10 state is an ideal material in respect of fatigue because it exhibits a high hardness and also a high ductility resulting in excellent fatigue performance with higher tolerance against crack initiation at inhomogeneities.
However, an open question is: why do early cracks or cracks at low stress amplitudes occur in some specimens of t-HPT-10? This can be explained comparing Figure 8 and Figure 11, which both show shear bands in the fracture surface. Shear bands represent inhomogeneities, which, in combination with a brittle material, are detrimental to the fatigue performance, as shown in Figure 14. However, when comparing fracture surfaces of late and early failure, it is visible that the specimens with the worst fatigue properties exhibit a rotation of the shear bands, which is not parallel to the nominal HPT-shear planes. Unusually turbulent flows, manifesting themselves in the appearance of whirls observed at the macroscopic [30] and microscopic [31] scale in severely deformed materials, are most likely the reason for this rotation. This effect seems to increase the influence of the shear bands on fatigue failure.
The rotation of the shear bands increases the possibility for cracks to grow along the shear bands. Investigations from Miller [32,33] support this argumentation. He proposed that cracks are always present with every kind of inhomogeneity and the only determining factor for the fatigue resistance is the question whether they reach a critical length that gives them the possibility of further growing. In the case of ultrafine grained high strength steels, grain boundaries, which are the traditional microstructural barrier against crack growth, are not efficient anymore because of the size of the inherent flaws such as non-metallic inclusions. In contrast to the grain size the inclusions do not decrease in size with increasing hardness. The inclusions can be regarded as cracks that are larger than the grain size and cannot be stopped easily by a single grain boundary. Process flaws, such as the identified shear bands, are, depending on their appearance, more detrimental than the non-metallic inclusions. However, important for reaching a critical length is not only the absolute length of a shear band. Crucial is also their direction in relation to the maximum applied stress direction [26,27]. With this argument it becomes clear that the rotated shear bands are more critical than those in the HPT planes. The flat fatigue crack path along the shear planes also indicates a higher fatigue crack growth rate, which lowers the lifetime of the samples, as shown in the S-N diagrams in Figure 6. This observation is known from the literature as well as the fact that the threshold for long crack propagation is lower for favorably oriented shear bands [34]. Evidence for this explanation and for the crack initiation being affected by the shear bands and their orientation is presented in Figure 12, where the shear bands are visible on the fracture surface and also at the lower side of the specimen with the highest fatigue stresses. This characteristic appearance has already been reported in literature [35] and seems to be beneficial for crack initiation.
4. Conclusions
The present investigation offers an analysis of the fatigue behavior of medium carbon steel SAE 1045 with different initial carbide morphologies (spheriodized and tempered state) processed by HPT. High hardness values of up to 758 HV and a homogenous ultrafine grained microstructure were observed. Microstructure investigations and the results of bending fatigue tests led to the following conclusions:
- The microstructure was refined during HPT. The ferrite grain refinement during HPT is more pronounced for the state with fine dispersed carbides obtained by tempering as compared to the state with spheroidal carbides. Six and ten rotations were used for HPT processing for each of the heat treatment conditions. Only after ten rotations the microstructure was fine enough to reach highest strength and hardness.
- Up until circa 500 HV or approximately 830 MPa the endurance limits correlate linearly with the hardness. The carbide morphology does not affect the linear behavior of the fatigue limit directly in this hardness region. In addition, no process flaws or other inherent flaws significantly influenced the fatigue behavior except for the hardness. The reason is the high ductility of the spheroidizing annealed microstructure, which is tolerant towards stress concentration at shear bands.
- Above approximately 500 HV, the fatigue limit no longer correlates linearly with the hardness. Process flaws are the main reason for this behavior. The process flaws observed in the present investigation are shear bands caused by the HPT treatment. Evidence was found that shear bands were responsible for crack initiation at low fatigue loads and high crack propagation rates. This is particularly noticeable when the shear bands are rotated out of the plane of the fatigue specimen.
Acknowledgments
The authors would like to thank the German Research Foundation (DFG) for the financial support of this work under grant IV 98/4-1 and KE 1426/3-1. We acknowledge support by Open Access Publishing Fund of Karlsruhe Institute of Technology.
Author Contributions
Y.I. processed samples using HPT. C.R. conducted fatigue tests and performed the metallographic and fractographic observations. A.K. and E.C.-M. conducted characterization of the microstructure by TEM. R.P. prepared the TEM samples using FIB. C.R. performed analysis of the data. E.K., Y.I. and C.K. supervised the work. C.R. and E.K. wrote the initial manuscript with input from all authors. All authors contributed to discussion of the results, provided input on the manuscript, and approved the final version.
References
- Song, R.; Ponge, D.; Raabe, D.; Speer, J.G.; Matlock, D.K. Overview of processing, microstructure and mechanical properties of ultrafine grained bcc steels. Mater. Sci. Eng. A 2006, 441, 1–17. [Google Scholar]
- Shen, H.; Li, Z.; Gunther, B.; Korznikov, A.V.; Valiev, R.Z. Influence of powder consolidation methods on the structural and thermal properties of a nanophase Cu-50wt%Ag alloy. Nanostructured Mater. 1995, 6, 385–388. [Google Scholar]
- Valiev, R.Z.; Langdon, T.G. Principles of equal-channel angular pressing as a processing tool for grain refinement. Prog. Mater. Sci. 2006, 51, 881–981. [Google Scholar]
- Zhilyaev, A.P.; Langdon, T.G. Using high-pressure torsion for metal processing: Fundamentals and applications. Prog. Mater. Sci. 2008, 53, 893–979. [Google Scholar]
- Tsuji, N. Fabrication of bulk nanostructured materials by Accumulative Roll Bonding (ARB). In Bulk Nanostructured Materials; Zehetbauer, M.J., Zhu, Y.T., Eds.; Wiley-VCH: Weinheim, Germany, 2009. [Google Scholar]
- Valiev, R.Z.; Islamgaliev, R.K.; Alexandrov, I.V. Bulk nanostructured materials from severe plastic deformation. Prog. Mater. Sci. 2000, 45, 103–189. [Google Scholar]
- Pouryazdan, M.; Schwen, D.; Wang, D.; Scherer, T.; Hahn, H.; Averback, R.S.; Bellon, P. Forced chemical mixing of immiscible Ag-Cu heterointerfaces using high-pressure torsion. Phys. Rev. B 2012, 86, 144302. [Google Scholar]
- Korznikov, A.V.; Dimitrov, O.; Korznikova, G.F.; Dallas, J.P.; Quivy, A.; Valiev, R.Z.; Mukherjee, A. Nanocrystalline structure and phase transformation of the intermetallic compound TiAl processed by severe plastic deformation. Nanostructured Mater. 1999, 11, 17–23. [Google Scholar]
- Pavlov, V.A. Structural amorphization of metals and alloys with an extremely high plastic deformation ratio. Phys. Metals Metallogr. 1985, 59, 629–649. [Google Scholar]
- Valiev, R. Nanostructuring of metals by severe plastic deformation for advanced properties. Nat. Mater. 2004, 3, 511–516. [Google Scholar]
- Valiev, R.Z.; Murashkin, M.Y.; Kilmametov, A.; Straumal, B.; Chinh, N.Q.; Langdon, T.G. Unusual super-ductility at room temperature in an ultrafine-grained aluminum alloy. J. Mater. Sci. 2010, 45, 4718–4724. [Google Scholar]
- Vinogradov, A.; Patlan, V.; Suzuki, Y.; Kitagawa, K.; Kopylov, V.I. Structure and properties of ultra-fine grain Cu–Cr–Zr alloy produced by equal-channel angular pressing. Acta Mater. 2002, 50, 1639–1651. [Google Scholar]
- Vinogradov, A.; Hashimoto, S. Multiscale Phenomena in Fatigue of Ultra-Fine Grain Materials—An Overview. Mater. Trans. 2001, 42, 74–84. [Google Scholar]
- Chapetti, M.D.; Miyata, H.; Tagawa, T.; Miyata, T.; Fujioka, M. Fatigue strength of ultra-fine grained steels. Mater. Sci. Eng. A 2004, 381, 331–336. [Google Scholar]
- Sawai, T.; Matsuoka, S.; Tsuzaki, K. Low- and High-cycle Fatigue Properties of Ultrafine-grained Low Carbon Steels. Tetsu-to-Hagane 2003, 89, 726–733. [Google Scholar]
- Niendorf, T.; Canadinc, D.; Maier, H.J.; Karaman, I.; Sutter, S.G. On the fatigue behavior of ultrafine-grained interstitial-free steel. Int. J. Mat. Res. 2006, 97, 1328–1336. [Google Scholar]
- Okayasu, M.; Sato, K.; Mizuno, M.; Hwang, D.Y.; Shin, D.H. Fatigue properties of ultra-fine grained dual phase ferrite/martensite low carbon steel. Int. J. Fatigue 2008, 30, 1358–1365. [Google Scholar]
- Niendorf, T.; Böhner, A.; Höppel, H.W.; Göken, M.; Valiev, R.Z.; Maier, H.J. Comparison of the monotonic and cyclic mechanical properties of ultrafine-grained low carbon steels processed by continuous and conventional equal channel angular pressing. Mater. Des. 2013, 47, 138–142. [Google Scholar]
- Ning, J.-L.; Courtois-Manara, E.; Kurmanaeva, L.; Ganeev, A.V.; Valiev, R.Z.; Kübel, C.; Ivanisenko, Y. Tensile properties and work hardening behaviors of ultrafine grained carbon steel and pure iron processed by warm high pressure torsion. Mater. Sci. Eng. A 2013, 581, 8–15. [Google Scholar]
- Hück, M. Ein verbessertes Verfahren für die Auswertung von Treppenstufenversuchen. Z. Werkstofftech. 1983, 14, 406–417. [Google Scholar]
- Rauch, E.F.; Portillo, J.; Nicolopoulos, S.; Bultreys, D.; Rouvimov, S.; Moeck, P. Automated nanocrystal orientation and phase mapping in the transmission electron microscope on the basis of precession electron diffraction. Zeitschrift für Kristallographie 2010, 225, 103–109. [Google Scholar]
- Bachmann, F.; Hielscher, R.; Schaeben, H. Grain detection from 2d and 3d EBSD data—Specification of the MTEX algorithm. Ultramicroscopy 2011, 111, 1720–1733. [Google Scholar]
- Kobler, A.; Kashiwar, A.; Hahn, H.; Kübel, C. Combination of in situ straining and ACOM TEM: A novel method for analysis of plastic deformation of nanocrystalline metals. Ultramicroscopy 2013, 128, 68–81. [Google Scholar]
- Kobler, A. Untersuchung von Deformationsmechanismen in nanostrukturierten Metallen und Legierungen mit Transmissionselektronenmikroskopie. Ph.D. Thesis, Technical University Darmstadt, TUPrints, Darmstadt, Germany, 2015. [Google Scholar]
- Ivanisenko, Y.; Kurmanaeva, L.; Weissmueller, J.; Yang, K.; Markmann, J.; Rösner, H.; Scherer, T.; Fecht, H.-J. Deformation mechanisms in nanocrystalline palladium at large strains. Acta Mater. 2009, 57, 3391–3401. [Google Scholar]
- Murakami, Y.; Kodama, S.; Konuma, S. Quantitative evaluation of effects of non-metallic inclusions on fatigue strength of high strength steels. Int. J. Fatigue 1989, 11, 291–298. [Google Scholar]
- McGreevy, T.E.; Socie, D.F. Competing roles of microstructure and flaw size. Fatigue Fract. Engng. Mater. Struct. 1999, 22, 495–508. [Google Scholar]
- Apple, C.A.; Krauss, G. Microcracking and Fatigue in a Carburized Steel. Metall. Trans. 1973, 4, 1195–1200. [Google Scholar]
- Suresh, S. Fatigue of Materials; Cambridge Solid State Science Series; Cambridge University Press: Cambridge, UK, 1998. [Google Scholar]
- Cao, Y.; Kawasaki, M.; Wang, Y.B.; Alhajeri, S.N.; Liao, X.Z.; Zheng, W.L.; Ringer, S.P.; Zhu, Y.T.; Langdon, T.G. Unusual macroscopic shearing patterns observed in metals processed by high-pressure torsion. J. Mater. Sci. 2010, 45, 4545–4553. [Google Scholar]
- Ivanisenko, Y.; Lojkowski, W.; Valiev, R.Z.; Fecht, H.-J. The mechanism of formation of nanostructure and dissolution of cementite in a pearlitic steel during high pressure torsion. Acta Mater. 2003, 51, 5555–5570. [Google Scholar]
- Miller, K.J. Materials science perspective of metal fatigue resistance. Anales de Mecanica de la Fractura 1995, 12, 1–10. [Google Scholar]
- Miller, K.J. The two thresholds of fatigue behaviour. Fatigue Fract. Engng. Mater. Struct. 1993, 16, 931–939. [Google Scholar]
- Hockauf, K.; Hockauf, M.; Wagner, M.F.-X.; Lampke, T.; Halle, T. Fatigue crack propagation in an ECAP-processed aluminium alloy—Influence of shear plane orientation. Materialwissenschaft und Werkstofftechnik 2012, 43, 609–616. [Google Scholar]
- Hamada, A.S. Deformation and Damage Mechanisms in Ultrafine-Grained Austenitic Stainless Steel During Cyclic Straining. Metall. Mater. Trans. A 2013, 44, 1626–1630. [Google Scholar] [CrossRef]
© 2015 by the authors; licensee MDPI, Basel, Switzerland. This article is an open access article distributed under the terms and conditions of the Creative Commons Attribution license (http://creativecommons.org/licenses/by/4.0/).