3.1. Microstructure of ESD W-MoS2 Coatings
As shown in
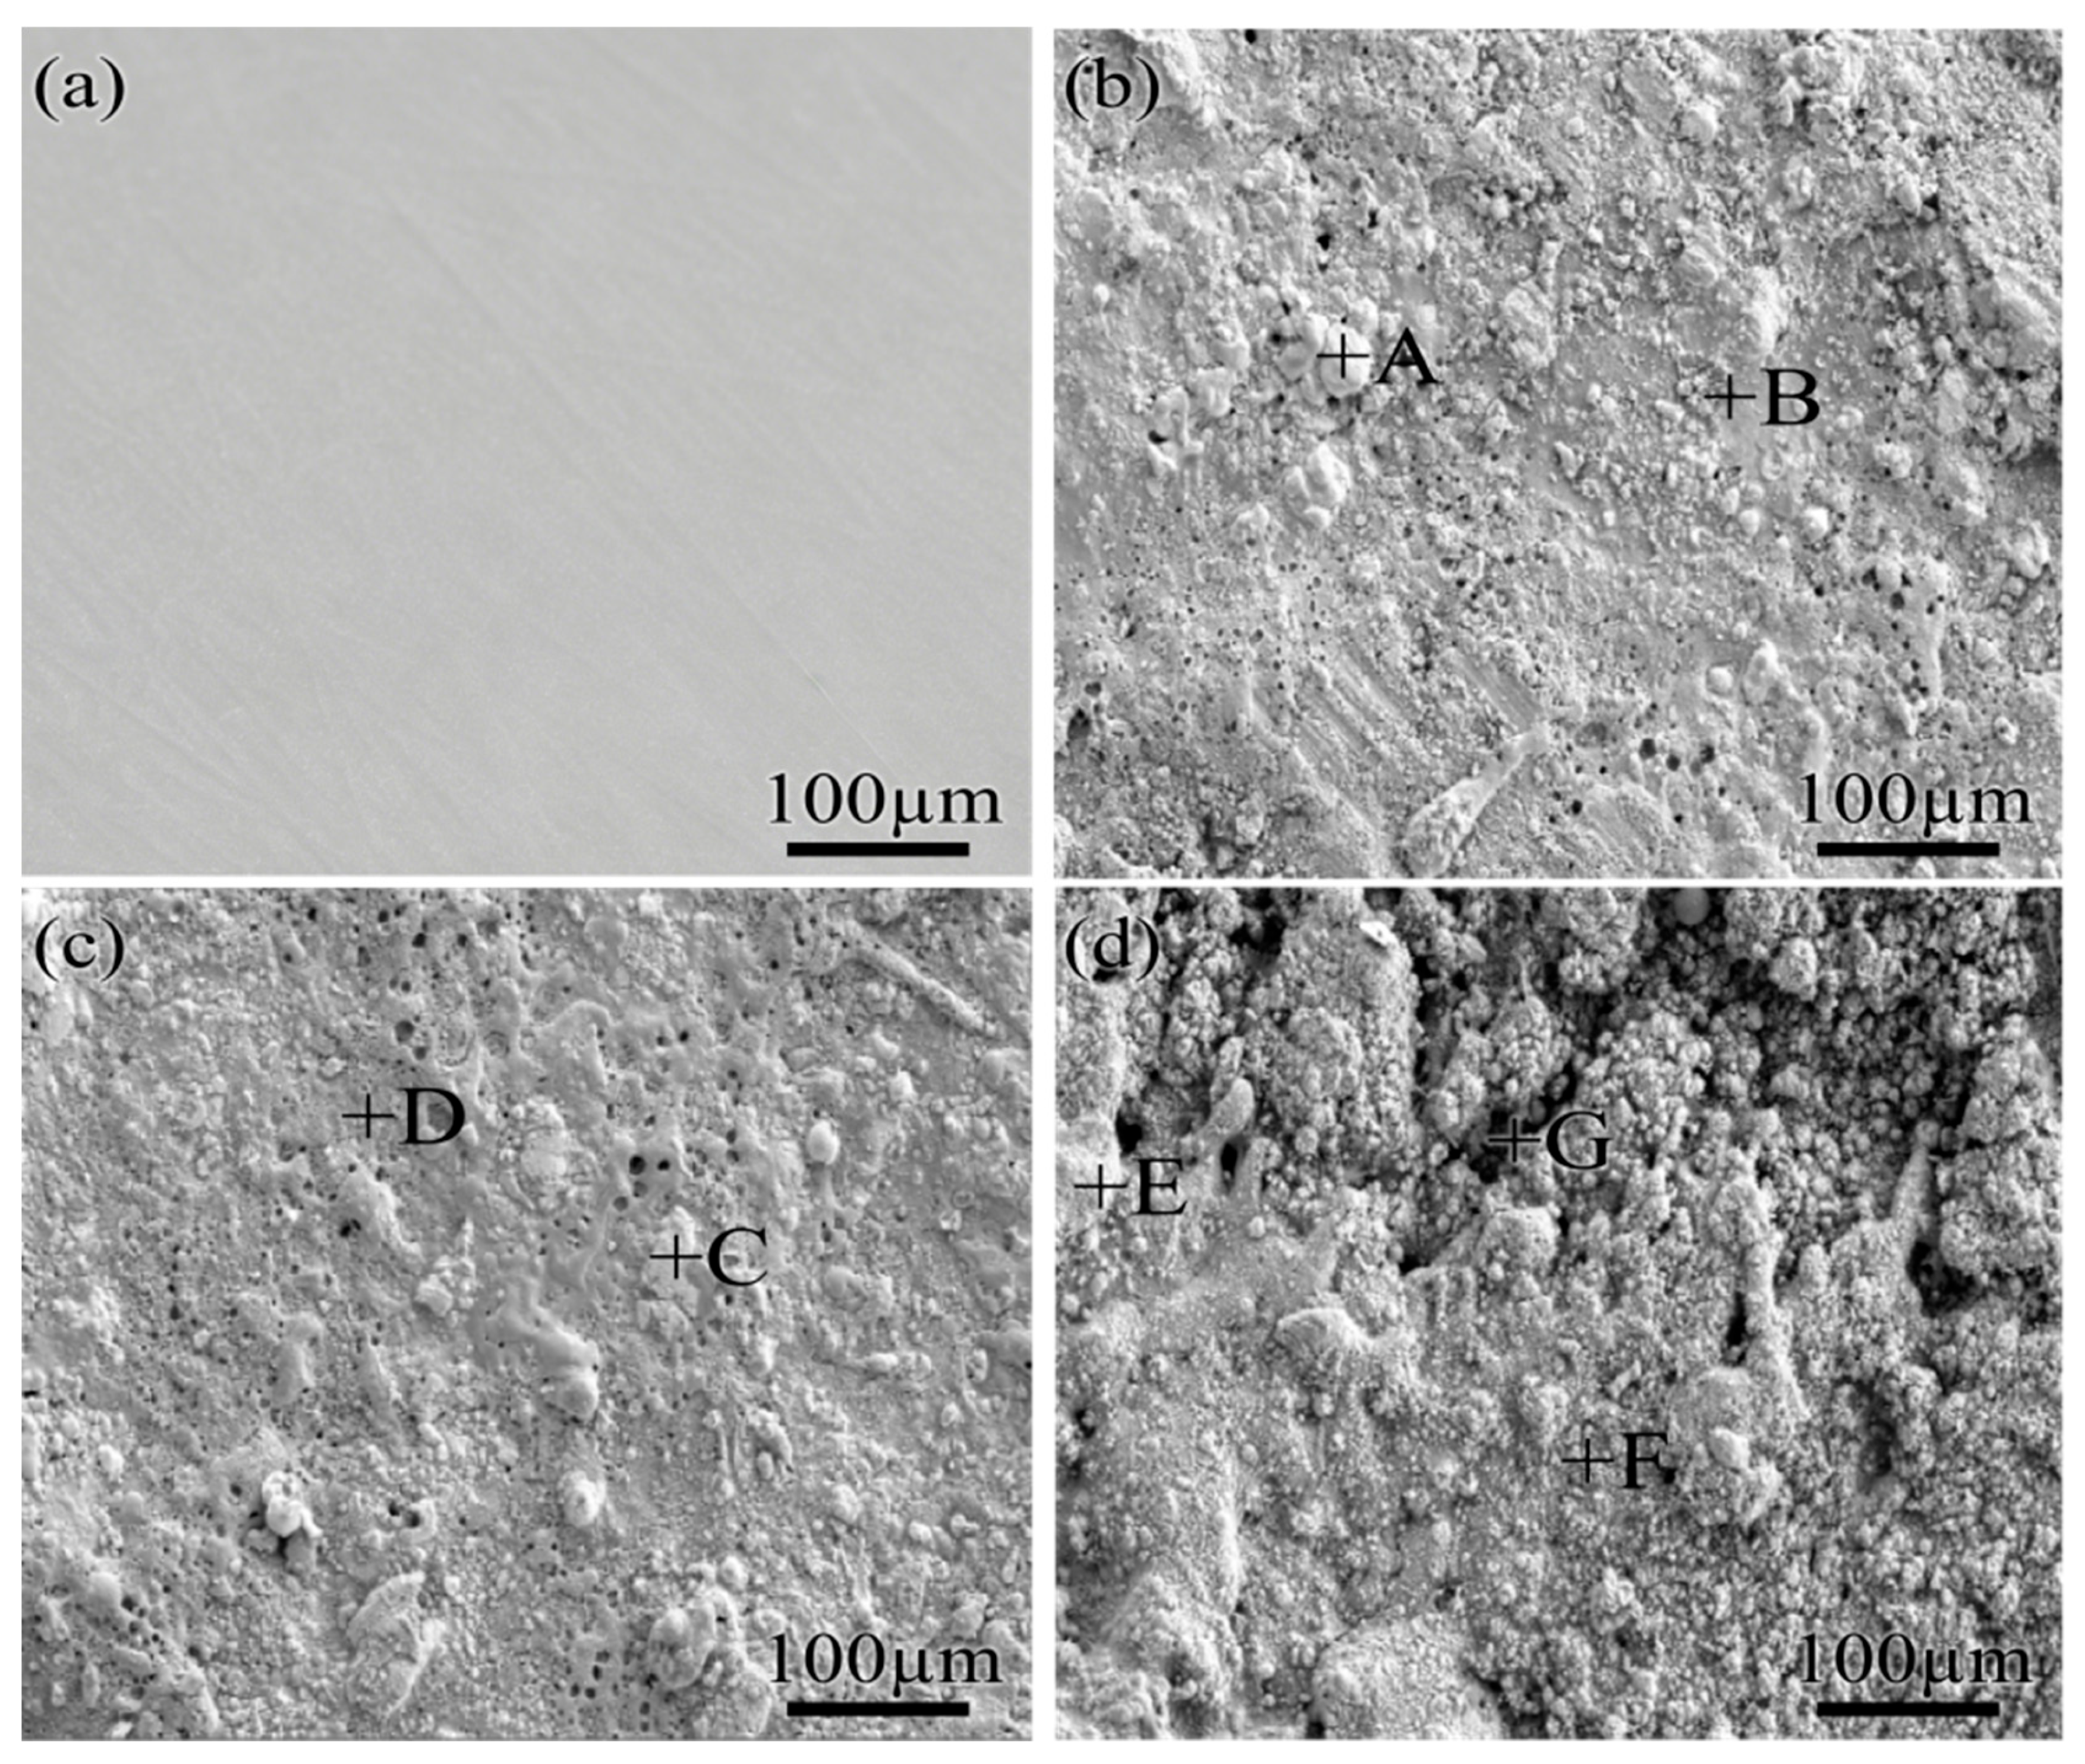
Figure 1a, the surface of the CrNi3MoVA steel substrate was smooth and flat, with localized grinding and polishing scratches. The SEM analysis of the three W-MoS
2 coatings revealed a characteristic micro-roughness morphology typical of ESD, featuring localized micron-scale pores and a pronounced light–dark contrast, as illustrated in
Figure 1b–d. In comparison, the 10WMoS
2 coating exhibited high-density agglomerated protrusions, while the 30WMoS
2 coating displayed deep pores and grooves. Conversely, the surface of the 20WMoS
2 coating was notably smoother and flatter.
The quantitative roughness results in
Table 3 corroborate the SEM observations. The 20WMoS
2 coating exhibited lower Ra, Rq, and Rz values than the 10WMoS
2 and 30WMoS
2 coatings, consistent with its smoother and denser surface. By contrast, the greater roughness of the 10WMoS
2 and 30WMoS
2 coatings was associated with agglomerated protrusions, pores, grooves, and cracks, which increase the effective electrolyte-contact area and favor localized corrosion.
The EDS results in
Table 4 show that increasing the initial MoS
2 content increased the S and Mo contents of the coatings while decreasing the W content, in agreement with the nominal electrode compositions. The bright regions (A, C, and E) contained substantially more W than the corresponding dark regions (B, D, and F). Fe was also detected in the coatings, indicating substrate-to-coating transfer or intermixing during the ESD process. The compositional contrast between the bright and dark regions confirms that the rapidly solidified coatings were microscopically heterogeneous.
Compared with the other coatings, the 30WMoS2 coating showed less pronounced W enrichment on the surface and a smaller compositional difference between the bright and dark regions. EDS analysis of the deep concavity (G) also detected W, Mo, and S, confirming that this feature remained part of the deposited coating rather than an exposed substrate area.
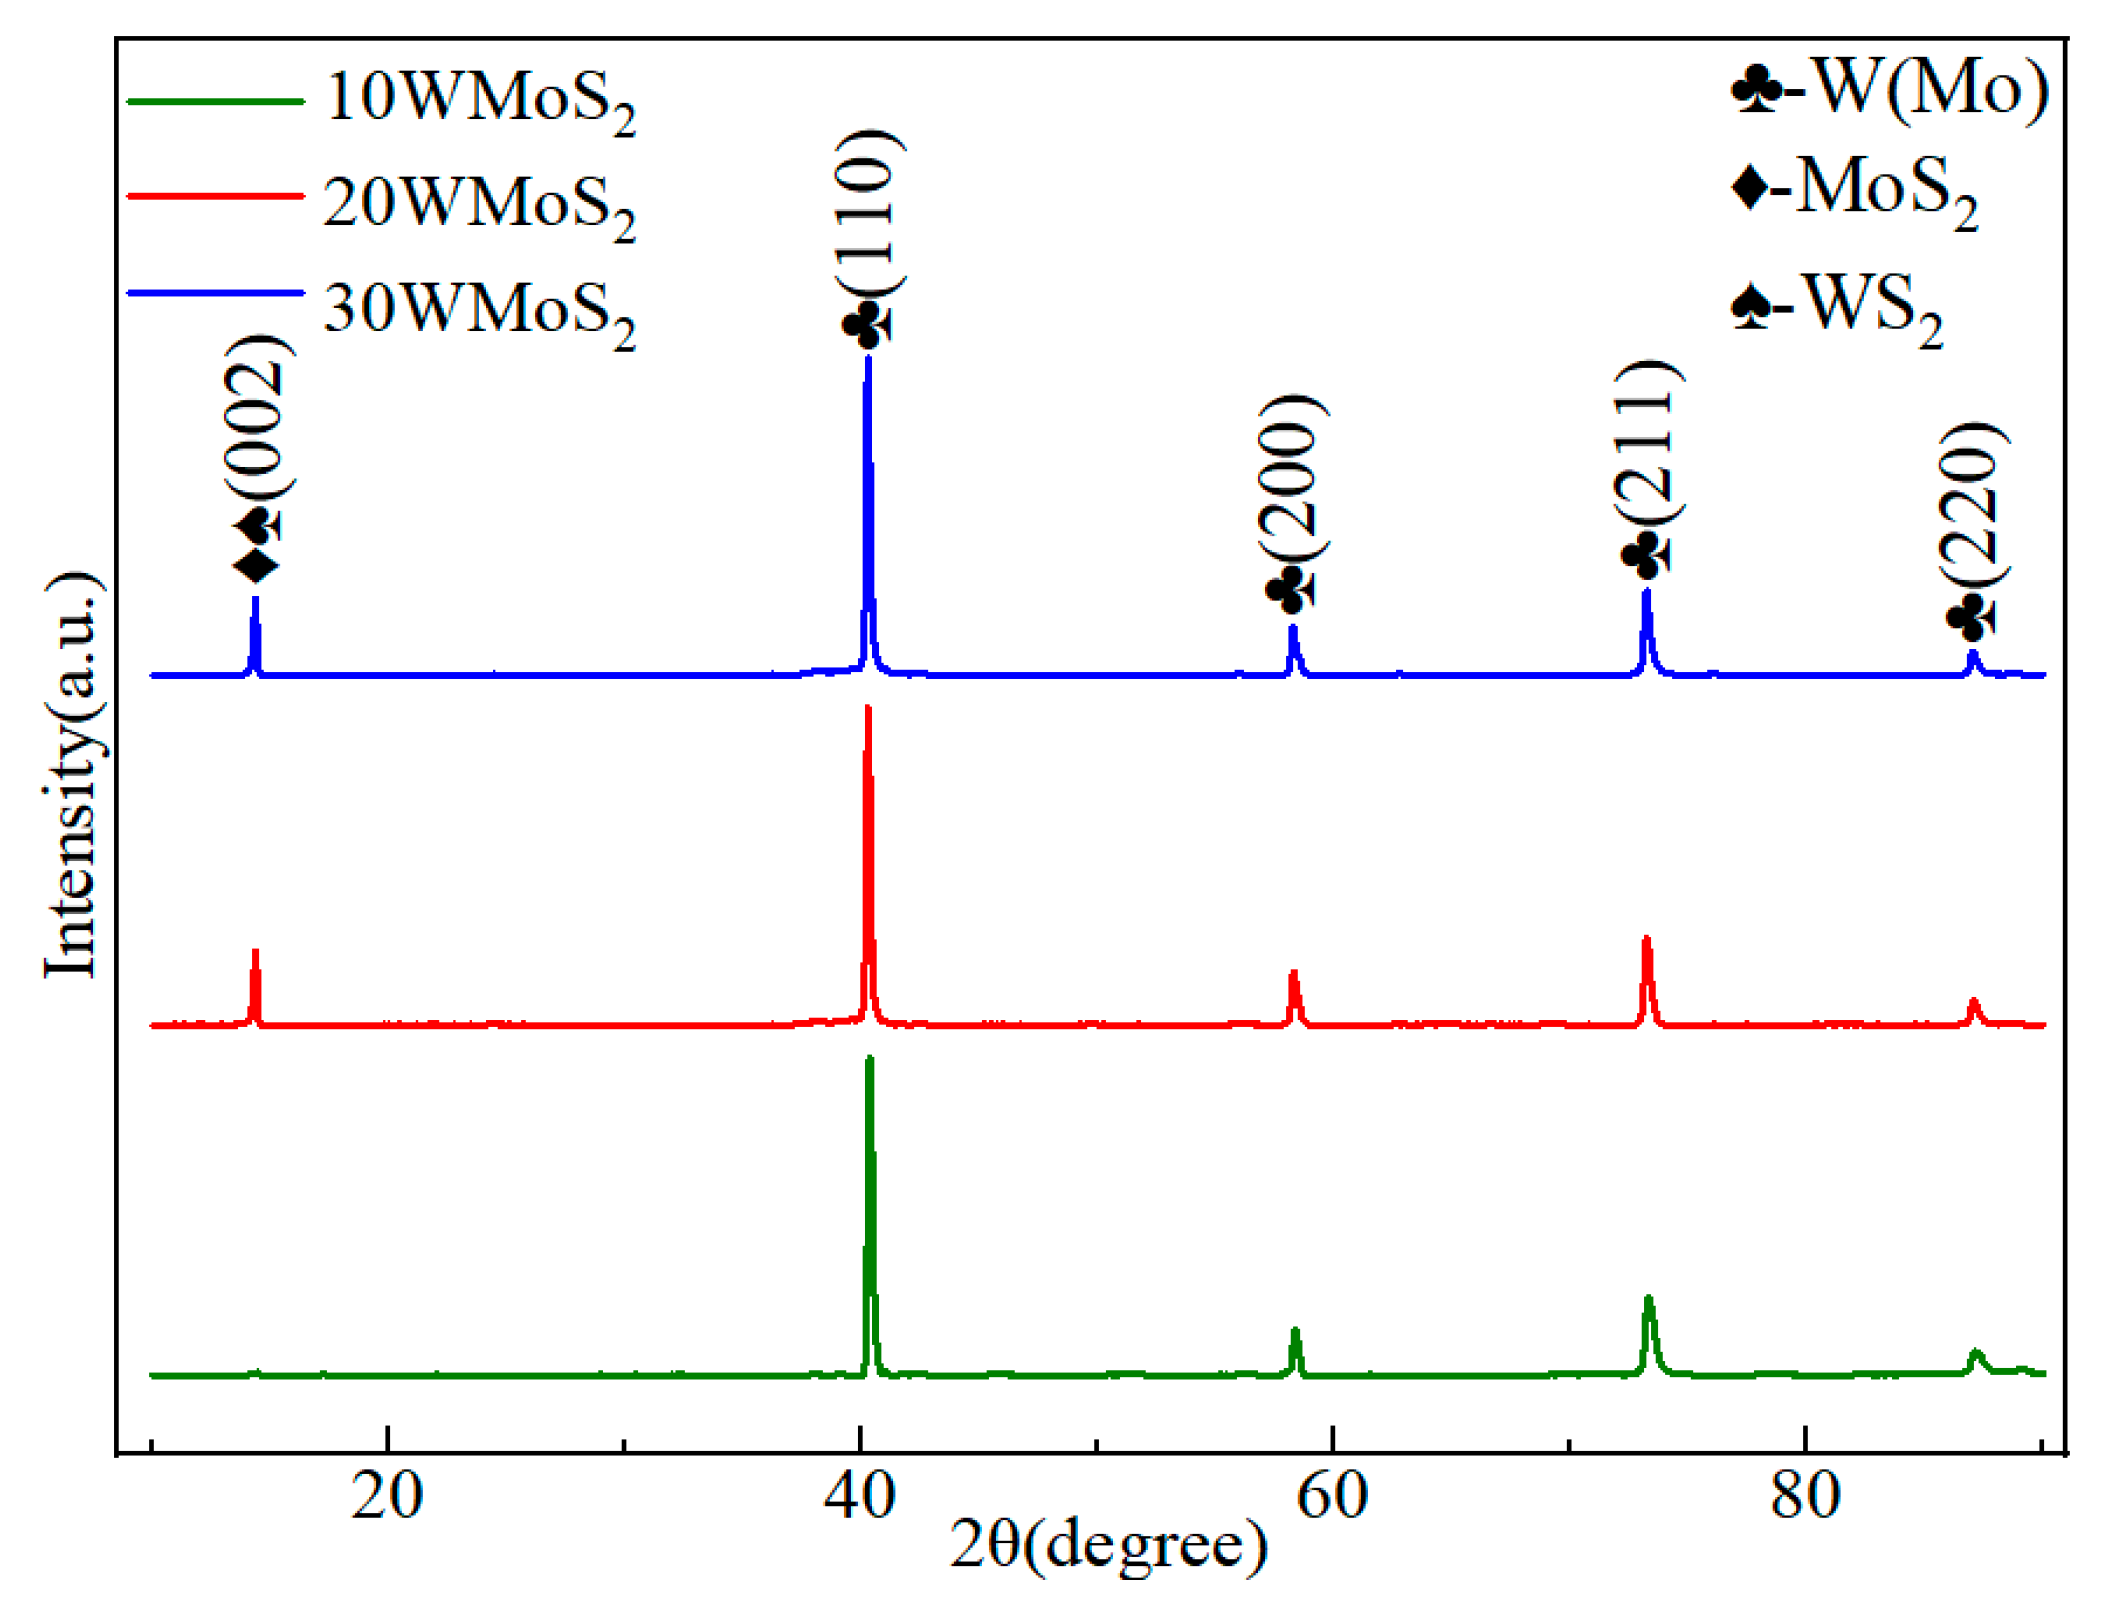
The XRD analysis results depicted in
Figure 2 revealed that the phase compositions of the W-MoS
2 coatings primarily consisted of W, Mo, MoS
2, and WS
2. The diffraction peaks corresponding to W/Mo and MoS
2/WS
2 exhibited partial overlap, and the intensities near the MoS
2/WS
2 basal reflections increased with increasing initial MoS
2 content, indicating a (002) preferred orientation. Because these peaks overlap, the phase constitution and lattice relationships cannot be assigned unambiguously from conventional XRD alone.
During the transient high-temperature cycling of the ESD process, partial decomposition of MoS
2 may occur, and the generated Mo may diffuse into W-rich regions because W and Mo have similar physicochemical characteristics [
23,
25]. This process may lead to W(Mo)-rich metallic regions or a possible W(Mo) solid-solution tendency. Meanwhile, W may act as a heterogeneous nucleation site and promote preferential orientation of MoS
2/WS
2 along the low-surface-energy (002) plane.
Because the diffraction peaks of W/Mo and MoS2/WS2 partially overlap, the exact amount of W-Mo solid solution cannot be determined solely from conventional XRD. Accordingly, the coatings are described as composite structures containing W(Mo)-rich metallic regions and MoS2/WS2 lubricating phases, rather than as fully confirmed single W(Mo) solid-solution coatings. More definitive confirmation of lattice relationships and nanoscale phase distribution would require TEM, peak deconvolution, or grazing-incidence XRD, which will be considered in future work.
The decomposition product S can further react with W to generate WS2 in situ, while residual MoS2 and formed WS2 together contribute to the soft lubricating phase. Based on the combined EDS and XRD results, the white bright regions can be cautiously assigned mainly to W(Mo)-rich metallic regions with a small amount of dispersed lubricating phases, whereas the gray dark regions likely contain a more mixed distribution of W(Mo)-rich regions, MoS2, and WS2 phases.
This phase constitution differs from previously reported electrospark-alloyed Mo-MoS
2 coatings, in which MoS
2 was detected together with Fe-based solid solutions and the discussion mainly focused on structure and tribological properties [
17]. In the present W-MoS
2 system, the coexistence of W(Mo)-rich metallic regions, residual MoS
2, and in situ-formed WS
2 indicates that the corrosion response is regulated jointly by the W/MoS
2 ratio and the distribution of ESD-induced defects.
The (002) preferred orientation can reduce the number of dangling and unsaturated bonds exposed on the basal planes of MoS
2 and WS
2, which is beneficial for reducing the adsorption of O
2 and H
2O. In addition, WS
2 generally exhibits better oxidation resistance than MoS
2, further improving the stability of the coating in humid environments. Therefore, the W-MoS
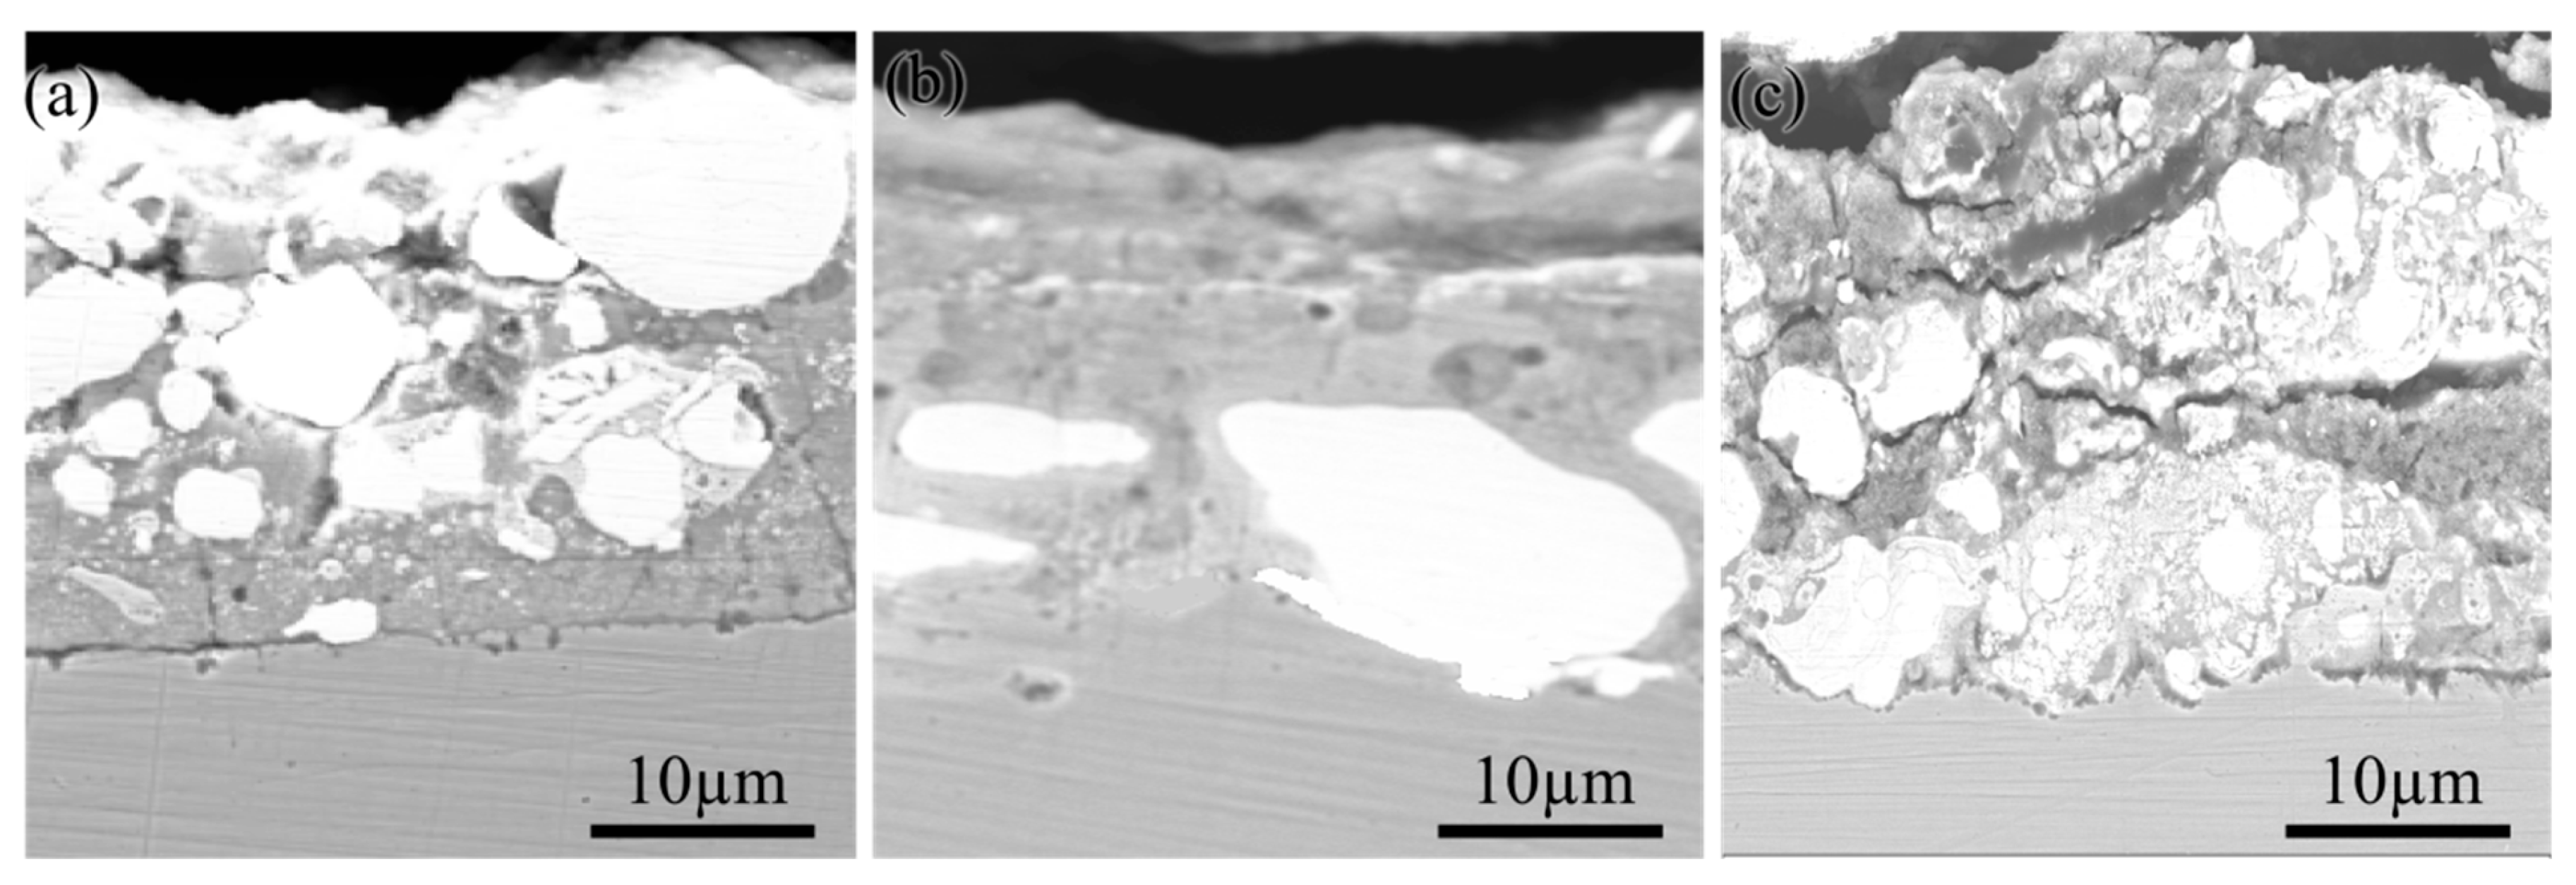
2 coating formed by ESD is expected to be conducive to improved short-term corrosion resistance. The cross-sectional morphologies (
Figure 3a–c) show that the coating thicknesses are similar, approximately 30 µm, while the internal bright/dark phase distribution differs markedly with the W/MoS
2 ratio.
From the cross-sectional morphology, no catastrophic interfacial delamination was observed for the 20WMoS2 coating in the examined area, which qualitatively supports interfacial continuity. However, this observation cannot replace quantitative adhesion testing, such as scratch or pull-off tests, and adhesion performance should be evaluated in future work.
The gray phases in the 10WMoS2 coating are sparse and concentrated near the substrate. Consequently, the XRD detection results revealed extremely weak diffraction peak intensities for both MoS2 and WS2. The majority of the remaining areas are covered by white phases. During the preparation of the coating, an excessive amount of hard metal W and an insufficient proportion of soft lubricant MoS2 led to a thermodynamic mismatch between the white W(Mo)-rich metallic region and the gray regions with a high content of lubricant phases, resulting in localized porosity defects. Simultaneously, noticeable microcracks formed within the coating and at the interface between the coating and the substrate.
The upper half of the 20WMoS2 coating primarily consisted of a gray phase, accompanied by a small quantity of tiny W(Mo)-rich metallic regions. The lower half, near the substrate, was mainly composed of continuously distributed W(Mo)-rich metallic regions, with a small amount of gray phases interspersed. Moreover, the W(Mo)-rich metallic regions adjacent to the substrate were predominantly metallic phases and exhibited a gradient distribution structure, effectively reducing differences in mechanical properties.
In the cross-section of the 30WMoS2 coating, the W(Mo)-rich metallic regions displayed a relatively uniform distribution. However, an excessive content ratio of MoS2 triggered agglomeration phenomena, leading to the formation of wide cracks at the junction of the gray and white regions. Notably, substantial microcracks were also observed at the interface between the coating and the substrate.
3.3. EIS Testing
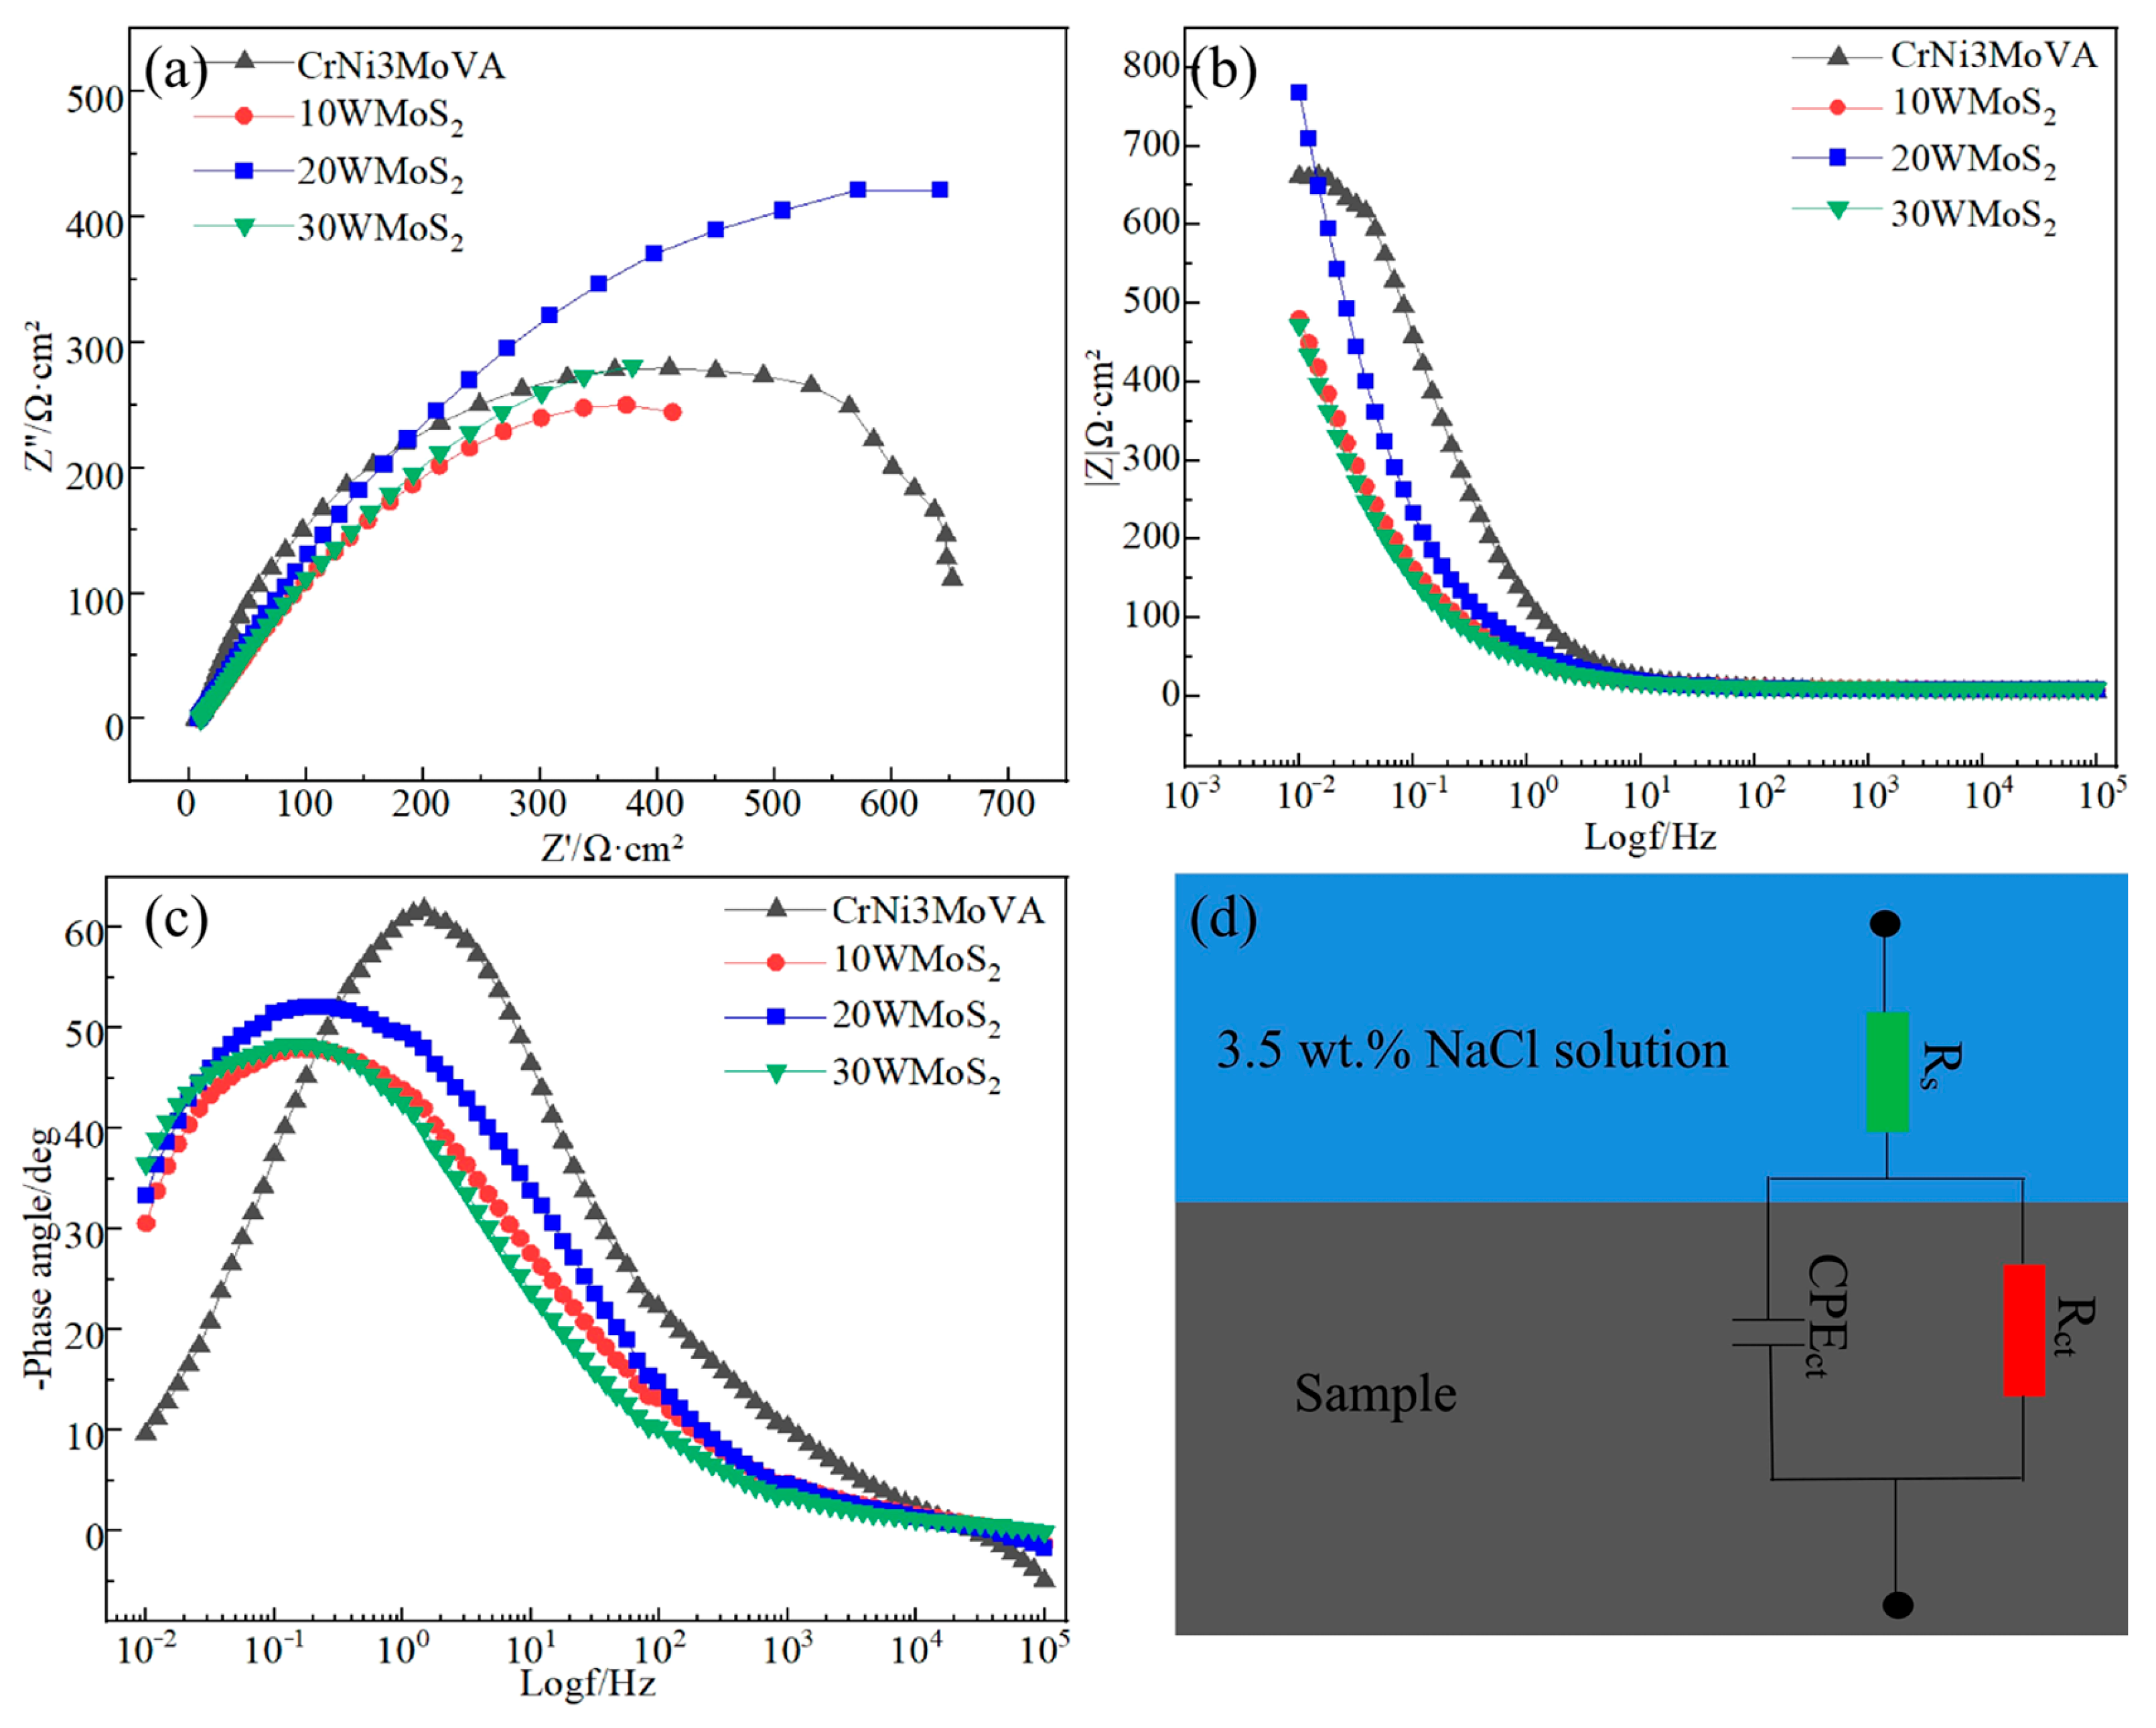
EIS can provide information regarding the electrochemical corrosion process of samples. The test results are presented in
Figure 5. The single phase-angle peak (
Figure 5c) indicates that one electrochemical process dominated the EIS response within the measured frequency range. However, compared to the substrate, the coatings exhibited a lower peak phase angle and a broader peak shape, suggesting reduced surface uniformity. Meanwhile, the phase angle of the coatings increased significantly at 10
−2 Hz, demonstrating the presence of a notable phase lag phenomenon. This characteristic implies that the coatings had a longer relaxation time during corrosion compared to the substrate. These findings confirm that the W-MoS
2 coatings can effectively delay the kinetics of interfacial corrosion reactions through their high-resistance physical barrier properties, thereby reducing the corrosion current density and corrosion rate.
The Nyquist plot in
Figure 5a demonstrates that both the substrate and the coatings exhibit the characteristic of a single capacitive arc, reflecting the parallel nature between double-layer capacitance and charge transfer resistance. Given the significant deviation of the capacitive arc from an ideal semicircle, it is challenging to directly compare the corrosion resistance of the samples quantitatively based on the radius. However, the complete interface electrochemical reaction process can be captured at the low frequency of 10
−2 Hz. Therefore, this impedance modulus (|Z|) serves as a useful comparative parameter for evaluating the corrosion resistance performance of the samples. The higher its value, the stronger the corrosion resistance performance. From the Bode-modulus plot (
Figure 5b), it is evident that all samples achieve the maximum |Z| at 10
−2 Hz. Among them, the |Z| values of the 10WMoS
2 coating and the 30WMoS
2 coating are similar and relatively low, followed by that of the substrate. The 20WMoS
2 coating exhibits the highest |Z|, which is approximately 16% higher than that of the substrate. The aforementioned results indicate that the 20WMoS
2 coating possesses the best corrosion resistance and can effectively enhance the protective performance of the substrate, whereas the 10WMoS
2 and 30WMoS
2 coatings demonstrate relatively weaker protective performance.
To further quantify the impedance effect of the coatings, based on the test results depicted in
Figure 5a–c and the characteristics of the corrosion system, the R-C parallel equivalent circuit shown in
Figure 5d was selected for fitting analysis. Here, Rs represents the resistance of the 3.5 wt.% NaCl solution, Rct denotes the charge transfer resistance, and CPEct is the constant phase element used to characterize the non-ideal capacitive behavior of the deformed semicircle. Its impedance, ZCPE, can be expressed as shown in Equation (1) [
26], where Y0 is the admittance of the CPE, ω is the angular frequency, and n is the CPE exponent (0 ≤
n ≤ 1). When
n = 1, the CPE represents a pure capacitor, and when
n = 0, it represents a pure resistor. A value of
n < 1 indicates the presence of factors such as pores, cracks, or inhomogeneity. Furthermore, the corresponding double-layer effective capacitance (Cct) can be calculated using Equation (2) [
27]. The fitting results are listed in
Table 6.
As shown in
Table 6, the solution resistances (Rs) were similar and relatively small, supporting the consistency of the measurements. In general, a higher charge-transfer resistance (Rct) indicates better corrosion resistance [
28]. All three coatings had a higher Rct than the substrate, and the 20WMoS
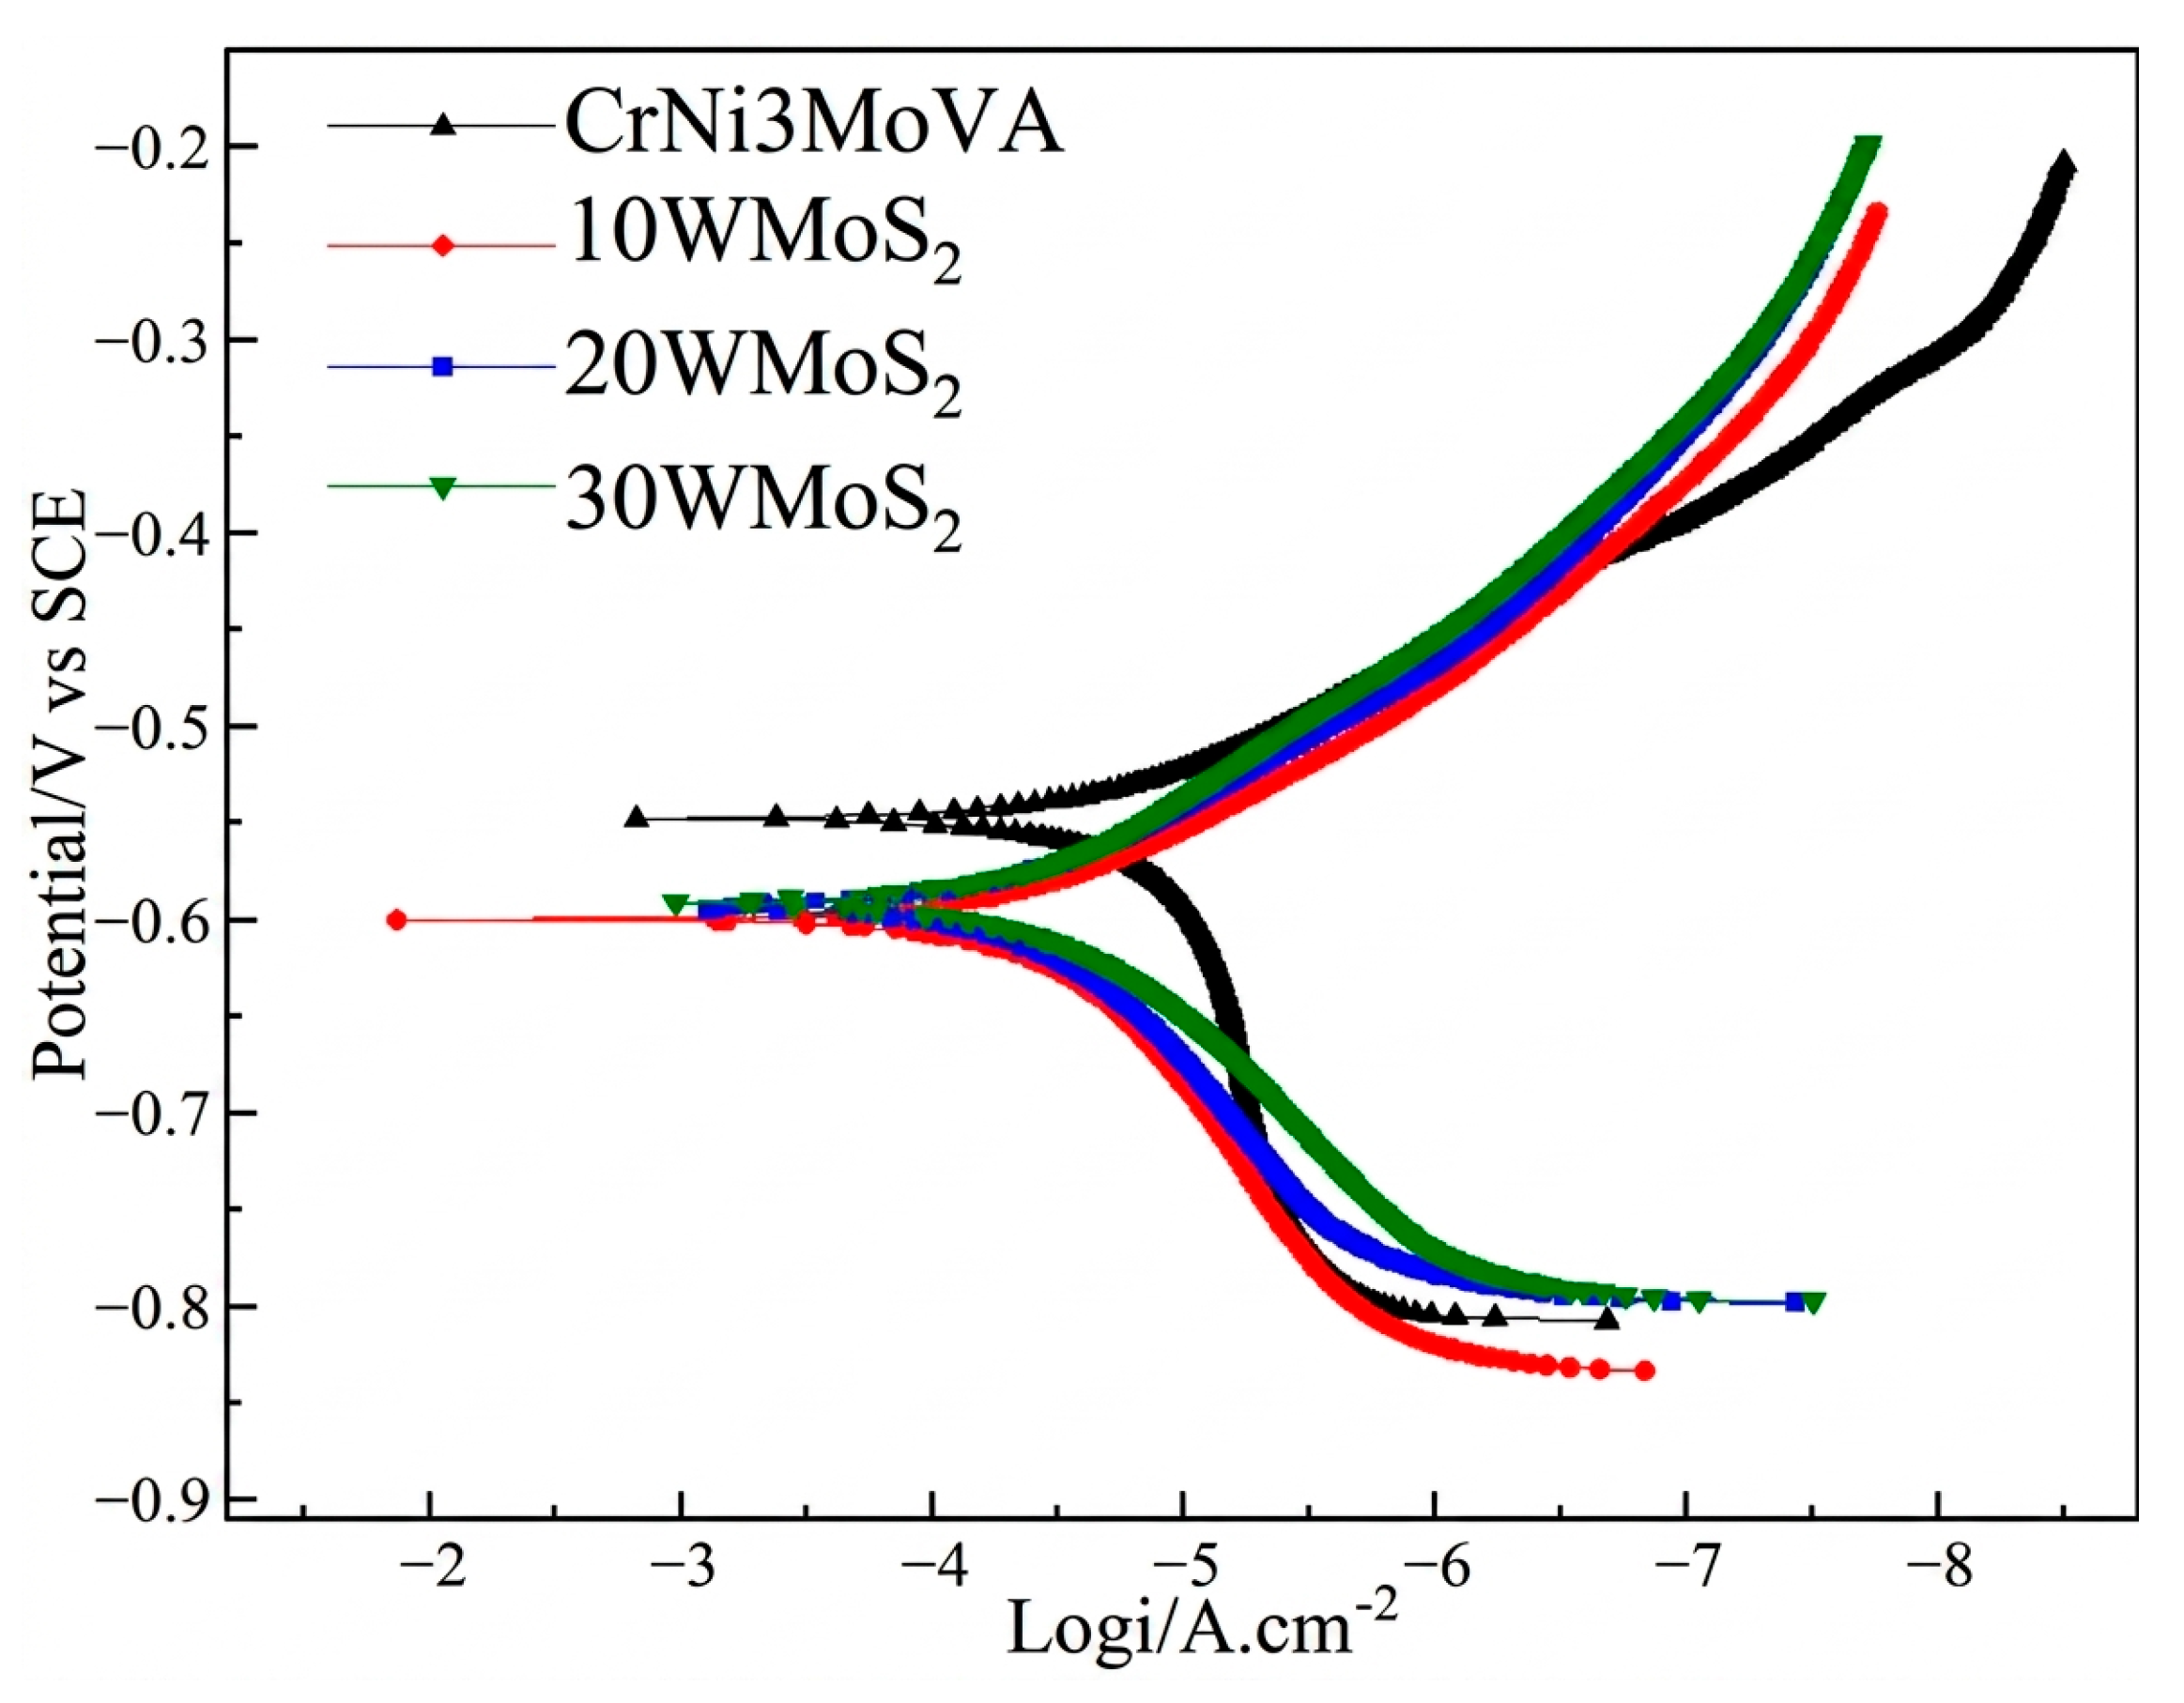
2 coating showed the highest Rct, 1.39 times higher than that of the substrate, consistent with its lowest Icorr in the PDP test. The repeated measurements produced the same ranking of corrosion resistance, indicating that the superior electrochemical performance of the 20WMoS
2 coating was reproducible despite the local defects inherent to ESD coatings.
The value of
n is associated with the degree of interfacial non-ideality and may qualitatively reflect surface heterogeneity, whereas C
ct is related to the interfacial electrochemical response and may increase with a larger effective wetted/active area [
29]. In comparison, the substrate exhibited the highest
n value and the lowest C
ct value. Among the three coatings, the 20WMoS
2 coating demonstrated the highest
n value and the smallest C
ct value. The results indicated that the surface uniformity of the W-MoS
2 coatings was inferior, leading to an increased electrolyte contact area. Capacitive reactance exhibits an inverse relationship with effective capacitance. Consequently, the W-MoS
2 coatings demonstrated reduced capacitive reactance compared to the substrate. However, among the three coatings, the 20WMoS
2 coating exhibited superior uniformity and density, thereby experiencing the smallest reduction in capacitive reactance.
The results from EIS and Tafel polarization curve tests revealed that the Rct of W-MoS2 coatings was significantly higher than that of the substrate, thereby substantially reducing Icorr and the corrosion rate during the electrochemical corrosion process. However, the 10WMoS2 and 30WMoS2 coatings exhibited decreased capacitive reactance due to increased surface roughness and reduced uniformity, which in turn led to a decrease in |Z|, indicating an exacerbation of local corrosion. In contrast, the 20WMoS2 coating demonstrated better uniformity in its coating structure. During electrochemical corrosion, it exhibited higher capacitive reactance, resulting in a significantly enhanced |Z| and superior protective performance compared to both the substrate and the other coatings.
A qualitative comparison was made between the existing W-MoS
2 anti-static coating and the representative ship coating systems reported in the literature, as shown in
Table 7. Conventional marine coatings may show lower corrosion currents, but they are usually thick barrier systems rather than thin self-lubricating ESD layers. The significance of the 20WMoS
2 coating is therefore not universal replacement of marine coatings, but a 67.4% reduction in Icorr relative to CrNi3MoVA steel while retaining MoS
2/WS
2-related lubricating phases for local wear-corrosion protection.
3.4. Corrosion Behavior of CrNi3MoVA Steel
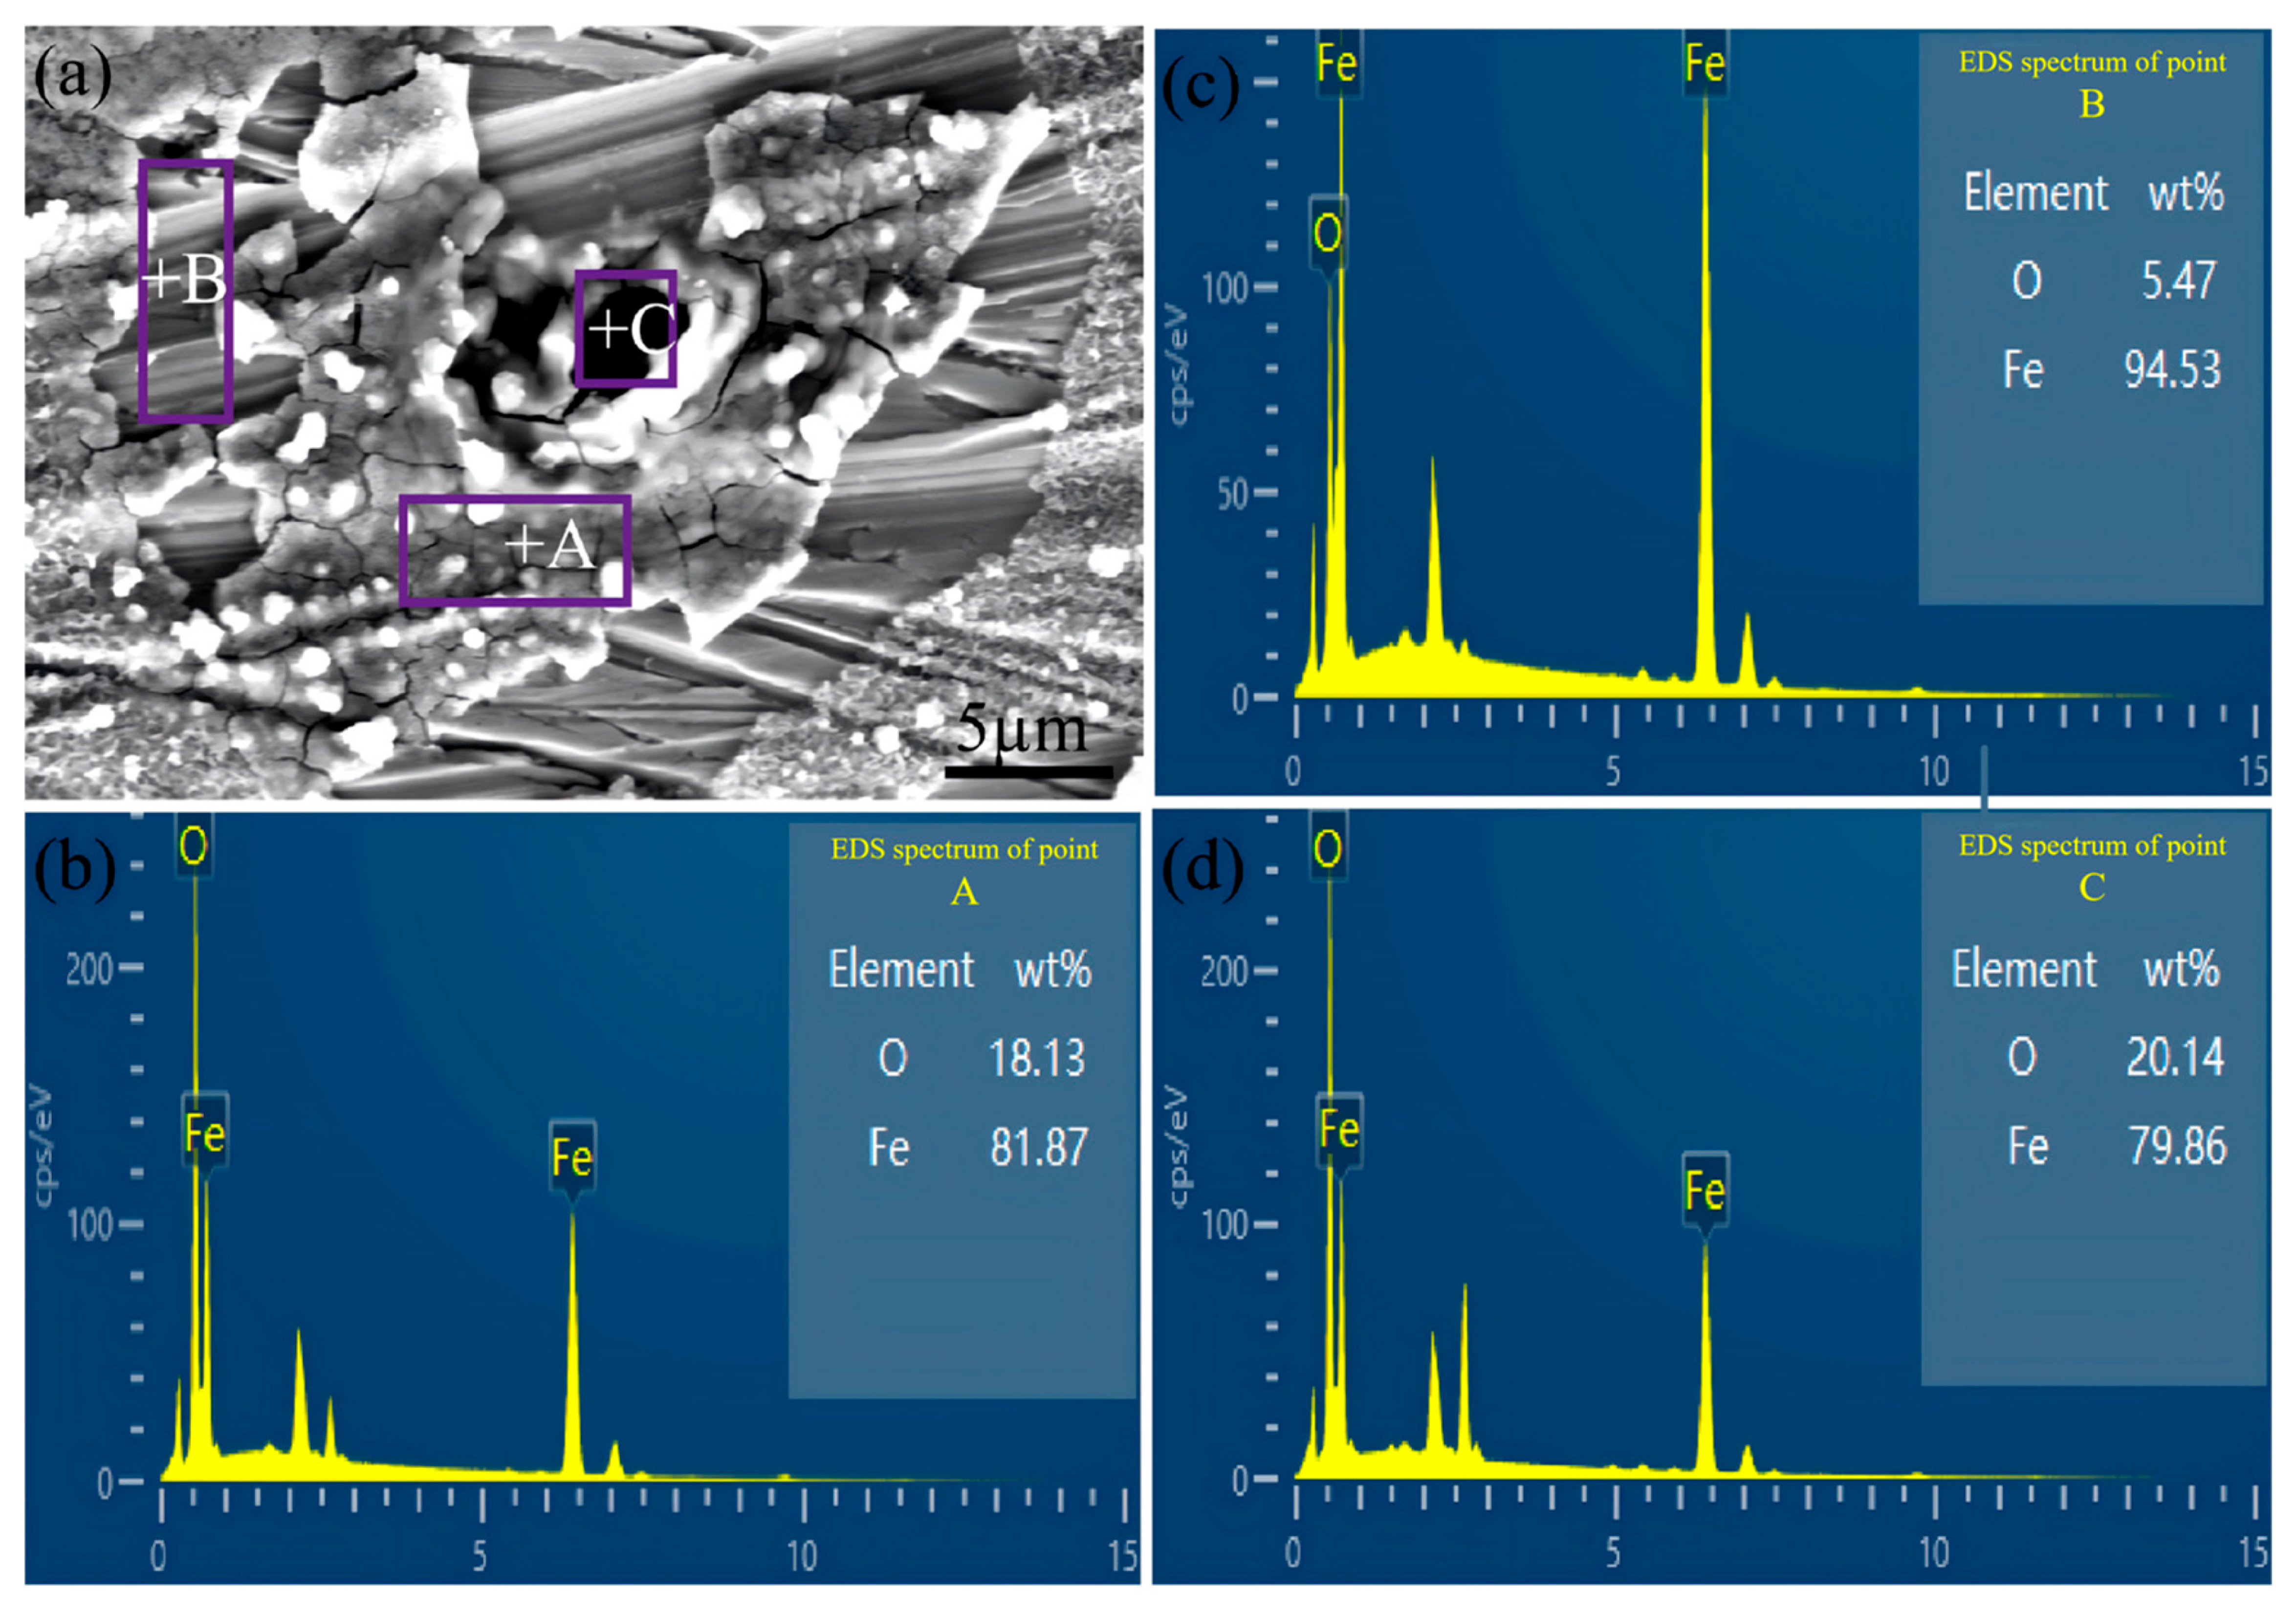
As depicted in
Figure 6a, the substrate underwent severe corrosion, resulting in the complete destruction of its originally smooth surface morphology. The surface was now covered with corrosion products that were full of cracks (Zone A). Localized regions displayed significant corrosion pits (Zone C) and extensive flaking phenomena (Zone B). The energy spectra results shown in
Figure 6b–d revealed that both Zone A and Zone C exhibited substantial Fe loss along with a relatively high oxygen (O) content, primarily consisting of Fe oxide. In Zone B, the O content was notably reduced, and the Fe content was comparable to that of the original substrate. The findings indicated that Fe underwent oxidation–dissolution reactions, leading to its loss and the formation of the corrosion product Fe oxide (Zone A). Nevertheless, the corrosion layer was riddled with cracks. During the ongoing corrosion process, these cracks gradually propagated and interconnected, causing partial flaking of the products and exposing fresh substrate (Zone B), thereby facilitating further internal corrosion expansion. Particularly in the weaker areas, the detachment of products was more pronounced, resulting in the formation of corrosion pits (Zone C). Under the persistent scouring action of the electrolyte, corrosion products continued to accumulate within these pits, creating regions with a high O content.
The corrosion results mentioned above were as follows: The Fe element in the CrNi3MoVA steel substrate exhibited high reactivity, with an Rct value of merely 824.8 Ω·cm2. Under the influence of a 3.5 wt.% NaCl solution, it was highly prone to electron loss, undergoing an oxidation–dissolution reaction and functioning as the anode, thereby generating the corrosion product Fe oxide. Meanwhile, the Cl− ions, which were highly concentrated and had a small radius, strongly adsorbed onto the generated Fe2+ at the interface, forming the inner layer of the double-layer capacitance. Cations such as Na+, which were repelled by electrostatic forces, occupied the outer layer. The potential difference established by this double-layer configuration drove continuous electrochemical reactions.
Despite the substrate exhibiting low Cct and high n during corrosion, along with high capacitive reactance and a relatively uniform interface, the passivating property of Fe oxide further contributed to reducing the severity of corrosion. However, due to the extremely high Fe content (approximately 94%) and low Rct at the interface, the polarization curve indicated a high Icorr and a rapid corrosion rate. Furthermore, the formation of Fe oxide corrosion products was accompanied by significant volume expansion, generating substantial internal stress at the interface between the substrate and the product layer, which induced cracking in the corrosion product layer. Additionally, highly corrosive Cl− preferentially adsorbed at the weak areas of the product layer, forming soluble complexes with Fe atoms. This further destabilized the passivation layer, thereby accelerating the active dissolution of the substrate and the propagation of cracks.
As corrosion progressed, cracks continuously extended and interconnected, ultimately leading to extensive peeling of the originally loosely structured corrosion products. The newly exposed surface of the substrate then became the new active anode, facilitating the continuous occurrence of electrochemical reactions and driving the corrosion deeper into the material. Additionally, the standard electrode potential of Fe was lower than that of Ni (the trace element present in relatively higher concentrations) in the substrate, resulting in the formation of micro-couples due to the potential difference. This phenomenon was particularly pronounced at grain boundaries, further accelerating localized anodic dissolution and promoting the initiation and propagation of corrosion pits. Under the synergistic effects of the low Rct of Fe, the strong erosive action of Cl−, and the micro-galvanic couple, the CrNi3MoVA steel substrate exhibited an extremely high Icorr and a rapid corrosion rate, ultimately displaying severe corrosion morphological characteristics.
3.5. Corrosion Behavior of W-MoS2 Coating
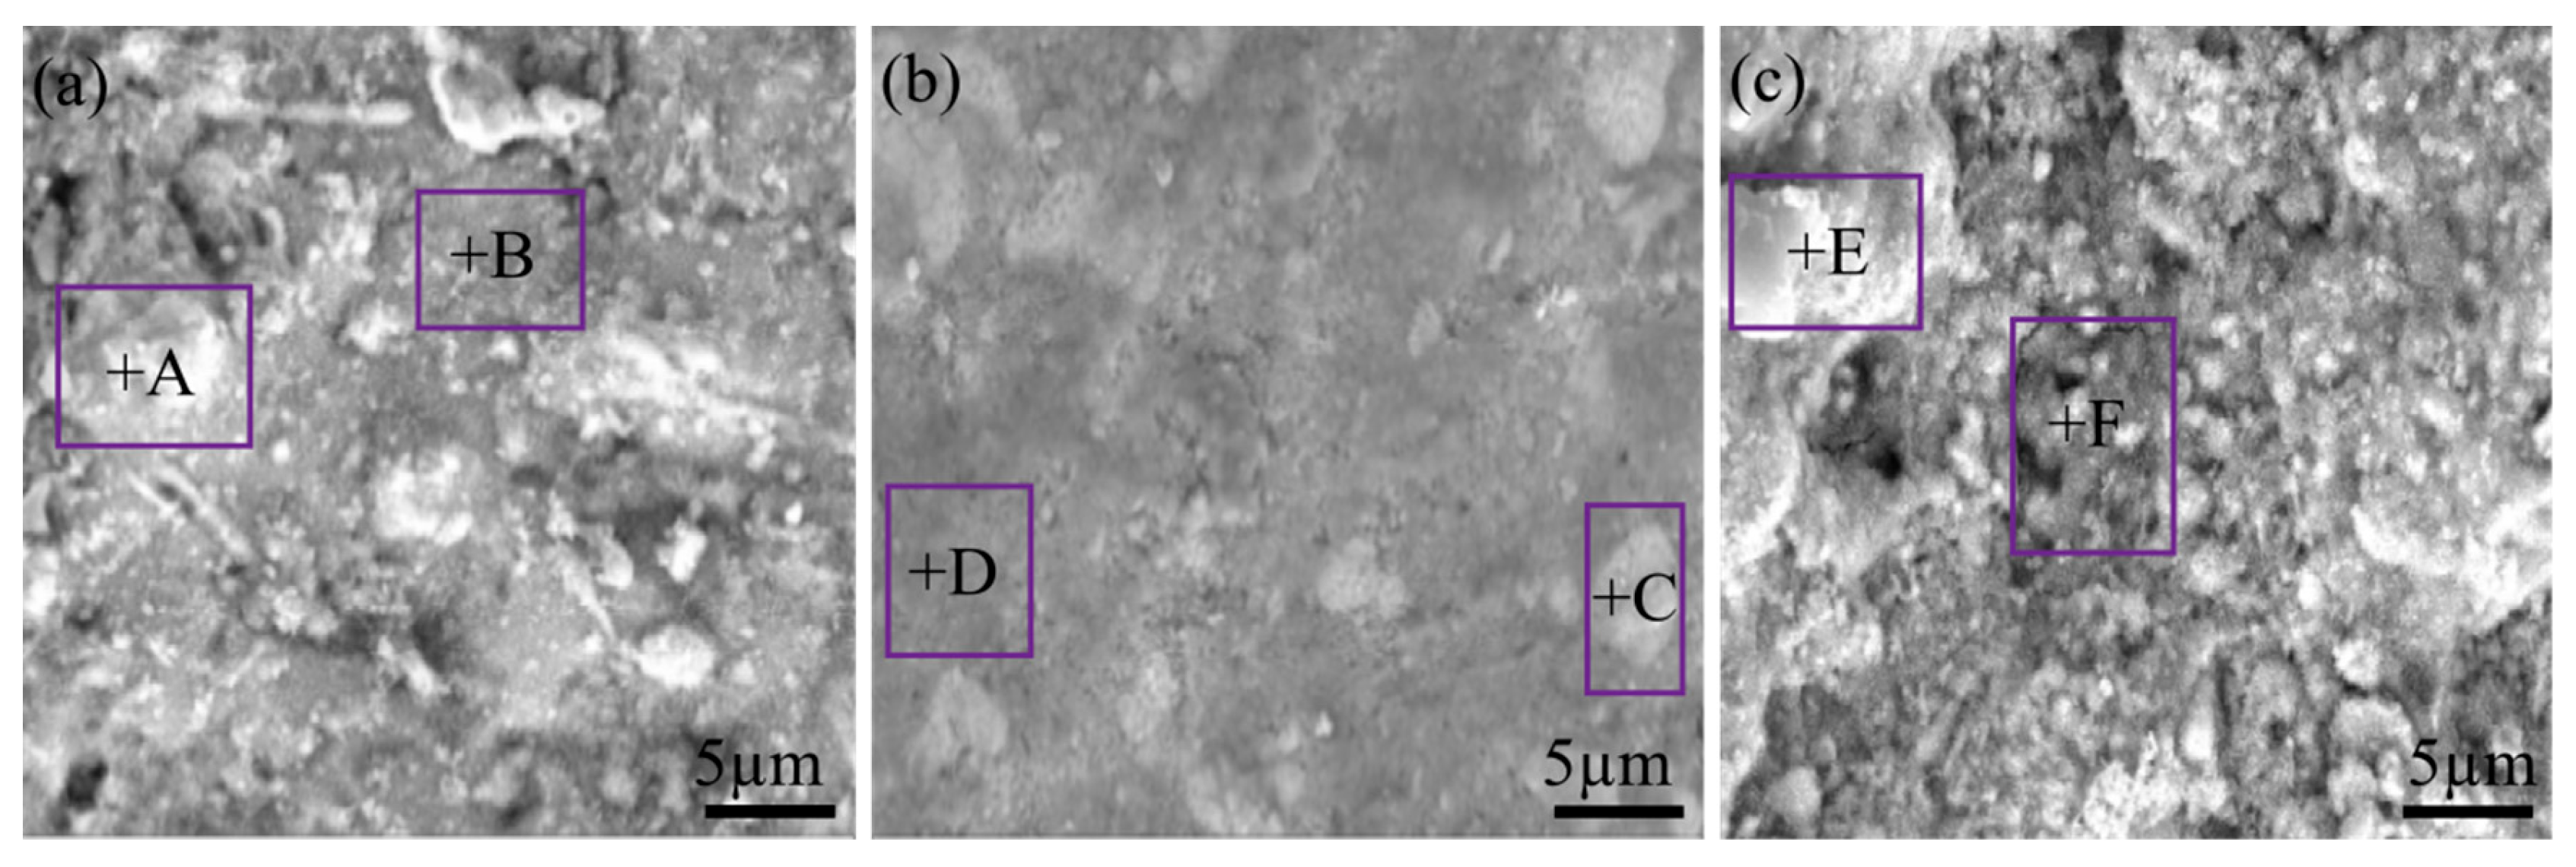
Figure 7 presents the corrosion morphology and EDS results of the W-MoS
2 coatings. As shown in
Figure 7a–c, compared to the CrNi3MoVA steel substrate, the W-MoS
2 coatings maintained their original deposition morphology profile, with only significant accumulation of corrosion products observed at the inherent pores. This led to a notable reduction in both the size and quantity of pores on the coated surface after corrosion, indicating a substantially mitigated degree of corrosion.
EDS results for the two typical regions (white and gray) (
Table 8) revealed that O was newly detected on the corroded coating surface of the post-corrosion coating, with the O content being significantly higher in the white areas compared to the gray ones. Notably, the O content around the groove in the 30WMoS
2 coating region (E) was particularly high, reaching up to 27.9%, whereas both typical regions of the 20WMoS
2 coating exhibited a significantly lower O content. These findings indicated that the W-MoS
2 coatings underwent oxidation reactions under the influence of a 3.5 wt.% NaCl solution, resulting in the formation of oxides. The 20WMoS
2 coating demonstrated the lowest degree of oxidation and the strongest corrosion resistance.
To thoroughly analyze the evolution of coating composition and reveal the corrosion mechanism, a comparative analysis was conducted on the EDS results, with specific data presented in
Table 9. As indicated in
Table 9, all coatings exhibited losses of W and Mo, along with an increase in Fe content, following corrosion. Notably, the loss of W was significantly higher in the white bright areas compared to the gray dark areas. In particular, the Mo content in the white regions rich in the W(Mo)-rich metallic phase of the 10WMoS
2 and 30WMoS
2 coatings decreased from 7.4% and 27% to 0, respectively, while their residual Mo remained relatively high after corrosion. Although the lubricating phases MoS
2 and WS
2 were highly prone to oxidation in humid environments, with their reaction product H
2SO
4 causing a loss of S, in this experiment, except for the gray area of the 30WMoS
2 coating (F), the S content increased in all areas of the coatings after electrochemical corrosion.
The observed phenomena can be summarized as follows: The white regions consisted of W(Mo)-rich metallic regions with an exceptionally high W content. When exposed to a 3.5 wt.% NaCl solution, the W(Mo)-rich metallic phase exhibited preferential oxidation characteristics. Among its components, W with a high content and Mo with a low content preferentially underwent oxidative dissolution, acting as the anode. This led to a greater loss of W in the white regions, indicating that the lost W primarily originated from the W(Mo)-rich metallic phase. Meanwhile, the elevated S content suggested that the lost Mo also predominantly came from the W(Mo)-rich metallic phase rather than from MoS2. Furthermore, considering WS2’s superior oxidation resistance compared to MoS2 and the observed increase in S content, it can be inferred that WS2 remained retained within the coatings. Consequently, both MoS2 and WS2 were effectively protected by the W(Mo)-rich metallic phase, resulting in significantly enhanced oxidation resistance.
Furthermore, although the Fe content increased following coating corrosion, it remained considerably lower than that of the substrate. Based on the results of the single time constant test (
Figure 5c), it can be concluded that during corrosion, the electrolyte diffused from the surface into the interior of the coating. This process led to the oxidative dissolution of the Fe that had diffused from the substrate into the original coating, resulting in the formation of Fe oxide, while the substrate itself remained unexposed.
The gray zone of the 30WMoS
2 coating (F in
Figure 7) showed an abnormal decrease in S content and a sharp increase in Fe content. This phenomenon indicated that structural defects, such as deep grooves and wide cracks, facilitated rapid penetration of the electrolyte, triggering severe internal corrosion. Consequently, oxidation reactions occurred in MoS
2 and WS
2 within the defect region, leading to the formation of H
2SO
4 and resulting in the loss of S. Meanwhile, the internal Fe formed Fe oxides, which caused the dramatic rise in Fe content. The intensified corrosion in these regions directly reduced the coating’s anti-corrosion performance.
A comprehensive comparison of the coatings revealed that the 20WMoS2 coating demonstrated the lowest total loss of W and Mo in the gray-white regions, the highest retention of Mo and S, and the smallest increase in Fe and O content. The results indicated that this coating could effectively prevent electrolyte penetration and inhibit the dissolution of the metal phase and the formation of oxidation products, thereby achieving optimal corrosion resistance performance. Although electrolyte infiltration exacerbated the oxidation and dissolution of Fe in the 10WMoS2 and 30WMoS2 coatings, leading to significant elemental loss and weakened corrosion resistance, none of the coatings exposed the underlying substrate after corrosion. Overall, the protective performance of the W-MoS2 coating system was reliable.
Cross-sectional EDS maps before and after corrosion would further clarify electrolyte penetration paths and the through-thickness redistribution of W, Mo, S, Fe, and O. In the present study, the corrosion interpretation is based on the available as-deposited cross-sectional morphology, post-corrosion surface SEM/EDS, XPS, and electrochemical data. Thus, the depth-resolved corrosion behavior should be regarded as a limitation of the current dataset and will be examined by cross-sectional EDS mapping in subsequent work.
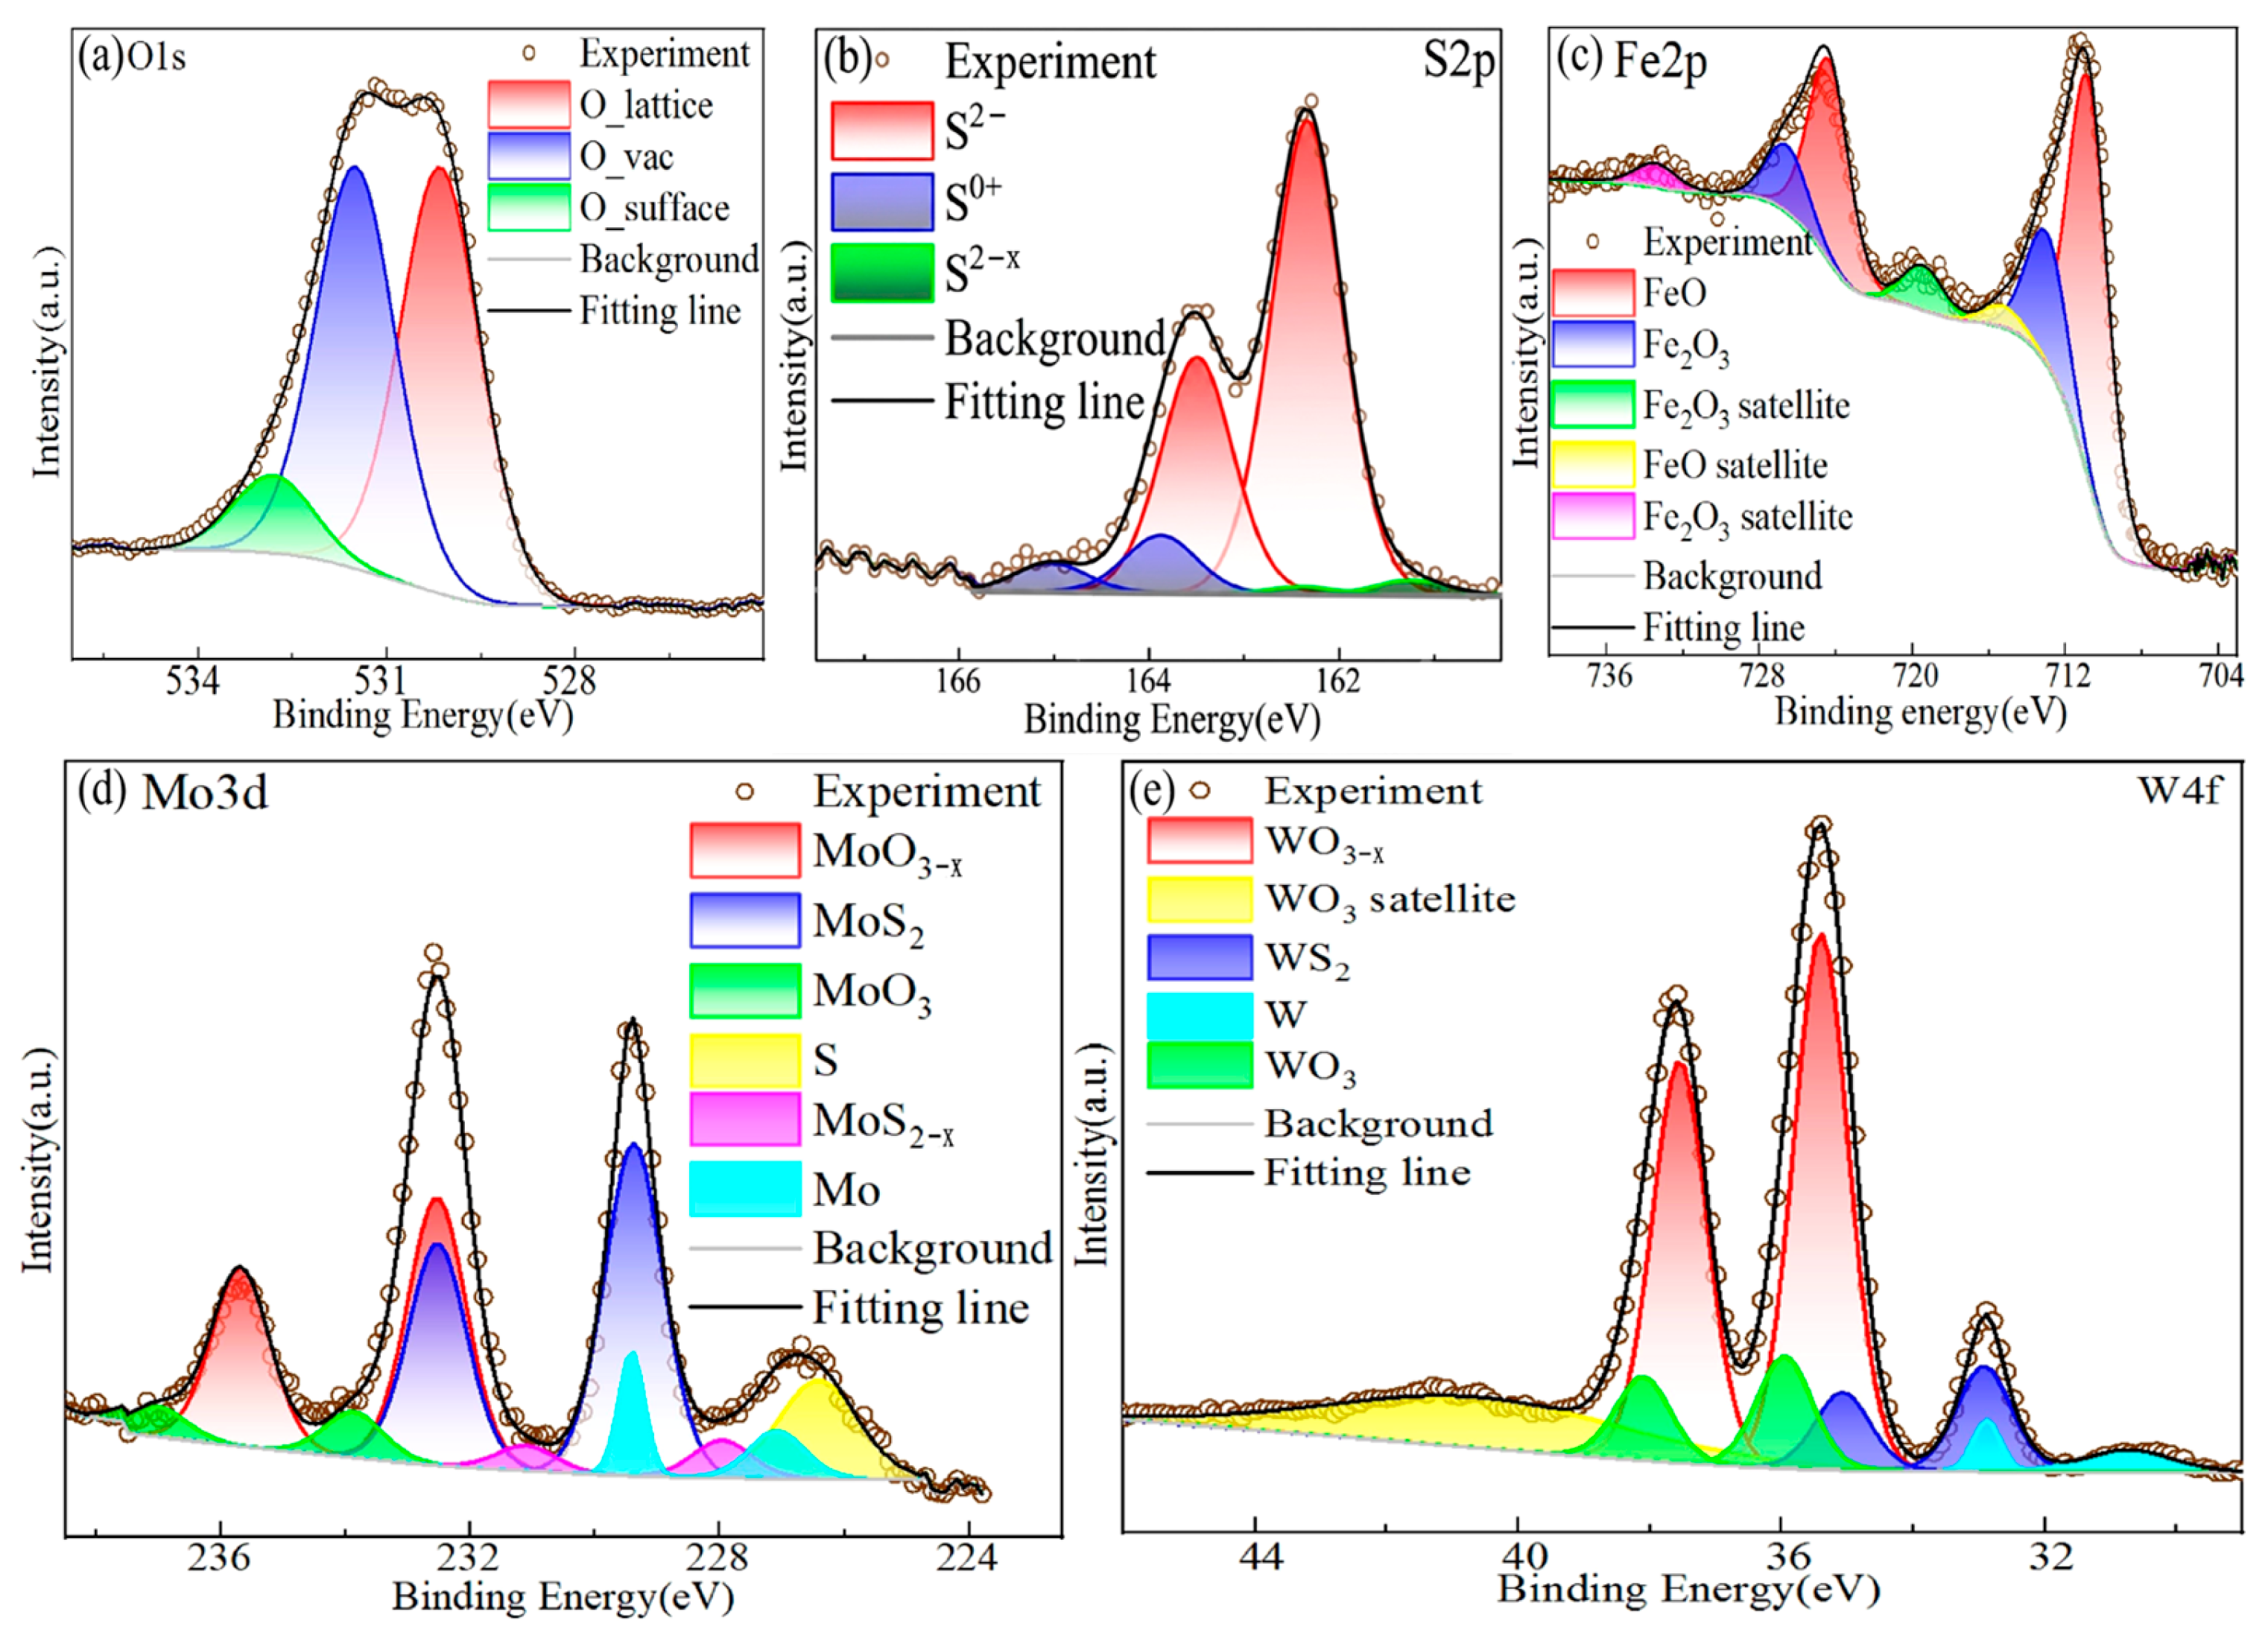
The XPS analysis results are shown in
Figure 8, which indicates that the corrosion products of the W-MoS
2 coating primarily consisted of a series of metal oxides formed by W, Mo, and Fe. Notably, no chlorides were identified in the XPS spectra. This phenomenon was ascribed to electrochemical corrosion reactions initiated by active agents such as O
2, H
2O, and Cl
−. However, due to the solubility of chlorides, they had difficulty persisting on the coating surface. Meanwhile, the detection of MoS
2 and WS
2 signals further indicated that although the W-MoS
2 coating underwent electrochemical corrosion, the W(Mo)-rich metallic phase likely participated preferentially in the oxidation process. This significantly curbed the oxidative consumption of the lubricating phases, enabling them to remain intact. This mechanism was also a crucial factor allowing the W-MoS
2 coating to maintain excellent protective performance in a 3.5 wt.% NaCl solution.
3.6. Corrosion Mechanism of W-MoS2 Coating
On the basis of the SEM/EDS/XRD/XPS and electrochemical results, the corrosion mechanism of the W-MoS
2 coatings can be summarized as follows: The MoS
2/WS
2 lubricating phases provide relatively high-resistance regions, while the W(Mo)-rich metallic regions and the rapidly solidified ESD microstructure form a composite layer with tortuous electrolyte-transport paths. Because the electrochemical activity of W and Mo is lower than that of Fe in the CrNi3MoVA substrate, the coatings exhibit higher impedance and significantly lower Icorr than the uncoated steel under the present short-term 3.5 wt.% NaCl test. Compared with MoS
2-containing organic barrier coatings, where MoS
2 mainly improves corrosion resistance by increasing the tortuosity of the layered barrier [
18], the present ESD coating combines W(Mo)-rich metallic regions with MoS
2/WS
2 lubricating phases. The results also complement recent studies on tungsten-based dichalcogenide corrosion-inhibition systems [
21], because they demonstrate that the corrosion resistance of W-containing sulfide coatings is governed not only by the intrinsic chemical stability of the sulfide phases but also by the compactness and defect distribution determined by the W/MoS
2 ratio.
Furthermore, the W/MoS2 ratio strongly influenced corrosion resistance. The 10WMoS2 coating exhibited a relatively low Rct because of its low lubricating-phase content, high W content, rough surface, and uneven phase distribution. It had the lowest CPE exponent n and a relatively high Cct, indicating stronger interfacial non-ideality and a larger effective wetted area rather than the maximum Cct among all coatings. The concentration of W(Mo)-rich metallic regions in the upper part of the coating, together with pores and microcracks, facilitated local electrolyte penetration and the formation of oxygen-concentration cells. At these defects, W and Mo-containing corrosion products could not form a continuous protective layer, and Cl− further destabilized the locally passivated regions. The electrolyte therefore penetrated the porous corrosion products and promoted internal Fe oxidation, weakening the overall protective performance.
The 20WMoS2 coating, featuring a homogeneous and dense structure, effectively hindered the penetration of the electrolyte. It achieved the highest n, the lowest Cct among the coatings, and the maximum capacitive reactance. Meanwhile, the optimal ratio of MoS2 and W contents significantly increased the charge transfer resistance. As a result, during the electrochemical corrosion process, the 20WMoS2 coating formed relatively stable corrosion products and demonstrated the highest Rct and |Z|, thereby providing the best protective performance.
For the 30WMoS2 coating, the higher MoS2 fraction was expected to increase charge-transfer resistance, but excessive MoS2 also promoted agglomeration during ESD and produced deep grooves or wide cracks. These defects reduced surface uniformity, decreased the CPE exponent n, and increased the effective electrolyte-contact area, resulting in a higher Cct and lower capacitive impedance. The cracks also provided faster channels for electrolyte penetration and promoted O concentration-gradient microcells. Under the combined action of Cl- erosion and localized defect-assisted transport, the protective performance of the 30WMoS2 coating was weakened.
The quantitative roughness measurements provide direct support for this composition-dependent mechanism. The higher Ra, Rq, and Rz values of the 10WMoS2 and 30WMoS2 coatings increase the real electrolyte-contact area and the number of sites available for localized corrosion, whereas the smoother 20WMoS2 coating limits electrolyte accumulation and helps maintain a higher impedance response.
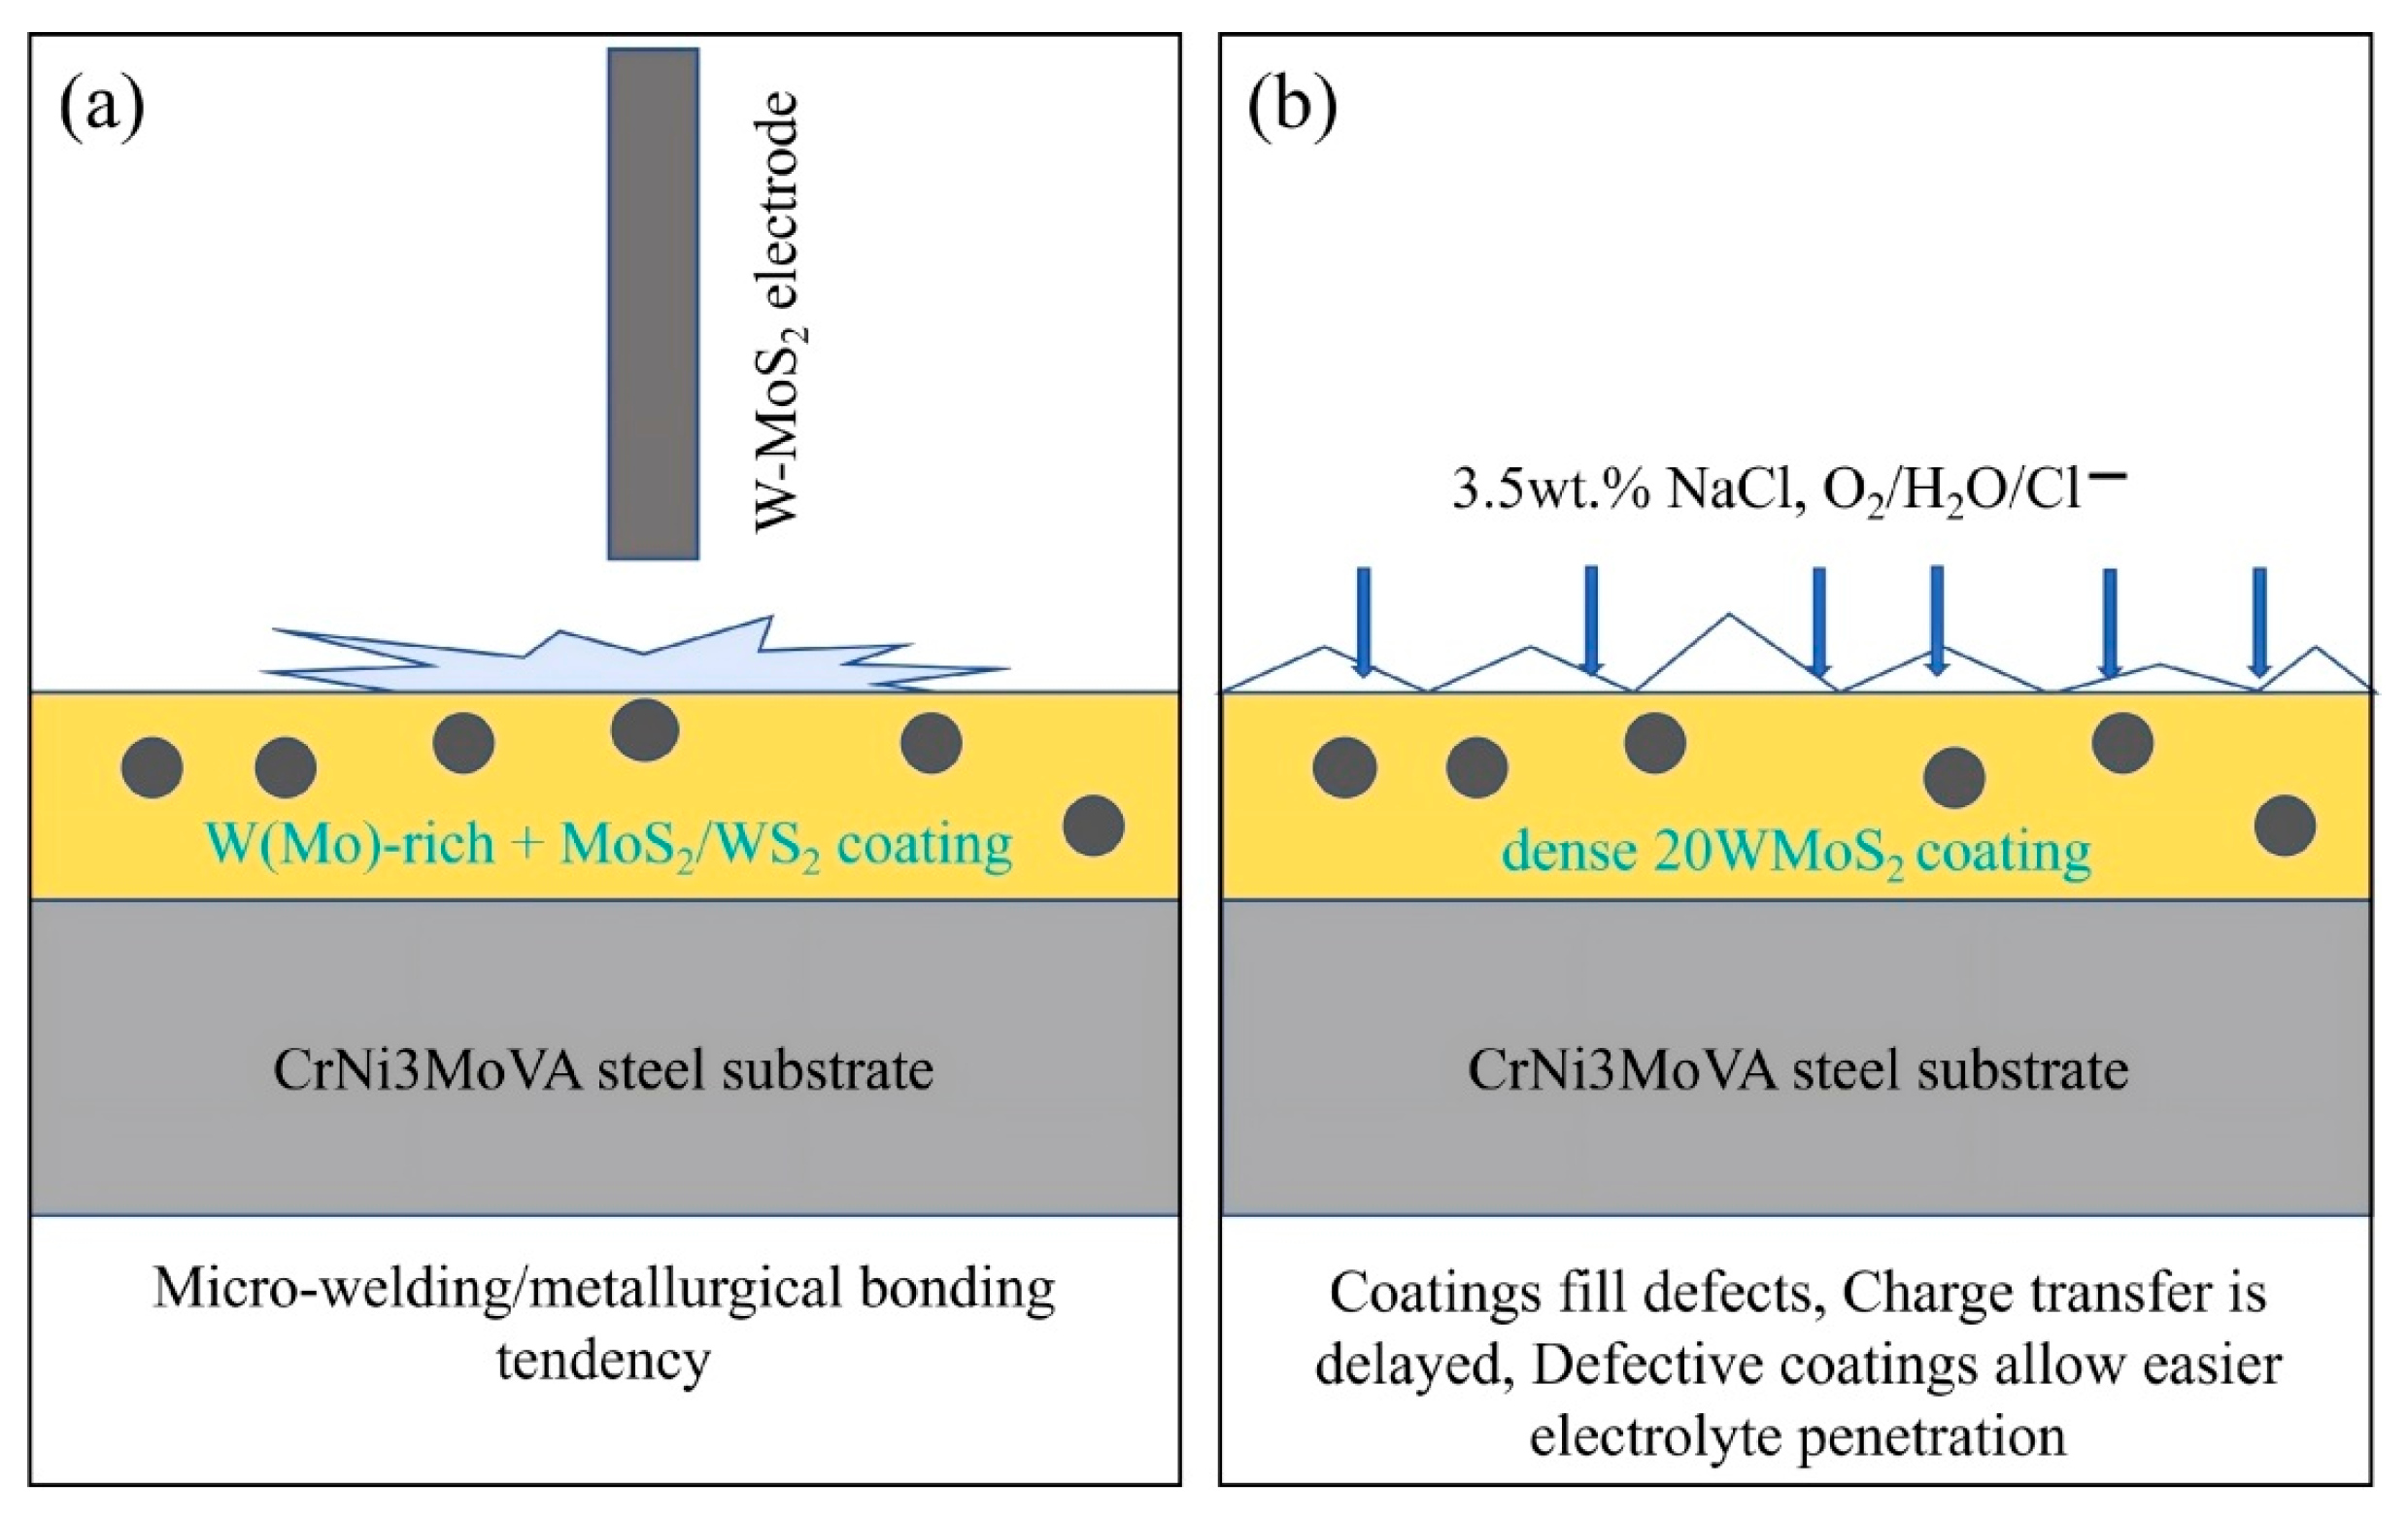
As summarized in
Figure 9, the transient spark discharge melts and transfers W-MoS
2 electrode material to the steel surface, producing a rapidly solidified composite layer. During corrosion, electrolyte first contacts surface pores, grooves, and phase boundaries. For the 20WMoS
2 coating, the denser morphology and more favorable phase distribution delay electrolyte penetration and charge transfer. In contrast, excessive W-rich aggregation in 10WMoS
2 and MoS
2-related agglomeration/grooves in 30WMoS
2 provide easier channels for localized corrosion.



 and
and