Article

Surface Integrity and Subsurface Modification Depths During Grinding Under Varying Process Conditions


by
Gerrit Kuhlmann
1,2,*,
Lars Langenhorst
1,2,
Tobias Hüsemann
1,2,
Carsten Heinzel
1,2 and
Bernhard Karpuschewski
1,2
1
MAPEX Center for Materials and Processes, Faculty Production Engineering, University of Bremen, Bibliothekstr. 1, 28359 Bremen, Germany
2
Leibniz Institute for Materials Engineering—IWT, Badgasteiner Str. 3, 28359 Bremen, Germany
*
Author to whom correspondence should be addressed.
Metals 2026, 16(7), 770; https://doi.org/10.3390/met16070770
Submission received: 11 June 2026 / Revised: 2 July 2026 / Accepted: 8 July 2026 / Published: 10 July 2026
(This article belongs to the Special Issue Novel Insights into Surface Integrity in Metal Machining)

Abstract

This study investigates the influence of the spatial distribution of specific grinding power within the contact zone on subsurface layer modification and the resulting modification depth effects. In surface grinding experiments on AISI 4140, the width of cut and depth of cut were deliberately modified to generate distinct thermal loads within the grinding contact zone, with simultaneous measurement of tangential and normal grinding forces to quantify the mechanical loading conditions. The distribution of specific grinding power was analyzed with respect to its localization along the contact length and across the width of cut. The results indicate a predominantly uniform distribution of grinding power density within the contact zone under the investigated process conditions. Subsurface integrity was characterized in terms of tempering effects in metallographic cross-sections, hardness and residual stress depth profiles. These findings were correlated with Barkhausen noise measurements to establish a non-destructive assessment methodology for thermally induced modifications. Also, roughness measurements were evaluated. The experimental results reveal a consistent relationship between specific grinding power input and subsurface modification depth. Furthermore, a uniform grinding burn threshold was identified, indicating a critical condition for thermally induced surface damage.

1. Introduction

The cost-efficient manufacturing of highly complex components poses significant challenges to modern production engineering, particularly when stringent requirements regarding quality and functional reliability must be fulfilled simultaneously [1]. In the machining of hardened components, grinding frequently constitutes the final process step [2]. Owing to the high added value of these components, the prevention of process-induced damage at this stage is of critical importance. During grinding, the workpiece is subjected to combined mechanical and thermal loads, with thermal effects typically dominating [3]. To ensure high productivity while maintaining consistent component quality, manufacturing processes must be operated close to their performance limits without compromising process stability [4]. In the precision machining of hardened materials, this necessitates the design of process strategies near permissible grinding burn limits [5].
If these limits are exceeded during the grinding of hardened steels, grinding burn may occur at the component surface. This damage can extend into subsurface regions to depths of several hundred micrometers [6]. The extent of subsurface modifications depends strongly on the partitioning of the generated heat (heat partition ratio ε) among the interacting partners and on the fraction of heat transferred into the workpiece through the contact zone. A substantial portion of the energy dissipated during grinding is converted into heat and conducted into the workpiece [7,8]. The resulting thermal load can induce changes in hardness, microstructure and residual stress state, or even lead to the formation of rehardened layers [9,10].
Improper process design may, depending on application-specific requirements, restrict the usability of the component or necessitate its rejection. Undesirable subsurface modifications frequently impair functional properties such as wear resistance [11] and may promote premature failure during service [12]. In industrial practice, thermally induced surface and subsurface modifications are typically detected only after the completion of the grinding process. Common methods include Barkhausen noise analysis, residual stress measurements, metallographic examinations and nital etching, the latter being most widely applied in industrial environments [13]. In addition to the partially subjective nature of the evaluation, these methods are associated with considerable time and economic expenditure. Consequently, insufficient understanding of the process limits represents a major constraint for reliable process design and process optimization [14,15].
One of the governing factors limiting the selection of process parameters due to thermal process constraints is the generation and distribution of heat within the grinding contact zone. Depending on the selected process parameter combination, different thermal loads arise in the contact zone, which lead to varying subsurface modifications and modification depths in the workpiece surface layer after grinding [3]. Thermal load is typically characterized in terms of the acting process temperatures and therefore constitutes the basis of model-based approaches for grinding burn prevention [16]. These approaches frequently rely on the moving heat source theory introduced by Carslaw and Jaeger [17]. To describe the thermal load of the workpiece, they developed an analytical solution for the calculation of quasi-steady-state temperature rises. Their formulation assumes a two-dimensional heat source with constant heat flux density moving at constant velocity relative to a semi-infinite solid with an adiabatic surface [17].
In the application of moving heat source theory to grinding processes, several key aspects must be considered. Numerous studies have focused on the distribution of heat flux along the contact zone [18]. The geometrical contact length lc and the associated variation in undeformed chip thickness hcu decisively govern the local heat generation and, consequently, the resulting heat distribution within the workpiece [19]. In addition, the grinding energy is primarily dissipated within the geometrical contact length lc, where heat generation and transfer are concentrated [20]. Although this assumption provides a reasonable approximation of workpiece temperatures, Guo and Malkin [21] demonstrated that the resulting temperature profile can be predicted with high accuracy. The variation in undeformed chip thickness hcu along the geometrical contact length lc locally and quantitatively influences heat generation. Consequently, triangular and parabolic heat flux distributions are commonly applied in grinding models [22,23]. Anderson et al. [24] employed a triangular heat source model for both numerical and analytical temperature calculations in shallow grinding and creep-feed grinding under dry conditions. The results indicate that at small depths of cut ae both the numerical models and the analytical solution provide high predictive accuracy. However, with increasing depth of cut ae the numerical approaches outperform the analytical model, while the contact angle was found to have a negligible influence on the contact temperatures [24].
From a physical perspective, modifications of subsurface properties are primarily governed by the attained temperature, the duration of thermal exposure and superimposed loads [9,25]. Numerous previous studies have examined correlations between controllable machining parameters, such as cutting speed vc, tangential feed speed vft and depth of cut ae, and the resulting subsurface characteristics. However, these empirical relationships are generally insufficient to provide reliable quantitative predictions over a broader range of parameter combinations beyond the conditions investigated.
To characterize the thermal impact of the grinding process, Malkin et al. [3,26] developed a grinding burn criterion based on the moving heat source model of Carslaw and Jaeger [17]. This analytical–empirical approach enables a preliminary assessment of grinding burn occurrence in cylindrical and surface grinding of hardened steels. Assuming that grinding burn in steel occurs when a critical workpiece surface temperature is exceeded, Malkin derived a linear relationship as a function of the specific grinding energy u and a combined term of relevant process parameters. Accordingly, the burn-free regime is separated from the grinding burn region by a critical specific grinding energy u, forming a linear threshold. Nevertheless, the theoretical–empirical framework is limited to surface-visible grinding burn revealed by nital etching and does not account for subsurface modifications or depth-related modifications [3,26].
In addition to the lack of interpretability regarding subsurface modification depths, Malkin’s process model is not readily applicable to more complex kinematics, such as those encountered in gear grinding. Furthermore, the requirement to calculate the specific grinding energy complicates in-process monitoring [27]. To overcome these limitations, Malkin’s experimental data were transferred into the Pc″–Δt diagram. For analogous processes of discontinuous profile grinding of gears, it was demonstrated that a comparable thermal grinding burn limit exists. The Pc″–Δt diagrams are based on the assumption that the grinding process can be abstracted as a short-term heat treatment. In this framework, the specific grinding power Pc can be interpreted as the intensity of the moving heat source, whereas the contact time Δt corresponds to the thermal exposure duration of a material point on the newly generated surface [28]. The specific grinding power Pc is calculated from the tangential force Ft, the cutting speed vc, the width of cut ap and the geometrical contact length lc (see Equation (1)). In addition, the tangential feed speed vft is required to determine the contact time Δt (see Equation (2)). The geometrical contact length lc is determined from the equivalent wheel diameter deq and the depth of cut ae (see Equation (3)). In the corresponding investigations, the distribution of the specific grinding power Pc within the contact zone along the geometric contact length lc and across the width of cut ap was simplified by assuming a constant profile.
P c = F t   ·   v c a p · l c
Δ t = l c v f t
l c = a e   ·   d e q
Heinzel et al. [29] identified the existence of a common lower grinding burn limit. In metallographic cross-sections, this condition is observable as the formation of tempering effects. The identified threshold condition was shown to apply not only to conventional external cylindrical and surface grinding operations, but also to kinematically more demanding processes such as generating gear grinding with corundum wheels. The underlying experimental investigations covered a wide range of thermal loads, reflecting different combinations of exposure time and heat intensity. These studies further included various case-hardened steel grades, coolant supply conditions and corundum wheel specifications [29]. Pc″–Δt diagrams can also be applied for the identification of grinding burn in non-cylindrical external grinding operations, such as camshaft machining [30]. Extending the grinding burn criterion to such processes necessitates an angularly resolved evaluation of the engagement conditions. Owing to the continuously changing workpiece geometry and the cam-specific rotational speed variation, the contact area AK, the specific grinding power Pc, the contact time Δt and the corresponding thermal process limit must be determined as functions of the angular position [30].
The Pc″–Δt diagram proposed by Heinzel [29] is exclusively based on the detection of tempering zones in metallographic cross-sections obtained after grinding case-hardened steels. Guba [31] extended this diagram by introducing an upward-shifted grinding burn limit derived from surface grinding experiments on AISI 4140 (42CrMo4) steel for high contact times Δt. In the quenched and tempered condition, AISI 4140 exhibits a lower carbon content compared to case-hardened steels. An increasing carbon content is associated with a higher susceptibility to thermally induced grinding burn [31].
In addition to the magnitude of the specific grinding power or thermal load, the duration of heat exposure plays a decisive role in the formation of the subsurface layer and its depth of modification [32]. The resulting modification depth is primarily governed by the process-specific exposure time and the local temperature gradient. Consequently, shorter contact times Δt and steeper temperature gradients lead to reduced thermally induced subsurface alterations [29]. This relationship was analytically and experimentally demonstrated by Jamshidi and Budak [33]. The formation of an oxide layer was adopted as the grinding burn criterion. Based on an oxidation growth model, the thickness of the thermally affected or oxidized subsurface layer was determined as a function of the maximum temperature Tmax and the exposure duration Δt [33].
Kuhlmann et al. [34] extended the Pc″–Δt diagram by incorporating regions of equal tempering zone depths Δz for surface grinding with corundum abrasives on case-hardened steels. The predictive capability of this model was subsequently validated for multi-stage grinding processes. In two multi-stage grinding trials, the thermal process limit was intentionally exceeded. The resulting tempering zone depth Δz was predicted and subsequently removed during the finishing stage. The temporarily induced tempering zones remaining in the workpiece were also predicted with high accuracy [34]. Based on this approach, an algorithm is introduced to fully exploit the time-saving potential associated with intermediate thermal impact, enabling the systematic design of grinding stages in which the material is intentionally influenced up to the final stock allowance. Furthermore, a non-linear programming optimization algorithm is applied to determine arbitrary combinations of grinding parameters across multiple process stages [35].
Previous investigations on grinding burn limits and subsurface modification depths in the Pc″–Δt diagram were performed using corundum grinding wheels. Even at elevated specific material removal rates Q′w, the likelihood of thermally induced workpiece damage is substantially reduced when CBN grinding wheels are employed [36,37]. This behavior is attributed to the higher thermal conductivity of CBN, which reduces the amount of heat conducted into the subsurface region and therefore leads to a reduced risk of thermal damage [38,39]. Further investigations on thermal process limits and subsurface modification depths using CBN abrasives reveal a shift of the thermal process limit towards higher specific grinding power Pc compared to identical process parameters with corundum, both in cylindrical and surface grinding in the Pc″–Δt diagram [40]. An empirical relationship is established for the determination of the depth of tempering zones Δz.
In previous studies, the determination of Pc″–Δt diagrams was based on the simplifying assumption that the specific grinding power Pc is uniformly distributed across the width of cut ap within the contact zone. This assumption is not valid when the local depth of cut ae varies across the width of cut ap. Instead, the spatial distribution of the local specific grinding power Pc must be considered. The distribution of the local undeformed chip thickness hcu provides a suitable basis for this analysis. It must be evaluated both along the geometric contact length lc in the direction of the tangential feed speed vft and across the width of cut ap. Based on geometric and kinematic relationships, the distribution of hcu along the feed direction can be approximated as linearly increasing [9]. In the transverse direction, it is generally assumed that the grinding wheel generates a constant specific grinding power Pc across the width of cut ap. However, it remains unclear how local lubrication takes effect on the conversion of mechanical energy into heat and how local cooling influences the resulting heat flux into the workpiece. Consequently, variations in local subsurface modification may arise not only from differences in local power density but also from spatial variations in the heat partition ratio ε across the width of cut ap. These previously unknown relationships are examined and evaluated based on an analysis of the resulting subsurface layer properties. The present study addresses the following three research questions, derived from the identified limitations in the current state of the art:
  • Is the specific grinding power uniformly distributed across the width of cut ap and linearly increasing along the geometric contact length lc or is there a need to incorporate these geometric parameters explicitly into the Pc″–Δt diagram?
  • Does the width of cut ap influence the position of the grinding burn limit established for AISI 4140 (42CrMo4) in the Pc″–Δt diagram?
  • How do different widths of cut ap take effect on the subsurface modification depth, particularly with regard to tempering zones, hardness and residual stress depth profiles?

2. Materials and Methods

To address the outlined research questions concerning the influence of the width of cut ap across the specimen width, i.e., transverse to the grinding direction, the specimens investigated in this study were specifically designed and prepared. Rectangular samples with dimensions of 80 × 28 × 22 mm3 were used. The flat specimens incorporated centrally positioned grooves oriented in the feed direction, introduced during the soft machining stage of specimen preparation (Figure 1a). To investigate the distribution of grinding power along the width of cut ap under constant stock removal conditions, the milled section was progressively widened. This modification resulted in a corresponding reduction in the width of cut ap. The specimens possess a total width of 28 mm. The width of the introduced grooves was systematically varied to b = 4, 8, 12, 16 and 20 mm, resulting in corresponding widths of cut ap = 24, 20, 16, 12 and 8 mm. Since the grooves were positioned centrally across the specimen width, half of the resulting width of cut ap was located on each side of the groove (Figure 1b). This configuration ensures a symmetric grinding wheel engagement, homogeneous coolant supply conditions and a controlled reduction in the width of cut while minimizing the influence of geometric asymmetries on the process. Consequently, the local force and power distribution could be determined as a function of the respective grinding wheel segment engaged in the contact zone. This systematic variation in the width of cut ap extends previous investigations on Pc″–Δt diagrams, in which the specific influence of the depth of cut ae had not been explicitly examined. In addition, the depth of cut ae was varied in order to deliberately modify the geometric contact length lc and the overall process intensity. These parameter variations enable a comprehensive assessment of the local thermal and mechanical process characteristics within the contact zone. To assess the initial material condition and the thermally induced modifications introduced by the grinding process, metallographic cross-sections, hardness depth profiles and carbon concentration depth profiles were prepared after heat treatment (Figure 1c). The specimens made of AISI 4140 were heat-treated in a vacuum furnace by Ipsen International GmbH (Kleve, Germany). Austenitization was carried out at 850 °C with a holding time of 4 h, followed by oil quenching. Tempering was then carried out at 180 °C for a period of four hours. The chemical composition of the base material was characterized by means of optical emission spectroscopy. Five individual measurements were obtained, and the mean elemental concentrations were calculated with consideration for the corresponding standard deviations. The analyses were conducted using an ARL 3460 spectrometer by Thermo Fisher Scientific GmbH (Waltham, MA, USA). Table 1 summarizes the determined chemical composition and associated permissible limit values of the investigated AISI 4140 material.
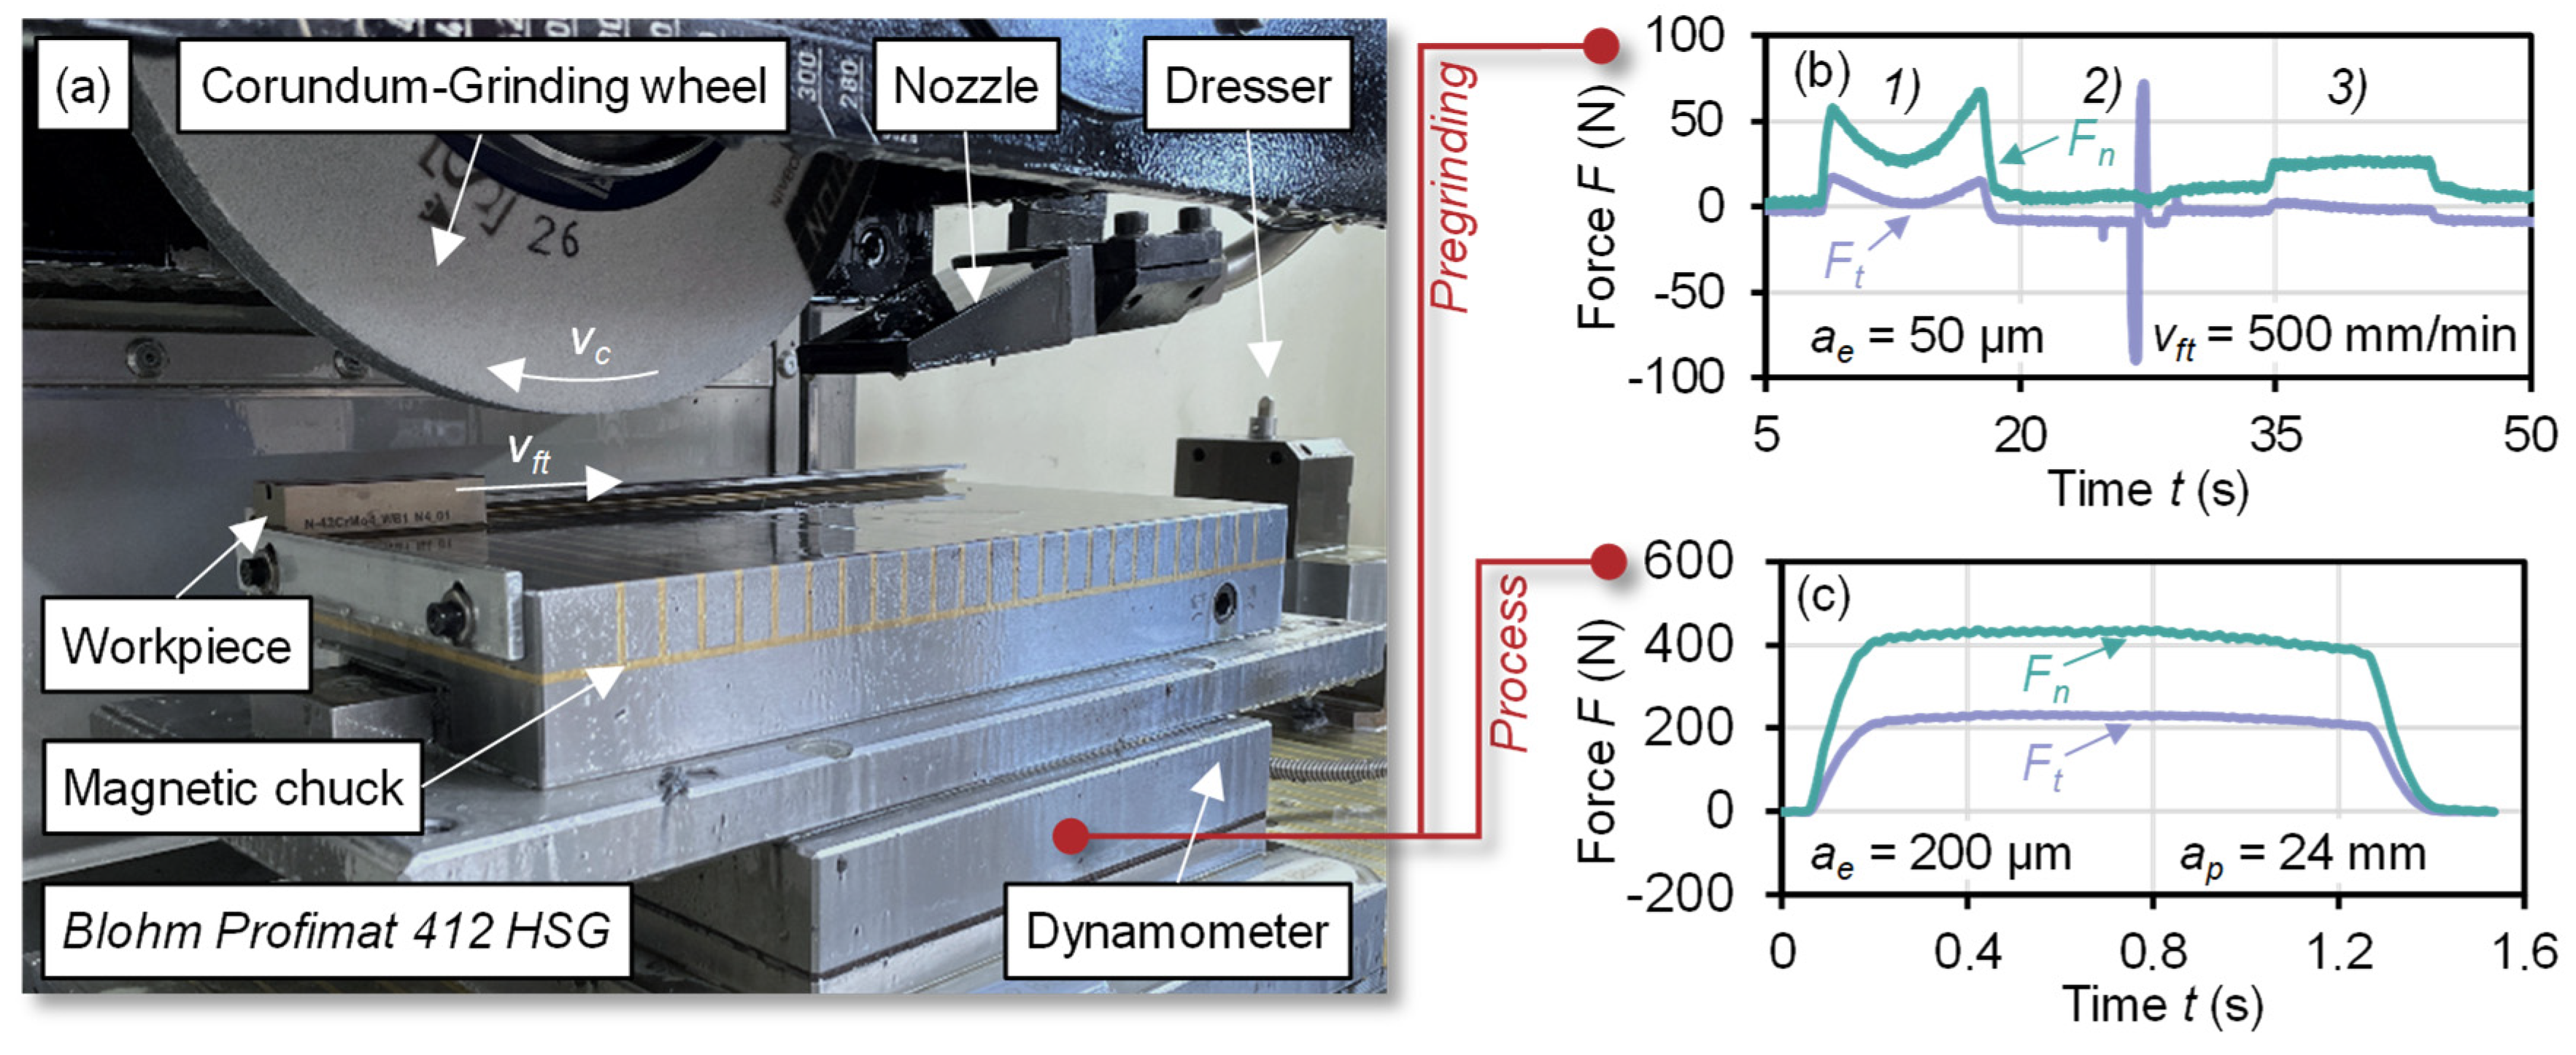
The grinding experiments were conducted on a Blohm Profimat 412 HSG surface grinding machine manufactured by Blohm Jung GmbH (Hamburg, Germany). A corundum grinding wheel of type CFA60L15VS3CF (400 × 30 × 127 mm3) supplied by Saint-Gobain GmbH (Wesseling, Germany) was employed. Prior to each experiment, the wheel was dressed using a single-diamond dressing tool (NSS 10808 WS) from Riegger Diamantwerkzeuge GmbH (Affalterbach, Germany) to ensure reproducible engagement conditions. The dressing parameters were a dressing overlap ratio of Ud = 3 and a dressing infeed value of aed = 0.02 mm. Coolant was supplied via a flat-jet nozzle oriented tangentially towards the grinding contact zone. The grinding oil CUT-MAX 906-10 provided by Quaker Houghton (Dortmund, Germany) was applied at a volumetric flow rate of QMWF = 50 L/min. The coolant supply conditions were kept constant throughout all experiments. The workpiece was clamped on a magnetic chuck. Grinding forces were measured using a piezoelectric dynamometer type 9225B installed beneath the workpiece, supplied by Kistler Instrumente AG (Winterthur, Switzerland). The experimental setup is illustrated in Figure 2a. Following heat treatment, the specimens were pre-ground prior to each test in order to eliminate heat-treatment-induced distortion and to ensure a defined depth of cut ae. The pre-grinding parameters consisted of a tangential feed rate of vft = 500 mm/min and two successive depths of cut of ae = 50 μm each. An exemplary force profile (Figure 2b) displaying the normal force Fn and tangential force Ft over process time can be divided into three distinct phases: (1) a non-stationary regime caused by workpiece distortion, (2) a machine movement retraction phase and (3) a steady-state material removal phase characterized by a constant force level. The stable force plateau in the third phase confirms uniform conditions and steady-state grinding. A representative force signal of a grinding experiment is shown in Figure 2c. The uniform force progression indicates a constant thermal load during steady-state operation. In total, 35 experiments were conducted, comprising five different widths of cut ap combined with seven depths of cut ae at a constant tangential feed speed vft. In the conducted grinding experiments, the depth of cut ae was progressively increased in order to induce varying subsurface conditions and subsurface depth modification through the associated rise in thermal load. This approach ensured that both burn-free states and conditions exhibiting thermally induced grinding burn with increasing subsurface modification depths were systematically obtained. Table 2 summarizes the experimental design, including the corresponding calculated specific material removal rates Q′w. Each grinding test was performed in a single trial.
To evaluate subsurface modifications and their corresponding modification depths induced by the thermal load of the grinding process, a combination of destructive and non-destructive characterization methods was employed. This methodological approach enables a differentiated assessment of thermally induced microstructural changes within the subsurface layer.
Surface topography was assessed by means of tactile roughness measurements using a Surftest SV-3200 instrument by Mitutoyo (Sakado, Japan). A cutoff wavelength filter of λc = 0.8 mm was selected for waviness filtering. Measurements were conducted at the center of the specimen length and perpendicular to the machining direction (tangential feed direction vft), corresponding to the location of subsequent metallographic analyses (see Figure 1a). For statistical reliability, three measurements were carried out on each side of the ground groove per rib.
Non-destructive evaluation of thermally induced microstructural changes was carried out using micromagnetic Barkhausen noise analysis. Prior to measurement, all specimens were demagnetized to eliminate residual magnetization originating from the magnetic clamping system. A circular coil of type EM12 supplied by Vallon GmbH (Eningen, Germany) was used. Barkhausen noise measurements were conducted using a Rollscan 350 system from Stresstech GmbH (Rennerod, Germany) in combination with an S8505 sensor (Stresstech GmbH, Rennerod, Germany) designed for flat geometries. The magnetizing voltage was set to 5 V at a frequency of 125 Hz. The analysis frequency range was filtered between 70 and 200 kHz. Each rib was measured four times, with the specimen positioned centrally beneath a movable sensor under constant contact pressure. Since the sensor width exceeds the rib width, increasing groove width (i.e., decreasing width of cut ap) reduces the effective material coverage beneath the sensor.
To assess thermally induced tempering zones and their depth effect Δz, metallographic cross-sections were prepared. The central specimen region was first sectioned by EDM to ensure representative sampling from the steady-state grinding zone, followed by standard metallographic preparation including polishing and etching with 3% nitric acid (HNO3). The etching procedure and duration were kept constant for all samples to ensure comparable microstructural contrast. Microstructural images were acquired using high-resolution optical microscopy from Zeiss GmbH (Oberkochen, Germany). Tempering zone depth Δz was evaluated from multiple positions across each cross-section. At these locations, optical micrographs were analyzed using contrast-enhanced black-and-white image representations to clearly identify the boundary between tempered and unaffected material. The depth of the tempered zone was determined using the image analysis software Imagic, which allows calibrated dimensional measurements directly from the recorded micrographs. In addition, overview images of the ground surfaces were captured using a Nikon Z6 II (Tokyo, Japan).
While metallographic analysis provides qualitative insight into subsurface modification depth, quantitative analysis was obtained by hardness depth profiles. Hardness depth profiles were determined according to the Vickers method using a DuraScan 70 G5 testing system from EMCO-TEST Prüfmaschinen GmbH (Kuchl, Austria).
Residual stress depth profiles were measured by X-ray diffraction using a 2θ diffractometer (Analytical X-ray MZ VI E XRD) by GE Inspection Technology (Ahrensburg, Germany) with Cr-Kα1 radiation. Depth profiles were obtained by successive measurements following incremental electrolytic material removal using a 15% NaCl solution and a MoviPol-5 electropolishing device from Struers GmbH (Ballerup, Denmark).

3. Results

The following chapter presents the experimental results and the corresponding metallurgical findings obtained from the conducted investigation. The chapter and its subsections are structured according to the defined research questions. First, it is examined whether the specific grinding power is uniformly distributed across the width of cut ap and increases linearly along the geometric contact length lc. The second subsection addresses the second research question concerning the position of a uniform grinding burn limit in the PcΔt diagram as a function of the width of cut ap. The third subsection focuses on the subsurface modification depth, including the tempering zone depth, the hardness modification and the residual stress depth profiles. In doing so, it addresses the third research question.

3.1. Distribution of Specific Grinding Power Within the Contact Zone

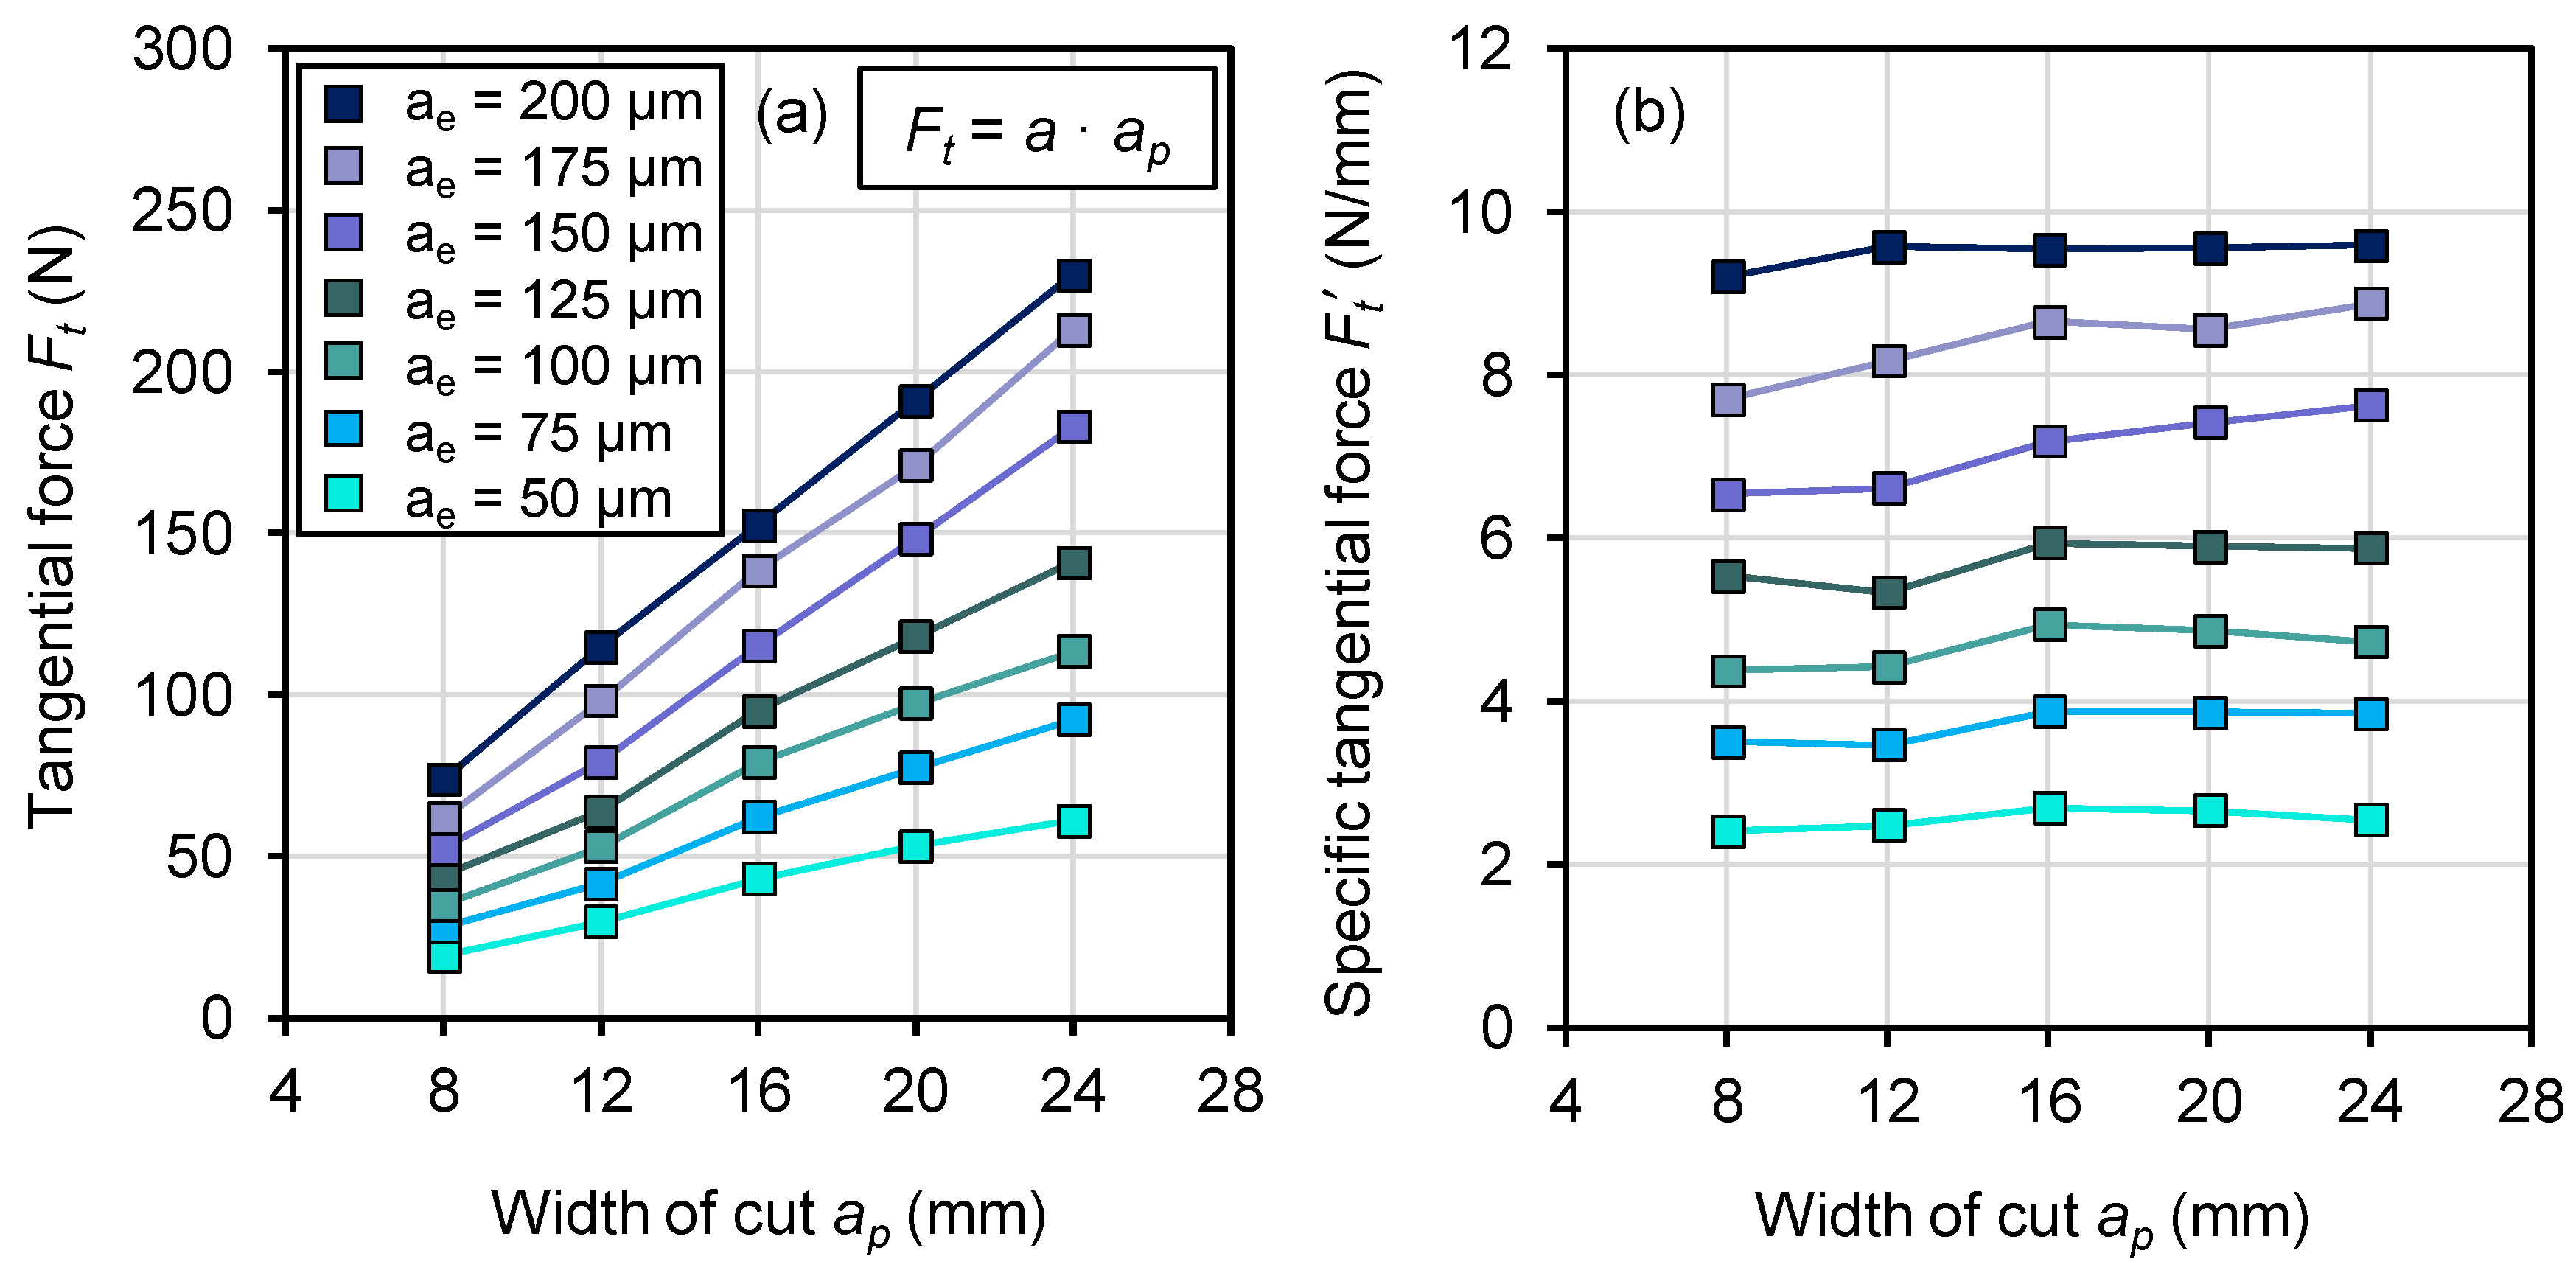
To evaluate the distribution of specific grinding power Pc along the geometric contact length lc and across the width of cut ap, in-process force measurements were conducted during grinding. By progressively reducing the groove width b, the width of cut ap was increased while enabling a spatial allocation of the corresponding force components. An increase in the depth of cut ae results in higher thermal load within the contact zone and simultaneously leads to an increase in the geometric contact length (see Equation (3)). Figure 3a presents the measured tangential forces Ft as a function of the width of cut ap for seven different depths of cut ae. For a constant depth of cut ae, the tangential force Ft increases with increasing width of cut ap. This behavior can be attributed to the increasing material removal rate Qw = ap · ae · vft and the associated volumetric resistance against the grinding wheel. A comparison of different depths of cut ae at constant width of cut ap likewise reveals an increase in Ft, which can also be explained by the higher removed material volume. With increasing width of cut ap, the influence of ae on the force increase becomes more pronounced. Figure 3b shows the specific tangential forces Ft normalized to a width of cut ap of 1 mm (Ft′ = Ft/ap). For a constant depth of cut ae, the variation in ap appears to have only a minor influence on Ft, indicating an approximately uniform distribution of tangential force across the width of cut ap. This suggests a homogeneous heat generation along the width of cut ap. However, with increasing depth of cut ae, the normalized specific tangential force Ft increases accordingly.
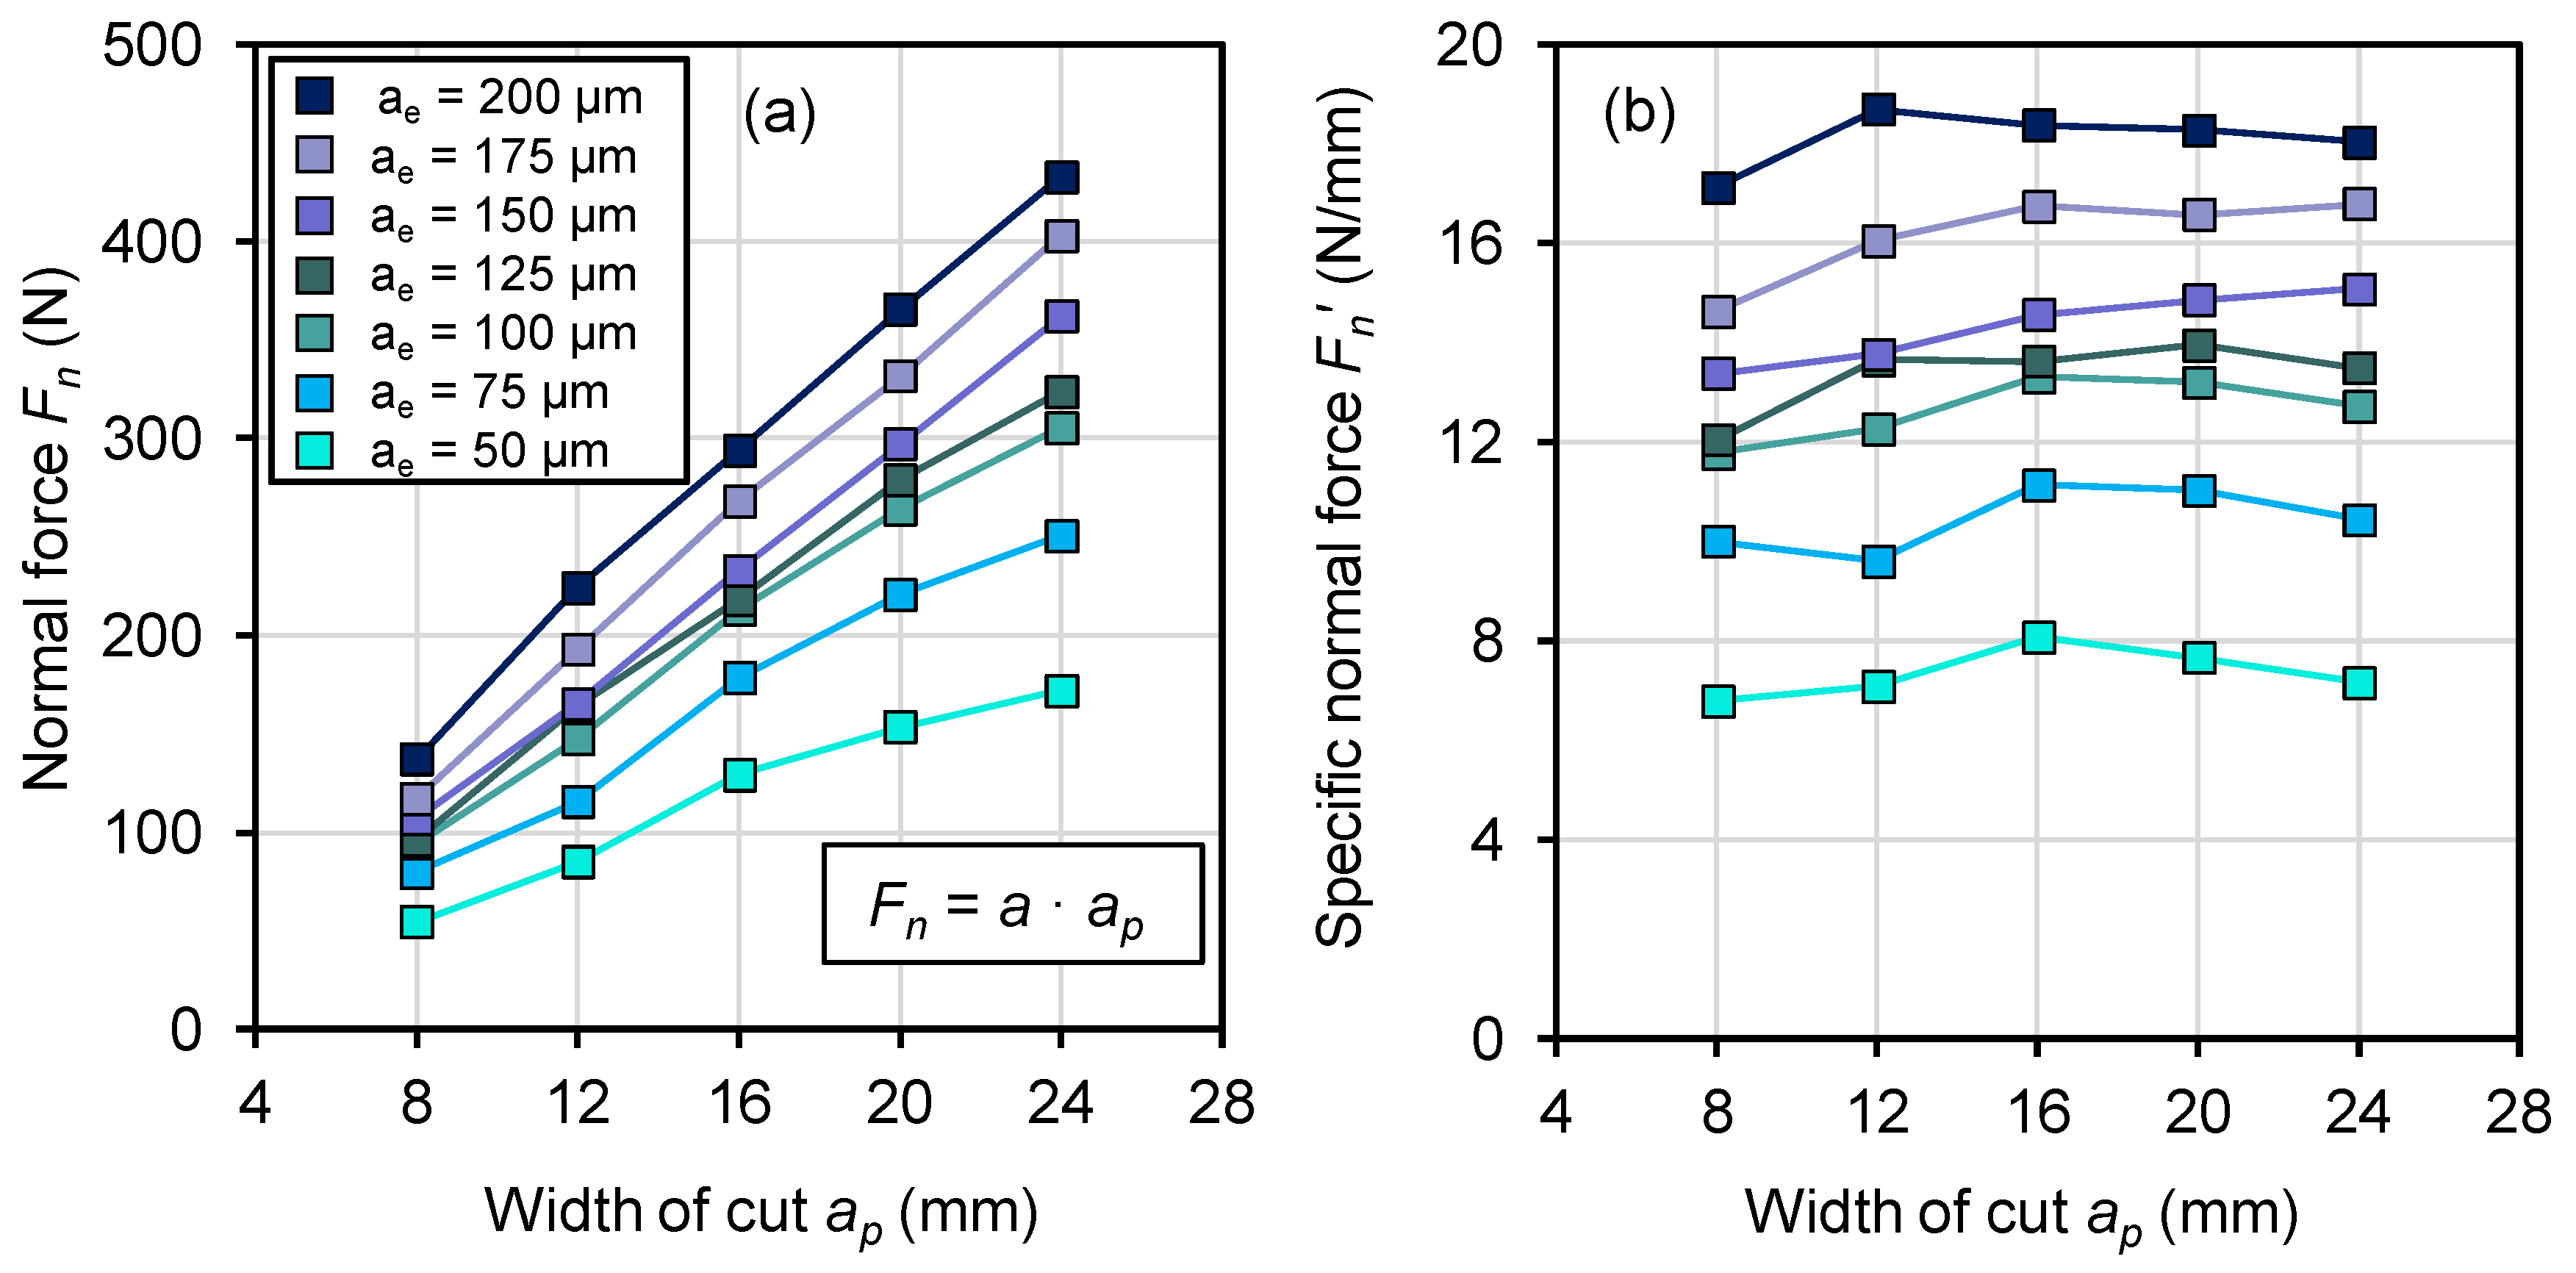
In addition to the tangential forces Ft, the normal forces Fn were evaluated. Figure 4a illustrates the normal forces Fn as a function of the width of cut ap for the selected depths of cut ae. The measured normal forces Fn exhibit a trend comparable to that observed for the tangential forces Ft. With increasing width of cut ap and depth of cut ae, the normal forces increase continuously. Compared to the tangential forces Ft (see Figure 3), higher force values are observed for Fn at each individual process point (see Figure 4). The consistently higher normal forces compared to tangential forces indicate a dominant ploughing and frictional component within the grinding contact, which significantly contributes to heat generation. Figure 4b presents the normal forces normalized to a width of cut of ap = 1 mm (Fn = Fn/ap). With increasing depth of cut ae, the specific normal forces Fn increase for all investigated widths of cut. However, in contrast to the normalized tangential forces Ft, the specific normal forces Fn exhibit larger fluctuations within a given depth of cut ae. This behavior may be attributed to the assumption that tangential forces Ft are more directly linked to the steady grinding energy required for chip formation, while normal forces Fn are influenced by highly sensitive, non-linear shifting contact geometries and the intermittent transition from plowing to effective micro-cutting at varying grain penetration depths [42].
A regression analysis was performed for the measured tangential force Ft and normal force Fn to describe their linear dependence on the width of cut ap for the different investigated depths of cut ae. The experimental data exhibited an approximately linear relationship over the investigated parameter range. Therefore, the grinding forces were described using the linear model given in Equation (4), where F represents either the tangential force Ft or the normal force Fn, ap is the width of cut and a is the corresponding regression coefficient. The identified regression coefficients a together with the coefficients of determination R2 for both tangential and normal forces are summarized in Table 3. The high R2 values confirm the suitability of the linear model and indicate a low scatter of the experimental data over the investigated process conditions.
F = a   · a p
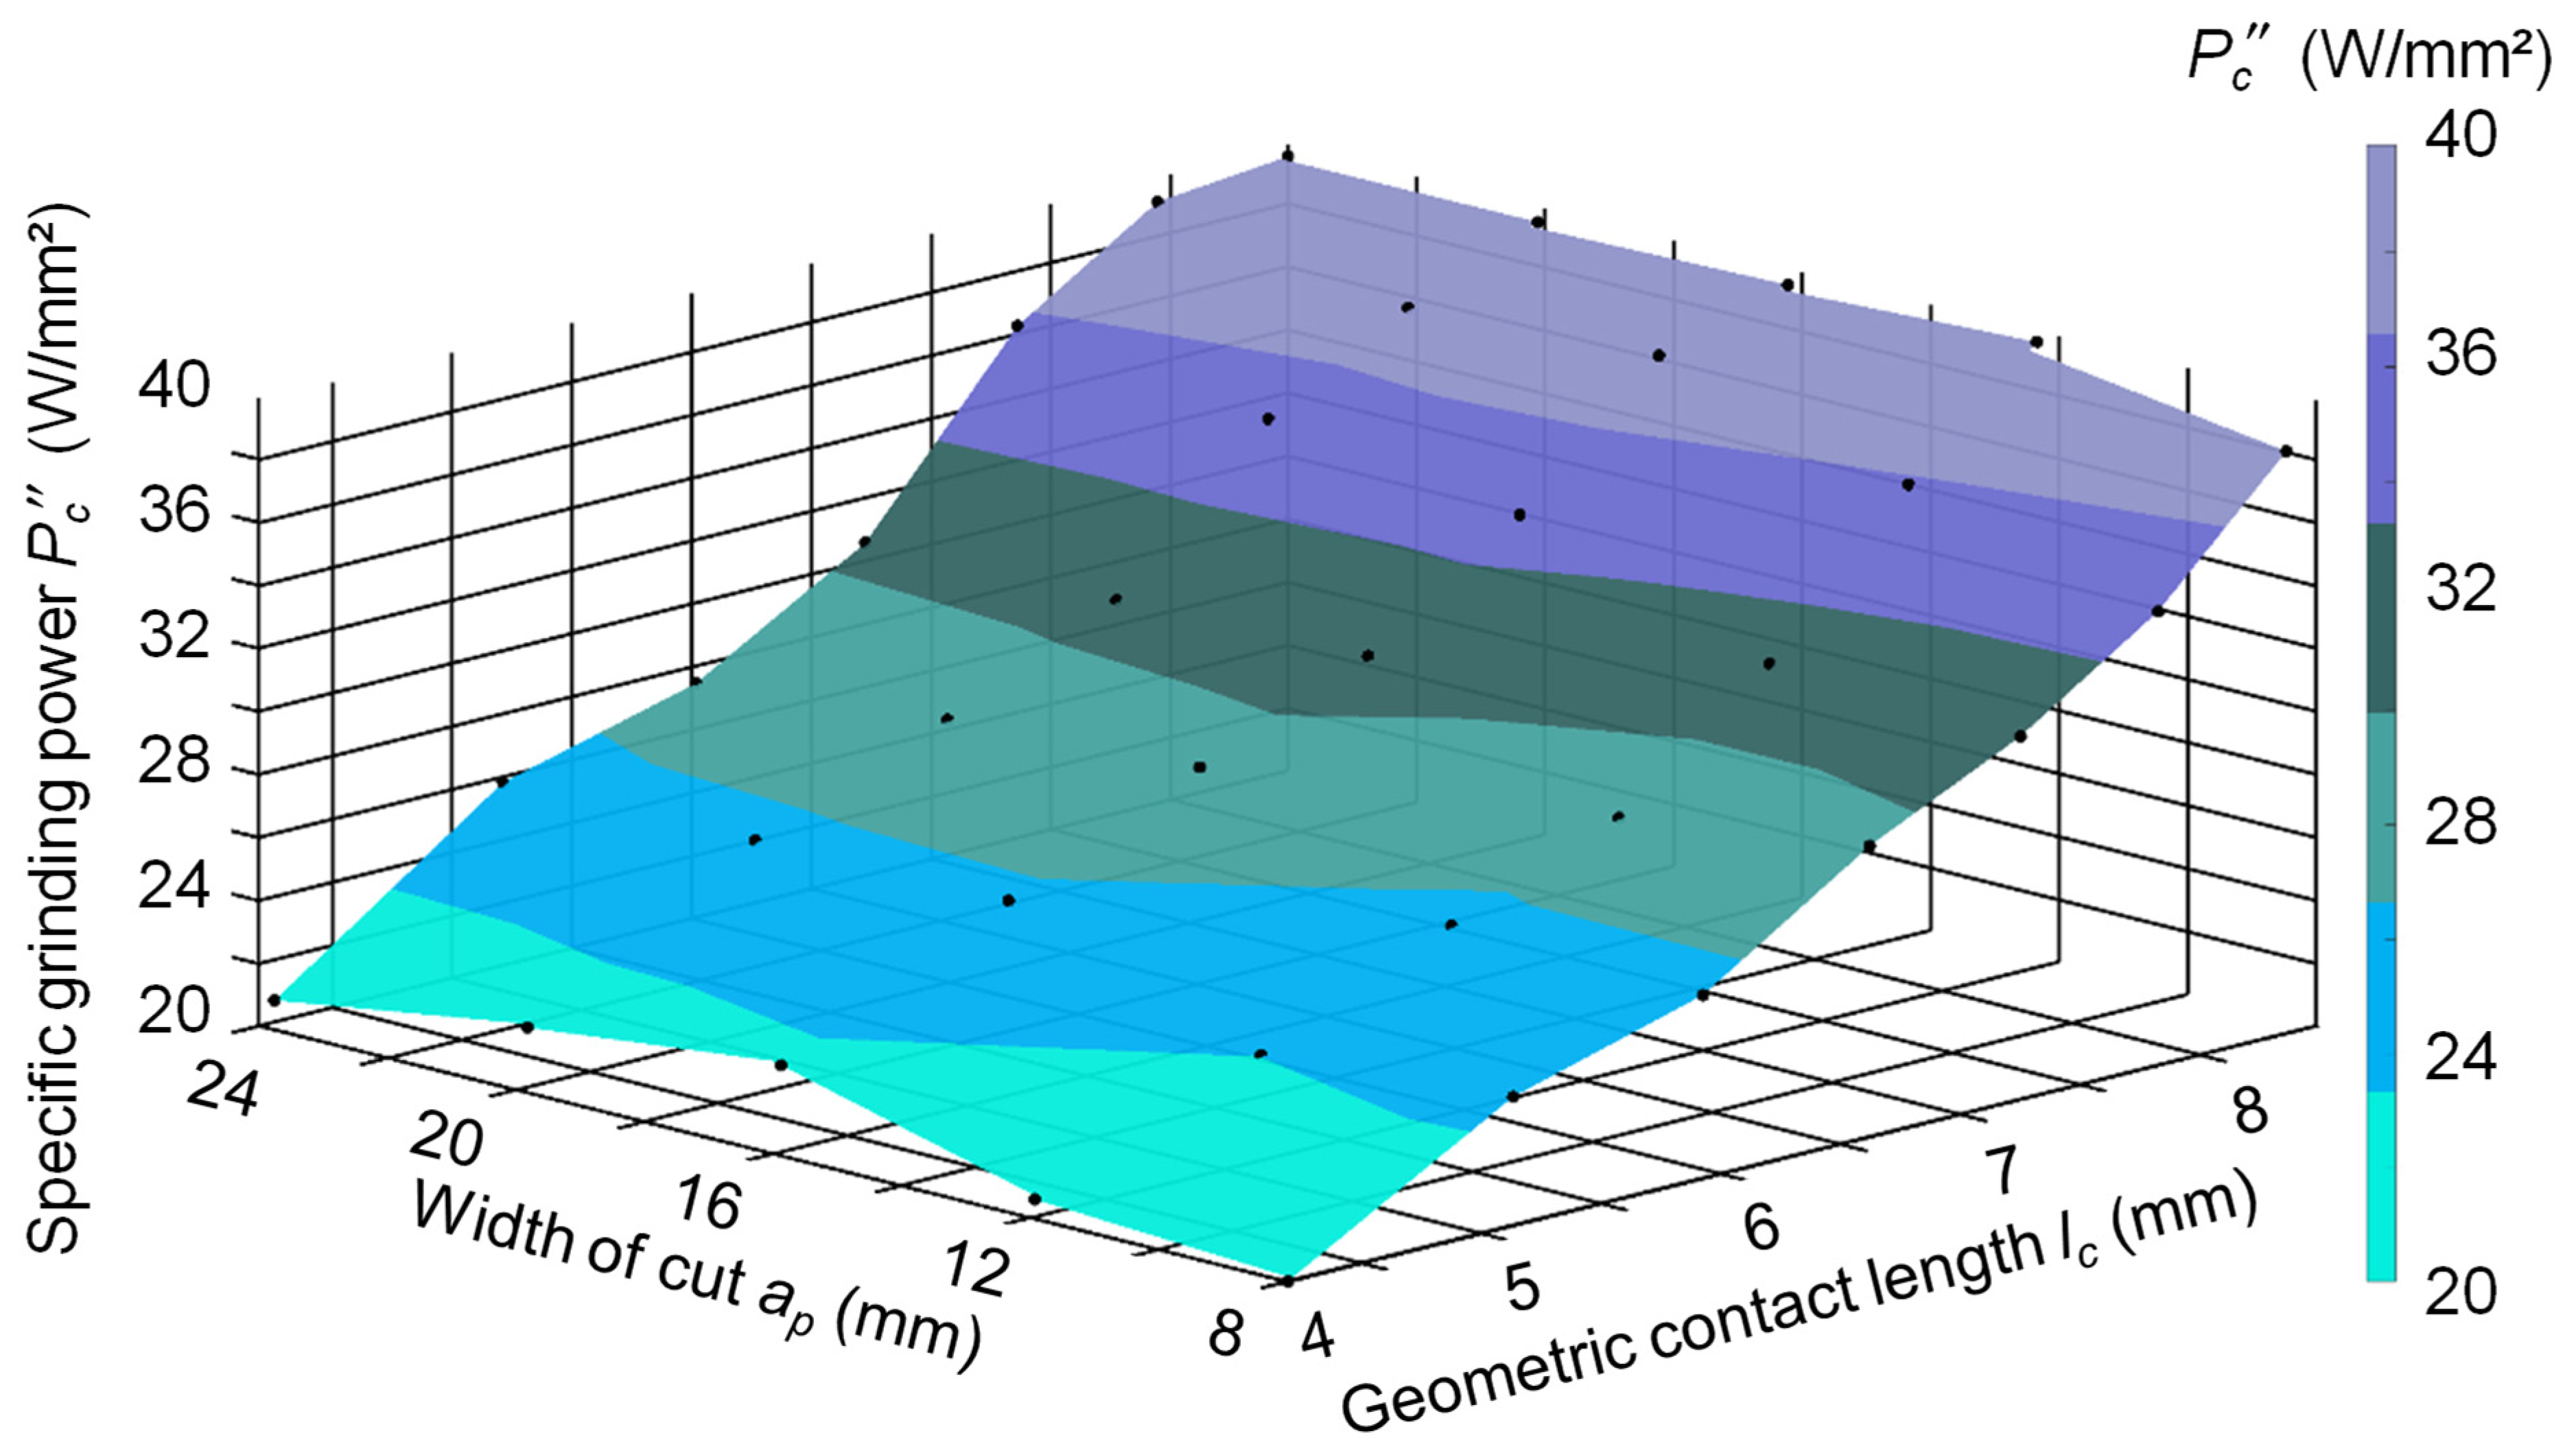
To evaluate the distribution of the specific grinding power Pc (see Equation (1)) within the contact zone (lcap), an analysis was performed along the geometric contact length lc (see Equation (3)) as well as across the width of cut ap. The resulting distribution is illustrated in the three-dimensional diagram shown in Figure 5. An approximately uniform distribution of the specific grinding power is observed across the width of cut ap, while a linear increase is observed along the geometric contact length lc. For constant widths of cut ap, a linear increase in the specific grinding power Pc is obtained with increasing geometric contact length lc. The presented results indicate that no geometrically induced intensification of grinding power occurs within the contact zone. The linear scaling of both tangential forces and specific grinding power with increasing width of cut ap suggests that the energy input is not locally concentrated due to geometric effects. Instead, the grinding power increases proportionally with the engaged contact area (lc · ap).

3.2. Prediction of Grinding Burn Limit

For the prediction of grinding burn limits, the non-destructive detection of thermally induced subsurface modifications, micromagnetic Barkhausen noise analysis was applied. The technique is based on the discontinuous motion of magnetic domain walls under an alternating magnetic field and is highly sensitive to changes in microstructure, hardness and residual stress state in the subsurface region. Since grinding burn is associated with localized tempering or phase transformations as well as characteristic residual stress alterations, Barkhausen noise analysis is particularly suitable for the qualitative and quantitative assessment of thermally induced damage. A correlation between micromagnetic parameters and the position of the grinding burn limit in the Pc″–Δt diagram, thereby enabling a predictive evaluation of grinding burn risk, is established for the width of cut ap.
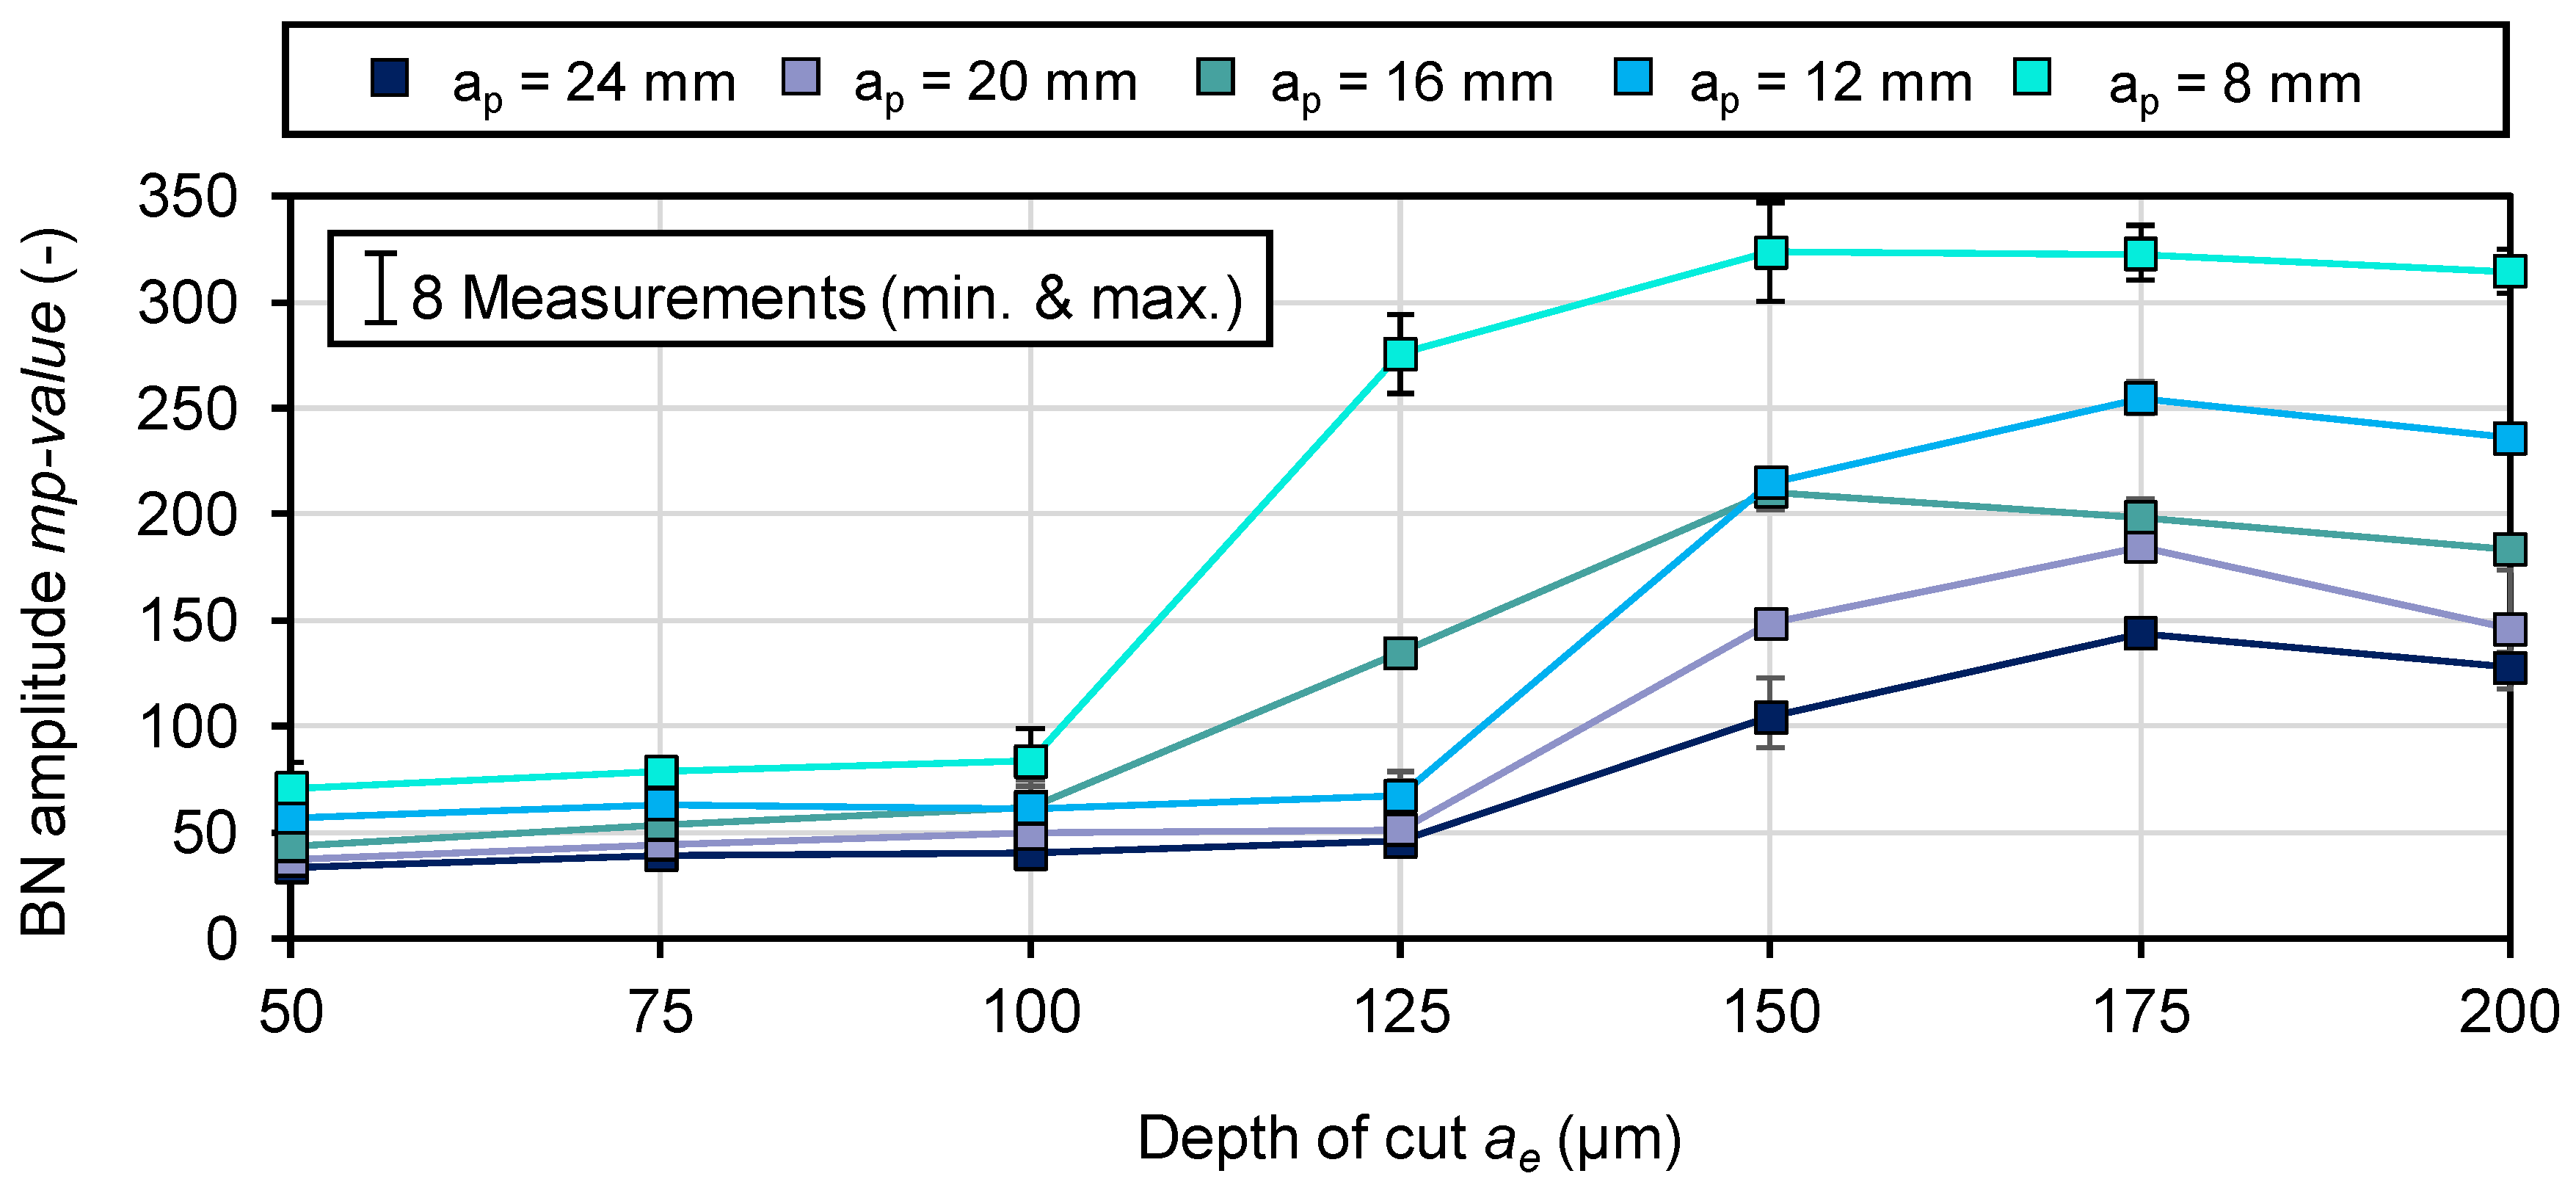
Figure 6 presents the measured Barkhausen noise amplitude as a function of the depth of cut ae for different widths of cut ap. With increasing depth of cut ae, higher thermal loads are introduced into the workpiece, leading to metallurgical modifications in the subsurface region. These changes are reflected in the evolution of the Barkhausen noise amplitude. Up to a depth of cut of ae = 100 μm, a slight increase in the signal amplitude can be observed. Deviations occur depending on the width of cut ap. For smaller widths of cut, higher amplitudes are measured. This effect can be attributed to the reduced rib width, which results in incomplete coverage of the sensor by ferromagnetic material and increased coupling of ambient air into the measurement signal, leading to signal distortion. The observed increase in Barkhausen noise amplitude with decreasing rib width b can be attributed to a reduced effective averaging volume beneath the sensor, resulting in a higher relative contribution of the remaining magnetically active material and an increased weighting of locally affected regions. In addition, the increasing proportion of non-material area within the sensor footprint alters the spatial signal integration, which could further improve the response of the remaining steel volume. It should therefore be noted that a qualitative interpretation of the Barkhausen noise signal in terms of subsurface material modifications is most meaningful when evaluated at constant rib width b or width of cut ap, where the measurement volume and geometric coupling remain unchanged.
At approximately ae = 150 μm, a pronounced increase in amplitude is observed. This increase correlates with enhanced thermal load and the associated tempering effects in the microstructure. The amplitude rise is more pronounced for smaller widths of cut ap. The qualitative signal trend and amplitude level indicate that distinct tempering zones and therefore the formation of grinding burn are present in the subsurface at depths of cut of at least ae = 150 μm. With further increase in depth of cut ae, a slight decrease in amplitude is detected. This behavior suggests intensified tempering with deeper tempering zones Δz and more pronounced hardness reduction, which again modifies the magnetic response of the material.
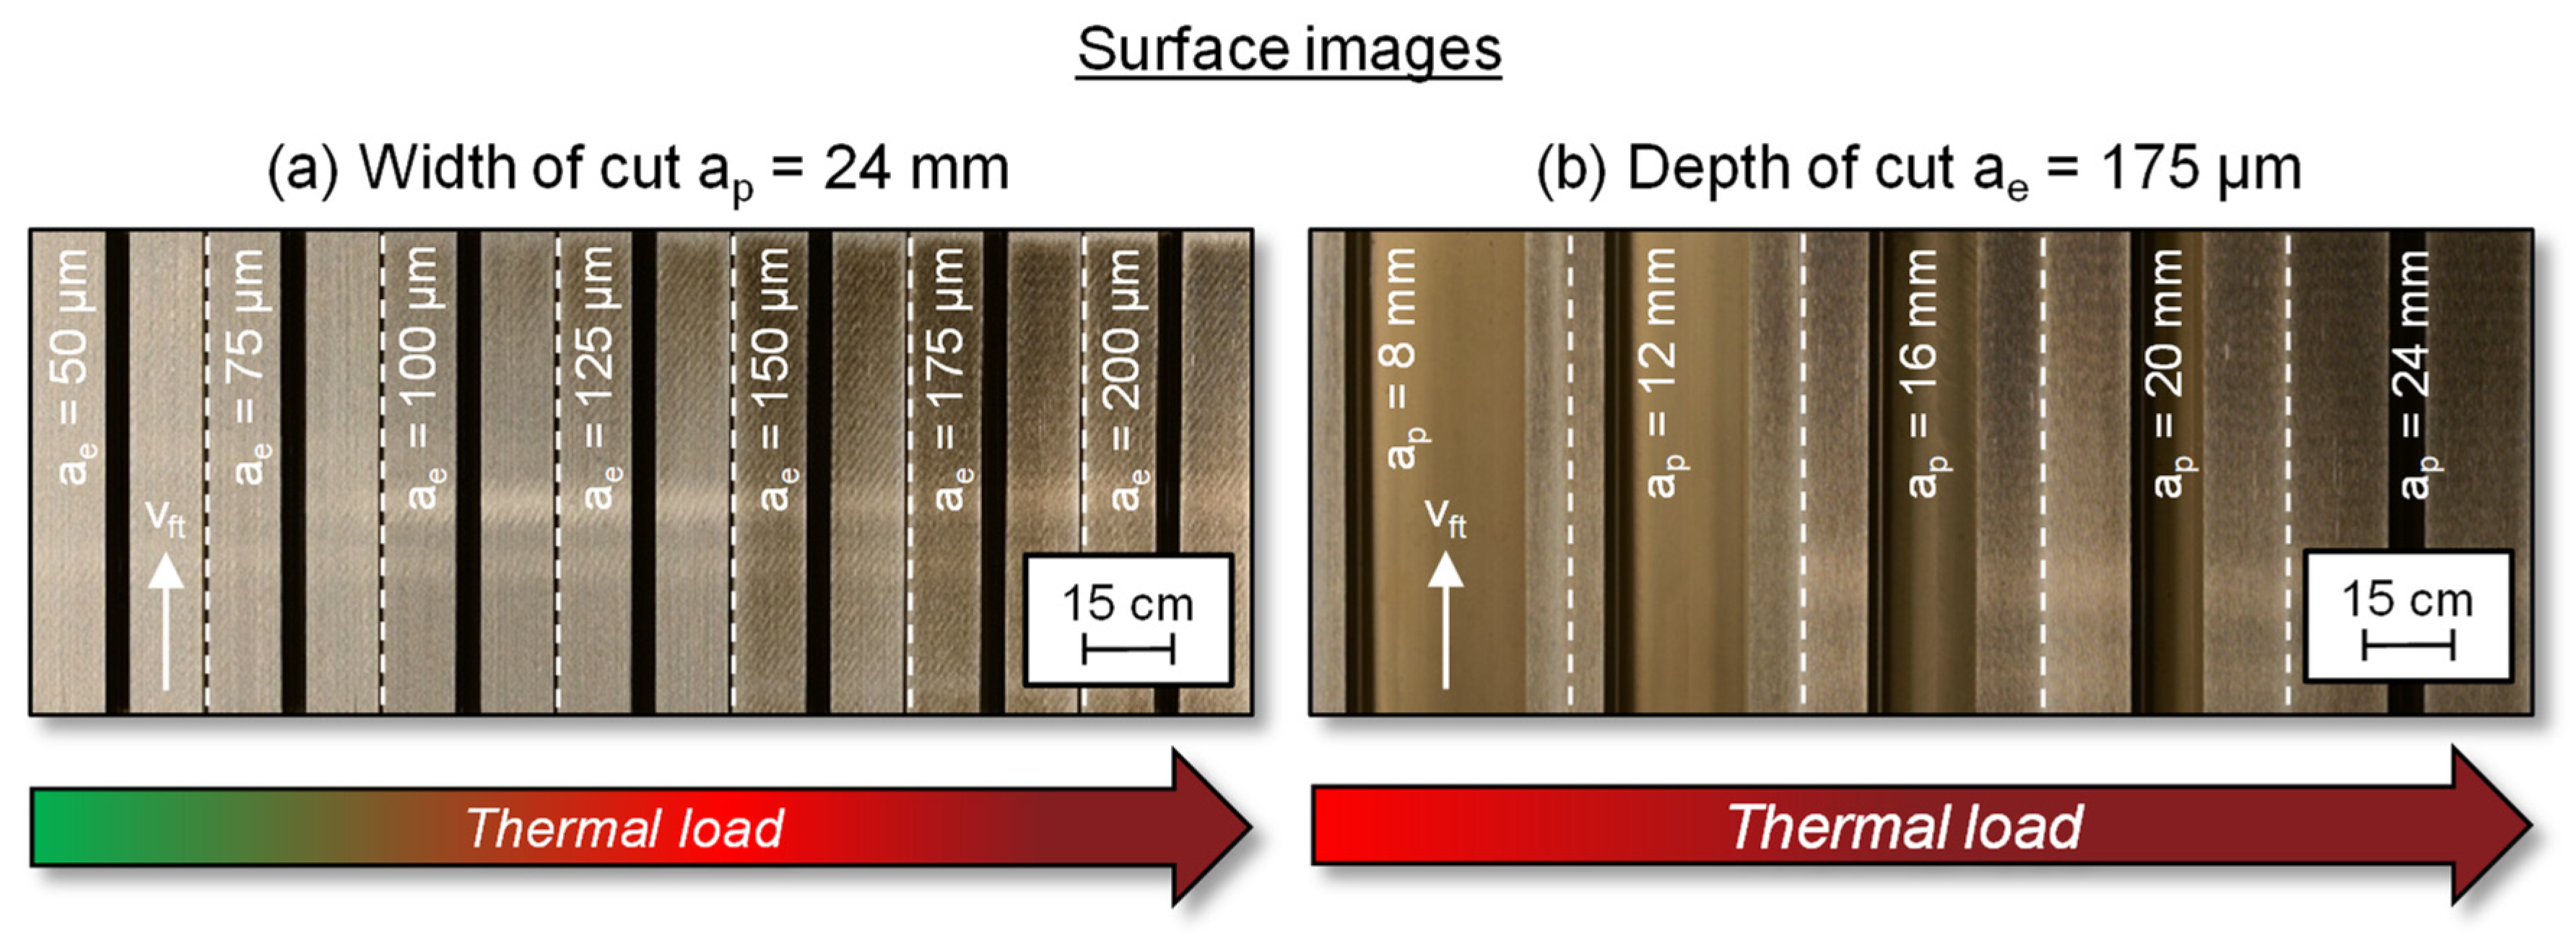
For a visual assessment of the thermal impact of the grinding process, surface images of the ground specimens are presented in Figure 7. Figure 7a illustrates the increase in thermal load at a constant width of cut of ap = 24 mm with increasing depth of cut ae. From a depth of cut of ae = 150 μm onwards, distinct dark discolorations appear on the specimen surface. These discolorations are attributed to temperature-induced oxidation and tempering effects, which are typically associated with significant microstructural softening in the subsurface region. The formation of such tempering zones indicates severe thermal impact and the onset of pronounced grinding burn. The occurrence of these visually detectable burn marks is consistent with the previously observed increase in Barkhausen noise amplitude (Figure 6). The qualitative agreement between the optical surface inspection and the micromagnetic response supports the suitability of Barkhausen noise analysis as a non-destructive indicator for thermally induced subsurface modifications.
Figure 7b exemplarily demonstrates the influence of the width of cut ap at a constant depth of cut of ae = 175 μm. A visual inspection reveals continuous and severe grinding burn across all investigated widths of cut. This indicates that once a critical thermal load is exceeded, the occurrence of grinding burn becomes largely independent of the width of cut ap. Under these conditions, the dominant influencing factor is the overall thermal energy input rather than its geometric distribution within the contact zone. It should be noted, however, that visual surface discoloration provides only qualitative evidence of thermal damage. While it indicates the presence of oxidation and tempering phenomena, it does not allow a direct quantification of the subsurface modification depth. Therefore, complementary metallographic and hardness investigations are carried out to assess the extent and depth of the thermally affected zone Δz.
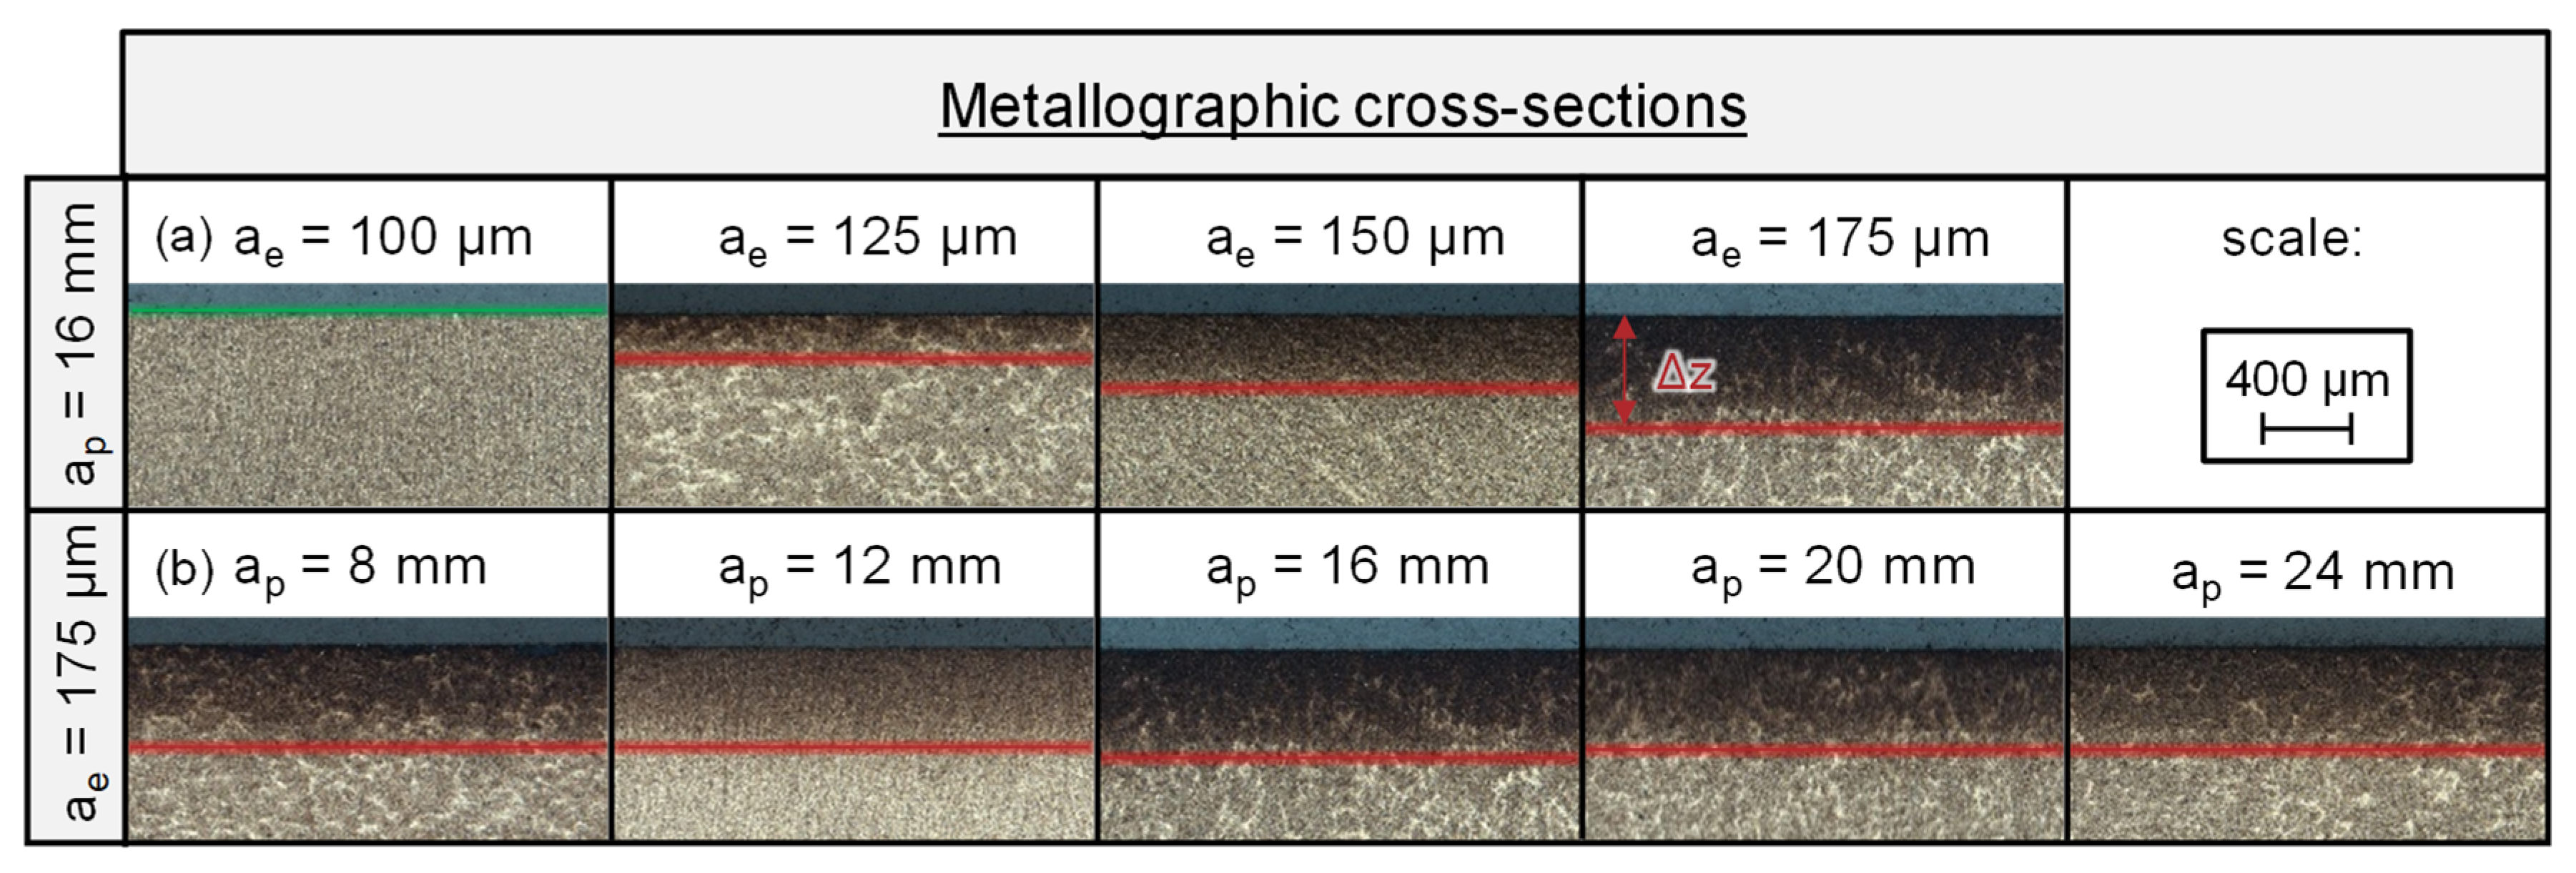
To evaluate the resulting microstructure, the tempering zone depth Δz and the occurrence as well as the exceedance of the grinding burn limit for the material AISI 4140, metallographic cross-sections were prepared perpendicular to the feed direction vft. This approach enables the assessment of subsurface microstructural modifications as a function of the width of cut ap. The corresponding micrographs are presented in Figure 8a. In the present study, the grinding burn limit is defined as the process condition at which a metallographically detectable tempering zone first appears in the subsurface region. This definition allows a reproducible identification of the thermally critical threshold based on microstructural evidence.
Figure 8a exemplarily shows the microstructures for a constant width of cut of ap = 16 mm with increasing depth of cut ae. No distinct tempering zone is observed for ae = 100 μm. However, at ae = 125 μm, the grinding burn limit is exceeded according to the defined criterion, as indicated by the appearance of a tempering zone. With further increase in depth of cut ae, the tempering zone depth Δz increases progressively.
In Figure 8b, the depth of cut is kept constant at ae = 175 μm while varying the width of cut ap. The comparable tempering zone depths observed for all investigated widths of cut suggest a similar depth of thermal influence. While an increase in the width of cut ap leads to higher overall tangential forces Ft (Figure 3a) and consequently greater heat generation, this heat is simultaneously distributed over a larger or wider contact area. The tempering depth is therefore consistent with the previously identified linear scaling of tangential forces (Figure 3b). The results therefore support the assumption of a uniform thermal process limit in the PcΔt diagram.
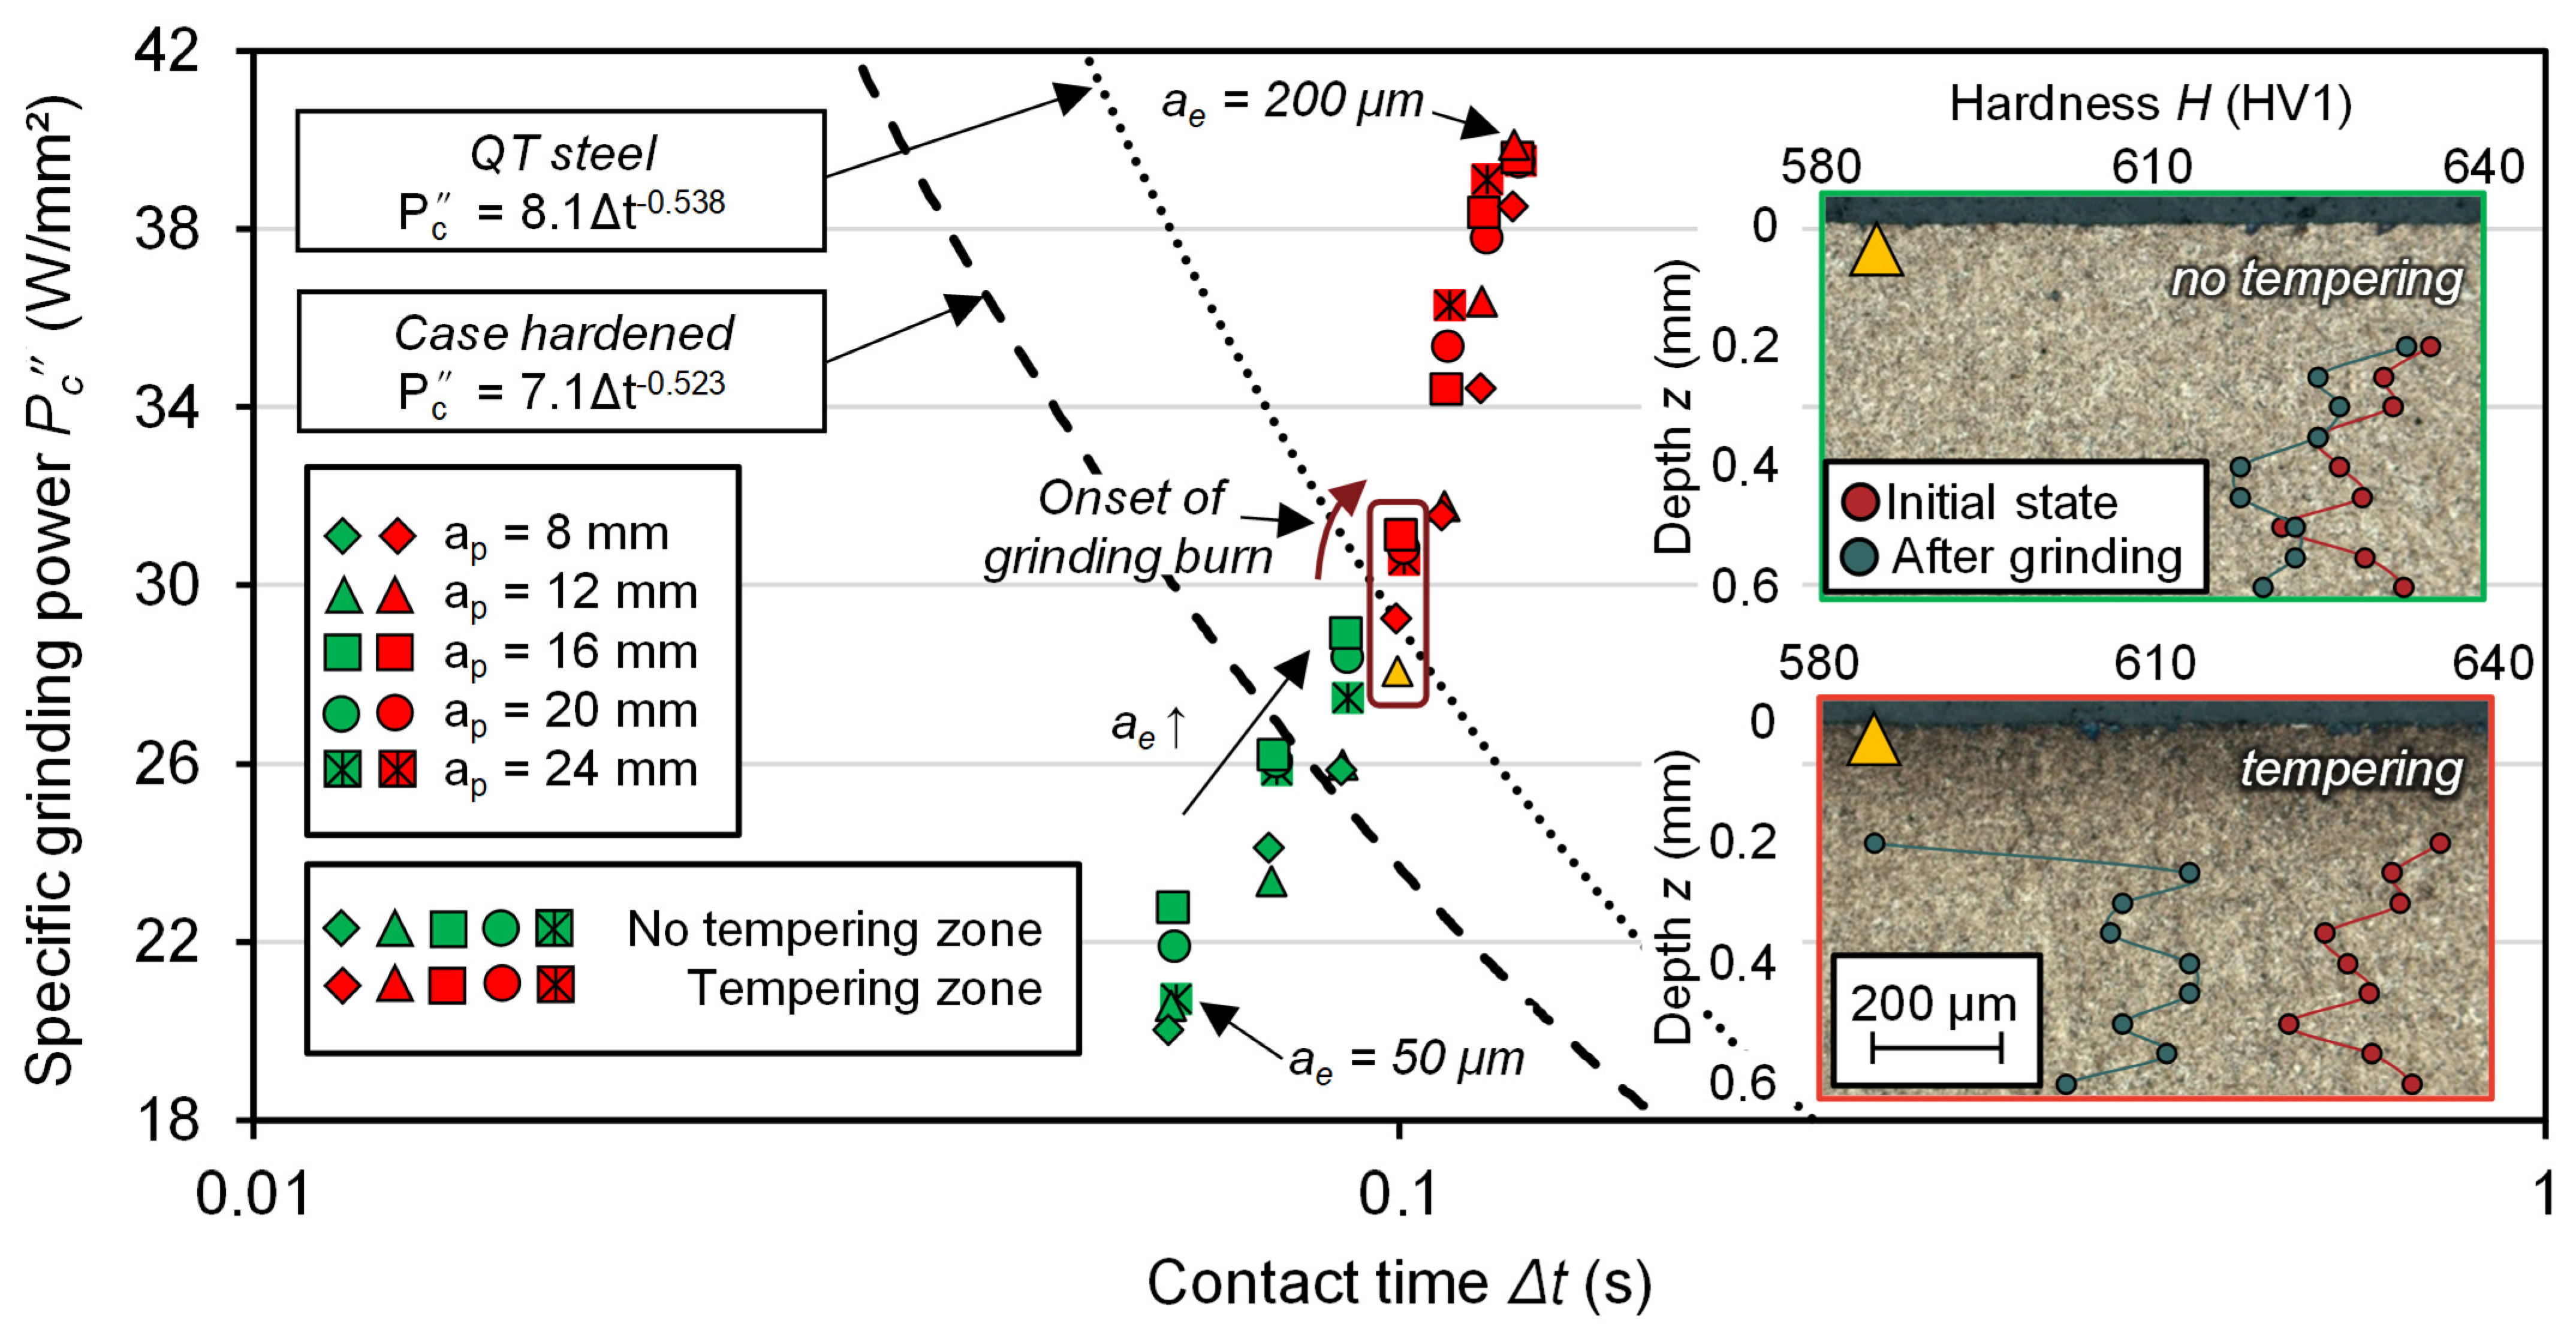
To address the second research question regarding the existence of a unified thermal process limit in the PcΔt diagram, the specific grinding power Pc (Equation (1)) and the contact time Δt (Equation (2)) were calculated for all investigated process points and plotted in the diagram in Figure 9. In addition, the thermal process limit reported by Heinzel [29] for case-hardened steels is included for comparison. A reference thermal process limit for the material under investigation, AISI 4140, was derived from multiple experimental series. A subset of these results has already been reported by Guba [31] and Kuhlmann et al. [43].
The metallographic cross-sections were evaluated for all widths of cut ap with respect to the initial occurrence of grinding burn (occurrence tempering effects). Process points marked with green symbols indicate conditions where no tempering zone could be identified in the metallographic micrographs. In contrast, red symbols denote process points where a tempering zone was detected in the subsurface region. The distribution of the colored process points indicates that the thermal limit for quenched and tempered AISI 4140 represents a consistent process limit that is independent of the width of cut ap. The orange-marked experimental point represents a transitional state. The corresponding specimen exhibits both thermally unaffected material (without tempering zone, upper image) and thermally affected material (with tempering zone, lower image) within the same grinding track. The measured hardness depth profiles after grinding (green curve) further confirm this locally varying thermal impact compared to the initial material condition after heat treatment (red curve). Based on these observations, it is assumed that the orange process point represents a more precise approximation of the actual thermal process limit.

3.3. Surface Integrity and Subsurface Modification Depth

Besides the occurrence of grinding burn, the thermal and mechanical load and the heat exposure time significantly determine the final subsurface properties and the depth of modification of the workpiece. To address the third research question regarding the influence of the width of cut ap on the resulting subsurface properties and modification depths, the following subsection evaluates the surface roughness, tempering zone depth Δz, hardness depth profiles and residual stresses of the ground workpieces.
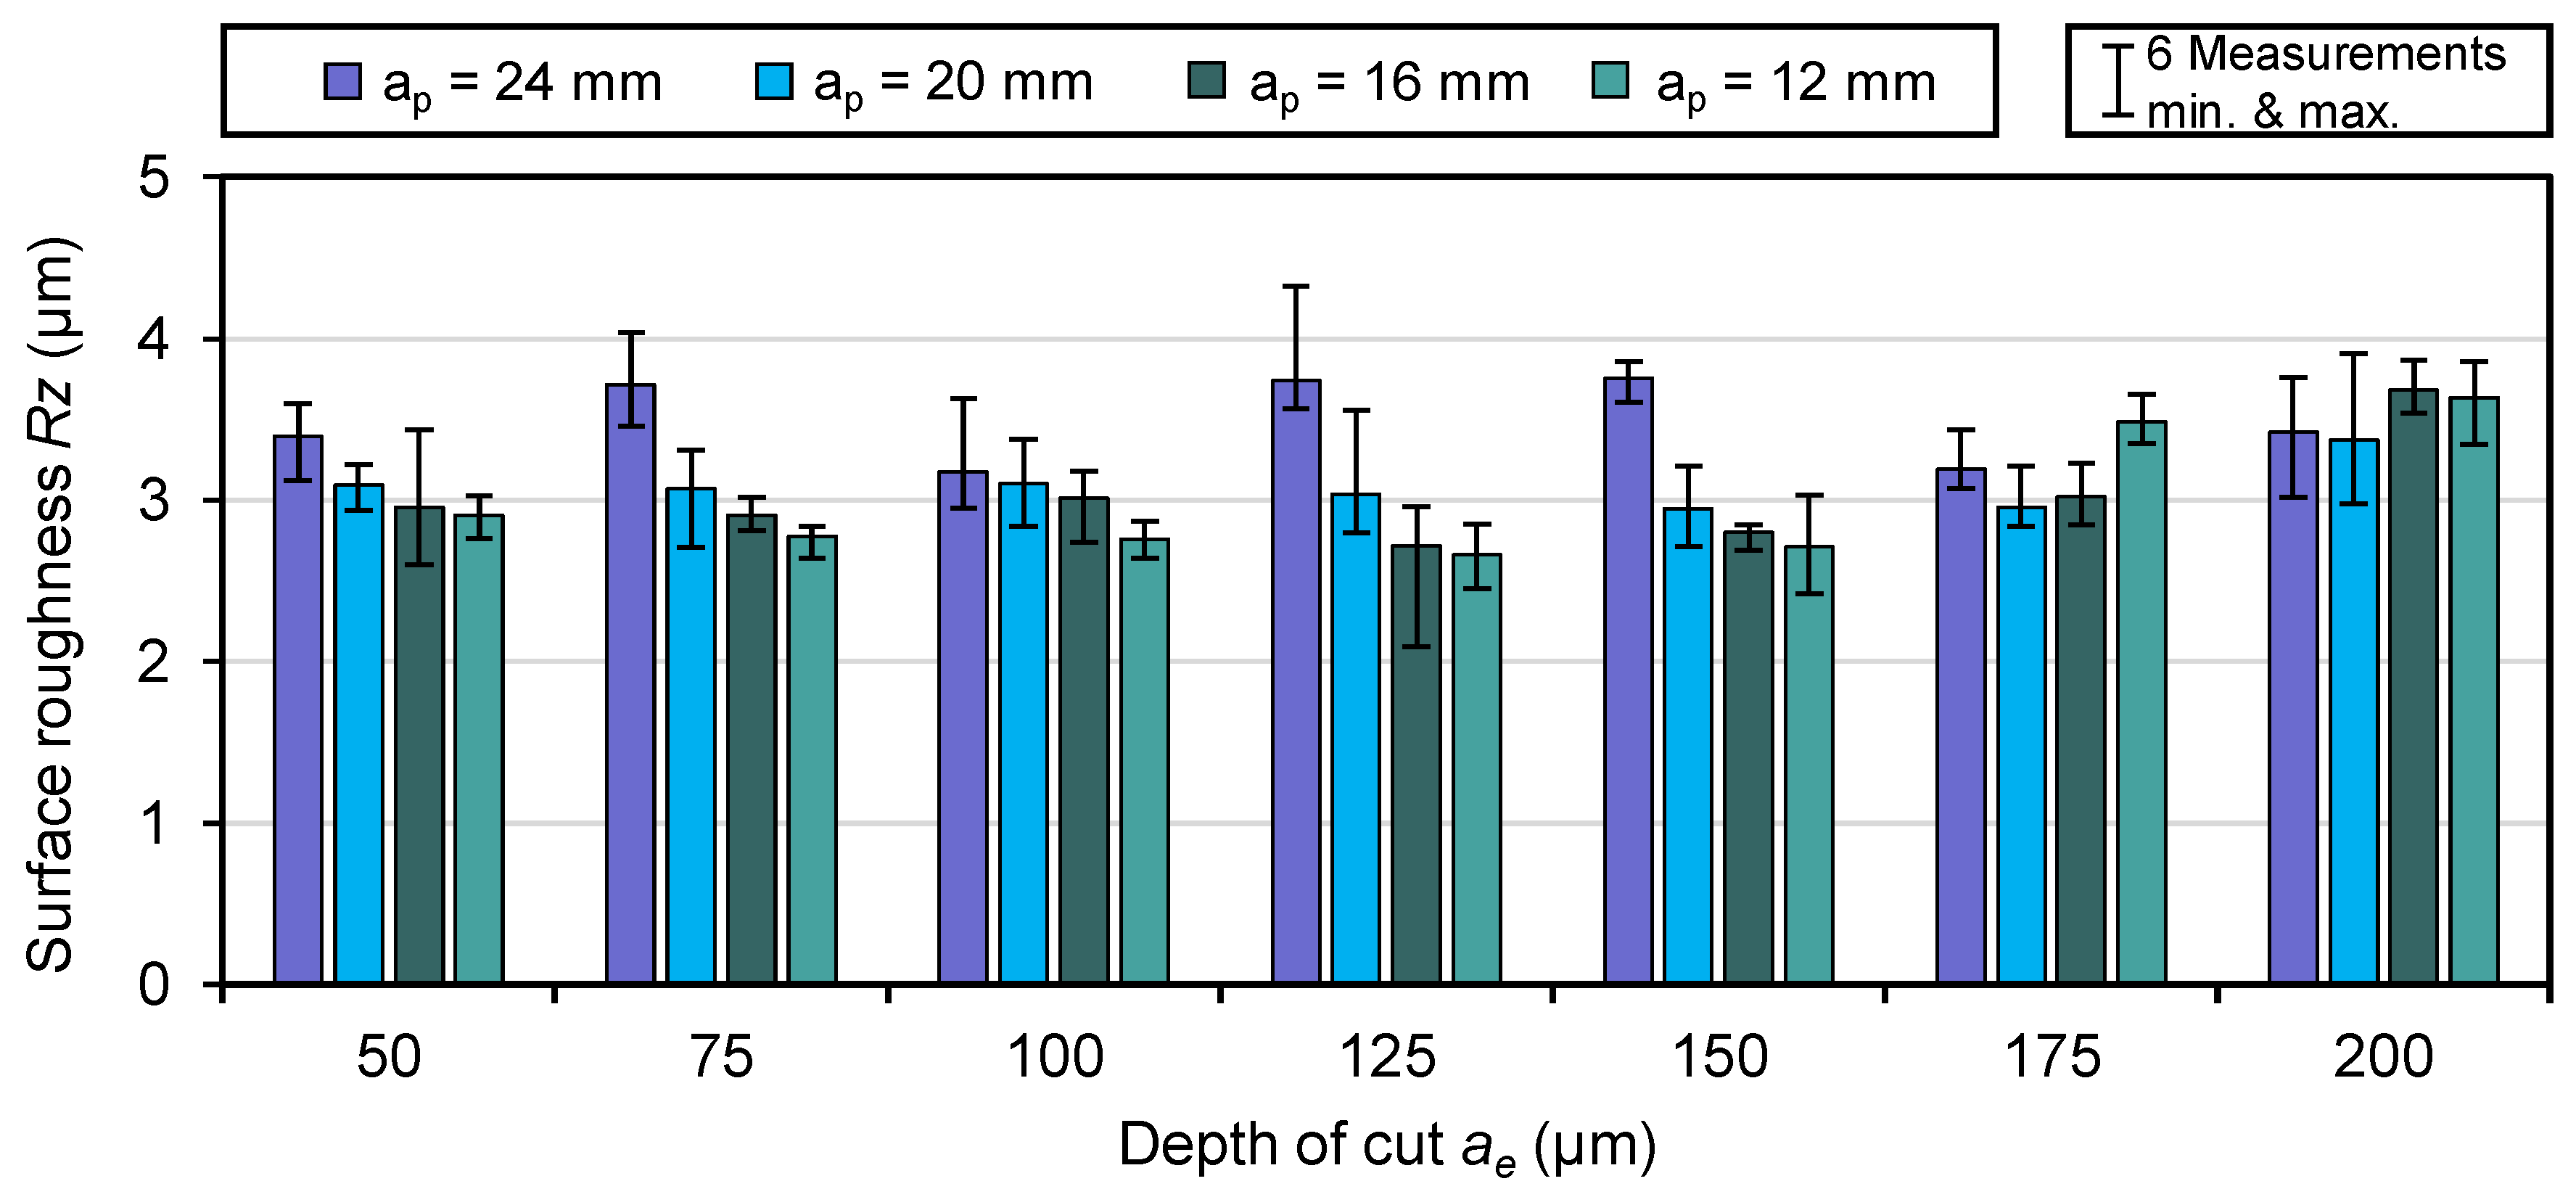
Figure 10 shows the tactilely measured surface roughness Rz with increasing depth of cut ae for four different widths of cut ap. For each of the two ribs, three measurements were conducted perpendicular to the feed direction vft in the center of the workpiece. Surface roughness values for the width of cut ap = 8 mm (rib width 4 mm) could not be determined because the minimum evaluation length required for the measurement was not reached. The measured roughness values indicate that an increase in the depth of cut ae results in a rise in the surface roughness Rz. With increasing depth of cut, the thermomechanical load within the grinding contact zone increases. This elevated load can lead to local plastic deformation, material smearing or the formation of material pile-ups on the surface. Consequently, the surface roughness Rz increases not only due to the purely kinematic influence of the grinding process but also as a result of these thermally induced surface effects.
For a constant depth of cut ae, a tendency towards higher surface roughness values with increasing width of cut ap can be observed. This behavior is attributed to the local lubrication conditions in the grinding contact zone. Smaller widths of cut ap facilitate improved penetration of the coolant–lubricant into the contact zone from the rib sides, which enhances lubrication and cooling conditions. As a result, friction and adhesive interactions between the grinding wheel and the workpiece are reduced, leading to a more stable chip formation process and improved surface quality. However, surface roughness measurements primarily characterize the topographical condition of the workpiece surface and do not provide direct information about thermally induced subsurface modifications. Therefore, further analyses of the tempering zone depth Δz, hardness depth profiles and residual stress profiles are required to evaluate the influence of the width of cut ap on the resulting subsurface modification depth.
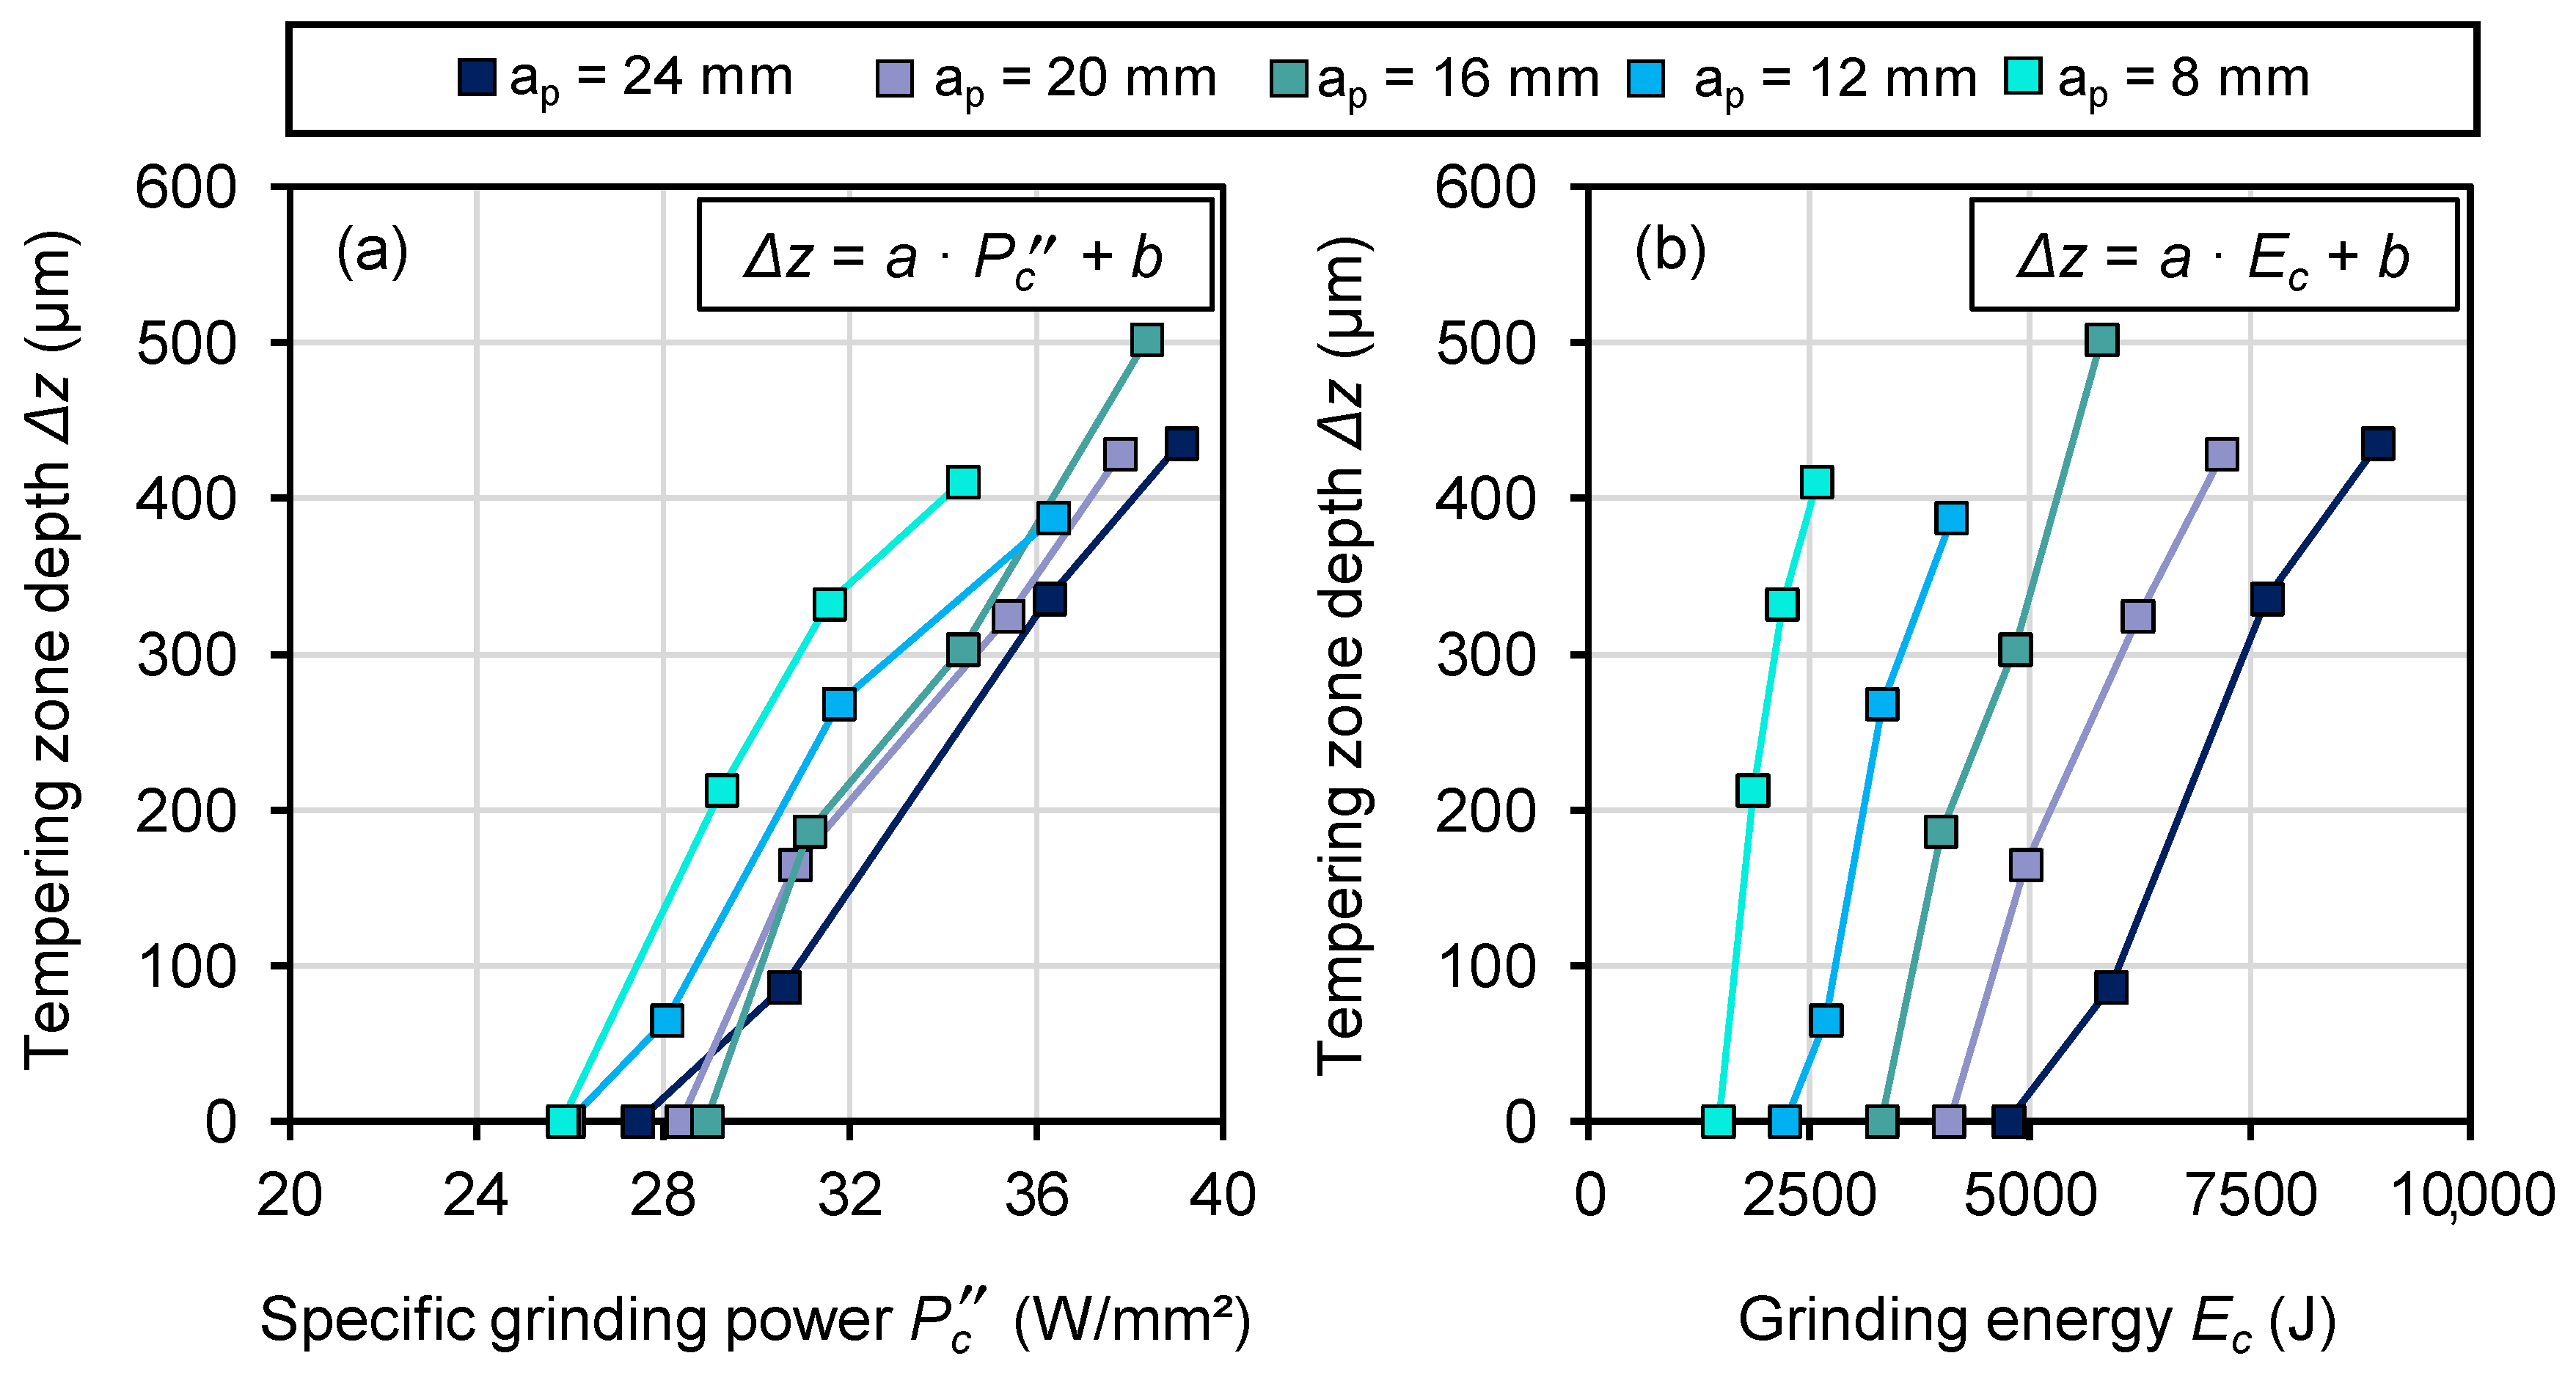
To evaluate the depth of the tempering zone Δz, the metallographic cross-sections (partially shown in Figure 8) were analyzed. For improved identification of the transition between the unaffected base material and the thermally affected subsurface layer, the grayscale contrast of the micrographs was adjusted. Figure 11 presents the determined tempering zone depths Δz as a function of the specific grinding power Pc (Figure 11a) and the grinding energy Ec (Figure 11b). The grinding energy Ec was calculated according to Equation (5), where Vw is the ground material volume.
E c = F t   ·   v c   · V w Q w
Both parameters provide suitable indicators for evaluating the thermal load introduced during the grinding process. In both representations, an approximately linear increase in the tempering zone depth Δz with increasing specific grinding power and energy input can be observed. Furthermore, it becomes apparent that with decreasing width of cut ap, lower values of specific grinding power Pc or grinding energy Ec are sufficient to generate comparable tempering zone depths Δz. This observation indicates that smaller widths of cut ap may lead to a more concentrated thermal load within the grinding contact zone. A possible explanation is the reduced lateral heat dissipation within the workpiece and a modified heat distribution in the grinding contact. Consequently, similar energetic process indicators can result in comparable or even increased subsurface modification depths. In addition, the results indicate a scaling effect associated with the width of cut ap. While the energetic process descriptors Pc and Ec are commonly used to characterize the thermal load in grinding, the present results suggest that geometric engagement conditions influence the effective thermal partitioning within the contact zone. As a result, identical energetic input parameters may lead to different subsurface modification responses depending on the width of cut ap.
To determine the tempering zone depth shown in Figure 11, a regression analysis was conducted as a function of specific grinding power Pc and grinding energy Ec. The underlying linear regression equation is given in Equation (6). For both input variables, a pronounced linear relationship was observed. The high coefficients of determination R2 indicate good agreement between the experimental data and the linear regression model. The corresponding regression coefficients a and b are listed in Table 4.
Δ z = {   a · P c + b   a · E c + b
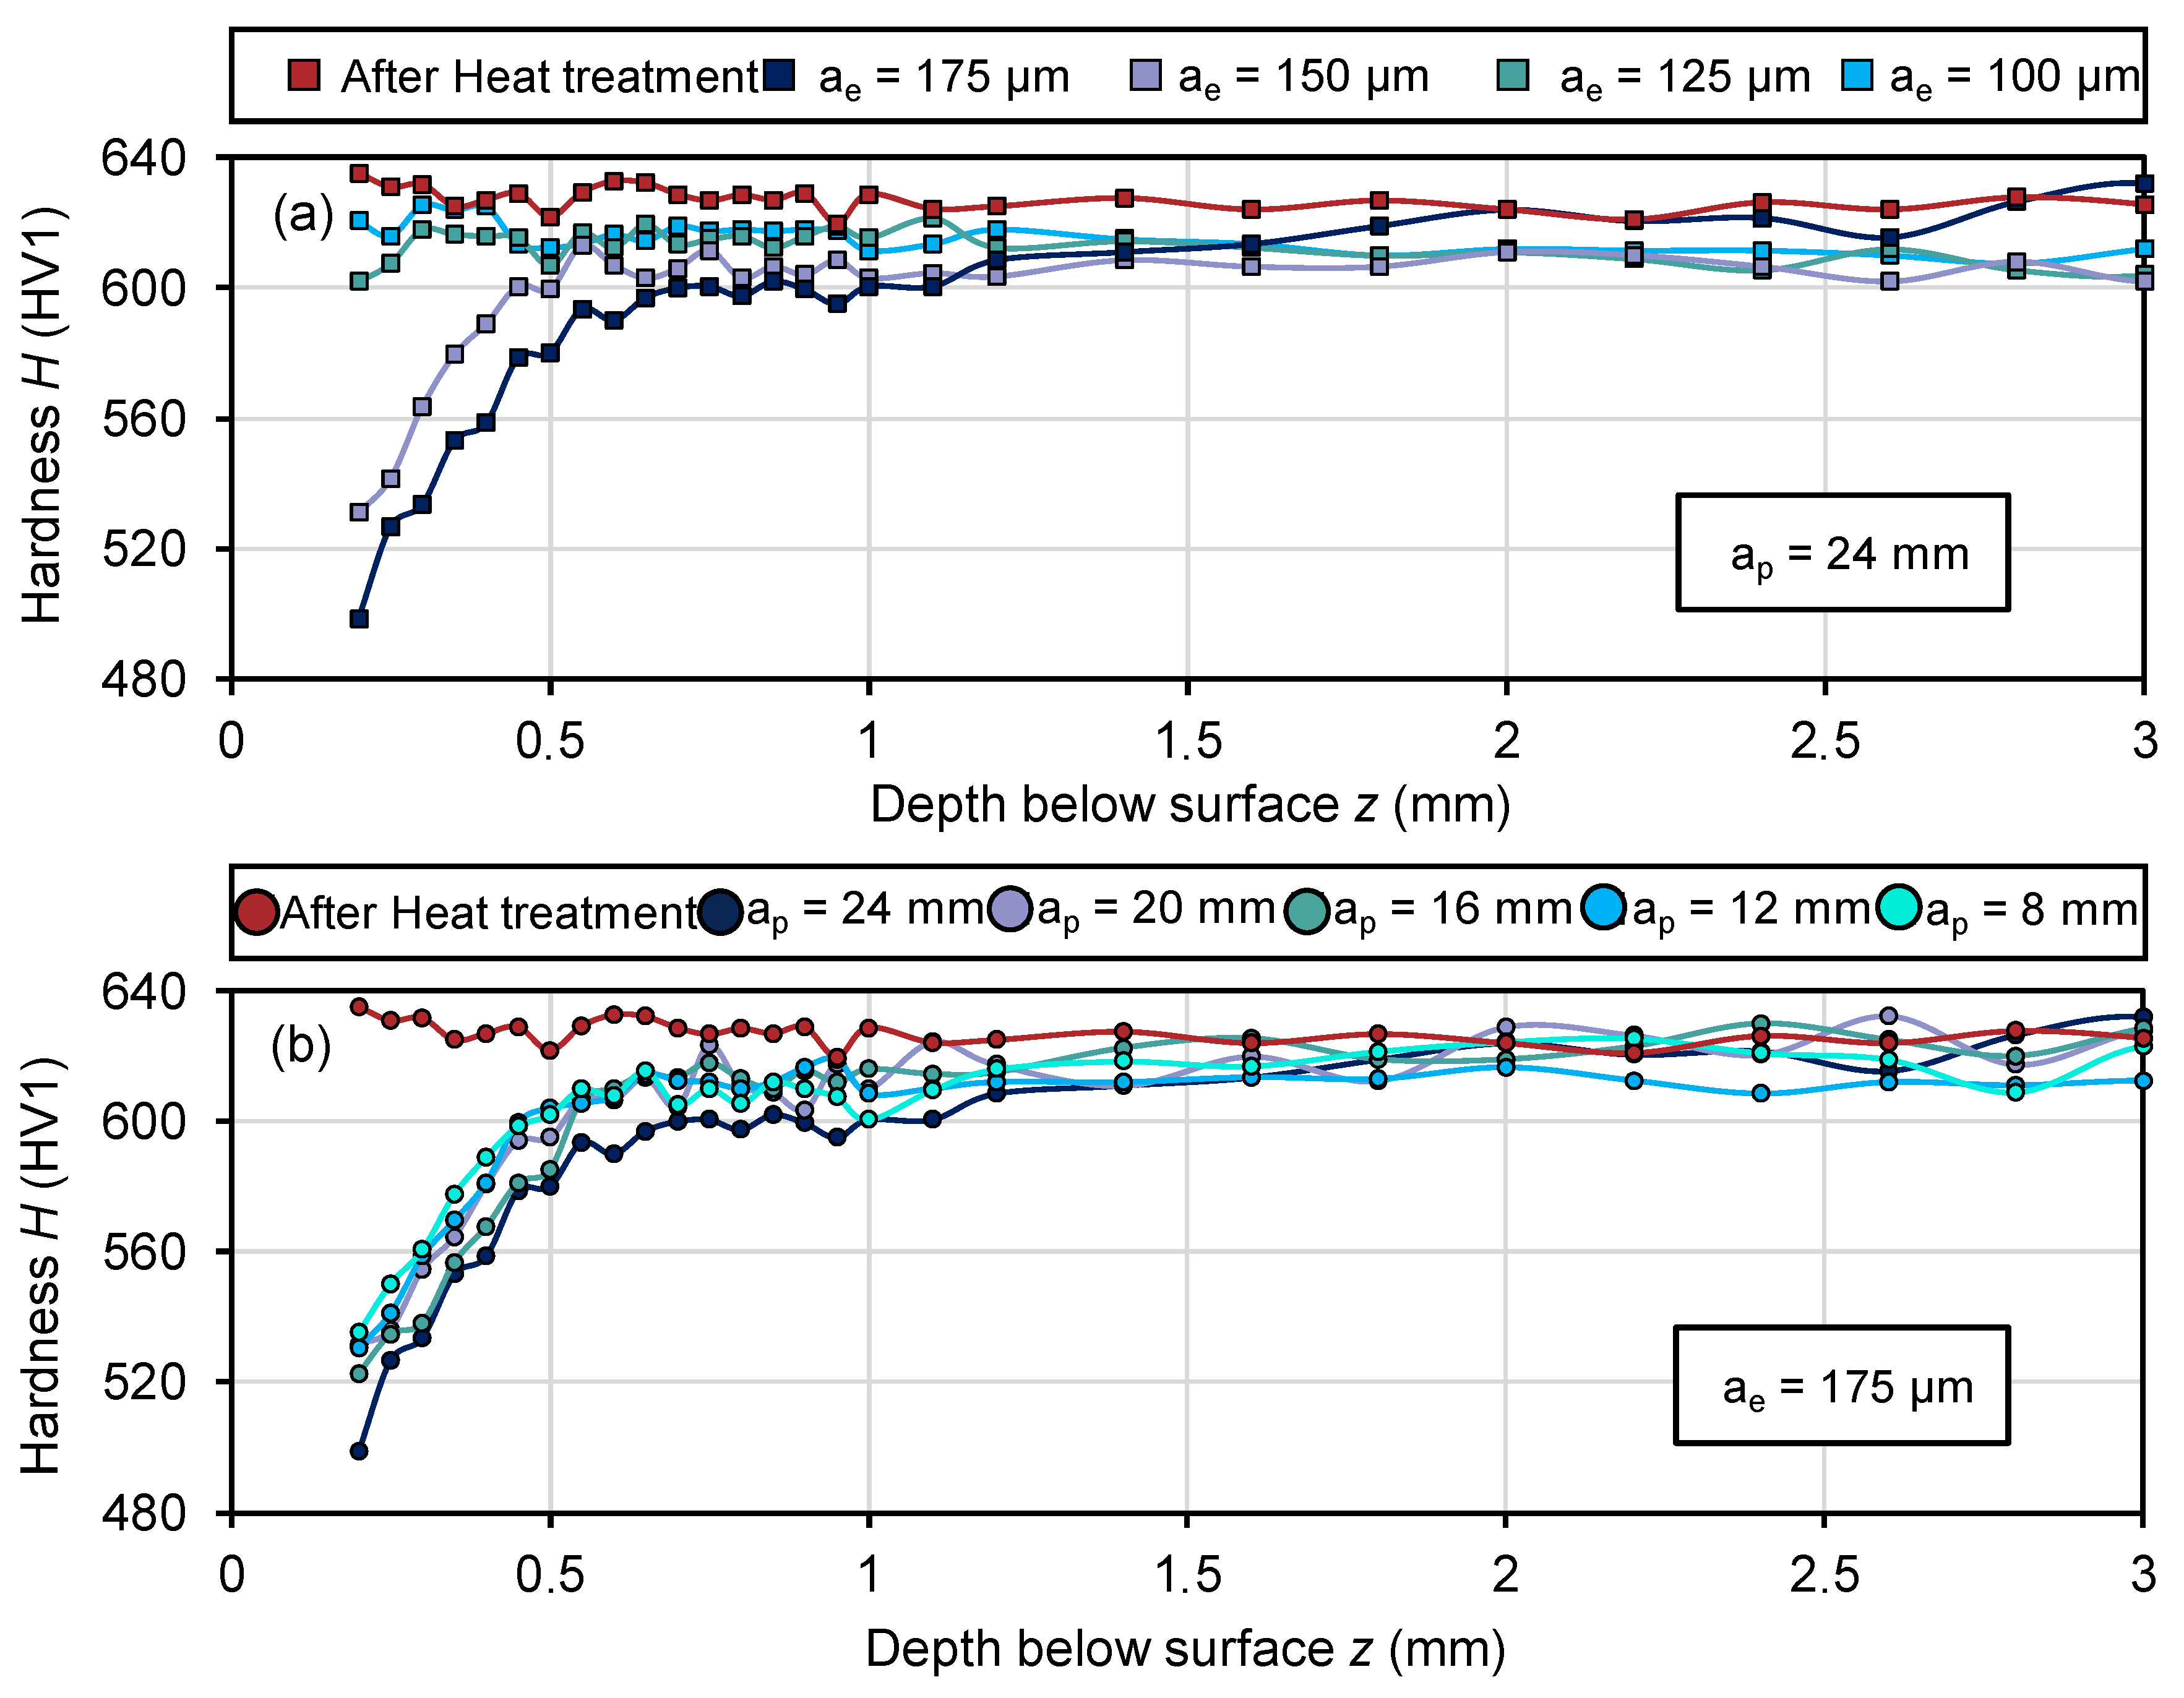
The formation of tempering zones is associated with a thermal overload of the surface layer and a reduction in hardness. To evaluate the thermal load, hardness depth profiles were measured. In both ribs, one hardness depth profile was recorded and the hardness values were averaged at the respective depth. Figure 12a exemplarily shows hardness depth profiles for a constant depth of cut ap = 24 mm with increasing depth of cut ae. The initial hardness state after heat treatment is also shown (red curve). With increasing depth of cut ae, an increase in tangential forces Ft and thus a higher thermal load was observed. This is also reflected in the hardness depth profiles, where a greater reduction in hardness occurs. In addition, higher depths of cut ae lead to a larger depth of hardness modification before the profile approaches the initial hardness of the base material after heat treatment.
Figure 12b shows hardness depth profiles for different widths of cut ap at a constant depth of cut of ae = 175 μm. No clear trend between the width of cut ap and the resulting hardness reduction can be identified. Instead, the hardness reduction follows the applied specific grinding power Pc (see Figure 11). Independent of the width of cut ap, greater surface softening occurs with increasing specific grinding power Pc. This hardness reduction may attribute to induced tempering effects in the martensitic surface layer, which become more pronounced with increasing thermal load.
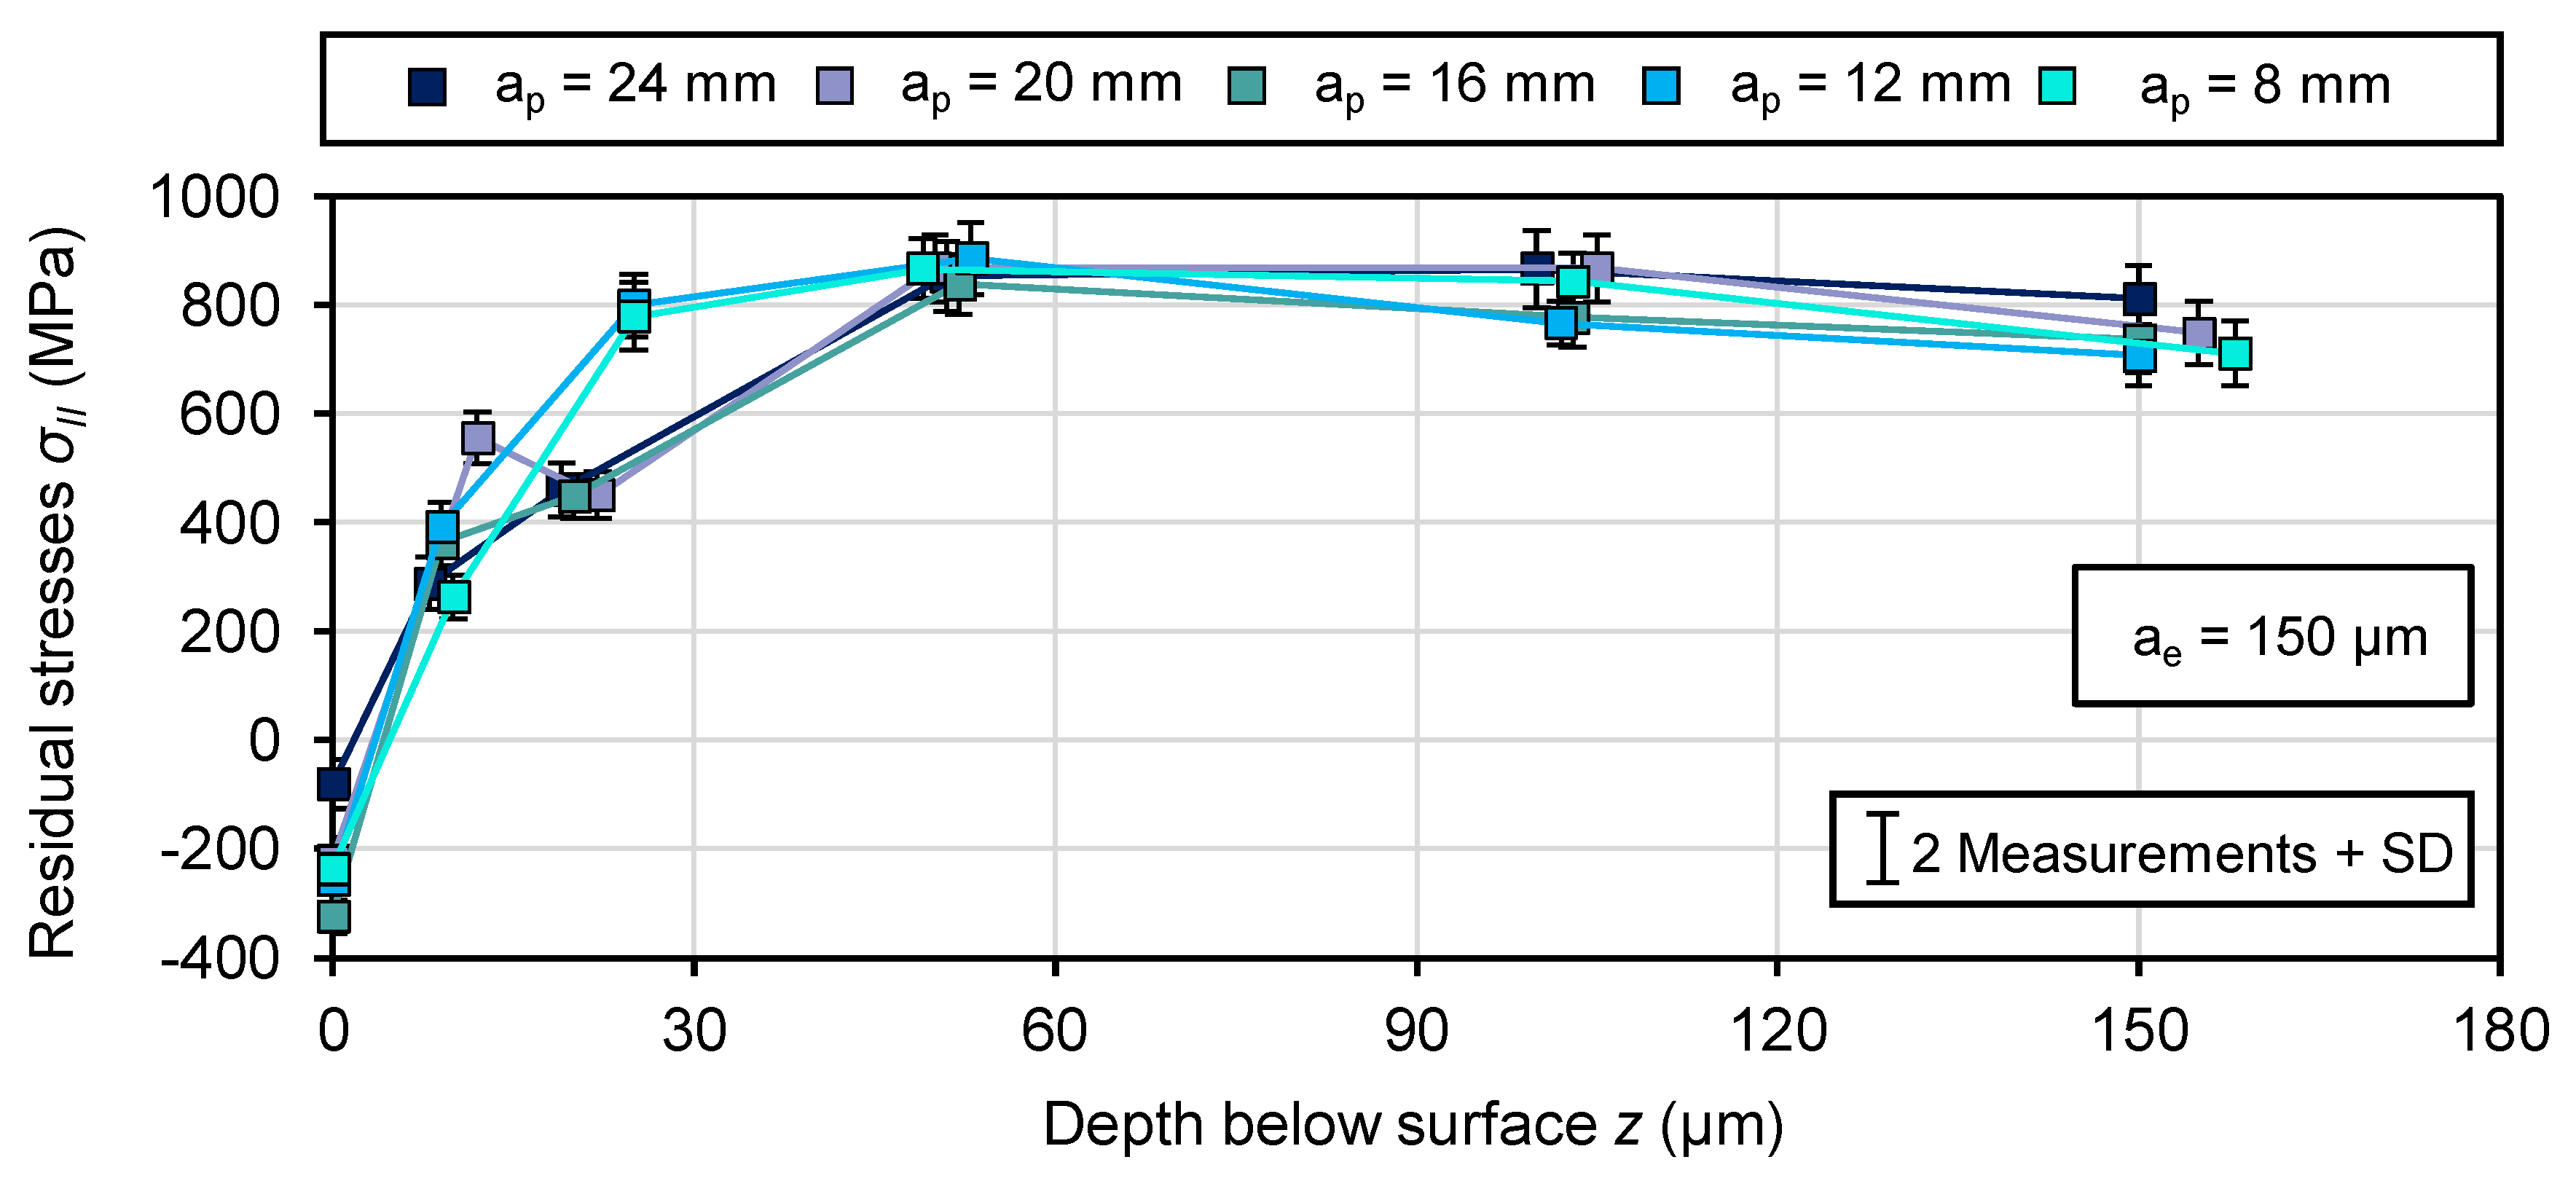
Besides hardness modifications, the thermomechanical loads during grinding also influence the residual stress state in the subsurface layer. While mechanical loads can promote compressive residual stresses, high thermal gradients and tempering effects tend to induce tensile stresses. Therefore, the residual stresses are analyzed in the following paragraphs to further assess the surface integrity of the ground components. Figure 13 shows the measured residual stress depth profiles for different widths of cut ap at a constant depth of cut ae = 150 μm. For each width of cut ap, two measurements were conducted; the error bars indicate the resulting standard deviation (SD).
At the surface, all parameter combinations exhibit compressive residual stresses. With increasing depth below the surface z, the magnitude of compressive residual stresses decreases and approaches the tensile residual stress state of the unaffected base material. The compressive residual stresses generated at the surface must be balanced by tensile residual stresses in the subsurface to satisfy mechanical equilibrium. Consequently, the residual stress profile typically changes from compressive stresses near the surface to tensile stresses at greater depths before gradually approaching zero [44]. Only a minor influence of the width of cut ap on the overall residual stress distribution can be observed. The curves for the different widths of cut ap show a very similar progression and comparable depths of the compressive stress maximum. This indicates that, at a constant depth of cut ae, the thermomechanical load of the subsurface is primarily governed by the process energy input rather than the engagement width itself. This can likely be attributed to the fact that, although the generated heat increases due to the larger material removal volume, it is simultaneously distributed over a larger contact area, resulting in a lower local thermal load [45]. Slight differences can be observed in the surface region, where smaller widths of cut ap tend to result in somewhat higher compressive residual stresses. This may be attributed to an improved penetration of the coolant into the contact zone at smaller widths of cut ap, which reduces friction and thermal load. This observation is consistent with the previously discussed hardness depth profiles, where the magnitude of softening was mainly correlated with the specific grinding power Pc rather than with the width of cut ap alone.

4. Discussion

The experimental results indicate that the thermomechanical load in the grinding process is primarily governed by the total energy input into the contact zone. Although the grinding forces increase with increasing width of cut ap and depth of cut ae, the specific values normalized to the width of cut ap remain relatively constant. This suggests that the local load intensity within the contact zone does not significantly depend on the width of cut ap. Consequently, the specific grinding power Pc is distributed uniformly across the width of cut ap and increases linearly along the geometrical contact length lc. This observation implies that the thermal load generated during grinding is not locally intensified by geometric effects but scales mainly with the effective contact area. The metallographic analyses, Barkhausen noise measurements, hardness profiles and residual stresses consistently show that the occurrence of grinding burn and the depth of tempering zones Δz correlate primarily with the applied process energy rather than with the width of cut ap itself.
Within the investigated parameter range, the onset of grinding burn can therefore be described by a material-specific thermal process limit in the PcΔt diagram that appears independent of the width of cut ap. From a broader perspective, these findings support the applicability of energy-based process descriptions for predicting thermal damage in grinding. Future work may focus on refining the understanding of local heat generation and heat transport mechanisms within the grinding contact zone in order to further improve predictive grinding burn models. A limitation of the present study is that the tangential feed velocity vft and the cutting speed vc were kept constant throughout all experiments. Consequently, the resulting contact time range Δt remained implicitly coupled to the chosen geometric process parameters and was not independently varied. In addition, both the grinding wheel specification and the coolant strategy were held constant, although these parameters are known to significantly influence heat generation, heat partitioning and the resulting thermomechanical load in the grinding contact zone. Future work should therefore address a systematic variation in these process-relevant parameters. In particular, changes in grinding wheel specification as well as coolant supply conditions are expected to alter the heat generation mechanisms and the heat partition ratio between workpiece, grinding wheel and chips. A comprehensive investigation of these coupled effects would enable a more detailed understanding of heat partitioning and its direct influence on grinding burn initiation and subsurface material modification.

5. Conclusions

The present study analyzed the influence of the width of cut ap on the thermomechanical load conditions during grinding of quenched and tempered AISI 4140. Grinding forces, the specific grinding power Pc, Barkhausen noise measurements, metallographic investigations, hardness and residual stresses were evaluated. The results were used to assess whether a uniform thermal process limit exists in the PcΔt diagram independent of the width of cut ap. In addition, the influence of the process parameters on grinding burn formation and subsurface modification and its depth effects were examined.
The main findings can be summarized as follows:
  • The tangential and normal grinding forces increased proportionally with both width of cut ap and depth of cut ae. When normalized to the width of cut, the forces (Ft and Fn) remained nearly constant, indicating an approximately uniform load distribution across the width of cut ap.
  • The specific grinding power Pc was found to be distributed nearly uniformly across the width of cut ap and to increase linearly along the geometric contact length lc.
  • Barkhausen noise measurements, visual surface inspection and metallographic analyses consistently identified the onset of thermally induced tempering effects at comparable process conditions.
  • The experimentally determined grinding burn threshold corresponded well with the thermal process limit previously proposed for quenched and tempered AISI 4140. The results indicate that the position of the grinding burn limit in the PcΔt diagram is independent of the width of cut ap.
  • Increasing thermal load resulted in progressively larger tempering zone depths Δz, stronger hardness reductions and more pronounced subsurface modifications.
  • Hardness depth profiles demonstrated that increasing thermal load not only intensified surface softening but also increased the depth of the affected subsurface region.
  • Residual stress depth profiles showed compressive residual stresses at the surface for all investigated conditions. Only minor differences between the investigated widths of cut were observed, indicating that residual stress formation is primarily controlled by process energy input rather than by the engagement width itself.

Author Contributions

Conceptualization, G.K., L.L. and C.H.; methodology, G.K.; validation, G.K. and L.L.; formal analysis, G.K., L.L. and T.H.; investigation, G.K.; resources, C.H. and B.K.; data curation, G.K.; writing—original draft preparation, G.K.; writing—review and editing, G.K., L.L., T.H., C.H. and B.K.; visualization, G.K.; supervision, T.H., C.H. and B.K.; project administration, C.H.; funding acquisition, T.H. and C.H. All authors have read and agreed to the published version of the manuscript.

Funding

This research was funded by Deutsche Forschungsgemeinschaft (DFG, German Research Foundation), grant number 508491085.

Data Availability Statement

The raw data supporting the conclusions of this article will be made available by the authors on request.

Conflicts of Interest

The authors declare no conflicts of interest.

References

  1. Brinksmeier, E.; Meyer, D.; Heinzel, C.; Lübben, T.; Sölter, J.; Langenhorst, L.; Frerichs, F.; Kämmler, J.; Kohls, E.; Kuschel, S. Process signatures—The missing link to predict surface integrity in machining. Procedia CIRP 2018, 71, 3–10. [Google Scholar] [CrossRef]
  2. Hashimoto, F.; Yamaguchi, H.; Krajnik, P.; Wegener, K.; Chaudhari, H.; Hoffmeister, H.-W.; Kuster, F. Abrasive fine-finishing technology. CIRP Ann. 2016, 65, 597–620. [Google Scholar] [CrossRef]
  3. Malkin, S.; Guo, C. Thermal analysis of grinding. CIRP Ann. 2007, 56, 760–782. [Google Scholar] [CrossRef]
  4. Karpuschewski, B.; Bleicher, O.; Beutner, M. Surface integrity inspection on gears using Barkhausen noise analysis. Procedia Eng. 2010, 19, 162–171. [Google Scholar] [CrossRef]
  5. Krajnik, P.; Drazumeric, R.; Badger, J.; Hashimoto, F. Cycle optimization in cam-lobe grinding for high productivity. CIRP Ann. 2014, 63, 333–336. [Google Scholar] [CrossRef]
  6. Kukla, D.; Kopec, M.; Gradzik, A. Identification and characterization of the grinding burns by eddy current method. Open Eng. 2022, 12, 1046–1050. [Google Scholar] [CrossRef]
  7. Hou, Z.B.; Komanduri, R. On the mechanics of the grinding process. Part II—Thermal analysis of fine grinding. Int. J. Mach. Tools Manuf. 2004, 44, 247–270. [Google Scholar] [CrossRef]
  8. Stephenson, D.J.; Jin, T. Physical basics in grinding. In Proceedings of the 1st European Conference on Grinding, Aachen, Germany, 6–7 November 2003. [Google Scholar]
  9. Snoeys, R.; Maris, M.; Peters, J. Thermally induced damage in grinding. CIRP Ann. 1978, 27, 571–581. [Google Scholar]
  10. Shaw, M.C.; Vyas, A. Heat-affected zones in grinding steel. CIRP Ann. 1994, 43, 279–282. [Google Scholar] [CrossRef]
  11. Jawahir, I.S.; Brinksmeier, E.; Saoubi, R.M.; Aspinwall, D.K.; Outeiro, J.C.; Meyer, D.; Umbrello, D.; Jayal, A.D. Surface integrity in material removal processes: Recent advances. CIRP Ann. 2011, 60, 603–626. [Google Scholar] [CrossRef]
  12. Field, M.; Koster, W. Optimizing grinding parameters to combine high productivity with high surface integrity. CIRP Ann. 1978, 27, 523–526. [Google Scholar]
  13. He, B.; Wei, C.; Ding, S.; Shi, Z. A survey of methods for detecting metallic grinding burn. Measurement 2019, 134, 426–439. [Google Scholar] [CrossRef]
  14. Oliveira, J.F.G.; Silva, E.J.; Guo, C.; Hashimoto, F. Industrial challenges in grinding. CIRP Ann. 2009, 58, 663–680. [Google Scholar] [CrossRef]
  15. Rowe, W.B. Towards high productivity in precision grinding. Inventions 2018, 3, 24. [Google Scholar] [CrossRef]
  16. Duscha, M.; Eser, A.; Klocke, F.; Broeckmann, C.; Wegner, H.; Bezold, A. Modeling and simulation of phase transformation during grinding. Adv. Mater. Res. 2011, 223, 743–753. [Google Scholar] [CrossRef]
  17. Carslaw, H.; Jaeger, J.C. Conduction of Heat in Solids; Oxford University Press: Oxford, UK, 1959. [Google Scholar]
  18. Brinksmeier, E.; Aurich, J.C.; Govekar, E.; Heinzel, C.; Hoffmeister, H.W.; Klocke, F.; Peters, J.; Rentsch, R.; Stephenson, D.J.; Uhlmann, E.; et al. Advances in modeling and simulation of grinding processes. CIRP Ann. 2006, 55, 667–696. [Google Scholar] [CrossRef]
  19. Cao, Y.; Zhao, B.; Ding, W.; Jia, X.; Wu, B.; Liu, F.; Zhu, Y.; Lui, Q.; Xu, D. Evolution of undeformed chip thickness and grinding forces in grinding of K4002 nickel-based superalloy using corundum abrasive wheels. Chin. J. Aeronaut. 2025, 38, 102937. [Google Scholar] [CrossRef]
  20. Jamshidi, H.; Budak, E. A 3D analytical thermal model in grinding considering a periodic heat source under dry and wet conditions. J. Mater. Process. Technol. 2021, 295, 117158. [Google Scholar] [CrossRef]
  21. Guo, C.; Malkin, S. Analysis of energy partition in grinding. J. Eng. Ind. 1995, 117, 55–61. [Google Scholar] [CrossRef]
  22. Mao, C.; Zhou, Z.X.; Zhou, D.W.; Gu, D.Y. Analysis of influence factors for the contact length between wheel and workpiece in surface grinding. Key Eng. Mater. 2007, 359–360, 128–132. [Google Scholar] [CrossRef]
  23. Zhang, L.; Mahdi, M. Applied mechanics in grinding—IV. The mechanism of grinding induced phase transformation. Int. J. Mach. Tools Manuf. 1995, 35, 1397–1409. [Google Scholar] [CrossRef]
  24. Anderson, D.; Warkentin, A.; Bauer, R. Comparison of numerically and analytically predicted contact temperatures in shallow and deep dry grinding with infrared measurements. Int. J. Mach. Tools Manuf. 2008, 48, 320–328. [Google Scholar] [CrossRef]
  25. Schulze, V.; Aurich, J.C.; Jawahir, I.S.; Karpuschewski, B.; Yan, J. Surface conditioning in cutting and abrasive processes. CIRP Ann. 2024, 73, 667–693. [Google Scholar] [CrossRef]
  26. Malkin, S.; Lenz, E. Burning limit for surface and cylindrical grinding of steels. CIRP Ann. 1978, 27, 233–236. [Google Scholar]
  27. Heinzel, J.; Jedamski, R.; Rößler, M.; Karpuschewski, B.; Epp, J.; Dix, M. Hybrid approach to evaluate surface integrity based on grinding power and Barkhausen noise. Procedia CIRP 2022, 108, 489–494. [Google Scholar] [CrossRef]
  28. Guba, N.; Heinzel, J.; Heinzel, C.; Karpuschewski, B. Grinding burn limits: Generation of surface layer modification charts for discontinuous profile grinding with analogy trials. CIRP J. Manuf. Sci. Technol. 2020, 31, 99–107. [Google Scholar] [CrossRef]
  29. Heinzel, C.; Heinzel, J.; Guba, N.; Hüsemann, T. Comprehensive analysis of the thermal impact and its depth effect in grinding. CIRP Ann. 2021, 70, 289–292. [Google Scholar] [CrossRef]
  30. Jedamski, R.; Kuhlmann, G.; Rößler, M.; Karpuschewski, B.; Dix, M.; Epp, J. Towards developing a control of grinding processes using a combination of grinding power evaluation and Barkhausen noise analysis. Prod. Eng. 2024, 18, 339–351. [Google Scholar] [CrossRef]
  31. Guba, N. Einflüsse auf Thermische Prozessgrenzen beim Schleifen Gehärteter Stähle. Ph.D. Thesis, University of Bremen, Bremen, Germany, February 2025. [Google Scholar]
  32. Takazawa, K. Effects of grinding variables on surface structure of hardened steel. Bull. Jpn. Soc. Precis. Eng. 1966, 2, 14–21. [Google Scholar]
  33. Jamshidi, H.; Budak, E. On the prediction of surface burn and its thickness in grinding processes. CIRP Ann. 2021, 70, 285–288. [Google Scholar] [CrossRef]
  34. Kuhlmann, G.; Langenhorst, L.; Hüsemann, T.; Heinzel, C. Consideration of thermally induced material modification depth for grinding process cycle design. CIRP Ann. 2025, 74, 423–427. [Google Scholar] [CrossRef]
  35. Kuhlmann, G.; Langenhorst, L.; Knauer, M.; Guba, N.; Hüsemann, T.; Heinzel, C. Investigation of Surface Integrity Changes in Multistage Grinding with Interim Thermally Induced Material Modifications. Procedia CIRP, 2026; in press.
  36. Kohli, S.; Guo, C.; Malkin, S. Energy partition to the workpiece for grinding with aluminum oxide and CBN abrasive wheels. J. Eng. Ind. 1993, 117, 160–168. [Google Scholar] [CrossRef]
  37. Rowe, W.B.; Black, S.C.E.; Mills, B. Temperature control in CBN grinding. Int. J. Adv. Manuf. Technol. 1996, 12, 387–392. [Google Scholar] [CrossRef]
  38. Lavine, A.S.; Malkin, S.; Jen, T.C. Thermal aspects of grinding with CBN abrasives. CIRP Ann. 1989, 38, 557–560. [Google Scholar] [CrossRef]
  39. Rowe, W.B.; Black, S.C.E.; Mills, B.; Qi, H.S.; Morgan, M.N. Experimental investigation of heat transfer in grinding. CIRP Ann. 1995, 44, 329–332. [Google Scholar] [CrossRef]
  40. Kuhlmann, G.; Guba, N.; Hüsemann, T.; Heinzel, C. Comprehensive study of grinding burn limit and subsurface modifications in grinding with CBN and corundum abrasives. CIRP J. Manuf. Sci. Technol. 2025, 63, 490–504. [Google Scholar] [CrossRef]
  41. DIN EN ISO 683-2; Für eine Wärmebehandlung Bestimmte Stähle, Legierte Stähle und Automatenstähle—Teil 2: Legierte Vergütungsstähle. Beuth Verlag: Berlin, Germany, 2016.
  42. Li, L.; Zhang, Y.; Cui, X.; Said, Z.; Sharma, S.; Liu, M.; Gao, T.; Zhou, Z.; Wang, X.; Li, C. Mechanical behavior and modeling of grinding force: A comparative analysis. J. Mater. Process. Technol. 2023, 102, 921–954. [Google Scholar] [CrossRef]
  43. Kuhlmann, G.; Baschak, M.; Guba, N.; Hüsemann, T.; Heinzel, C. Surface Integrity of Ground AISI4140: A Comparison of Quenched and Tempered and Induction Hardened States. Procedia CIRP, 2026; in press.
  44. Brinksmeier, E.; Cammett, J.T.; König, W.; Leskovar, P.; Peters, J.; Tönshoff, H.K. Residual Stresses—Measurement and Causes in Machining Processes. CIRP Ann. 1982, 31, 491–510. [Google Scholar] [CrossRef]
  45. Chen, X.; Rowe, W.B.; McCormack, D.F. Analysis of the transitional temperature for tensile residual stress in grinding. J. Mater. Process. Technol. 2000, 107, 216–221. [Google Scholar] [CrossRef]
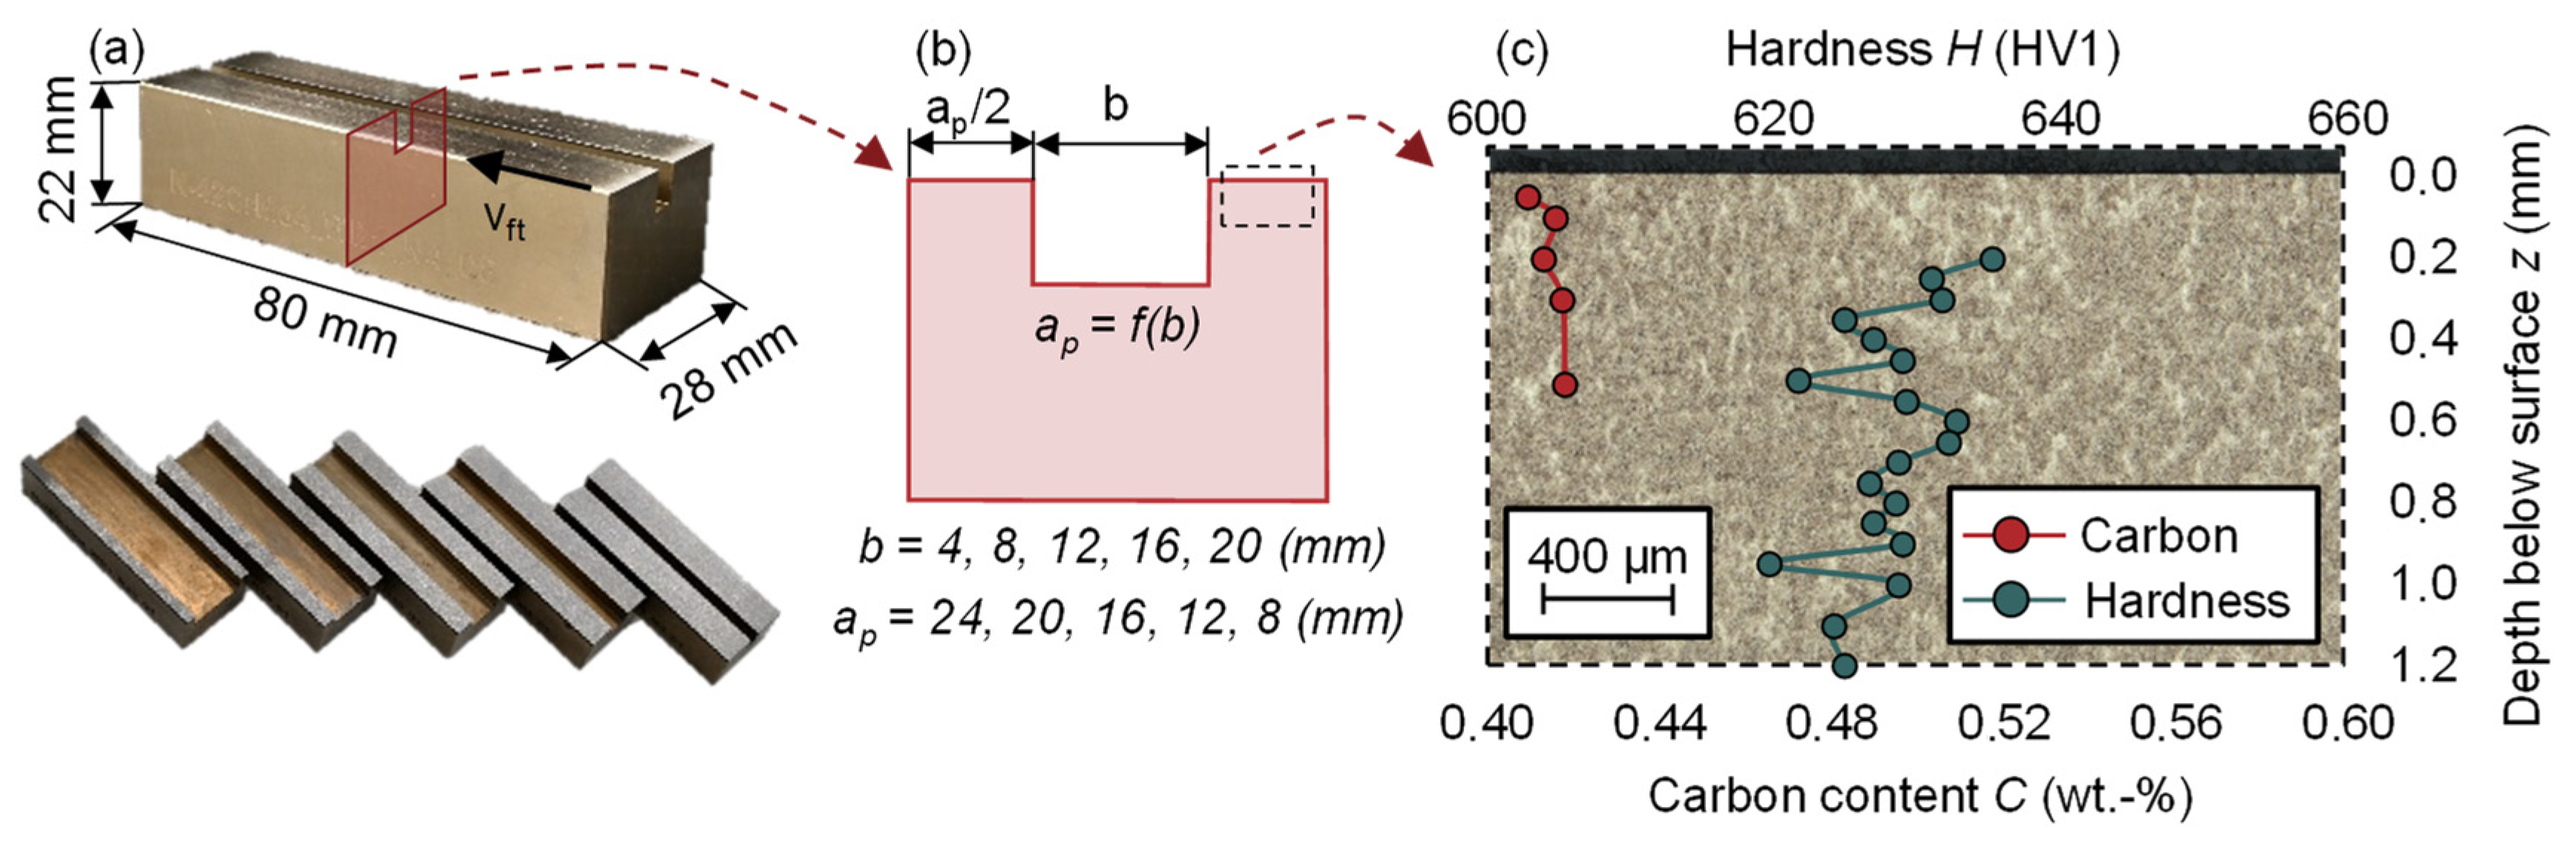
Figure 1. (a) Overview of the employed specimens and their geometry, (b) cross-sectional view of the specimen indicating the groove width b and the corresponding resulting widths of cut ap (c) and initial material condition of AISI 4140 after heat treatment.
Metals 16 00770 g001
Figure 2. (a) Experimental setup on the Blohm Profimat 412 HSG surface grinding machine, (b) grinding force signals recorded during the pre-grinding operation and (c) representative grinding force progression of an experimental trial.
Metals 16 00770 g002
Figure 3. (a) Tangential force Ft as a function of the width of cut ap for different depths of cut ae; (b) specific tangential force Ft as a function of the width of cut ap for different depths of cut ae.
Metals 16 00770 g003
Figure 4. (a) Normal force Fn as a function of the width of cut ap for different depths of cut ae; (b) specific normal force Fn as a function of the width of cut ap for different depths of cut ae.
Metals 16 00770 g004
Figure 5. Distribution of the specific grinding power Pc within the contact zone between workpiece and grinding wheel as a function of geometric contact length lc and width of cut ap.
Metals 16 00770 g005
Figure 6. Evolution of the Barkhausen noise amplitude depending on the depth of cut ae and widths of cut ap for the identification of thermally induced subsurface modifications.
Metals 16 00770 g006
Figure 7. Surface images of ground specimens for visual assessment of thermally induced grinding burn: (a) at constant width of cut of ap = 24 mm; (b) at constant depth of cut of ae = 175 μm.
Metals 16 00770 g007
Figure 8. Metallographic cross-sections for the evaluation of tempering zone formation and tempering depth Δz for (a) increasing depth of cut ae; (b) increasing width of cut ap.
Metals 16 00770 g008
Figure 9. PcΔt diagram showing grinding burn occurrence based on metallographic analysis of dependence on the width of cut ap. Data from Ref. [29].
Metals 16 00770 g009
Figure 10. Surface roughness measurements Rz with increasing depth of cut ae for different widths of cut ap.
Metals 16 00770 g010
Figure 11. Tempering zone depth Δz from metallographic cross-sections of dependence of (a) specific grinding power Pc; (b) grinding energy EC as a function of the width of cut ap.
Metals 16 00770 g011
Figure 12. Hardness depth profiles for (a) increasing depth of cut ae at constant width of cut of ap = 24 mm; (b) variation in width of cut ap at constant depth of cut of ae = 175 μm.
Metals 16 00770 g012
Figure 13. Residual stress depth profile for different widths of cut ap at a constant depth of cut ae of ae = 150 μm.
Metals 16 00770 g013
Table 1. Chemical composition of the material AISI 4140 with associated permissible limit values according to DIN EN ISO 683-2 [41].
ElementCSiMnPSCrMoNiAlCuNCo
Min.0.38-0.6--0.90.15-----
Max.0.450.40.90.0250.0351.20.3-----
Measured0.4460.2630.7340.0120.0021.090.2430.1990.0180.0650.0070.008
Table 2. Experimental design and process parameters.
ap (mm)b (mm)ae (μm)vc (m/s)vft (mm/min)Q′w (mm3/mm∙s)
82050–200 (25)3540000.33–13.33 (1.67)
121650–200 (25)3540000.33–13.33 (1.67)
161250–200 (25)3540000.33–13.33 (1.67)
20850–200 (25)3540000.33–13.33 (1.67)
24450–200 (25)3540000.33–13.33 (1.67)
Table 3. Parameters of regression analysis for process forces F.
Tangential Force FtNormal Force Fn
ae (μm)a (-)R2 (-)ae (μm)a (-)R2 (-)
2009.550.9920018.190.99
1758.620.9917516.550.99
1507.340.9915014.710.99
1255.820.9912513.590.99
1004.750.9910012.870.99
753.810.997510.630.99
502.590.99507.440.99
Table 4. Parameters of regression analysis for Δz.
Specific Grinding Power PcGrinding Energy Ec
ap (μm)a (-)b (-)R2 (-)ap (μm)a (-)b (-)R2 (-)
848.55−12300.9780.37−5050.95
1238.85−10060.98120.22−4880.98
1650.66−14350.98160.19−6230.99
2043.55−12120.98200.13−5350.99
2438.67−10750.99240.11−5350.98
Disclaimer/Publisher’s Note: The statements, opinions and data contained in all publications are solely those of the individual author(s) and contributor(s) and not of MDPI and/or the editor(s). MDPI and/or the editor(s) disclaim responsibility for any injury to people or property resulting from any ideas, methods, instructions or products referred to in the content.