Article

Effect of Deposition Parameters on the Supercapacitive Behavior of Electroless Ni–P Coatings

1
Institute of Physical Metallurgy, Metal Forming and Nanotechnology, University of Miskolc, H-3515 Miskolc, Hungary
2
Institute of Energy Engineering and Chemical Machinery, University of Miskolc, H-3515 Miskolc, Hungary
3
Department of Materials Physics, Eötvös Loránd University, H-1117 Budapest, Hungary
4
Department of Development, Bay Zoltán Nonprofit Ltd. for Applied Research, H-1117 Budapest, Hungary
5
HUN–REN Institute for Nuclear Research, Bem Tér 18/C, H-4026 Debrecen, Hungary
*
Author to whom correspondence should be addressed.
Metals 2026, 16(7), 709; https://doi.org/10.3390/met16070709
Submission received: 1 June 2026 / Revised: 23 June 2026 / Accepted: 25 June 2026 / Published: 28 June 2026

Abstract

Electroless nickel–phosphorus (Ni–P) coatings were deposited on steel substrates for 20, 40, and 60 min to examine the effect of deposition time on their pseudocapacitive behavior in an alkaline electrolyte. The coatings were characterized by scanning electron microscopy (SEM/EDS), atomic force microscopy (AFM), X-ray photoelectron spectroscopy (XPS), cyclic voltammetry (CV), galvanostatic charge–discharge (GCD), and electrochemical impedance spectroscopy (EIS). Although coating mass, thickness, and roughness increased monotonically with deposition time, the electrochemical response showed a pronounced maximum at 40 min. The 40 min coating exhibited the highest areal capacitance in both CV and GCD measurements, reaching 33.1 ± 1.8 mF cm−2 at 10 mV s−1 and 426.5 ± 9.8 mF cm−2 at 5 mA cm−2, whereas the 60 min coating showed substantially lower capacitance. SEM and AFM confirmed progressive nodular coarsening and increasing surface roughness with time, but these geometric parameters alone did not explain the non-monotonic capacitance trend. In contrast, XPS revealed that the 40 min coating possessed the highest surface Ni content, while prolonged deposition led to a more P-enriched outermost surface. EIS further showed that the 40 min coating had the most favorable local high-frequency interfacial response, whereas the 60 min coating exhibited the highest local polarization. The results demonstrate that the electrochemical performance of electroless Ni–P coatings is more closely associated with the composition and accessibility of the activated near-surface region than with coating thickness or roughness alone, and that 40 min represents an interfacial optimum under the applied deposition conditions.

1. Introduction

Nickel–phosphorus (Ni–P) coatings prepared by electroless deposition are known for their uniform thickness and good adhesion on various substrates [1,2,3]. In this process, a Ni–P alloy layer is deposited without external electrical power, which is advantageous for coating complex geometries and obtaining uniform layers [4,5]. Ni–P coatings are widely used in industries for their superior hardness [6,7], wear and corrosion resistance [8,9], making them ideal for applications in electronics, automotive [10], and aerospace [11] sectors.
Despite their widespread industrial use, Ni–P coatings have received relatively limited attention for supercapacitor applications, with only a few studies specifically exploring their pseudocapacitive behavior [12,13,14,15,16,17,18]. Supercapacitors are electrochemical energy-storage devices characterized by rapid charge/discharge capability and long cycle life. They are classified into two main types: electric double-layer capacitors (EDLCs) and pseudocapacitors [19,20]. EDLCs store energy through electrostatic charge separation, which can be described with the Helmholtz model [21,22], whereas pseudocapacitors store energy through surface or near-surface Faradaic reactions involving electron transfer and therefore can exhibit higher capacitance than EDLCs [23,24,25].
Ni–P alloys are of interest for pseudocapacitive applications because nickel-based surface species can participate in Faradaic charge storage, while phosphorus influences the structure and surface composition of the deposit [3,23,26,27]. In electroless Ni–P coatings, these features are sensitive to deposition conditions, which affect phosphorus incorporation, microstructure, and surface morphology [2,28].
Previous studies have clearly shown that electroless Ni–P deposition is sensitive to bath composition and process parameters, including pH, temperature, hypophosphite concentration, and deposition time. These parameters affect coating thickness, phosphorus incorporation, nodular morphology, crystallinity, and corrosion-related properties [29,30,31,32,33,34]. At the microstructural level, previous studies on Ni–P and P-containing Ni systems have discussed Ni–P alloy formation, phosphorus segregation, grain-boundary effects, grain-growth behavior, and coating microstructure [35,36,37,38,39,40,41]. In particular, deposition time has been investigated mainly from the viewpoint of coating growth, surface morphology, and protective performance [42,43], whereas phosphorus content is known to influence the amorphous/nanocrystalline character and structural development of Ni–P deposits [3,28,41,44,45].
From an electrochemical energy-storage perspective, Ni–P-based materials are attractive because nickel-containing surface species can undergo reversible Faradaic reactions in an alkaline electrolyte, while phosphorus can modify the structure, conductivity, and surface chemistry of the deposit [12,13,14,15,16,17,18]. Previous Ni–P-related supercapacitor studies have demonstrated high electrochemical activity using different electrode designs. For example, amorphous Ni–P materials prepared by a solvothermal route have been reported to reach 1597 F g−1 at 0.5 A g−1, demonstrating the intrinsic pseudocapacitive potential of amorphous Ni–P systems [12]. Electroless Ni–P coatings deposited on expanded graphite paper have also shown high gravimetric capacitance, reaching 625 F g−1 at 1 A g−1; however, in that case, the high surface area and conductive graphite support strongly contributes to the electrode architecture [18]. In addition, chemically etched electroless Ni–P coatings have shown markedly improved capacitance after porosity generation, highlighting the importance of electrolyte-accessible surface area and surface activation [46,47].
These studies demonstrate that Ni–P-based systems can be electrochemically active and that their performance can be enhanced by amorphization, high-surface-area supports, or post-deposition etching. However, such approaches do not directly clarify how deposition time alone affects the activated near-surface composition and charge-storage response of a directly deposited electroless Ni–P coating. Therefore, the present work addresses this gap by isolating deposition time as the main experimental variable and correlating coating growth, nodular morphology, XPS-derived near-surface composition, and CV/GCD/EIS response in an alkaline electrolyte.

2. Materials and Methods

Electroless Ni–P coatings were deposited on steel from a sodium–hypophosphite–containing bath, with deposition time (20, 40, and 60 min) as the primary experimental variable. All other variables, like bath composition and pH, temperature control, agitation geometry and set point, and fixture geometry, were held constant to isolate the time effect. To increase the number of specimens per time point and quantify intra-batch variability, the small-volume, single-specimen deposition approach reported by Czagány et al. [2], using 50 mL of bath per sample, was scaled to a 500 mL bath containing ten specimens. This modification preserved the same nominal bath volume per specimen while enabling parallel sample preparation and statistical evaluation within the same bath. The stirring set point in the larger vessel was chosen using standard mixing criteria (equal tip speed or power per volume) and validated by a one-time PIV [48] measurement in the same reactor geometry to ensure comparable hydrodynamic conditions across scales. A rigid 3D-printed holder maintained fixed sample orientation and constant sample–impeller spacing during deposition. For each time condition, 10 independently prepared samples were processed in a fresh bath, as bath-age effects were not investigated. The pH of the electroless bath was verified before deposition at 25 °C. Post-deposition, structural/compositional characterization comprised cross-sectional SEM (thickness and uniformity), EDS (surface Ni/P at.%), and XPS acquired after electrochemical activation. Electrochemical testing employed a three-electrode configuration in 1 M KOH (CV, GCD, and EIS).

2.1. Substrates and Surface Preparation

Rectangular steel samples (AISI 1345 20 × 12.5 × 1 mm) were prepared from plate stock sourced from [Szatex Ltd., Miskolc, Hungary]. The nominal composition (wt%) provided by the supplier was: C 0.43–0.48, Mn 1.60–1.90, Si 0.15–0.35, P ≤ 0.035, S ≤ 0.040, balance Fe (~97.2–97.8).
After cutting, the samples were ground and polished in multiple steps to minimize roughness-related hydrodynamic effects during deposition. Grinding proceeded on a disc sander with P80 → P220 → P500 SiC papers, respectively. Final finishing used a disc polisher with a 1 μm polishing cloth to reach mirror-like Ra ≈ 0.05 μm. Both faces were treated identically, and edges were lightly deburred to avoid localized flow disturbances.
Surface preparation comprised three steps:
  • Solvent ultrasonication (degrease/particle contaminant removal): samples were sonicated for 5 min in acetone (CAS 67-64-1—manufacturer: ES Lab Hungary Ltd., Debrecen, Hungary)
  • Alkaline cleaning: samples were immersed in a 10 wt% NaOH (CAS 1310-73-2—manufacturer: ES Lab Hungary Ltd.) solution held at 80 °C, agitated at 80 rpm for 5 min to remove persistent oily contaminants.
  • Acid activation: prior to plating, surfaces were activated in concentrated HCl (37 wt%) (CAS 7647-01-0—manufacturer: ES Lab Hungary Ltd.) for 30 s.
After each step, the samples were rinsed thoroughly with running distilled water.

2.2. Electroless Bath Composition and Deposition

After surface preparation, the electroless deposition was performed from a Ni–P bath containing the following constituents (per liter of deionized water), measured at 25 °C:
  • Nickel (II) sulfate hexahydrate (NiSO4·6H2O, CAS 10101-97-0), 15 g L−1—VWR Chemicals, Debrecen, Hungary.
  • Sodium hypophosphite monohydrate (NaH2PO2·H2O, CAS 10039-56−2), 14 g L−1—Molar Chemicals Kft, Halásztelek, Hungary.
  • Sodium acetate trihydrate (C2H2NaO2·3H2O, CAS 6131-90-4), 13 g L−1—Molar Chemicals Kft.
  • Thiourea (CH2N2S, CAS 62-56-6), 1 mg L−1 (stabilizer)—analytical grade.
The deposition times of 20, 40, and 60 min were selected to represent early, intermediate, and extended coating-growth stages within a stable electroless Ni–P deposition window. This selection was motivated by previous observations that electroless deposition parameters can significantly influence coating thickness and related properties, such as hardness [49]. In the present work, the bath composition, pH, temperature, agitation, and geometry were fixed based on established deposition conditions from our previous study and preliminary reproducibility tests that resulted in uniform, continuous coatings with good adhesion and no visible cracks and cauliflower-like morphology [2]. This allowed deposition time to be isolated as the main experimental variable. Longer deposition times were not included since prolonged bath operation may introduce bath-age effects, surface densification, and increased phosphorus enrichment of the outer surface. Both sides of the AISI 1345 samples were plated; no masking was used.
The bath pH was verified at 6.2 with Laboratory Research Grade Two Channel Benchtop pH/mV/ISE Meter–HI522.
To ensure temperature uniformity, the plating beaker was immersed in a circulating water bath regulated by a laboratory-grade thermostat (Julabo CORIO CD–200F, 230 V, 50 Hz) (JULABO GmbH, Baden-Württemberg, Germany). This setup held the process temperature at 80.0 ± 0.1 °C during the deposition, minimizing drift and gradients across the sample surface. Agitation was provided by magnetic stirring at 80 rpm (PTFE-coated bar), yielding gentle bulk motion with small vortex formation. Ten AISI 1345 samples were processed per bath. Between runs, the bath was discarded. To improve reproducibility and reduce between-sample deviation, the commonly used 50 mL per specimen laboratory practice [2,49,50,51] was modified to a 500 mL/10-specimen configuration while keeping all key bath parameters constant [52,53].
To support the 50 mL → 500 mL scale transition and keep the hydrodynamic forcing comparable between vessels, we performed a Particle Image Velocimetry (PIV)-based calibration targeting the circumferential flow component generated by magnetic stirring. Measurements were carried out using a TSI 2D PIV system comprising a Litron Lasers Nano L PIV Nd:YAG laser (4 ns pulse, 800 mJ output) (Sirius Aerospace Manufactureing, Rugby, UK), a TSI PowerView Plus camera (TSI GmbH, Shoreview, MN, USA) (Δt = 1 ms between paired frames), and INSIGHT 3G 9.0 (TSI GmbH, Shoreview, Minnesota, USA) /PIVLab 3.12 (Optolution Messtechnik GmbH, Bremen, Germany) for acquisition and postprocessing. Micrometer–scale tracer particles were dispersed in the liquid (mica powder, selected for its near-water density and low settling tendency) and imaged under high-power, pulsed planar laser illumination (horizontal light sheet) [54].

2.3. Structural and Surface Analysis

To relate the electrochemical trends to structural and compositional changes, the coatings were characterized structurally and chemically using a complementary set of surface- and cross-section-sensitive techniques. Prior literature consistently shows that electroless Ni–P process parameters—particularly deposition time, bath temperature and pH, and the hypophosphite/Ni2+ ratio—affect coating thickness, phosphorus incorporation (and thereby the amorphous/nanocrystalline character), and surface morphology [2,55,56,57,58]. These features are directly relevant to electrochemical performance in an alkaline electrolyte because they govern the accessible interfacial area, the density and distribution of electrochemically active sites, and charge-transfer pathways [59,60,61]. Since the central aim of this work was to evaluate the pseudocapacitive response of directly deposited electroless Ni–P coatings, electrochemical performance was treated as the primary functional property of interest. The CV, GCD, and EIS measurements were therefore used to quantify charge-storage behavior and interfacial response in an alkaline electrolyte, while SEM/EDS, AFM, and XPS were applied to identify the morphological and compositional factors responsible for the observed electrochemical trends.

2.3.1. SEM/EDS: Morphology, Thickness, and Compositional Analysis

Surface morphology and cross-sectional coating structure were examined by scanning electron microscopy (SEM) using a Thermo Scientific Helios G4 PFIB SEM (Thermo Fisher Scientific, Waltham, MA, USA) equipped with an EDAX Octane Elect EDS System with EDAX TEAM EDS v1.20 Analysis Software. Top-view images were acquired to evaluate deposition-time-dependent changes in nodularity and surface texture. Cross-sectional SEM was used to determine coating thickness and to assess thickness uniformity along the section. Where indicated, energy-dispersive X-ray spectroscopy (EDS) was performed to provide semi-quantitative Ni/P compositional analysis at the surface and/or across the cross-section.
Since electroless Ni–P coatings commonly exhibit nodular or cauliflower-like surface morphologies [29,42,43], the characteristic nodule sizes were also evaluated from calibrated top-view SEM micrographs. Image analysis was performed manually using ImageJ software (version 1.53m). The image scale was calibrated from the SEM scale bar, and individual nodules were identified based on grayscale contrast and visible nodule boundaries. For each deposition time, the primary nodule population was measured separately. Characteristic nodule size was expressed as the measured projected nodule diameter, and the error bars represent the standard deviation of the measured nodule population.

2.3.2. AFM: Surface Topography and Roughness (AFM-Derived Surface Development)

Surface topography and roughness were quantified via atomic force microscopy (AFM, AIST–NT Smart SPM–1000) (AIST–NT, Novato, CA, USA) operating in tapping mode with HQ/Al BS cantilevers (Umasch). The resulting quantitative height maps yielded roughness parameters (e.g., Ra, Rq, peak-to-valley statistics) and an areal surface enlargement factor, enabling the comparison of surface development across different deposition times.
AFM images were evaluated using Gwyddion (open-source SPM software, version 2.71), applying planefit leveling and third-degree polynomial background correction prior to extracting quantitative parameters.
Since two-dimensional AFM height maps were evaluated, areal roughness parameters were used instead of profile roughness parameters. The arithmetic mean height, Sa, represents the mean absolute height deviation from the mean plane and corresponds to the areal analogue of Ra, which denotes the arithmetic mean profile roughness. Similarly, the root-mean-square height, Sq, represents the root-mean-square height deviation and corresponds to the areal analogue of Rq, where Rq denotes the root-mean-square profile roughness. The maximum peak height, Sp, maximum pit depth, Sv, were used to describe the vertical amplitude of the surface topography.
AFM scans were collected over a representative field of view consistent with the maps shown (typically on the order of ~100 × 100 µm2) with an image resolution of approximately ~512 × 512 pixels, and at least n = 3 spatially separated areas were recorded per sample to capture within-sample variability. The reported AFM-derived values represent the mean ± standard deviation of these selected fields of view and not an average over the entire macroscopic sample surface.

2.3.3. XPS: Surface Chemistry of the Electrode Interface

Since the electrochemically relevant region is the outermost surface (top few nanometers) and because Ni–P surfaces undergo chemical/electrochemical transformation in alkaline media, X-ray photoelectron spectroscopy (XPS) was used to determine surface composition and chemical states at the electrolyte interface. Importantly, XPS was performed after electrochemical activation/conditioning, i.e., following the same electrolyte exposure and stabilization protocol used prior to electrochemical testing, to capture the chemically relevant interfacial state (including Ni oxidation/hydroxylation and possible phosphate/oxyphosphate species) [62,63,64,65]. Electrochemical activation consisted of repeated CV cycling in 1 M KOH (CAS 1310-58-3) within 0–0.55 V vs. Ag/AgCl, as described in the conditioning protocol above.
XPS measurements were carried out using a SPECS system (Berlin, Germany) equipped with an XR 50 dual-anode, non-monochromatized X-ray source and a Phoibos 100 MCD–5 hemispherical energy analyzer. Samples were mounted on copper holders using double-sided adhesive tape and degassed overnight in the load lock (~10−7 mbar) prior to transfer. The base pressure in the analysis chamber was 5 × 10⁻¹⁰ mbar, remaining better than 10−8 mbar during measurements. Spectra were acquired using Al Kα radiation (hν = 1486.6 eV) at 10 kV acceleration voltage and 10 mA emission current (100 W X-ray power).

2.4. Electrochemical Measurements

Electrochemical measurements were carried out at 25 ± 0.5 °C, using an Autolab PGSTAT302N potentiostat from Metrohm (Utrecht, Netherlands). The NOVA 2.1.5 software was used for data analysis. Cyclic voltammetry and galvanostatic charge–discharge measurements were carried out in 1 M KOH electrolyte prepared from potassium hydroxide (KOH, CAS No. 1310-58-3) and deionized water. Electrochemical characterization was conducted in a three-electrode cell to decouple working-electrode behavior from counter-electrode polarization [66,67,68]. An Ag–AgCl–3M KCl glass electrode was used as the reference electrode, and a platinized platinum electrode was used as the counter electrode. The working electrodes were Ni–P-coated plates. To ensure a stabilized electrode response, all CV and GCD data reported in this work were recorded after an electrochemical conditioning step consisting of 30 stabilization cycles [69,70]. Stabilization was performed by cyclic voltammetry at 100 mV s−1 over the same potential window used for evaluation (0–0.55 V vs. Ag/AgCl), after which the subsequent CV/GCD/EIS datasets were acquired using a potential window of 0–0.55 V, with scan rates of 10–20–30–50 and 100 mV s–1 and charge–discharge current densities of 0.1–0.5 and 1 A dm−2. Current densities reported in A dm−2 are referenced to the geometric (macroscopic) exposed area of the Ni–P-coated working electrode.
For the EIS measurements, samples were embedded in a two-component epoxy resin (cured for 12 h) to define a consistent working area of 1.00 cm2 within the three-electrode setup. Spectra were recorded at three distinct potentials derived from the CV: near the cathodic peak, at the zero-current baseline, and close to the anodic peak. Prior to each recording, the potential was set to the target potential and allowed to stabilize. The resulting impedance data were evaluated using a local circle fit applied to the initial high-frequency Nyquist arc to extract the series resistance (Rs), a local high-frequency polarization resistance (Rp), and the constant-phase element parameters (CPE, Y0 and n). The local high-frequency arc was represented by the equivalent circuit Rs–(Rp∥CPE), where Rs is the series resistance, Rp is the local high-frequency polarization resistance, and CPE represents the non-ideal interfacial capacitance. The constant-phase element impedance is given by ZCPE = [Y0(jω)n] − 1. Since this fit is explicitly confined to the high-frequency regime, Rp should be regarded as a local high-frequency resistance parameter rather than a global, full-spectrum charge-transfer resistance [71].
Specific capacitance was calculated and reported from both cyclic voltammetry (1) and galvanostatic charge–discharge (2) measurements using the corresponding standard slope-based approaches. In the case of CV, the specific capacitance was calculated as follows:
C C V = 0 Δ V I V d V 2 Δ V · v · Π
where ΔV is the potential window, v (mV s−1) is the scan rate, 0 Δ V I V d V is the area of the cyclic voltammetry curve and Π represents the normalization quantity used to express electrode-specific capacitance. In the case of GCD, the specific capacitance was calculated as follows:
C G C D = 2 I · t 0 t 1 V t d t Δ V 2 · Π
Here, t0 corresponds to the onset of the GCD step and t1 to its discharge.
Measurement uncertainty and data scatter were evaluated according to the type of experiment. For coating growth, deposited mass and cross-sectional thickness were determined from independently prepared specimens and are reported as mean ± standard deviation. The relative standard deviation was used to assess the reproducibility of the electroless deposition process. For SEM-based nodule-size analysis, the error bars represent the standard deviation of the measured nodule population. AFM-derived roughness parameters were calculated from at least three spatially separated scan areas after identical leveling and background-correction procedures; therefore, these values describe the variability of representative local surface regions rather than the entire macroscopic sample. For electrochemical testing, five independently prepared electrodes were measured for each deposition time, and capacitance values are reported as mean ± standard deviation unless otherwise stated. For the EIS analysis, the quality of the local high-frequency fit was evaluated using the root-mean-square error (RMSE), which is reported together with the fitted parameters.

3. Results

The results are presented by first evaluating coating growth and morphology, followed by electrochemical characterization and surface-sensitive XPS analysis. Since such microstructural and compositional changes can alter both accessible interfacial areas and the distribution of electrochemically active surface states in an alkaline electrolyte, a time-resolved analysis is essential to interpret capacitive trends beyond simple mass loading [18,72]. Accordingly, the mass gain of the samples was determined by weighing them before and after deposition, then thickness quantification and surface development by cross-sectional SEM and AFM. Finally, we relate these structural surface parameters to electrochemical metrics (CV/GCD/EIS) and to the post-conditioning surface chemistry obtained by XPS, which captures the electrolyte-relevant interfacial state rather than the as-plated surface alone.

3.1. Coating Measurements and Surface Morphology

The deposition characteristics, including coating mass and thickness as a function of bath time, are summarized in Table 1. The samples were deposited together in the same 500 mL bath using the previously described specimen holder. The holder maintained a fixed substrate orientation relative to the stirring direction, ensuring consistent hydrodynamic conditions across all specimens. While the literature predominantly relies on conventional single-specimen bath configurations [73], multi-specimen configuration provided excellent reproducibility under the present conditions. This is reflected in the low relative standard deviations (RSD) observed for both deposited mass (0.50–1.05%) and coating thickness (2.2–2.5%), confirming excellent spatial and batch-to-batch uniformity of the deposited layer.
While the total mass gain increased monotonically over the investigated deposition window, the apparent areal mass gain rate decreased at longer times: the incremental mass gain dropped from ~0.221 mg cm−2 min−1 between 20 and 40 min to ~0.096 mg cm−2 min−1 between 40 and 60 min, indicating a clear deceleration of growth at longer deposition times, in qualitative agreement with prior reports on electroless Ni–P deposition [42,74]. An analogous slowdown is also observed in thickness growth, where the incremental thickness increase changed from ~0.304 µm min−1 (20–40 min) to ~0.149 µm min−1 (40–60 min). This behavior is consistent with an initially faster growth stage followed by a gradual slowdown, rather than a true saturation within 60 min.
These mass-gain data, together with the corresponding thickness evolution, provide a quantitative baseline for interpreting the time-dependent evolution of coating thickness/morphology and for comparing electrochemical responses as a function of deposited loading.
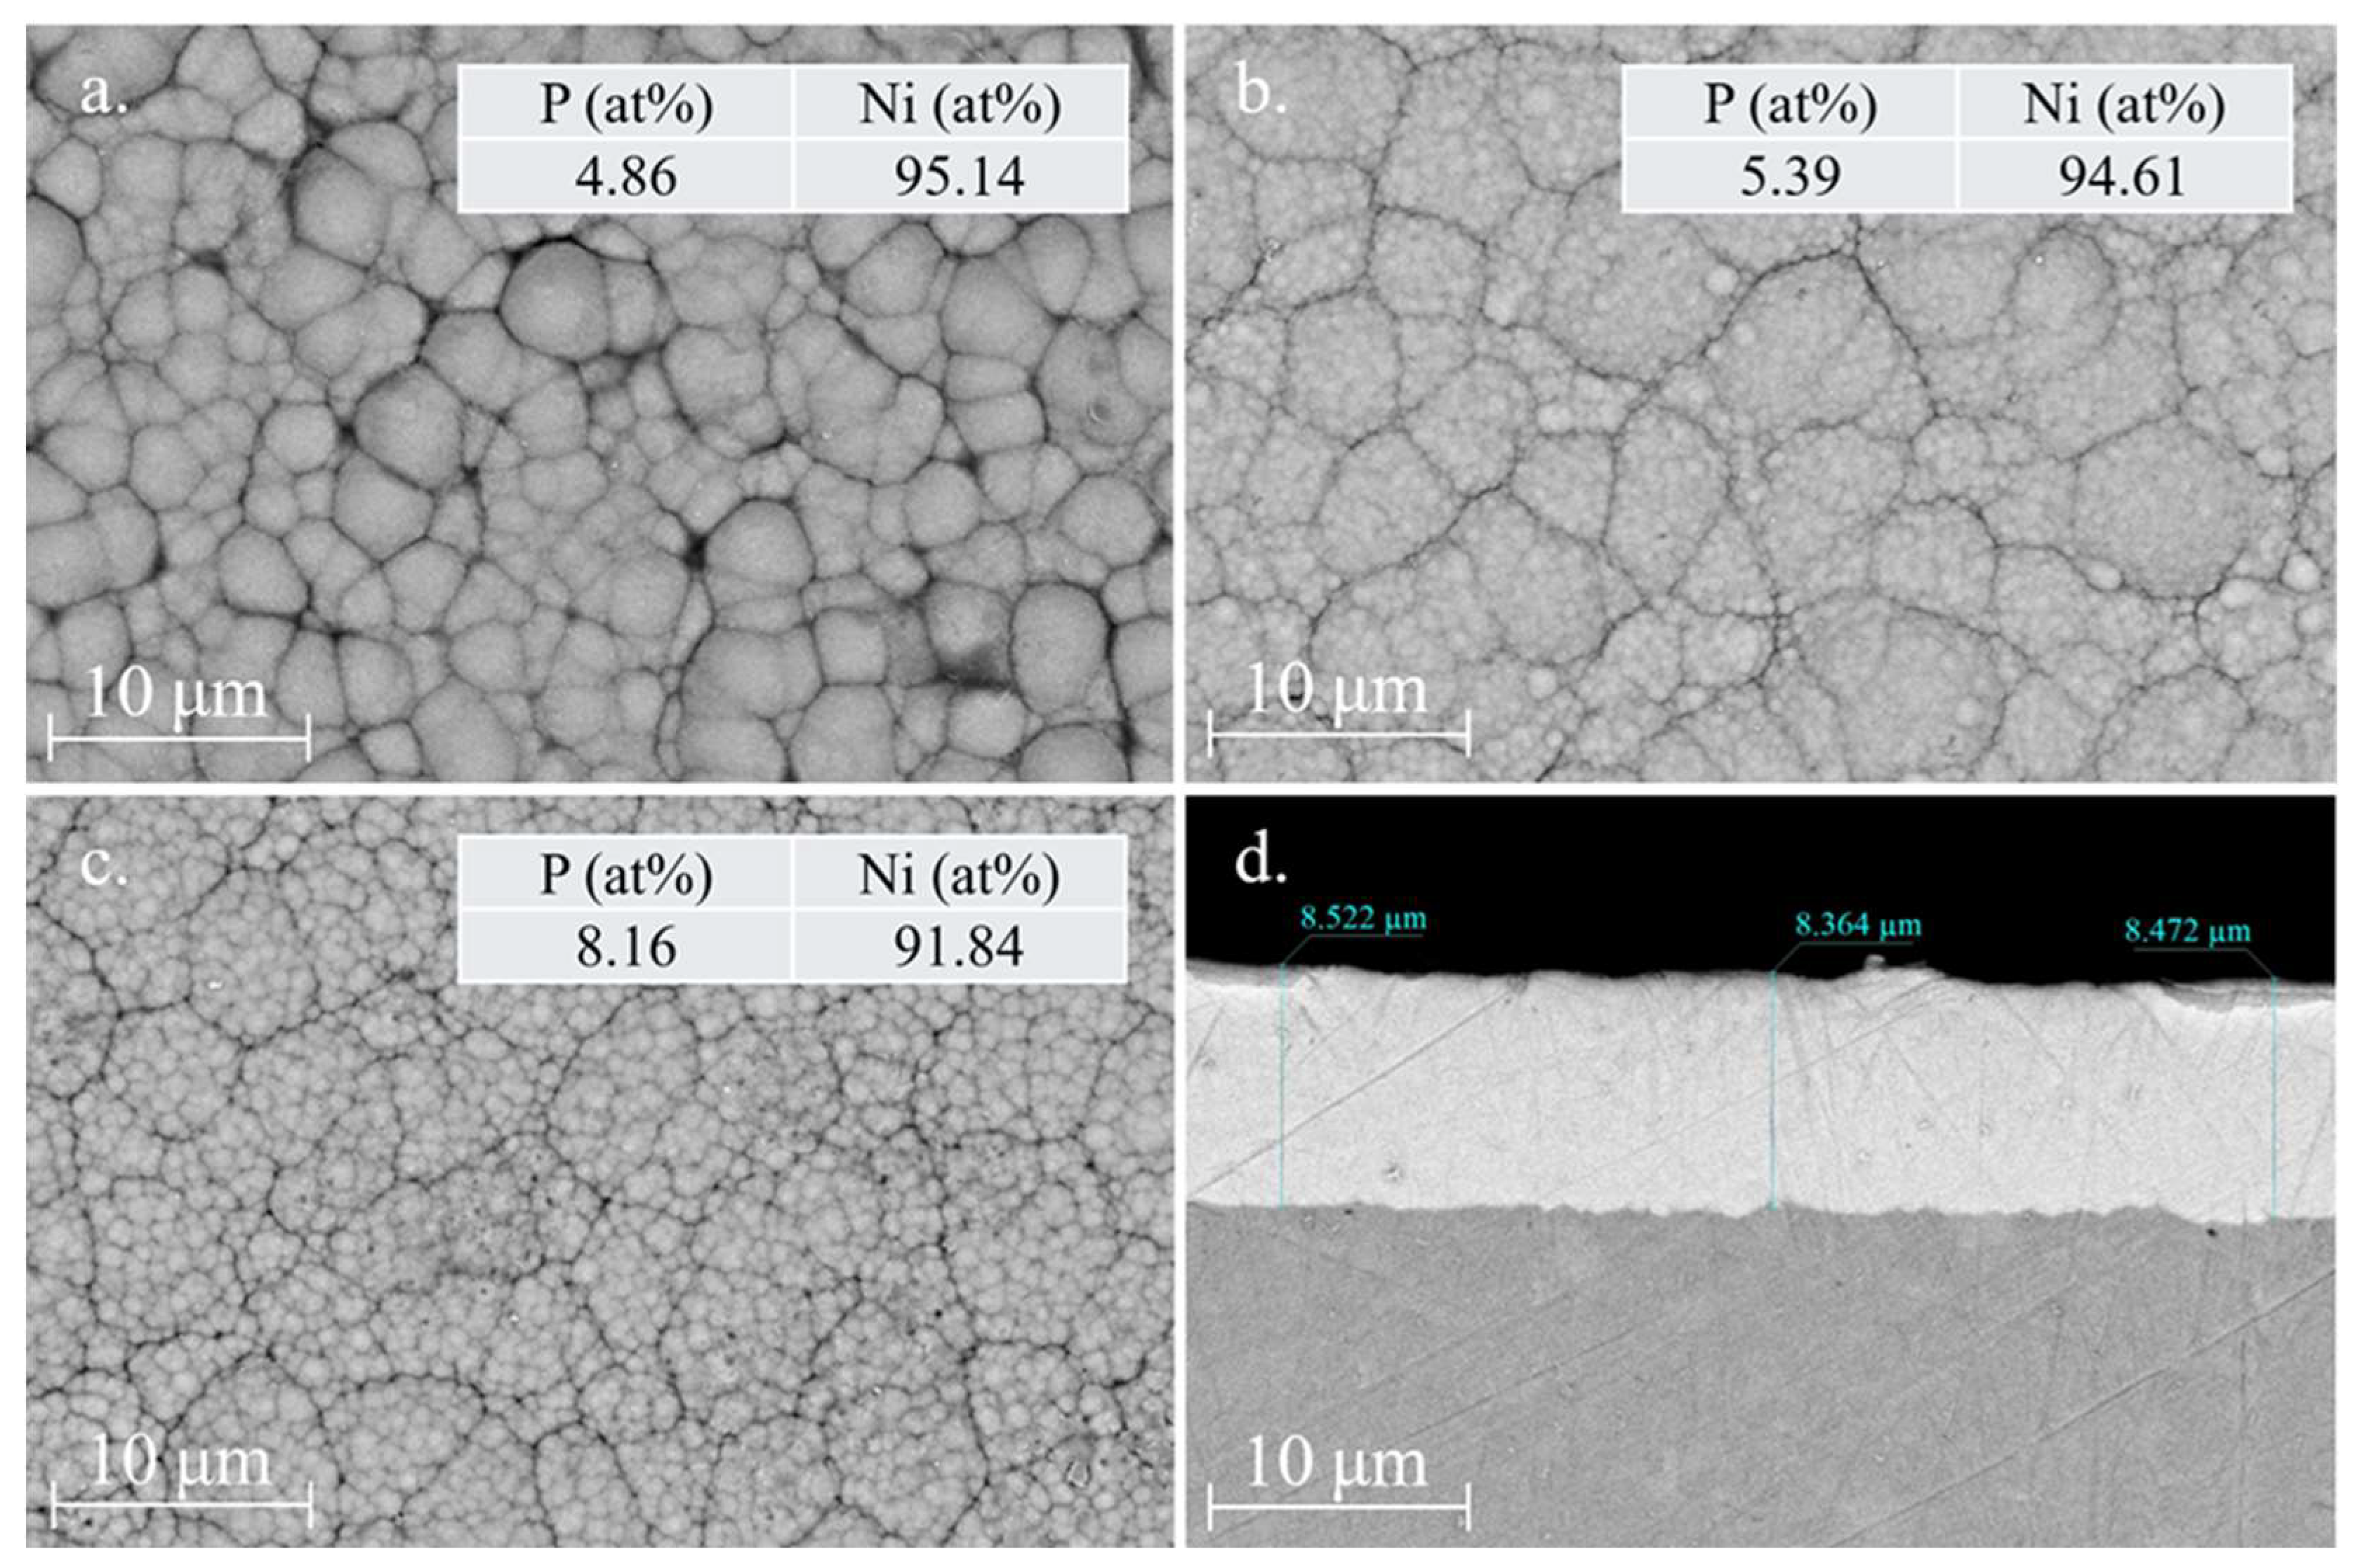
Cross-sectional SEM imaging confirms the formation of a continuous Ni–P layer for all deposition times, with a well-defined coating/substrate interface and no obvious signs of delamination, in agreement with the generally adherent and compact character of electroless Ni–P coatings reported in the literature [41,75,76]. As a representative example, the cross-sectional view of the 40-minute sample (Figure 1d) demonstrates good thickness uniformity at the examined scale, corroborating the systematically increasing thickness trend discussed previously.
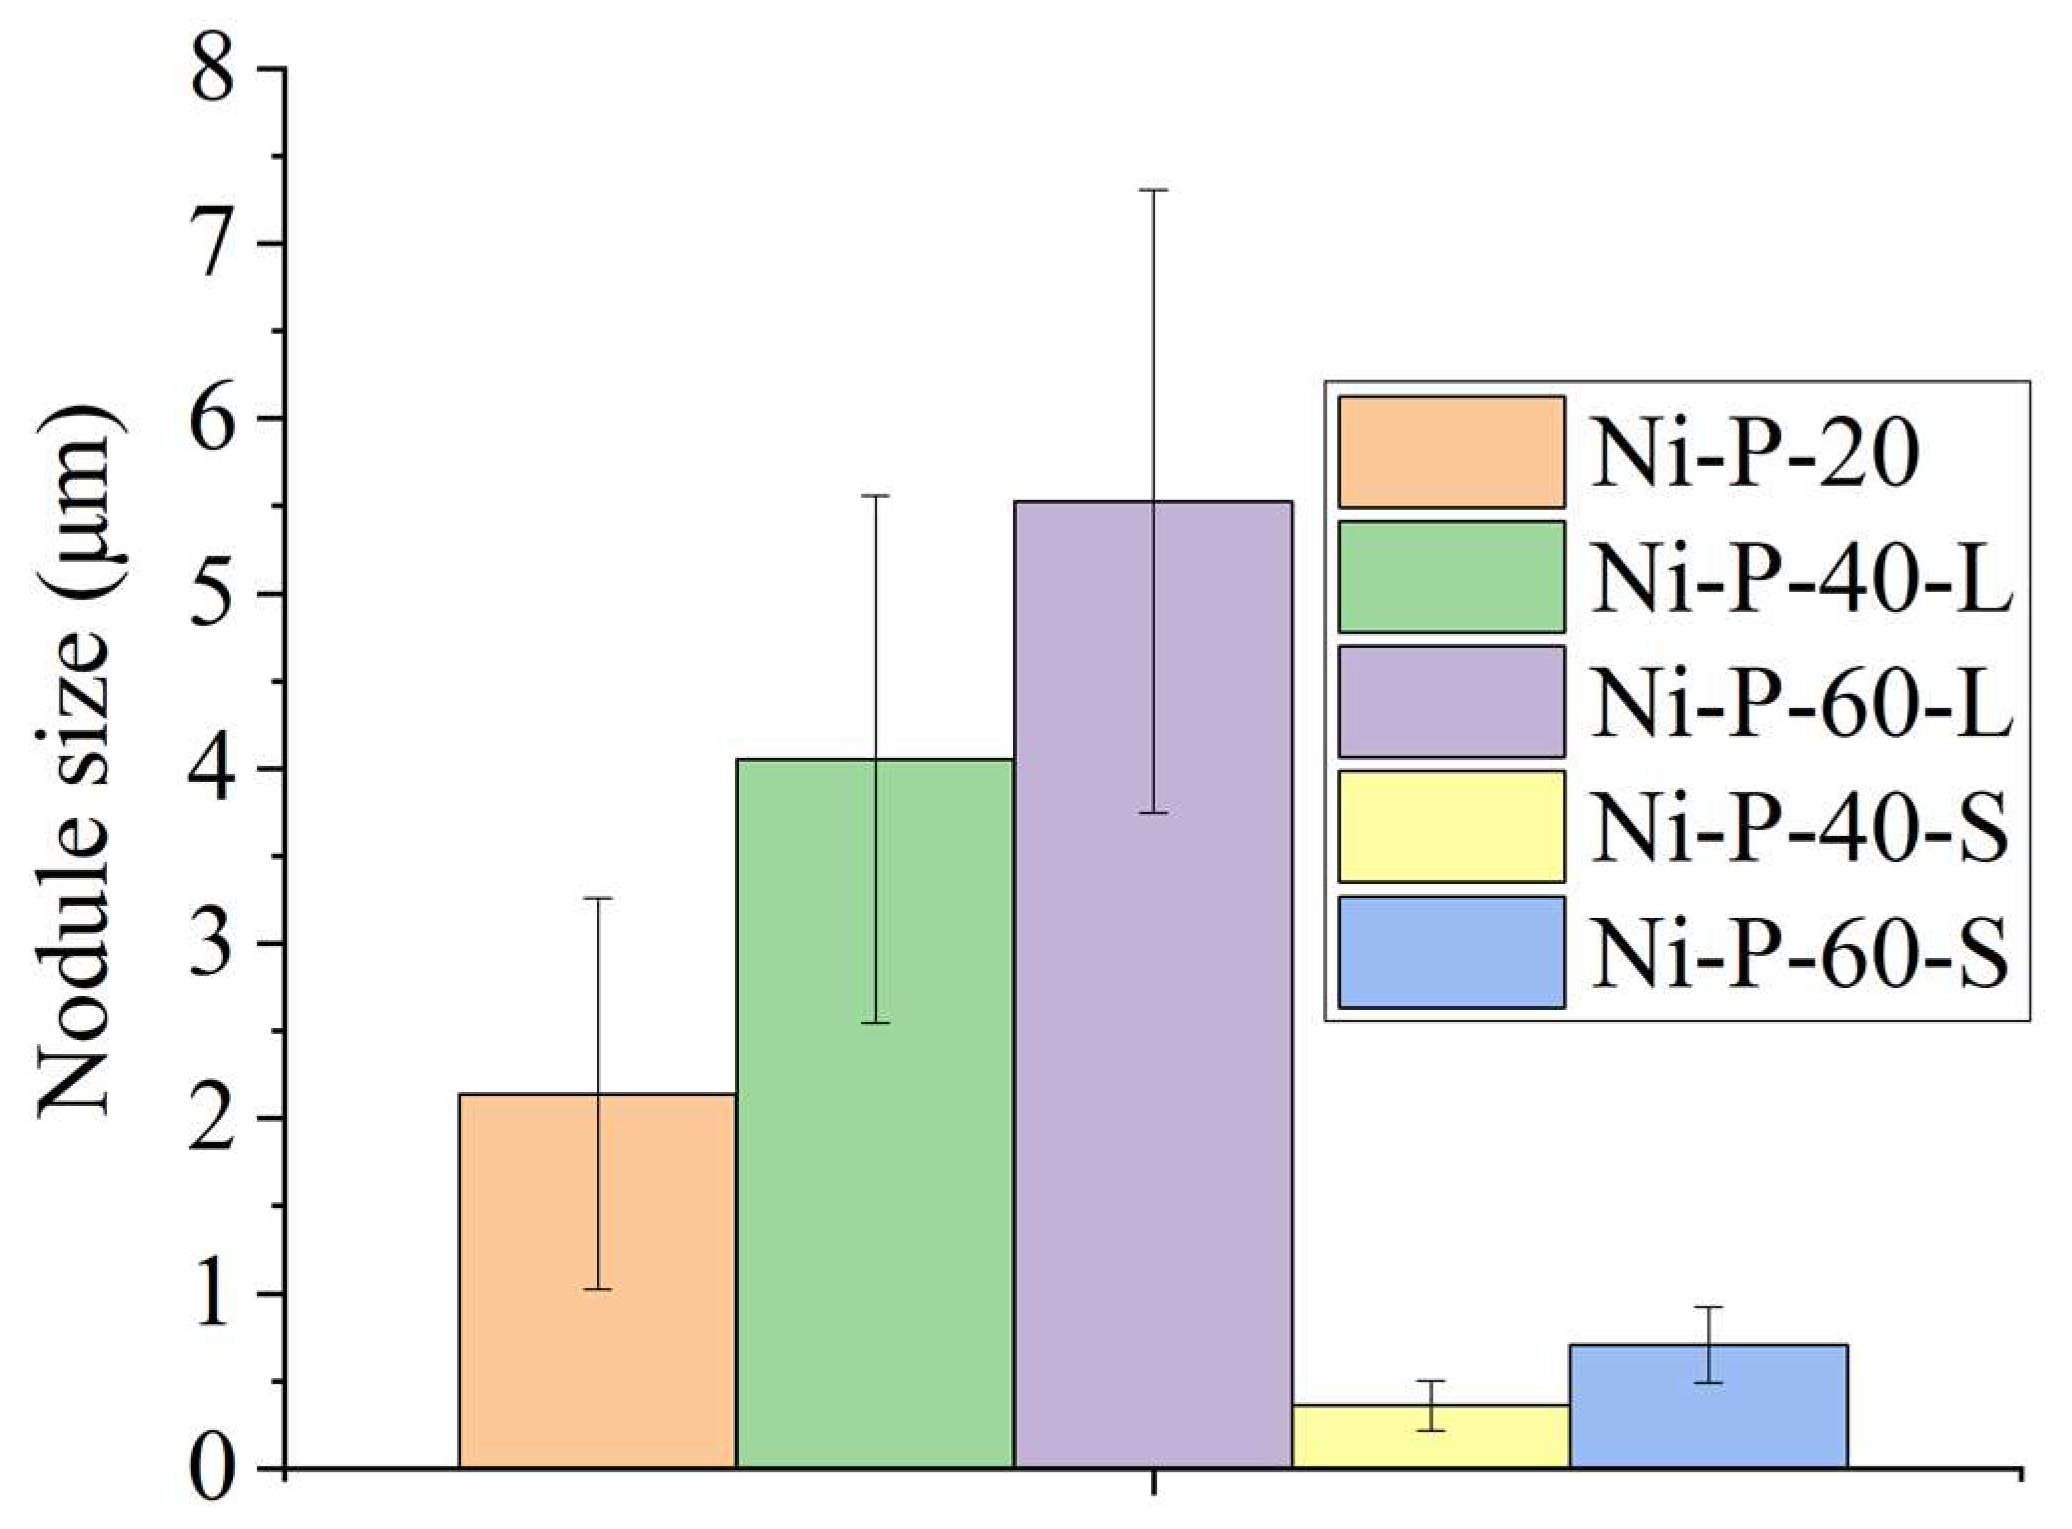
Top-view SEM images reveal the characteristic nodular or cauliflower-like morphology typically associated with electroless Ni–P deposition, arising from an autocatalytic growth process where newly formed Ni–P islands act as active sites for further reduction and competitive growth [29,76,77,78]. The morphological evolution follows a clear time-dependent scenario. At 20 min (Figure 1a), the coating surface is dominated by relatively large, rounded primary nodules. This indicates an early-stage growth regime where discrete nuclei have already coarsened. At 40 min (Figure 1b), morphology becomes more clearly hierarchical. Smaller nodules form on top of the previously developed larger ones, yielding a pronounced cauliflower-like appearance and a visibly reduced fraction of open gaps between adjacent nodules [76]. This morphology is consistent with the appearance of secondary nodules on the previously formed larger surface features [29,42,79]. At 60 min (Figure 1c), the surface appears denser and more laterally continuous at lower magnification. The coating still exhibits a nodular substructure, while the overall morphology appears more continuous. This suggests progressive coverage of the regions between neighboring nodules as deposition proceeds, rather than a complete loss of nodular surface features. A similar interpretation has been reported in the literature for continued growth of electroless Ni–P coatings via nodular enlargement and partial filling of inter-nodular regions [42,80,81]. Taken together, the 40 and 60 min coatings exhibit a more developed nodular hierarchy than the 20 min coating. In particular, the 40 min surface likely provides a higher density of inter-nodular boundaries and related surface features, which may improve electrolyte access to electrochemically active Ni sites. Similar boundary-controlled accessibility has also been reported for electroless Ni-based coatings, where pore- and boundary-related surface features were identified as ion-accessible regions contributing to the electrochemical response [46,82]. These observations indicate clear time-dependent changes in surface morphology. To quantify these differences, the characteristic nodule sizes were evaluated from the SEM images (Figure 2). The results confirm that the primary nodules became larger with increasing deposition time, while a secondary population of smaller nodules was distinguishable for the 40 and 60 min coatings. The relatively large standard deviations, especially for the primary nodule population, are attributed to the broad nodule-size distribution and to the gradual merging of neighboring nodules during growth. As the boundaries between adjacent nodules become less well defined, the error bars in Figure 2 mainly reflect the variation in nodule size and morphology within the analyzed SEM fields of view.
The semi-quantitative EDS results, summarized in the inset tables of Figure 1, confirm that the coatings are predominantly composed of Ni and P and reveal a distinct deposition-time-dependent shift in the measured elemental composition. As the process progresses from 20 to 60 min, the phosphorus content increases from 4.86 at% to 8.16 at%, accompanied by a corresponding decrease in the nickel content from 95.14 at% to 91.84 at%. Similar deposition-time- and analysis-depth-dependent compositional variations have been reported for electroless Ni–P coatings based on EDS, EPMA, and XPS measurements [29,43,83]. The observed increase in P content is consistent with the time-dependent growth of electroless Ni–P coatings, where continued deposition can lead to higher phosphorus incorporation and the formation of P-enriched regions on the growing nodular surface [84,85]. Such P-containing surface regions may locally reduce the availability of Ni-rich active growth sites, contributing to the apparent increase in the measured P/Ni ratio at longer deposition times. Since EDS averages the composition over a near-surface interaction region and is affected by local surface morphology, these values are treated as semi-quantitative.
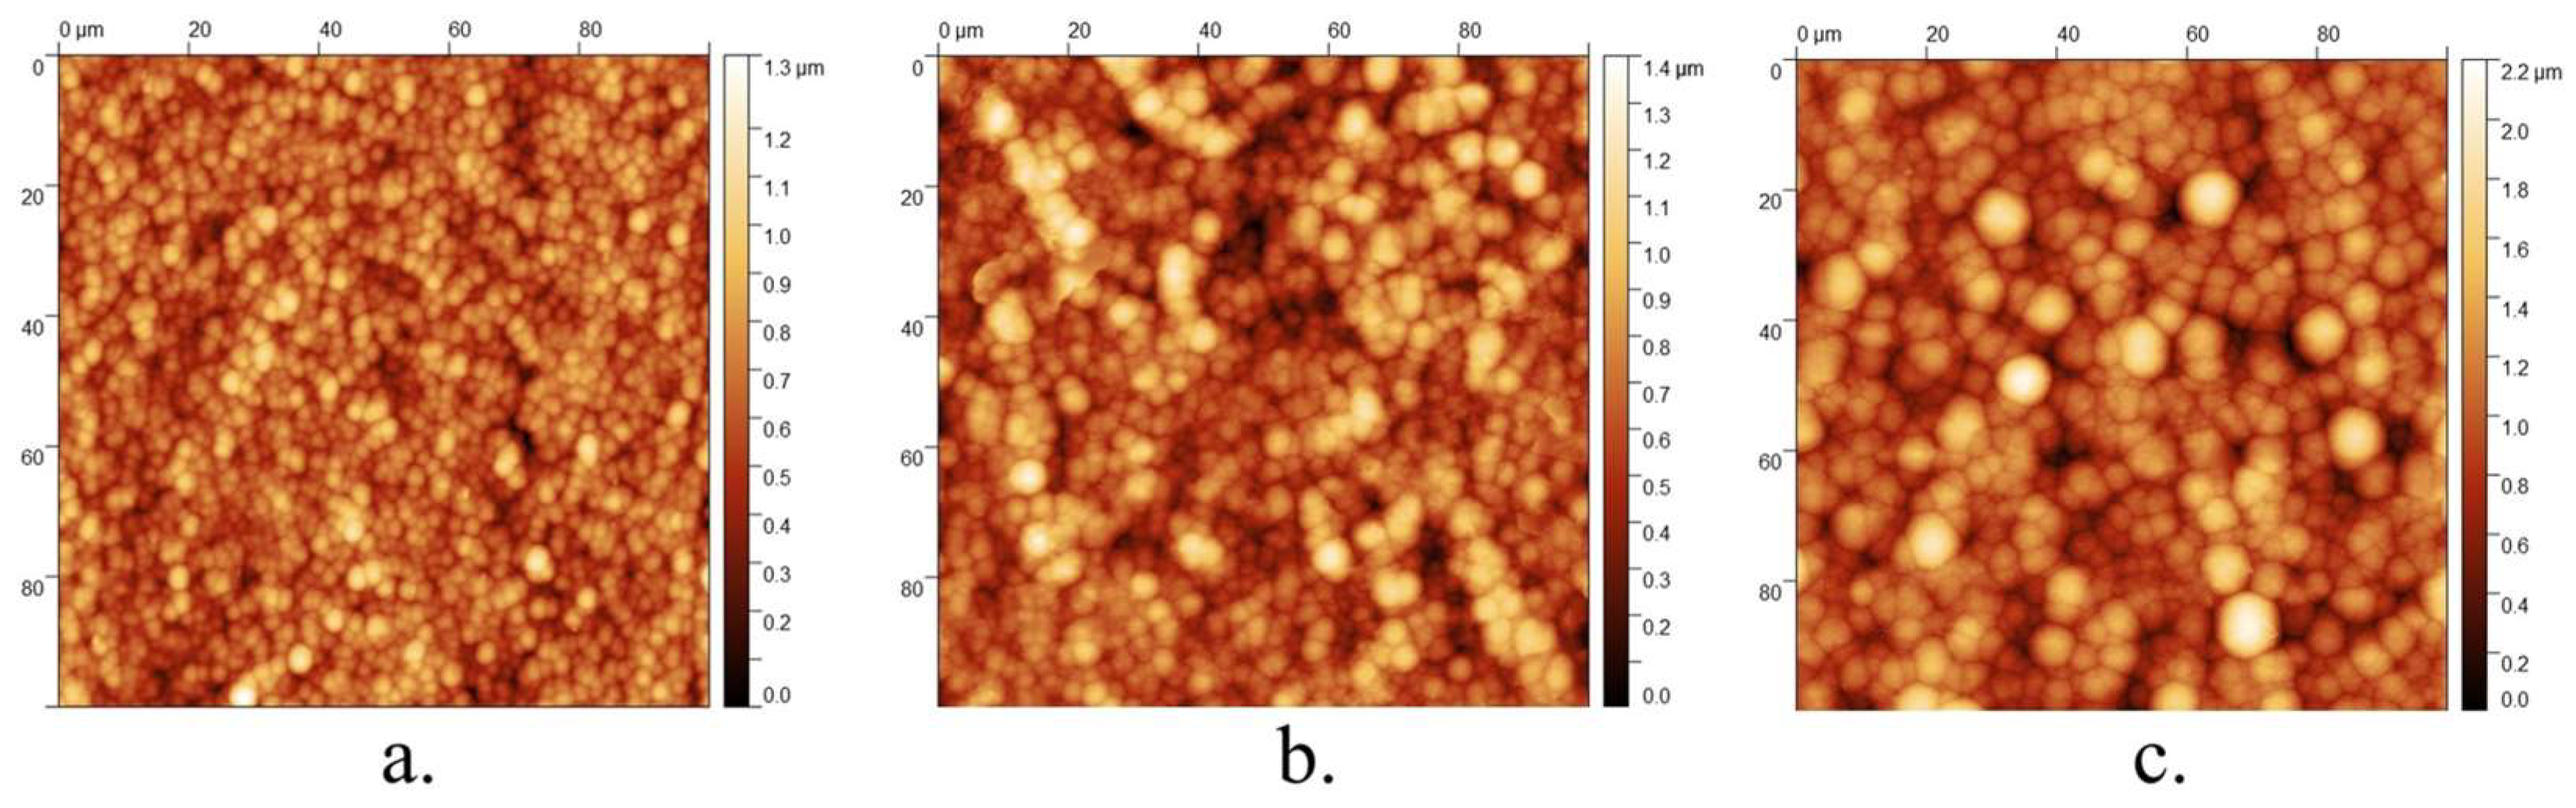
AFM height maps (Figure 3) reveal a nodular surface topography for all electroless Ni–P coatings, with a clear time-dependent increase in the vertical amplitude and roughness [86,87]. Quantitatively, the areal roughness parameters increase monotonically with deposition time (Table 2): the mean areal roughness Sa rises from 107.96 nm (20 min) to 148.25 nm (40 min) and 202.15 nm (60 min). Consistent with the height maps, both the maximum peak height (Sp) and the maximum pit depth (Sv) increase with deposition time, with Sp rising from 0.77 μm (20 min) to 0.90 μm (40 min) and 1.10 μm (60 min), while Sv increases from 0.54 μm to 0.62 μm and 1.02 μm, respectively.
Although the AFM results indicate a gradual increase in surface development with deposition time, the calculated area enlargement remains limited, amounting to only ~1.9% for the 20–40 min coatings and ~3.0% for the 60 min coating (Table 2). A similarly moderate AFM-derived surface-area increase was previously observed for electroless Ni–B coatings despite clear morphology changes [82]. This should be interpreted with caution, since the surface area measured by AFM does not necessarily reflect the true specific surface area of the coating, thus the method cannot fully account for nano-, meso-, and microporous structural features [88]. Instead, AFM mainly characterizes the outer topography of the surface. Therefore, SEM-based analysis of nodular morphology may provide a more realistic description of the surface structure relevant to electrolyte accessibility.

3.2. Electrochemical Characterization of Electroless Ni–P Coatings

Cyclic voltammetry (CV), electrochemical impedance spectroscopy (EIS), and galvanostatic charge–discharge (GCD) measurements were employed to compare the electrochemical response of electroless Ni–P. Prior to evaluation, preliminary scans were used to define a potential window appropriate for reversible charge-storage comparison while avoiding electrolyte decomposition. Based on these tests, a window of 0–0.55 V vs. Ag/AgCl was selected.
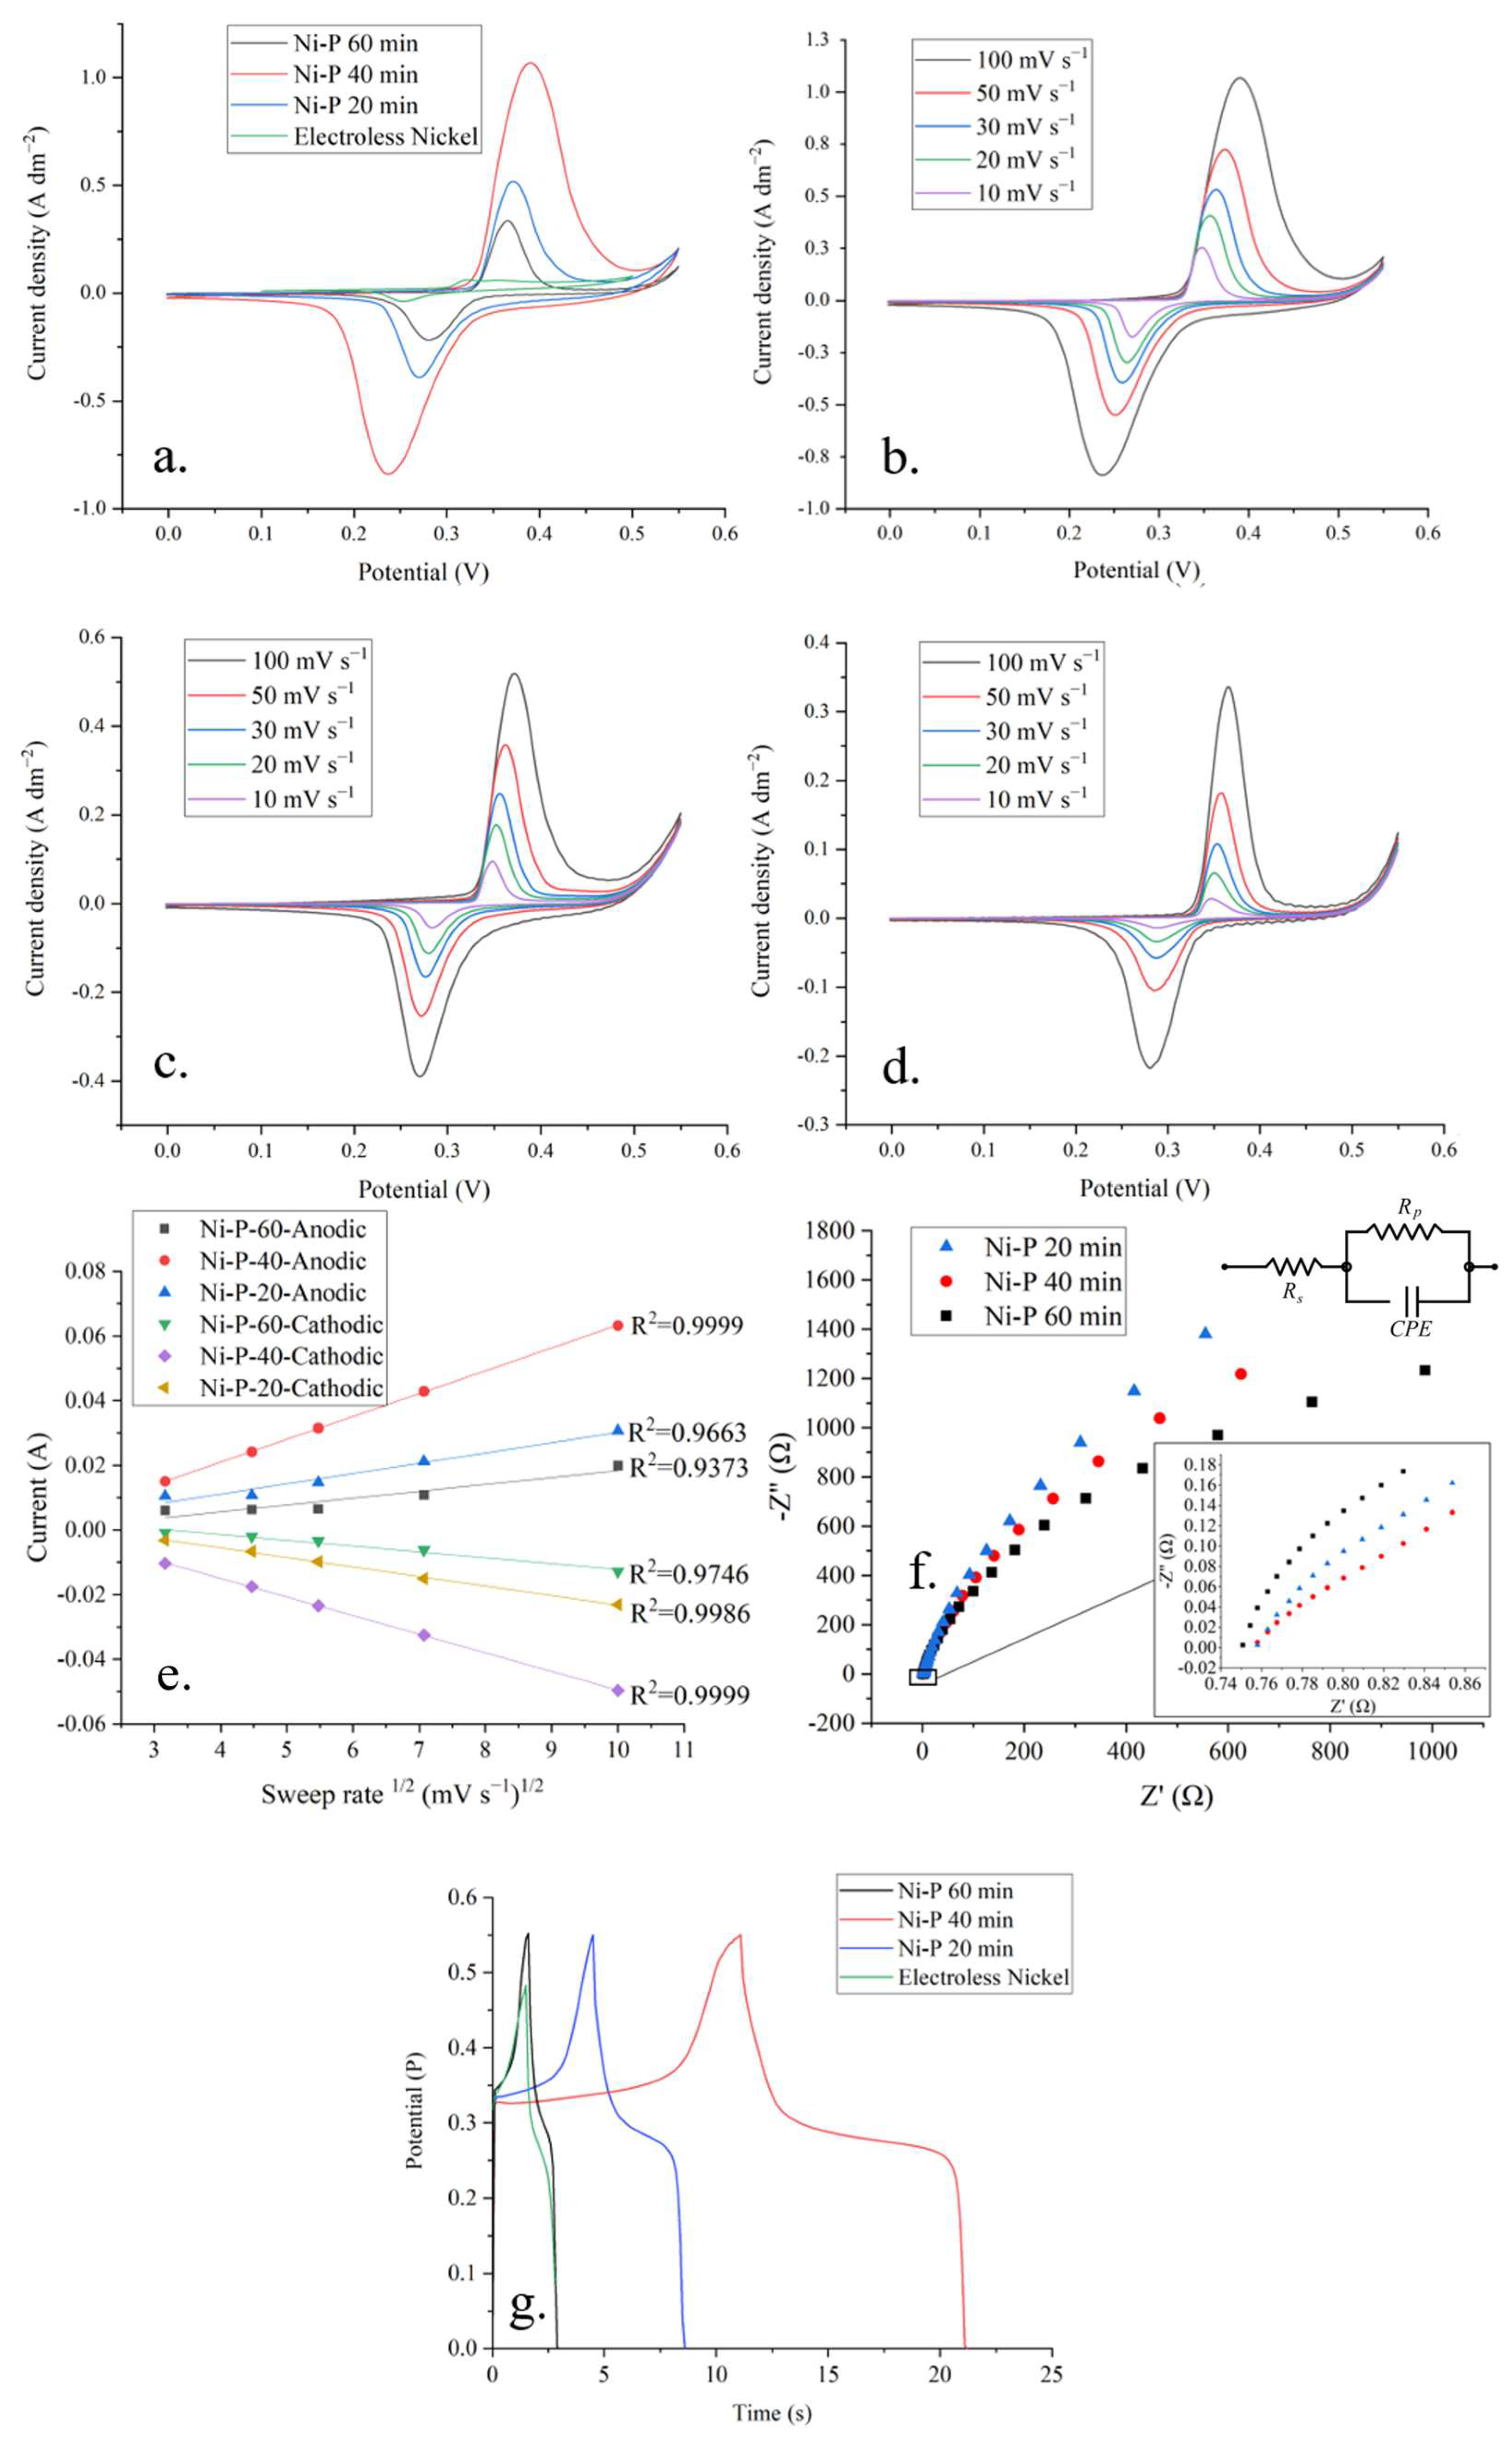
The voltammetric response was first assessed by CV curves recorded at 100 mV s−1 (Figure 4a). It showed a strong dependence on deposition time [89,90]. Among the investigated Ni–P coatings, the 40 min deposit exhibits the largest enclosed CV area and the highest anodic and cathodic current response, whereas the 60 min coating shows the smallest response, and the 20 min coating remains intermediate. The electroless Ni reference, included here for comparison, was taken from our previous work [82] and displays a markedly smaller voltammetric response than the optimized Ni–P coating under the same conditions. Since the enclosed voltammetric area provides a direct comparative measure of the charge-storage response, the areal capacitance derived from CV can be expressed from equation (1). However, the CV profiles within the selected window are dominated by pronounced Faradaic features; therefore, the CV data were interpreted primarily based on the integrated response and the peak-current evolution.
To assess scan-rate dependence, CV series were recorded over 10–100 mV s−1 (Figure 4b–d). Across this range, each sample retained its characteristic voltammetric shape, and no additional redox processes emerged within the chosen potential window. For all three coatings, the anodic and cathodic peak currents increased systematically with scan rate. Accordingly, the peak current densities were plotted against v1/2 (Figure 4e). The approximately linear dependence of peak current on square root of scan rate indicates that the response in this window is strongly influenced by diffusion-assisted Faradaic kinetics rather than by purely ideal capacitive charging [91,92]. The 40 min coating gave the highest anodic and cathodic peak currents at all investigated scan rates, in line with the qualitative trend observed in the CV profiles. The 20 min coating again occupied an intermediate position, while the 60 min sample showed the weakest peak-current response.
The resistive and interfacial contributions were examined by EIS (Figure 4f). The Nyquist plots consist of a high-frequency intercept followed by a depressed arc and a low-frequency tail, indicating the combined presence of ohmic resistance, local interfacial polarization, and lower-frequency capacitive transport-related contributions [93]. Since the low-frequency region showed distributed, non-ideal behavior, the quantitative evaluation was restricted to the initial high-frequency arc. Accordingly, the fitted Rp values are interpreted here as indicators of the local high-frequency interfacial polarization response rather than as full-spectrum charge-transfer resistances.
For all coatings, Rp decreased from the lower to the middle and upper potential points, indicating a more favorable fast interfacial response at more anodic potentials [71,94]. At the middle point, Rp was 0.48, 0.99, and 1.14 Ω cm2 for the 40, 20, and 60 min coatings, respectively (Table 3). The fitted Rs values remained in the range of 0.76 Ω, while the CPE exponent n ranged from 0.7 to 0.75, consistent with a non-ideal but strongly capacitive interfacial response [95]. The magnified high-frequency region in Figure 4f shows the smallest local arc for the 40 min coating, an intermediate response for the 20 min coating, and the largest arc for the 60 min coating.
At lower frequencies, however, the relative ordering of the spectra changes. This indicates that the high- and low-frequency regions reflect different contributions to the overall impedance response: the initial high-frequency arc mainly probes the fast local response of the outer active surface, whereas the low-frequency branch increasingly includes distributed charge-storage, ion-transport, and accessibility-related effects [71,96]. Overall, the EIS results indicate that the 40 min coating exhibits the most favorable local high-frequency interfacial response, while the differences at lower frequencies reflect additional transport-related contributions beyond the HF response alone.
Galvanostatic charge–discharge measurements were used to quantify charge storage under constant-current conditions. Representative GCD profiles recorded within 0–0.55 V vs. Ag/AgCl at 5 mA cm–2 are shown in Figure 4g, including the electroless Ni reference. In agreement with the CV results, the 40 min Ni–P coating exhibits the longest discharge time, the 20 min coating is intermediate, and the 60 min coating shows the shortest discharge duration. The electroless Ni reference displays a considerably shorter discharge profile than the optimized Ni–P layer. The non-linear shape of the GCD curves confirms that the electrochemical response within this window is not purely electric-double-layer-like but contains a substantial Faradaic contribution [97]. The areal capacitance derived from GCD was calculated from the discharge branch according to
C A = J Δ t Δ V e f f
where J is the applied current density, Δt is the discharge time, and ΔVeff is the effective potential window used for evaluation. In the present work, ΔVeff corresponded to the applied discharge interval of 0–0.55 V. This expression is equivalent to Equation (2) but is reformulated in terms of geometric current density for the areal capacitance evaluation.
To examine load-dependent behavior within the Ni–P series, areal capacitances were evaluated at both 5 and 10 mA cm−2 (Figure 4). At 10 mA cm−2, the resulting areal capacitances were 149.0, 300.8, and 43.8 mF cm−2 for the 20, 40, and 60 min coatings, respectively. At 5 mA cm−2, the same ordering was preserved, yielding 189.2, 426.5, and 66.2 mF cm−2 for the respective samples. Independent of the applied galvanostatic load used here, the 40 min coating consistently delivered the highest area-normalized charge-storage response, while the 60 min sample remained the weakest performer. Thus, the GCD results independently confirm the deposition-time-dependent ordering observed by CV and EIS.
From each batch of electroless Ni–P plating, five samples were used for electrochemical measurements.
Although direct benchmarking is difficult because most reported Ni–P systems differ in substrate, morphology, metric, or post-treatment, the present values fall within a broader literature landscape in which as-deposited electroless Ni–P coatings show modest or composition-insensitive capacitance, whereas substantially higher values are typically achieved only after introducing porous structures or high-surface-area supports [18,46].

3.3. XPS Results

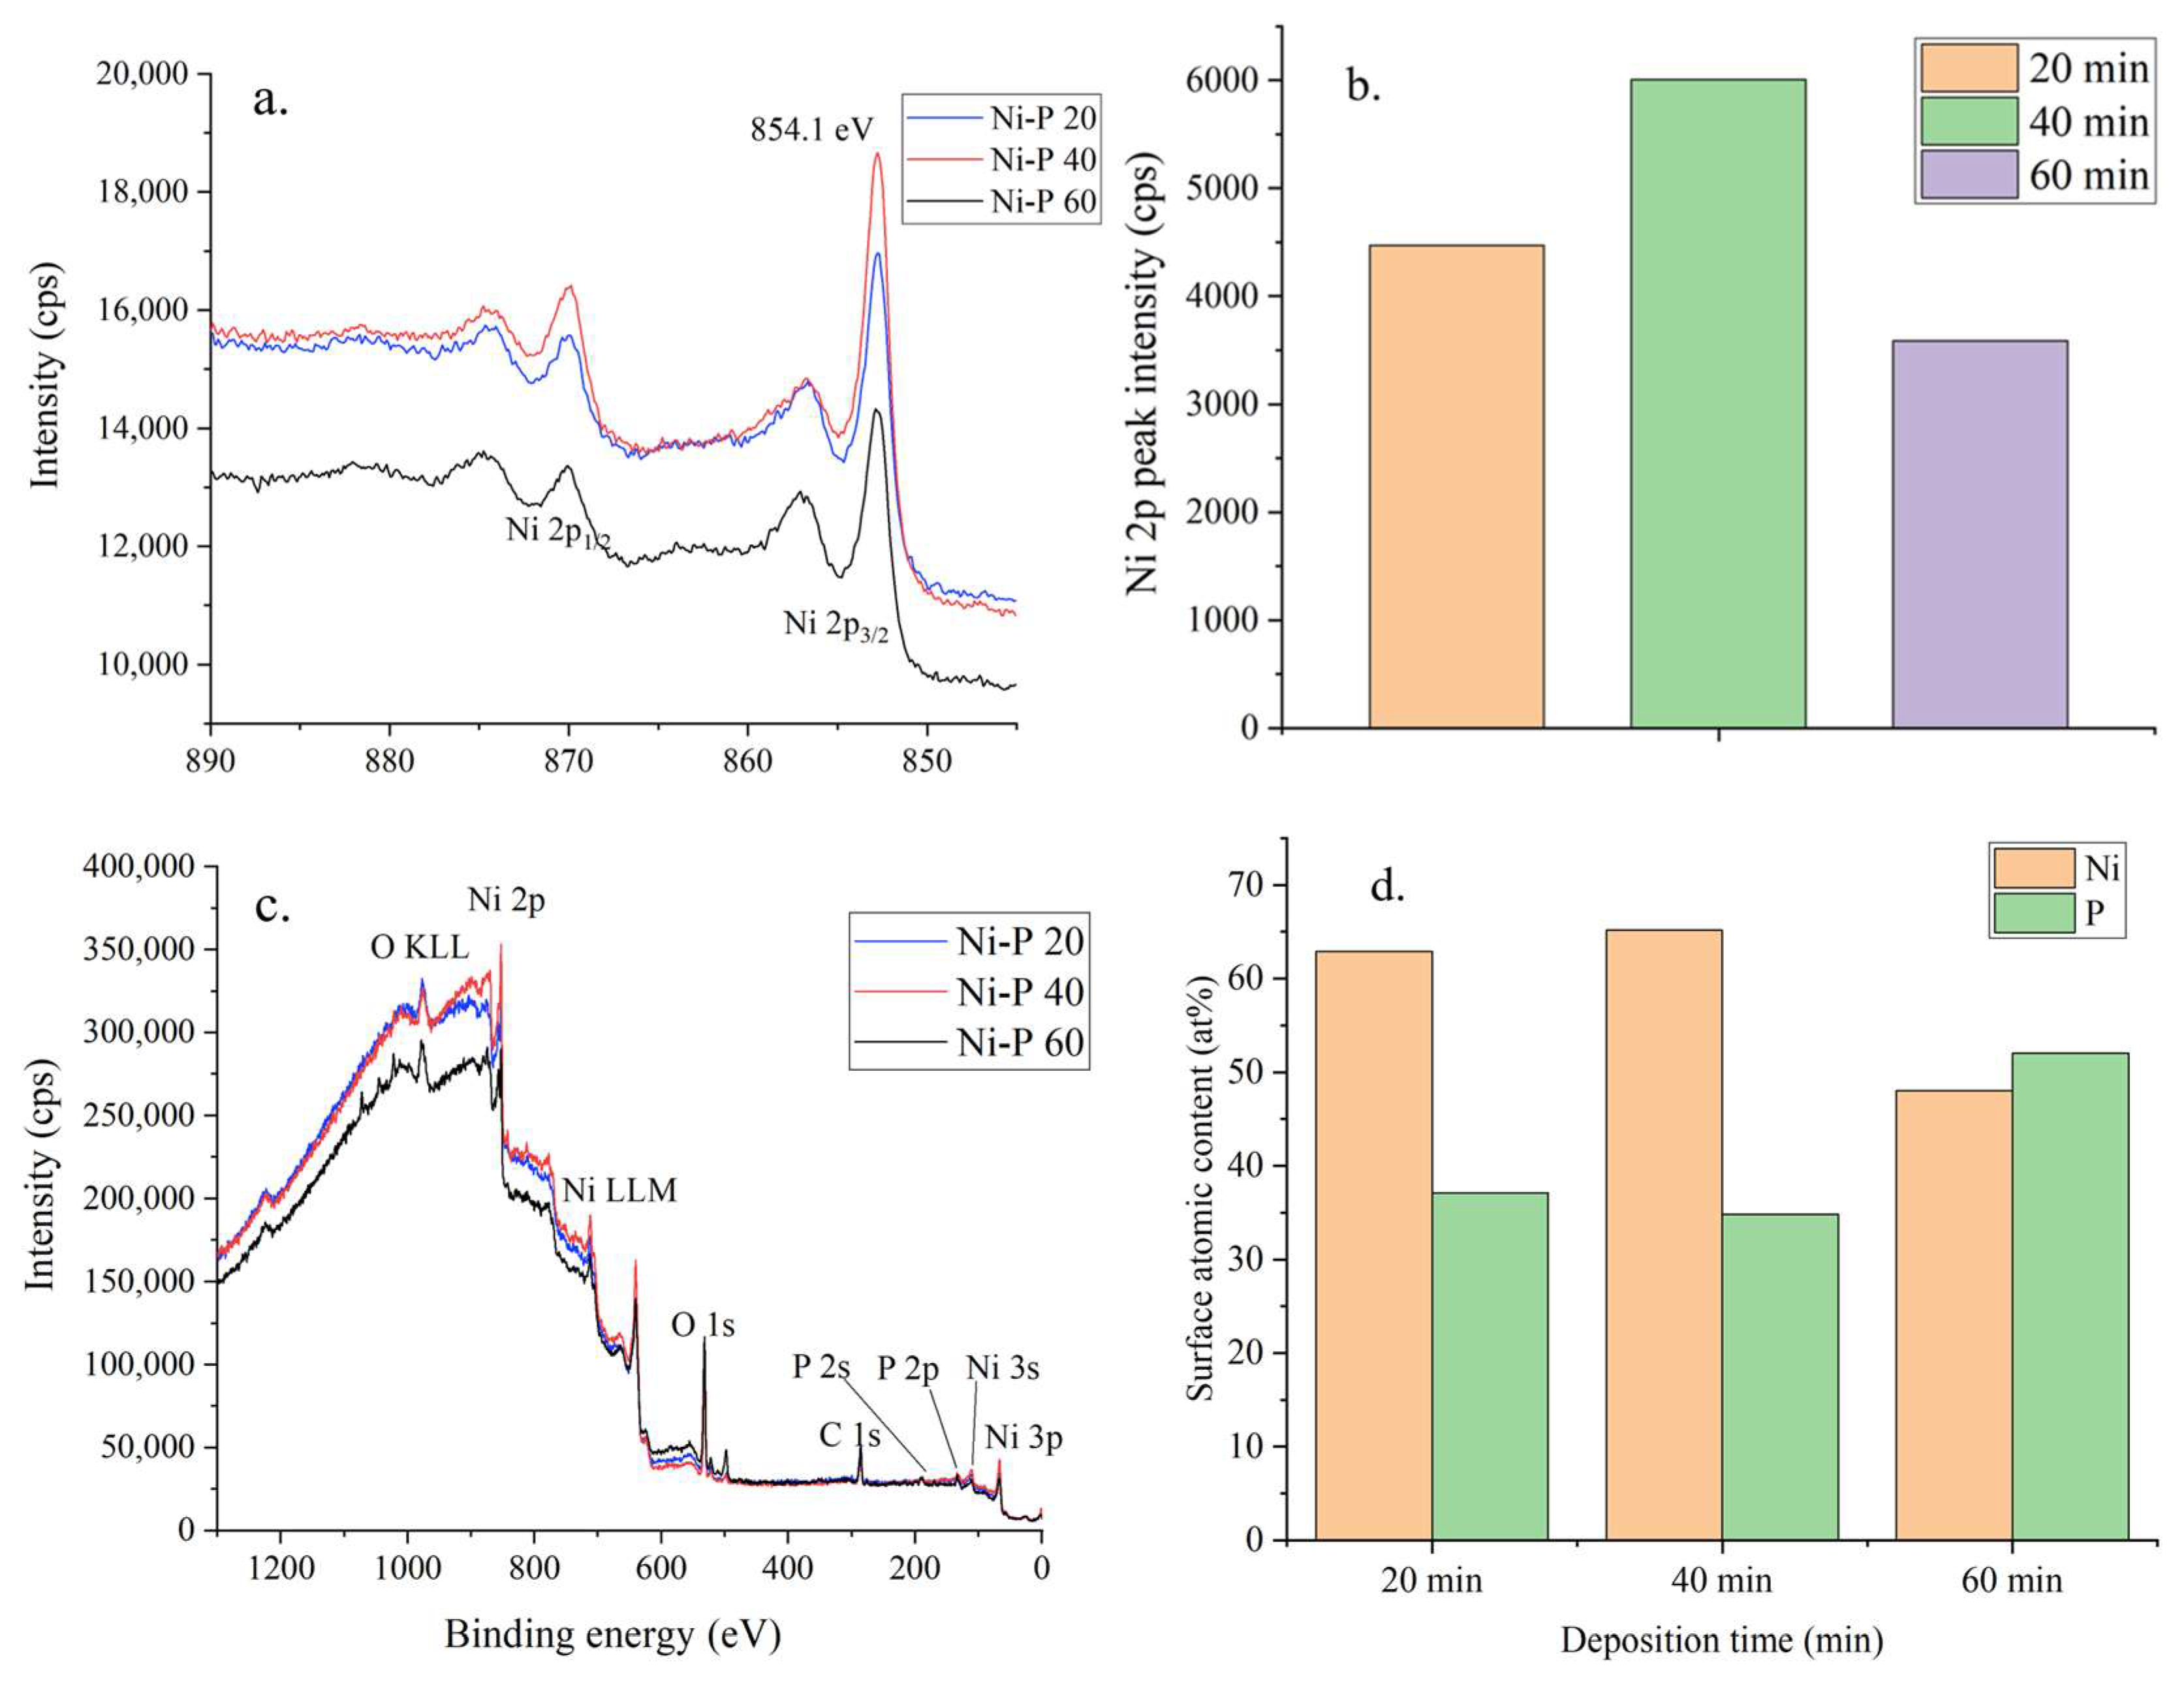
XPS analysis of the electroless Ni–P coatings further revealed a clear deposition-time-dependent variation in surface composition (Figure 5) [85]. The survey spectra (Figure 5 a,c) confirmed the presence of the characteristic Ni and P signals for all coatings, together with O 1s and C 1s contributions originating from the outermost surface layer. While the overall spectral shape remained similar for the 20, 40, and 60 min samples, noticeable differences in the peak intensities of the Ni- and P-related features were observed as a function of deposition time.
The high-resolution Ni 2p spectra (Figure 5a) showed a distinct Ni 2p3/2 contribution at 854.1 eV, accompanied by the corresponding Ni 2p1/2 component at higher binding energy [98]. The presence of the Ni 2p3/2 feature at 854.1 eV indicates that the outermost surface contains oxidized Ni2+ species, typically associated with NiO- and/or Ni(OH)2-like surface states. The intensity of the Ni 2p3/2 signal varied systematically among the samples. As summarized in Figure 5b, the 40 min coating exhibited the highest Ni 2p3/2 peak intensity, followed by the 20 min sample, whereas the 60 min coating showed the lowest value. Since oxidized Ni surface species, particularly hydroxide/oxide-type nickel states, are closely related to pseudocapacitive charge storage in alkaline media, the more intense Ni2+ related signal observed for the 40 min coating is consistent with its superior electrochemical performance. A similar role of surface Ni(OH)2-type species in enhancing the capacitive response was also observed by Czagány et al. previously for electroless Ni–B coatings [82].
Quantitative XPS evaluation of the surface composition (Figure 5d) showed that the Ni and P atomic contents also changed with deposition time. The 20 and 40 min coatings were characterized by Ni-rich surfaces, with Ni contents of approximately 63 and 65 at.%, respectively, and corresponding P contents of about 37 and 35 at.%. In contrast, the 60 min coating showed a markedly different surface composition, with the Ni content decreasing to approximately 48 at.% and the P content increasing to about 52 at.%. Thus, prolonged deposition resulted in a more P-rich outermost surface layer, whereas the intermediate deposition time produced the highest relative Ni signal and the highest surface Ni atomic fraction.

4. Discussion

The electrochemical response of the electroless Ni–P coatings showed a clear non-monotonic dependence on deposition time. Although the deposited mass, coating thickness, and AFM-derived roughness increased progressively from 20 to 60 min, both CV- and GCD-derived areal capacitances reached a pronounced maximum at 40 min and decreased sharply at 60 min. This decoupling shows that the charge-storage response does not scale with deposited mass alone but is more closely associated with the composition and electrochemical accessibility of the activated near-surface region [90,99,100].
To place the obtained capacitance values in the context of the current literature, the present coating was compared with representative Ni–P supercapacitor electrodes (Table 4). Direct numerical comparison should be treated with caution because the reported capacitance values are strongly affected by the normalization method, electrode architecture, substrate, active-material loading, and post-treatment route. In the present work, the best-performing electroless Ni–P coating delivered an areal capacitance of 426.5 mF cm−2 at 5 mA cm−2. This value was obtained for a directly deposited, binder-free coating on steel, without a porous carbon support or post-deposition etching. By contrast, several literature systems report higher gravimetric capacitance values, but they typically rely on different Ni–P architectures, such as amorphous or powder-type Ni–P materials, conductive high-surface-area supports, flexible substrate-supported Ni–P films, or post-deposition etched Ni–P coatings. Therefore, the present results should not be interpreted as a direct performance competition with porous, etched, or support-assisted Ni–P electrodes. Rather, their significance lies in demonstrating that deposition time alone can generate a clear electrochemical optimum in a simple electroless Ni–P coating system.
Surface roughness and nodular morphology can influence the capacitance response by increasing the electrolyte-contacting area and the number of potentially accessible interfacial sites. In the present case, however, the morphological trends do not follow the electrochemical response directly. SEM revealed a time-dependent transition from relatively large primary nodules at 20 min to a more hierarchical surface at 40 min, followed by a denser and more laterally continuous morphology at 60 min. AFM also showed a monotonic increase in roughness with deposition time; however, the calculated surface-area increase remained modest, amounting to about 1.9% for the 20 and 40 min coatings and about 3.0% for the 60 min coating relative to the projected area. If surface geometry alone controlled the electrochemical response, the 60 min coating would be expected to show the highest capacitance, which is clearly not the case. This indicates that topographic roughness contributes to the electrode response but does not determine the capacitance trend by itself. Moreover, the AFM-derived surface enlargement describes only the outer topography and does not necessarily represent the electrochemically active surface area available for Faradaic charge storage. Therefore, the lower capacitance of the 60 min coating, despite its higher roughness, is more likely related to reduced accessibility of Ni-containing redox-active sites, surface densification, P enrichment, and/or transport limitations within the more developed nodular surface [47,102,103].
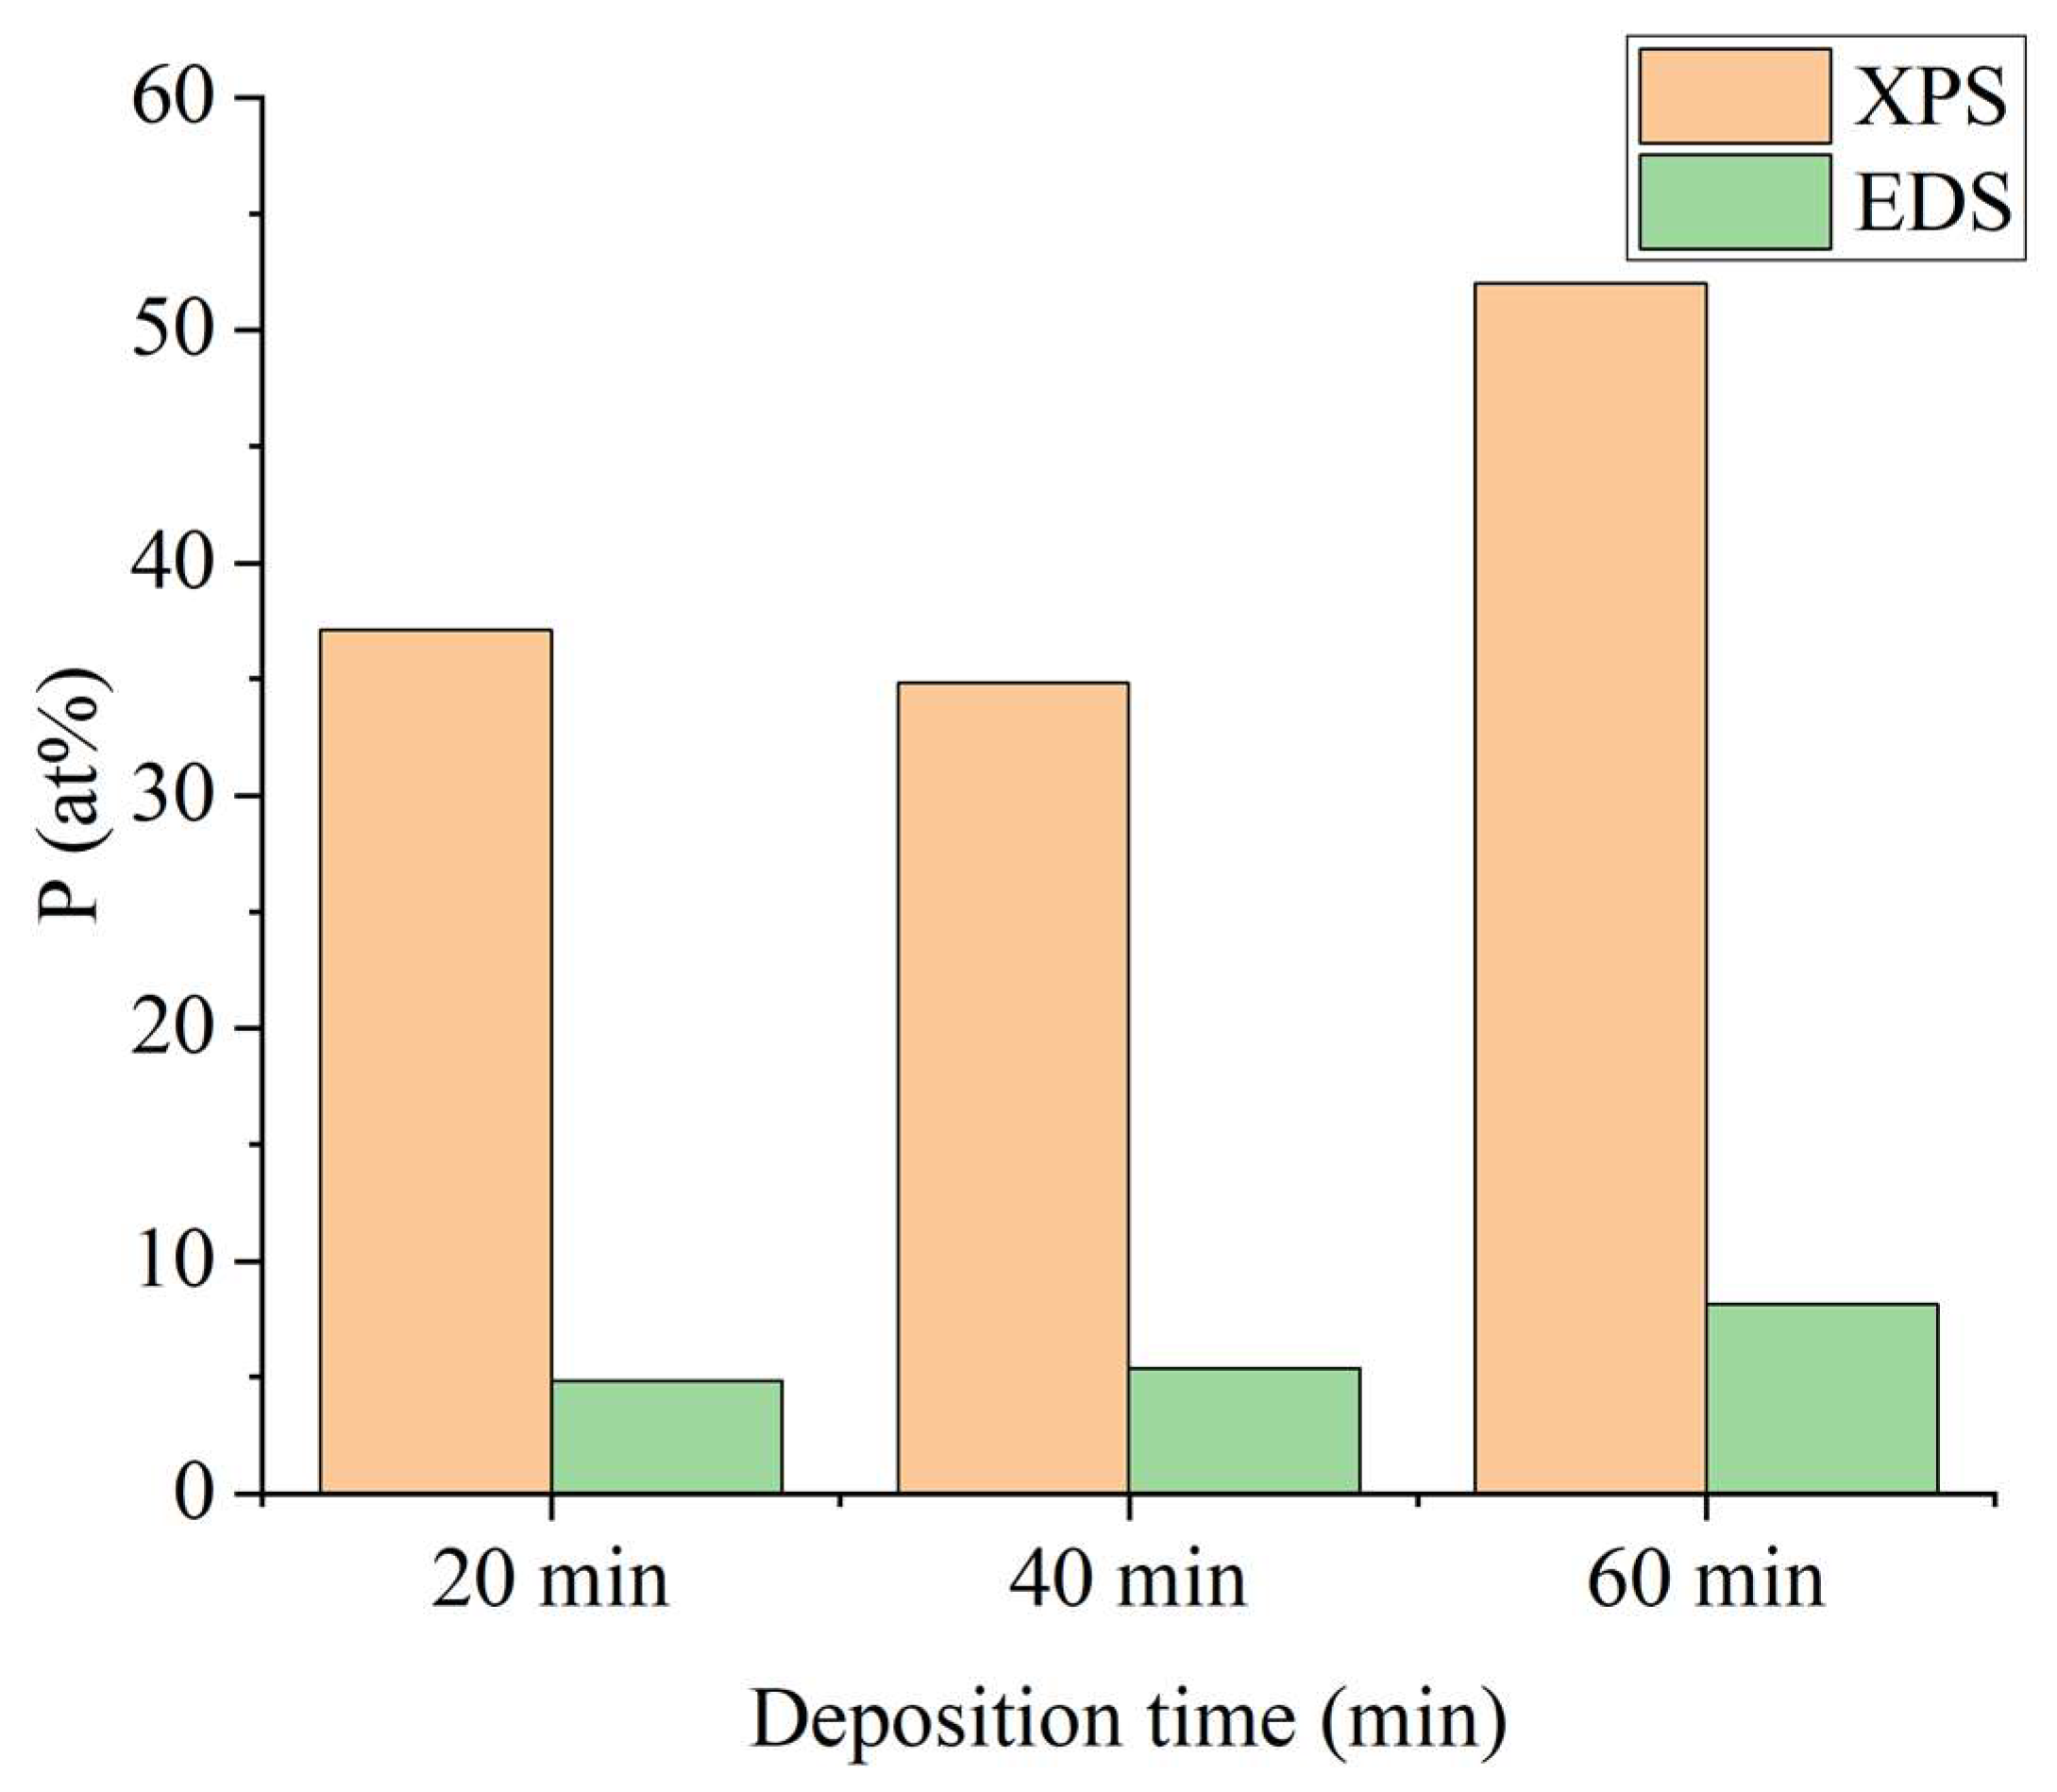
The strongest correlation was observed with the XPS-derived surface composition. After electrochemical conditioning, the 40 min coating exhibited the highest surface Ni signal, while the 60 min coating showed a lower Ni contribution together with a more P-enriched surface state. This trend is also reflected in the surface Ni/P atomic ratio, which changed from 1.69 at 20 min to 1.87 at 40 min and then dropped to 0.92 at 60 min. In parallel, the surface P fraction increased at the longest deposition time. These observations associate the 40 min optimum with a more Ni-rich near-surface composition, whereas prolonged deposition promotes a less favorable, P-enriched outermost surface. Since the pseudocapacitive response in an alkaline electrolyte is expected to originate primarily from electrochemically accessible Ni-containing surface sites, the depositiontime-dependent change in surface composition provides the most plausible explanation for the non-monotonic capacitance trend within the present dataset [100,103]. A comparison of the phosphorus content obtained by EDS and XPS measurements (Figure 6) further supports the interpretation proposed above. Although both techniques indicate an increase in P content at 60 min, the XPS-derived values show a much stronger deposition-time dependence than the EDS results. In particular, the XPS surface P content is lowest for the 40 min coating and highest for the 60 min coating, which is opposite to the capacitance trend. By contrast, the EDS-derived P values vary only slightly with deposition time and do not reflect the electrochemical behavior as clearly. This difference indicates that the capacitance is governed primarily by the outermost surface region rather than by the average near-surface composition. Accordingly, the stronger inverse correlation between XPS-derived surface P content and capacitance supports the conclusion that surface P enrichment becomes unfavorable for electrochemical performance, most likely because it is accompanied by a reduced accessibility of active Ni-based surface sites.
The EIS results further support this interpretation. In the local high-frequency region, the 40 min coating showed the smallest arc, while the 60 min coating exhibited the largest one. This trend is consistent with the fitted middle-potential Rp values, which were 0.48, 0.99, and 1.14 Ω cm2⋅for the 40, 20, and 60 min coatings, respectively. Thus, the 40 min sample exhibited the most favorable local interfacial response, whereas the 60 min coating was associated with the highest local polarization. At lower frequencies, however, the relative ordering of the spectra changed, indicating that the full impedance response also includes distributed charge-storage, transport, and accessibility-related contributions [71,96,104]. Accordingly, the EIS results do not simply indicate a difference in local HF polarization but also suggest that the thicker 60 min coating likely experiences additional transport- or utilization-related limitations beyond the outermost active surface [90].
Taken together, the results indicate that the electrochemical optimum is reached at 40 min deposition time. In an alkaline electrolyte, charge storage is associated primarily with the reversible Ni(OH)2/NiOOH surface redox transition [47],
N i ( O H ) 2 + O H N i O O H + H 2 O + e
rather than with metallic Ni itself. In this context, the higher Ni signal observed by XPS for the 40 min coating is important because it points to a more favorable surface state for the formation and participation of electrochemically active oxidized nickel species. Phosphorus appears to play a different role. Previous studies on electroless Ni–P coatings have shown that P content strongly influences the amorphous character of the deposit, its corrosion and dealloying behavior, and the microstructure that develops during subsequent surface modification [46,47]. This helps explain why the 60 min coating does not exhibit the best electrochemical performance despite its greater roughness. Although prolonged deposition increases the surface development, it is accompanied by a marked decrease in the relative surface Ni content and a pronounced surface P enrichment, together with a less favorable interfacial response. Specifically, the XPS-derived surface Ni content decreased from 65.16 at% at 40 min to 48.00 at% at 60 min, while the surface P content increased from 34.84 to 52.00 at%. In parallel, the local polarization resistance increased from 0.48 to 1.14 Ω·cm2. Phosphorus is nevertheless not detrimental. Its presence is important for the formation of the amorphous Ni–P structure, which is known to provide significantly higher capacitance than electroless Ni coatings without phosphorus. At the same time, the present results suggest that excessive surface P enrichment becomes unfavorable, because it reduces the accessibility of electrochemically active Ni-based surface sites, including oxidized Ni species associated with NiO- and Ni(OH)2-like states, and thereby deteriorates the electrochemical response. This behavior can be rationalized by considering the dual role of phosphorus at the Ni–P/electrolyte interface. While phosphorus contributes to the amorphous character and chemical stability of electroless Ni–P coatings, a P-enriched outermost region can also act as a passivating or site-diluting surface layer. In an alkaline electrolyte, the pseudocapacitive response of nickel-based surfaces is primarily associated with the reversible Ni(OH)2/NiOOH redox transition; therefore, a decrease in the relative amount or accessibility of oxidized Ni surface sites directly limits the Faradaic charge-storage response. In this sense, the P-rich surface of the 60 min coating may partially block or dilute the electrochemically active Ni sites, which is consistent with its lower Ni 2p signal, higher P content, weaker CV/GCD response, and higher local polarization resistance. The 40 min coating, therefore, appears to provide the most favorable balance between the structural role of phosphorus and the preservation of a Ni-rich, electrochemically accessible surface.
The scope of the present work is defined by the controlled variation of deposition time under fixed electroless Ni–P plating conditions. This approach allowed the effect of coating growth time to be separated from other bath-, substrate-, and hydrodynamics-related factors; however, it also means that the identified 40 min optimum should be interpreted within the applied parameter window. Further studies may examine whether the same interfacial optimum is preserved under different bath compositions, substrate materials, agitation conditions, or post-deposition activation strategies. Within the present experimental range, the combined electrochemical and surface-analytical results show that the capacitance trend does not simply follow coating growth or geometric surface development, but is more consistently associated with the composition and accessibility of the activated near-surface region.

5. Conclusions

Electroless Ni–P coatings showed a clear electrochemical optimum at intermediate deposition time in an alkaline electrolyte. While deposited mass and thickness increased substantially from 20 to 60 min (2.27 → 8.34 → 11.31 μm), the electrochemical response did not scale with loading: areal capacitance reached a pronounced maximum at 40 min and decreased sharply at 60 min.
Morphological analysis showed a time-dependent evolution from primary nodules at 20 min to a more hierarchical nodular structure at 40 min, followed by a denser and more laterally continuous surface at 60 min. AFM confirmed a monotonic increase in roughness and only a modest increase in developed surface area, indicating that geometric surface enlargement alone does not explain the electrochemical optimum. In this respect, AFM and SEM provide useful information on surface evolution, but they are not sufficient on their own to account for the capacitance maximum.
The strongest correlation with electrochemical performance was obtained from the surface-sensitive compositional analysis. XPS showed that the 40 min coating exhibited the highest surface Ni signal and Ni atomic fraction, whereas the 60 min coating became distinctly more P-enriched. These changes indicate that prolonged deposition produces a less favorable outermost interfacial state, likely reducing the population of electrochemically accessible Ni-containing surface sites. The EIS results support this interpretation: the 40 min coating showed the smallest local high-frequency arc and the lowest middle-potential Rp, while the 60 min coating exhibited the highest local polarization and additional low-frequency contributions associated with transport- and accessibility-related limitations.

Author Contributions

Conceptualization, S.H. and M.C.; methodology, S.H. and M.C.; software, not applicable; validation, S.H., M.C., P.B. (Péter Bozzay), T.F. and M.W.; formal analysis, S.H.; investigation, S.H., P.B. (Péter Bozzay), T.F. and M.W.; resources, S.H., M.C., T.F., M.W. and P.B. (Péter Baumli); data curation, S.H.; writing—original draft preparation, S.H.; writing—review and editing, S.H., M.C., P.B. (Péter Bozzay), T.F., M.W. and P.B. (Péter Baumli); visualization, S.H.; supervision, M.C. and P.B. (Péter Baumli); project administration, S.H.; funding acquisition, S.H. and M.C. All authors have read and agreed to the published version of the manuscript.

Funding

The research of S. Hompoth is supported by the University Research Scholarship Program of the Ministry for Culture and Innovation from the source of the National Research, Development and Innovation Fund, KDP–2023-7-C2278017. The research work of M. Czagany is supported by the University Research Scholarship Program of the Ministry for Culture and Innovation from the source of the National Research, Development and Innovation Fund.

Data Availability Statement

The original contributions presented in this study are included in the article. Further inquiries can be directed to the author.

Acknowledgments

The authors gratefully acknowledge Dániel Koncz-Horváth for his assistance with SEM/EDS imaging and compositional analysis.

Conflicts of Interest

Author Márk Windisch was employed by the Bay Zoltán Nonprofit Ltd. for Applied Research. The remaining authors declare that the research was conducted in the absence of any commercial or financial relationships that could be construed as a potential conflict of interest.

References

  1. Zhang, X.; Wang, H.; Liu, G. Friction and Wear of Electroless Ni-P-CS Composite Coating. Metals 2023, 13, 315. [Google Scholar] [CrossRef] [Scilit]
  2. Czagany, M.; Baumli, P. Effect of pH on the Characteristics of Electroless Ni-P Coatings. J. Min. Metall. Sect. B Metall. 2017, 53, 327–332. [Google Scholar] [CrossRef] [Scilit]
  3. Czagány, M.; Baumli, P.; Kaptay, G. The Influence of the Phosphorous Content and Heat Treatment on the Nano-Micro-Structure, Thickness and Micro-Hardness of Electroless Ni-P Coatings on Steel. Appl. Surf. Sci. 2017, 423, 160–169. [Google Scholar] [CrossRef] [Scilit]
  4. Gao, S.; Wu, C.; Yang, X.; Cheng, J.; Kang, R. Study on Adhesion Properties and Process Parameters of Electroless Deposited Ni-P Alloy for PEEK and Its Modified Materials. Coatings 2023, 13, 388. [Google Scholar] [CrossRef] [Scilit]
  5. Genova, V.; Paglia, L.; Pulci, G.; Pedrizzetti, G.; Pranzetti, A.; Romanelli, M.; Marra, F. Medium and High Phosphorous Ni-P Coatings Obtained via an Electroless Approach: Optimization of Solution Formulation and Characterization of Coatings. Coatings 2023, 13, 1490. [Google Scholar] [CrossRef] [Scilit]
  6. Nazari, H.; Barati Darband, G.; Arefinia, R. A Review on Electroless Ni–P Nanocomposite Coatings: Effect of Hard, Soft, and Synergistic Nanoparticles. J. Mater. Sci. 2023, 58, 4292–4358. [Google Scholar] [CrossRef] [Scilit]
  7. Kothanam, N.; Harachai, K.; Qin, J.; Boonyongmaneerat, Y.; Triroj, N.; Jaroenapibal, P. Hardness and Tribological Properties of Electrodeposited Ni–P Multilayer Coatings Fabricated through a Stirring Time-Controlled Technique. J. Mater. Res. Technol. 2022, 19, 1884–1896. [Google Scholar] [CrossRef] [Scilit]
  8. Mainier, F.B.; Fonseca, M.P.C.; Tavares, S.S.M.; Pardal, J.M. Quality of Electroless Ni-P (Nickel-Phosphorus) Coatings Applied in Oil Production Equipment with Salinity. J. Mater. Sci. Chem. Eng. 2013, 1, 1–8. [Google Scholar] [CrossRef]
  9. Lekmine, F.; Naoun, M.; Gana, A.; Temam, H.B. Structural, Mechanical and Corrosion Behavior of Ni-P-TiO2 Composite Coatings: Effect of Current Density. J. Nano-Electron. Phys. 2022, 14, 01009. [Google Scholar] [CrossRef] [Scilit] [PubMed]
  10. Zhang, Y.; Yao, L.; Chen, L. Improved Wear and Corrosion Protection of Ni–P Alloy Coating by an Electrodeposited Ni–Co–P Alloy Coating. Int. J. Electrochem. Sci. 2024, 19, 100756. [Google Scholar] [CrossRef] [Scilit]
  11. Wang, B.; Li, J.; Xie, Z.; Wang, G.; Yu, G. High Corrosion and Wear Resistant Electroless Ni-P Gradient Coatings on Aviation Aluminum Alloy Parts. Int. J. Miner. Metall. Mater. 2024, 31, 155–164. [Google Scholar] [CrossRef] [Scilit]
  12. Ling, J.; Zou, H.; Yang, W.; Lei, K.; Chen, S. Self-Enhanced Electrochemical Properties of Ni–P Nanosphere with Heterogeneous Ni and Ni–P Nanoflake Outer Layer Anchored on Carbon Cloth for Asymmetric All-Solid-State Supercapacitors. J. Mater. Sci. Mater. Electron. 2019, 30, 18088–18100. [Google Scholar] [CrossRef] [Scilit]
  13. Fan, T.; Sun, P.; Zhao, J.; Cui, Z.; Cui, G. Facile Synthesis of Three-Dimensional Ordered Porous Amorphous Ni-P for High-Performance Asymmetric Supercapacitors. J. Electrochem. Soc. 2019, 166, D37–D43. [Google Scholar] [CrossRef] [Scilit]
  14. Li, X.; Ding, R.; Yi, L.; Shi, W.; Xu, Q.; Liu, E. Mesoporous Ni-P@NiCo2O4 Composite Materials for High Performance Aqueous Asymmetric Supercapacitors. Electrochim. Acta 2016, 222, 1169–1175. [Google Scholar] [CrossRef] [Scilit]
  15. Wang, D.; Kong, L.-B.; Liu, M.-C.; Zhang, W.-B.; Luo, Y.-C.; Kang, L. Amorphous Ni–P Materials for High Performance Pseudocapacitors. J. Power Sources 2015, 274, 1107–1113. [Google Scholar] [CrossRef] [Scilit]
  16. Zarebidaki, A.; Jadmavi Nezhad, A. Catalytic Activity of Electroless Ni-Cu-P Coating for Oxygen Evolution Reaction. J. Power Sources 2026, 665, 239083. [Google Scholar] [CrossRef] [Scilit]
  17. Lu, Y.; Liu, J.; Liu, X.; Huang, S.; Wang, T.; Wang, X.; Gu, C.; Tu, J.; Mao, S.X. Facile Synthesis of Ni-Coated Ni2P for Supercapacitor Applications. CrystEngComm 2013, 15, 7071. [Google Scholar] [CrossRef] [Scilit]
  18. Erdemir, F.; Güler, O.; Çanakçı, A. Electroless Nickel-Phosphorus Coated Expanded Graphite Paper: Binder-Free, Ultra-Thin, and Low-Cost Electrodes for High-Performance Supercapacitors. J. Energy Storage 2021, 44, 103364. [Google Scholar] [CrossRef] [Scilit]
  19. Han, Z.; Fang, R.; Chu, D.; Wang, D.-W.; Ostrikov, K. Introduction to Supercapacitors. Nanoscale Adv. 2023, 5, 4015–4017. [Google Scholar] [CrossRef] [Scilit] [PubMed]
  20. Dissanayake, K.; Kularatna-Abeywardana, D. A Review of Supercapacitors: Materials, Technology, Challenges, and Renewable Energy Applications. J. Energy Storage 2024, 96, 112563. [Google Scholar] [CrossRef] [Scilit]
  21. Jiang, L.; Li, D.; Xie, X.; Ji, D.; Li, L.; Li, L.; He, Z.; Lu, B.; Liang, S.; Zhou, J. Electric Double Layer Design for Zn-Based Batteries. Energy Storage Mater. 2023, 62, 102932. [Google Scholar] [CrossRef] [Scilit]
  22. Wang, X.; Kuang, Y.; Le, J.-B. Recent Advances in Calculating Potential of Zero Charge and Helmholtz Capacitance of Metal/Aqueous Solution Interfaces from Ab Initio Molecular Dynamics. Curr. Opin. Electrochem. 2023, 40, 101341. [Google Scholar] [CrossRef] [Scilit]
  23. Conway, B.E.; Birss, V.; Wojtowicz, J. The Role and Utilization of Pseudocapacitance for Energy Storage by Supercapacitors. J. Power Sources 1997, 66, 1–14. [Google Scholar] [CrossRef] [Scilit]
  24. González, A.; Goikolea, E.; Barrena, J.A.; Mysyk, R. Review on Supercapacitors: Technologies and Materials. Renew. Sustain. Energy Rev. 2016, 58, 1189–1206. [Google Scholar] [CrossRef] [Scilit]
  25. Czagany, M.; Hompoth, S.; Keshri, A.K.; Pandit, N.; Galambos, I.; Gacsi, Z.; Baumli, P. Supercapacitors: An Efficient Way for Energy Storage Application. Materials 2024, 17, 702. [Google Scholar] [CrossRef] [Scilit] [PubMed]
  26. Wei, Y.-M.; Kumar, K.D.; Zhang, L.; Li, J.-F. Pseudocapacitive Materials for Energy Storage: Properties, Mechanisms, and Applications in Supercapacitors and Batteries. Front. Chem. 2025, 13, 1636683. [Google Scholar] [CrossRef] [Scilit] [PubMed]
  27. Alshahrie, A.; Arkook, B.; Al-Ghamdi, W.; Eldera, S.; Alzaidi, T.; Bamashmus, H.; Shalaan, E. Electrochemical Performance and Hydrogen Storage of Ni–Pd–P–B Glassy Alloy. Nanomaterials 2022, 12, 4310. [Google Scholar] [CrossRef] [Scilit] [PubMed]
  28. Yu, H.-S.; Luo, S.-F.; Wang, Y.-R. A Comparative Study on the Crystallization Behavior of Electroless Ni-P and Ni-Cu-P Deposits. Surf. Coat. Technol. 2001, 148, 143–148. [Google Scholar] [CrossRef] [Scilit]
  29. Sridhar, N.; Udaya Bhat, K. Effect of Deposition Time on the Morphological Features and Corrosion Resistance of Electroless Ni-High P Coatings on Aluminium. J. Mater. 2013, 2013, 985763. [Google Scholar] [CrossRef] [Scilit]
  30. Li, L.; Wang, J.; Xiao, J.; Yan, J.; Fan, H.; Sun, L.; Xue, L.; Tang, Z. Time-Dependent Corrosion Behavior of Electroless Ni–P Coating in H2S/Cl Environment. Int. J. Hydrogen Energy 2021, 46, 11849–11864. [Google Scholar] [CrossRef] [Scilit]
  31. Xu, S.-A.; Liang, C.-S. Effect of Deposition Time and Temperature on the Performance of Electroless Ni-P Coatings. Int. J. Electrochem. Sci. 2016, 11, 8817–8826. [Google Scholar] [CrossRef] [Scilit]
  32. Miao, N.; Jiang, J.; Wu, W. Influences of Bath Chemistry and Plating Variables on Characteristics of Electroless Ni–P Films on Si Wafers from Alkaline Citrate Solutions. J. Nanomater. 2018, 2018, 1817542. [Google Scholar] [CrossRef] [Scilit]
  33. Anijdan, S.H.M.; Sabzi, M.; Zadeh, M.R.; Farzam, M. The Effect of Electroless Bath Parameters and Heat Treatment on the Properties of Ni-P and Ni-P-Cu Composite Coatings. Mater. Res. 2018, 21, e20170973. [Google Scholar] [CrossRef] [Scilit]
  34. Sudagar, J.; Lian, J.; Sha, W. Electroless Nickel, Alloy, Composite and Nano Coatings—A Critical Review. J. Alloys Compd. 2013, 571, 183–204. [Google Scholar] [CrossRef] [Scilit]
  35. Lelevic, A. Ni-P Coatings Electroplating—A Review, Part I: Pure Ni-P Alloy. arXiv 2018. [Google Scholar] [CrossRef] [Scilit]
  36. Fu, Y.; Xiao, Q.; Yuan, D.; Hu, W.; Huang, B. Atomic Simulation of Phosphorus Segregation in Nickel Grain Boundaries and Its Impact on Deformation Mechanisms. Vacuum 2024, 227, 113363. [Google Scholar] [CrossRef] [Scilit]
  37. Mariani, F.; Magagnin, I.L. Electroless Deposition of NiP Alloys. Master’s Thesis, Politecnico Di Milano, Milan, Italy, 2017. [Google Scholar]
  38. Färber, B.; Cadel, E.; Menand, A.; Schmitz, G.; Kirchheim, R. Phosphorus Segregation in Nanocrystalline Ni–3.6 at.% P Alloy Investigated with the Tomographic Atom Probe (TAP). Acta Mater. 2000, 48, 789–796. [Google Scholar] [CrossRef] [Scilit]
  39. Liu, W.; Ren, C.; Han, H.; Tan, J.; Zou, Y.; Zhou, X.; Huai, P.; Xu, H. First-Principles Study of the Effect of Phosphorus on Nickel Grain Boundary. J. Appl. Phys. 2014, 115, 043706. [Google Scholar] [CrossRef] [Scilit]
  40. Mehta, S.C.; Smith, D.A.; Erb, U. Study of Grain Growth in Electrodeposited Nanocrystalline Nickel-1.2 Wt.% Phosphorus Alloy. Mater. Sci. Eng. A 1995, 204, 227–232. [Google Scholar] [CrossRef] [Scilit]
  41. Mousavi, M.; Rahimi, E.; Mol, J.M.C.; Gonzalez-Garcia, Y. The Effect of Phosphorous Content on the Microstructure and Localised Corrosion of Electroless Nickel-Coated Copper. Surf. Coat. Technol. 2024, 492, 131174. [Google Scholar] [CrossRef] [Scilit]
  42. Hu, R.; Su, Y.; Liu, Y.; Liu, H.; Chen, Y.; Cao, C.; Ni, H. Deposition Process and Properties of Electroless Ni-P-Al2O3 Composite Coatings on Magnesium Alloy. Nanoscale Res. Lett. 2018, 13, 198. [Google Scholar] [CrossRef] [Scilit] [PubMed]
  43. Meng, Y.; Zhao, Y.; Zhong, J.; Liao, Y.; Chen, D. Effect of Plating Time on Surface Morphology and Corrosion Behavior of Electroless Ni-P Coating in Simulated Concrete Pore Solution. Case Stud. Constr. Mater. 2024, 21, e03497. [Google Scholar] [CrossRef] [Scilit]
  44. Sampath Kumar, P.; Kesavan Nair, P. Effect of Phosphorus Content on the Relative Proportions of Crystalline and Amorphous Phases in Electroless NiP Deposits. J. Mater. Sci. Lett. 1994, 13, 671–674. [Google Scholar] [CrossRef] [Scilit]
  45. Alexandru, P.; Radu, T.; Potecasu, F.; Vlad, M.; Istrate, G.G.; Buruiana, D.L.; Carp, B.-G. Structural Analysis of Thin Ni-P Layers. Rev. Chim. 2019, 70, 1466–1470. [Google Scholar] [CrossRef] [Scilit]
  46. Lin, J.-D.; Chou, C.-T. The Influence of Phosphorus Content on the Microstructure and Specific Capacitance of Etched Electroless Ni-P Coatings. Surf. Coat. Technol. 2019, 368, 126–137. [Google Scholar] [CrossRef] [Scilit]
  47. Lin, J.-D.; Chou, C.-T. The Influence of Acid Etching on the Electrochemical Supercapacitive Properties of Ni-P Coatings. Surf. Coat. Technol. 2017, 325, 360–369. [Google Scholar] [CrossRef] [Scilit]
  48. Taghavi, M.; Moghaddas, J. Using PLIF/PIV Techniques to Investigate the Reactive Mixing in Stirred Tank Reactors with Rushton and Pitched Blade Turbines. Chem. Eng. Res. Des. 2019, 151, 190–206. [Google Scholar] [CrossRef] [Scilit]
  49. Gadhari, P.; Sahoo, P. Effect of Heat Treatment and Bath Process Parameters on the Corrosion Behavior of Ni-P-TiO2 Composite Coatings. Port. Electrochim. Acta 2015, 33, 165–181. [Google Scholar] [CrossRef] [Scilit]
  50. Gadhari, P.; Sahoo, P. Improvement in Tribological Performance of Ni-P-TiO2 Composite Coatings Using Taguchi Technique with Grey Relational Analysis. Indian J. Mater. Sci. 2015, 2015, 104187. [Google Scholar] [CrossRef] [Scilit]
  51. Moniruzzaman, M.; Roy, S. Effect of pH on Electroless Ni-P Coating of Conductive and Nonconductive Materials. Int. J. Automot. Mech. Eng. 2011, 4, 481–489. [Google Scholar] [CrossRef] [Scilit]
  52. Yokohama, H.; Tayakout-Fayolle, M.; Galfré, A.; Fukumuro, N.; Yae, S.; Maeda, K.; Yamamoto, T. Kinetic Modelling of Electroless Nickel–Phosphorus Plating under High Pressure. ACS Omega 2020, 5, 6937–6946. [Google Scholar] [CrossRef] [Scilit] [PubMed]
  53. Zhao, C.; Guo, Y.; Yang, Y.; Bai, Y.; Li, B.; Lu, W.F.; Zeng, K.; Wang, H. Effect of Heat Treatment and Electroless Ni-P Coating on Mechanical Property and Corrosion Behaviour of 316L Stainless Steel Fabricated by Laser Powder Bed Fusion. Virtual Phys. Prototyp. 2024, 19, e2312912. [Google Scholar] [CrossRef] [Scilit]
  54. Raffel, M.; Willert, C.E.; Wereley, S.T.; Kompenhans, J. Particle Image Velocimetry: A Practical Guide, 2nd ed.; Springer: Berlin/Heidelberg, Germany, 2007. [Google Scholar]
  55. Parker, K. The Formulation of Electroless Nickel-Phosphorus Plating Baths. Plat. Surf. Finish. 1987, 74, 60–65. [Google Scholar]
  56. Salicio-Paz, A.; Ugarte, I.; Sort, J.; Pellicer, E.; García-Lecina, E. Full Optimization of an Electroless Nickel Solution: Boosting the Performance of Low-Phosphorous Coatings. Materials 2021, 14, 1501. [Google Scholar] [CrossRef] [Scilit] [PubMed]
  57. Farzaneh, A.; Ehteshamzadeh, M.; Cobley, A.J. Modelling of Surfactants and Chemistry for Electroless Ni-P Plating. Surf. Eng. 2018, 34, 454–461. [Google Scholar] [CrossRef] [Scilit]
  58. Somphotch, C.; Nisarattanaporn, E.; Boonyongmaneerat, Y. Influence of Bath Formulations on Low-Temperature Electroless Deposition of Ni-P Alloys. Chiang Mai J. Sci. 2014, 41, 1332–1340. [Google Scholar]
  59. Perez Bakovic, S.I.; Acharya, P.; Watkins, M.; Thornton, H.; Hou, S.; Greenlee, L.F. Electrochemically Active Surface Area Controls HER Activity for FexNi100−x Films in Alkaline Electrolyte. J. Catal. 2021, 394, 104–112. [Google Scholar] [CrossRef] [Scilit]
  60. Chen, X.; Wang, X.-T.; Le, J.-B.; Li, S.-M.; Wang, X.; Zhang, Y.-J.; Radjenovic, P.; Zhao, Y.; Wang, Y.-H.; Lin, X.-M.; et al. Revealing the Role of Interfacial Water and Key Intermediates at Ruthenium Surfaces in the Alkaline Hydrogen Evolution Reaction. Nat. Commun. 2023, 14, 5289. [Google Scholar] [CrossRef] [Scilit] [PubMed]
  61. Gómez–Marín, A.M.; Domke, K.F. Expanding Our View on Active Sites in Electrocatalysis. Curr. Opin. Electrochem. 2025, 51, 101692. [Google Scholar] [CrossRef] [Scilit]
  62. Son, Y.J.; Kim, S.; Leung, V.; Kawashima, K.; Noh, J.; Kim, K.; Marquez, R.A.; Carrasco-Jaim, O.A.; Smith, L.A.; Celio, H.; et al. Effects of Electrochemical Conditioning on Nickel-Based Oxygen Evolution Electrocatalysts. ACS Catal. 2022, 12, 10384–10399. [Google Scholar] [CrossRef] [Scilit]
  63. Togashi, R.; Harada, K.; Watanabe, T.; Mizuhata, M.; Yoshida, M.; Minamimoto, H. Integrating Electrochemical Analyses and Operando X-Ray Spectroscopy of Fluorine-Doped α-Ni(OH)2 for Alkaline Water Electrolysis. ACS Electrochem. 2025, 1, 2034–2041. [Google Scholar] [CrossRef] [Scilit]
  64. Manso, R.H.; Hong, J.; Wang, W.; Acharya, P.; Hoffman, A.S.; Tong, X.; Wang, F.; Greenlee, L.F.; Zhu, Y.; Bare, S.R.; et al. Revealing Structural Evolution of Nickel Phosphide-Iron Oxide Core–Shell Nanocatalysts in Alkaline Medium for the Oxygen Evolution Reaction. Chem. Mater. 2024, 36, 6440–6453. [Google Scholar] [CrossRef] [Scilit] [PubMed]
  65. Poureshghi, F.; Seland, F.; Jensen, J.O.; Sunde, S. Nickel Phosphide: The Effect of Phosphorus Content on the Activity and Stability toward Oxygen Evolution Reaction in Alkaline Medium. ChemSusChem 2025, 18, e202401586. [Google Scholar] [CrossRef] [Scilit] [PubMed]
  66. Zhang, S.; Pan, N. Supercapacitors Performance Evaluation. Adv. Energy Mater. 2015, 5, 1401401. [Google Scholar] [CrossRef] [Scilit]
  67. Qin, N.; Jin, L.; Xing, G.; Wu, Q.; Zheng, J.; Zhang, C.; Chen, Z.; Zheng, J.P. Decoupling Accurate Electrochemical Behaviors for High-Capacity Electrodes via Reviving Three-Electrode Vehicles. Adv. Energy Mater. 2023, 13, 2204077. [Google Scholar] [CrossRef] [Scilit]
  68. Zhu, J.; Chen, B.; Ni, M.; Xu, H. A Mini-Review on Three-Electrode Configuration for Solid Oxide Cells. Energy Rev. 2025, 4, 100128. [Google Scholar] [CrossRef] [Scilit]
  69. Yang, K.; Cline, J.P.; Kim, B.; Kiely, C.J.; McIntosh, S. The Influence of Crystal Structures on the Performance of CoMoO4 Battery-Type Supercapacitor Electrodes. RSC Adv. 2024, 14, 8251–8259. [Google Scholar] [CrossRef] [Scilit] [PubMed]
  70. Pissinis, D.E.; Sereno, L.E.; Marioli, J.M. Utilization of Special Potential Scan Programs for Cyclic Voltammetric Development of Different Nickel Oxide-Hydroxide Species on Ni Based Electrodes. Open J. Phys. Chem. 2012, 2, 23–33. [Google Scholar] [CrossRef]
  71. Lazanas, A.C.; Prodromidis, M.I. Electrochemical Impedance Spectroscopy—A Tutorial. ACS Meas. Sci. Au 2023, 3, 162–193. [Google Scholar] [CrossRef] [Scilit] [PubMed]
  72. Kushwaha, V.; Mandal, K.D.; Gupta, A.; Singh, P. Ni0.5Co0.5S Nano-Chains: A High-Performing Intercalating Pseudocapacitive Electrode in Asymmetric Supercapacitor (ASC) Mode for the Development of Large-Scale Energy Storage Devices. Dalton Trans. 2024, 53, 5435–5452. [Google Scholar] [CrossRef] [Scilit] [PubMed]
  73. Gupta, R.K.; Nihore, A.; Sankar, P.R.; Ganesh, P.; Kaul, R. An Experimental Study on Electroless Nickel Plating on Alumina Ceramic. Chem. Mater. Eng. 2021, 8, 1–6. [Google Scholar] [CrossRef] [Scilit]
  74. Sheng, G.Y. Study on Growth Mode and Properties of Electroless Nickel Plating on Aluminum Alloy. Chem. Eng. Trans. 2016, 55, 319–324. [Google Scholar] [CrossRef] [Scilit]
  75. Vitry, V.; Bonin, L.; Malet, L. Chemical, Morphological and Structural Characterisation of Electroless Duplex NiP/NiB Coatings on Steel. Surf. Eng. 2018, 34, 475–484. [Google Scholar] [CrossRef] [Scilit]
  76. Ahmed, S.Y.; Mahmoud, S.B.; Shoeib, M.A. Synthesis, Structure Characterization, and Corrosion Properties of Duplex Electroless Ni-P/Ni-B and Ni-P/Ni-B-W Coatings on Mild Steel. Sci. Rep. 2024, 14, 24983. [Google Scholar] [CrossRef] [Scilit] [PubMed]
  77. Baskaran, I.; Narayanan, T.S.N.S.; Stephen, A. Effect of Accelerators and Stabilizers on the Formation and Characteristics of Electroless Ni–P Deposits. Mater. Chem. Phys. 2006, 99, 117–126. [Google Scholar] [CrossRef] [Scilit]
  78. Balaraju, J.N.; Rajam, K.S. Electroless Deposition of Ni–Cu–P, Ni–W–P and Ni–W–Cu–P Alloys. Surf. Coat. Technol. 2005, 195, 154–161. [Google Scholar] [CrossRef] [Scilit]
  79. Ma, L.; Chen, Y.; Renner, P.; Parkinson, D.; Fang, A.; Liang, H. Synthesis and Morphological Characterization of Electroless-Deposited Ni-P Coatings on Diamond Abrasives. Lubricants 2021, 9, 20. [Google Scholar] [CrossRef] [Scilit]
  80. Li, Q.; Li, H.; Zhang, Q.; Han, Z.; Hu, J. Influence of CuSO4 Concentration on Microstructures and Properties of Electroless Deposited Ni/Cu-P Coatings. Sci. Rep. 2026, 16, 12335. [Google Scholar] [CrossRef] [Scilit] [PubMed]
  81. Chen, Z.; Zhu, L.; Ren, L.; Liu, J. Electroless Plating of Ni-P and Ni-P-PTFE on Micro-Arc Oxidation Coatings for Improved Tribological Performance. Mater. Res. 2022, 25, e20220096. [Google Scholar] [CrossRef] [Scilit]
  82. Czagany, M.; Hompoth, S.; Windisch, M.; Baumli, P. Investigation of the Supercapacitive Behavior of Electroless Ni-B Coatings. Metals 2023, 13, 1233. [Google Scholar] [CrossRef] [Scilit]
  83. Chowdhury, T.A. XPS Studies on Electroless As-Deposited and Annealed Ni-P Films. Engineering 2024, 16, 123–133. [Google Scholar] [CrossRef]
  84. Gould, A.J.; Boden, P.J.; Harris, S.J. Phosphorus Distribution in Electroless Nickel Deposits. Surf. Technol. 1981, 12, 93–102. [Google Scholar] [CrossRef] [Scilit]
  85. Peeters, P.; Hoorn, G.v.d.; Daenen, T.; Kurowski, A.; Staikov, G. Properties of Electroless and Electroplated Ni–P and Its Application in Microgalvanics. Electrochim. Acta 2001, 47, 161–169. [Google Scholar] [CrossRef] [Scilit]
  86. Latha, N.; Raj, V.; Selvam, M.; Manisankar, P. Synthesis and Characterization of Electroless Nanocrystalline Ni-P on Aluminium. Int. J. Chem. Sci. 2012, 10, 479–489. [Google Scholar]
  87. Fayyaz, O.; Khan, A.; Shakoor, R.A.; Hasan, A.; Yusuf, M.M.; Montemor, M.F.; Rasul, S.; Khan, K.; Faruque, M.R.I.; Okonkwo, P.C. Enhancement of Mechanical and Corrosion Resistance Properties of Electrodeposited Ni–P–TiC Composite Coatings. Sci. Rep. 2021, 11, 5327. [Google Scholar] [CrossRef] [Scilit] [PubMed]
  88. Joshi, J.; Homburg, S.V.; Ehrmann, A. Atomic Force Microscopy (AFM) on Biopolymers and Hydrogels for Biotechnological Applications—Possibilities and Limits. Polymers 2022, 14, 1267. [Google Scholar] [CrossRef] [Scilit] [PubMed]
  89. Malek, S.N.A.; Mohd, Y. Effect of Deposition Time on Structural and Catalytic Properties of Pt Films Electrodeposited on Ti Substrate. Malays. J. Anal. Sci. 2019, 23, 52–59. [Google Scholar] [CrossRef] [Scilit]
  90. Battiato, S.; Urso, M.; Cosentino, S.; Pellegrino, A.L.; Mirabella, S.; Terrasi, A. Optimization of Oxygen Evolution Reaction with Electroless Deposited Ni–P Catalytic Nanocoating. Nanomaterials 2021, 11, 3010. [Google Scholar] [CrossRef] [Scilit] [PubMed]
  91. Mathis, T.S.; Kurra, N.; Wang, X.; Pinto, D.; Simon, P.; Gogotsi, Y. Energy Storage Data Reporting in Perspective—Guidelines for Interpreting the Performance of Electrochemical Energy Storage Systems. Adv. Energy Mater. 2019, 9, 1902007. [Google Scholar] [CrossRef] [Scilit]
  92. Costentin, C.; Savéant, J.-M. Energy Storage: Pseudocapacitance in Prospect. Chem. Sci. 2019, 10, 5656–5666. [Google Scholar] [CrossRef] [Scilit] [PubMed]
  93. Scarpioni, F.; Khalid, S.; Chukwu, R.; Pianta, N.; La Mantia, F.; Ruffo, R. Electrochemical Impedance Spectroscopy for Electrode Process Evaluation: Lithium Titanium Phosphate in Concentrated Aqueous Electrolyte. ChemElectroChem 2023, 10, e202201133. [Google Scholar] [CrossRef] [Scilit]
  94. Attias, R.; Dlugatch, B.; Chae, M.S.; Goffer, Y.; Aurbach, D. Changes in the Interfacial Charge-Transfer Resistance of Mg Metal Electrodes, Measured by Dynamic Electrochemical Impedance Spectroscopy. Electrochem. Commun. 2021, 124, 106952. [Google Scholar] [CrossRef] [Scilit]
  95. Gateman, S.M.; Gharbi, O.; Gomes De Melo, H.; Ngo, K.; Turmine, M.; Vivier, V. On the Use of a Constant Phase Element (CPE) in Electrochemistry. Curr. Opin. Electrochem. 2022, 36, 101133. [Google Scholar] [CrossRef] [Scilit]
  96. Lasia, A. Impedance of Porous Electrodes. Curr. Opin. Electrochem. 2025, 54, 101764. [Google Scholar] [CrossRef] [Scilit]
  97. Shao, Y.; El-Kady, M.F.; Sun, J.; Li, Y.; Zhang, Q.; Zhu, M.; Wang, H.; Dunn, B.; Kaner, R.B. Design and Mechanisms of Asymmetric Supercapacitors. Chem. Rev. 2018, 118, 9233–9280. [Google Scholar] [CrossRef] [Scilit] [PubMed]
  98. Biesinger, M.C.; Payne, B.P.; Grosvenor, A.P.; Lau, L.W.M.; Gerson, A.R.; Smart, R.S.C. Resolving Surface Chemical States in XPS Analysis of First Row Transition Metals, Oxides and Hydroxides: Cr, Mn, Fe, Co and Ni. Appl. Surf. Sci. 2011, 257, 2717–2730. [Google Scholar] [CrossRef] [Scilit]
  99. Yip, B.; Chen, C.; Jiang, Y.; Ohayon, D.; Bazan, G.; Wang, X. Aqueous Asymmetric Pseudocapacitor Featuring High Areal Energy and Power Using Conjugated Polyelectrolytes and Ti3C2Tx MXene. Nat. Commun. 2025, 16, 7984. [Google Scholar] [CrossRef] [Scilit] [PubMed]
  100. Nam, K.-W.; Kim, K.-H.; Lee, E.-S.; Yoon, W.-S.; Yang, X.-Q.; Kim, K.-B. Pseudocapacitive Properties of Electrochemically Prepared Nickel Oxides on 3-Dimensional Carbon Nanotube Film Substrates. J. Power Sources 2008, 182, 642–652. [Google Scholar] [CrossRef] [Scilit]
  101. Kumar, T.; Rana, A.; Tiwari, S.; Hang, D.; Chaudhary, A. Upcycling Plastic Waste for Dual Applications in Glucose Sensing and Energy Storage. Energy Technol. 2026, 14, e202501436. [Google Scholar] [CrossRef] [Scilit]
  102. Gira, M.J.; Tkacz, K.P.; Hampton, J.R. Physical and Electrochemical Area Determination of Electrodeposited Ni, Co, and NiCo Thin Films. Nano Converg. 2016, 3, 6. [Google Scholar] [CrossRef] [Scilit] [PubMed]
  103. Yuan, Y.F.; Xia, X.H.; Wu, J.B.; Yang, J.L.; Chen, Y.B.; Guo, S.Y. Nickel Foam-Supported Porous Ni(OH)2/NiOOH Composite Film as Advanced Pseudocapacitor Material. Electrochim. Acta 2011, 56, 2627–2632. [Google Scholar] [CrossRef] [Scilit]
  104. Cooper, S.J.; Bertei, A.; Finegan, D.P.; Brandon, N.P. Simulated Impedance of Diffusion in Porous Media. Electrochim. Acta 2017, 251, 681–689. [Google Scholar] [CrossRef] [Scilit]
Figure 1. SEM micrographs of electroless Ni–P coatings: surface morphology and elemental composition with EDS (inset tables) after deposition for (a) 20 min, (b) 40 min, and (c) 60 min. Image (d) shows a cross-sectional view of the 40-minute sample, with representative thickness measurements (µm).
Metals 16 00709 g001
Figure 2. Characteristic nodule sizes of electroless Ni–P coatings obtained from top-view SEM image analysis. For the 40 and 60 min coatings, both large nodules (L) and smaller secondary nodules (S) growing on the large nodules were identified, whereas the 20 min coating exhibited only the large-nodule population.
Metals 16 00709 g002
Figure 3. AFM height maps of electroless Ni–P coatings deposited for (a) 20 min, (b) 40 min, and (c) 60 min.
Metals 16 00709 g003
Figure 4. Electrochemical characterization of electroless Ni–P coatings deposited for 20, 40, and 60 min, together with an electroless Ni reference. Adapted from Ref. [82]. (a) Cyclic voltammograms recorded at 100 mV s−1 for the Ni–P coatings and the electroless Ni coating. (bd) Cyclic voltammograms recorded at different sweep rates (10, 20, 30, 50, and 100 mV s−1) for the (b) 40 min, (c) 20 min, and (d) 60 min Ni–P coatings. (e) Dependence of anodic and cathodic peak currents on the square root of sweep rate for the Ni–P coatings, together with linear fits. (f) Nyquist plots of the Ni–P coatings. The inset highlights the high-frequency region used for the local Rs–(Rp∥CPE) fit. (g) Galvanostatic charge–discharge curves of the Ni–P coatings and the electroless Ni reference recorded at 5 mA cm−2.
Metals 16 00709 g004
Figure 5. XPS characterization of electroless Ni–P coatings deposited for 20, 40, and 60 min. (a) High-resolution Ni 2p spectra of the Ni–P coatings, highlighting the Ni 2p3/2 region at 854.1 eV and the Ni 2p1/2 component. (b) Signal intensity of the Ni 2p3/2 peak at 854.1 eV for the coatings deposited for different times. (c) XPS survey spectra of the Ni–P coatings with the main photoelectron and Auger features indicated. (d) Surface atomic contents of Ni and P determined from XPS quantification as a function of deposition time.
Metals 16 00709 g005
Figure 6. Comparison of phosphorus contents obtained by XPS and EDS for electroless Ni–P coatings as a function of deposition time.
Metals 16 00709 g006
Table 1. Coating thickness (µm) and coating mass (mg) as a function of deposition time for electroless Ni–P coatings (mean ± SD as indicated).
Deposition Time (min)Mean Coating
Mass (mg)
SD–Mass
(mg)
Mean Thickness (µm)SD–Thickness (µm)
209.40.052.270.05
4035.500.238.340.19
6046.90.4911.310.28
Table 2. AFM-derived areal roughness and surface-area parameters of electroless Ni–P coatings deposited for 20, 40, and 60 min. Surface area values are compared with a projected area of 10,000 µm2.
Samples by Coating Times20 min40 min60 min
Mean roughness (Sa) [nm]107.96148.28202.15
Maximum peak height (Sp) [nm]0.770.901.10
Maximum pit depth (Sv) [nm]0.540.621.02
Surface area [μm2]10,186.0310,191.2310,297.63
Table 3. Local high-frequency circle-fit parameters and fitting errors (RMSE) for electroless Ni–P coatings at the middle point.
Deposition Time (min)Rp
(Ω·cm2)
Selected Points,
N
RMSE
(Ω)
200.99100.002149
400.480.000866
601.140.002181
Table 4. Comparison of the present electroless Ni–P coating with representative Ni–P supercapacitor electrodes reported in the literature.
Electrode SystemPreparation/ArchitectureReported Electrochemical MetricRef.
Present workDirectly deposited electroless Ni–P coating on steel426.5 mF cm−2 at 5 mA cm−2-
Amorphous Ni–PDisordered or powder-type Ni–P material1597 F g−1 at 0.5 A g−1[15]
Electroless Ni–P/expanded graphite paperElectroless Ni–P deposited on conductive graphite support625 F g−1 at 1 A g−1[18]
Electroless Ni–P on waste plastic substrateNi–P thin film on flexible/waste-plastic substrate571.43 F g−1 at 1 mA cm−2[101]
Acid-etched Ni–P coatingElectroless Ni–P coating after acid etching1254 F g−1 at 1 A g−1[46]
Disclaimer/Publisher’s Note: The statements, opinions and data contained in all publications are solely those of the individual author(s) and contributor(s) and not of MDPI and/or the editor(s). MDPI and/or the editor(s) disclaim responsibility for any injury to people or property resulting from any ideas, methods, instructions or products referred to in the content.