Article

Mg and Cu Addition Effect on the As-Cast Hypoperitectic Zn-Ag-Based Bioabsorbable Alloy

by
A. L. Ramirez-Ledesma
1,*,
P. Roncagliolo-Barrera
2,
Y. Sánchez-de Jesús
2,
E. Aburto-Perdomo
3,
A. Pérez-García
1 and
J. A. Juarez-Islas
3
1
Dirección de Investigación, Hospital General de México Dr. Eduardo Liceaga, Ciudad de México 06720, Mexico
2
Departamento de Ingeniería Metalúrgica, Facultad de Química, Universidad Nacional Autónoma de México, Av. Universidad 3000, Circuito Exterior S/N. Cd. Universitaria, Ciudad de México 04510, Mexico
3
Departamento de Materiales Metálicos y Cerámicos, Instituto de Investigaciones en Materiales, Universidad Nacional Autónoma de México, Av. Universidad 3000, Circuito Exterior S/N. Cd. Universitaria, Ciudad de México 04510, Mexico
*
Author to whom correspondence should be addressed.
Metals 2026, 16(7), 706; https://doi.org/10.3390/met16070706
Submission received: 30 April 2026 / Revised: 22 June 2026 / Accepted: 23 June 2026 / Published: 26 June 2026
(This article belongs to the Special Issue Microstructure and Properties of Biomedical Metallic Materials)

Abstract

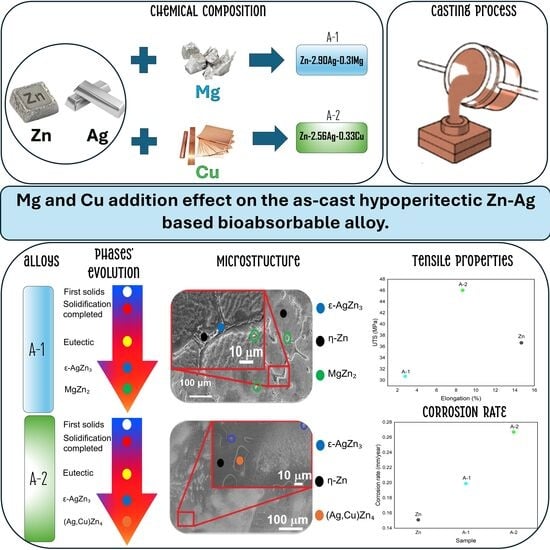
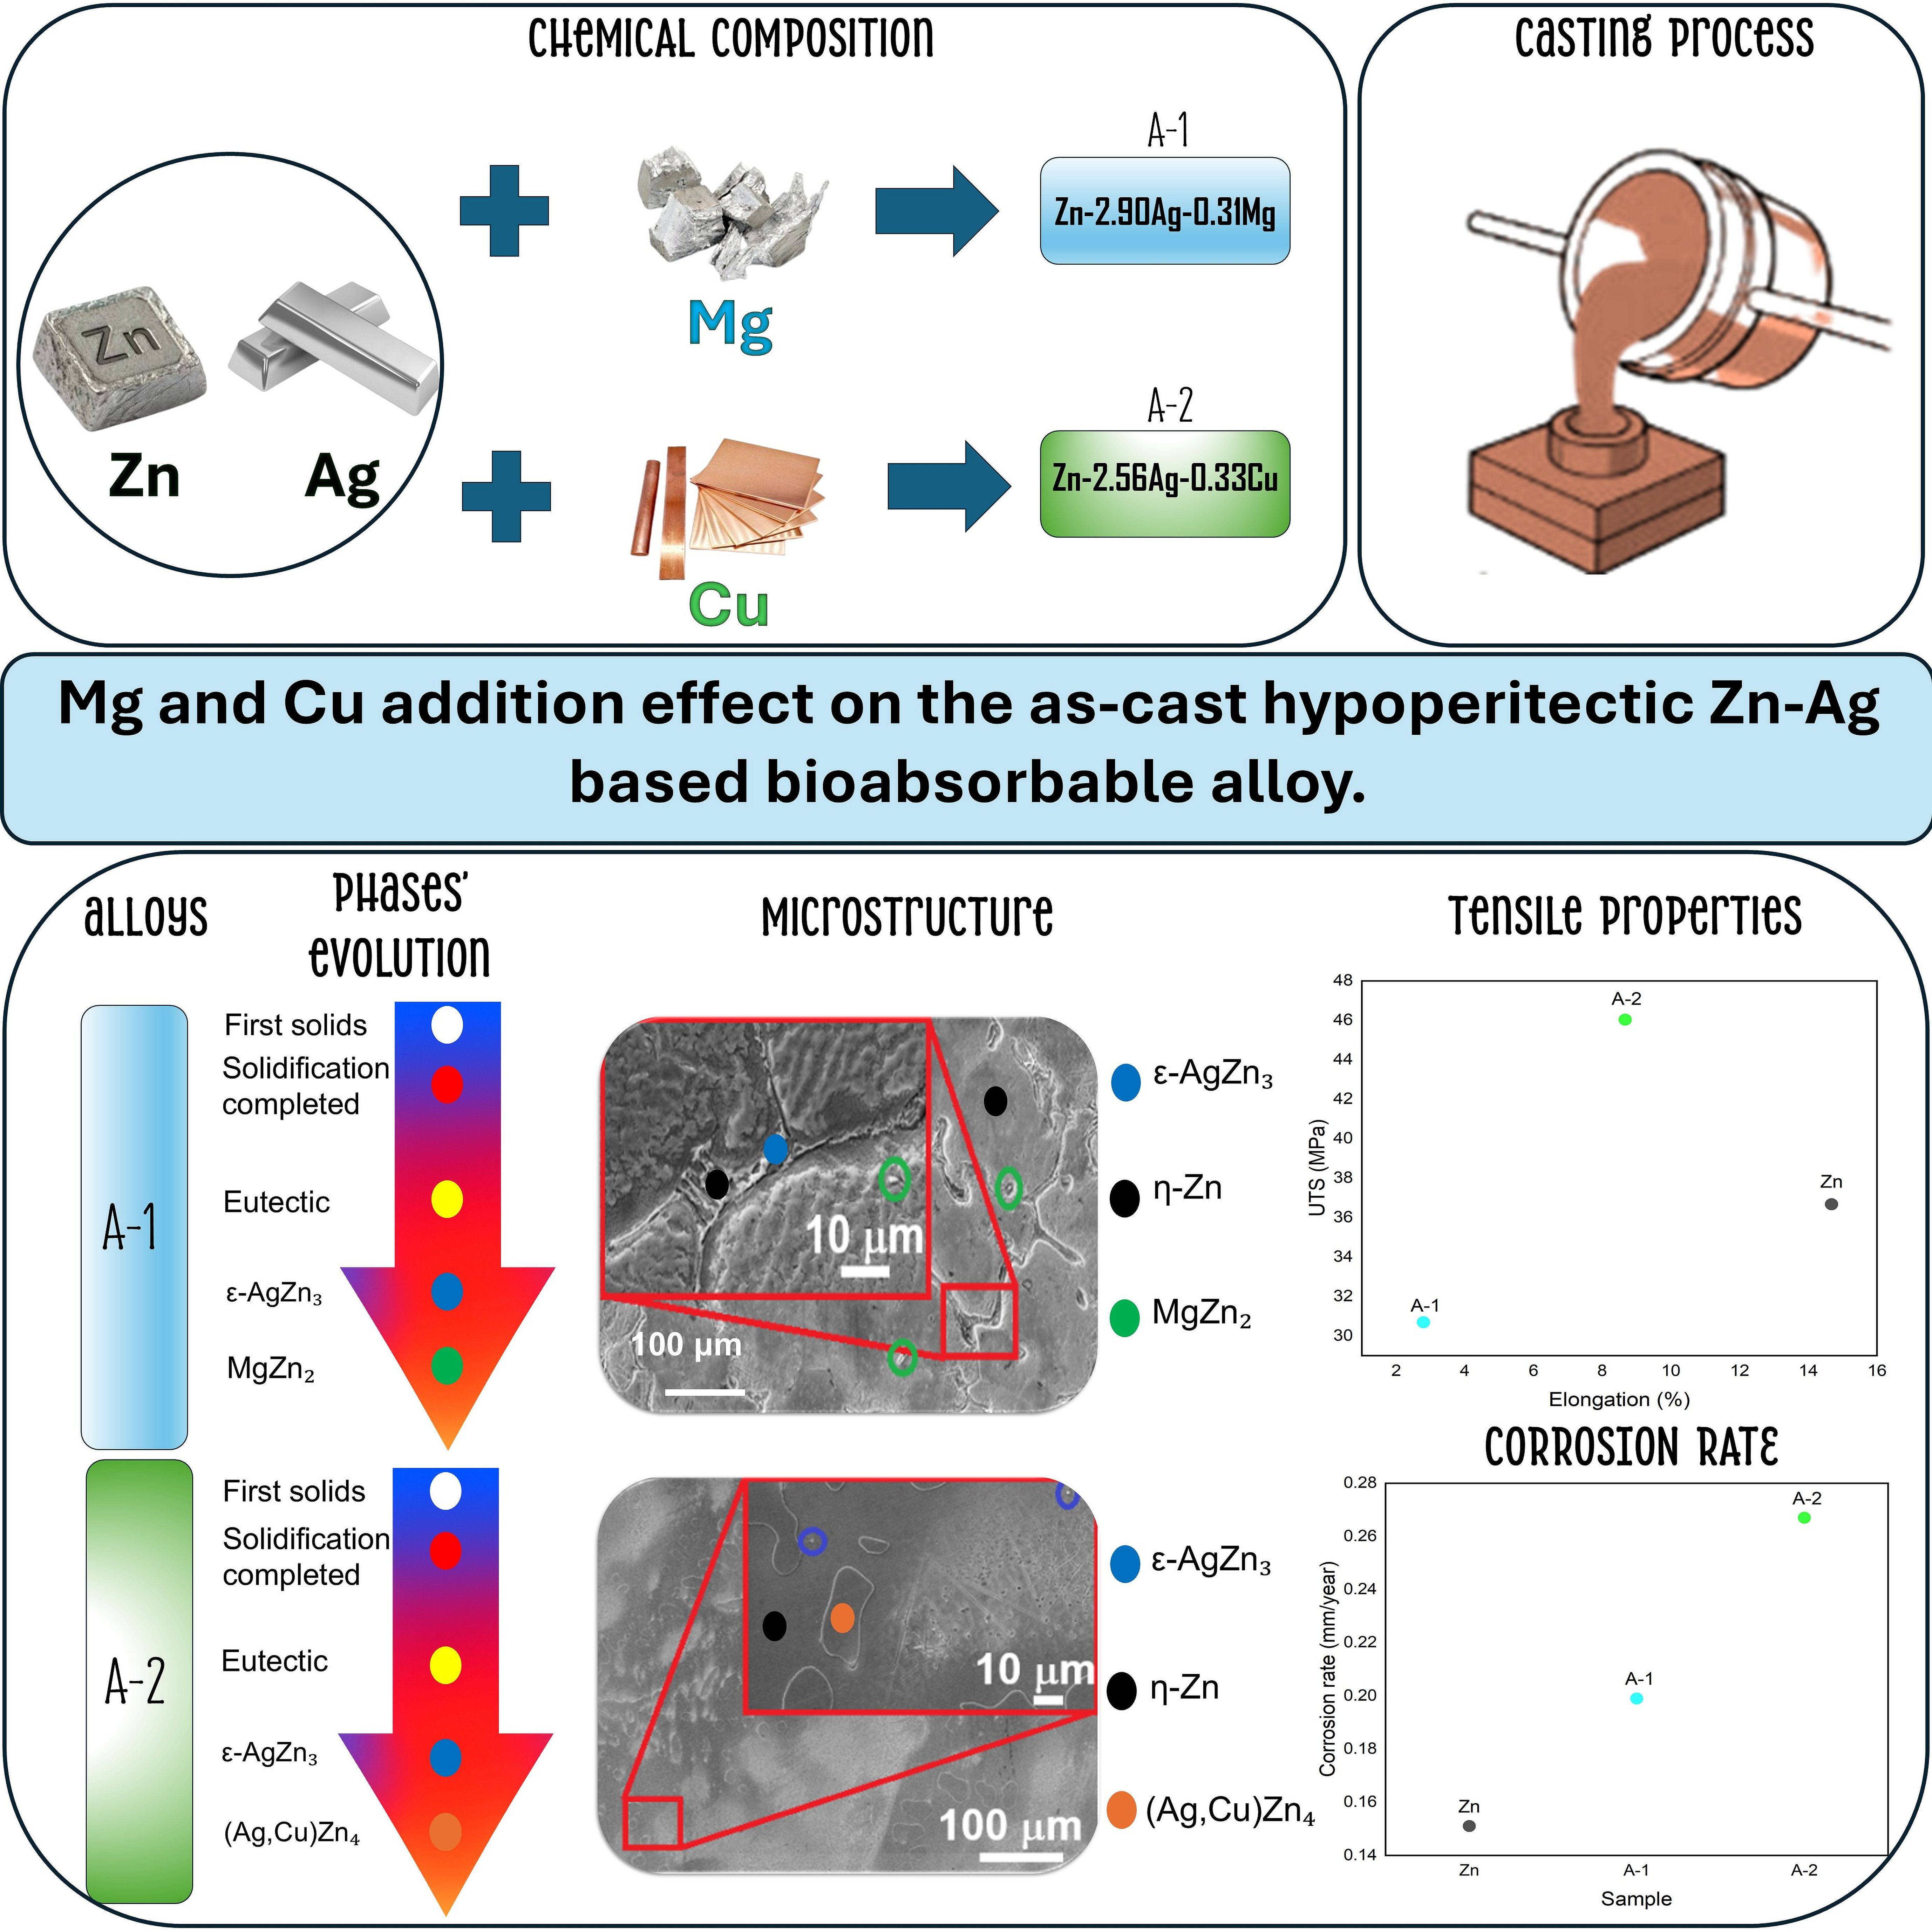
Due to fractures in young and mature people, combined with aging and other factors increasing year by year, there is a demand for new materials to efficiently address fracture-healing-related issues. There are designs of new biodegradable Zn-based alloys whose chemical composition provides new opportunities to manufacture medical devices for supporting and assisting bones in their healing processes. To achieve this goal, it is well known that a strength–ductility balance and appropriate degradation are required. In this context, it is vital to know and understand how the addition of elements modifies the as-cast microstructure, which is the basis of further processing steps such as heat treatment and thermomechanical processing. In the present work, a broad characterization was performed of two as-cast hypoperitectic Zn-Ag-based alloys with Mg and Cu additions. First, cooling curves were presented, and a dissertation regarding the temperature appearance of their secondary phases was made. Also, XRD and SEM-EDS techniques were performed, and their mechanical and corrosion performance was analyzed to elucidate which third element is the best option for intended orthopedic applications.

Graphical Abstract

1. Introduction

The WHO (World Health Organization) reported 178 million new fractures globally in 2019 and affirmed that due to global population growth, aging, and other circumstances such as traffic accidents, sports injuries, and metabolic diseases, this tendency is going to increase [1,2]. Three main phases of fracture healing are stated: (1) inflammatory, (2) reparative, and (3) remodeling. In this context, surgical treatments like internal fixation, screws, pins, plates, and implantation, etc., provide mechanical stability to the bone, allowing weight-bearing and healing. Bones are metabolically active organs that pass through the three aforementioned phases during all humans’ lives [3]. Based on this, biodegradable alloys are a great option to be applied in bone tissue engineering technologies due to their ability to degrade gradually in vivo with an appropriate host response related to the released corrosion products that can be metabolized by cells or tissue and then dissolved totally after fulfilling their function, assisting the tissue healing without any implant residue [4,5]. It is well known that zinc is an important element in multiple physiological processes, for example, bone metabolism. Also, zinc deficiency in bone tissue can cause growth inhibition and osteoporosis [6,7], and this element is involved in immunomodulation and bacterial inhibition processes [8]. A challenge to be overcome regarding these alloys is their performance in terms of mechanical improvement, taking into account that a degradation balance must be preserved [9]. Alloying addition selection is essential to designing a new zinc biodegradable alloy. Yang et al. and Liu et al. show that Ag, Mg, and Cu are three of the most used elements to develop zinc alloys, increase mechanical properties, and contribute to their cytocompatibility, osteogenesis, and osseointegration enhancement [10,11].
It is well known that heat treatments and thermomechanical processing are necessary to improve the mechanical properties of Zn-based alloys; however, most of the reported work carried out these critical steps without knowing the precise solid transformation temperature of the present phases in the as-cast condition [12,13,14,15,16,17]. So, the selection of processing temperatures may not be convenient or optimum to achieve the best mechanical performance, especially for Zn alloys that are too sensitive to temperature, so much so that mechanical properties are dependent on the working temperature at the time to execute tensile tests [18,19]. Another important processing parameter is the cooling rate during solidification, as it is possible to control the microstructure dendrite refinement, the as-cast condition, and, consequently, the mechanical behavior [20,21]. Finally, it has been demonstrated that elemental addition in zinc alloys produces a microstructural refinement [22]. Specifically, for the Zn-Ag alloy system, trace Mg additions induce grain refinement through a pinning effect of nanoscale Zn3Ag, MgZn2, and Mg2Zn11 presence in conjunction with a thermomechanical processing; Zhuo et al. report an outstanding strength–ductility improvement [23]. Also, the combination of Ag and Cu additions increases strength and ductility and leads to the regulation of corrosion rate through (Ag, Cu)Zn4 secondary phase formation and distribution [24].
In this context, an as-cast Zn-Ag-based alloy was studied, with the third element varied by additions of Mg and Cu. An exhaustive characterization was performed by ICP-OES, XRD, and SEM-EDS to reveal the alloy’s microstructural features. A cooling curve disclosure regarding the precipitation temperatures of primary and secondary phases of the Zn-Ag-Mg and Zn-Ag-Cu systems is presented. Additionally, tensile tests at room temperature and potentiodynamic polarization (PDP) characterization in Hank’s buffered saline solution at 37 °C were carried out to determine how the Mg or Cu presence impacts the as-cast hypoperitectic Zn-Ag-based alloy’s behavior. In summary, this research is a systematic characterization and a comparison between the as-cast hypoperitectic Zn-Ag-Mg and Zn-Ag-Cu systems’ performance. The alloys were designed from their chemical composition to be tentatively used in orthopedic applications. In this sense, it is important to remark that only a few works report the as-cast microstructures and secondary phase precipitation temperatures of Zn-based alloys, although this information is vital at the time to make decisions related to the next processing steps, for example, solution treatments and extrusion to maximize the mechanical behavior of these materials.

2. Materials and Methods

2.1. Materials Preparation and Processing

High-purity Zn, Ag, Mg, and Cu (31653, 303372, 254118, 349208, Sigma-Aldrich, Naucalpan de Juárez, Mexico, respectively) were used as starting materials for processing two hypoperitectic Zn-Ag-based alloys (Table 1). A vacuum induction furnace under an argon (Ar) atmosphere (for reducing Zn evaporation as much as possible and inducing a positive and oxygen-free atmosphere) was used. To avoid melting contamination, the elements were inserted into alumina crucibles within a graphite susceptor to minimize a drastic temperature gradient during heating. Melting was performed at 12 kW of input power for 5 to 7 min, and the metal bath was homogenized by the effect of inherent electromagnetic stirring of the coil. Sand molds (3.5% H2O) were used for casting billets of the studied materials (see Figure S1 of Supplementary Materials). Zn-2.90Ag-0.31Mg and Zn-2.56Ag-0.33Cu alloys will be named Zn-Ag-Mg and Zn-Ag-Cu in the following part of the manuscript. A chromel/alumel thermocouple assembly to a Logicbus data logger (PP222, Chula Vista, CA, USA) was introduced inside the sand mold to record data related to the solidification (cooling rate) of the alloy’s ingots with dimensions of 100 mm length and 45 mm diameter. A detailed procedure explanation regarding the solidification rate calculation was incorporated in Figures S1 and S2 of the Supplementary Materials section.

2.2. Chemical Composition and Microstructural Characterization

To perform ICP–OES determinations, 0.2 to 1 mg of each sample has been exactly weighed using a microbalance. The sample was initially treated with 1 mL of HNO3 (438073, Sigma-Aldrich) and, successively, with 1 mL of aqua regia (HCl–HNO3 3–1 v/v) in a Teflon capsule, heated in a water bath. The final solutions of each sample were transferred to volumetric flasks, and the final volumes were adjusted to 25 mL using nano-pure water. An ICP–OES Perkin Elmer Optima 1200 (Hopkinton, MA, USA) was used for the elemental analysis of the samples. Data acquisition and processing were performed using the WinLab 32 software (Perkin Elmer, Hopkinton, MA, USA), and operating conditions are listed in Table 1. Formal phase identification from Zn-Ag-Mg and Zn-Ag-Cu specimens was performed by the X-ray diffraction technique (XRD) using a SIEMENS D–5000 (Munich, Germany) diffractometer equipped with a Cu tube (λCuKα =1.5418 Å) and a scanning angle ranging from 30 ° to 95°. XRD data were obtained with a scan step size of 0.02° and a scan rate of 0.001°/s. Phase identification was carried out using the Powder Diffraction File-2 (PDF-2) database and Match! 3 software (Crystal Impact, Bonn, Germany). Microstructural characterization, elemental mapping, and punctual phase identification were done by scanning electron microscopy (JEOL7600F, Tokyo, Japan) coupled with energy-dispersed X-ray microanalysis (EDS, JEOL, Tokyo, Japan). Metallographic preparation was made according to the ASTM E3-11 standard [25], and the chemical etching consisted of Nital at 2% (2% vol. of nitric acid + ethanol).
Mechanical characterization involving tensile tests and microhardness measurements was evaluated according to ASTM E8-04 and E92-17 specifications, respectively [26,27]. Specimens were cut longitudinally from as-cast ingots with dimensions of 50 mm in gauge length, 12.5 mm in width, and 2 mm in thickness. Then, they were pulled to fracture at room temperature (25 ± 1 °C) at a strain rate of 4.2 × 10 s−1 using an Instron 1125 machine (MTS Systems Corporation, Eden Prairie, MN, USA). Microhardness readings were taken for each sample using a Vickers hardness tester (THBRV–187.5 V, Lab. Testing Technology, Yiwu, China), with a load of 100 gf and a dwelling time of 15 s.

2.3. Electrochemical Characterization in Simulated Body Fluids

The hypoperitetic Zn-Ag with added Mg and Cu alloys were assessed in Hank’s buffered saline solution, with the pH adjusted to 7.4 using 0.1 M HCl, and the temperature held at 37 °C. The specimens were placed on a TFE-fluorocarbon support to prevent electrolyte accumulation in crevices with a contact area of 1 cm2. The electrochemical setup used consisted of a typical three-electrode cell, a reference electrode (RE), a saturated calomel electrode (SCE 0.24 V vs. ENH, standard hydrogen electrode, Cole-Parmer, Vernon Hills, IL, USA), and a platinum mesh as a counter electrode (CE). To maintain a constant temperature, an ECOSHEL, Pharr, TX thermostatic circulation bath with a jacketed cell was used. A VMP-3 Bio-Logic Science Instruments® potentiostat, Seyssinet-Pariset, FRA was used to apply the corrosion method as follows: (1) OCP for 7200 s at a 1s per minute measuring rate; (2) PDP over the potential range of ±250 mV vs. OCP at a rate of 30 mV min−1, following ASTM G102-89-2015 specifications [28]. Tafel analysis was performed using EC-Lab V11.62 software, and the corrosion current density (icorr) was determined from the Tafel extrapolation in the Tafel region (η = ±0.1 V), based on the best-fit value of ba and bc from the line’s intersection. Metallographic preparation was made according to the ASTM E3-11 standard, plus mirror polishing with 0.5 μm alumina [25] before performing the electrochemical characterization described above.

2.4. Statistical Analysis

For all experiments, each condition was tested 3 times, and variations are reported in terms of standard deviations. In order to determine if the stress and/or strain values corresponding to the pure Zn, Zn-Ag-Mg, and Zn-Ag-Cu conditions have significant differences between each other, a one-way ANOVA was performed since the data showed a normal distribution. Due to unequal variances, Tamhane’s T2 post hoc test was employed for pairwise comparisons. This analysis was conducted using IBM SPSS version 31 (IBM Corp., Armonk, NY, USA). Differences were considered statistically significant at p < 0.05. PDP results were analyzed using EC-Lab software version 10.4 (BioLogic Inc., Seyssinet-Pariset, France), and polarization curves were fitted using a Tafel linear extrapolation. The corrosion current density was calculated from the charge transfer resistance via the Stern–Geary equation, assuming activation control. Standard deviations from triplicate tests and chi-squared (χ2) values for each fit are also provided.

3. Results

3.1. Effect of Mg and Cu Additions on Thermal Data, Phase Precipitation, and Microstructure

Figure 1a is a representative cooling curve of the Zn-Ag-Mg hypoperitectic alloy, and its first derivative is presented as well. Figure 1b shows an inset showing the starting and completed solidification temperatures, ~485 °C and ~415 °C, respectively. In Figure 1c, it is possible to observe the eutectic temperature at ~389.65 °C, and Figure 1d exhibits precipitation temperatures of secondary phases such as MgZn2 at ~344.75 °C, and AgZn3 at ~375.20 °C.
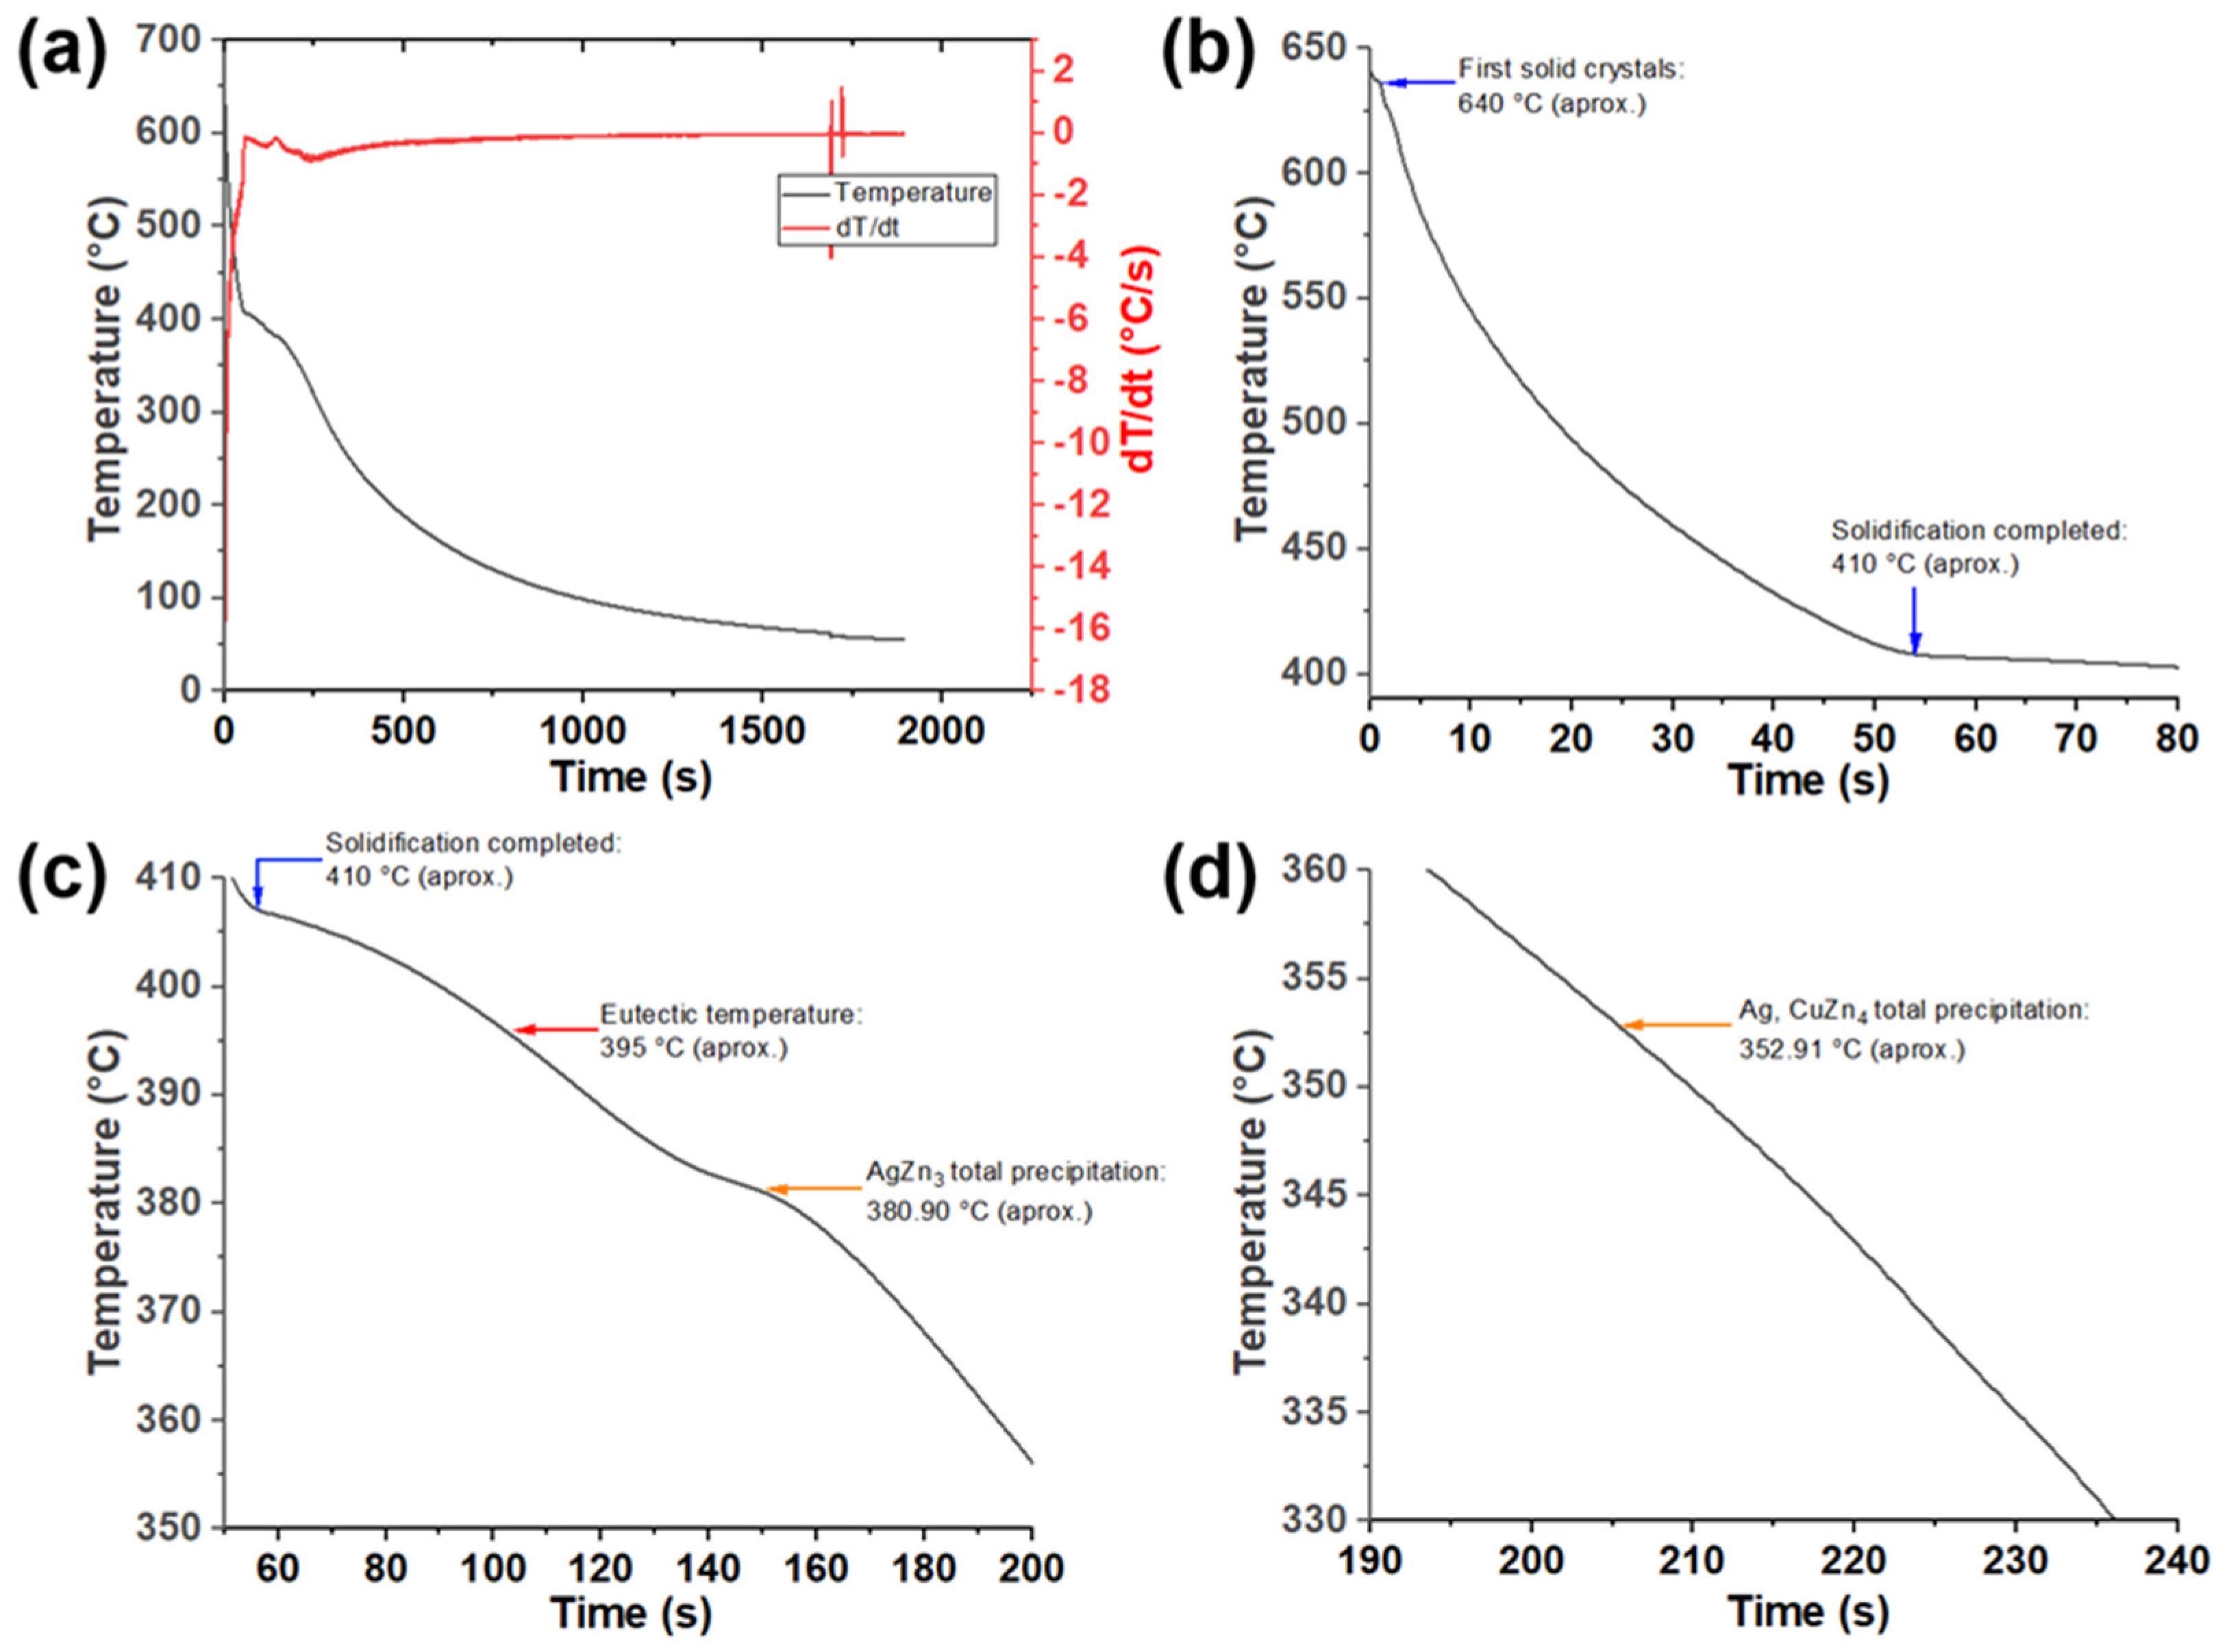
Figure 2a exposes the cooling curve and its first derivative related to the Zn-Ag-Cu hypoperitectic alloy. Once again, in Figure 2b, it can be appreciated that the starting solidification and completed solidification temperatures are ~640 °C and ~410 °C, respectively. Figure 2c presents the eutectic and epsilon (AgZn3) precipitation temperatures at ~395 °C and ~380.90 °C, respectively. Figure 2d shows the precipitation temperature of the secondary phase named Ag, CuZn4 at ~352.01 °C.
For both Zn-based hypoperitectic alloys, the solidification rate was calculated, and a value of ~1.875 °C/s was obtained. A detailed explanation was made in the Supplementary Materials section, Figures S1 and S2.
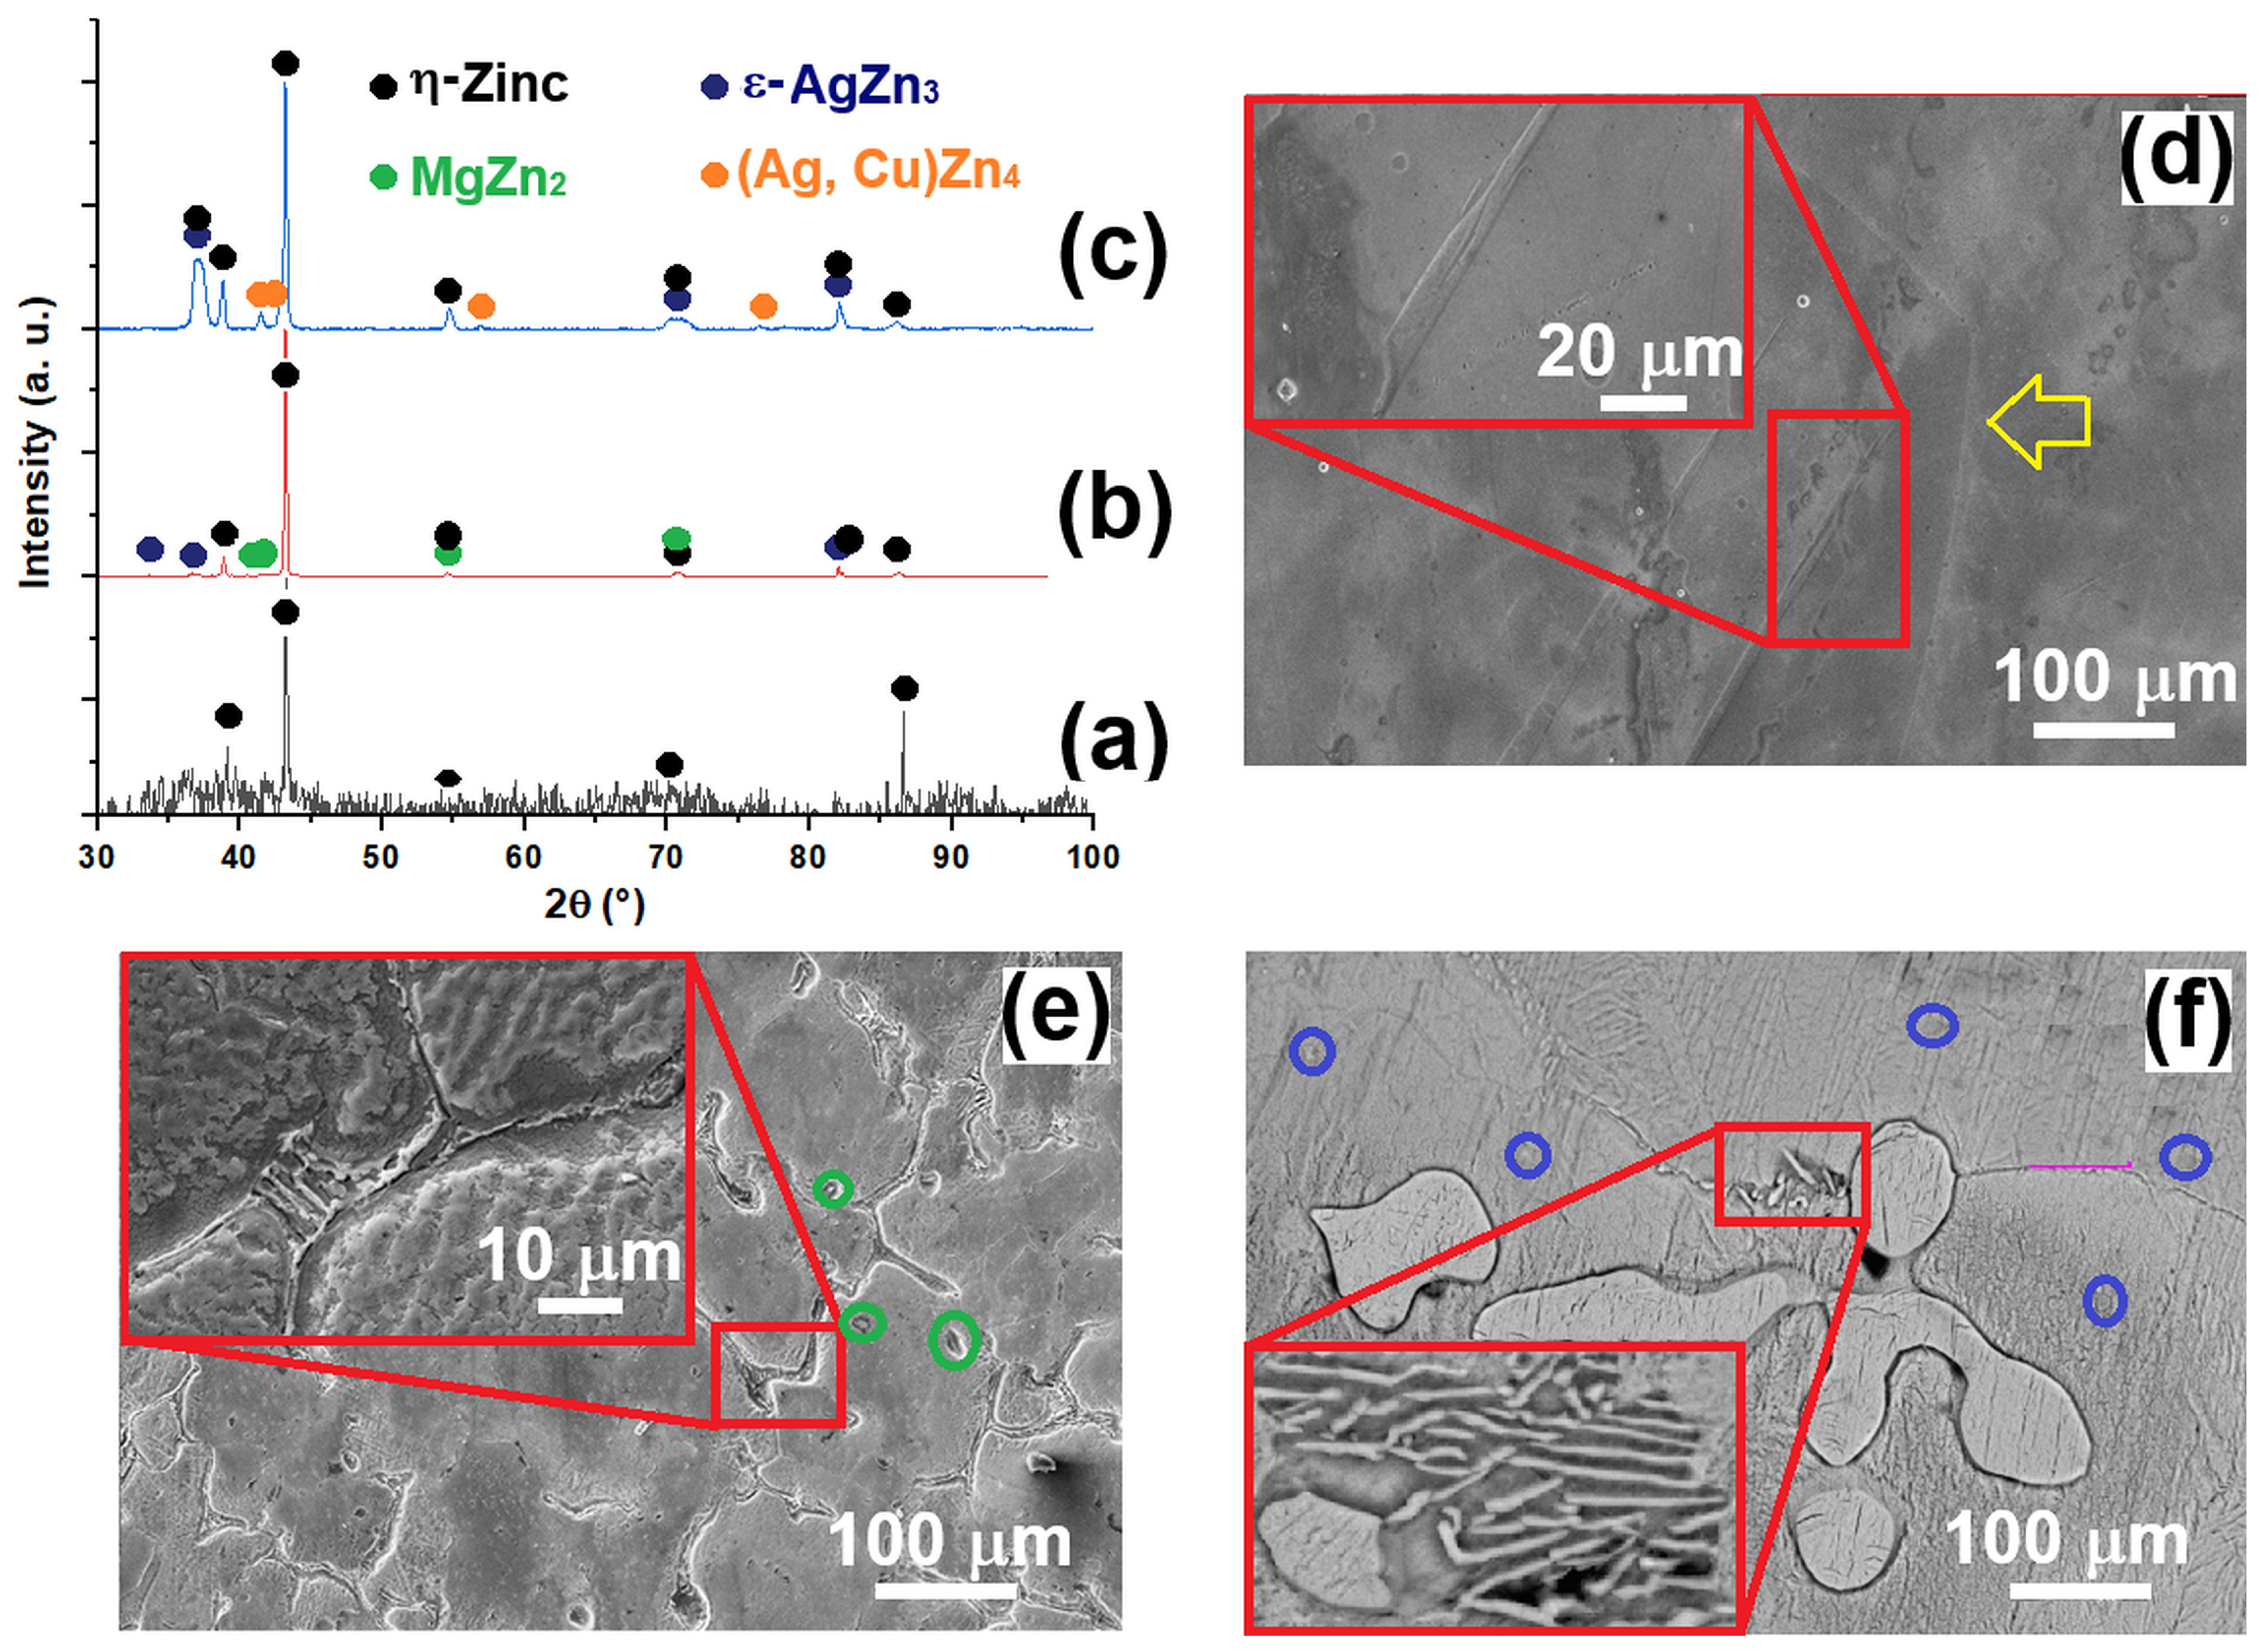
The characteristic XRD pattern of pure Zn solidified in cylindrical sand molds is shown in Figure 3a–c with η-Zn at 2θ positions of 38.87°, 43.27°, 70.39°, and 86.62°, respectively. In Figure 3d, the pure Zn microstructure in the as-cast condition, where typical twins were highlighted with a red rectangle, can be observed. Additionally, a yellow arrow indicates the presence of the grain boundary. Figure 3b confirms the presence of the secondary phases AgZn3 and MgZn2 showed in the Zn-Ag-Mg cooling curve from Figure 1c,d, at 2θ reflections of 36.67, 82.09, 40.59, 41.31, and 70.65, respectively. Figure 3e is a SEM micrograph where the Zn-Ag-Mg microstructure in the as-cast condition can be observed. The η-Zn matrix is divided by equiaxed grains, and the grain boundaries contain the well-known modified eutectic of ε-AgZn3 + η-Zn lamellas enriched with Mg. It seems that the MgZn2 secondary phase tends to be present in the form of precipitates distributed all along the η-Zn matrix, marked with green circles in Figure 3e. For the Zn-Ag-Cu system, it was confirmed the ε-AgZn3 and (Ag, Cu)Zn4 secondary phases were present, Figure 3c, at 2θ positions of 37°, 70.56°, 82.1°, and 41.5°, 42.71°, 56.83°, and 76.40°, respectively. In Figure 3f, equiaxed dendrites (purple line) composed of the (Ag, Cu)Zn4 and surrounded by the η-Zn matrix can be distinguished. Few and small precipitates can be noticed in Figure 3f, which can be attributed to the ε-AgZn3 secondary phase and were marked with blue circles.
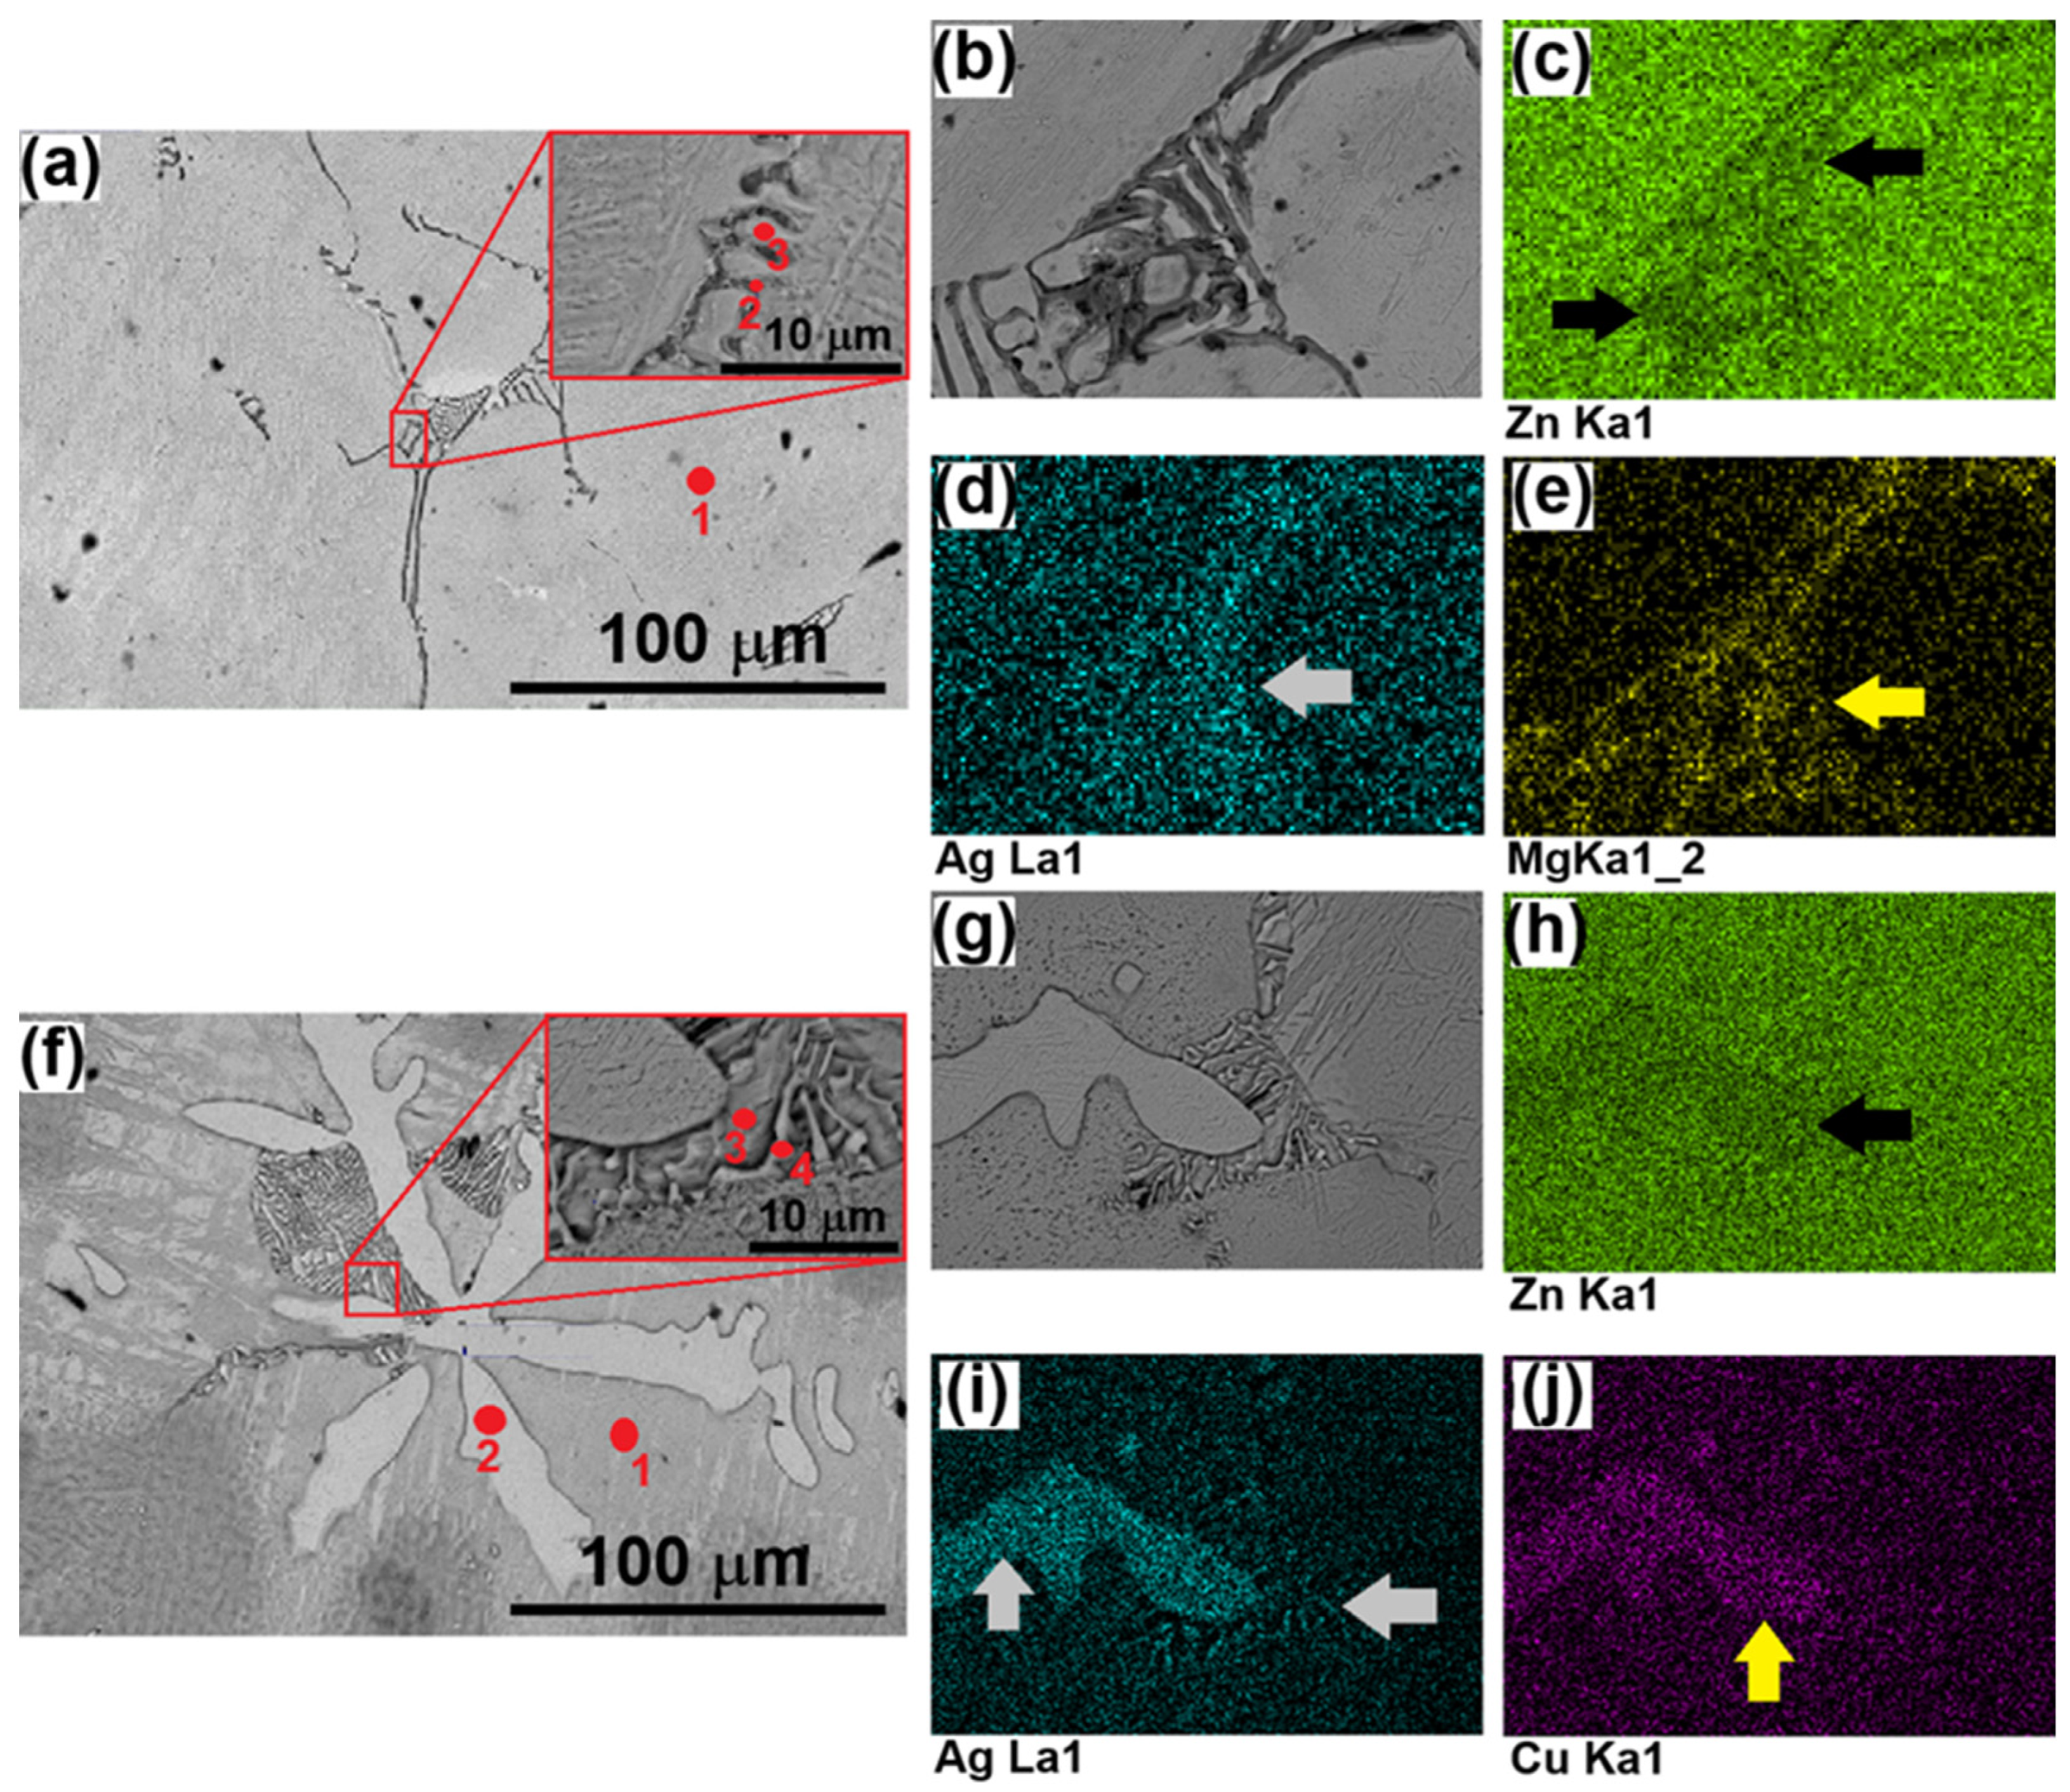
Interesting and highly defined microstructural features observed by SEM-EDS can be appreciated in Figure 4. From Figure 4a,b, the modified eutectic with hexagonal-like morphology and lamellas of the ε-AgZn3 + η-Zn phases can be observed. Figure 4c shows a deficiency of zinc in the region where the ε-AgZn3 lamellas are present (black arrows); in contrast, the η-Zn matrix is fully and homogeneously saturated with zinc. The above first assertion is confirmed in Figure 4d, where silver saturation can be appreciated in some regions (ε-AgZn3 lamellas, gray arrow) of the modified eutectic. Figure 4e reveals that this “sui generis” eutectic is Mg-enriched (yellow arrow). So, the Zn-Ag-Mg alloy is principally composed of the modified eutectic, which is a composition of ε-AgZn3 + η-Zn lamellas with Mg enrichment and the η-Zn matrix surrounding them. A more complex microstructure was found for the Zn-Ag-Cu alloy system; in Figure 4f,g, it can be appreciated that bigger equiaxed dendrites (compared with Zn-Ag-Mg) of the (Ag, Cu)Zn4 secondary phase are surrounded by the η-Zn matrix and a common eutectic made up of ε-AgZn3 + η-Zn lamellas. It is evident that the Zn deficiency (highlighted with black arrows) is in the (Ag, Cu)Zn4 dendrites, Figure 4h, where the η-Zn matrix is zinc-saturated as in Zn-Ag-Mg. On the other hand, in Figure 4i, silver is concentrated in the (Ag, Cu)Zn4 dendrites and in the ε-AgZn3 lamellas; these features were highlighted with gray arrows. Finally, it is clear that copper is principally in the (Ag, Cu)Zn4 dendrites (yellow arrow), and there is no presence of it in the eutectic lamellas, Figure 4j. Punctual chemical compositions of the aforementioned secondary phases present in Zn-Ag-Mg and Zn-Ag-Cu were made with the EDS technique, and the results with the corresponding standard deviations are summarized in Table 2 and Table 3. These tables are a complementary confirmation of the findings exposed in Figure 1, Figure 2, Figure 3 and Figure 4 related to the secondary phase’s precipitation in the hypoperitectic-studied alloys in the current work.

3.2. Mechanical Behavior and Fractography Evidence

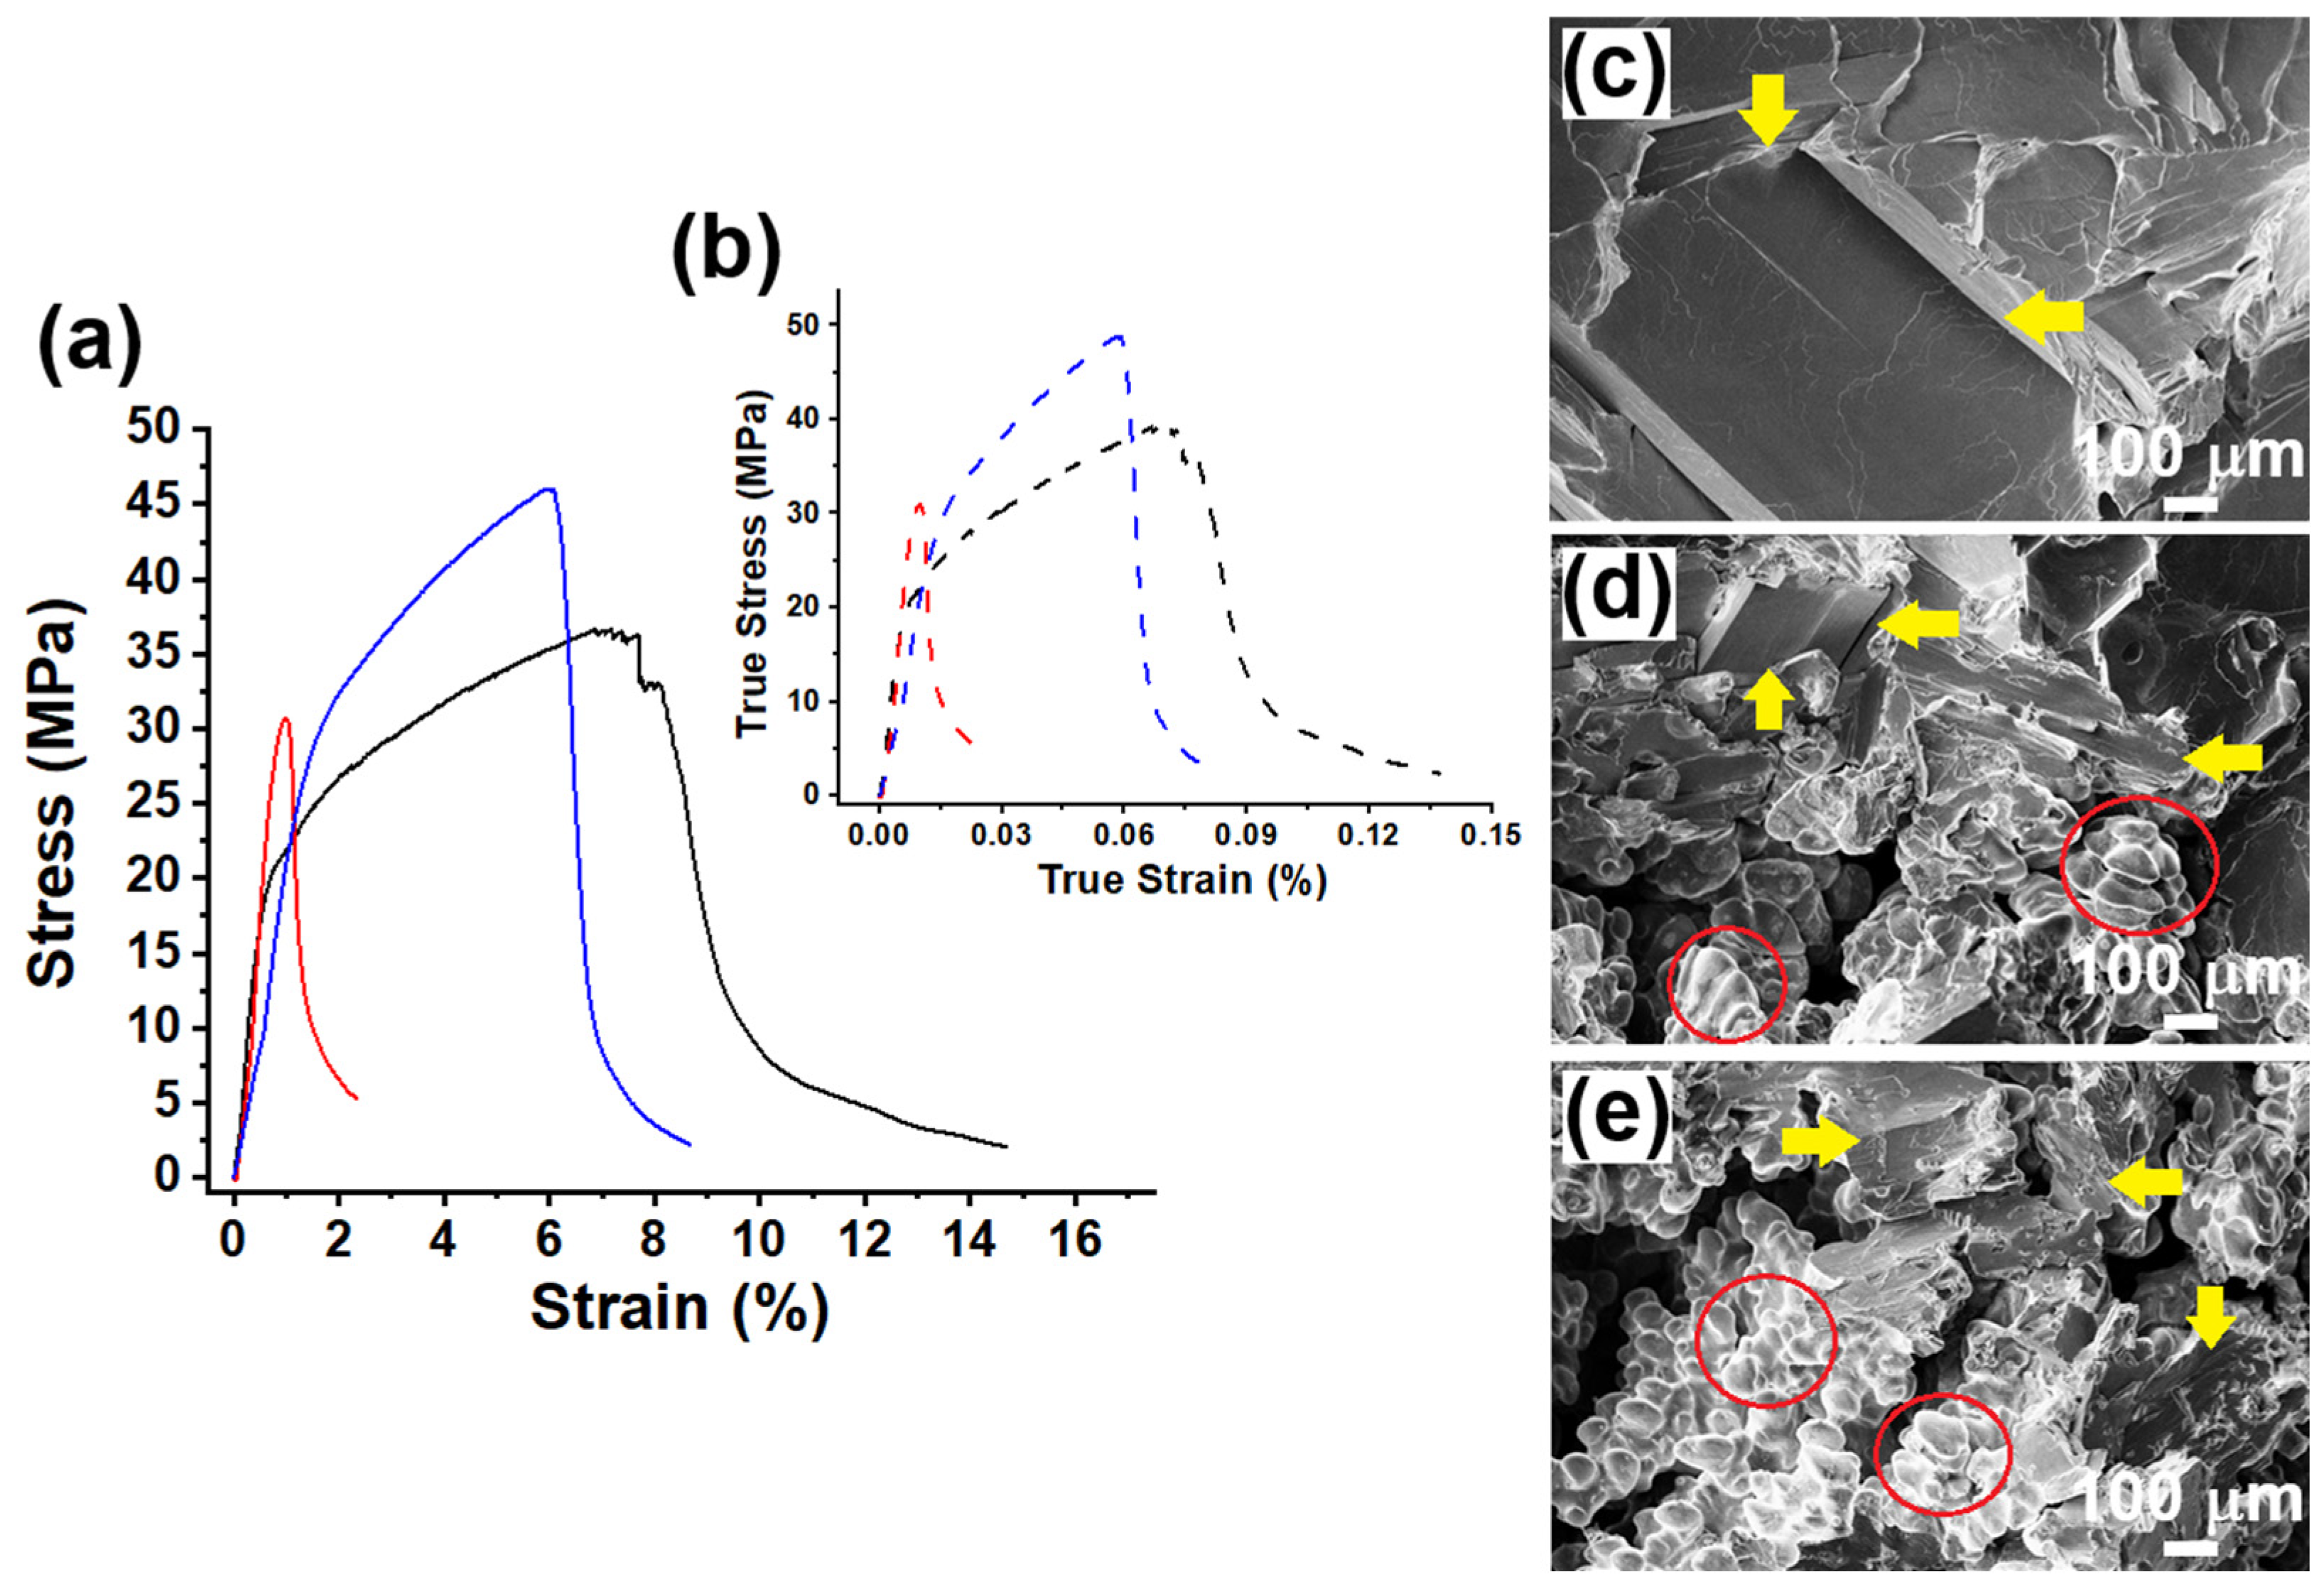
As complementary information, the mechanical behavior of the hypoperitectic as-cast alloys is presented in Figure 5 and Table 4. It is noticeable that Zn-Ag-Mg possesses the lowest mechanical properties in comparison to pure Zn and Zn-Ag-Cu. Although these properties are related to the as-cast condition, it is an antecedent that must be taken into account at the time of designing an alloy system for biomedical devices. The trend for YS and UTS is as follows: Zn-Ag-Cu ˃ pure Zn ˃ Zn-Ag-Mg; and for elongation: pure Zn ˃ Zn-Ag-Cu ˃ Zn-Ag-Mg. The performance shown by Zn-Ag-Mg is in accordance with its fractography, where a mixture of fragile faceted phases with a semi-ductile (more inclined to fragile) behavior from the modified eutectic is enriched with magnesium. Vickers’ hardness shows the following tendency: Zn-Ag-Cu ˃ Zn-Ag-Mg ˃ pure Zn, Table 4. Additionally, with respect to the mechanical properties, no statistical differences were found between the pure Zn, Zn-Ag-Mg, and Zn-Ag-Cu alloy (YS, UTS, and % of elongation); Table S1, related to the statistical analysis, can be found in the Supplementary Materials.

3.3. Electrochemical Information of the Hypoperitectic Zn-Ag Alloy with Mg and Cu Additions

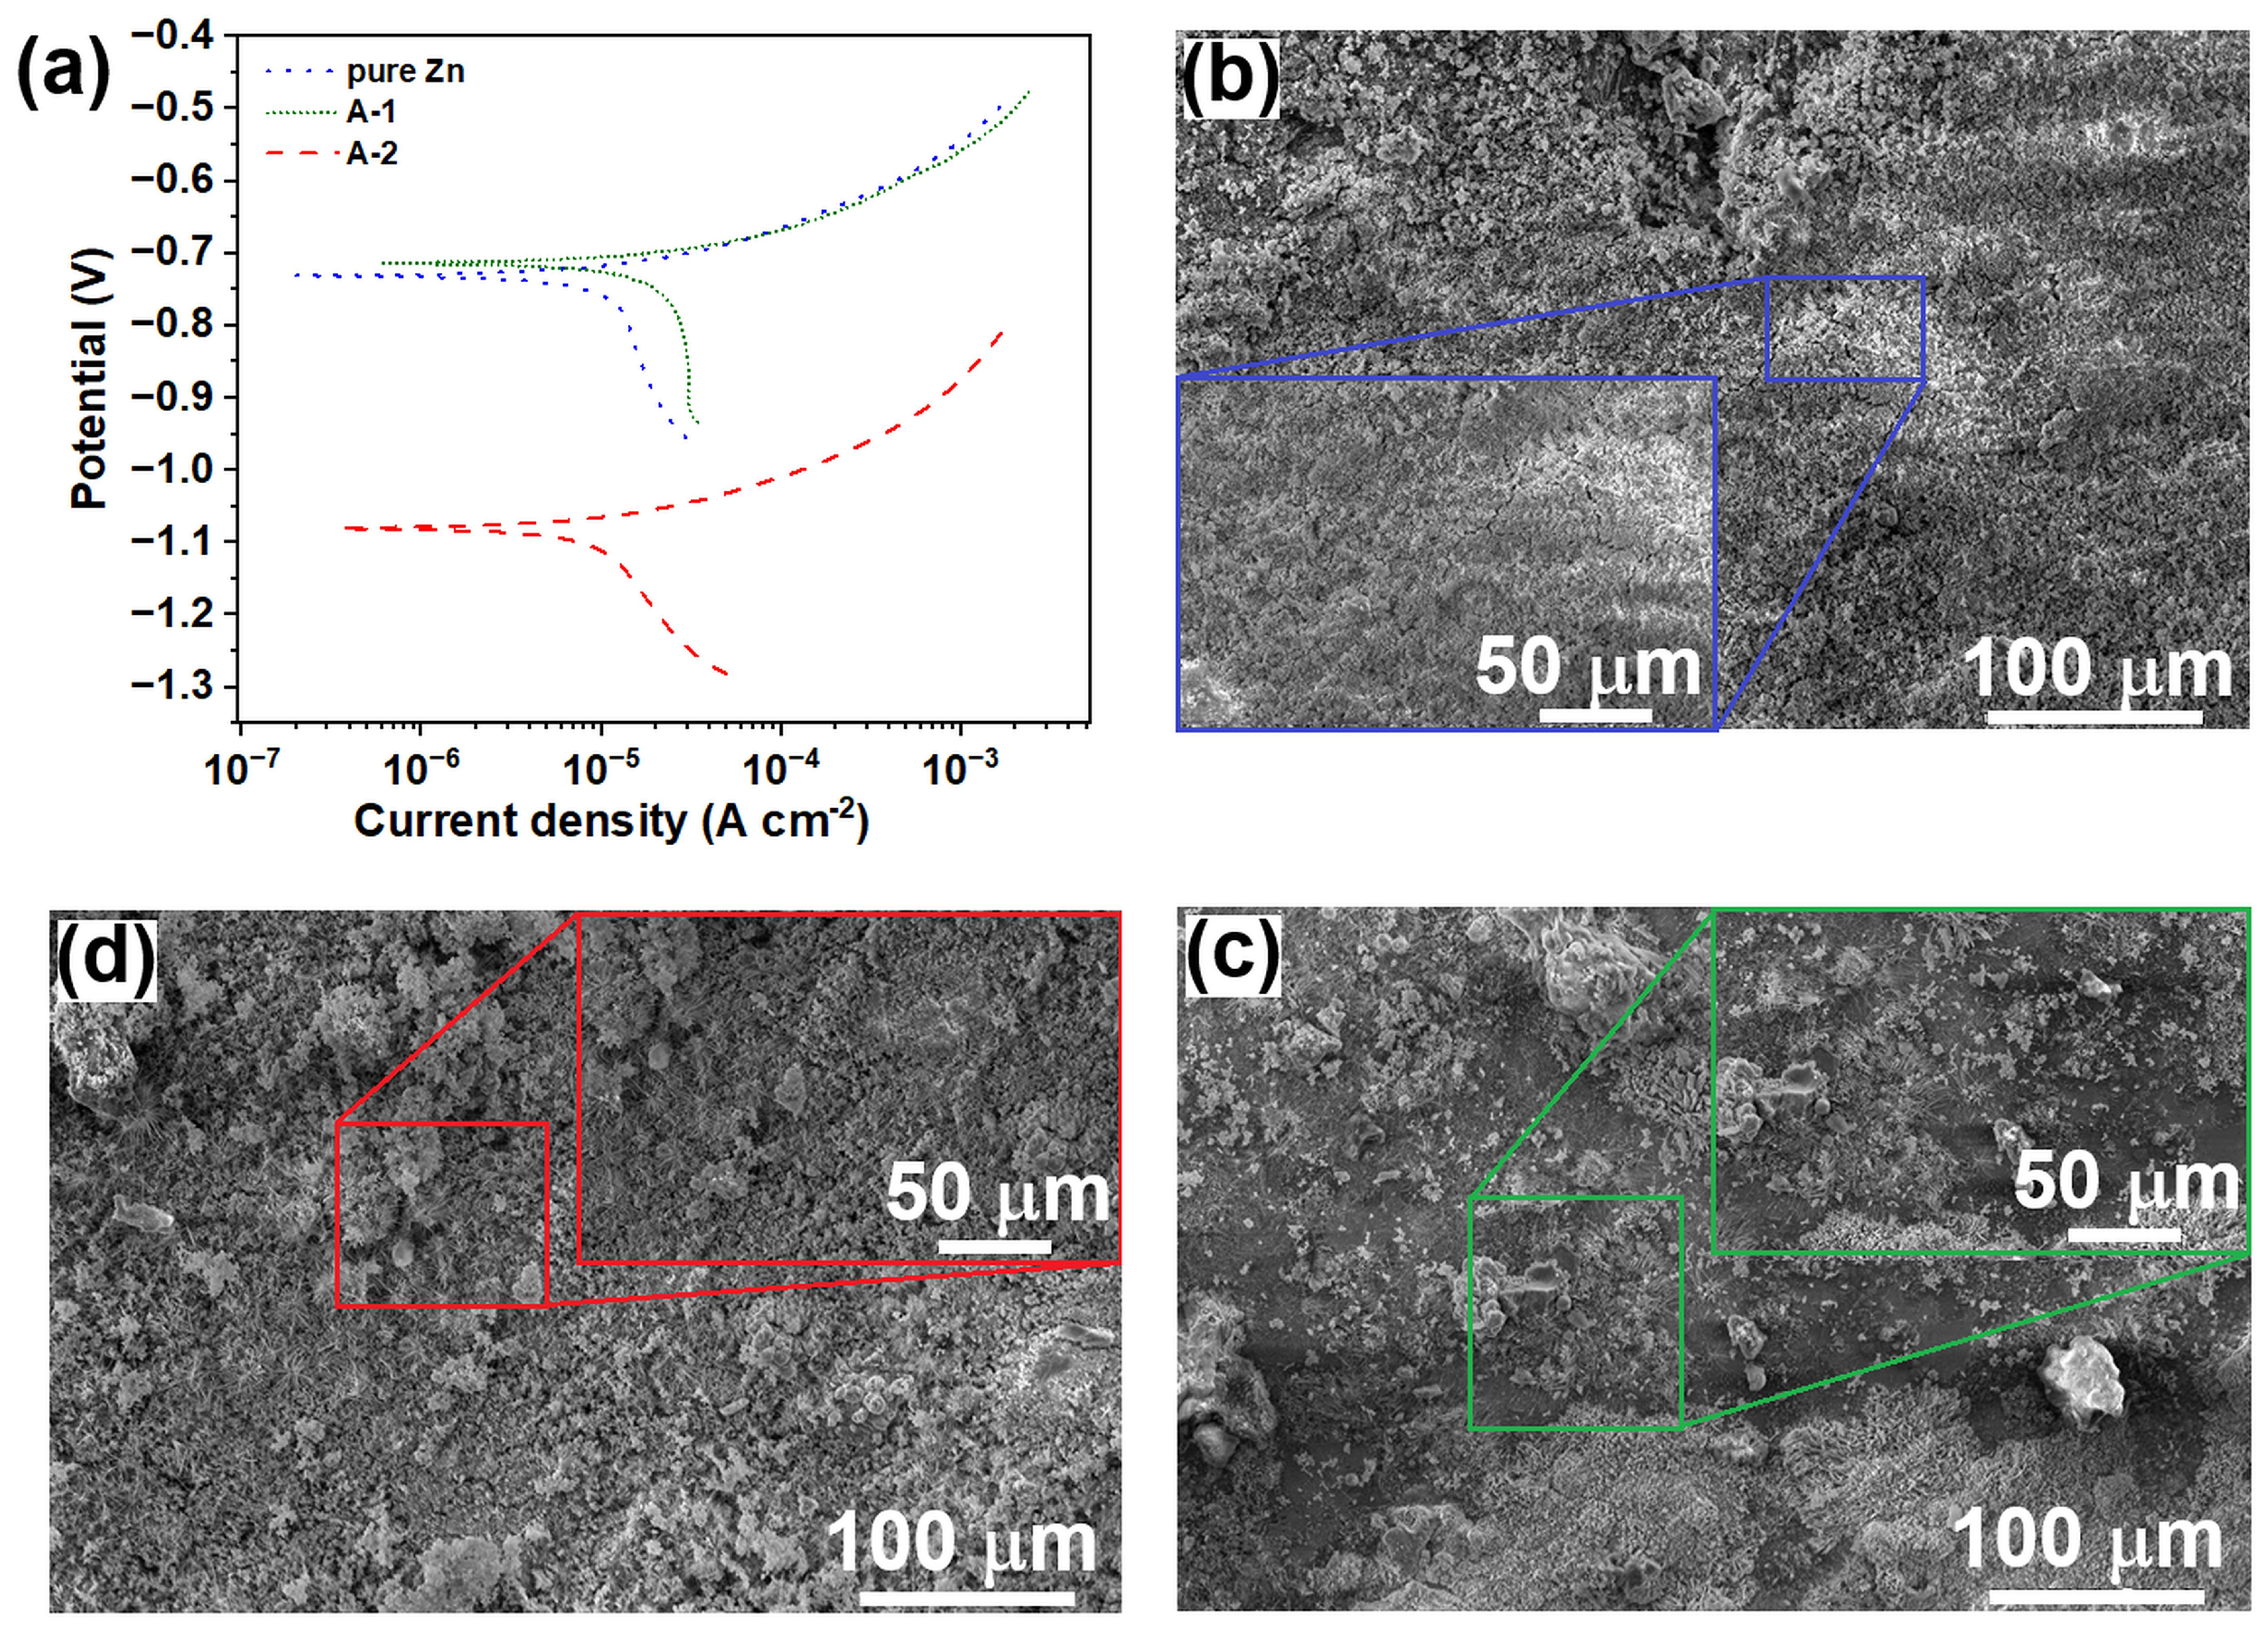
Regarding the studied alloys’ corrosion performance, the higher value in terms of corrosion rate corresponds to Zn-Ag-Cu with 0.267 mm/year, followed by Zn-Ag-Mg with 0.199 mm/year and pure Zn with 0.151 mm/year, Figure 6a, Table 5. Figure 6b–d exhibits the corrosion product’s morphology and distribution. In addition, Table 5 contains information on the electrochemical pure Zn, Zn-Ag-Mg, and Zn-Ag-Cu parameters, such as bc and ba cathodic and anodic Tafel slopes, and chemical compositions of corrosion products from the alloys being exposed to Hank’s buffered saline solution at 37 °C.

4. Discussion

4.1. Secondary Phase’s Stability and Zn-Ag Microstructure After Mg and Cu Additions

In previous work, the hyperperitectic Zn–10.0Ag–1.0Mg alloy [29] obtained under different cooling rate conditions was studied, and the main conclusions were that the ε-AgZn3 morphology is closely dependent on solidification growth, convective flow during casting, and Mg concentration. These assertions are in total agreement with the microstructures exhibited in Zn-Ag-Mg and Zn-Ag-Cu, where cooling rates are in the order of ~1.875 °C/s, values considerably lower than those reported by using copper molds for the casting process performed between the limits of constitutional velocity and absolute stability, 2.6 × 10⁻⁴ mm/s and 3.3 × 102 mm/s, respectively [29]. However, despite the low cooling rate, in the present work, the microstructure complexity increases when Mg additions are replaced by Cu for the as-cast hypoperitectic alloys. The first derivative of the representative cooling curves of Zn-Ag-Mg and Zn-Ag-Cu is projected in Figure 1a and Figure 2a to precisely clarify the precipitation of phases that are hardly detected from the original cooling curves. Thus, each peak detected from the first derivative represents a phase transformation; in addition, Figure 1b–d and Figure 2b–d are insets showing a magnification of these energy-generation reactions. For Zn-Ag-Mg, the first solid crystal’s formation takes place at ~485 °C, and their completed solidification is present at a value of ~415 °C, Figure 1b. Then, at ~389 °C, the eutectic temperature appears, Figure 1c, followed by MgZn2 precipitation at ~344 °C, and finally with a peak corresponding to the primary ε-AgZn3 dendrites at ~380 °C, Figure 1d. Some temperature changes were perceived for Zn-Ag-Cu, where the first solid crystals precipitated at ~640 °C, and the competition of solidification was at ~410 °C, Figure 2a,b. The eutectic temperature was at a value of ~395 °C, Figure 2c, and an important finding is the transformation reaction of the (Ag, Cu)Zn dendrites at ~352 °C, Figure 2d, and the ε-AgZn3 eutectic lamellas precipitation at ~380 °C. Dambatta et al. [30] reported a starting solidification temperature for a eutectoid Zn-3Mg alloy of ~367 °C, and a solidification temperature competition of ~354 °C at a cooling rate of ~0.5 °C/s. Also, they reported a eutectic coherency point at a temperature of ~368 °C, contemplating the Mg2Zn11 precipitation. From these phase transformation temperatures, it is evident that Ag plays an important role in Zn-based alloys, increasing the energy-generation reaction temperatures when compared with the simplest binary alloys, such as the eutectoid Zn-3Mg. On the other hand, it is interesting that in Zn-Ag-Mg, MgZn2 the reaction takes place before η-AgZn3 precipitation, whereas in Zn-Ag-Cu, (Ag, Cu)Zn4 occurs after ε-AgZn3 formation. Moreover, the eutectic-like reaction always appears just after the solidification is completed at a temperature value of ~390 °C for both Zn-Ag alloys independently of Mg or Cu additions. The aforementioned findings demonstrate that precise values of secondary precipitation temperatures are critical at the time of making decisions for post-casting processing. It is not obvious that a wrong solubilization treatment temperature before extrusion or equal-channel angular pressing, among other thermomechanical procedures, has an important impact on the mechanical properties of Zn-based and Zn-Ag-based biodegradable alloys. For example, Li et al. [31] reported a homogenization temperature of 300 °C for 1 h; in this respect, this temperature does not ensure the dissolution of all the precipitated phases, such as the secondary one known as ε-ZnAg3. A Zn-1.5Cu-1.5Ag biodegradable alloy was homogenized at 400 °C before extrusion. This is a very high solubilization temperature, which implies the localized fusion regions are at risk [32]. Di et al. [33] perform a homogenization treatment before hot extrusion on two biodegradable alloys: Zn-1Cu-0.5Ag and Zn-1Cu-1Ag at 360 °C. Once again, this solubilization temperature does not guarantee the desired secondary phase’s “disappearance.” The secondary phase’s presence in the Zn-Ag hypoperitectic system after Mg and Cu additions, respectively, was first confirmed by XDR pattern indexation, Figure 3a–c, and preliminary microstructure distribution can be appreciated in Figure 3d–f. In agreement with Ji et al. [34] for the Zn-Ag system with Mg, there is the Mg2Zn11 secondary phase related to low Mg content. And the appearance of the CuZn4 phase is in agreement with Liu et al. [35] for the Zn-2Cu binary alloy. These facts indicate that, due to the limited solubility of Mg in Zn [36], after precipitating in the MgZn2 form, the rejected Mg incorporates immediately into the eutectic-like lamellas, generating a modified eutectic composed of lamellas of η-AgZn3 + η-Zn enriched with Mg, as shown in Figure 4e. In contrast, Cu and Ag have more solubility in Zn [37,38], and also the great affinity between Cu and Ag gives the opportunity for both elements to transform into the (Ag, Cu)Zn4 secondary phase after the ε-AgZn3 + η-Zn eutectic-like lamella is formed [39]. The absence of Cu in its lamellas was confirmed in Figure 4i. And Figure 4h reveals that Cu is principally located in the (Ag, Cu)Zn dendrites and (Ag, Cu)Zn4 lamellas from the eutectic-like reaction distributed all along the η-Zn matrix as well. So, an important finding is that the eutectic-like lamella (ε-AgZn3 + η-Zn) is highly stable in the Zn-Ag binary system, and independently, the third addition element will be present in the microstructure, Figure 3 and Figure 4. Additionally, Heiss et al. reported the Zn-2.5Ag-1.5Cu as-cast microstructure [40], where it is possible to observe equiaxed dendrites enriched with Ag and Cu surrounded by the η-Zn matrix, which is similar to that one presented in Figure 4f–j. An important difference between the Zn-2.5Ag-1.5Cu [40] compared to the Zn-Ag-Cu presented in this work is the eutectic-like lamella composed of a mixture of ε-AgZn3 + η-Zn, which surrounds the equiaxed (Ag, Cu)Zn dendrites, which is absent in the Zn-2.5Ag-1.5Cu alloy [40], see Figure 4f.
From Table 2, the modified eutectic-like Mg enrichment in both lamellas was confirmed: the dark one related to the η-Zn phase (point 2) and the light one to the ε-AgZn3 phase (point 3), see Figure 4a,b. This means that the MgZn2 phase is present in precipitate form, which can only be visualized in Figure 3e, highlighted by green circles. On the other hand, Table 3 exhibits the secondary phases related to the Zn-Ag-Cu alloy (see Figure 4f,g), where it is possible to see their stoichiometry. Equiaxed dendrites, point 2 from Figure 4f, possess a stoichiometry of ~(Ag, Cu)Zn4, and similar to Zn-Ag-Mg, the dark lamella from Figure 4f corresponds to the η-Zn, and the light one is the ε-AgZn3, points 3 and 4, respectively.

4.2. Mechanical and Electrochemical Implications of Mg and Cu Additions

From Figure 5a,b, it is evident that the Zn-Ag-Cu system exhibits better mechanical performance compared to the Zn-Ag-Mg system. Additionally, one-way ANOVA analysis revealed no statistically significant differences among the three experimental replicates for each alloy condition (p > 0.05), indicating good reproducibility of the tensile response. The limited experimental scatter suggests that the processing route produced a relatively homogeneous microstructure, minimizing specimen-to-specimen variability. Consequently, the measured mechanical properties can be considered representative of the investigated alloys, thereby supporting the reliability of the observed trends and subsequent microstructure–property correlations. Although Ag and Mg are known as refiners’ elements in zinc alloys [41], this dendrite refinement (Figure 3e) must improve the mechanical response in Zn alloys; the presence of hexagonal morphology (Figure 4a,b) of the modified eutectic-like lamella with Mg enrichment that is not well distributed all along the η-Zn matrix significantly decreases the mechanical properties in Zn-Ag-Mg. This could be seen in its fractography, presenting several cleavage facets characteristic of brittle fracture [42,43], indicated with yellow arrows, Figure 5d. On the contrary, Zn-Ag-Cu exhibits shorter cleavage facet regions highlighted with yellow arrows in Figure 5e and more dimples related to ductile behavior marked with red circles. Also, it is important to mention that, in the present work, a similar ductility value was achieved in comparison to the work of Khafizova et al. of ~6 to 7% for a Zn-~4Ag-~1Cu-~0.44Mg alloy in the as-cast condition [44], see Table 4.
As a single-phase material, pure Zn lacks secondary phases, limiting its degradation to uniform dissolution regulated by a semi-protective surface film (e.g., Zn(OH)2, ZnO, ZnCO3) rather than a localized galvanic attack [45]. This is quantitatively supported by the highest anodic Tafel slope (ba = 0.195 V/dec), indicating a higher kinetic barrier to dissolution compared to the alloys. The addition of Mg and Ag in the Zn-Ag-Mg system resulted in a slight potential ennoblement (Ecorr = −0.728 V), likely due to the nobility of silver, yet the corrosion rate increased to 0.199 mm/year. In this way, corrosion mechanisms were further elucidated by analyzing the Tafel kinetic parameters (ba and bc). The cathodic slopes remained remarkably consistent across all materials (bc approx −0.130 to −0.142 V/dec). This stability indicates that the fundamental reduction reaction—likely the oxygen reduction reaction (ORR)—remains unchanged regardless of alloy composition. Consequently, the increased icorr observed in the alloys is not due to a change in the reaction pathway, but rather an increase in the effective cathodic surface area provided by the noble intermetallic phases (ε-AgZn3 y MgZn2). Zn-Ag-Cu shows the sharp reduction in anodic slopes (ba), which confirms that the Zn matrix is thermodynamically and kinetically destabilized by the Cu-rich phases. The strong galvanic driving force from the (Ag, Cu)Zn dendrites “depolarizes” the anodic reaction, lowering the energy barrier for Zn dissolution and maintaining the material in an active state. This behavior is driven by micro-galvanic coupling between the η-Zn matrix and the intermetallic precipitates (ε-AgZn3 and MgZn2), which act as local cathodes. Notably, despite containing active Mg, the MgZn2 phase can behave cathodically relative to the matrix in specific electrolytes, promoting a localized attack at precipitate interfaces. Zn-Ag-Cu induced a drastic shift to a more active potential (Ecorr = −1.146 V) and the highest degradation rate (0.267 mm/year) [46]. The significant decrease in the anodic slope to ba = 0.111 V/dec suggests a state of “facilitated dissolution.” This is attributed to the high cathodic efficiency of the Cu-rich (Ag, Cu)Zn dendrites, which generate a strong electromotive force relative to the matrix, thereby depolarizing the anodic reaction and preventing stable passive film formation [47,48].
Energy-Dispersive Spectroscopy (EDS) area analysis of the corrosion products, Table 5, provides chemical evidence for the observed corrosion hierarchy. The variation in corrosion resistance is fundamentally dictated by the ability of each material to form and sustain a stable, protective surface film in the presence of physiological ions. The superior corrosion resistance of pure Zn (0.151 mm/year) is directly supported by the chemical signature of its surface layer, which exhibits the highest atomic concentration of oxygen (63.87 at. %) and, significantly, a high concentration of phosphorus (8.35 at. %). This stoichiometry suggests the formation of a compact passivation layer composed primarily of zinc oxide/hydroxide (ZnO/Zn(OH)2) reinforced by insoluble zinc phosphates (Zn3(PO4)2) precipitated from Hank’s solution. This phosphate-rich film acts as an effective kinetic barrier, physically blocking dissolution of the underlying zinc matrix and preventing penetration by aggressive ions. In contrast, the alloying additions in the Zn-Ag-Mg system disrupt this passivation mechanism. The EDS analysis for the Zn-Ag-Mg system shows a distinct drop in oxygen content (53.90 at. %) and a drastic reduction in phosphorus to merely 0.83 at. %, indicating that the protective phosphate film is severely destabilized. Instead, the surface becomes enriched with soluble species, evidenced by significant amounts of sodium (18.12 at. %) and chlorine (1.50 at. %). The inability to sustain a phosphate barrier renders the matrix vulnerable to microgalvanic coupling, thereby allowing the corrosion reaction to proceed with reduced kinetic resistance. Thus, EDS analysis confirms that the superior corrosion resistance of pure Zn is linked to its ability to form a phosphorus-rich passive oxide layer. In contrast, the alloying elements in Zn-Ag-Mg and Zn-Ag-Cu disrupt this passivation. Specifically, the Zn-Ag-Mg system fails to retain the protective phosphate species, while the aggressive galvanic coupling in Zn-Ag-Cu renders the surface film porous and non-protective despite the presence of phosphorus, leading to the highest observed degradation rate. From this perspective, the transition from single-phase microstructure to heterogeneous multiphase systems significantly accelerates degradation. While Ag and Mg moderately increase corrosion via micro-galvanic coupling, the introduction of Cu in the Zn-Ag-Cu system creates aggressive micro-cathodes that actively depolarize the anodic matrix, resulting in the highest corrosion susceptibility. Finally, the Zn-Ag-Cu system represents a state of “active dissolution” where the driving force of the galvanic coupling overwhelms the protective capacity of the surface film. Although the EDS data indicate a recovery in phosphorus content (6.15 at. %), compared with the Zn-Ag-Mg system, the alloy exhibits the highest corrosion rate. This implies that while phosphate-based products form, they fail to adhere as a compact layer due to the rapid release of Zn2+ ions driven by the noble (Ag, Cu)Zn dendrites. The resulting porous product fails to retard the aggressive galvanic attack, confirming the microstructural dependence of the degradation rates.

5. Conclusions

-
Independent of Mg or Cu additions, the completed solidification, eutectic, and ε-AgZn3 precipitation temperatures remain mostly the same at ~410 °C, ~390 °C, and ~380 °C, respectively. However, precipitation temperatures of secondary phases exhibit the following values: ~340 °C and ~350 °C, for the MgZn2 and (Ag, Cu)Zn, respectively. This information is vital at the time of performing heat treatments or thermomechanical procedures with the main purpose of increasing the mechanical alloy’s performance.
-
XRD and EDS characterization confirm the secondary MgZn2 and (Ag, Cu)Zn phases’ presence. Specifically, EDS mapping plus SEM micrographs reveal the Ag, Mg, and Cu local distribution in detail. Additionally, it was demonstrated that Cu additions promote two stoichiometries for the Zn-Ag-Cu combinations identified as (Ag, Cu)Zn related to the equiaxed dendrites, and (Ag, Cu)Zn4, which corresponds to the eutectic-like dark lamellas formed in the Zn–2.56Ag–0.33Cu alloy.
-
Although both Ag and Mg are considered dendrite and grain refiners’ elements for Zn-based alloys and, consequently, they must promote an increase in mechanical behavior, the reality is that Mg acts as a brittle element by inducing hexagonal geometries in eutectic-like lamellas. On the contrary, Cu additions form ductile secondary phases such as (Ag, Cu)Zn and (Ag, Cu)Zn4; specifically for the (Ag, Cu)Zn4 located in the eutectic-like dark lamellas, the related microstructural geometries are more disordered, bringing a more ductile behavior without sacrificing the strength of the Zn-Ag-Cu alloy as a consequence.
-
From the electrochemical characterization performed in simulated body fluids, it is remarkable that the highest corrosion rate corresponds to the Zn-Ag-Cu alloy (0.267 mm/year) compared with pure Zn (0.151 mm/year) and the Zn-Ag-Mg alloys (0.199 mm/year); it is expected that after thermomechanical processing, the trend will continue. In addition, the SEM micrographs after electrochemical tests revealed that the Zn-Ag-Cu corrosion products are less adherent with respect to the ones formed in the Zn-Ag-Mg alloy, which is in agreement with the reported corrosion rate tendency.

Supplementary Materials

The following supporting information can be downloaded at https://www.mdpi.com/article/10.3390/met16070706/s1. Figure S1: Experimental arrangement showing in detail the cooling curves obtention; Figure S2: Cooling curves taken with type k thermocouples and the corresponding temperature-time values used to solve Equation (S1) to Equation (S3); Table S1: Statistical results of the one–way ANOVA test with Tamhane post–hoc multiple comparison between pure Zinc, Zn-Ag-Mg, and Zn-Ag-Cu alloys.

Author Contributions

Conceptualization, A.L.R.-L., P.R.-B., and J.A.J.-I.; methodology, A.L.R.-L., P.R.-B., Y.S.-d.J., and J.A.J.-I.; formal analysis, A.L.R.-L., P.R.-B., E.A.-P., and A.P.-G.; investigation, A.L.R.-L., P.R.-B., E.A.-P., and A.P.-G.; data curation, Y.S.-d.J.; writing—original draft preparation, A.L.R.-L., P.R.-B., and Y.S.-d.J.; writing—review and editing, A.L.R.-L.; supervision, A.L.R.-L. and J.A.J.-I. All authors have read and agreed to the published version of the manuscript.

Funding

This research received no external funding.

Data Availability Statement

The raw/processed data required to reproduce these findings cannot be shared at this time, as the data also forms part of an ongoing study.

Acknowledgments

A. G. Ruíz-Tamayo, C. Márquez-Herrera, E. Hernández-Mecinas, O. Novelo-Peralta, L. S. Bazán-Díaz, A. Tejeda-Cruz.

Conflicts of Interest

The authors declare no conflicts of interest.

References

  1. WHO|Cardiovascular Diseases (CVDs). WHO. 2025. Available online: https://www.who.int/news-room/fact-sheets/detail/cardiovascular-diseases-(cvds) (accessed on 2 December 2025).
  2. Liu, Y.; Du, T.; Qiao, A.; Mu, Y.; Yang, H. Zinc-Based Biodegradable Materials for Orthopaedic Internal Fixation. J. Funct. Biomater. 2022, 13, 164. [Google Scholar] [CrossRef] [PubMed]
  3. The Royal Children’s Hospital Melbourne|Fracture Healing. RCH.ORG.AU. Available online: https://www.rch.org.au/fracture-education/fracture_healing/ (accessed on 2 December 2025).
  4. Ma, Q.; Miri, Z.; Haugen, H.J.; Moghanian, A.; Loca, D. Significance of mechanical loading in bone fracture healing, bone regeneration, and vascularization. J. Tissue Eng. 2022, 13, 164. [Google Scholar] [CrossRef] [PubMed]
  5. Jia, B.; Yang, H.; Han, Y.; Zhang, Z.; Qu, X.; Zhuang, Y.; Wu, Q.; Zheng, Y.; Dai, K. In vitro and in vivo studies of Zn-Mn bio-degradable metals designed for orthopedic applications. Acta Biomater. 2020, 108, 358–372. [Google Scholar] [CrossRef] [PubMed]
  6. Li, P.; Dai, J.; Li, Y.; Alexander, D.; Čapek, J.; Geis-Gerstorfer, J.; Wan, G.; Han, J.; Yu, Z.; Li, A. Zinc based biodegradable metals for bone repair and regeneration: Bioactivity and molecular mechanisms. Mater. Today Bio. 2024, 25, 100932. [Google Scholar] [CrossRef] [PubMed]
  7. Wen, X.; Wang, J.; Pei, X.; Zhang, X. Zinc-based biomaterials for bone repair and regeneration: Mechanism and applications. J. Mater. Chem. B 2023, 48, 11405. [Google Scholar] [CrossRef] [PubMed]
  8. Fan, L.; Chen, S.; Yang, M.; Liu, Y.; Liu, J. Metallic Materials for Bone Repair. Adv. Healthc. Mater. 2024, 26, 2302132. [Google Scholar] [CrossRef] [PubMed]
  9. Hussain, M.; Ullah, S.; Raza, M.R.; Abbas, N.; Ali, A. Recent Developments in Zn-Based Biodegradable Materials for Biomedical Applications. J. Funct. Biomater. 2023, 14, 1. [Google Scholar] [CrossRef] [PubMed]
  10. Yang, H.; Jia, B.; Zhang, Z.; Qu, X.; Li, G.; Lin, W.; Zhu, D.; Dai, K.; Zheng, Y. Alloying design of biodegradable zinc as promising bone implants for load-bearing applications. Nat. Commun. 2020, 11, 401. [Google Scholar] [CrossRef] [PubMed]
  11. Jarzębska, A.; Gieleciak, M.; Bigos, A.; Mag, Ł.; Trembecka-W´ojciga, K.; Bugajska, M.; Bieda, M.; Rogal, Ł.; Kawałko, J.; Przybysz, S.; et al. Microstructure-properties relation of hydrostatically extruded absorbable zinc alloys: Effect of Mg and Cu addition on corrosion properties and biocompatibility. J. Mater. Res. Technol. 2024, 30, 283–294. [Google Scholar] [CrossRef]
  12. Mostaed, E.; Sikora-Jasinska, M.; Mostaed, A.; Loffredo, S.; Demir, A.G.; Previtali, B.; Mantovani, D.; Beanland, R.; Vedani, M. Novel Zn-based alloys for biodegradable stent applications: Design, development and in vitro degradation. J. Mech. Behav. Biomed. Mater. 2016, 60, 581–602. [Google Scholar] [CrossRef] [PubMed]
  13. Tong, X.; Dong, Y.; Han, Y.; Zhou, R.; Zhu, L.; Zhang, D.; Dai, Y.; Shen, X.; Li, Y.; Wen, C.; et al. A biodegradable Zn-5Gd alloy with biomechanical compatibility, cytocompatibility, antibacterial ability, and in vitro and in vivo osteogenesis for orthopedic applications. Acta Biomater. 2024, 177, 538–559. [Google Scholar] [CrossRef] [PubMed]
  14. Shen, D.; Li, Y.; Shi, J.; Zhang, T.; Nie, J.-J.; Chen, D.; Xia, D.; Zheng, Y. Biodegradable Zn-Li-Mn alloy to achieve optimal strength and ductility for bone implants. Acta Biomater. 2025, 199, 483–499. [Google Scholar] [CrossRef] [PubMed]
  15. Vojtěch, D.; Kubásek, J.; Šerák, J.; Novák, P. Mechanical and corrosion properties of newly developed biodegradable Zn-based alloys for bone fixation. Acta. Mater. 2011, 7, 3515–3522. [Google Scholar] [CrossRef] [PubMed]
  16. Liu, C.; Li, Y.; Ge, Q.; Liu, Z.; Qiao, A.; Mu, Y. Mechanical characteristics and in vitro degradation of biodegradable Zn-Al alloy. Mater. Lett. 2021, 300, 130181. [Google Scholar] [CrossRef]
  17. Tong, X.; Han, Y.; Zhou, R.; Zeng, J.; Wang, C.; Yuan, Y.; Zhu, L.; Huang, S.; Ma, J.; Li, Y.; et al. Mechanical properties, corrosion and degradation behaviors, and in vitro cytocompatibility of a biodegradable Zn–5La alloy for bone-implant applications. Acta Biomater. 2023, 169, 641–660. [Google Scholar] [CrossRef] [PubMed]
  18. Pola, A.; Tocci, M.; Goodwin, F.E. Review of Microstructures and Properties of Zinc Alloys. Metals 2020, 10, 253. [Google Scholar] [CrossRef]
  19. Prasad, B.K.; Yegneswaran, A.H.; Patwardhan, A.K. Tensile Properties of Some Copper- and Zinc-Based Alloys: Effects of Strain Rate and Test Temperature. J. Mater. Eng. Perform. 2000, 9, 688–699. [Google Scholar] [CrossRef]
  20. Osório, W.R.; Santos, C.A.; Quaresma, J.M.V.; Garcia, A. Mechanical properties as a function of thermal parameters and microstructure of Zn–Al castings. J. Mater. Process. Technol. 2003, 143–144, 703–709. [Google Scholar] [CrossRef]
  21. Krupiński, M.; Krupińska, B.; Labisz, K.; Rdzawski, Z.; Borek, W. Influence of cooling rate on crystallisation kinetics on micro-structure of cast zinc alloys. J. Therm. Anal. Calorim. 2014, 118, 1361–1367. [Google Scholar] [CrossRef]
  22. Liu, Z.; Qiu, D.; Wang, F.; Taylor, J.A.; Zhang, M. The grain refining mechanism of cast zinc through silver inoculation. Acta Mater. 2014, 79, 315–326. [Google Scholar] [CrossRef]
  23. Zhuo, X.; Zhao, L.; Liu, H.; Qiao, Y.; Jiang, J.; Ma, A. A high-strength and high-ductility Zn–Ag alloy achieved through trace Mg addition and ECAP. Mater. Sci. Eng. A 2023, 881, 145381. [Google Scholar] [CrossRef]
  24. Nafikov, R.K.; Khafizova, E.D.; Fakhretdinova, E.I. Mechanical Properties of Zinc Alloy Zn–1Ag–1Cu Processed by Equal–Channel Angular Pressing and Extrusion. J. Surf. Investig. 2023, 18, 1560–1569. [Google Scholar] [CrossRef]
  25. ASTM E3-11; Standard Guide for Preparation of Metallographic Specimens. ASTM International: West Conshohocken, PA, USA, 2017.
  26. ASTM E8/E8M-16a; Standard Test Methods for Tension Testing of Metallic Materials. ASTM International: West Conshohocken, PA, USA, 2016.
  27. ASTM E92-17; Standard Test Methods for Vickers Hardness and Knoop Hardness of Metallic Materials. ASTM International: West Conshohocken, PA, USA, 2017.
  28. ASTM G102-89; Standard Practice for Calculation of Corrosion Rates and Related Information from Electrochemical Measurements. ASTM International: West Conshohocken, PA, USA, 2015.
  29. Ramirez-Ledesma, A.L.; Juárez-Islas, J.A.; Aburto-Perdomo, E.; Ruíz-Rodríguez, D.; Paternoster, C.; Mantovani, D. Chill-cast solidification of a peritectic Zn-10 Ag (+1.0 Mg) bioabsorbable alloy. Mater. Today Commun. 2024, 41, 110191. [Google Scholar] [CrossRef]
  30. Dambatta, M.S.; Izman, S.; Kurniawan, D.; Farahany, S.; Yahaya, B.; Hermawan, H. Influence of thermal treatment on micro-structure, mechanical and degradation properties of Zn–3Mg alloy as potential biodegradable implant material. Mater. Des. 2015, 85, 431–437. [Google Scholar] [CrossRef]
  31. Li, P.; Schille, C.; Schweizer, E.; Rupp, F.; Heiss, A.; Legner, C.; Klotz, U.E.; Geis-Gerstorfer, J.; Scheideler, L. Mechanical Characteristics, In Vitro Degradation, Cytotoxicity, and Antibacterial Evaluation of Zn-4.0Ag Alloy as a Biodegradable Material. Int. J. Mol. Sci. 2018, 19, 755. [Google Scholar] [CrossRef] [PubMed]
  32. Chen, C.; Yue, R.; Zhang, J.; Huang, H.; Niu, J.; Yuan, G. Biodegradable Zn-1.5Cu-1.5Ag alloy with anti-aging ability and strain hardening behavior for cardiovascular stents. Mater. Sci. Eng. C 2020, 116, 111172. [Google Scholar] [CrossRef] [PubMed]
  33. Di, T.; Xu, Y.; Liu, D.; Sun, X. Microstructure, Mechanical Performance and Anti-Bacterial Activity of Degradable Zn-Cu-Ag Alloy. Metals 2022, 12, 1444. [Google Scholar] [CrossRef]
  34. Ji, C.; Ma, A.; Jiang, J.; Song, D.; Liu, H.; Guo, S. Research status and future prospects of biodegradable Zn-Mg alloys. J. Alloys Compd. 2024, 25, 174669. [Google Scholar] [CrossRef]
  35. Liu, J.; Wang, D.; Liu, B.; Li, N.; Liang, L.; Chen, C.; Zhou, K.; Baker, I.; Wu, H. Microstructural evolution, mechanical properties and corrosion mechanisms of additively manufactured biodegradable Zn-Cu alloys. J. Mater. Sci. Technol. 2024, 186, 142–157. [Google Scholar] [CrossRef]
  36. Okamoto, H. Supplemental Literature Review of Binary Phase Diagrams: Cs-In, Cs-K, Cs-Rb, Eu-In, Ho-Mn, K-Rb, Li-Mg, Mg-Nd, Mg-Zn, Mn-Sm, O-Sb, and Si-Sr. J. Ph. Equilib. Diffus. 2013, 34, 251–263. [Google Scholar] [CrossRef]
  37. Gómez-Acebo, T. Thermodynamic assessment of the Ag-Zn system. Calphad 1998, 2, 203–220. [Google Scholar] [CrossRef]
  38. Dinsdale, A.; Khvan, A.; Smirnova, E.A.; Ponomareva, A.V.; Abrikosov, I.A. Modelling the thermodynamic data for hcp Zn and Cu–Zn alloys– an ab initio and calphad approach. Calphad 2021, 72, 102253. [Google Scholar] [CrossRef]
  39. Garzel, G.; Janczak-Rusch, J.; Zabdyr, L. Reassessment of the Ag–Cu phase diagram for nanosystems including particle size and shape effect. Calphad 2012, 36, 52–56. [Google Scholar] [CrossRef]
  40. Heiss, A.; Thatikonda, V.S.; Richter, A.; Schmitt, L.-Y.; Park, D.; Klotz, U.E. Development, Processing and Aging of Novel Zn-Ag-Cu Based Biodegradable Alloys. Materials 2023, 16, 3198. [Google Scholar] [CrossRef] [PubMed]
  41. Liu, Z. A New Approach Toward Designing and Synthesizing the Microalloying Zn Biodegradable Alloys with Improved Mechanical Properties. Metall. Mater. Trans. A 2019, 50, 311–325. [Google Scholar] [CrossRef]
  42. Cai, J.; Li, Q.; Li, S.; Chengyue, Y.; Liu, Z.; Zhang, Z.; Cheng, B. Developing 400 MPa grade biodegradable Zn alloys with superior osteogenic and antibacterial performance. Sci. Rep. 2026, 16, 2537. [Google Scholar] [CrossRef] [PubMed]
  43. Liu, S.; Kent, D.; Doan, N.; Dargusch, M.; Wang, G. Effects of deformation twinning on the mechanical properties of bi-ode-gradable Zn-Mg alloys. Bioact. Mater. 2019, 4, 8–16. [Google Scholar] [CrossRef] [PubMed]
  44. Khafizova, E.; Fakhretdinova, E.; Islamgaliev, R.; Polenok, M.; Sitdikov, V.; Yilmazer, H. Effect of Plastic Deformation on the Structure and Mechanical Properties of the Zn-4Ag-1Cu Zinc Alloy. Materials 2023, 16, 4646. [Google Scholar] [CrossRef] [PubMed]
  45. Liang, H.; Wu, H.; Yin, D.; Yu, H.; He, Z.; Zhang, W.; Wang, Z.; Zheng, T.; Li, X.; Cai, Y.; et al. Potential of biodegradable Zn alloys with fine grains for orthopedic and antibacterial applications. Mater. Adv. 2025, 6, 3495–3511. [Google Scholar] [CrossRef]
  46. Mostaed, E.; Sikora-Jasinska, M.; Ardakani, M.S.; Mostaed, A.; Reaney, I.M.; Goldman, J.; Drelich, J.W. Towards revealing key factors in mechanical instability of bioabsorbable Zn-based alloys for intended vascular stenting. Acta Biomater. 2020, 105, 319–335. [Google Scholar] [CrossRef] [PubMed]
  47. Tanji, A.; Hermawan, H.; Boehlert, C.J. The microstructural evolution and corrosion behavior of Zn-Mg alloys and hybrids processed using high-pressure torsion. Materials 2024, 17, 270. [Google Scholar] [CrossRef] [PubMed]
  48. Pinc, J.; Školáková, A.; Hybášek, V.; Msallamová, Š.; Veřtát, P.; Ashcheulov, P.; Vondráček, M.; Duchoň, J.; McCarroll, I.; Hývl, M.; et al. A detailed mechanism of degradation behaviour of biodegradable as-ECAPed Zn-0.8Mg-0.2Sr with emphasis on localized corrosion attack. Bioact. Mater. 2023, 27, 447–460. [Google Scholar] [CrossRef] [PubMed]
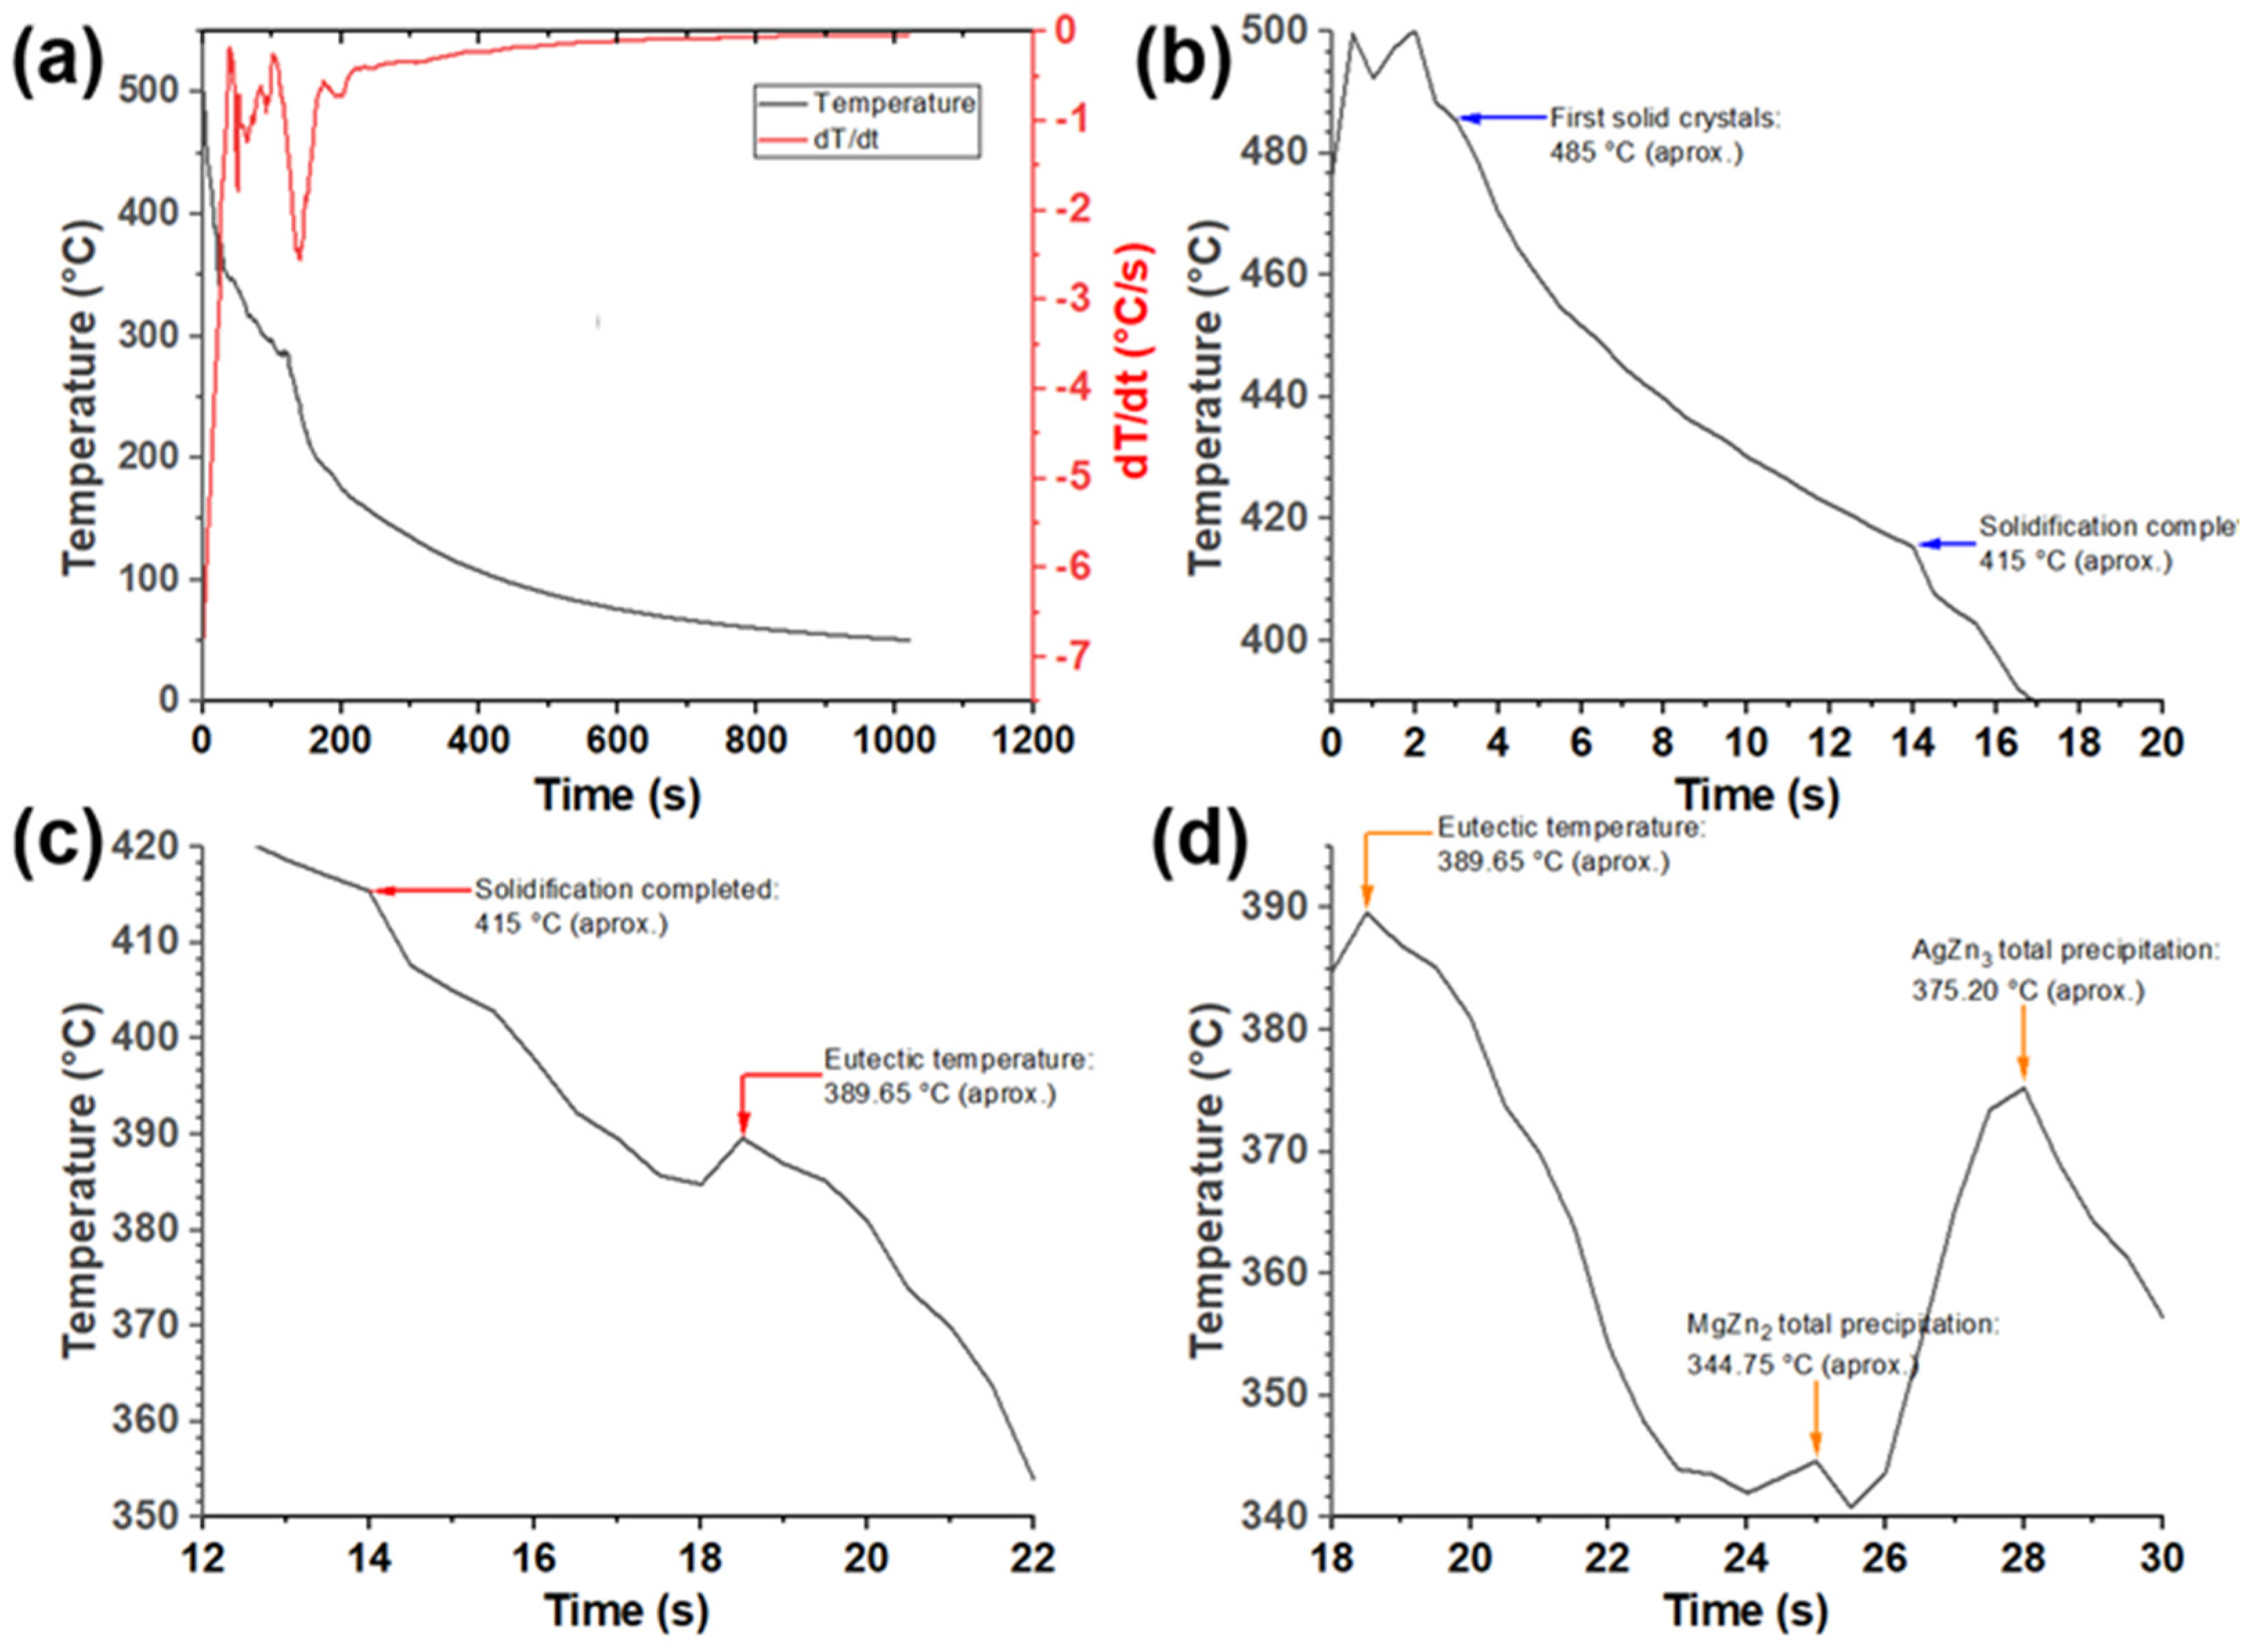
Figure 1. (a) Sand mold cooling curve with a calculated cooling rate of ~1.875 °C/s, and first derivative curve for the Zn-Ag-Mg hypoperitectic alloy. (bd) Fragmented cooling curve showing eutectic and secondary precipitation.
Metals 16 00706 g001
Figure 2. (a) Sand mold cooling curve with a calculated cooling rate of ~1.875 °C/s, and first derivative curve for the Zn-Ag-Cu hypoperitectic alloy. (bd) Fragmented cooling curve showing eutectic and secondary precipitation.
Metals 16 00706 g002
Figure 3. (ac) XRD patterns and their corresponding (df) SEM micrographs showing the microstructure of pure Zinc, Zn-Ag-Mg, and Zn-Ag-Cu alloys, respectively.
Metals 16 00706 g003
Figure 4. (a,b) SEM micrograph of Zn-Ag-Mg; (be) EDS mapping, and the corresponding elemental distribution maps (Zn, Ag, and Mg, respectively); (eg) SEM micrograph of Zn-Ag-Cu; and (gj) EDS mapping, and the corresponding elemental distribution maps (Zn, Ag, and Cu, respectively).
Metals 16 00706 g004
Figure 5. (a) Stress vs. strain engineering; (b) true stress vs. true strain curves from pure Zn (black color), Zn-Ag-Mg (red color), and Zn-Ag-Cu (blue color), respectively; (ce) SEM micrographs showing the fractography of pure Zn, Zn-Ag-Mg, and Zn-Ag-Cu, respectively.
Metals 16 00706 g005
Figure 6. (a) Tafel curves of pure Zinc and hypoperitectic alloys, and (bd) corrosion products of SEM micrographs of pure Zinc, Zn-Ag-Mg, and Zn-Ag-Cu, respectively.
Metals 16 00706 g006
Table 1. Hypoperitectic alloy systems’ short identification and their corresponding chemical compositions (weight %) by ICP—OES.
MaterialComposition (wt. %)
ZnAgMg
Pure Zn100.00------
Zn–2.90Ag–0.31Mg
short name: (Zn-Ag-Mg)
96.792.900.31
Zn–2.56Ag–0.33Cu
short name (Zn-Ag-Cu)
97.112.560.33
ICPOES operating conditions
RF power (W)1300
Sample uptake Flow rate (mL/min)1.5
Gas flow rates (L/min)Auxiliary: 0.2Nebulizer: 0.8Argon: 12
Viewing modeAxial
Table 2. EDS related to the red points marked inside Figure 4c,d corresponding to Zn-Ag-Mg.
Zn-Ag-Mg(Point 1, Matrix, η-Zn) (Point 2, Dark Lamellae, Modified Eutectic, η-Zn) (Point 3, Light Lamellae, Modified Eutectic, ε-AgZn3)
ElementMass (%)Atomic (%)ElementMass (%)Atomic (%)ElementMass (%)Atomic (%)
Zn (K)80.01 ± 2.0286.48 ± 2.22Zn (K)95.03 ± 1.2696.37 ± 1.31Zn (K)72.60 ± 7.5580.76 ± 5.70
Ag (L)19.78 ± 2.0212.89 ± 1.30Ag (L)4.80 ± 1.173.12 ± 0.72Ag (L)27.06 ± 7.5418.22 ± 5.85
Mg (K)0.21 ± 0.060.63 ± 0.18Mg (K)0.17 ± 0.090.51 ± 0.29Mg (K)0.34 ± 0.081.02 ± 0.20
Table 3. EDS related to the red points marked inside Figure 4h–j corresponding to Zn-Ag-Cu.
Zn-Ag-Cu(Point 1, Matrix, η-Zn) (Point 2, Dendrites, (Ag, Cu)Zn)
ElementMass (%)Atomic (%)ElementMass (%)Atomic (%)
Zn (K)90.61 ± 2.8393.06 ± 2.23Zn (K)56.52 ± 3.4463.40 ± 3.22
Ag (L)6.90 ± 1.924.31 ± 1.23Ag (L)28.73 ± 2.4419.56 ± 1.88
Cu (K)2.49 ± 1.022.63 ± 1.10Cu (K)14.75 ± 1.0917.04 ± 1.42
Zn-Ag-Cu(Point 3, Dark Lamellae, Modified Eutectic, η-Zn) (Point 4, Light Lamellae, Modified Eutectic,
(Ag, Cu)Zn4
ElementMass (%)Atomic (%)ElementMass (%)Atomic (%)
Zn (K)90.92 ± 5.0893.36 ± 3.81Zn (K)71.58 ± 4.8577.93 ± 4.44
Ag (L)6.95 ± 3.894.37 ± 2.5Ag (L)21.33 ± 2.8614.11 ± 2.07
Cu (K)2.13 ± 1.192.27 ± 1.31Cu (K)7.08 ± 2.267.96 ± 2.61
Table 4. Resume of the hypoperitectic alloy’s mechanical properties: pure Zinc, Zn-Ag-Mg, and Zn-Ag-Cu, respectively, with no statistically significant differences *.
MaterialYS
(MPa)
UTS
(MPa)
Elongation
to Failure
(%)
Vickers
Hardness
(HV)
Strengthening
Coefficient
n
Pure Zinc21.73 ± 6.83 *36.67 ± 4.84 *14.68 ± 3.08 *64.9 ± 3.80.30
Zn-Ag-Mg15.24 ± 0.33 *30.69 ± 1.78 *2.8 ± 0.24 *73.8 ± 0.50.54
Zn-Ag-Cu28.98 ± 6.83 *46.03 ± 8.16 *8.67 ± 2.75 *102 ± 0.50.34
NOTE: It was considered a significant difference when the comparison between stress and/or strain values of the pure Zn, Zn-Ag-Mg, and Zn-Ag-Cu alloys had p < 0.05.
Table 5. Pure zinc, Zn-Ag-Mg, and Zn-Ag-Cu alloys’ electrochemical parameters obtained by Tafel extrapolation, and the EDS area analysis of pure zinc and hypoperitectic systems.
MaterialOCP/V vs. ESCbcbaIcorrCR
(µA cm2)(mm Year−1)
Pure Zinc−0.756 ± 0.088−0.133 ± 0.0380.195 ± 0.0411.014 ± 0.9560.151 ± 0.045
Zn-Ag-Mg−0.728 ± 0.027−0.130 ± 0.0410.166 ± 0.0271.373 ± 1.0450.199 ± 0.066
Zn-Ag-Cu−1.146 ± 0.082−0.142 ± 0.0250.111 ± 0.0341.718 ± 1.0150.267 ± 0.012
Pure ZincArea analysisZn-Ag-MgArea analysisZn-Ag-CuArea analysis
ElementMass (%)Atomic (%)ElementMass (%)Atomic (%)ElementMass (%)Atomic (%)
O (K)34.0063.87O (K)28.4253.90O (K)32.1656.21
P (K)8.618.35Na (K)13.7218.12Na (K)12.5215.23
Cl (K)1.611.37P (K)0.840.83P (K)6.816.15
Ca (K)2.631.97Cl (K)1.751.50K (K)1.310.94
Zn (K)53.1524.44Zn (K)55.2625.66Ca (K)4.743.31
Zn (K)42.4518.16
Disclaimer/Publisher’s Note: The statements, opinions and data contained in all publications are solely those of the individual author(s) and contributor(s) and not of MDPI and/or the editor(s). MDPI and/or the editor(s) disclaim responsibility for any injury to people or property resulting from any ideas, methods, instructions or products referred to in the content.