Article

Acoustic and Inertial Sensor Techniques for Top Submerged Lance (TSL) Technology: A Practical Framework for Characterizing Bubble Dynamics Under High-Temperature Conditions


by
Avinash Kandalam
1,
Markus Andreas Reuter
1,
Michael Stelter
1,
Andreas Richter
2,
Christian Kupsch
3 and
Alexandros Charitos
1,*
1
Institute of Nonferrous Metallurgy and Purest Materials (INEMET), TU Bergakademie Freiberg, Leipziger Strasse 34, 09599 Freiberg, Germany
2
Institute of Energy Process Engineering and Chemical Engineering (IEC), TU Bergakademie Freiberg, Reiche Zeche, Fuchsmuehlenweg 9 D, 09599 Freiberg, Germany
3
Measurement, Sensor and Embedded Systems Laboratory (MSE Lab), Institute of Mechanical Engineering, TU Bergakademie Freiberg, Winklerstrasse 5, 09599 Freiberg, Germany
*
Author to whom correspondence should be addressed.
Metals 2026, 16(5), 519; https://doi.org/10.3390/met16050519
Submission received: 27 March 2026 / Revised: 4 May 2026 / Accepted: 8 May 2026 / Published: 11 May 2026
(This article belongs to the Section Extractive Metallurgy)

Abstract

Top Submerged Lance (TSL) technology is widely used in non-ferrous smelting, yet in-situ bath dynamics remain challenging to quantify because the process operates in a closed, high-temperature, highly turbulent and optically inaccessible environment. The absence of direct diagnostics limits the ability to relate operating conditions to bubble dynamics, gas penetration and bath agitation and constrains validation of multiphase CFD models under realistic conditions. This study introduces a multimodal sensing framework that combines spectral acoustic analysis with lance-mounted inertial motion sensing to characterize dynamic bath behavior across cold-model, laboratory-scale and pilot-scale systems. Water-glycerin experiments establish repeatable acoustic signatures of individual bubble-collapse events, with dominant emission bands in the 300–900 Hz range and higher-frequency components extending into the kilohertz domain. High-temperature laboratory trials using fayalitic slag reproduce these frequency regions while exhibiting depth-dependent attenuation and clear spectral separation between submerged and non-submerged lance operation. Power Spectral Density (PSD) and cumulative spectral power analyses resolve the influence of gas flow rate and lance submersion depth on acoustic spectral power distribution, while inertial measurements capture corresponding increases in vertical lance acceleration associated with back-pressure fluctuations. Pilot-scale trials at 120 Nm3/h air and 13 L/h diesel confirm that shallow lance submersion substantially increases measured acoustic spectral power below 3 kHz, whereas deeper penetration enhances periodic vertical acceleration response measured by the inertial sensor. The combined acoustic-inertial methodology provides a physically interpretable and cross-scale framework for assessing bubble collapse activity, plume interaction and bath agitation under high-temperature TSL conditions. The approach enables frequency-based diagnostics that can be systematically compared with CFD predictions of plume oscillation and collapse-related dynamics. Once baseline frequency ranges are established for a given slag system, the method can support process monitoring and may provide indirect indicators related to changes in surface agitation or foaming tendency, enabling structured data-driven analysis. The framework thus provides a practical bridge between cold-model experiments, high-temperature measurements, multiphase modeling and industrial TSL operation.

1. Introduction

TSL smelting technology was developed in the 1970s by J.M. Floyd et al. at CSIRO, Australia [1,2]. Originally designed for the extraction of tin from low-grade tin concentrates [3], the process was later adapted for other non-ferrous feedstocks, including lead, copper and complex secondary materials [4,5,6,7]. In a 2005 article, Floyd [8] provided a detailed account of the historical evolution of TSL, from its early laboratory trials to its successful commercialization across multiple smelting operations worldwide. In 2023, the present authors published two comprehensive state-of-the-art open-access review papers [9,10] summarizing the technological evolution of TSL, including its patented developments, thermodynamics, slag chemistry, plant flowsheets and global installations.
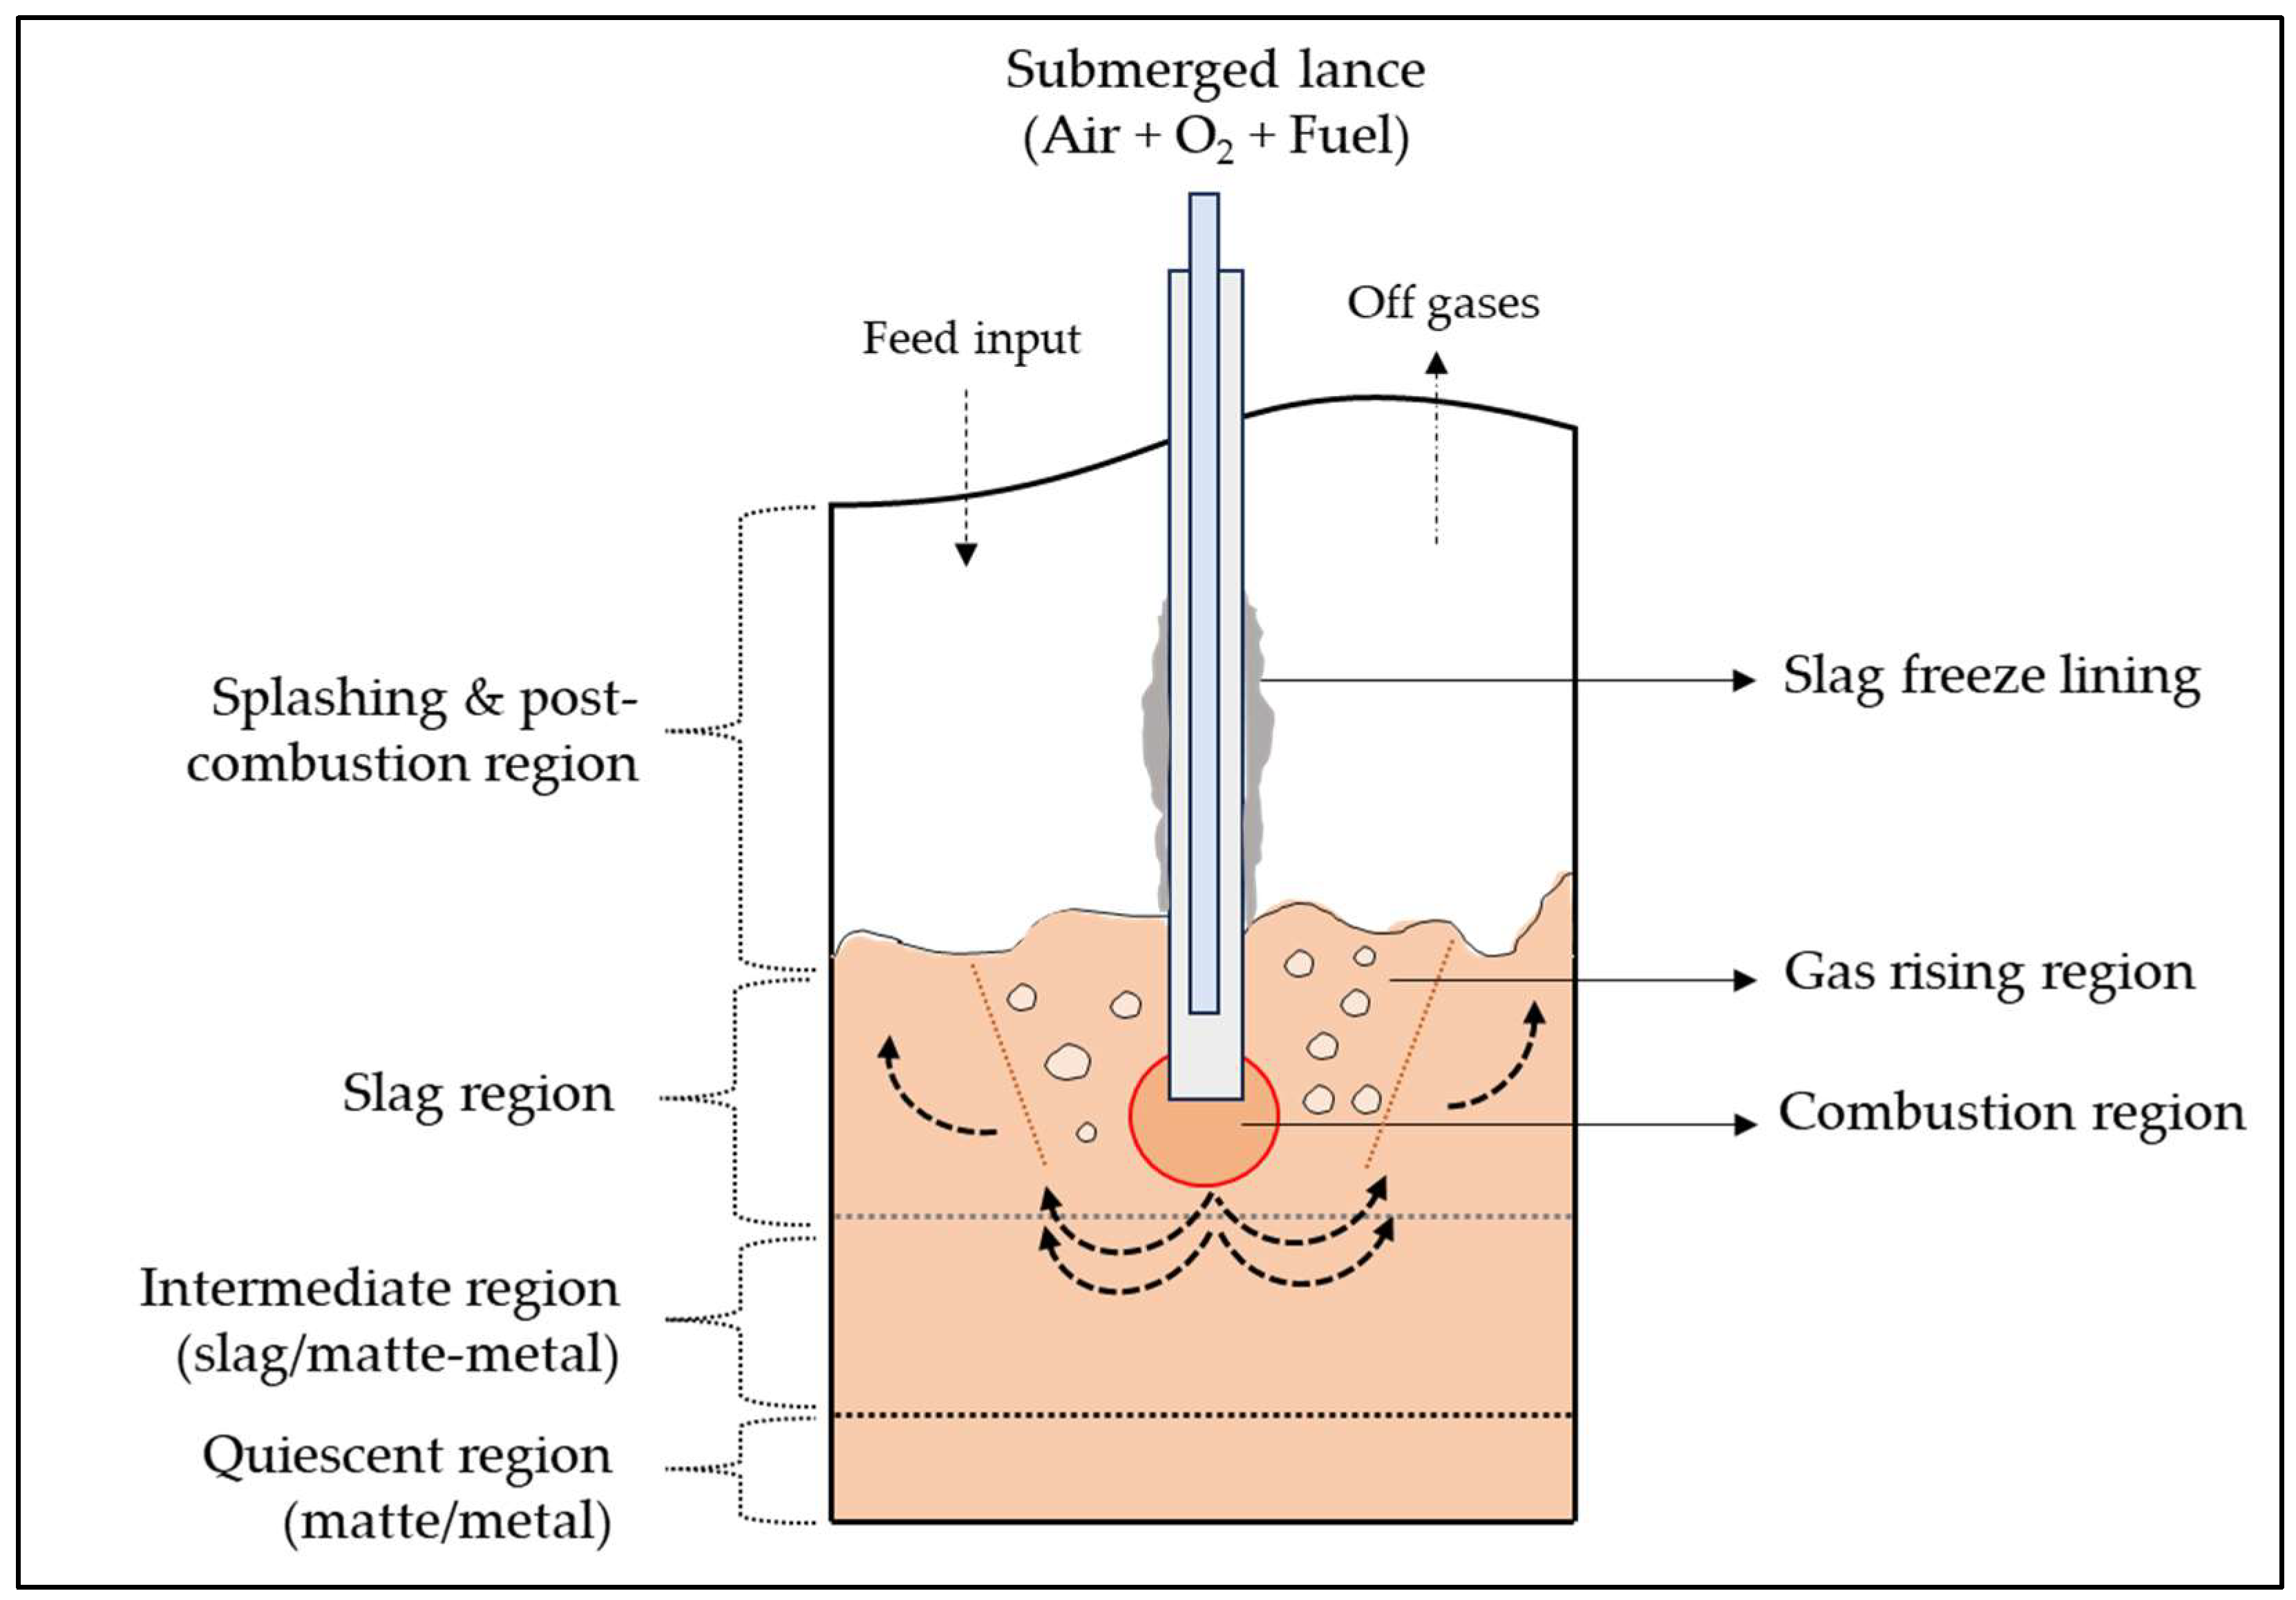
The TSL furnace is a vertical cylindrical vessel equipped with a centrally positioned lance (Figure 1). Feed materials are introduced through the top section of the furnace, while the lance is submerged into the molten slag bath. The lance typically consists of multiple concentric pipes that deliver fuel and oxygen-enriched air to sustain combustion and regulate the oxygen partial pressure within the bath. A variety of fuels, such as natural gas, heavy fuel oil, pulverized coal or their combinations, can be utilized, offering significant operational flexibility. Unlike conventional smelting systems, the feed does not need to be completely dry and can accommodate varying moisture levels and particle sizes. Depending on the furnace configuration, molten slag and metal or matte are discharged through tapholes or siphon systems. Due to its vertical design and compact geometry, the TSL furnace requires less installation space and minimizes fugitive emissions within the smelter environment. These advantages have enabled the successful global adoption of TSL technology across non-ferrous industries, mainly licensed by ISASMELTTM, Glencore Technology and AUSMELT®, Metso (see Figure 1) [11,12,13,14].
Despite these advantages, the closed geometry of the furnace, the high operating temperatures and the highly turbulent and splashing slag bath make direct measurement of internal bath dynamics extremely challenging. Key phenomena that govern heat and mass transfer such as gas penetration depth, bubble formation and collapse, bubble oscillations, bath agitation and transient back-pressure events at the lance cannot be observed visually and are difficult to quantify using conventional sensors. As a result, the dynamic response of the bath to changes in flow rate, lance submersion and operating conditions remains poorly resolved under industrial conditions.

1.1. Mechanism

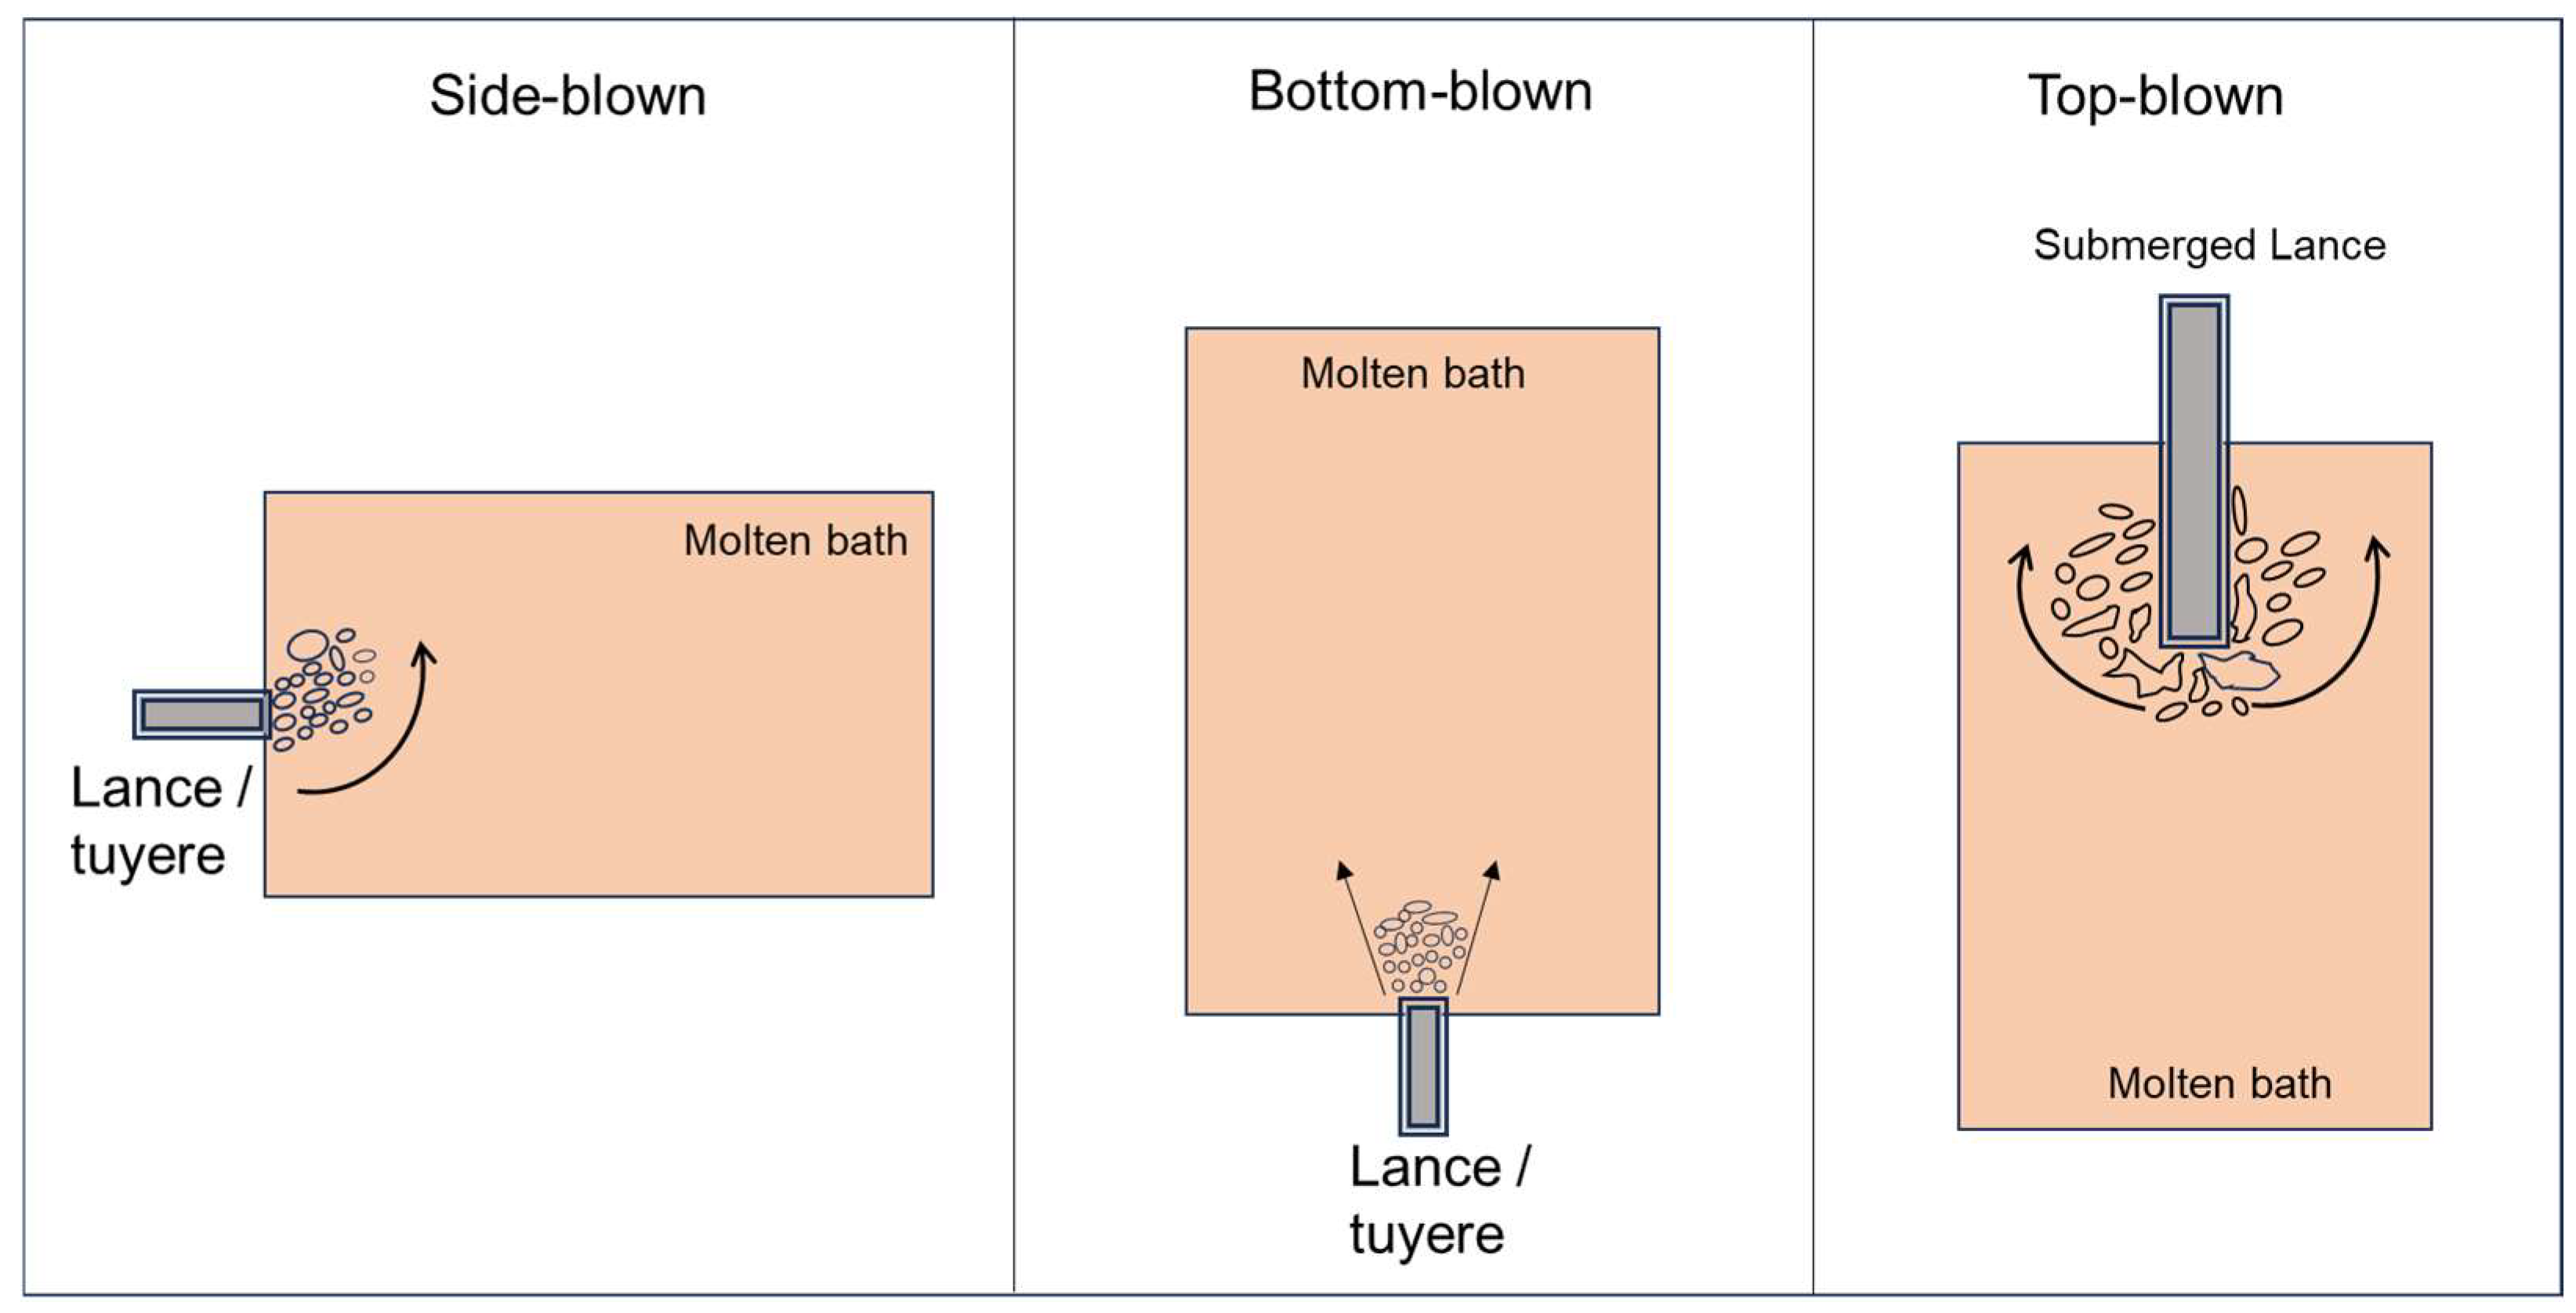
In TSL technology, the lance governs the fundamental heat and mass transfer mechanisms and is, therefore, often regarded as the “heart” of the process. Depending on the position and orientation of the gas injection system, lances, nozzles and tuyeres used in metallurgical furnaces can be broadly categorized as follows:
  • Bottom-blown (hearth or lower wall): QSL, SKS, BBOC.
  • Side-blown (sidewalls, above or near the bath): P-S Converter, El-Teniente Converter, Noranda Reactor, Vanyukov Furnace.
  • Top-blown (vertical, inclined or submerged): BOF, LD Converter, TSL (ISASMELTTM, AUSMELT®), TBRC, Mitsubishi Furnace, Kaldo Converter.
  • Suspension smelting (reaction shaft): Flash Smelting Furnace (Outokumpu, INCO, KIVCET).
Depending on the technology, the dominant heat and mass transfer mechanisms differ significantly (see Figure 2). These variations arise from several factors, including the position and orientation of the lance or tuyere, gas injection velocity, degree of submersion, furnace geometry and the type of fuel employed. Gas injection into the molten bath generates a “plume” (the upward rising gas bubble and liquid flow region created by gas injection), which governs bubble formation, bath circulation and the associated heat and mass transfer processes.
In TSL technology, the lance acts as the primary source of energy carrier to the molten bath, enabling the conversion of solid feed material into molten form. This energy is generated through combustion reactions, where solid fuels (e.g., pulverized coal [17]), liquid fuels (e.g., heavy fuel oil) and/or gaseous fuels (e.g., natural gas) react with oxygen-enriched air to produce exothermic reactions. The resulting combustion of gases transfers thermal energy to the bath, driving the smelting process. In addition, significant thermal energy may originate from exothermic reactions of the feed (e.g., sulfide oxidation and combustion of carbonaceous components).
The distinct reaction zones such as slag, intermediate and matte or metal layers are shown in Figure 3. As the lance is submerged in the molten slag, the combustion species generate gases such as CO, CO2, NOx and other volatile species in the form of bubbles [1]. The formation, growth, coalescence and collapse of these bubbles create strong hydrodynamic forces and a highly turbulent environment within the TSL furnace. While this turbulence governs key process phenomena such as gas penetration depth, bath agitation, mixing intensity and back pressure on the lance, these quantities cannot be directly measured due to the closed geometry and extreme operating conditions. As a result, bubble dynamics and their characteristic frequencies provide an indirect but physically meaningful means to quantify bath behavior under real operating conditions.
By linking acoustic signals and lance motion to bubble collapse and bath dynamics, it becomes possible to distinguish between submerged and non-submerged operation, changes in submersion depth and variations in gas momentum. This measurement approach therefore enables the assessment of process stability and smelting efficiency beyond what can be inferred from temperature or off gas analysis alone.
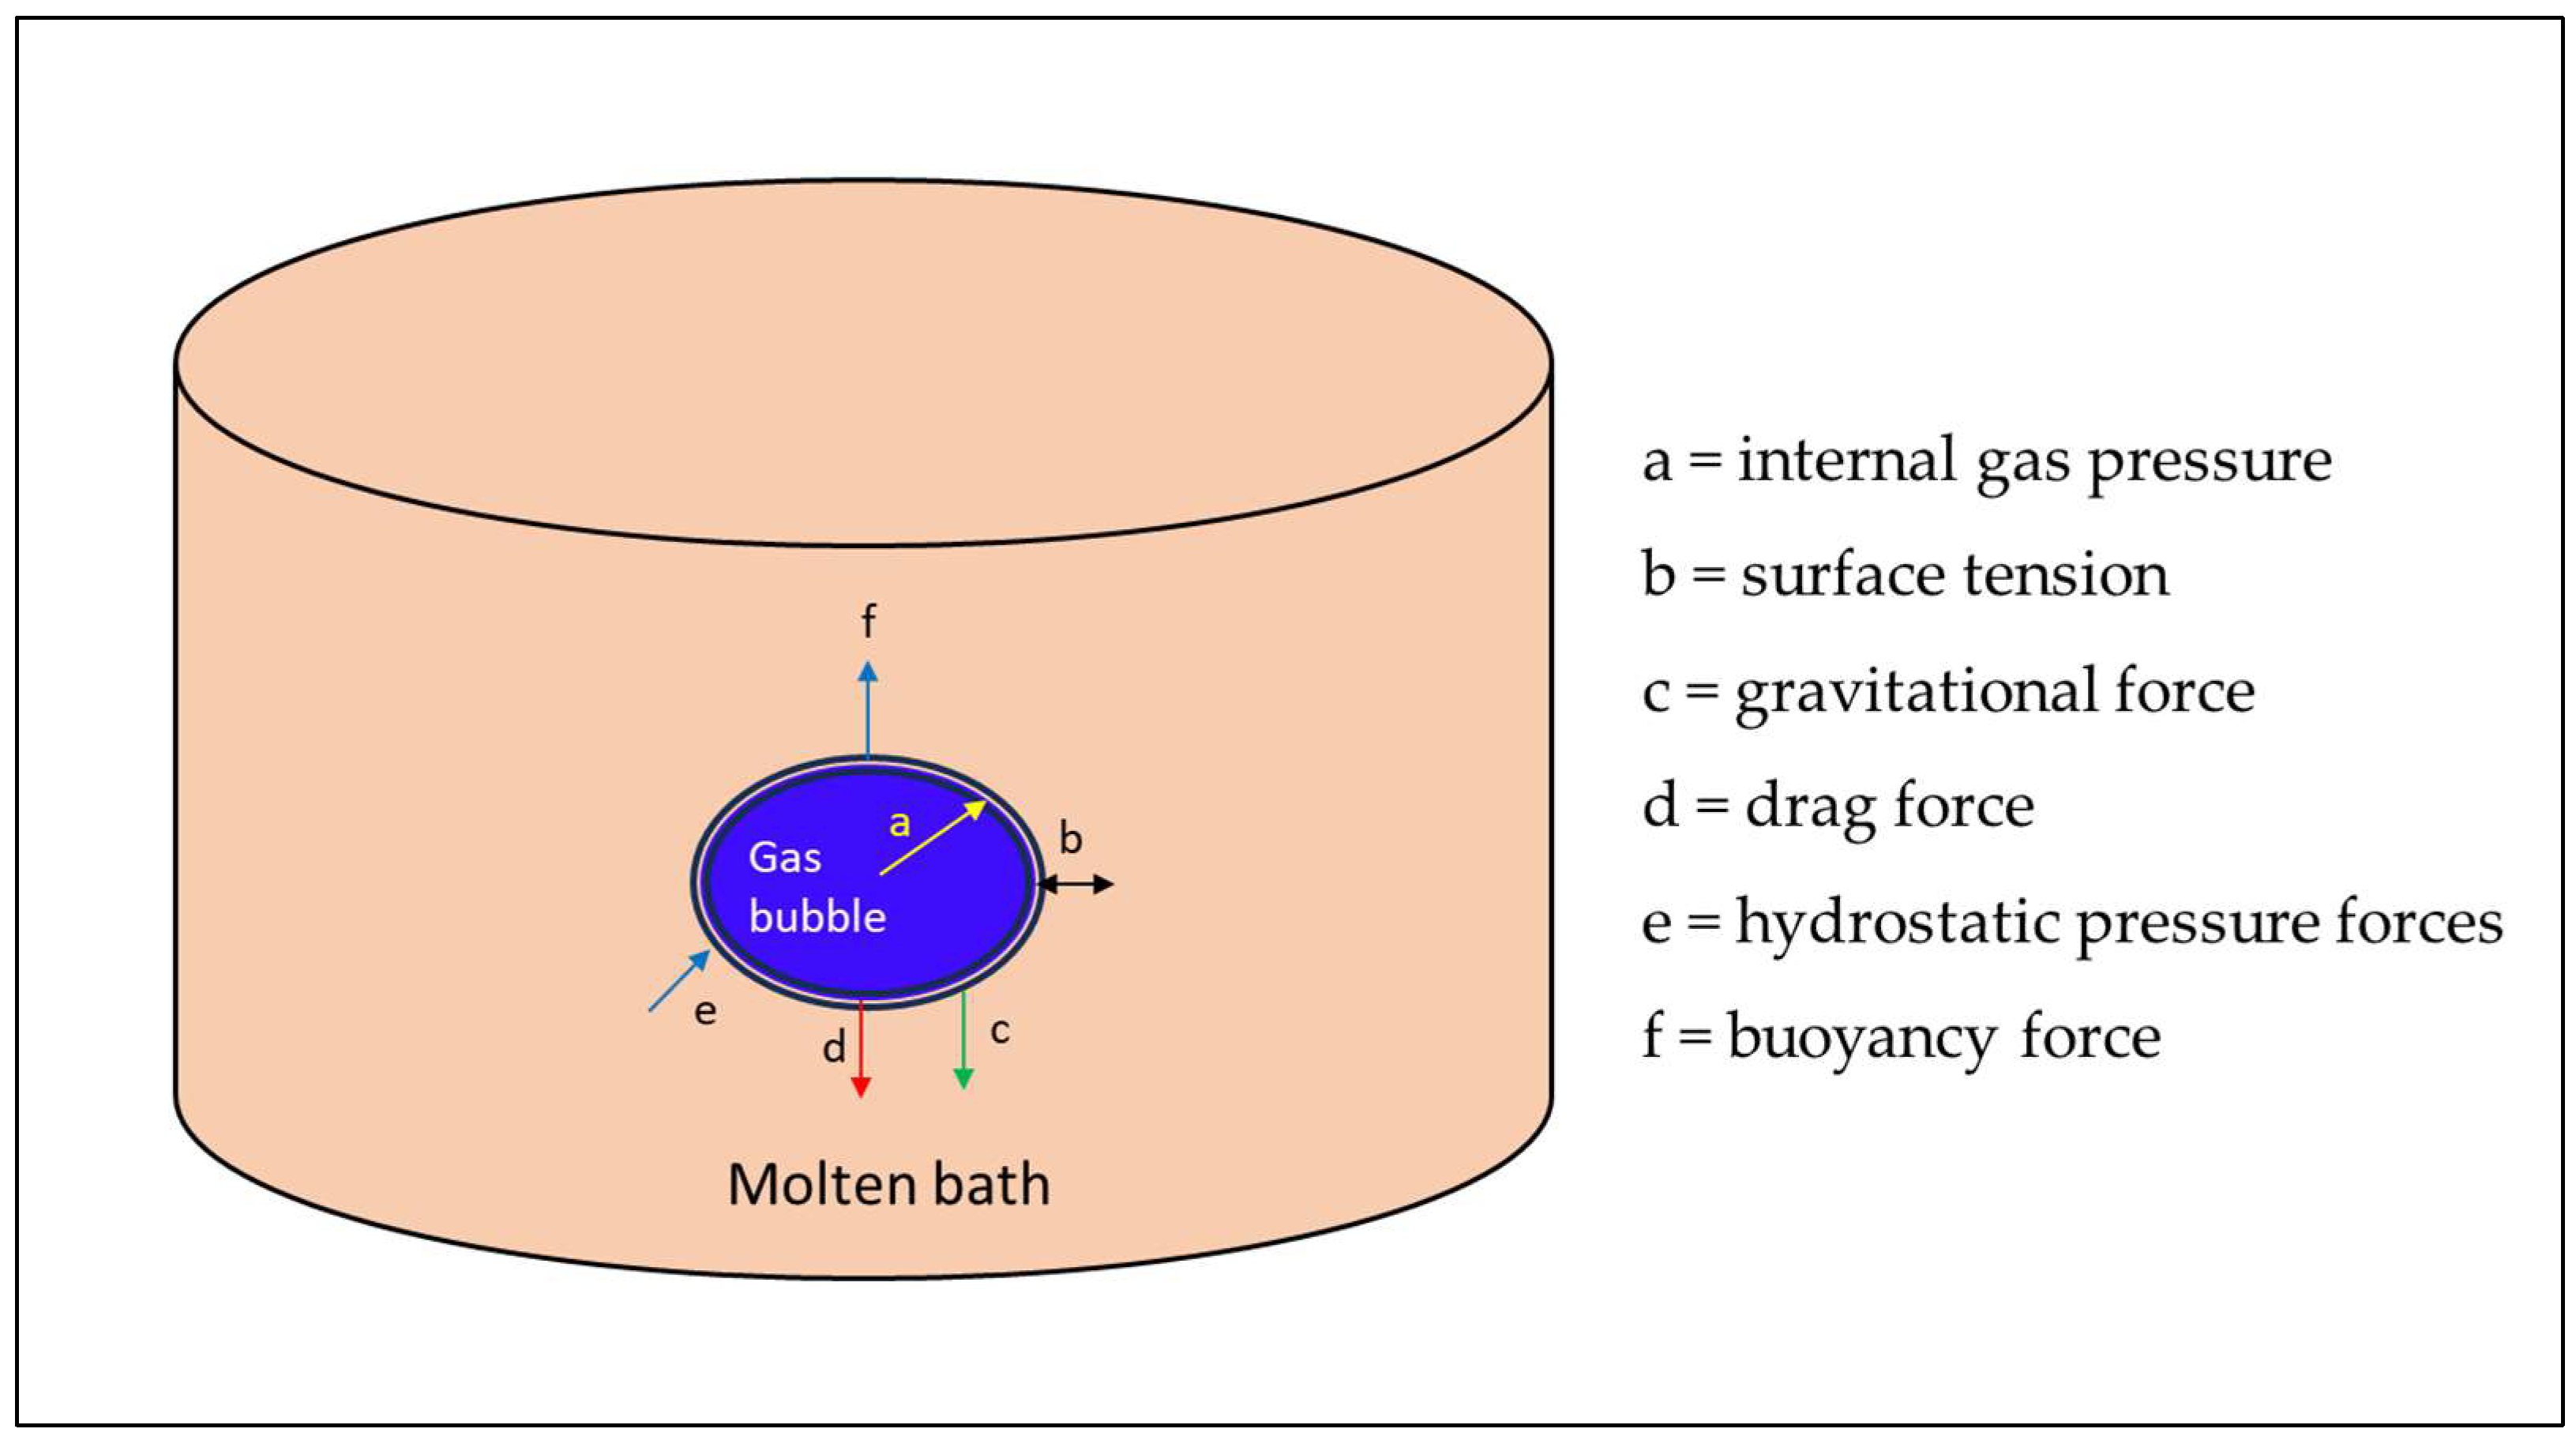
Although the gas velocities in TSL operations are well below supersonic levels [19], the combined effects of combustion, buoyancy and hydrodynamic drag generate a jet-like turbulent plume within the molten slag bath–distinct from supersonic oxygen jets used in BOF converters. In this TSL context, the term “jetting regime” refers to the continuous gas discharge and the formation of a turbulent bubble plume under subsonic injection conditions, rather than the supersonic jets typical of BOF converters [20,21]. When the lance is submerged in the slag, the combusted gases emerging from the lance tip experience strong resistance from the surrounding molten bath, causing the primary bubbles to rapidly fragment into smaller secondary bubbles. The continuous gases produced from the lance combustion react directly with the surrounding slag, which in turn continuously digests the fresh feed material introduced into the furnace [14]. As a result, simultaneous smelting and reduction/oxidation reactions are sustained within the bath. This enables the TSL furnace to operate flexibly under continuous, semi-continuous or intermittent tapping modes. This dynamic interaction between the combustion gases and reactive slag ensures efficient transfer of both thermal and chemical energy to the feed particles, thereby maintaining a highly reactive and well-mixed system. This continuous formation, expansion and collapse of bubbles lead to transient cavity oscillations (i.e., short-lived expansion and contraction of gas cavities generated by gas injection near the lance tip) whose size and frequency depend on the gas composition, local pressure and reaction kinetics. The gases subsequently react, coalesce and escape toward the freeboard region of the TSL. These oscillatory pressure fluctuations are detected typically by the lance backpressure sensors mounted within the fuel or air inlet ducts, which are used to regulate the lance submersion depth and maintain stable lance position. In addition to hydrostatic pressure, the gas bubbles are influenced by buoyancy, drag, surface tension, inertial and interfacial forces (see Figure 4) [22]. Considering these coupled phenomena is essential for understanding the complex bubble dynamics, multiphase flow structure and the overall heat and mass transfer behavior that governs the overall mechanism of TSL furnace.

1.2. Bubble Dynamics in TSL

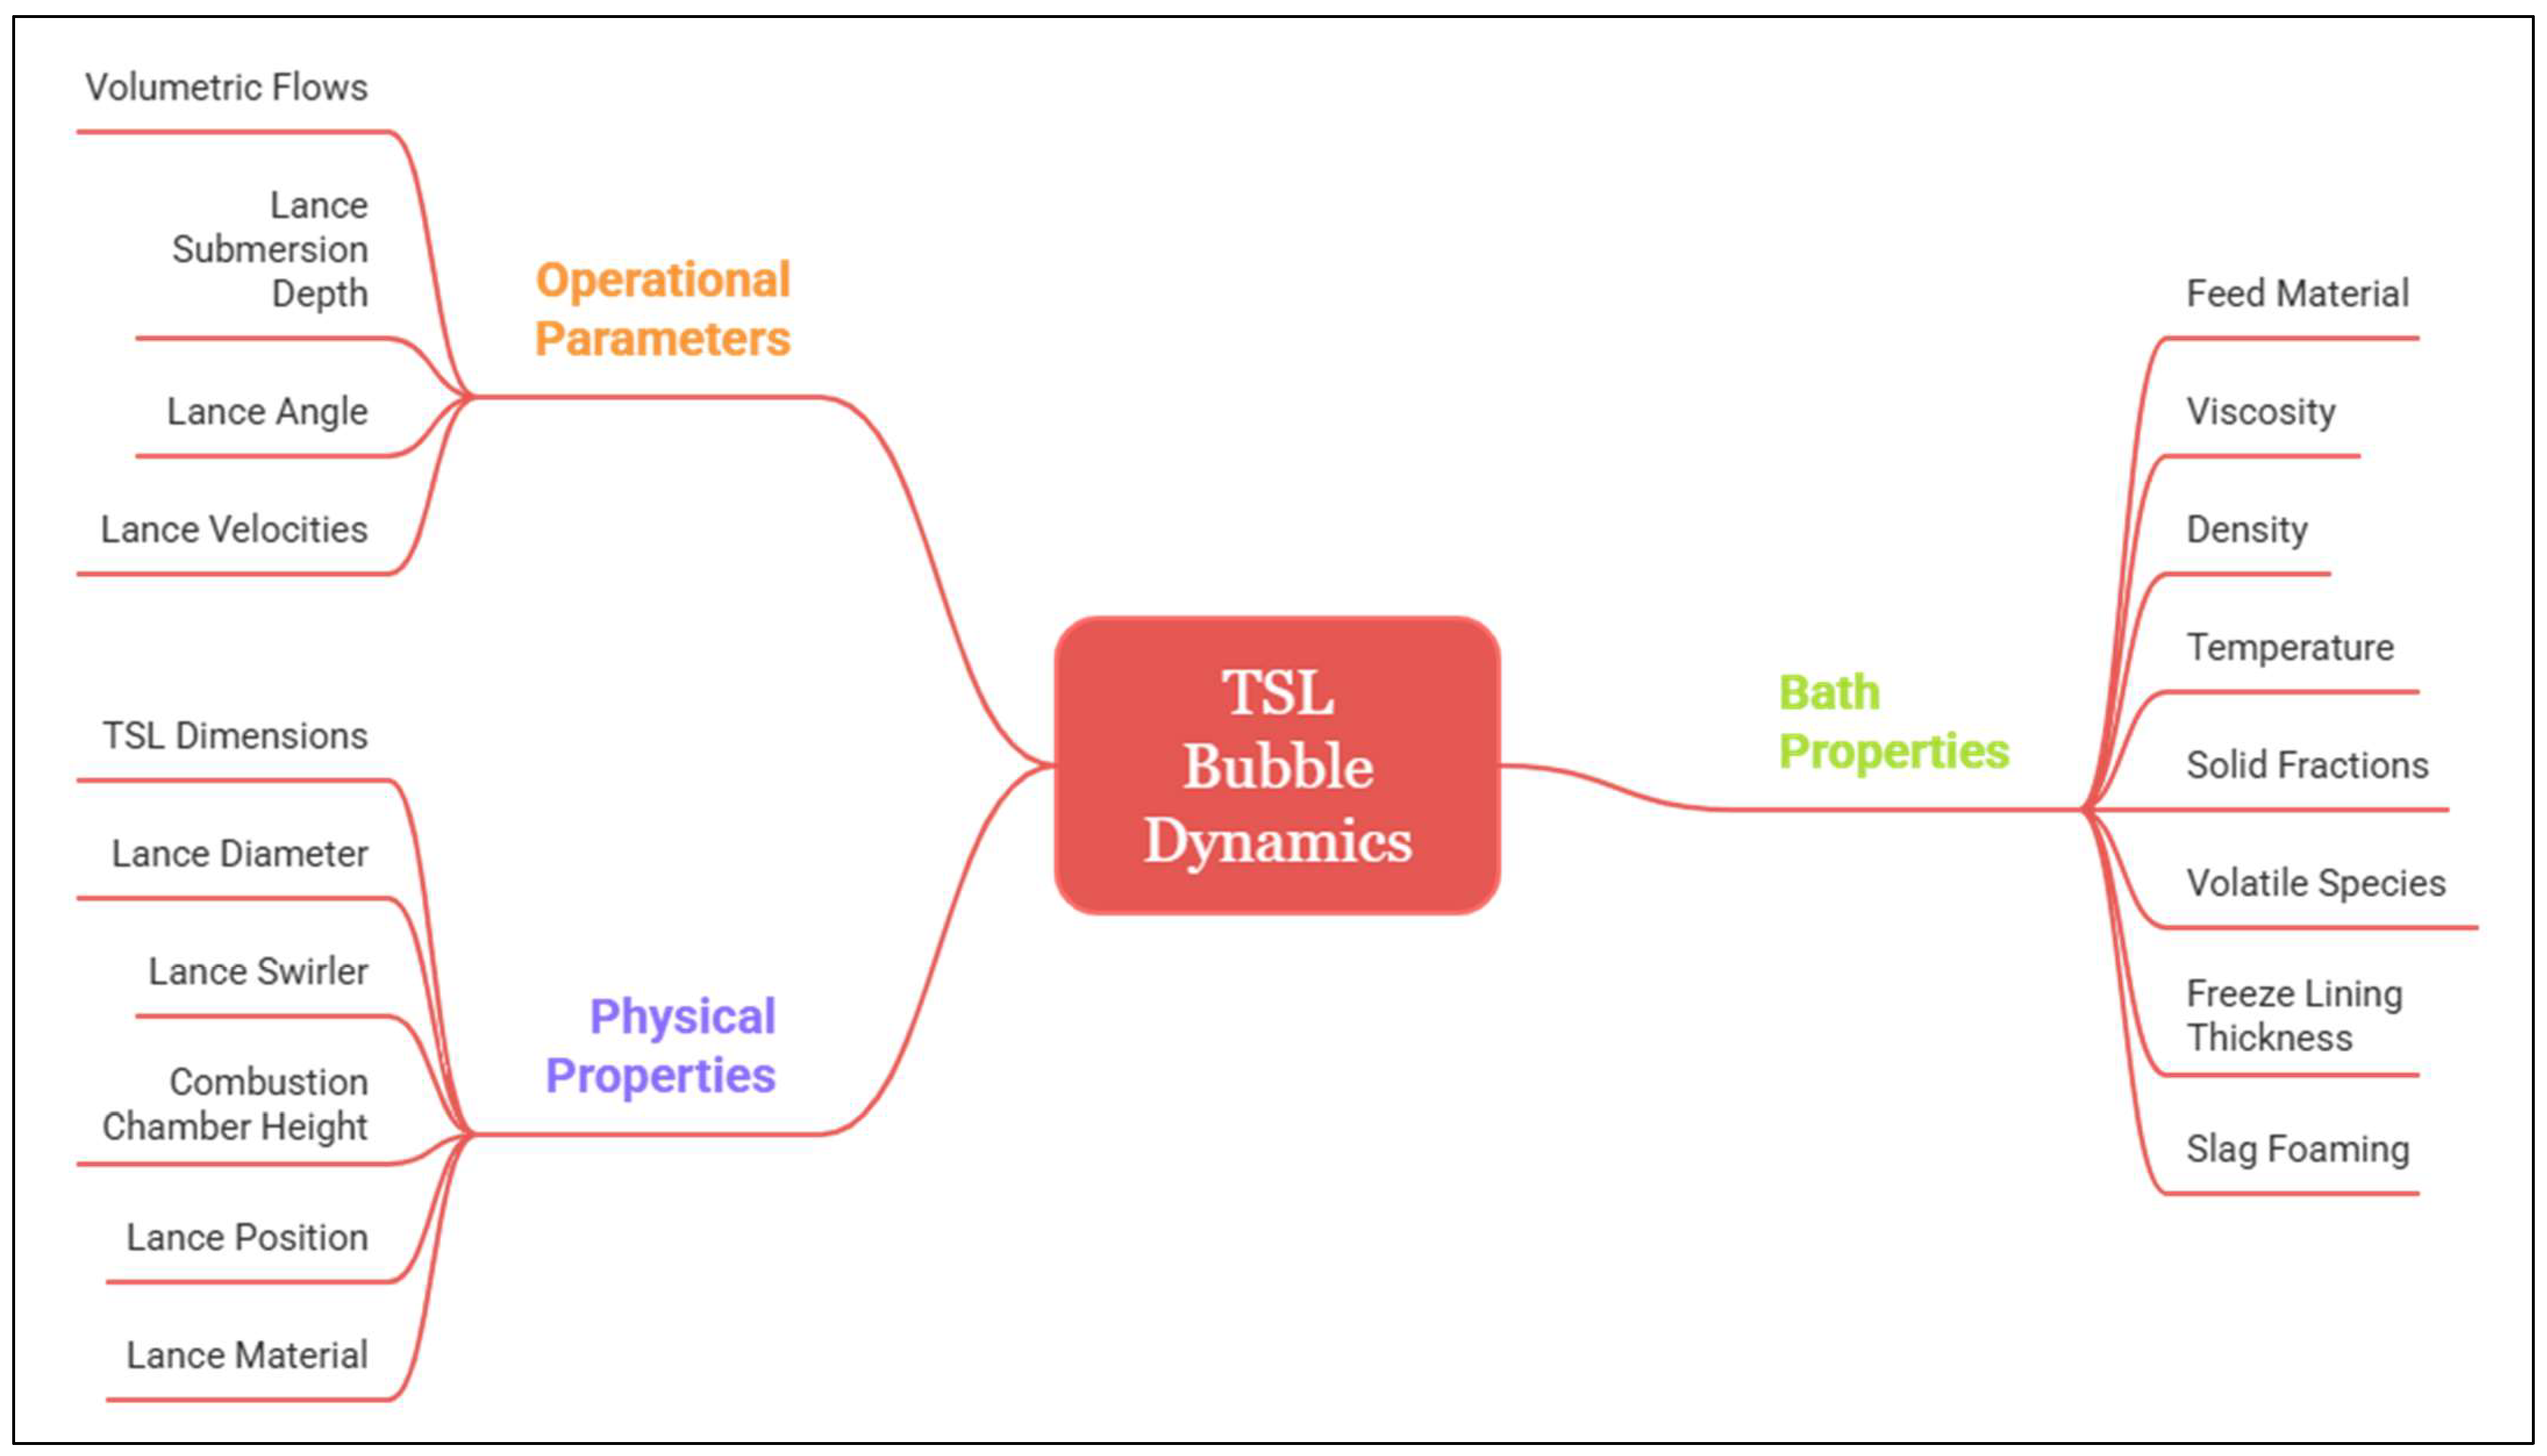
Bubble dynamics in a TSL furnace are governed by multiple interdependent parameters that collectively influence bubble formation (size and shape), bubble motion (trajectory and velocity), bubble kinetics (chemical reactivity and gas-slag interactions) and bubble dissipation (coalescence and collapse). These interactions are associated with critical operational behaviors such as the stability of the lance freeze-layer, turbulence intensity, bath splashing and sloshing, bath foaming and refractory erosion. As illustrated in Figure 5, the factors influencing bubble behavior can be broadly classified into three categories: physical properties (TSL dimensions, lance geometry, lance angle/bending and configuration), operational parameters (gas flow rates, lance submersion depth and velocity) and bath properties (viscosity, density, temperature and feed composition).

2. State of the Art

2.1. Experimental and CFD Research

It is important to review the numerical and experimental advances that underpin current understanding of TSL bubble dynamics as they provide the physical framework for interpreting the results presented herein. Early CSIRO work [23,24] showed that VOF with PLIC can resolve bubble formation, coalescence, cavity collapse and splash in top-submerged injection. Additionally, simulated pressure fluctuations and free-surface profiles were reported to be in reasonable agreement with laboratory data and demonstrated that decreasing liquid viscosity (glycerol → water) drives a transition from quasi-periodic bubbling to more chaotic motion with larger splashes and occasional upward liquid intrusion into the gas core near the lance tip during cavity collapse events. Water-model investigations reported that splash intensity increases nonlinearly with gas flow rate, reflecting enhanced plume momentum and surface interaction. However, splash behavior depends strongly on submersion depth and bath properties, indicating that volumetric flow rate alone is insufficient to characterize regime transitions without accounting for geometry and fluid properties.
High-speed imaging and lance back-pressure analysis [25,26] quantified a bubbling-frequency plateau near 7 Hz for Qg < 1.5 L/s, rising toward ~10 Hz at ~3.5 L/s under the specific geometric and fluid conditions of that study. These authors expressed oscillatory behavior using a Strouhal number formulation (see Equation (4)), demonstrating that bubbling frequency scales with injection velocity and lance diameter rather than absolute volumetric flow rate alone. This non-dimensional representation enables comparison across systems of different geometric scale and operating conditions. The literature on submerged gas injection can be organized according to dominant hydrodynamic regimes rather than individual studies. These regimes include discrete bubbling, coalescent plume formation, momentum-dominated plume or jetting-like behavior and transient cavity formation at the lance tip. Each regime exhibits characteristic dynamic signatures and frequency scales. Although specific frequency values vary between systems, expressing oscillatory behavior in terms of Strouhal number provides a physically consistent basis for comparing bubbling regimes.
A more rigorous interpretation of submerged injection behavior requires non-dimensional analysis. The governing force (see Equations (1)–(3)) balance between inertial, viscous, gravitational and surface tension effects is described by the Reynolds (Re), Weber (We) and Froude (Fr) numbers [27]:
R e = ρ U D μ
W e = ρ U 2 D σ
F r = U 2 g D
Transitions between bubbling, plume-dominated and cavity regimes are governed by the relative magnitude of inertial, gravitational and surface tension forces. At low Weber and Froude numbers, surface tension and gravitational forces dominate over inertial forces, resulting in discrete bubbling behavior with limited penetration. As the Weber number increases, inertial forces increasingly compete with surface tension constraints, promoting bubble coalescence and plume formation. At sufficiently high momentum relative to gravitational confinement and local bath pressure, transient cavity formation may occur at the lance tip. Although exact transition boundaries depend on geometry and fluid properties, this force-balance framework provides a physically consistent basis for regime classification. For oscillatory bubbling or plume behavior, a Strouhal number (see Equation (4)) may be defined as: [27]
S t = f D U
In this framework, an increase in gas momentum tends to shift the system from discrete bubbling toward plume-dominated behavior as inertial forces increasingly compete with surface tension and hydrostatic constraints. Therefore, throughout this study, frequency bands identified in the FFT-derived power spectral density are interpreted within a non-dimensional scaling framework rather than as universal dimensional transition thresholds.
Neven’s experimental and empirical studies [28,29] on ISASMELT reactors provided comprehensive early investigations of lance injection dynamics, gas-slag interaction and bath response using cold-model experiments and pilot-scale observations. His work demonstrated that injection regime, lance submersion depth, gas flow rate and swirl intensity influence cavity formation, plume stability and bath agitation. In this context, the term “cavity” refers to the gas-filled depression or void formed at the lance tip when injected gas displaces the surrounding liquid bath. This cavity may remain quasi-stable under steady injection or periodically expand and contract due to hydrodynamic pressure fluctuations and plume dynamics. These regime transitions can be interpreted using non-dimensional force balances (e.g., Weber and Froude numbers) as outlined in the preceding Section. At low gas momentum and shallow submersion, injection occurs in a bubbling regime characterized by discrete bubble release and limited penetration, whereas increasing flow rate or swirl promotes transition toward coalescent, plume-dominated or cavity regimes with deeper penetration and stronger back-pressure fluctuations. Time-resolved pressure and vibration measurements showed dominant low-frequency oscillations typically below 15 Hz, associated with plume oscillation, cavity breathing (periodic expansion and collapse of the gas cavity at the lance tip) and bath sloshing (large-scale oscillatory (back-and-forth) motion of the free surface and bulk liquid mass within the vessel, distinct from rotational or swirl-driven circulation). Characteristic frequencies were observed to increase with gas flow rate and decrease with higher slag viscosity. Swirlers were found to stabilize the lance-tip gas cavity and reduce asymmetric plume motion; however, at high swirl numbers (SN, defined as the ratio of axial flux of angular momentum to axial flux of axial momentum multiplied by a characteristic radius), they also increased wall impingement and refractory wear due to enhanced lateral momentum. Deeper lance submersion increased average back pressure and reduced surface disturbance but amplified unsteady forces acting on the lance due to intermittent cavity collapse and plume instability. The work further highlighted that these dynamic effects are not adequately captured by time-averaged process indicators alone and emphasized the need for frequency-resolved analysis of injection-induced fluctuations to better understand process stability, refractory wear and operating limits in industrial TSL furnaces.
More recent studies involved the use of X-ray radioscopy techniques utilizing Ga-In-Sn alloy system [30,31]. The results measured bubble diameters of ~15–25 mm (about half the 30–60 mm typical of air-water at comparable conditions), which can be attributed to differences in fluid properties, particularly higher density and surface tension in the Ga–In–Sn system that promote earlier bubble detachment and limit growth. Void-fraction profiles decayed from ~10–15% near the lance to <2% mid-bath. Reported bubble-release frequencies (~6–12 Hz) correspond to periodic gas detachment events at or near the lance tip and initial plume formation region.
The first reactive CFD simulations [32,33,34] captured plume penetration, combustion and mixing in viscous slags and indicated that two-thirds submersion may enhance bath turbulence without excessive splashing. Later work [35] combined Eulerian two-fluid and LES-VOF frameworks to reproduce transient plume oscillations, bubble-rise velocities on the order of 0.25–0.35 m/s at Qg = 3 L/s and dominant sloshing near 1 Hz set mainly by vessel geometry.
In 1:10 ISASMELT water models, mixing time was defined using a 95% conductivity-tracer criterion and was in the order of tens of seconds. The variation between monitoring locations was small (within ~3 s for the swirler case and ~5 s without), indicating good measurement consistency. The presence of a swirler reduced the overall mixing time at lower submersion depths by enhancing plume circulation and turbulent transport, without a measurable increase in splashing under optimized submergence conditions. Methodological refinements, including domain-integrated conductivity evaluation rather than reliance on a fixed single-point ±5% threshold, further improved reproducibility and reduced probe-location bias [36,37].
Building on this foundation, Obiso et al. [38,39,40,41] coupled X-ray radioscopy with validated CFD and pilot-scale modeling. The VOF simulations predicted bubble detachment frequencies of ~2.5–3 Hz, defined as the rate of gas bubble formation and release at or near the lance tip. X-ray and CFD comparisons matched void-fraction fields and trajectories, and under shallow submersion a dominant low-frequency oscillation around ~2 Hz was reported, which is referred as sloshing resonance, i.e., resonant free-surface and bulk-bath oscillation governed primarily by vessel geometry and bath conditions. The rotational sloshing increased with gas rate (swirl velocity increased by ~66% between moderate and high flow) before being disrupted by large-bubble entrainment. The swirl reduced bubbling frequency in pilot-scale modeling (e.g., ~3.05 → 2.46 Hz), consistent with tangential-momentum damping of plume oscillations.
A 2022 review on TSL gas injection [18] presented a comprehensive synthesis of hydrodynamic and combustion mechanisms in lance-based smelting. It established that optimized swirl geometry enhances plume stability and gas-slag mixing, whereas excessive swirl increases pressure losses within the lance and injection system, in some cases up to ninefold. Cold model studies reported bubble sizes of 30–60 mm in water at 0.05–3.5 L/s and significantly smaller bubbles in Ga–In–Sn alloy systems under comparable conditions (Section 2.1), with bubble-release frequencies rising from ~7 to 10 Hz as flow increased. Penetration depth scaled linearly with gas velocity and density, while viscosity effects were negligible below 0.01 Pa.s. Sloshing and splash behavior were governed by resonance between plume oscillation and free-surface motion (~1 Hz). The reported optimal lance submergence represented a compromise between enhanced reaction kinetics and mitigation of refractory wear. Mixing times of 1–10 s was observed. They decreased with increasing swirl and gas rate but increased in more viscous baths due to stabilization of recirculation zones.
A 2024 study [42] analyzed gas-liquid flow in a 170 ton steel ladle through a 1:10 cold-model experiment coupled with LES-VOF simulations. Dynamic similarity between the model and the prototype was ensured through Froude similarity, appropriate for gravity-dominated free-surface flows typical of gas-stirred ladles. Nitrogen flow rates of 317 and 635 NL/min, varying lance depths (0.4–0.7 m), eccentricities (0–0.5 r) and ceramic dam configurations were tested. CFD predictions matched experimental mixing times within ±3–6 s, confirming model fidelity. The configuration combining 0.5 r eccentric lance position, 0.6 m submersion and multi-dam base achieved the shortest total mixing time (~38 s), corresponding to a ~48% reduction compared with the baseline; increasing gas flow alone yielded approximately 40% improvement. Flow-field analysis indicated ~11% higher mean velocity, enhanced vortex coupling and reduced dead zones, contributing to improved gas-utilization efficiency. The study concluded that geometric and hydrodynamic optimization, rather than increased gas rate alone, can substantially improve bath homogenization in top-lance stirred systems.
The 2025 study developed a CFD-machine learning framework to optimize TSL lance geometry for enhanced swirl intensity and flow stability [43]. A database of 1024 CFD simulations was used to train five models, among which the ANN achieved the best accuracy (R2 = 0.997 for training, 0.987 for validation, 0.91 for extrapolation). SHAP analysis identified the vane rotation angle as the dominant factor affecting SN, followed by vane height and CH4 tube diameter. Coupling the ANN with the Crested Porcupine Optimizer produced an optimized SN of 0.9349 with only 2.56% deviation from CFD, verifying high model reliability. Sensitivity testing within ±10% geometric variation showed SN shifts of +4/−6% for vane angle changes, confirming robust, single-variable control over plume intensity. The optimized lance exhibited tighter, more coherent swirl structures, higher tangential velocity near walls and improved mixing uniformity in the annular and mixing zones. Overall, the study demonstrated that AI-assisted optimization can accelerate TSL design, reduce computational cost and achieve precise control of gas–liquid interaction strength in industrial smelting systems.
Taken together, TSL operation under submerged conditions is characterized by a highly turbulent, inertia-dominated bubble-plume regime in which gas injection, plume oscillation and bath motion interact across multiple time and frequency scales. Rather than reiterating absolute bubble sizes or frequencies reported in the literature, the present work focuses on how these regimes manifest in measurable acoustic spectral power distributions and lance-motion responses. The combined results demonstrate that low-frequency components (≈1–10 Hz) are associated with large-scale bath and plume oscillations, while mid- and high-frequency bands (≈200 Hz to kHz range) reflect bubble collapse dynamics. This frequency-resolved perspective provides a consistent basis for interpreting TSL hydrodynamics across different fluids, scales and operating conditions without relying on system-specific dimensional value.
It is important to note that the frequencies reported in CFD, X-ray and vibration/pressure-sensor based studies refer to hydrodynamic event frequencies (e.g., bubble detachment cycles, plume oscillation or surface sloshing), typically measured as events per second within a defined spatial region. These should not be confused with acoustic frequencies analyzed in the present work, which describe the oscillation rate of pressure waves recorded by the microphone. While hydrodynamic event frequencies often lie in the 1–15 Hz range, the resulting acoustic signal may contain substantially higher frequency components arising from rapid bubble deformation, detachment and collapse processes.
Despite this substantial progress, in-situ industrial validation remains limited due to opacity, elevated temperature and the chemically aggressive bath environment. To address these limitations, the present work introduces a non-intrusive diagnostic approach that couples acoustic analysis with a lance-mounted inertial sensor. Rather than directly visualizing bubbles, the method interprets frequency-resolved acoustic pressure and lance motion signatures as indicators of bubble detachment, collapse events and bath dynamics in both cold-model and hot-bath settings. This strategy is intended to complement CFD and laboratory studies by extending frequency-domain observability to operating TSL furnaces under industrial conditions.

2.2. Acoustics and Motion Sensors

Acoustic and motion sensing technologies are increasingly applied to monitoring multiphase flow, mechanical integrity and process stability across mining, mineral processing and metallurgical operations. These techniques are particularly attractive for TSL systems because their non-intrusive nature allows access to dynamic process information in aggressive, high-temperature environments where conventional optical or laser-based diagnostics are not feasible. Microphones, contact piezoelectric sensors, hydrophones, tri-axial accelerometers and fiber-based systems are, therefore, widely used to capture dynamic responses in harsh environments. In mineral processing, acoustic signals are used to assess froth stability and bubble coalescence in flotation cells [44,45], detect charge motion and liner wear in tumbling mills [46] and monitor hydro-cyclone roping through spectral shifts in sound pressure [47]. Vibration and acoustic measurements are applied in crushers and grinding plants to identify impact regimes and wear states [48,49], while cavitation and acoustic power intensity are tracked in leaching autoclaves and wastewater treatment reactors to optimize mixing and gas dispersion [50,51]. In transport systems, acoustic reflectometry and DAS-based methods enable leak and blockage detection in slurry pipelines [52,53].
In the context of pyrometallurgy (ferrous), microphones and accelerometers are used to monitor slag foaming and associated slopping (overflow event of slag foam from the vessel) in BOF [54] and to evaluate gas-stirring intensity and refractory integrity in ladles and converters [55]. Detailed experimental and plant-scale investigations by [56,57,58] provided the most complete quantitative evaluation of acoustic and vibration sensing for slag foaming control in the BOF system. Cold-model experiments showed that acoustic attenuation (defined as the reduction in sound pressure amplitude due to scattering, absorption and dissipation) increases linearly with foam height up to about 0.3 m, after which the response saturates as the foam reaches the vessel cone. Frequencies above 1000 Hz were most sensitive to foam depth, with the 1100–1200 Hz band giving the strongest linear correlation (R2 ≈ 0.94) between amplitude loss and foam thickness, compared with R2 ≈ 0.6 for the conventional 250–550 Hz range. Bubble sizes of 0.4–0.75 mm and thicker liquid films yielded the highest signal-to-noise ratios and the steepest attenuation slopes (up to 25 dB/m). Dual-microphone tests confirmed that using two sensors increased redundancy but did not significantly enhance accuracy relative to a single optimally placed sensor. Resonance analysis showed that microphones mounted at the vessel mouth experienced standing waves between 200 and 700 Hz, which masked true process signals, while a flush-mounted design below the mouth provided cleaner spectra.
In pilot BOF trials at Port Kembla, New South Wales, Australia acoustic signals recorded at 1 kHz and 1.2 kHz dropped by 4–6 dB within 30 s of flux addition, corresponding to the period of maximum foaming growth measured by off-gas CO levels. RMS amplitude in these bands increased sharply during flux charging and dropped prior to slopping, providing a 10–20 s early warning window that is operationally significant, as slopping events can lead to material loss, reduced process efficiency and safety risks. This time window allows corrective actions such as adjusting oxygen flow, lance position or slag chemistry before uncontrolled overflow occurs. STFT analysis revealed pre-slopping peaks in the 1.1–1.3 kHz band were not visible in lower frequencies. In contrast, low-frequency ranges (<600 Hz) remained dominated by lance and combustion noise. Across 35 industrial blows, acoustic-based slopping prediction achieved about 78% accuracy, while combined acoustic-vibration models improved to roughly 85%. The studies also reported that purge-air flow through microphone housing reduced high-frequency sensitivity by up to 50% and introduced broadband noise between 800–2000 Hz, emphasizing the need for redesigned purge systems. The 2024 work further verified that acoustic correlation with foam height decreases sharply once the foam reaches the vessels conical zone, indicating geometric cutoff, while mechanical vibration sensors captured structural modes in the 15–30 Hz range linked to lance dynamics and vessel resonance. These results demonstrate that high-frequency acoustics (>1 kHz) reliably track foam evolution and collapse, while vibration monitoring provides complementary low-frequency information on vessel response [56,57,58].
The 2023 study by Nissilä et al. [59] analyzed nearly 300 oxygen blows at the 125 ton SSAB Raahe, Finland, BOF using triaxial accelerometers on the trunnion and a wide-band microphone above the vessel. Low-frequency (3–20 Hz) vibration and acoustic signals correlated with off-gas temperature (r = 0.6–0.8), reflecting decarburization dynamics, while mid-frequency bands (100–1000 Hz) showed strong correlation with lance height (r ≈ 0.82–0.96), linking them to foam and droplet behavior at the slag-metal interface. Dominant vibration modes occurred at 5–10 Hz, with transient bursts up to 1.2 m/s2 during slopping events. The authors emphasized that trunnion-mounted sensors preserve high coherence by avoiding signal loss through bearings. Operational limitations included battery life and thermal durability of sensors. The findings closely align with Heenatimulla’s BOF studies [56,57,58], where low-frequency signals in the range of ~200–800 Hz were shown to exhibit weaker attenuation and limited sensitivity to slag foam height, while higher-frequency acoustics > ~1000 Hz demonstrated significantly stronger attenuation and greater sensitivity to foam structure, bubble size and slopping-related phenomena.
Another research from 2021 [60,61] focused on the use of vibration and acoustic measurements for process monitoring in BOF steelmaking. The work used field data from an operating industrial converter to evaluate correlations between low-frequency vibration, acoustic spectral power and process parameters such as off-gas temperature and oxygen-blowing stages. Spectral analysis confirmed that low-frequency vibration components in the 5–15 Hz range corresponded to vessel resonance and bath agitation, while higher acoustic bands around 1 kHz were sensitive to slag foaming and slopping onset. Unlike later studies by Heenatimulla [56,57,58], which concentrated on frequency-band selection and attenuation behavior, Kadam’s work emphasized the overall feasibility of sensor-based monitoring under industrial conditions and validated that both acoustic and vibration signals contain measurable indicators of process transitions. Nevertheless, the results aligned with subsequent findings from Port Kembla and Raahe trials, confirming that combined acoustic and vibration sensing provides a viable, non-intrusive means of identifying dynamic process events in BOF operations.
The insights gained from CFD simulations and cold-model investigations of TSL furnaces have clarified the fundamental mechanisms of bubble formation, coalescence, plume behavior, turbulence and sloshing patterns. At the same time, advancements in acoustic and vibration sensing within the steel industry have demonstrated their reliability and sensitivity in capturing real-time process dynamics such as slag foaming, slopping and vessel resonance. Building upon these two knowledge bases, the present work integrates both approaches to develop a new diagnostic methodology for TSL systems, where direct optical access and intrusive measurements are not feasible. Unlike BOF, TSL furnaces operate with a submerged lance in a subsonic, multiphase environment, creating distinct acoustic signatures dominated by bubble collapse, cavity oscillation and turbulence. The motion-sensing aspect is equally novel, as it involves attaching an inertial measurement unit directly to the lance (unlike on BOF shell) to quantify its dynamic response to internal bath forces. The combined multimodal acoustic-inertial sensing approach proposed here enables non-intrusive, continuous quantification of bubble dynamics and lance motion within a high-temperature TSL bath. This integration represents a significant advancement, extending established steelmaking diagnostic principles into a closed, submerged-lance environment and laying the foundation for the experimental design that follows.

3. Design of Experiments

The concept of acoustic-inertial sensing for TSL technology was initially coined by Metso (formerly Outotec) in the late 2000s as part of its vision for future process automation. However, no validated methodology, experimental framework, or data-driven implementation was available in the public domain. Recent fundamental studies [62,63] on bubble morphology and spectral statistics in confined and yield-stress fluids demonstrate that bubble frequency, rise velocity and collapse behavior are highly sensitive to fluid rheology, confinement and injection conditions and that small changes in geometry or forcing can shift dominant frequency bands and spectral power distribution. These works show that frequency is not an arbitrary signal feature but an emergent response of bubble-fluid interaction that requires carefully controlled experiments to be meaningfully interpreted. Motivated by these findings, the present work systematically develops and validates an experimental framework tailored to the extreme conditions of the TSL furnace, where direct observation is not feasible and bath dynamics are strongly coupled to lance operation.
In 2019, this concept was independently adopted and systematically developed within the research programs of INEMET and Virtuhcon at TUBAF, while Metso contributed to the OCT software [64] (formerly ACT) and HSC SIM flowsheet integration for general sensor connectivity in the pilot TSL plant. The experimental configuration, sensor placement, calibration strategy, signal-processing framework and validation procedures described herein were developed and implemented within the Virtuhcon research program (INEMET and IEC, TUBAF). The development included establishing new measurement protocols for cold and hot model systems, validating sensor signals with high-speed cameras, defining frequency-power relationships for bubble collapse events and postmortem analysis. Related TUBAF studies on TSL temperature profiles [65], lance combustion [66] and cold-model trials [67,68,69] contributed to the broader understanding of process behavior but are scientifically distinct from the present work. This study, therefore, represents an original contribution that extends beyond existing industrial frameworks by developing and validating an acoustic-inertial diagnostic methodology specifically tailored for characterizing bubble dynamics and lance motion in TSL furnaces.

3.1. Rationale and Stepwise Scaling of the Experimental Framework

Earlier investigations [67,68,69] using cold-model systems based on water and glycerin demonstrated that acoustic and motion sensing can reliably quantify bubble dynamics under controlled and optically accessible conditions. These studies established relationships between bubble formation, collapse behavior and frequency-domain signal features across a range of flow rates, lance submersion depths and bath properties. However, cold models cannot reproduce the thermal, chemical and mechanical complexity of industrial TSL operation.
The next step was, therefore, to validate these techniques under high-temperature conditions, where bath opacity (i.e., optical non-transparency of the molten slag system due to high temperature, suspended droplets and gas bubbles), turbulence and combustion-driven gas injections fundamentally alter bubble behavior. The laboratory-scale TSL furnace provides a controlled high-temperature environment to bridge cold-model observations with realistic smelting conditions. The pilot-scale furnace further extends this validation by introducing increased bath volume, lance diameter and gas momentum, allowing scale effects to be examined.
This stepwise progression from cold model to laboratory-scale and pilot-scale TSL systems enables systematic comparison across temperature, scale and operating regime. It allows fundamental signal (acoustic and motion sensor) process relationships to be preserved while assessing their robustness under increasingly realistic conditions. This approach establishes a validated pathway toward implementation of acoustic and motion sensing techniques in full-scale industrial TSL furnaces.

3.2. Experimental Setup

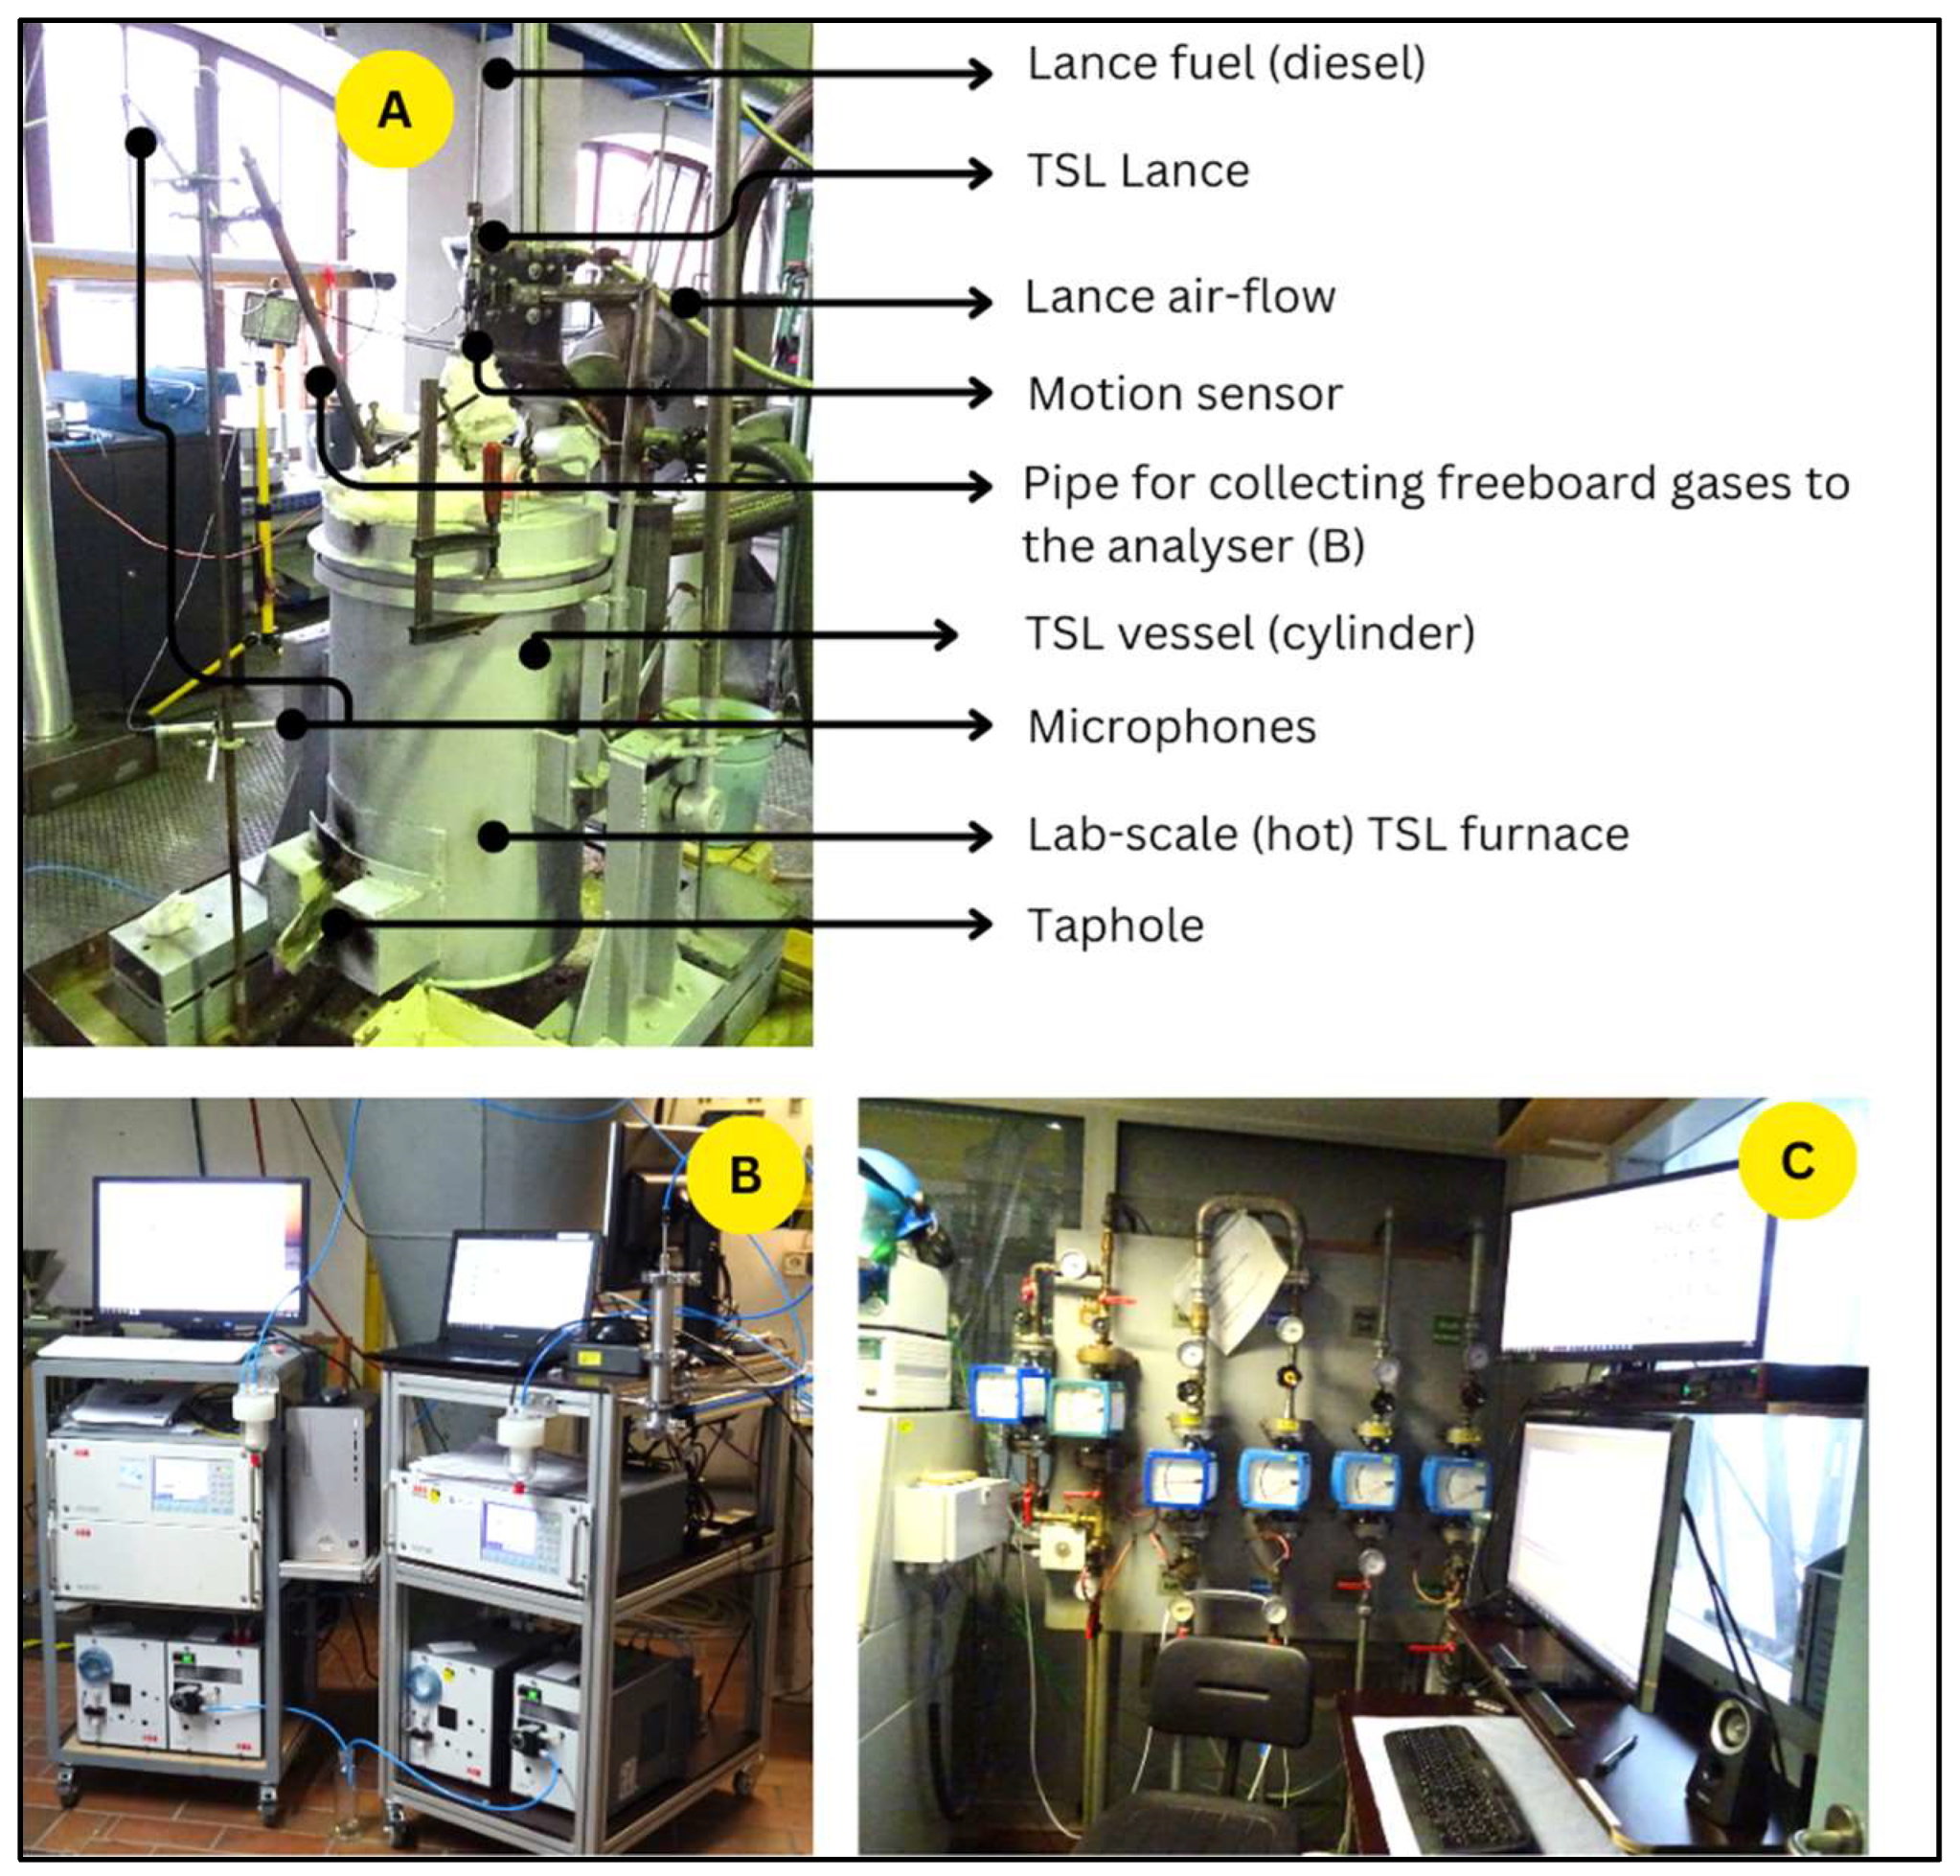
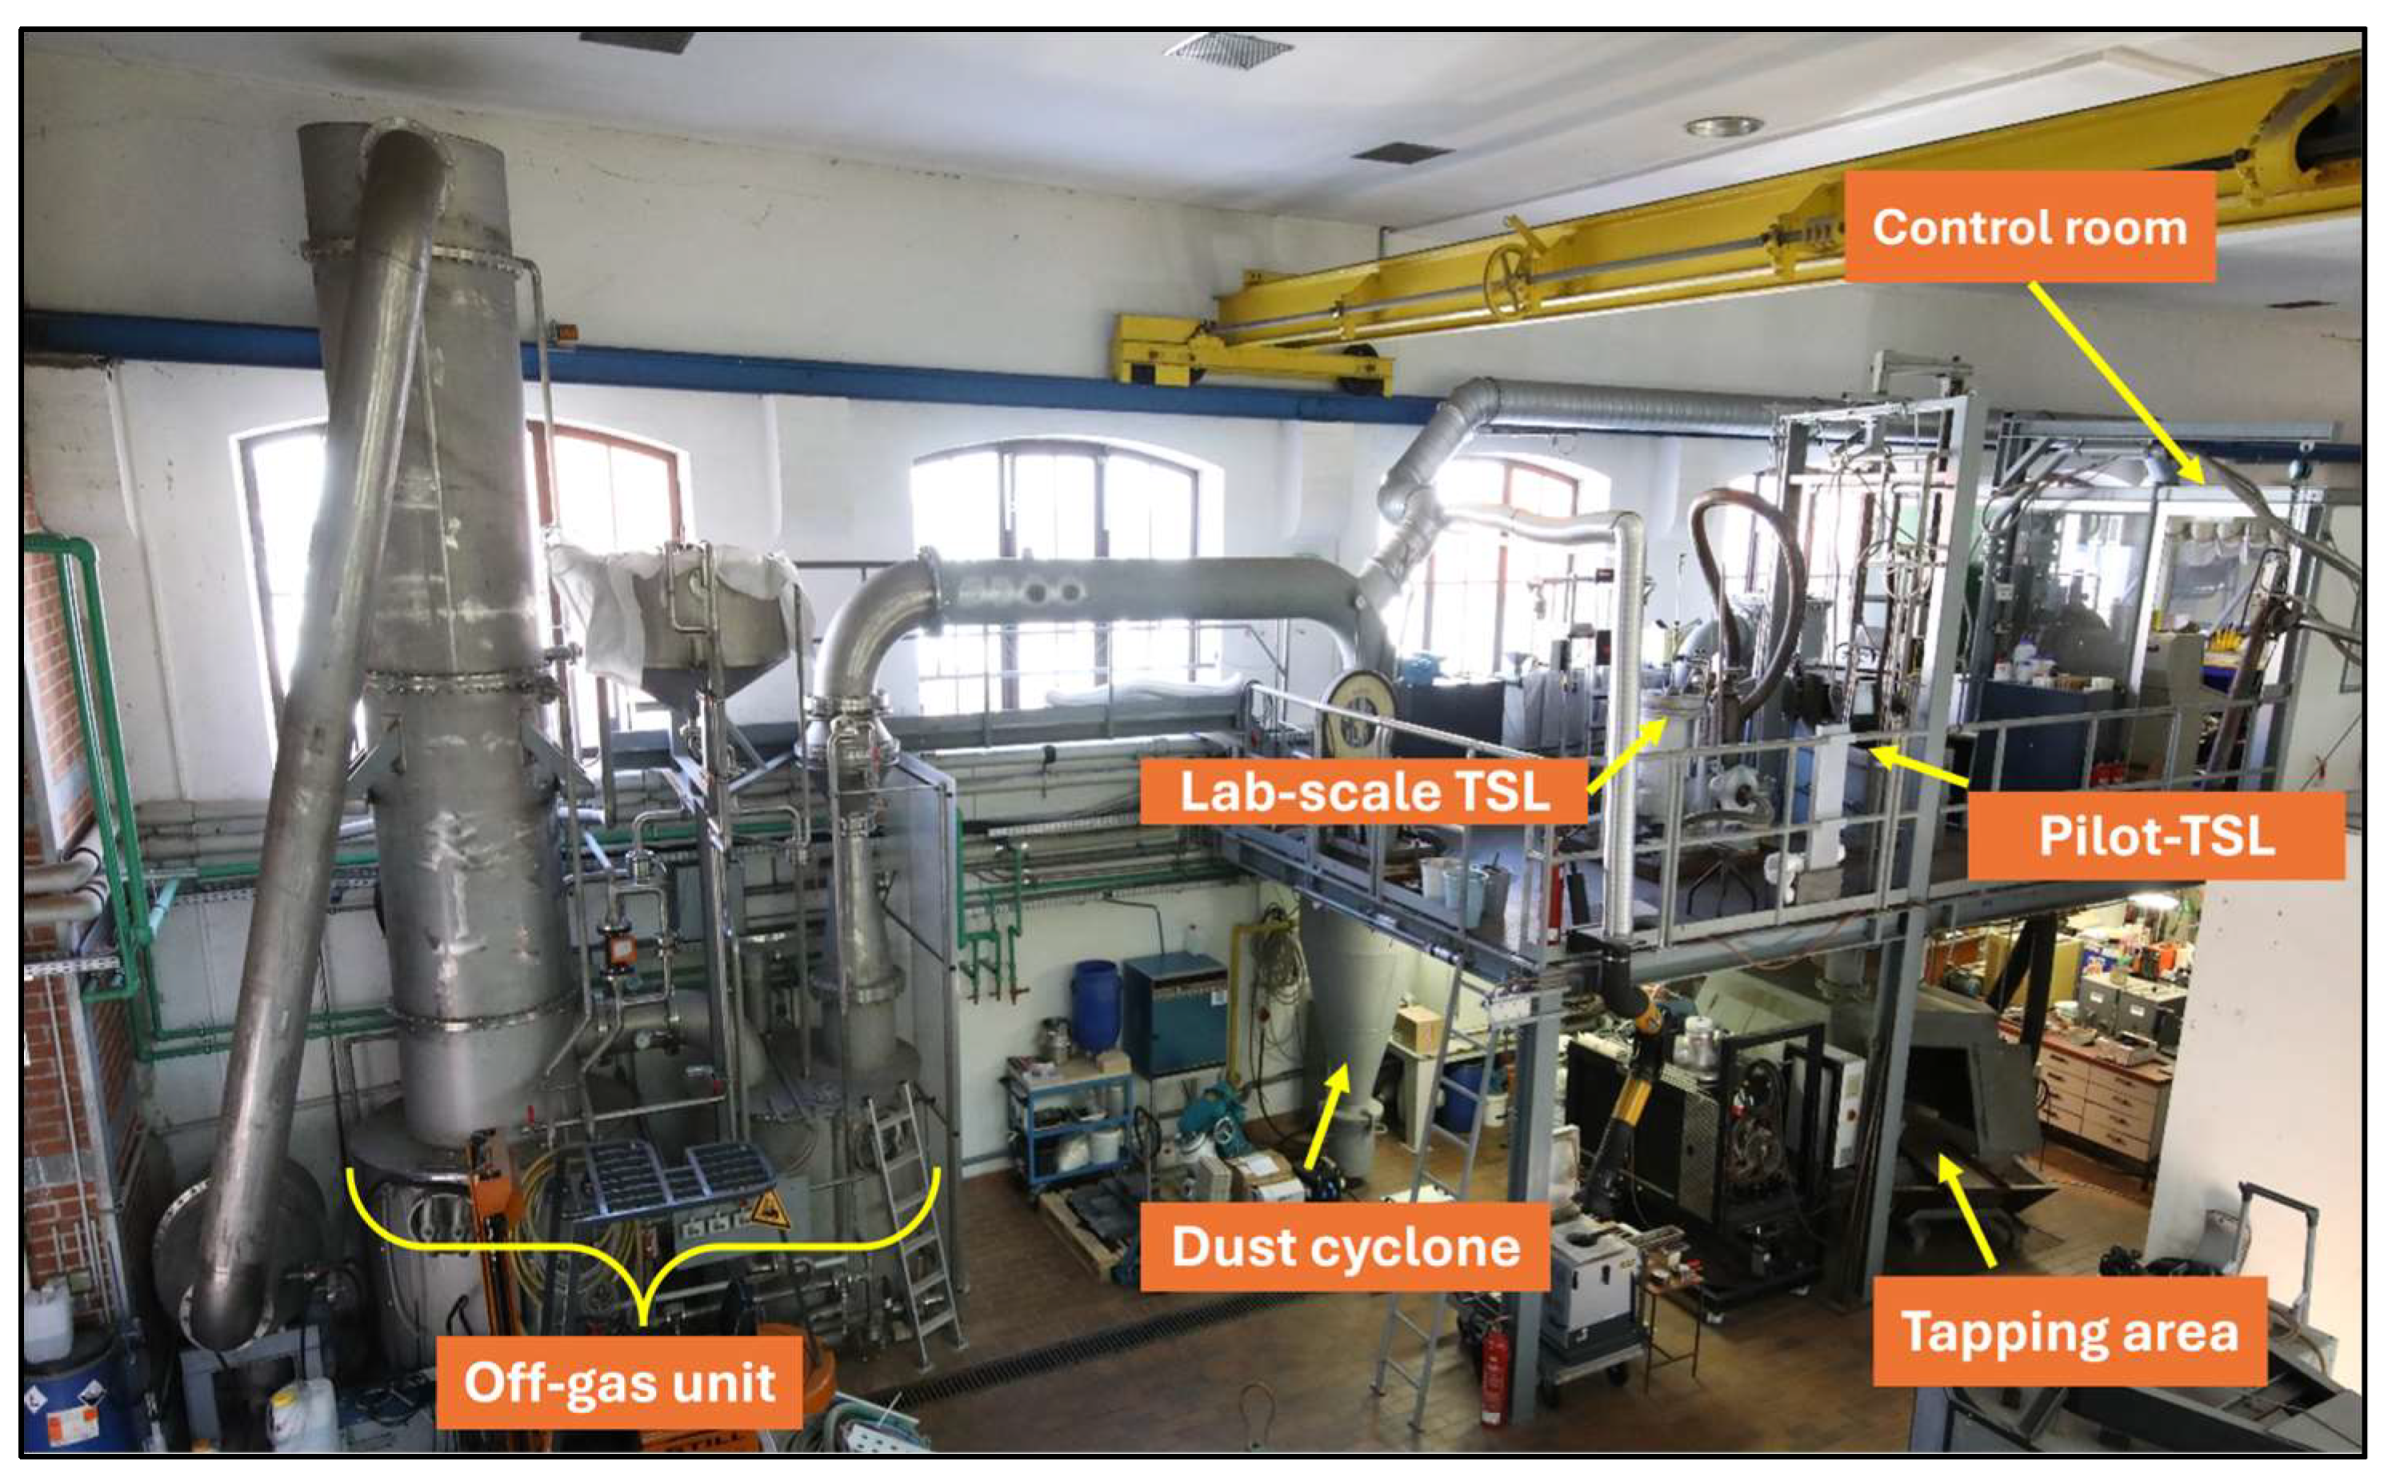
As mentioned earlier, this study applies acoustic and motion sensor techniques to two high-temperature TSL furnace (INEMET, TU Bergakademie Freiberg, Germany) systems: a laboratory-scale furnace (see Figure 6) with 1.2 m height, 0.15 m diameter and 20 kg bath capacity and a pilot-scale furnace with 2.6 m height, 0.4 m diameter and 300 kg bath capacity. The lance outer diameter of laboratory-scale and pilot-scale TSL (see Figure 7) furnaces are 14 mm and 32 mm, respectively. Both lances consist of two concentric pipes: the outer pipe supplies air, while the inner pipe delivers diesel fuel. The inner pipe of each lance is equipped with a helical swirler with a 38° vane angle. Both TSL units share a centralized control system that includes a computer interface, flow controllers (lance air and fuel flowrates) and an off-gas cleaning unit. Thermocouples embedded in the refractory wall and in the off-gas duct monitor temperature distribution and support stable operation. Two omnidirectional condenser microphones from Behringer (ECM8000) [70] were installed near the furnace, one at the roof section and one near the bath surface, to capture acoustic signals. The selected microphone exhibits a near-flat frequency response over the frequency range of interest, ensuring that spectral features are not significantly distorted across the analyzed bandwidth. This supports reliable interpretation of frequency-domain characteristics, although amplitude remains uncalibrated. An IMU from x-IO Technologies [71] was mounted below the lance holder to record lance motion in the X, Y and Z directions. The microphones were connected to a Focusrite Scarlett 18i20 [72] ADC interface through XLR cables and the IMU transmitted data wirelessly to the computer. All sensor inputs, including acoustics, motion, thermocouples, gas analyzers and lance-fuel controllers, were integrated into the OCT software for real-time display. Post-processing of acoustic and motion data was performed separately in MATLAB (R2021a Update 8) for detailed frequency analysis.

3.3. Signal Acquisition and Data Processing Framework

This section explains how acoustic and inertial sensor data were recorded and how the raw signals were converted into the results presented in Section 4.
To ensure consistency and reproducibility of the measurements, multiple experimental campaigns were conducted across all scales. For the cold-model experiments, three independent test campaigns were performed on different days, covering a range of water-glycerin mixtures, lance submersion depths and air flow rates. For high-temperature conditions, two laboratory-scale and two pilot-scale campaigns were carried out under consistent operating conditions using the same slag composition. An additional pilot-scale trial was conducted during the initial system setup phase. For each operating condition, acoustic signals were recorded continuously in one-minute segments over a duration of ~10 min, resulting in multiple datasets per condition. The analysis presented in this work is based on representative signals selected from stable operating periods to minimize transient effects associated with process adjustments. Across repeated measurements, consistent qualitative trends were observed in waveform characteristics, power spectral density distributions and cumulative spectral power behavior. In the present study, no explicit spectral subtraction or decomposition is applied to isolate combustion-related and bubble-induced acoustic contributions. In high-temperature TSL operation, these processes are physically coupled and occur simultaneously, resulting in overlapping spectral content. Preliminary evaluation of direct subtraction approaches using non-submerged conditions as a baseline indicated that, in certain frequency ranges, combustion-related signals can exceed those measured under submerged conditions. This leads to non-physical artifacts and unreliable spectral representations. Therefore, direct subtraction was not considered appropriate for this system. All acoustic recordings were acquired using identical measurement hardware and acquisition settings, including microphone type, preamplifier configuration, and sampling parameters. For each operating condition, fixed-duration audio segments of one minute were used for spectral analysis.

3.3.1. Acoustic Signal Acquisition and Fundamentals

The acoustic signal recorded from the microphone (Section 3.2) was sampled at 44.1 kHz. Sound waves generated inside the furnace propagate through the structure and surrounding air and produce time-varying pressure fluctuations at the microphone location. A sound wave is a small, time-dependent pressure variation in air that carries information about dynamic events in the source region [73,74]. The microphone converts these pressure fluctuations into a proportional analog voltage signal, which is then digitized by the ADC of the audio interface. The recorded amplitude represents the instantaneous digitized voltage level and is expressed in relative (dimensionless) units because no absolute calibration to sound pressure (Pa) was performed. All signals were acquired using an identical measurement chain (microphone, acquisition system and processing parameters), ensuring internal consistency across operating conditions. Therefore, the analysis focuses on comparative trends in spectral distribution, peak frequencies, and relative intensity rather than absolute magnitude. A waveform is the plot of amplitude versus time and shows how the signal evolves during operation. Short high-amplitude bursts in the waveform correspond to transient events such as rapid bubble deformation or collapse. Frequency describes how fast the pressure oscillates and is measured in Hertz (Hz), where 1 Hz equals one oscillation per second. The frequency content of the signal is obtained using the PSD (relative amplitude2/Hz), which represents how the measured signal power is distributed across frequency [75]. Integration of the linear PSD over frequency yields the cumulative spectral power (relative amplitude2), which is used here to compare operating conditions. All acoustic data were stored as uncompressed WAV files containing the complete raw time-domain signal for each operating state, from which waveform, spectrogram, PSD and cumulative spectral power were computed using MATLAB.

3.3.2. Spectrogram (Time-Frequency Representation)

The waveform shows amplitude versus time but does not reveal how the frequency content evolves during transient events. To analyze how frequency changes over time, a spectrogram is computed. The spectrogram is obtained using the STFT, in which the signal is divided into short, overlapping time windows (50 ms in this study, corresponding to a temporal resolution of 0.05 s) and an FFT is applied to each segment [75,76]. A Hamming window (cosine weighting function applied to each signal segment to reduce spectral leakage) with 90% overlap is applied and zero-padding is used to refine frequency sampling without altering physical resolution [49,51]. The frequency resolution is given by Δf = fs/N, where fs = 44.1 kHz is the sampling frequency, resulting in a frequency resolution determined by the window length, while zero-padding refines frequency sampling without increasing true spectral resolution. The result is a time-frequency map in which the horizontal axis represents time (s), the vertical axis represents frequency (Hz) and the color scale represents spectral power in decibels (dB), calculated as 10.log10(PSD(linear)). The spectrogram enables identification of transient frequency bands associated with bubble growth, detachment and collapse processes. The spectrogram color scale is referenced to the maximum power level within each individual dataset to enhance visualization of spectral features. As a result, direct comparison of absolute amplitude across different operating conditions is not possible using the spectrogram plots, and interpretation is limited to relative frequency-time characteristics.

3.3.3. Power Spectral Density (PSD)

While the spectrogram displays how frequency content evolves over time, the PSD represents the average distribution of signal spectral power over frequency for the entire recording. In this study, the PSD is computed using Welch’s method [77], which improves statistical stability by averaging spectra from overlapping windowed segments.
The processing steps are as follows:
  • The signal is first mean-centered to remove the DC component.
  • A Hann window of 0.5 s is applied to reduce spectral leakage.
  • 50% overlap between adjacent segments is used.
  • The FFT length is chosen as the next power of two (minimum 2048 points).
  • The squared magnitude of the FFT is averaged over all segments to obtain PSD.
The resulting PSD has units of relative amplitude2 per Hertz, since the microphone signal is expressed in uncalibrated digital units. For visualization, the PSD is plotted in decibels as PSD(dB) = 10.log10 (PSD(linear)/PSD(ref)), where PSD(ref) is taken as a common reference value across all datasets within a given plot (typically the maximum PSD value across all curves in that plot), ensuring consistent scaling and direct comparability between operating conditions. A light moving-average smoothing corresponding to ~200 Hz bandwidth (based on the applied FFT resolution and smoothing span) is applied only for visualization. Peak locations were verified to remain stable for different window lengths and smoothing spans. It should be noted that PSD magnitudes are presented on a relative scale and comparisons across operating conditions are based on spectral shape and frequency distribution rather than absolute amplitude.

3.3.4. Cumulative Spectral Power

To quantify how spectral power accumulates across frequency, the cumulative spectral power is computed from the linear (non-dB) PSD. Mathematically, it is obtained by numerically integrating the PSD over frequency, implemented as the cumulative sum of PSD values multiplied by the corresponding frequency spacing. The resulting curve represents the total integrated spectral power contained below a given frequency. Because the microphone signal is expressed in uncalibrated digital amplitude units and is not referenced to absolute sound pressure (Pa), the PSD has units of relative amplitude2/Hz and the cumulative spectral power has units of relative amplitude2. Therefore, all values are reported in relative units and are used strictly for comparative analysis between operating conditions rather than absolute acoustic quantification [75].

3.3.5. Inertial Motion Sensing

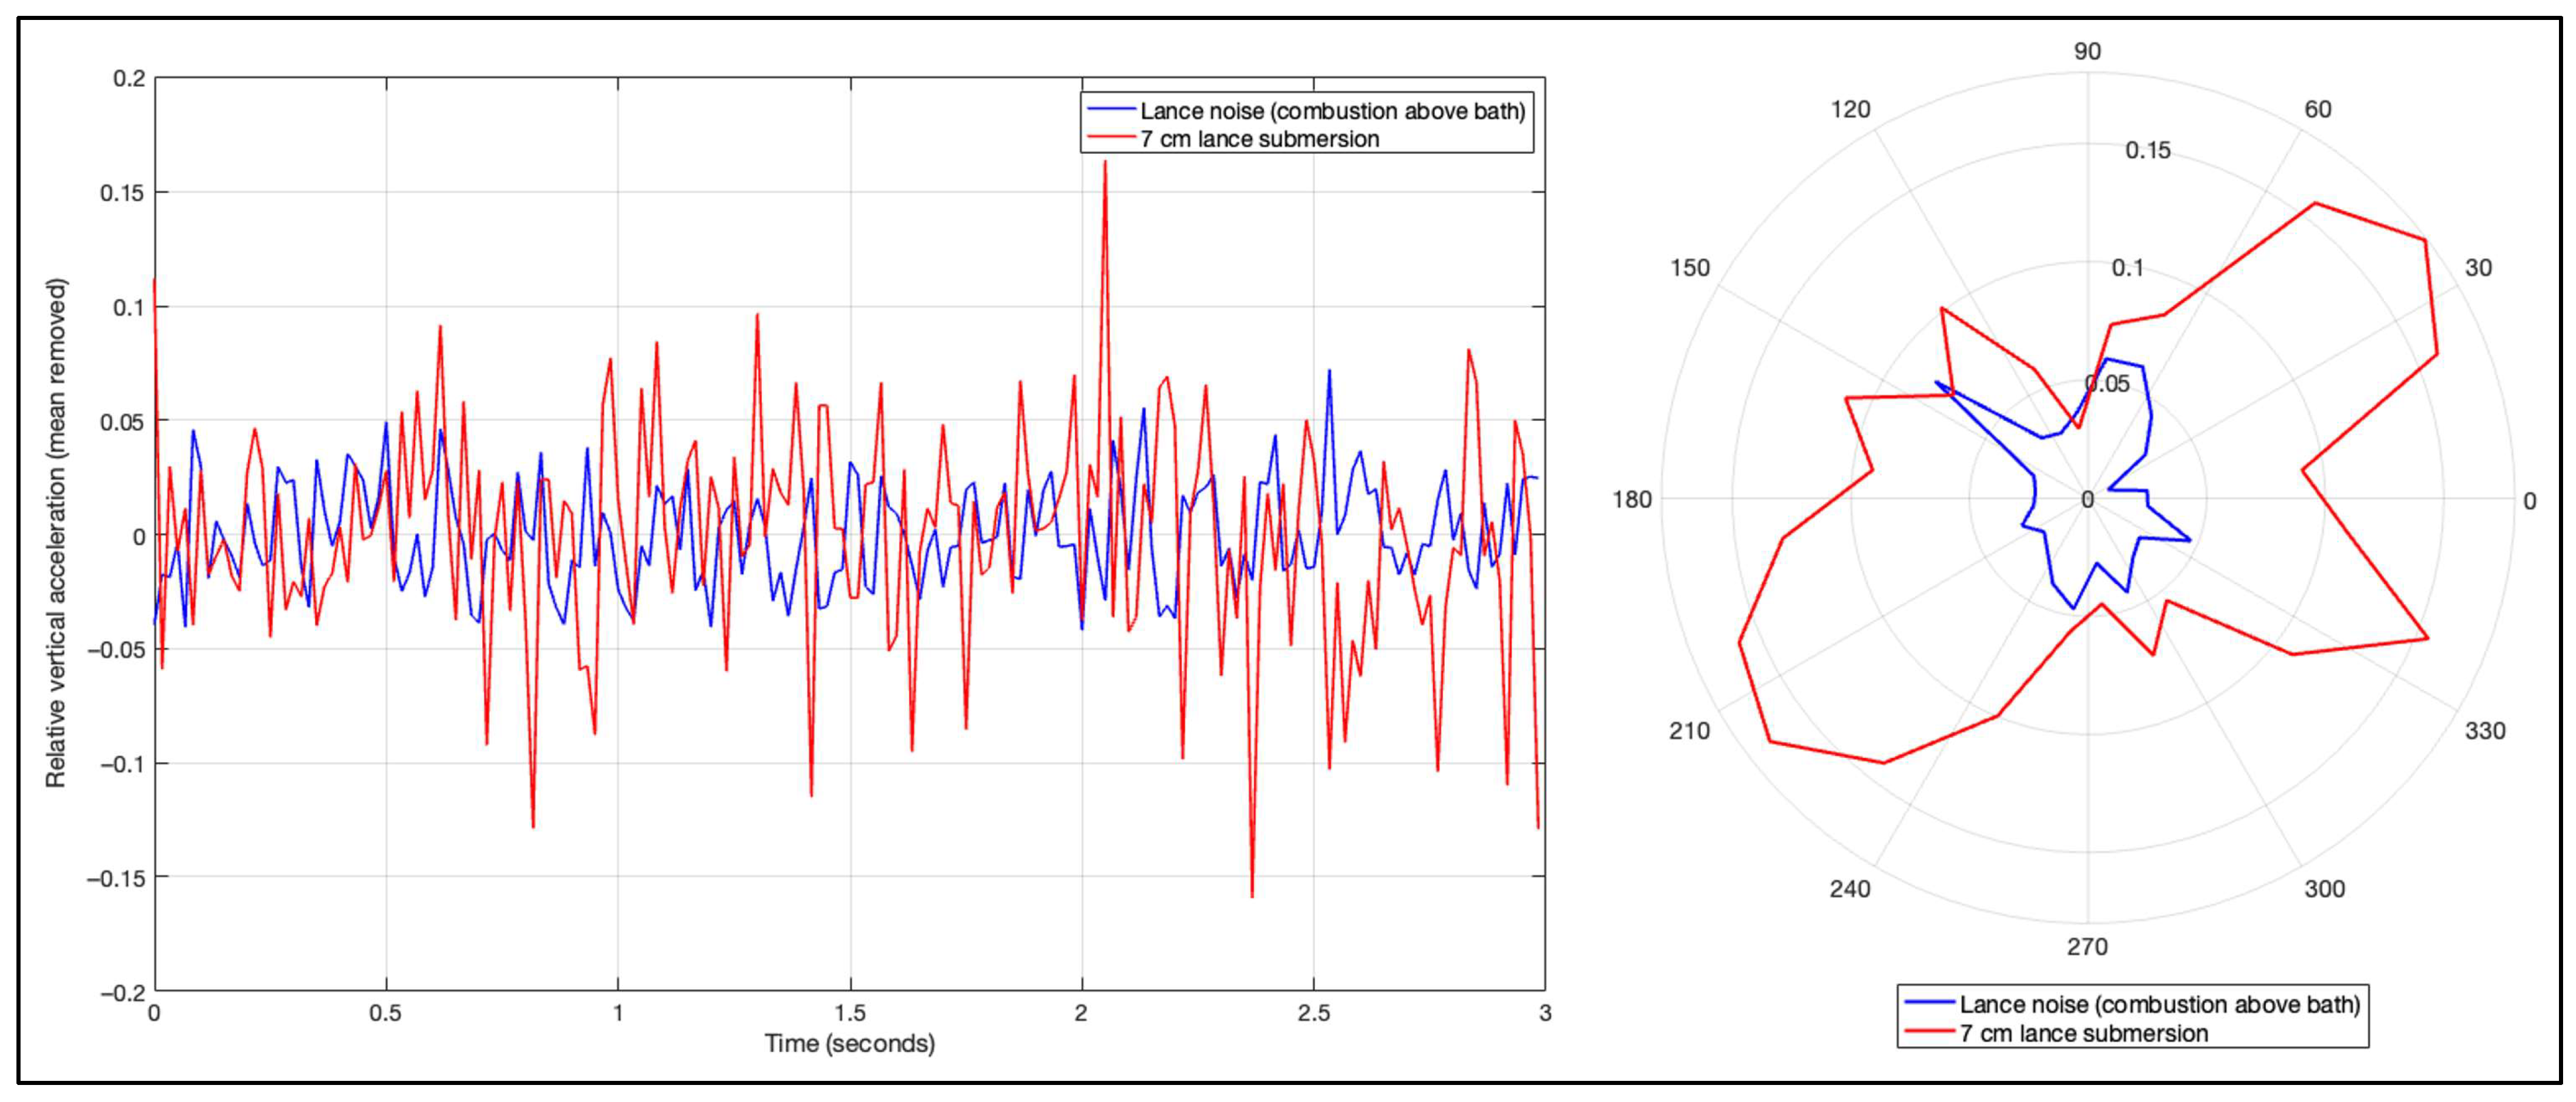
Lance motion was measured using a tri-axial IMU mounted on the external lance wall below the holding clamps. The sensor contains a three-axis accelerometer that measures linear acceleration along the X, Y and Z axes and a gyroscope that measures angular velocity. In the present work, only the accelerometer signals were used. The accelerometer natively reports acceleration in units of g (1 g = 9.81 m/s2). However, the analysis focuses on relative acceleration changes and, therefore, the signals were mean-centered and expressed in relative normalized units.
The IMU recorded ≈36,000 data points during a ten-minute acquisition period, corresponding to a sampling rate of about 60 Hz. Sensor data was exported as JSON files and processed in MATLAB. For each dataset, acceleration values were extracted from the JSON structure and converted into time series for the three axes. To avoid start-up and shutdown disturbances, analysis was performed on a short time window selected from the center of the recording. A three-second segment (≈180 samples) was used for each operating condition. The signals were mean-centered to remove static bias and a light robust smoothing filter (rloess) was applied for visualization only. The measurements are presented in normalized units and no direct conversion to absolute acceleration (m/s2) is performed. Therefore, the analysis focuses on comparative trends in motion behavior rather than absolute acceleration values.
The vertical lance response is represented by the X-axis acceleration signal, which corresponds to the lance axial direction. The values are plotted as normalized acceleration in relative units to emphasize changes between operating conditions rather than absolute acceleration levels. The planar lance motion is evaluated using the lateral Y and Z components, which represent planar motion, i.e., motion perpendicular to the lance axis. For each time step, the radial motion magnitude is calculated from the combined Y-Z acceleration components. The directional distribution of this planar motion is visualized using polar plots. A polar motion envelope is constructed to represent the dominant lateral motion directions of the lance during the selected time window. The area enclosed by this envelope is also calculated numerically, providing a single scalar indicator of overall planar motion intensity and allowing comparison between operating conditions.
Acceleration values are, therefore, reported in normalized relative units because the analysis focuses on relative variations in motion behavior rather than absolute displacement. Although the IMU is installed above the lance tip, the measured acceleration trends provide consistent indicators of bath-lance interaction when operating parameters such as gas flow rate and submersion depth are varied. To ensure that the recorded signals represent bath-induced forcing rather than structural vibration of the mounting system, the IMU position and mounting configuration were kept identical for all experiments. Interpretation, therefore, relies on relative changes between operating conditions rather than absolute acceleration values.
Acoustic representations (waveform, spectrogram, PSD and cumulative spectral power) are derived from the microphone WAV recordings, whereas the motion plots originate from the IMU measurements. The two measurement systems capture different physical responses, with acoustic data reflecting pressure fluctuations in the furnace and inertial measurements reflecting mechanical movement on the lance.

4. Results

4.1. Acoustic Measurements from the Cold-Model Tests

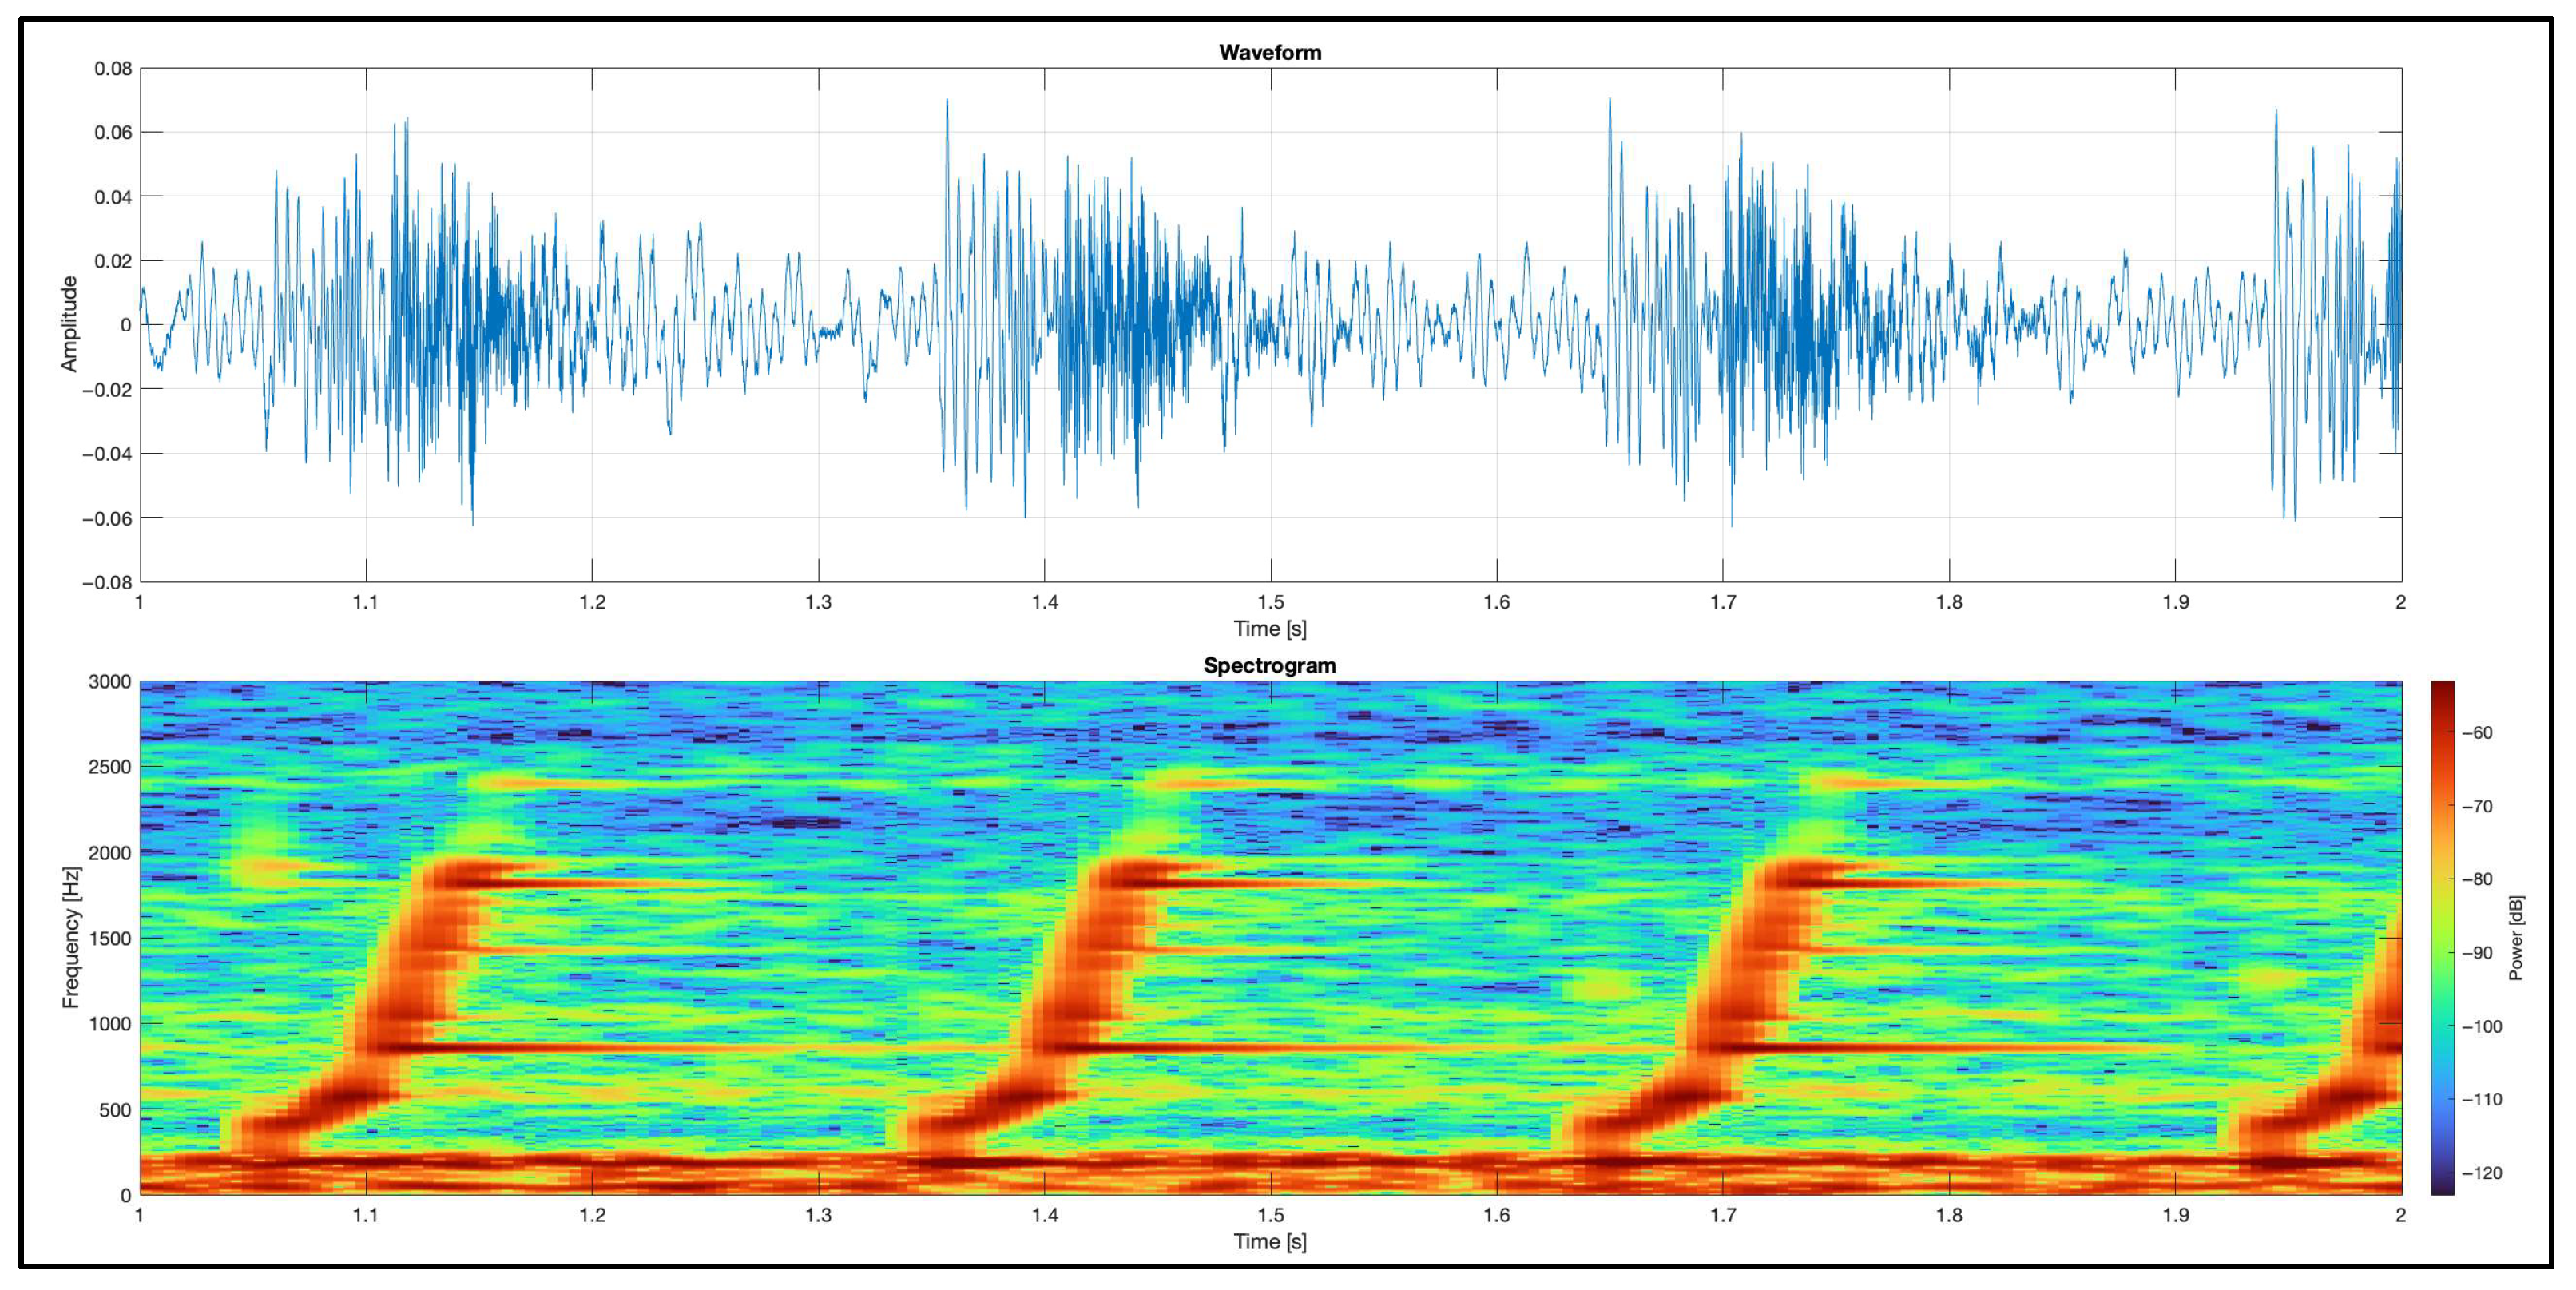
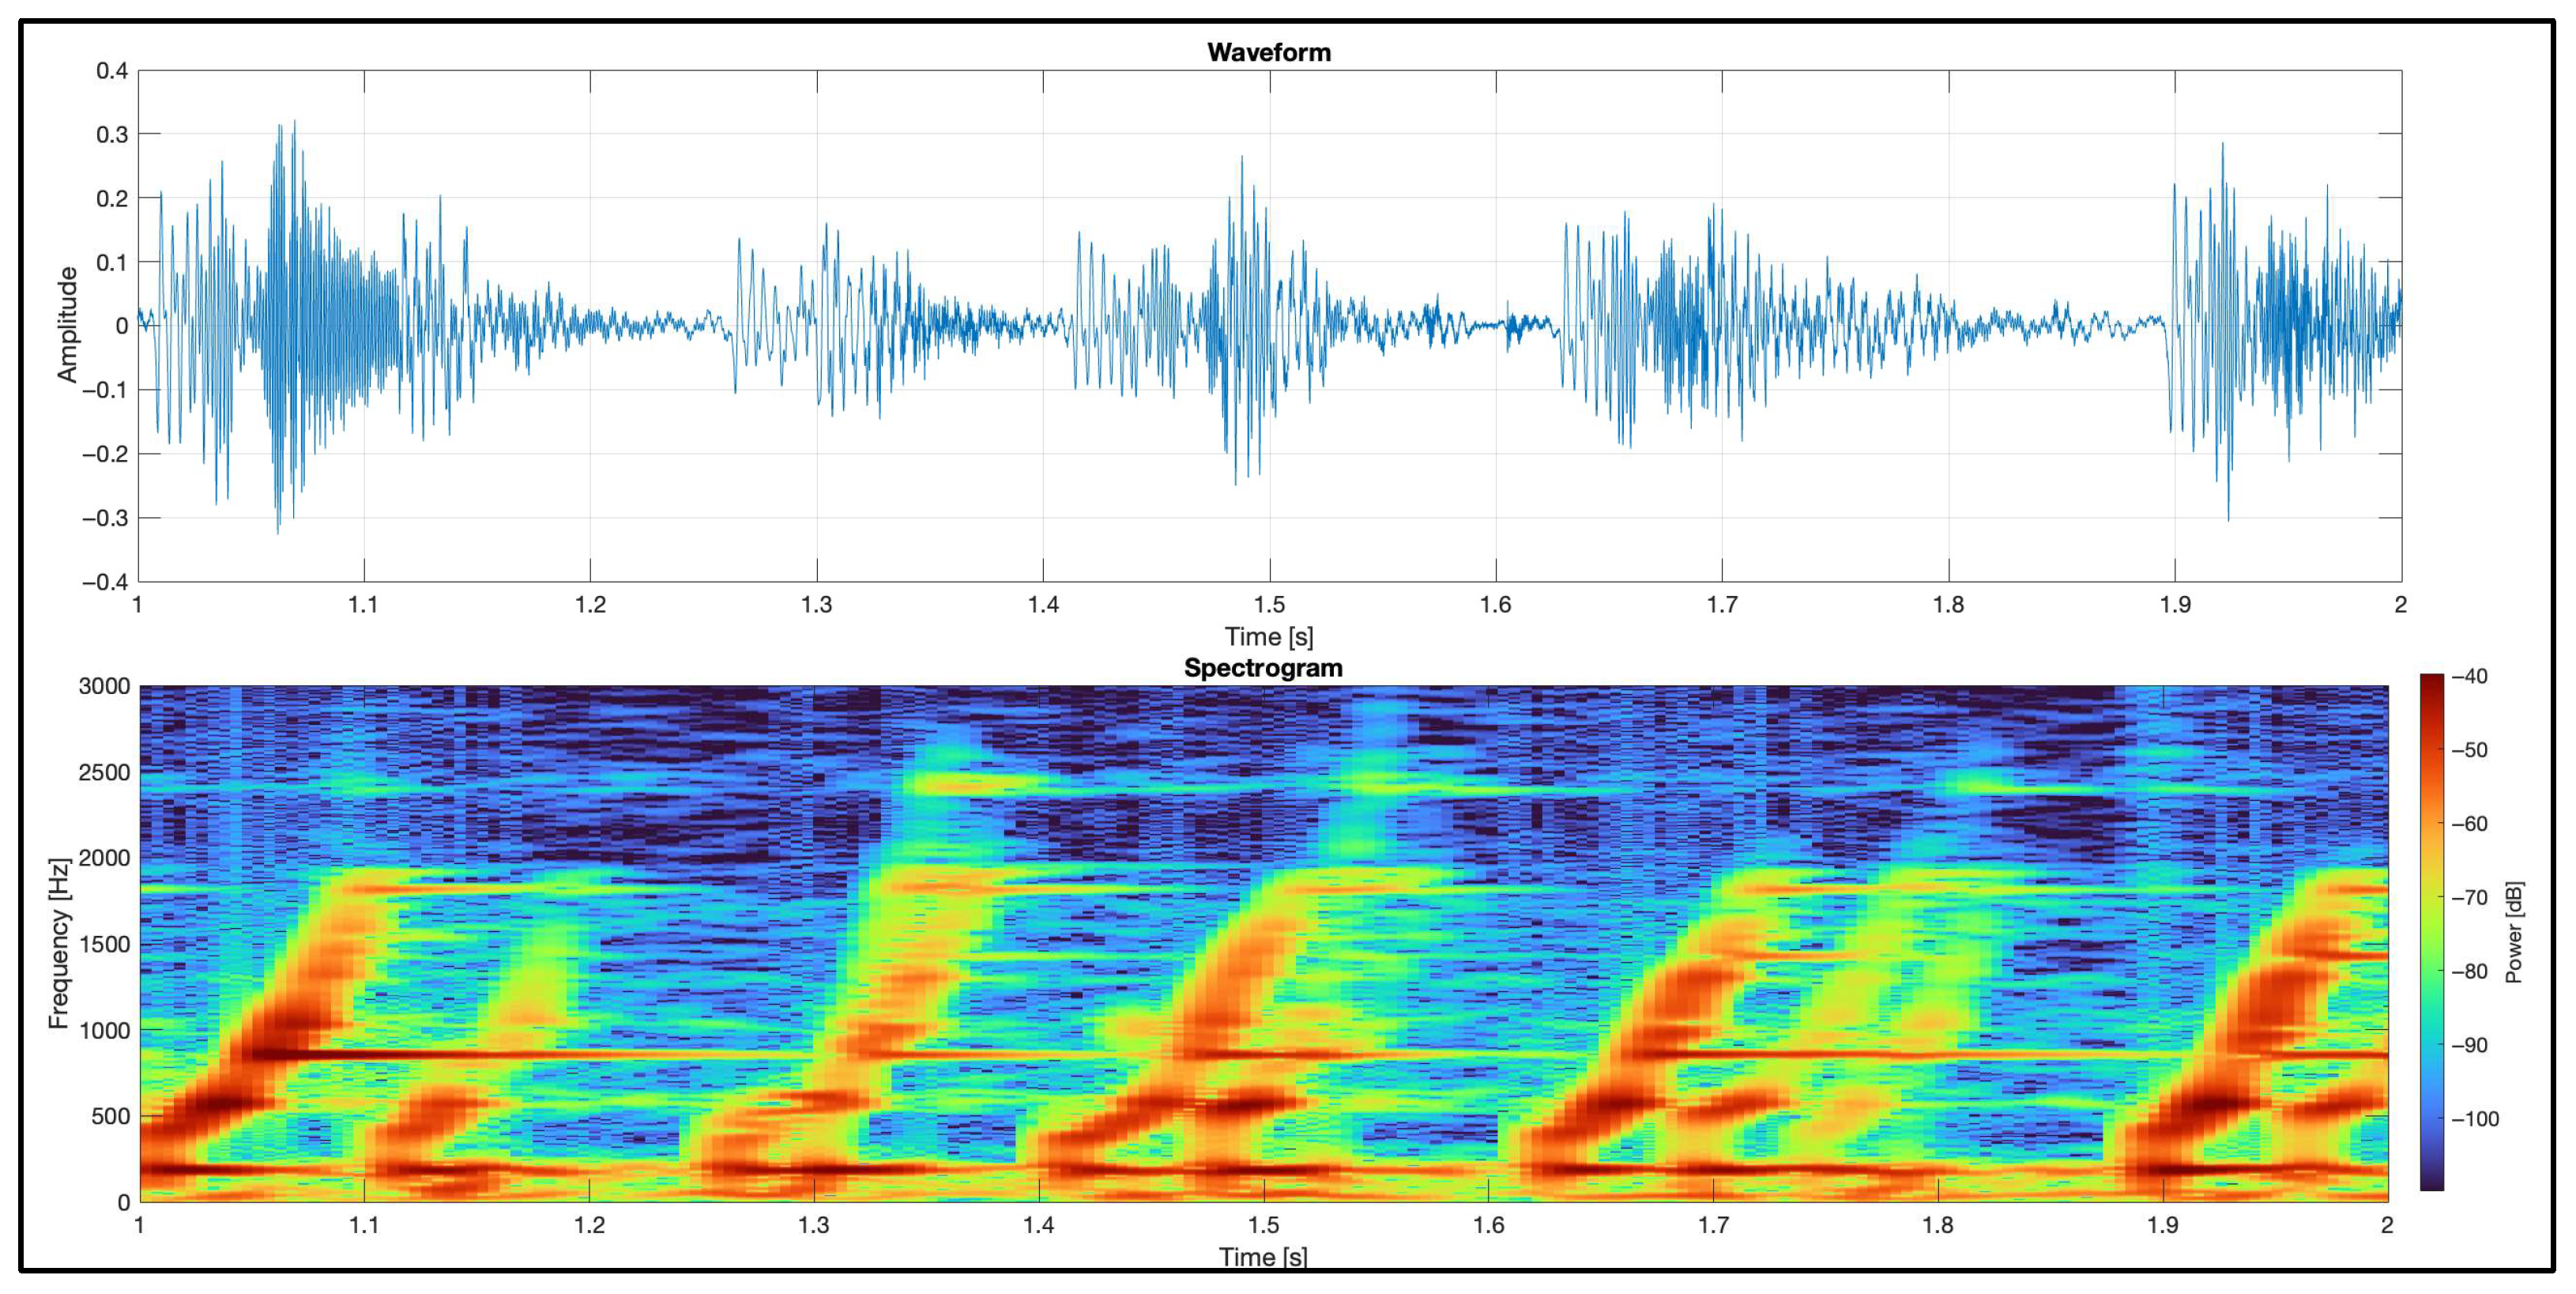
Although the cold model tests and high-speed camera validation are discussed elsewhere [67,68], it is useful here to summarize the corresponding acoustic patterns in the time domain and in the spectrograms. The cold-model experiments presented in this paper represent a limited subset of a broader experimental campaign. The purpose of this section is to illustrate the initial validation of the sensing approach under controlled conditions, rather than to provide a comprehensive parametric study. The results presented correspond to representative datasets selected from repeated measurements under each operating condition. Similar qualitative trends were consistently observed across repeated runs. Figure 8 and Figure 9 present representative results from the cold model, which uses a vessel and lance geometry (d = 14 mm) similar to that of the laboratory-scale TSL (Figure 6). The bath consists of 80 wt.% water and 20 wt.% glycerin solution. In both figures the lance submersion depth is 2 cm. The only difference between the two cases is the air flow rate through the lance, which is 60 L/h in Figure 8 and 300 L/h in Figure 9. For each case, the upper panel shows the waveform of a 1 s segment (from 1.0 to 2.0 s), with time in seconds on the x-axis and recorded amplitude signal on the y-axis. The lower panel shows the corresponding spectrogram.
In Figure 8 (60 L/h), the waveform shows approximately four dominant high-amplitude transients within the 1 s window. The peak amplitudes are about ±0.06 (digital units). The temporal spacing between successive peaks is approximately 0.25–0.30 s, corresponding to an event frequency of roughly 3–4 Hz, which represents the repetition rate of transient bubble-related events. In the spectrogram, four corresponding transient events are visible as time-localized broadband features with increasing frequency content. Each event begins ~300–400 Hz and extends upward ~1.5–2.0 kHz, indicating a frequency sweep during the evolution of the transient. In addition, persistent narrowband components are visible at ~900 Hz and 1800 Hz as horizontal lines across the spectrogram. These components are interpreted as system-related or resonance features rather than discrete bubble-collapse events. A persistent low-frequency component <200 Hz is present throughout the window and is interpreted as background mechanical vibration and steady gas injection noise rather than discrete bubble-related events.
In Figure 9 (300 L/h), the waveform exhibits a larger number of high-amplitude transients, with about nine to ten distinct peaks within the same 1 s interval. The peak amplitudes reach about ±0.30. The spacing between successive peaks is shorter, typically around 0.08–0.12 s (i.e., 8–12 Hz), indicating an increased repetition rate of transient bubble-related events. In the spectrogram, a corresponding series of more frequent transient events is visible as time-localized broadband features with increasing frequency content. Each event begins near ~200–400 Hz and extends upward to about 2.5–3.0 kHz, indicating a broader frequency sweep compared with the 60 L/h case. The transient features appear wider in frequency and higher in spectral power, reflecting more intense bubble-bath interactions at elevated gas flow. In addition, persistent narrowband components are visible as horizontal lines across the spectrogram, which are attributed to system-related or resonance effects rather than discrete bubble-collapse events. The background acoustic spectral power > 1 kHz is also noticeably higher, indicating an overall increase in broadband acoustic activity at higher gas flow rates.
These results show that the acoustic measurements resolve individual transient events and clearly distinguish changes in event frequency, amplitude and spectral bandwidth between the 60 L/h and 300 L/h operating conditions. When the lance is not submerged, these discrete transient peaks are not observed, confirming that the detected events are associated with submerged bubble formation and interaction with the bath rather than lance gas flow alone.
The acoustic signatures observed in the present cold-model experiments are consistent in trend with the injection dynamics reported by Neven et al. [28]. The authors identified dominant bubbling frequencies in the range of approximately 5–12 Hz for large gas bubbles using pressure measurements near the lance. In the pilot plant trials (VD = 0.4 m, LD = 0.05 m) at an effective gas flow rate of 0.2 m3/s (O2 enrichment = 37%), a dominant bubbling frequency of ~8 Hz was measured, while a surface wave (~3 Hz) and a natural oscillation (~32 Hz) were also identified. Across demo reactor (gas flow rate = 1.47–1.92 m3/s, VD = 1.2 m, LD = 0.12 m) and industrial reactors (gas flow rate = 20–34 m3/s, VD = 3.5 m, LD = 0.2–0.3 m), bubbling frequencies consistently followed the Davidson–Schüler scaling (f ∝ G1/3). The frequency increased systematically with effective gas flow rate and was influenced by lateral bath cross-flow (i.e., horizontal recirculatory liquid motion across the plume region) and turbulence intensity, which depend not only on gas flow rate but also on geometric scaling parameters such as lance diameter, submergence depth and vessel size. In a non-dimensional framework, turbulence effects scale with Reynolds number, while plume penetration and free-surface interaction scale with Froude number. These coupled inertial and geometric effects, rather than submergence depth alone, govern bubble detachment frequency and the resulting dynamic pressure response.
While Neven’s study focused primarily on low-frequency pressure oscillations associated with bubble formation and detachment, the present acoustic measurements exhibit a comparable increase in transient event repetition rate as the gas flow increases (from approximately 3–4 Hz at 60 L/h to 8–12 Hz at 300 L/h). In addition, a higher repetition rate of transient acoustic bursts and broader acoustic spectral bandwidth at elevated air flow were also noted. The rising frequency bands observed between approximately 300 Hz and 3 kHz in Figure 8 and Figure 9 are interpreted as higher-frequency acoustic spectral components associated with bubble growth, deformation and collapse, which were not accessible in Neven’s pressure-based measurements. Both studies indicate that increasing gas momentum intensifies bubble-bath interaction and turbulence, leading to stronger dynamic pressure fluctuations and enhanced acoustic signal response. Although the present experiments were conducted at fixed shallow submergence (2 cm), the observed increase in event frequency with gas flow is consistent with the general injection-regime trends reported by Neven et al. The present results therefore complement Neven’s work by extending frequency-based diagnostics from low-frequency pressure oscillations to higher-frequency acoustic spectral components, while remaining consistent with established gas-injection scaling behavior.

4.2. Feed Material Characterization for High-Temperature Trials

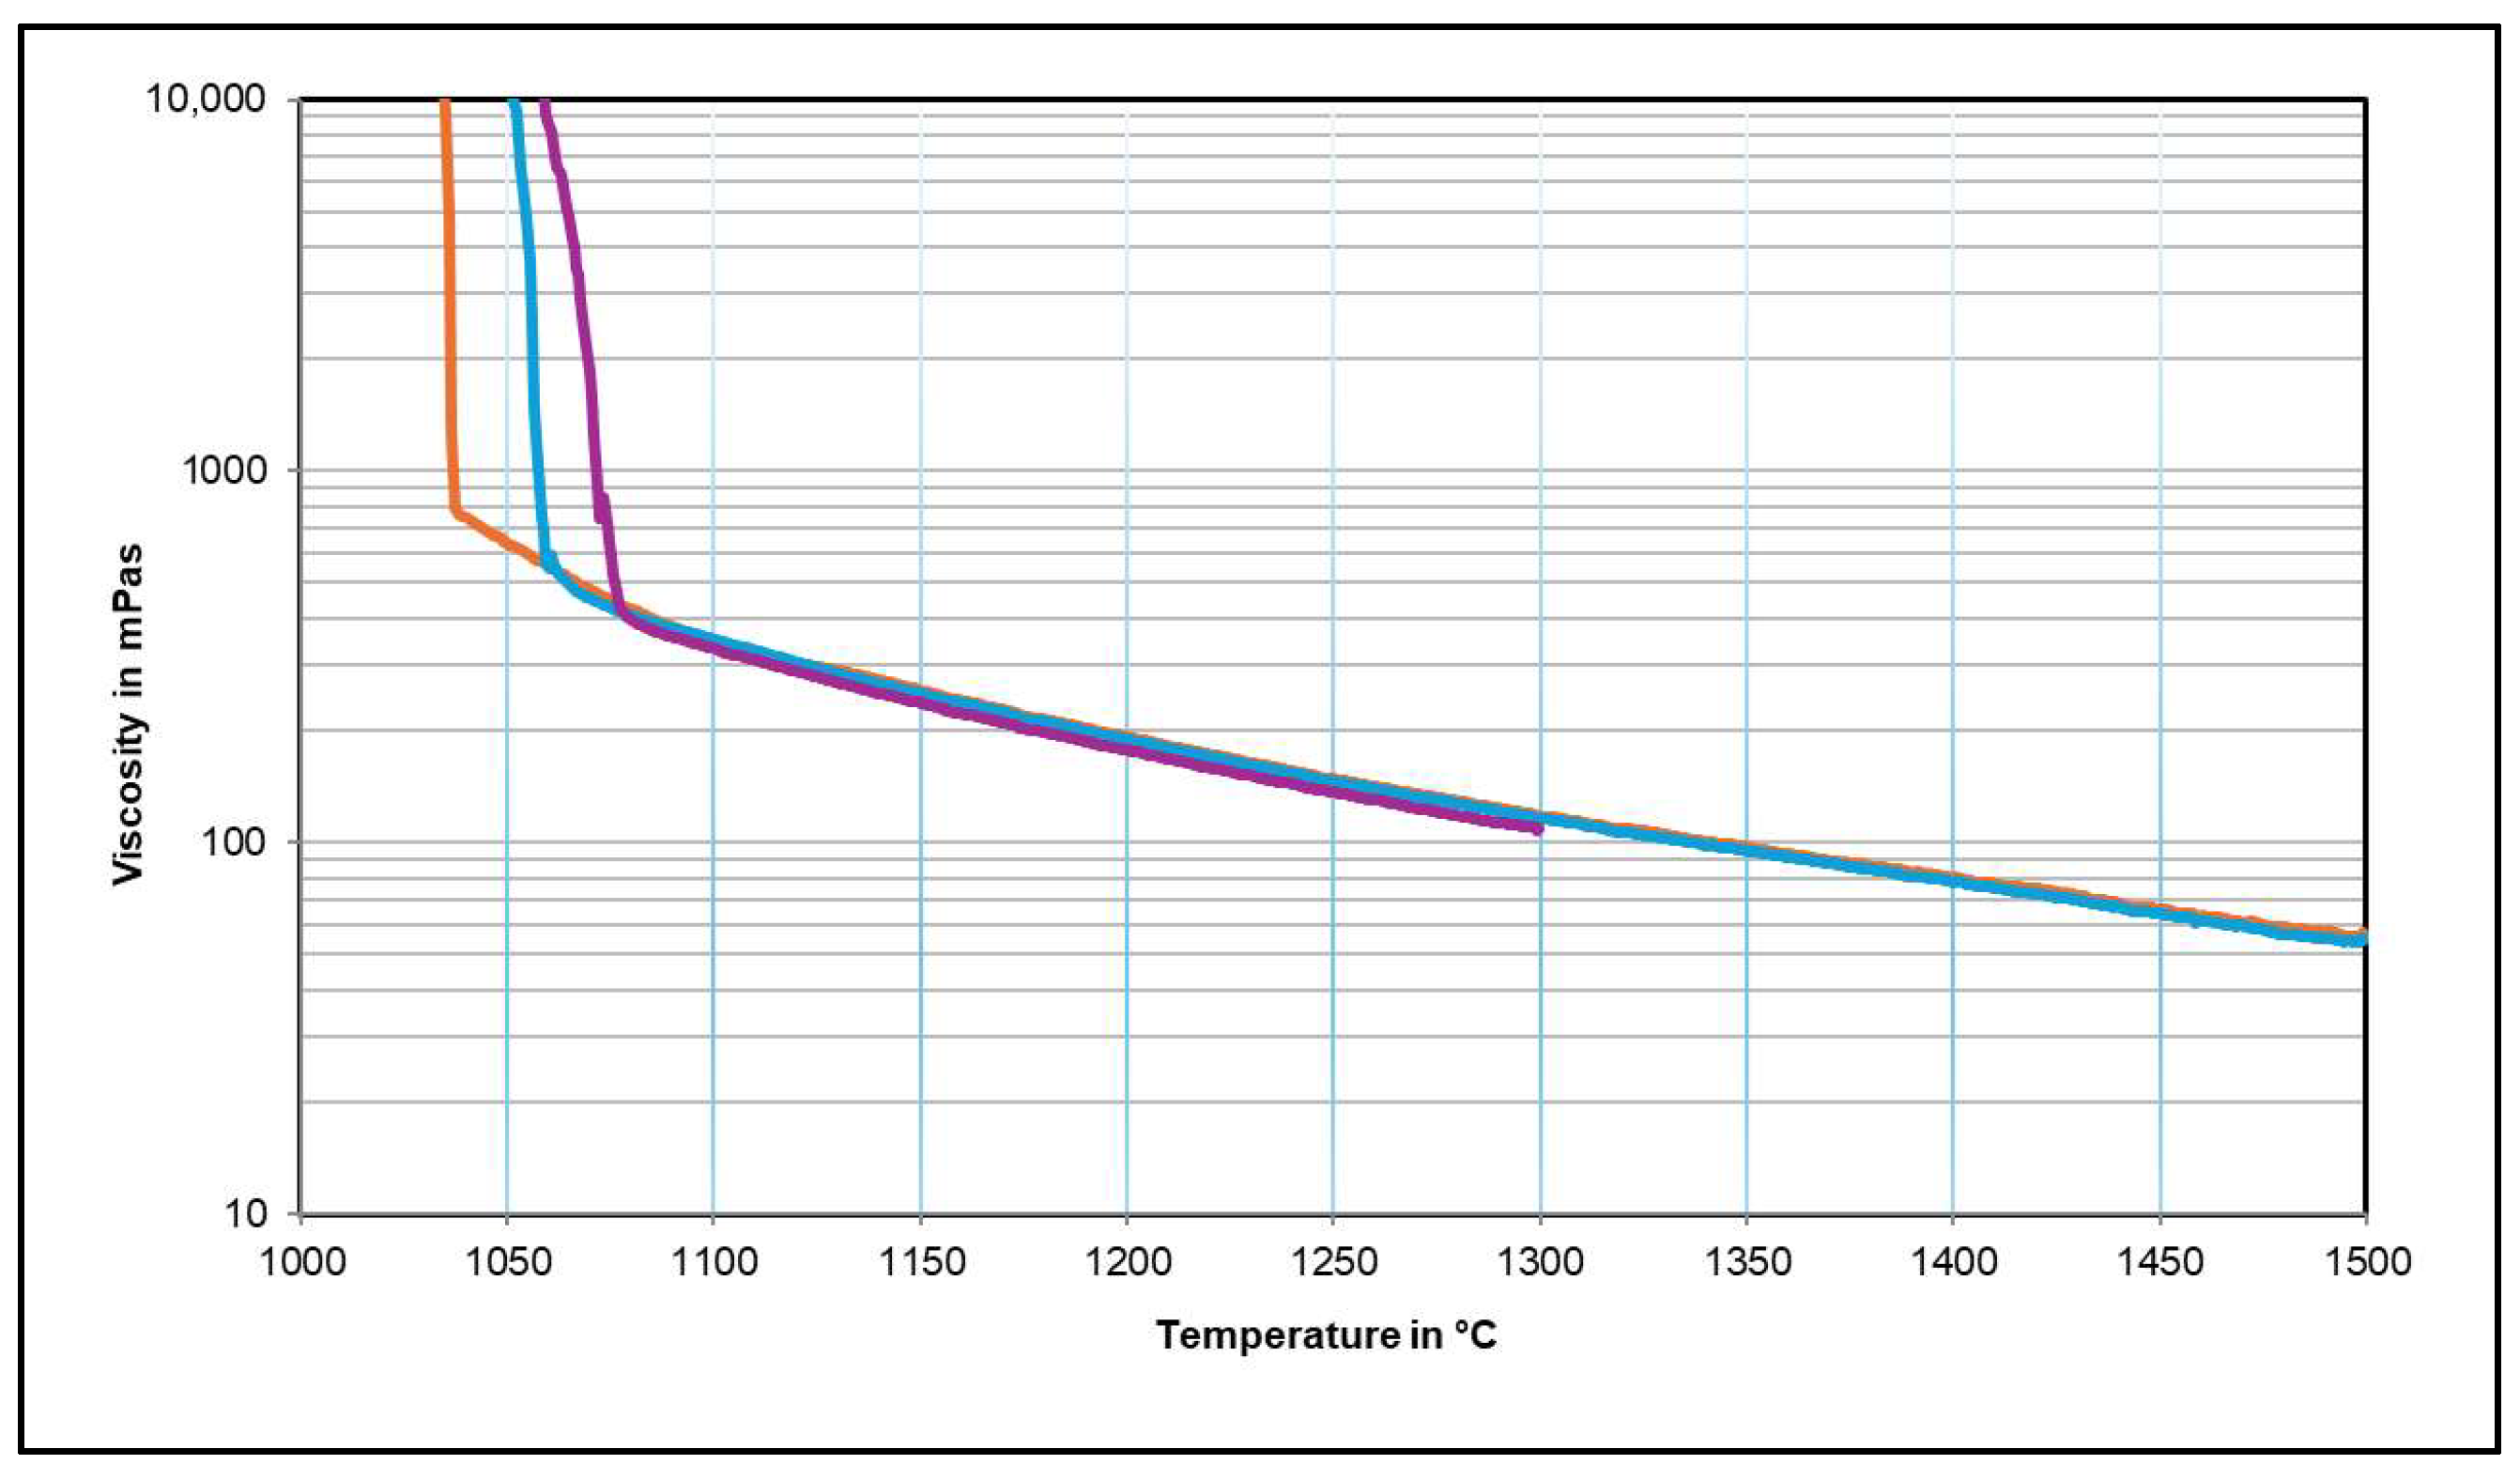
Before presenting the acoustic results from high-temperature TSL tests, the material properties of the feed used in the tests are summarized in this Section. These thermophysical properties directly influence bubble formation, plume stability, damping behavior and, therefore, the resulting acoustic signatures. The feed corresponds to a fayalitic slag originating from industrial copper production. Its chemical composition was determined by XRF and XRD analyses (Table 1 and Table 2), carried out at IEC, TU Bergakademie Freiberg. The viscosity measurements were performed at the Institute of Iron and Steel Technology, TU Bergakademie Freiberg, using a vibrating finger viscometer [78] under inert atmosphere and at different temperatures (Figure 10). Additional slag properties evaluated at 1500 K are density ~3435 kg/m3 and surface tension ~0.1998 N/m. These parameters govern the relative magnitude of inertial, viscous, gravitational and capillary forces (Re, Fr, We numbers), which in turn control bubble detachment frequency, bubble rise velocity and collapse dynamics. Consequently, they define the mechanical-acoustic coupling conditions under which the high-temperature measurements presented in Section 4.3 and Section 4.4 are interpreted.
In addition to viscosity, acoustic wave propagation in molten slag is governed by thermophysical properties such as density, compressibility and temperature. Literature on molten metals indicates that sound velocity typically lies in the range of approximately 1500–5000 m/s, depending on composition and temperature, and decreases with increasing temperature due to increased compressibility of the liquid [79,80]. Acoustic attenuation in liquid media is significant and is governed by viscous dissipation, thermal conduction and structural relaxation mechanisms. In liquid metals, thermal conduction losses can dominate classical attenuation and additional absorption may arise from structural relaxation under acoustic pressure fluctuations [79,80]. Experimental studies report attenuation values on the order of 0.1–0.3 neper/cm in molten systems, indicating damping of acoustic waves over relatively short propagation distances [81]. For the present slag system, direct measurement of sound velocity and attenuation was not performed. Such measurements require controlled high-temperature ultrasonic techniques (e.g., pulse-echo or through-transmission methods) with known propagation paths and calibrated instrumentation.
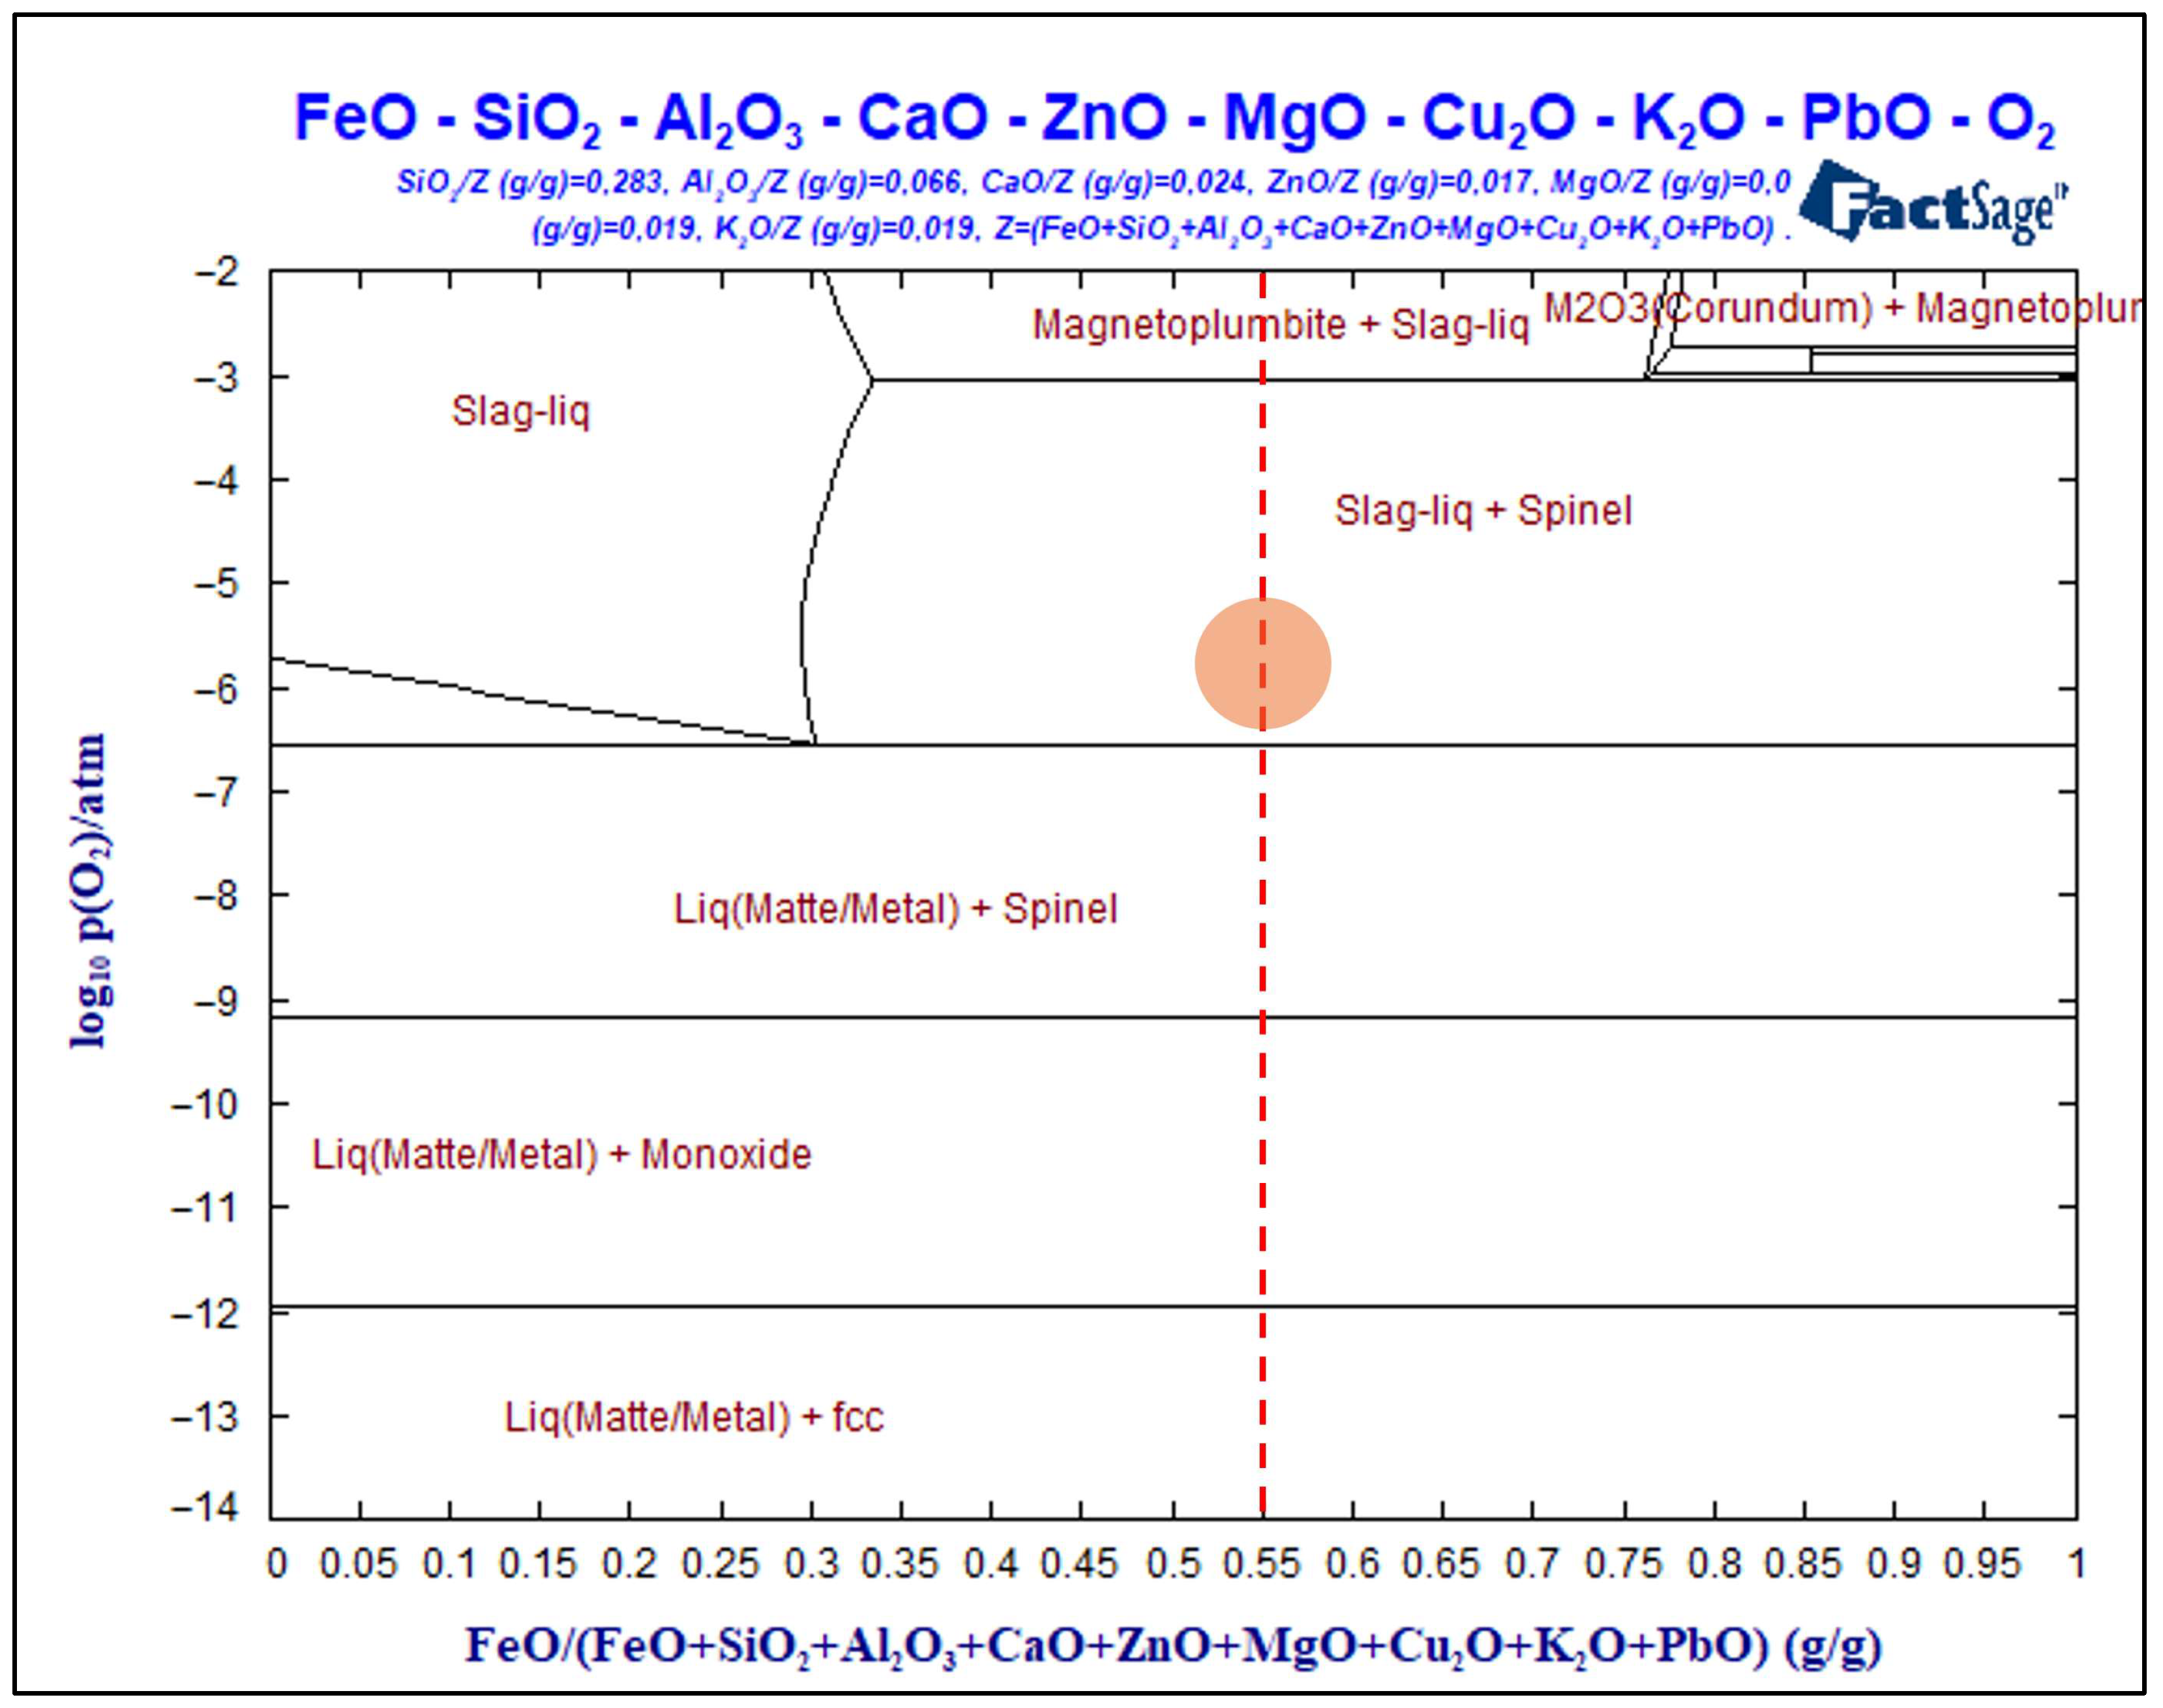
The laboratory and pilot-scale high-temperature trials were carried out at an operating temperature of ~1200 °C using the fayalitic slag composition shown in Table 1. Based on the isothermal FeO-p(O2) phase diagram at 1200 °C (Figure 11), this slag corresponds to a normalized FeO fraction of ~0.55. The corresponding oxygen potential range (log p(O2) ≈ −6 to −7) is not directly measured but is estimated based on near-stoichiometric air-fuel combustion conditions. Under these conditions, the phase diagram indicates that the system lies within the slag-liquid + spinel stability region. It is noted that, due to the batch nature of the experiments and ongoing gas injection, the local oxygen potential is expected to be transient. Therefore, the reported p(O2) range should be interpreted as a representative thermodynamic window rather than a fixed operating value. The phase diagram is calculated using FactSage 8.4 and UQPY Database [82]. It is to be noted that the XRD represents the solidified slag at room temperature, whereas Figure 11 is an equilibrium diagram at 1200 °C. Spinel (e.g., magnetite) can precipitate during cooling and/or slight oxidation.

4.3. Laboratory-Scale TSL Acoustic Measurements

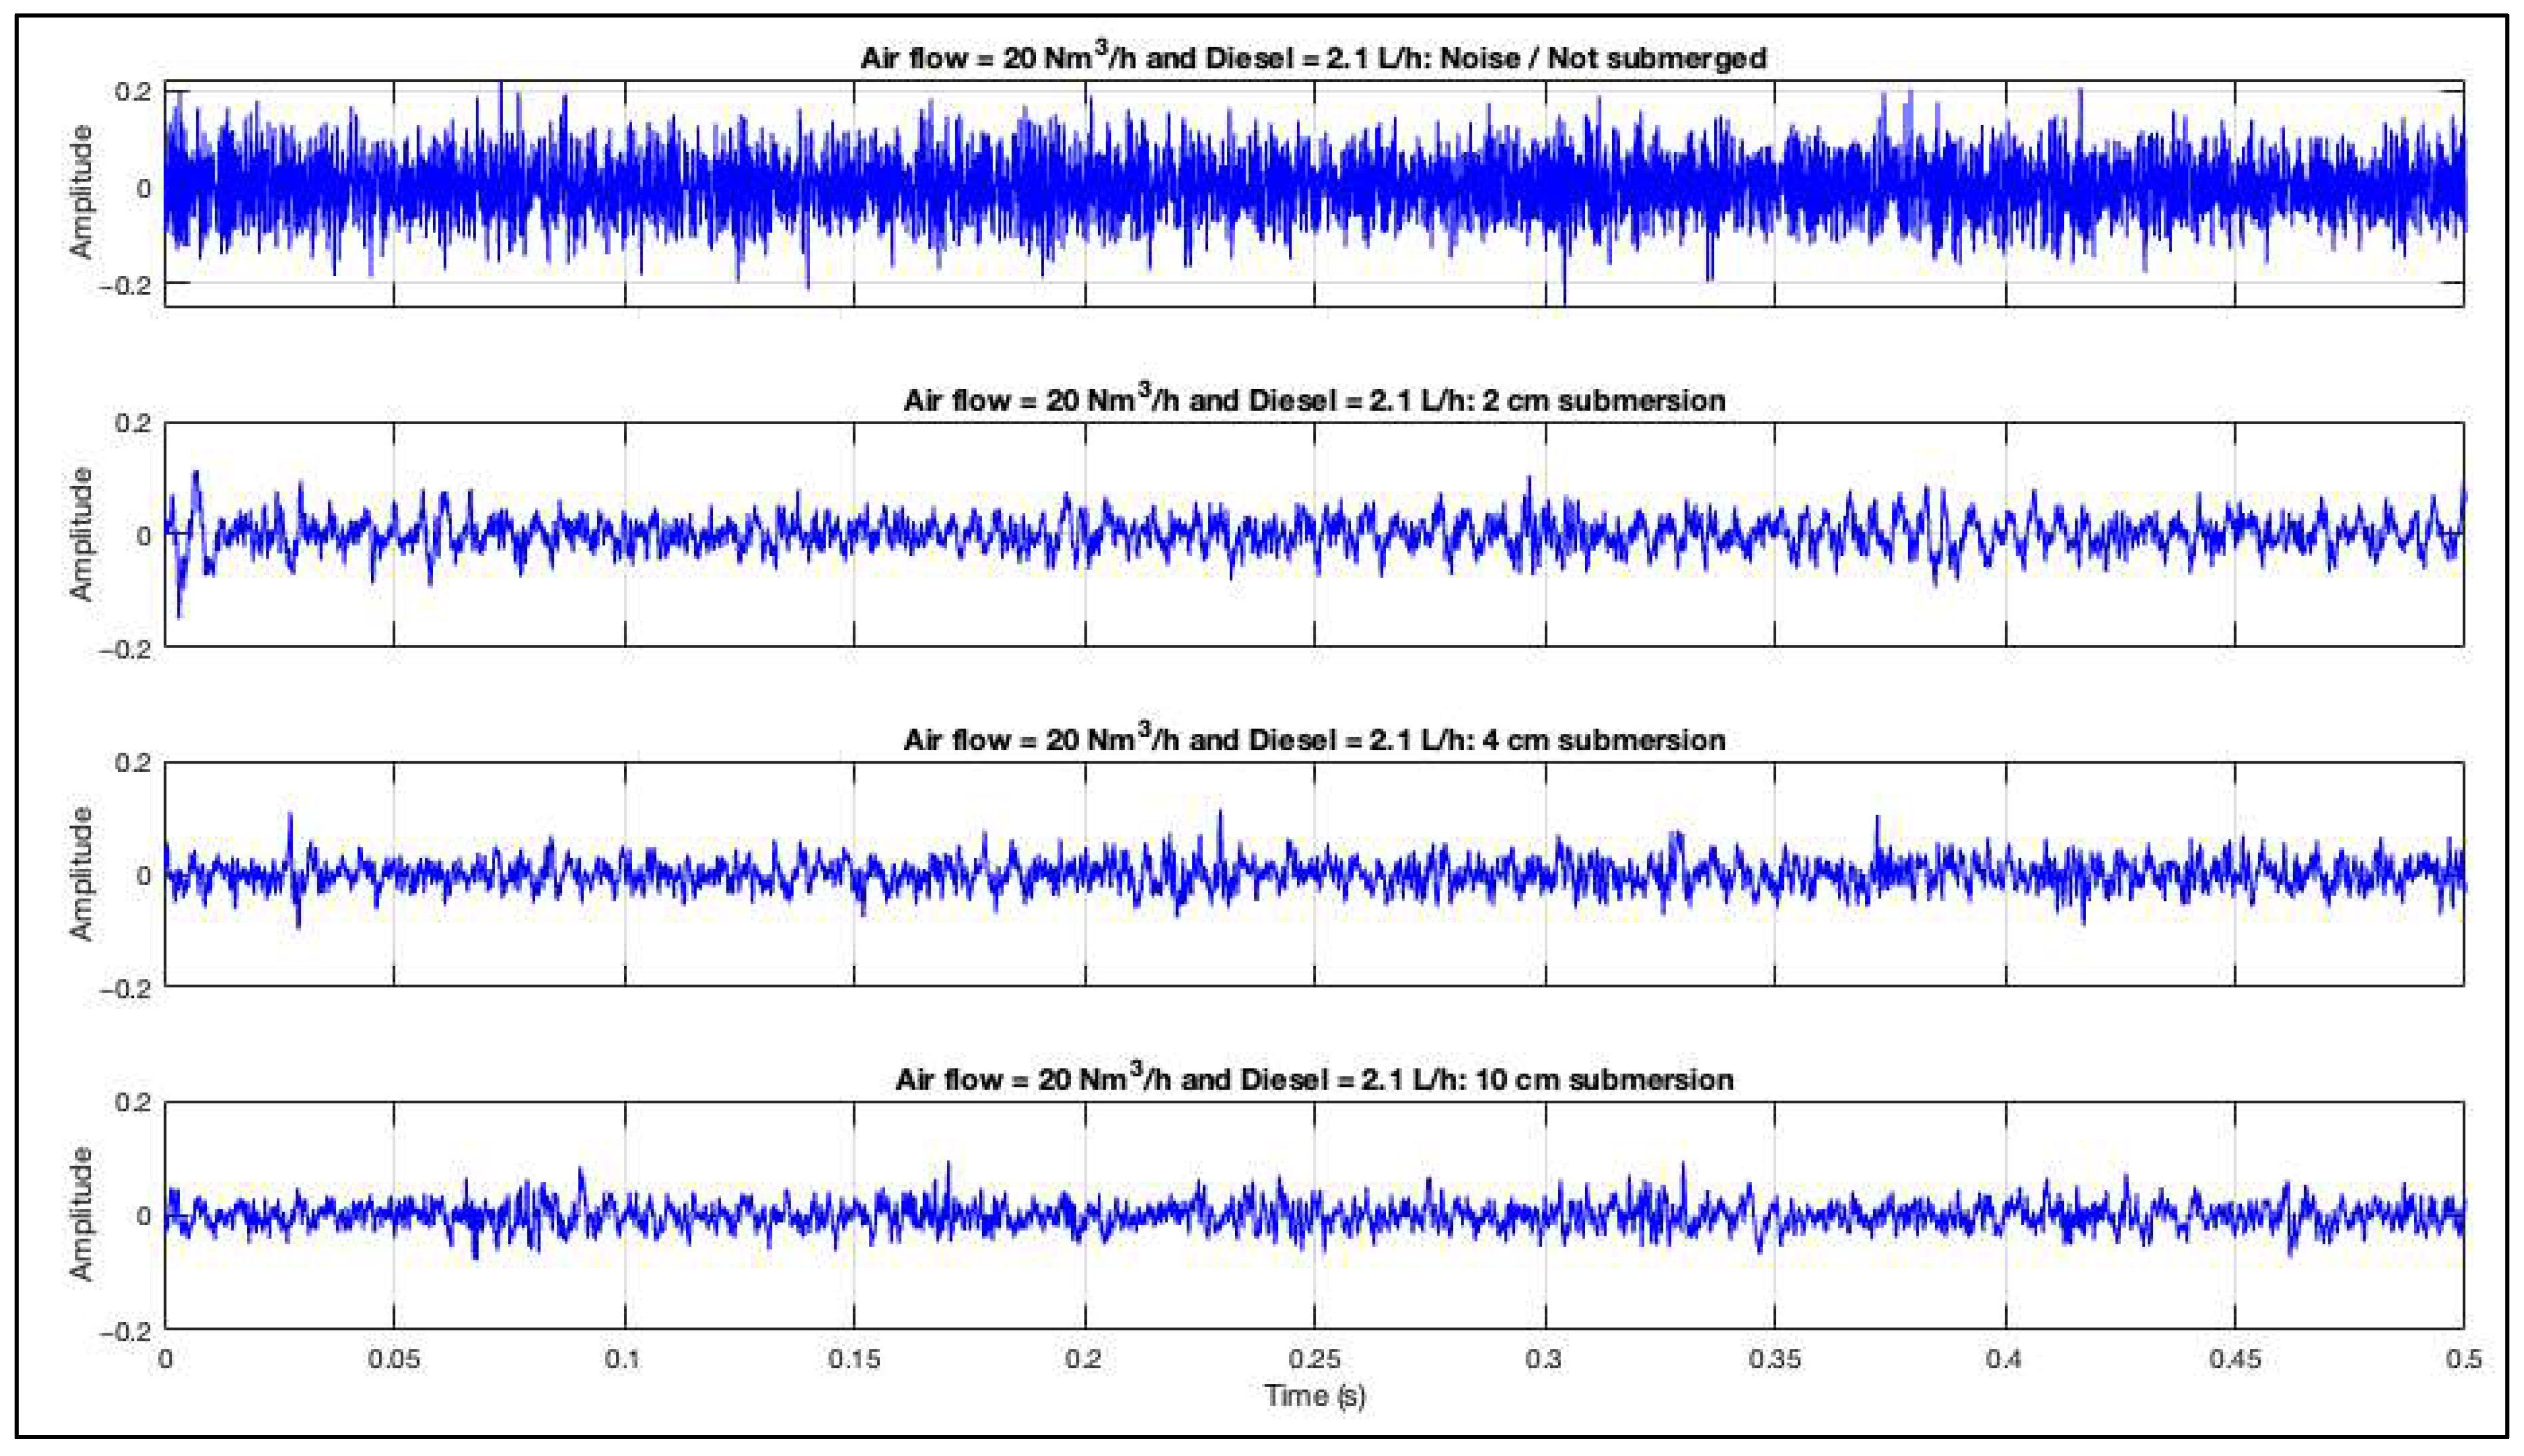
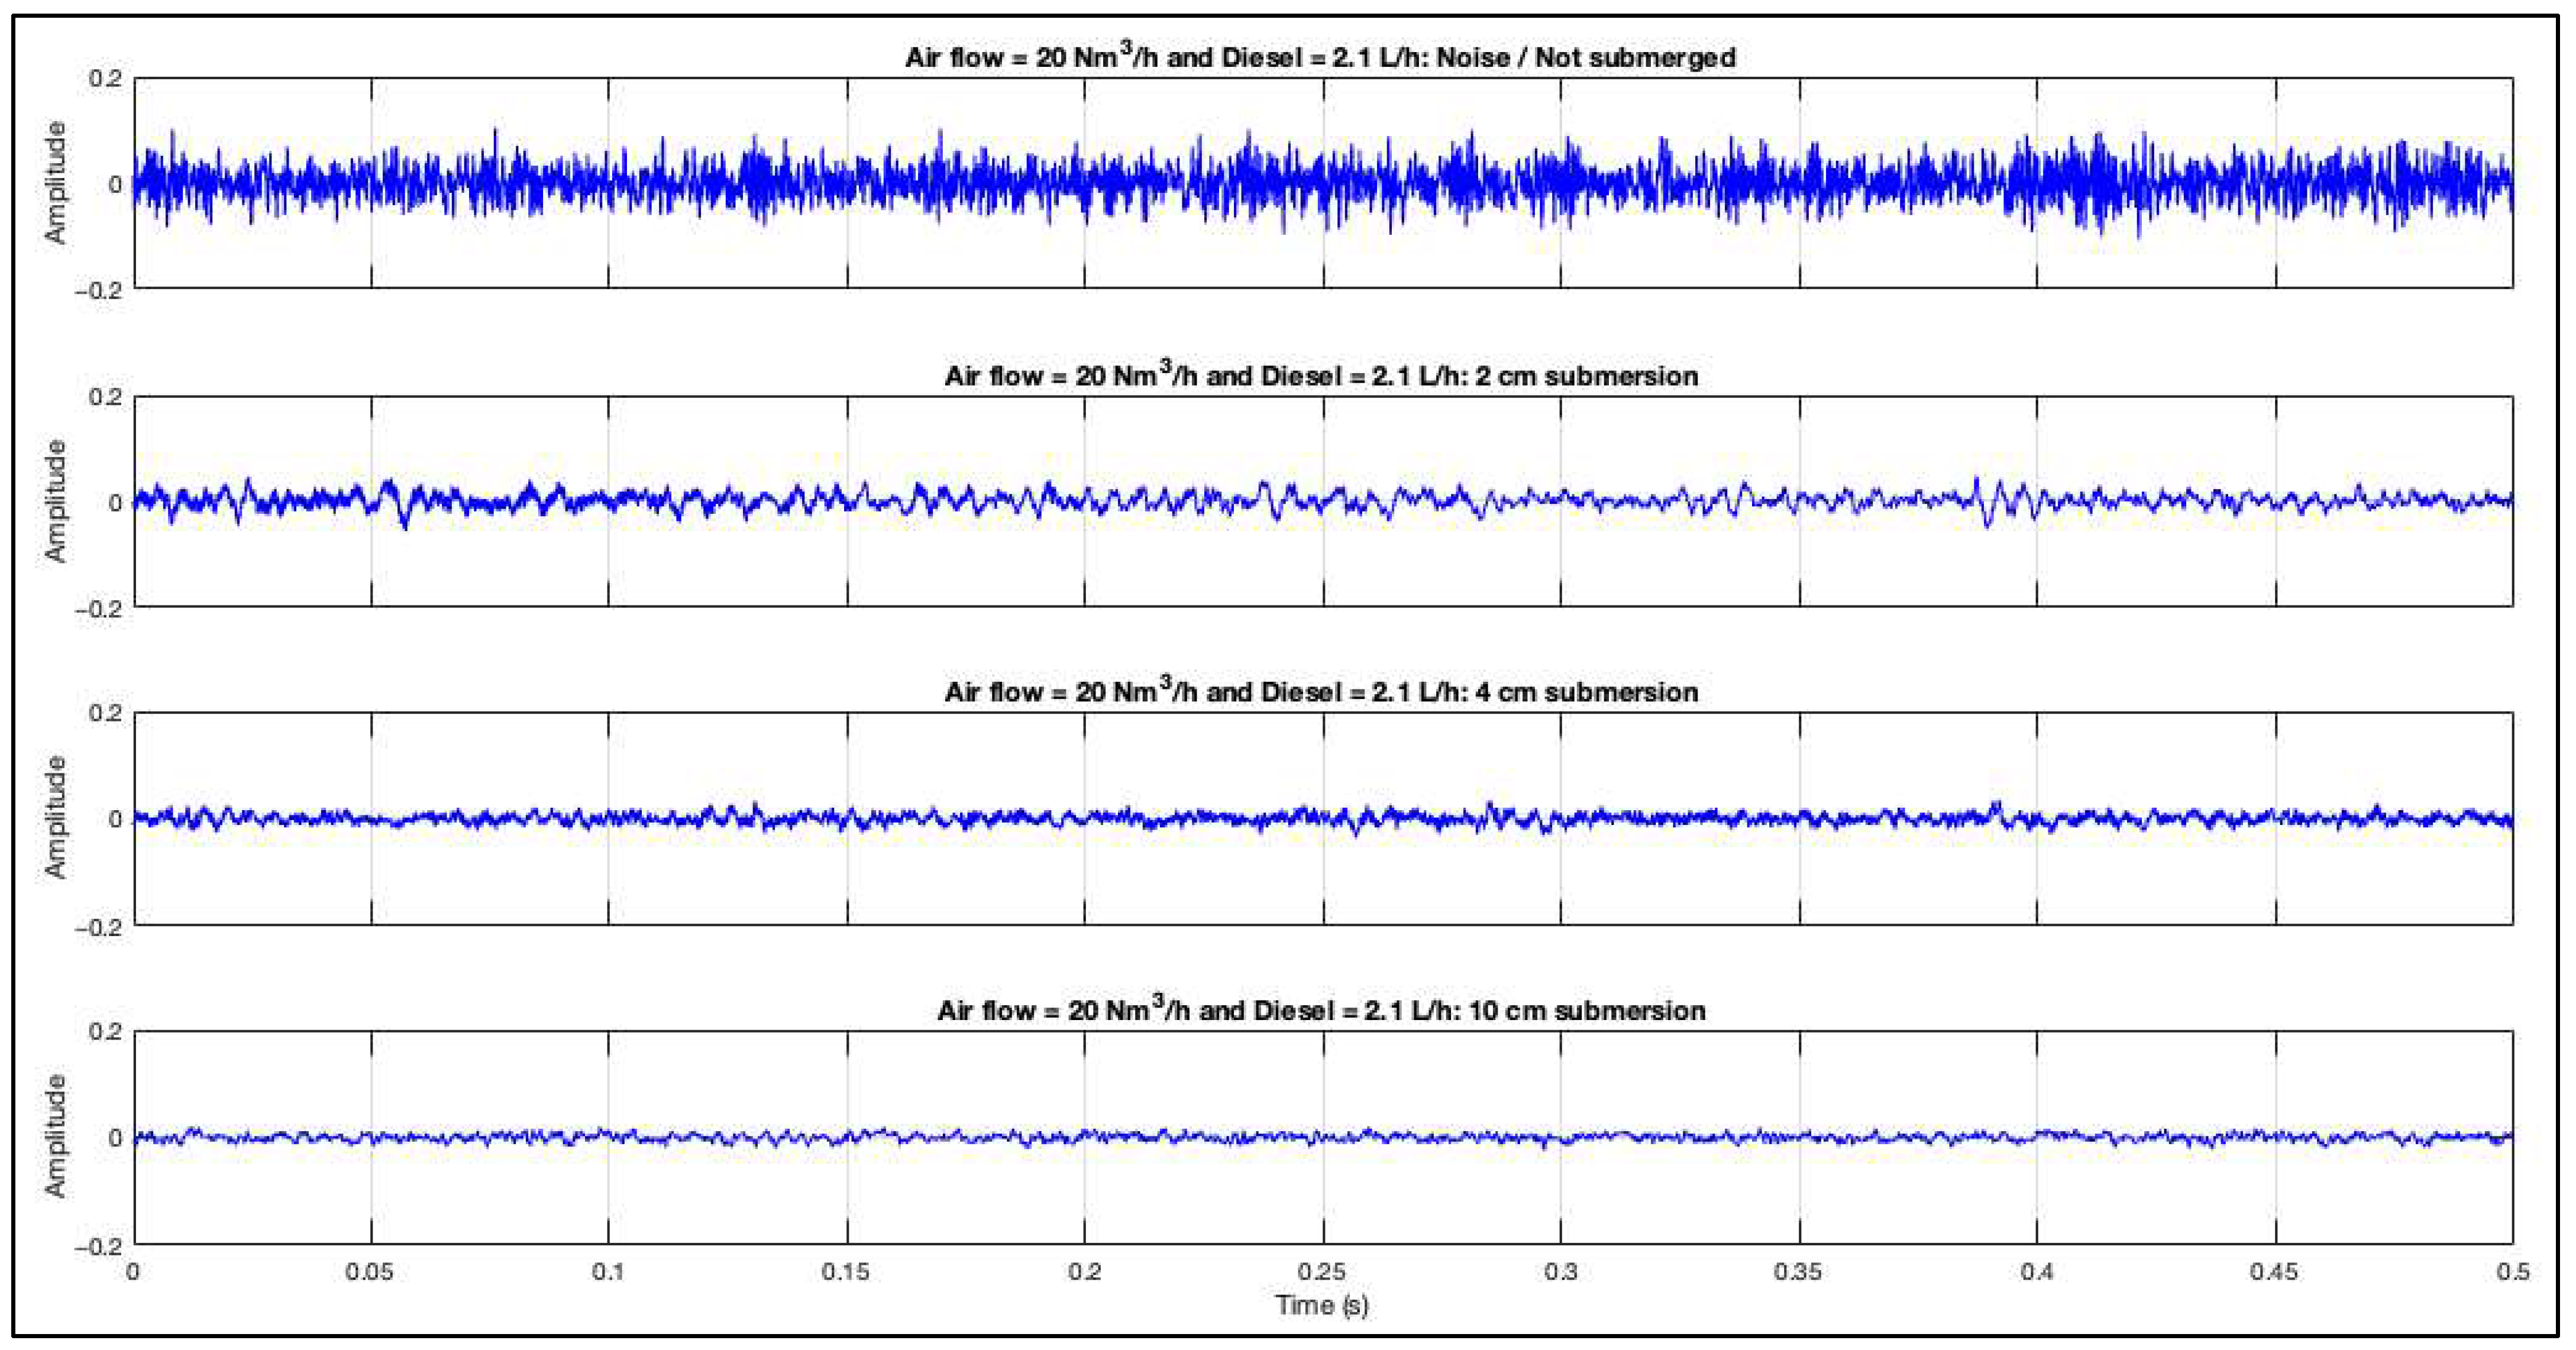
The laboratory-scale TSL trials were carried out under near-stoichiometric lance combustion, with air flow rates of 20, 30 and 40 Nm3/h and corresponding diesel flows of 2.1, 3.2 and 4.2 L/h (lance dia. 14 mm). For each condition, the lance position was varied between a non-submerged state (lance combustion above the bath) and submersion depths of 2, 4 and 10 cm. Figure 12 and Figure 13 present representative time-domain acoustic signals for the 20 Nm3/h case recorded by the “top-positioned” microphone and the “bottom-positioned” microphone close to the bath, respectively. In all plots, amplitude is shown in relative (dimensionless) units and time in seconds, consistent with the signal definitions provided in Section 3.3.
The waveforms demonstrate a progressive reduction in recorded signal amplitude with increasing lance submersion. When the lance is not submerged, the top microphone records a high-amplitude signal, whereas the bottom microphone shows a weaker response. Once the lance is submerged, the signal amplitude decreases progressively from 2 cm to 10 cm for both microphones, with the strongest damping observed at 10 cm. This trend is consistent with increased attenuation of pressure fluctuations as acoustic waves propagate through the molten bath, furnace structure and surrounding air before reaching the microphones. In this context, attenuation refers to the reduction in measurable signal amplitude due to a combination of geometric spreading, viscous and thermal damping in the liquid phase, structural transmission losses and partial reflection at phase boundaries. The reduction in amplitude with increasing submersion depth suggests that pressure disturbances generated at the lance tip and within the bubble plume are increasingly damped by the surrounding molten bath before being transmitted to the external measurement location. However, the present time-domain analysis does not by itself distinguish between attenuation due to geometric spreading, viscous damping, structural filtering, or changes in bubble dynamics. Further frequency-domain analysis (Section 4.4) is therefore required to separate combustion-dominated contributions from bubble-related acoustic components. The observable difference between non-submerged and submerged operation confirms that the acoustic signal is sensitive to injection regime and microphone position. These results are qualitatively consistent with attenuation trends reported in BOF acoustic monitoring studies (Section 2.2), where increased foam or liquid depth reduced acoustic transmission.
Unlike the cold-model spectrograms shown earlier (Figure 8 and Figure 9), the acoustic response of the high-temperature TSL system requires additional post-processing because of phenomena that add complexity, such as combustion, turbulence, bubble formation, bubble collapse, slag splashing and echo. To isolate physically meaningful features, the recorded audio signals from the “top” microphone were analyzed in the frequency domain by computing the PSD (Section 3.3.3).
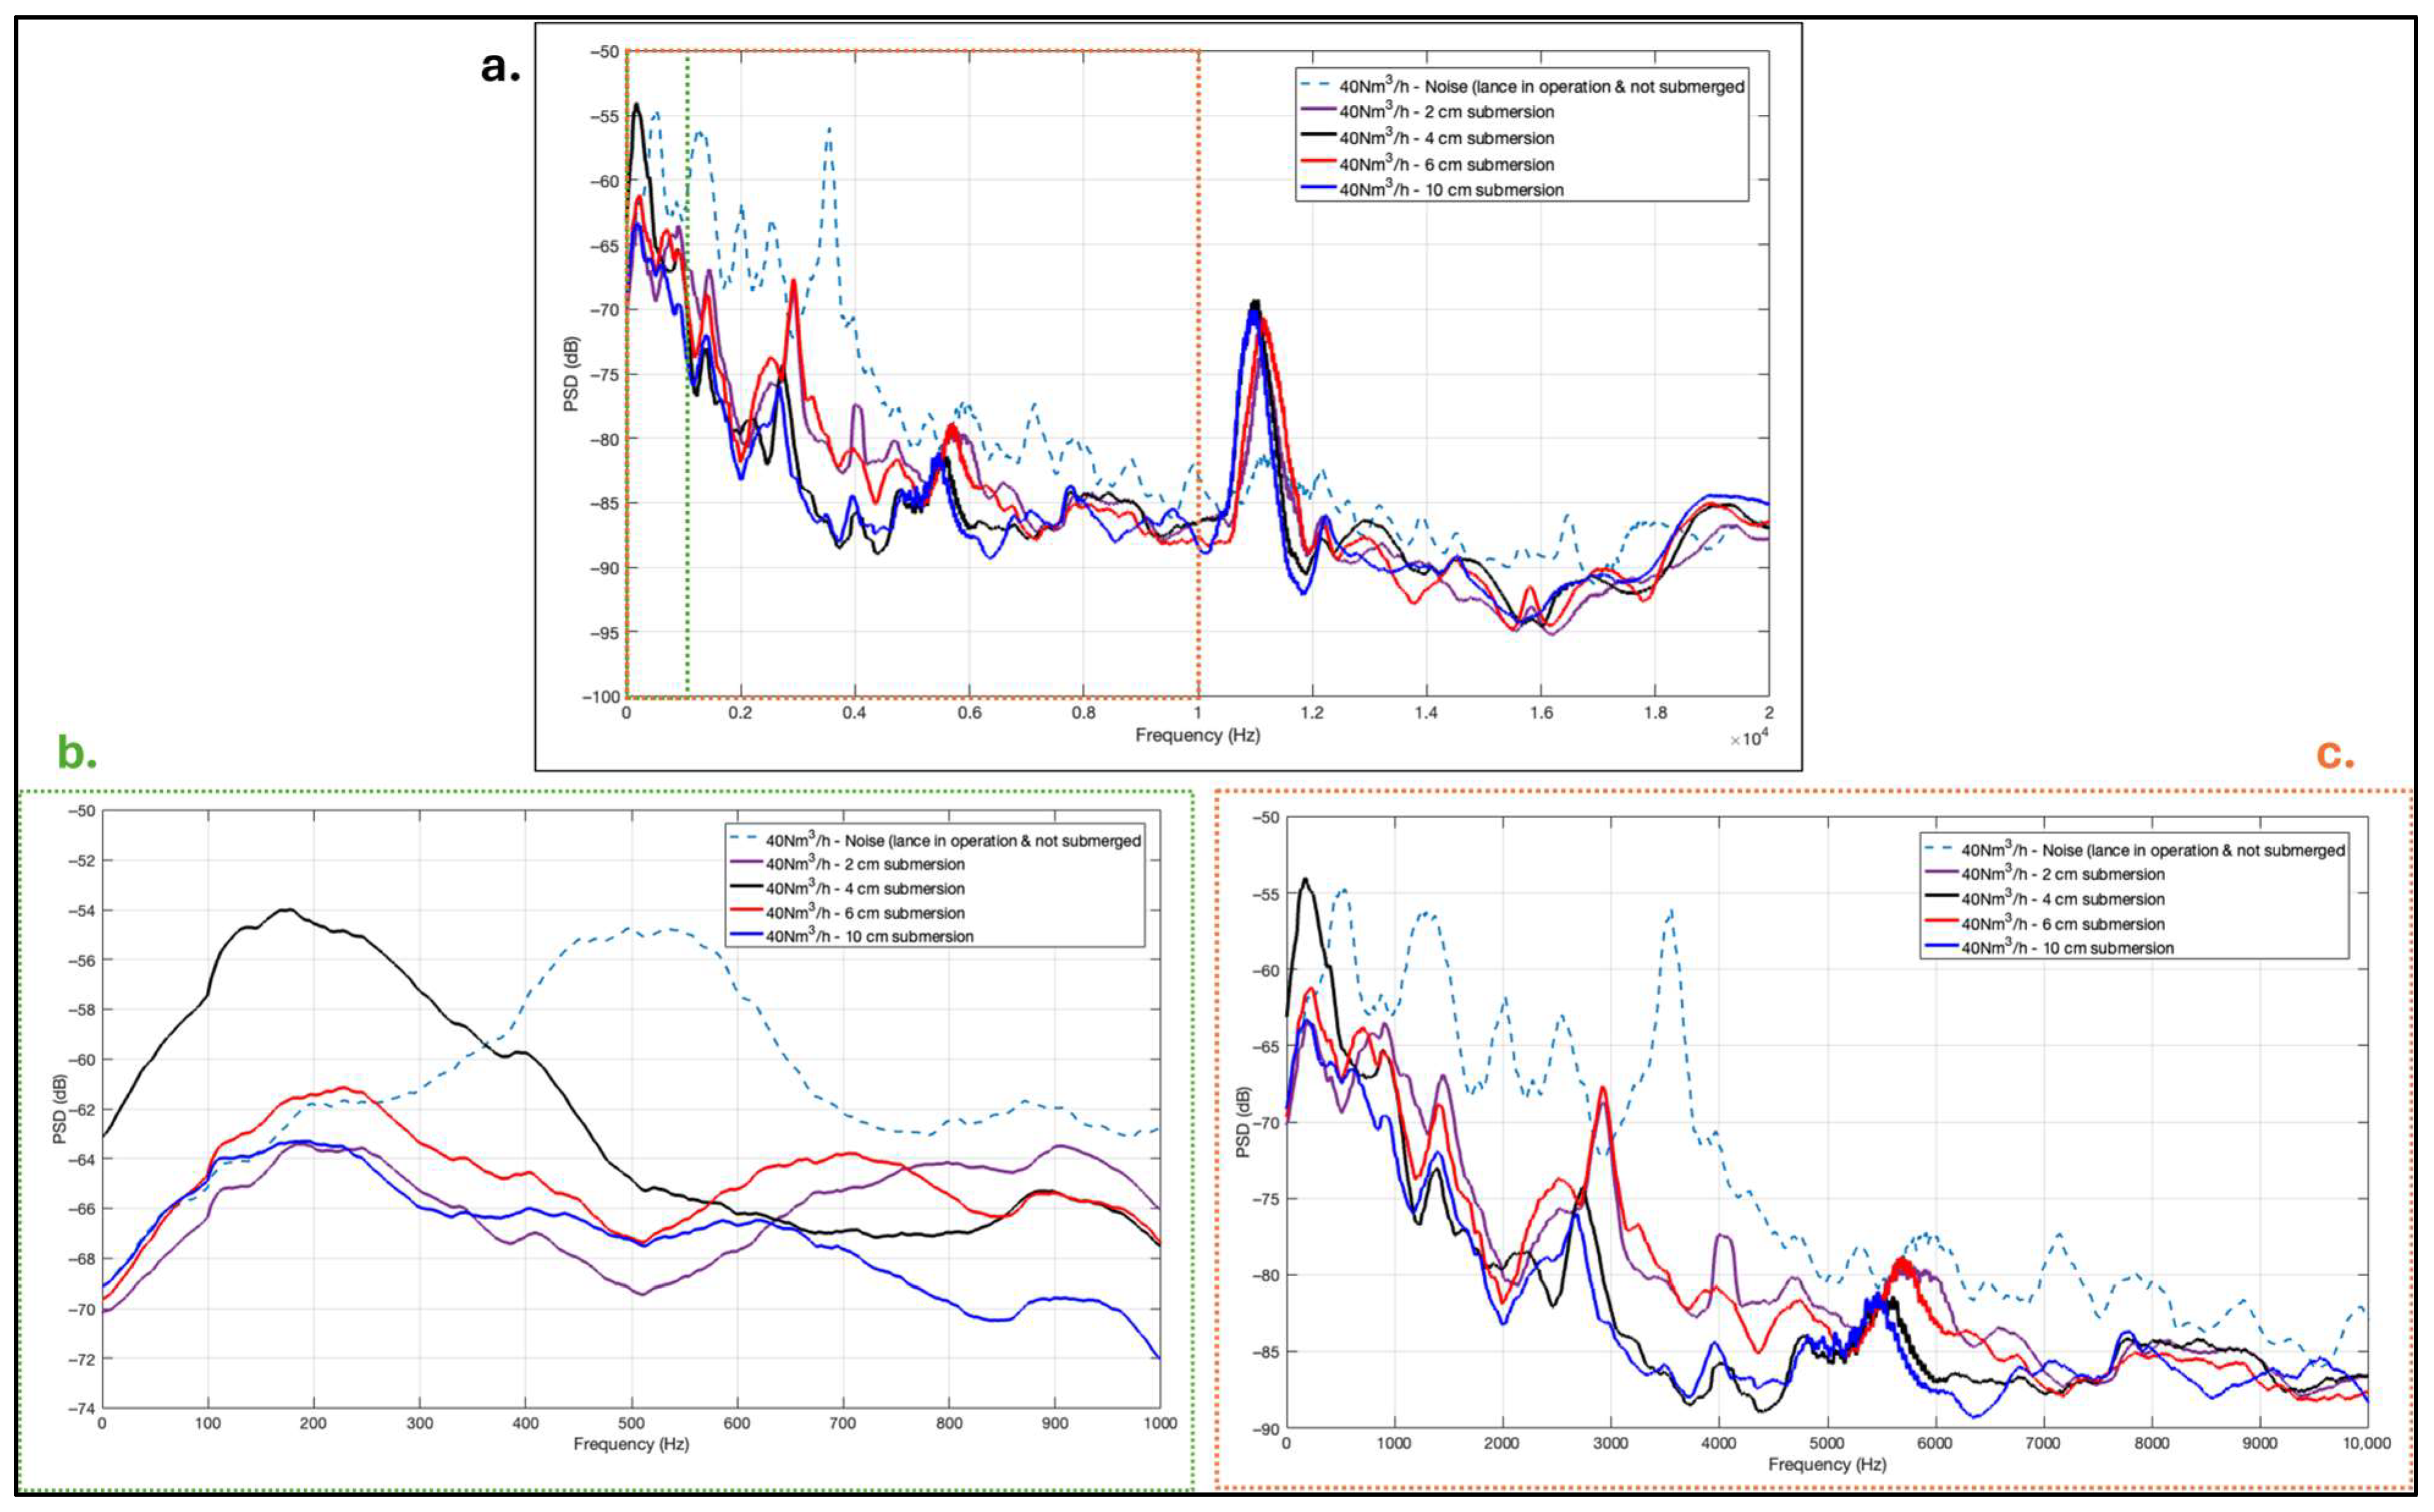
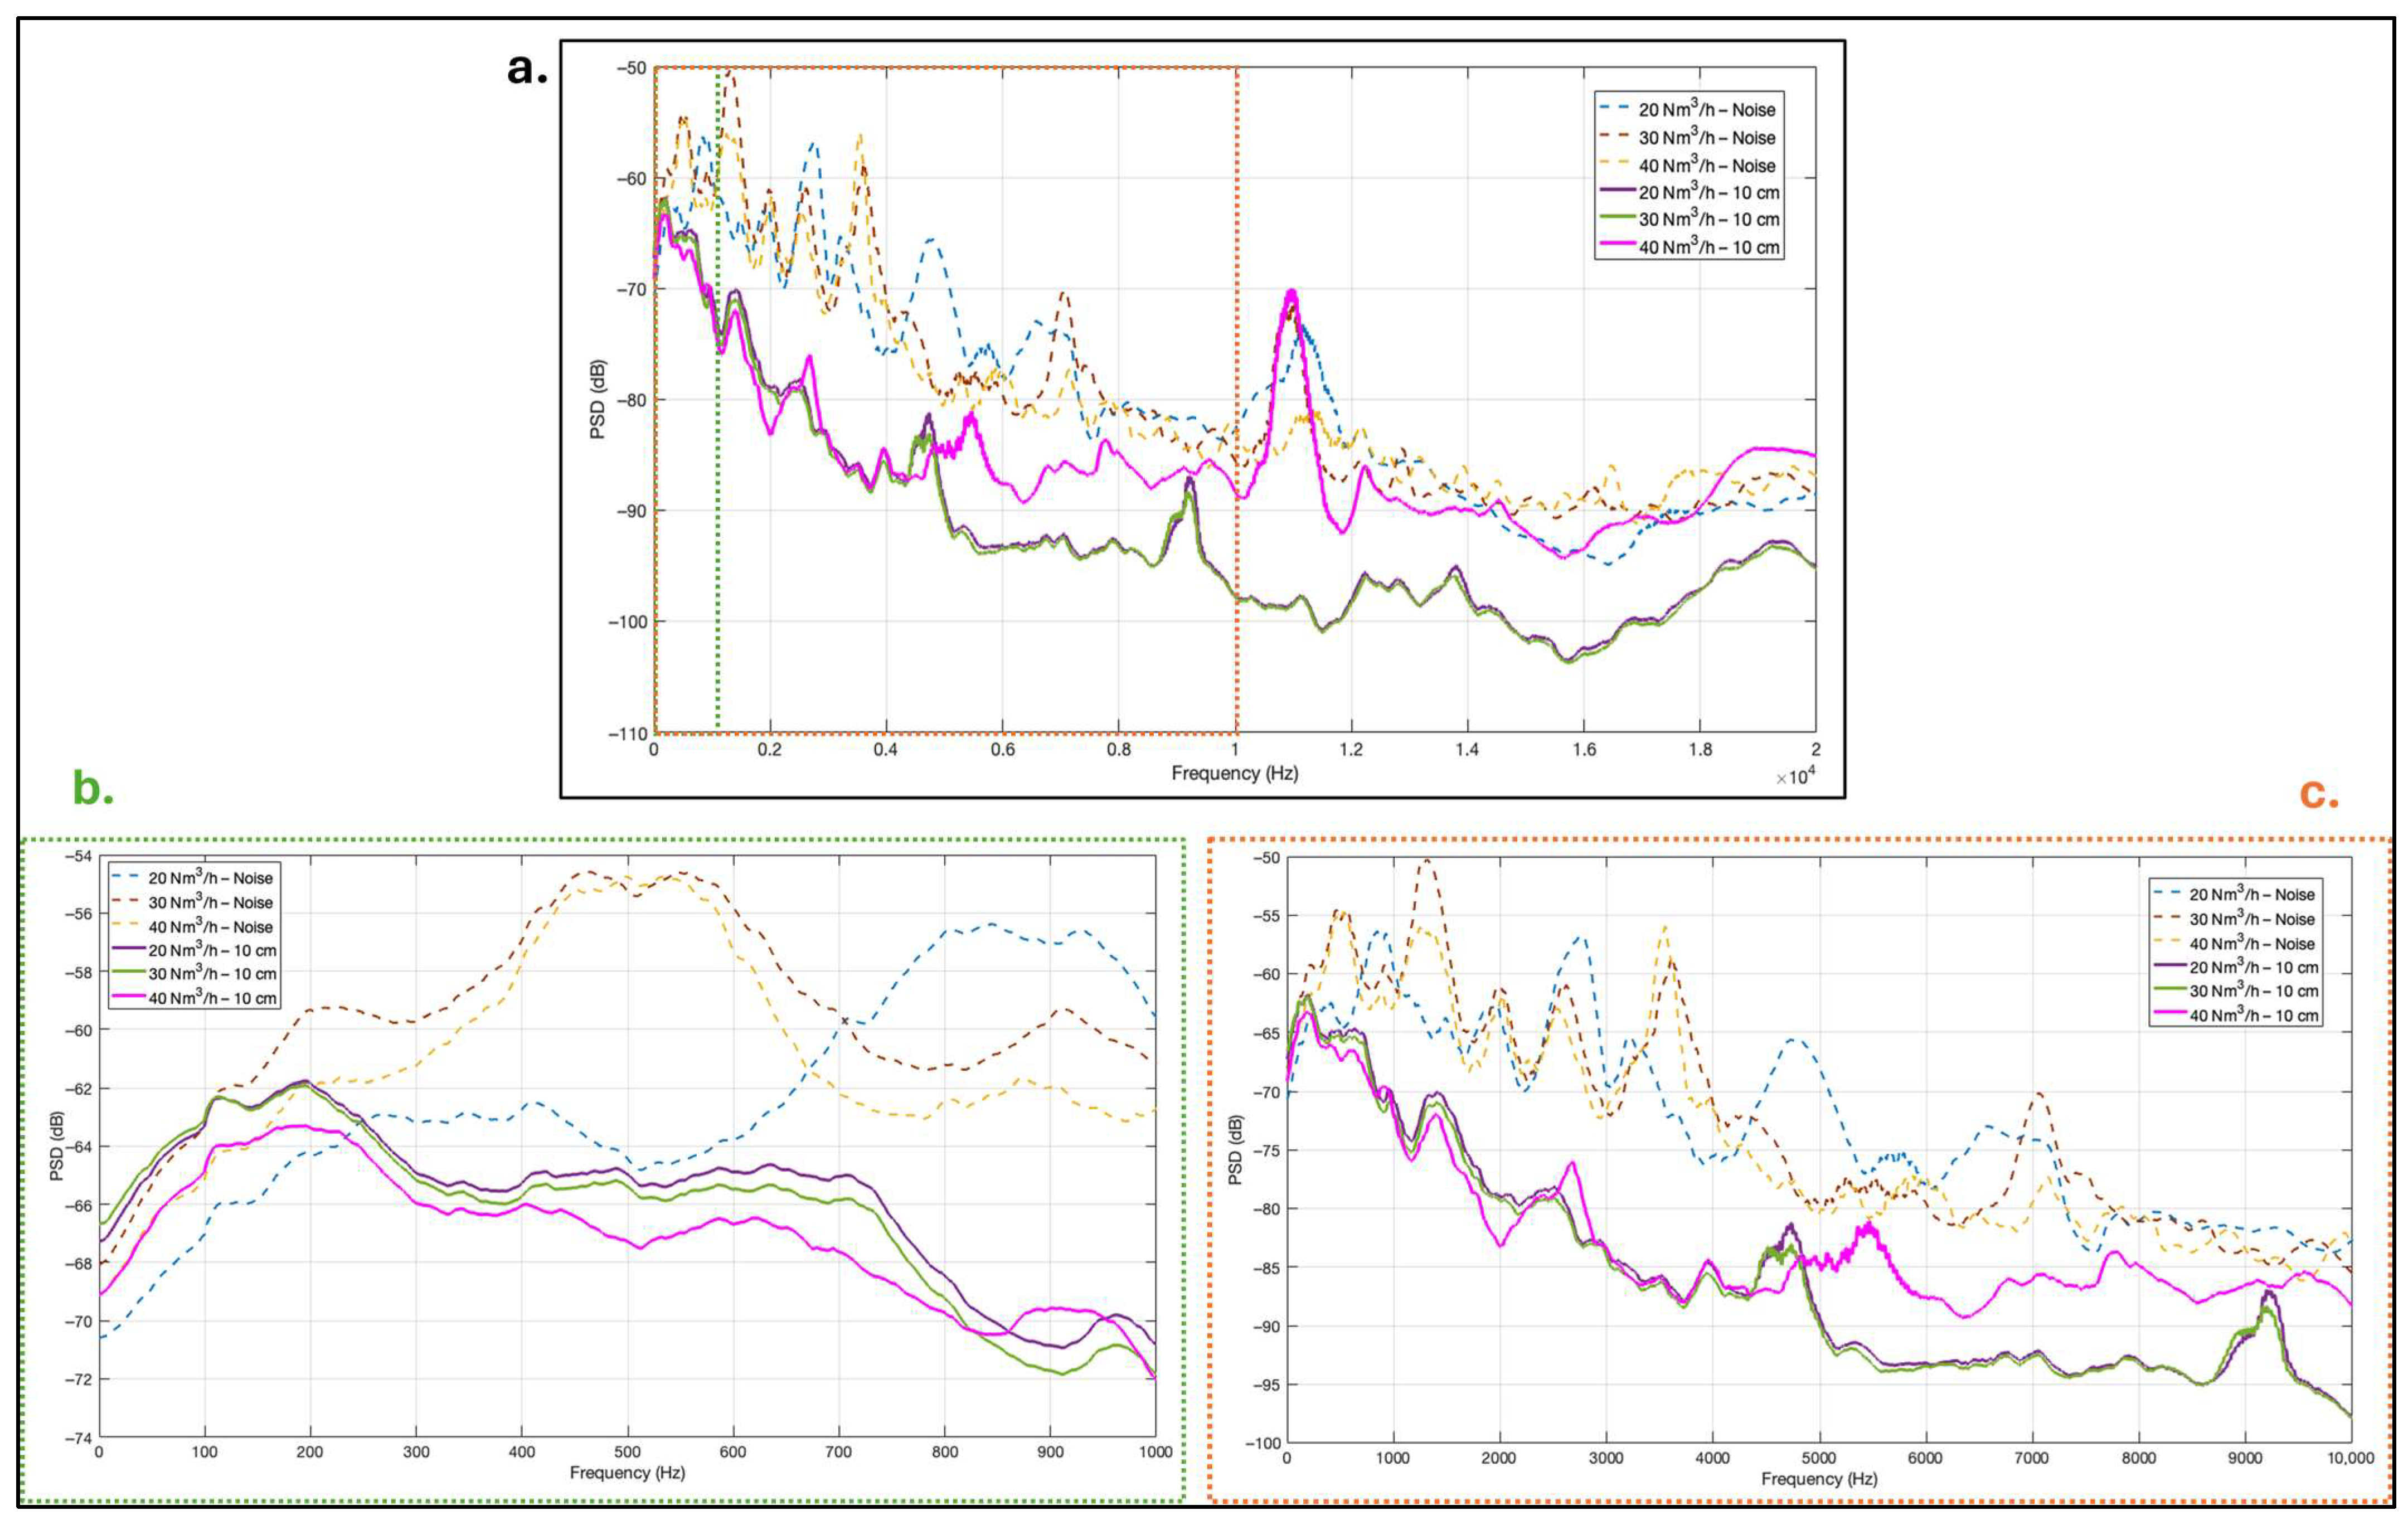
Figure 14 presents the smoothed PSD curves for three air flow rates (20, 30 and 40 Nm3/h) at 10 cm lance submersion, plotted together with their corresponding non-submerged “noise” baselines. Figure 14a shows the full frequency range, while Figure 14b and Figure 14c provide zoomed views of the low-frequency (0–1000 Hz) and mid-to-high frequency (1000–10,000 Hz) regions, respectively. In this context, “noise” refers specifically to the combustion noise of the lance when operated above the bath (i.e., non-submerged condition). The baseline measurements were recorded at identical air-flow rates, with the same microphone position and acquisition settings, but without bath interaction. Thus, the “noise” curves represent combustion-generated acoustic signal components only and exclude bubble formation, bath-driven turbulence and collapse phenomena. Separate background measurements confirmed that ambient laboratory noise was substantially lower in amplitude and did not exhibit structured spectral peaks in the investigated frequency range; therefore, it does not contribute to the features observed in Figure 14.
The following trends emerge:
  • The non-submerged “noise” spectra (dashed lines) consistently exhibit higher PSD levels across much of the frequency range, particularly in the low-frequency domain (Figure 14b). This is consistent with time-domain observations, where the top-positioned microphone directly captures combustion and freeboard-related acoustic signal fluctuations with minimal attenuation.
  • Upon lance submersion, the PSD level decreases across broad frequency bands. This reduction is consistent with attenuation of pressure fluctuations transmitted to the microphone due to propagation through the molten slag and refractory lining before reaching the microphone. The difference between non-submerged and submerged conditions is visible in both the full spectrum (Figure 14a) and the zoomed panels (Figure 14b,c)
  • For submerged operation at 20 and 30 Nm3/h, the PSD curves are relatively similar in overall magnitude and shape, particularly in the low-frequency range (Figure 14b). This suggests comparable injection dynamics and bubble activity under these flow conditions.
  • At 40 Nm3/h, the spectrum shows more pronounced and sharper spectral features compared to lower flow rates. While individual peaks are not clearly distinguishable in the full-range PSD (Figure 14a), the zoomed views (Figure 14b,c) reveal distinct spectral signals within the ~200–600 Hz and ~1–2 kHz ranges. At higher frequencies (>5 kHz), several peaks shift toward higher frequencies and additional spectral features emerge. In particular, a pronounced peak around ~11 kHz is observed at 40 Nm3/h, although a similar feature is partially present in the corresponding noise condition, indicating that contributions from combustion and structural sources cannot be excluded. The persistence of these features in both unsmoothed and smoothed spectra confirms that they originate from the measured signal rather than from the smoothing procedure. The increase in high-frequency content and the shift in peaks with increasing gas flow indicate stronger bubble-plume interaction and turbulence. However, the PSD analysis alone cannot clearly separate bubble-related signals from combustion and structural noise.
The PSD curves for different lance submersion depths (Figure 15) show that low-frequency PSD levels (<200 Hz) are generally higher for all submerged cases relative to the non-submerged baselines. This low-frequency enhancement is consistent with bulk hydrodynamic motions such as bath sloshing, large-scale plume oscillation and quasi-periodic bubble release events. In viscous media, higher-frequency pressure fluctuations generally experience stronger viscous and thermal damping than lower-frequency components [83,84,85]. This frequency-dependent attenuation provides a plausible explanation for the relative persistence of low-frequency spectral components under submerged conditions. A localized peak is observed at ~25 Hz for the 4 cm submersion. This feature may reflect enhanced surface or plume oscillation under intermediate submersion conditions; however, the present PSD analysis does not uniquely identify the underlying mechanism. Additional peaks appear around ~200 Hz and ~600 Hz, which are consistent with intermediate-scale hydrodynamic activity, potentially associated with bubble interactions and turbulent plume fluctuations. All submerged cases show a strong, narrow peak around ~1.5 kHz. The presence of this peak across all submersion depths suggests a repeatable high-frequency excitation mechanism during submerged operation. The characteristic oscillation frequency of gas bubbles scales inversely with bubble radius. Accordingly, lower-frequency components are generally associated with larger bubble structures, whereas higher-frequency peaks (~1–2 kHz) are consistent with smaller-scale deformation or collapse events; however, this interpretation remains qualitative in the absence of direct bubble-size measurements. In addition, a pronounced narrow peak appears near ~11 kHz (previously displayed in MATLAB scientific notation as 1.1 × 10⁴ Hz). Since this peak position is essentially depth-independent, it is unlikely to reflect depth-controlled bubble-size variations. It is, therefore, more likely to represent a structural or acoustic resonance of the coupled furnace-lance-microphone system that is excited during transient collapse events.
Across the spectrum, the non-submerged (noise) signal is consistently higher due to direct line-of-sight exposure to combustion and mechanical noise. As the lance is submerged deeper, the PSD amplitude decreases, confirming that the slag layer dampens high-frequency pressure fluctuations more strongly than low-frequency components. This demonstrates that increasing submersion depth primarily enhances acoustic attenuation within the slag layer rather than shifting the characteristic collapse frequencies. In other words, submersion depth controls signal transmission and damping, whereas the dominant bubble-collapse spectral features (~1–2 kHz and ~11 kHz) remain approximately constant with measurement resolution. The principal peaks discussed (~25 Hz, ~200 Hz, ~600 Hz, ~1.5 kHz and ~11 kHz) are zoomed for better visualization.
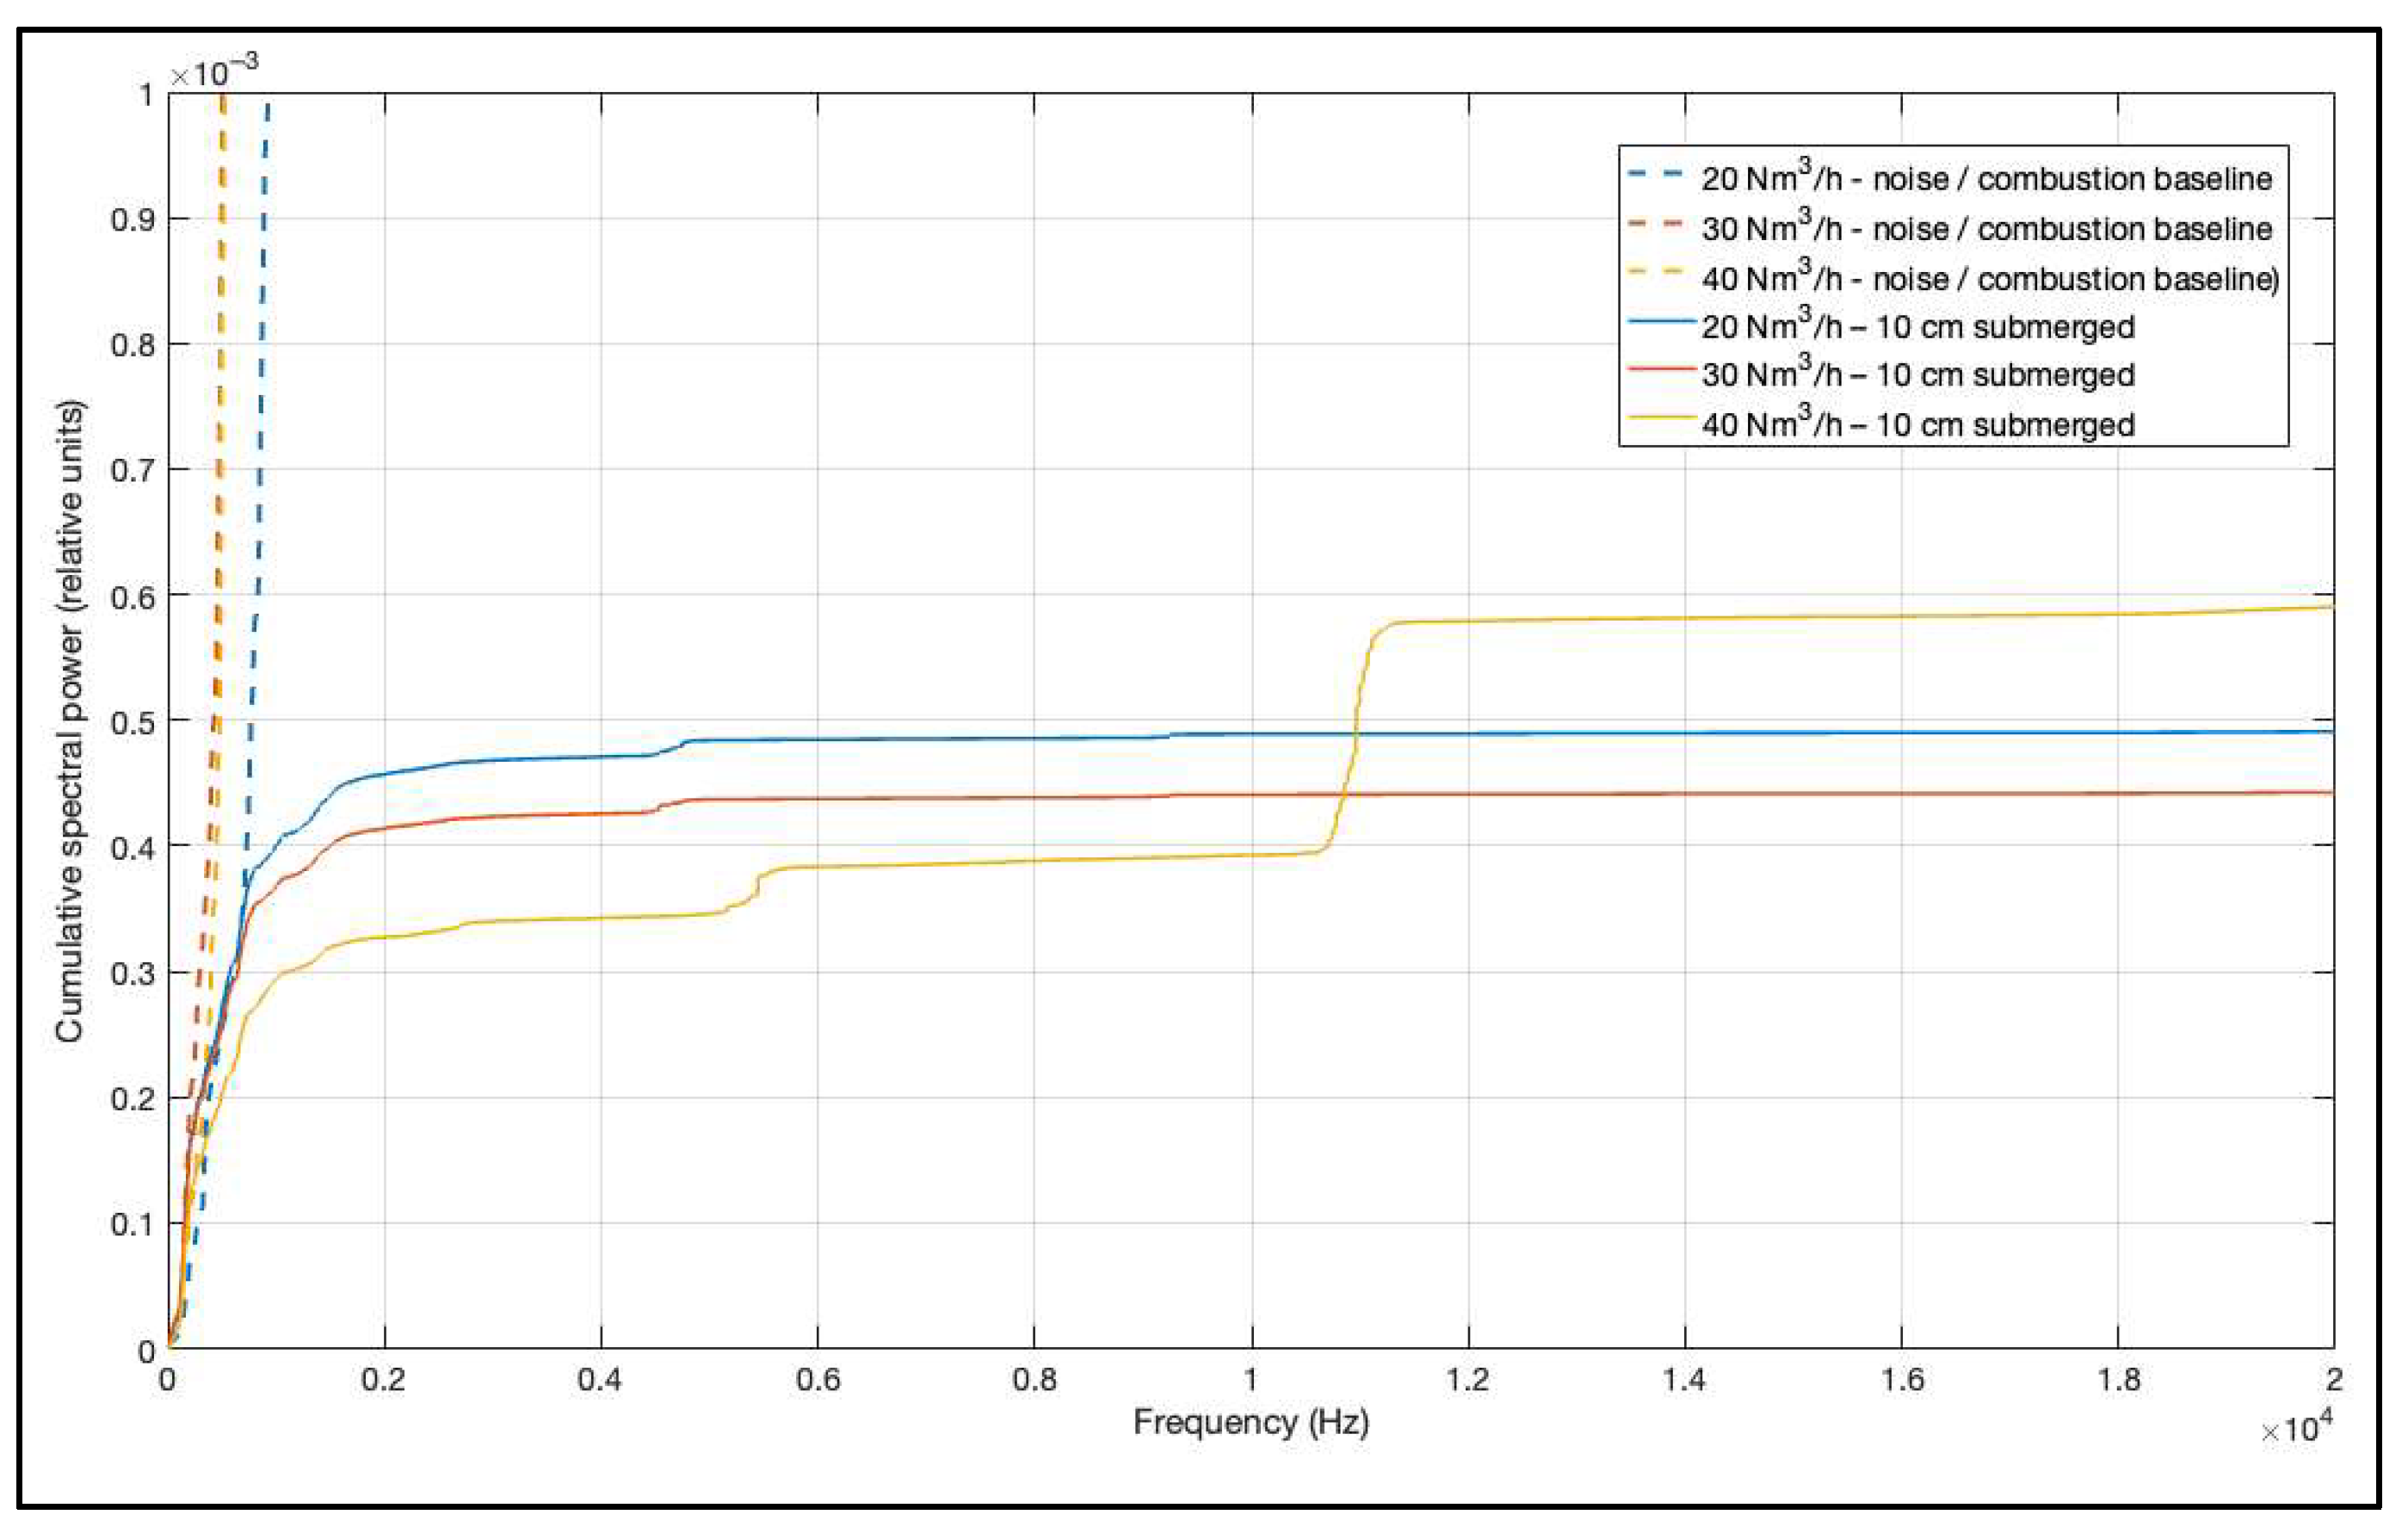
Figure 16 shows the cumulative spectral power for submerged lance conditions at 20, 30 and 40 Nm3/h, together with their corresponding non-submerged noise signals. The cumulative spectral power (see Equation (5)) is obtained by integrating the linear (non-dB) one-sided PSD over frequency, as defined in Section 3.3.4. The integration is performed on the PSD in linear units (relative amplitude2/Hz), since dB-scaled values cannot be directly accumulated.
E c ( f ) = 0 f P S D ( f ) d f
The final plateau value corresponds to the total integrated spectral power over the investigated frequency range. Notably, the plateau levels of the submerged cases are significantly lower than those of the non-submerged combustion baselines, indicating substantial attenuation of transmitted pressure fluctuations once the lance is immersed in the bath. The non-submerged baseline curves (dashed lines) accumulate spectral power rapidly in the low-frequency range, consistent with combustion, freeboard reflections (echo) and structural vibration dominating the acoustic field above the bath. In contrast, all submerged cases show a slower and smoother increase, consistent with the molten bath filtering out a portion of the high-frequency content. At 20 Nm3/h, the cumulative spectral power rises quickly below ~200 Hz and then levels off, indicating relatively limited high-frequency spectral contribution under these operating conditions. At 30 Nm3/h, the curve maintains a similar shape but shifts slightly downward, reflecting a redistribution of spectral contributions as gas momentum increases. At 40 Nm3/h, the cumulative spectral power shows an additional rise beginning near ~1.1 kHz, matching the high-frequency peaks observed in the PSD. The additional rise indicates an enhanced contribution of high-frequency components at this flow rate.

4.4. Pilot-Scale TSL Acoustic Measurements

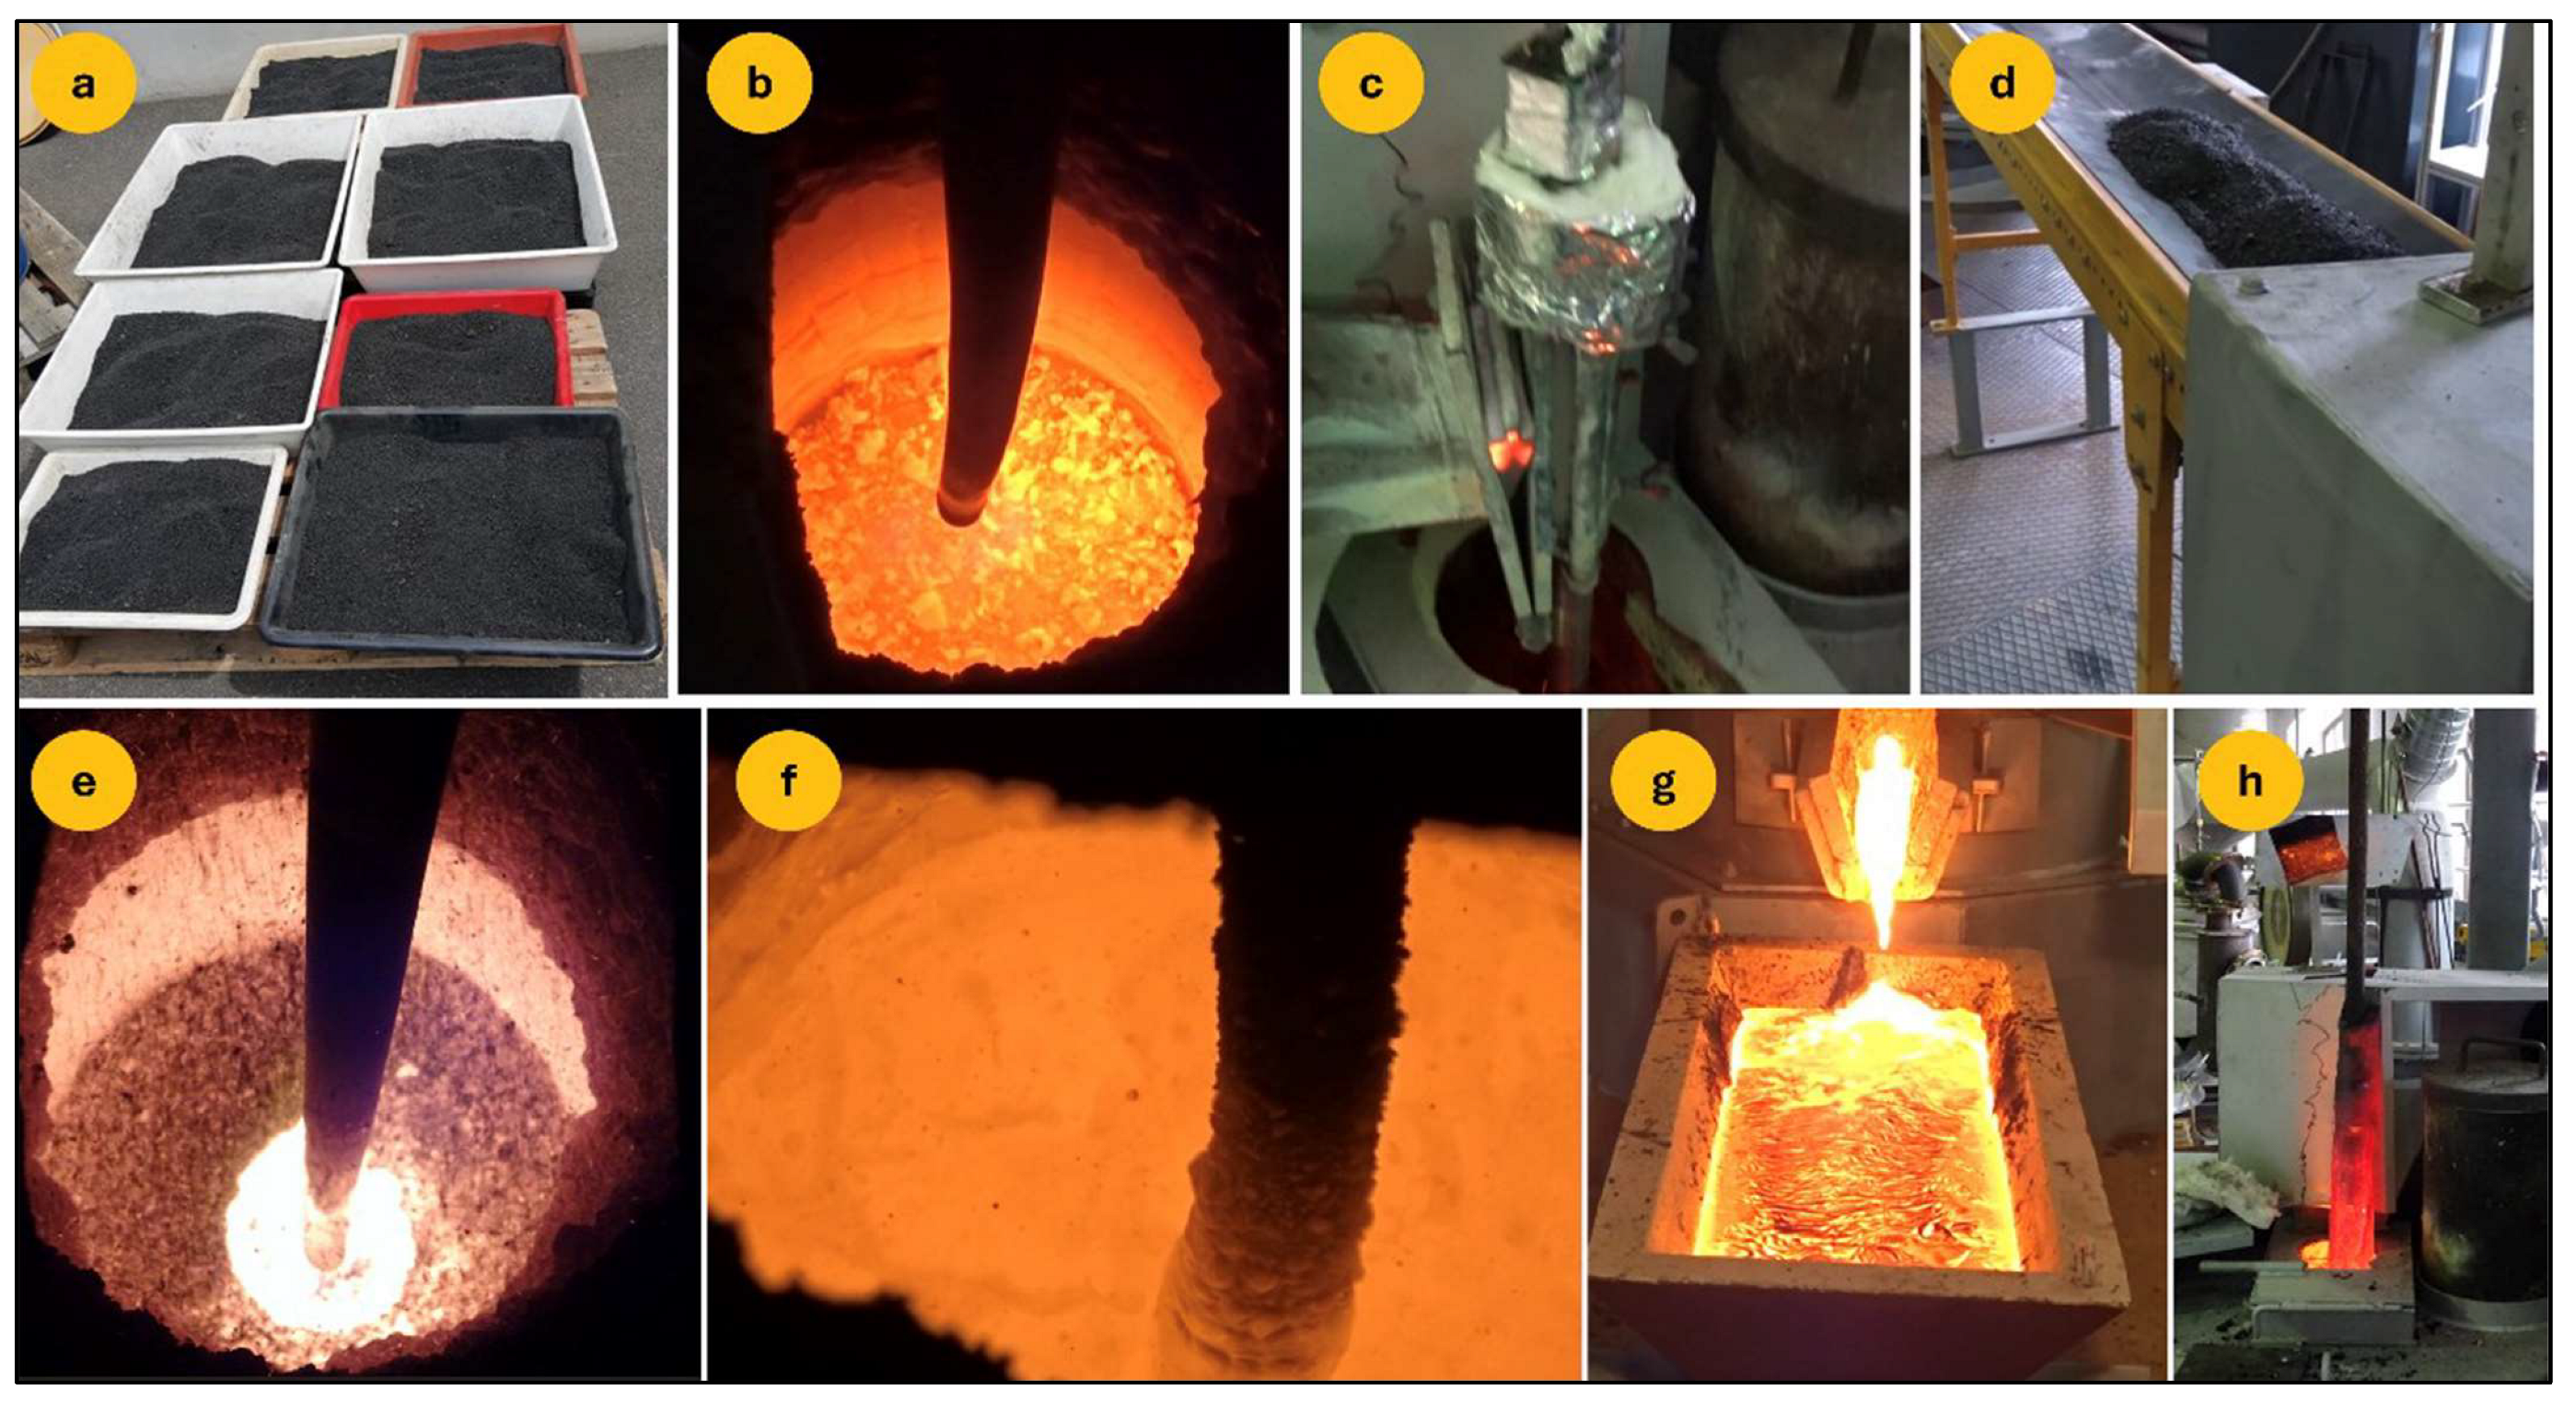
The pilot-scale TSL campaign was operated at a lance (diameter 32 mm) air flow of 120 Nm3/h and a diesel injection rate of 13 L/h, corresponding to near-stoichiometric combustion conditions. About 230 kg of fayalitic slag was charged into the furnace via a conveyor system (Figure 17), resulting in an approximate molten bath height of ≈450 mm. Two microphones were positioned outside the furnace; one directed toward the roof feed port (top microphone) and the other positioned near the lower vessel wall (bottom microphone). Both microphones were placed ~50 cm from the furnace shell. During operation, the bath temperatures were recorded at ~1200 °C and acoustic recordings were collected. Consistent with the laboratory-scale observations, the bottom microphone registered a weaker acoustic response, reflecting attenuation of pressure fluctuations through the molten bath and refractory. The top microphone, having partial line-of-sight to the freeboard region, captured the dominant acoustic signature and is, therefore, analyzed in detail.
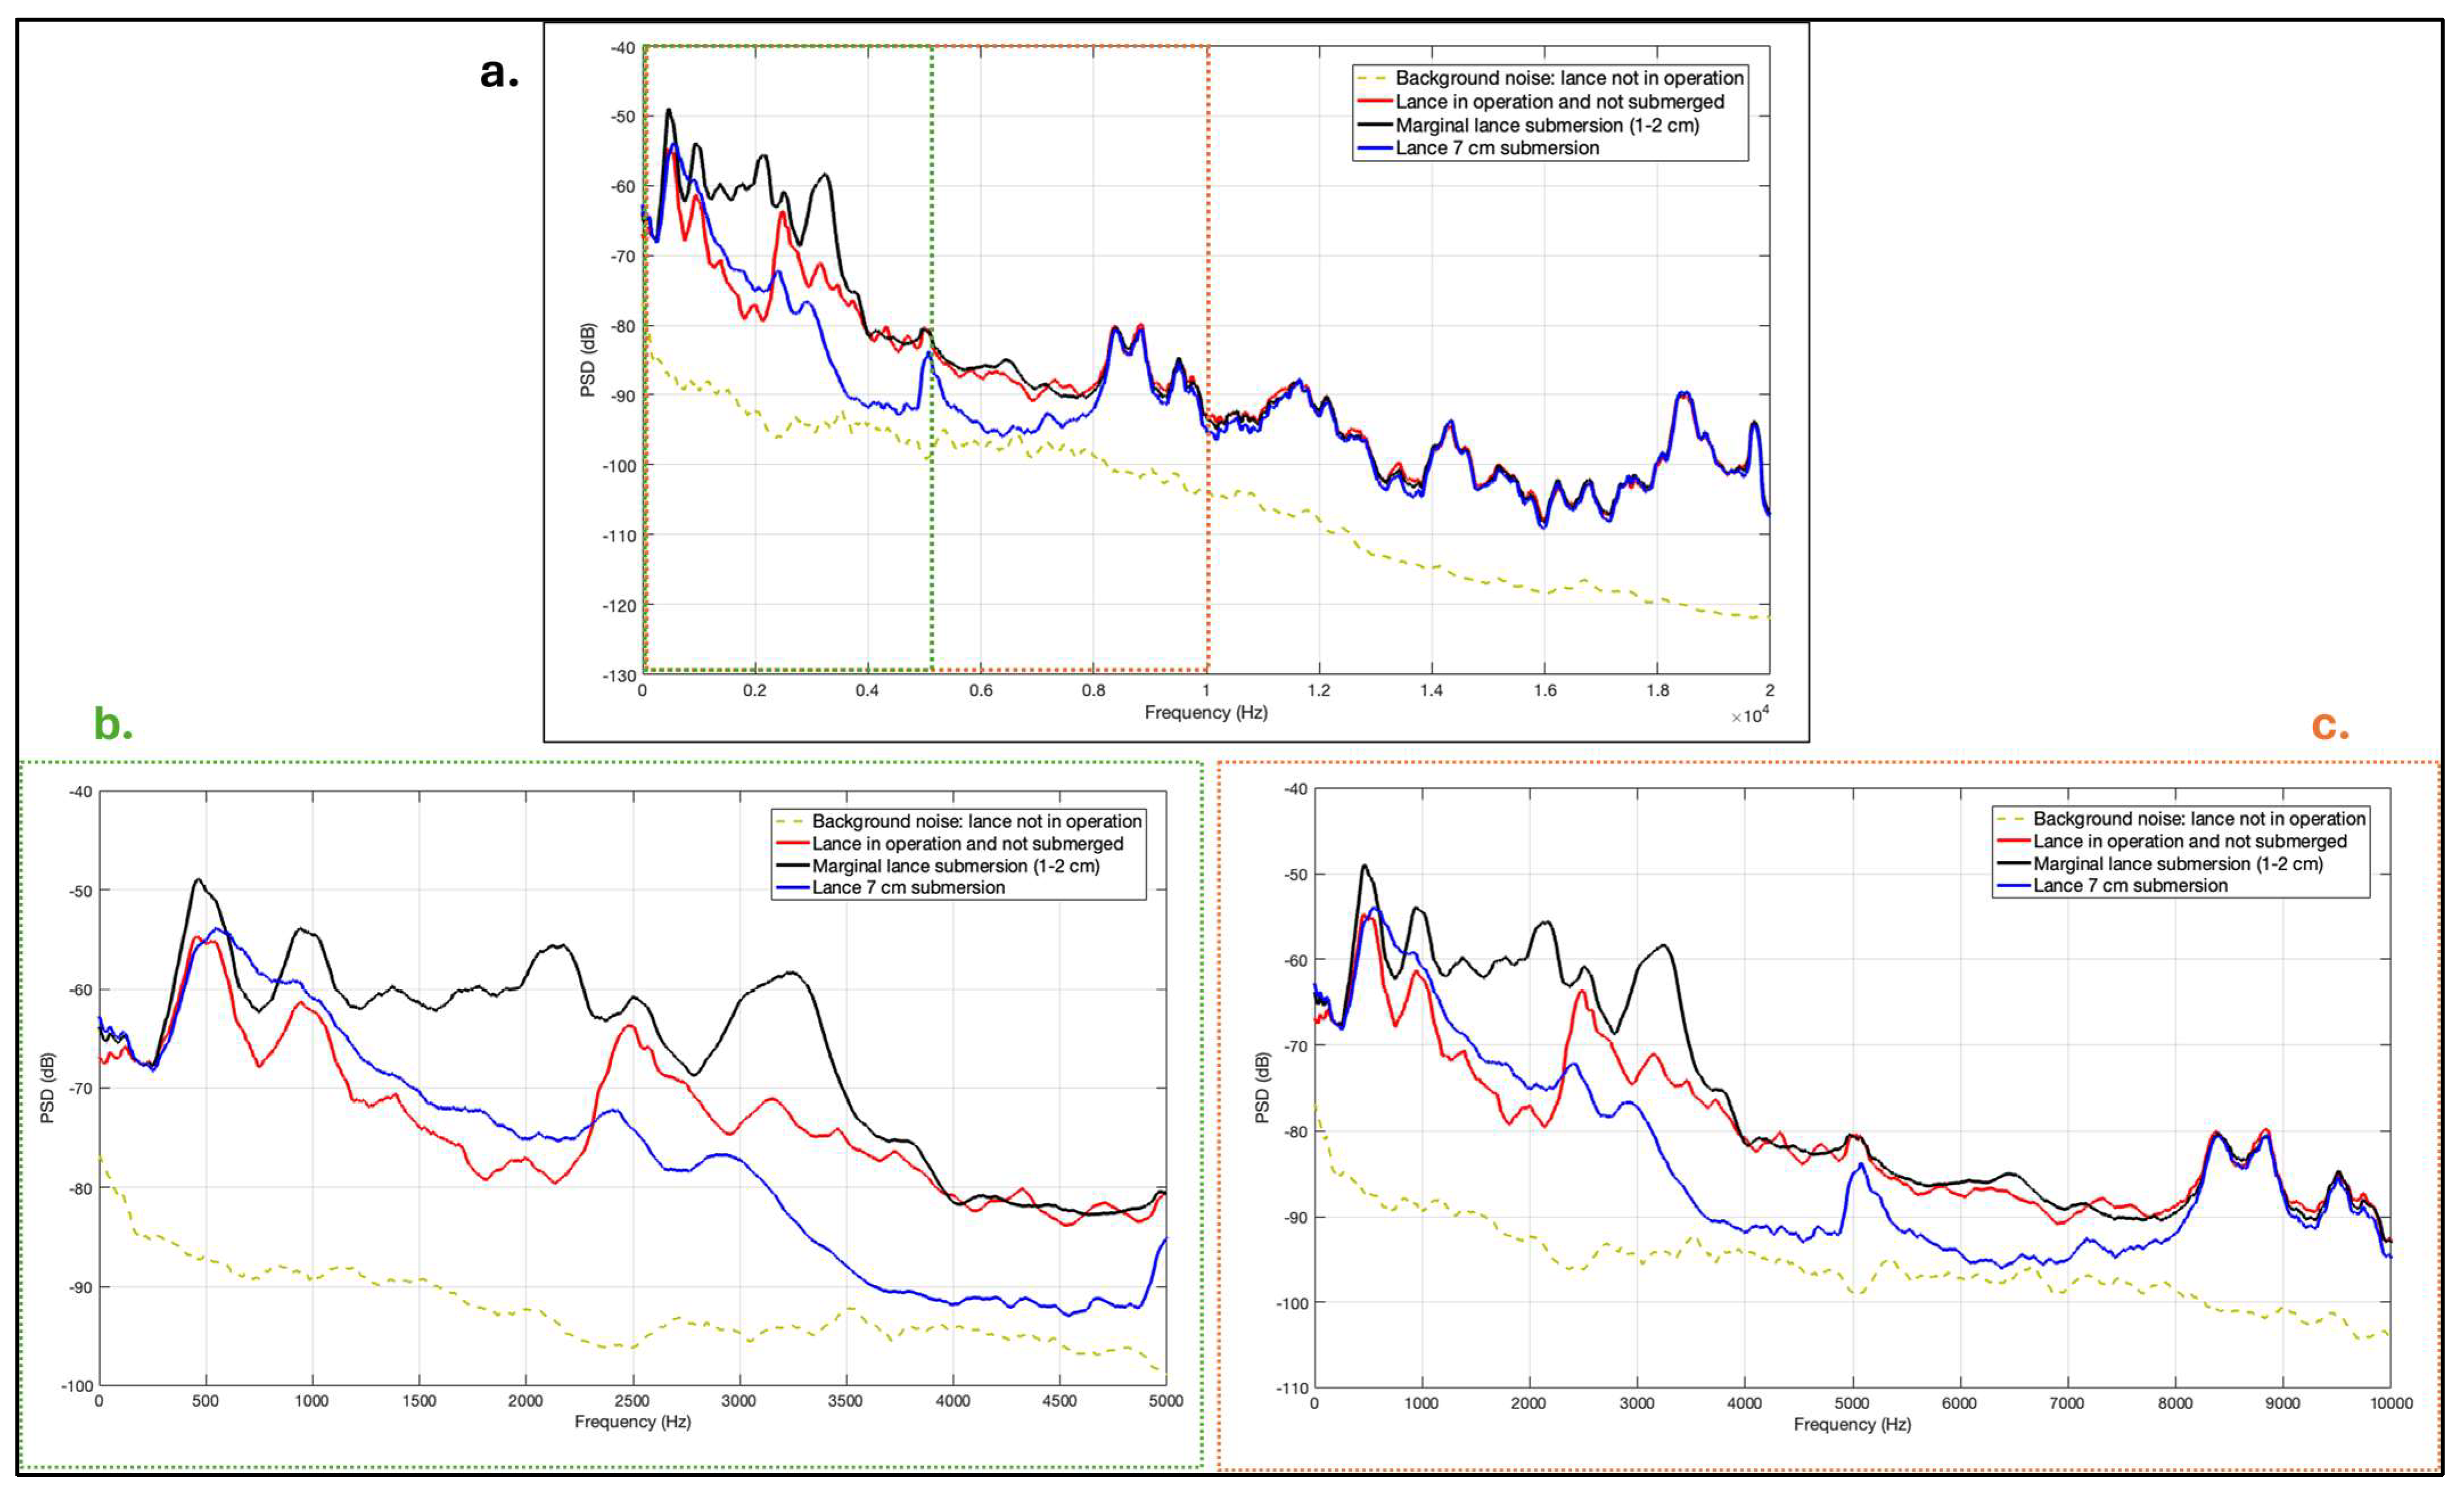
Figure 18 presents the smoothed PSD curves of the top microphone for four operating states: background noise (lance not in operation), lance operation above the bath (non-submerged), shallow submersion (~1–2 cm) and deeper submersion (~7 cm). Panel (a) shows the full frequency range, while panels (b) and (c) provide zoomed views of the low-to-mid (0–5 kHz) and mid-to-high (0–10 kHz) frequency regions, respectively, to clarify spectral features that are less visible in the full-range plot. The background noise curve exhibits the lowest PSD levels across the spectrum and represents environmental and equipment-related contributions (e.g., pumps and structural vibrations). When the lance operates above the bath, the PSD increases significantly in the 0.1–3 kHz region and develops broad peaks associated with combustion noise and acoustic reflections within the freeboard.
Submerging the lance modifies the spectral structure. In the low-frequency region (<~1 kHz), shown more clearly in panel (b), additional spectral undulations appear relative to the non-submerged case. These features are consistent with bubble formation, plume oscillation and bath-induced pressure fluctuations superimposed on the combustion baseline. The shallow submersion case shows higher PSD levels than the 7 cm case in this range, suggesting reduced attenuation and stronger transmission of bath-related pressure fluctuations. In the mid-frequency region (1–5 kHz), also visible in panel (b) and more clearly in panel (c), submerged operation exhibits structured peaks that differ from the smooth broadband combustion response observed in the non-submerged condition. At higher frequencies (>5 kHz), all operating curves gradually converge and follow a similar slope (panel c), indicating that structural vibration and combustion-related broadband noise dominate in this range. The relative differences between shallow and deeper submersion become less pronounced, supporting the interpretation that high-frequency components are more strongly attenuated within the slag and that submersion depth primarily affects transmission magnitude rather than peak location.
Figure 19 shows the cumulative spectral power of the pilot-scale trials for four operating conditions at 120 Nm3/h air flow rate and 13 L/h diesel. The background signal (lance not in operation) remains close to zero over the whole spectrum, indicating that ambient noise and equipment hum contribute only marginal spectral power. When the lance is combusted above the bath, the cumulative spectral power rises rapidly below about 300 Hz and then levels off, indicating that freeboard combustion, echo and vibrations contribute predominantly low frequencies.
Once the lance tip is marginally submerged (~1–2 cm), the cumulative curve increases substantially, exceeding the freeboard case. This indicates that interaction at the slag-gas interface introduces additional pressure fluctuations beyond combustion alone. At shallow penetration depth, bubble formation, intermittent surface rupture and localized splashing occur close to the free surface, where acoustic transmission to the external microphone is minimally attenuated. This results in higher cumulative spectral power compared with non-submerged operation.
At 7 cm submersion, the total spectral power drops again and the curve sits only slightly above the freeboard condition. This reduction suggests that as bubble formation and collapse occur deeper within the slag bath, a larger portion of the generated pressure fluctuations is attenuated before reaching the furnace wall and microphone location. Thus, in the pilot-scale configuration, submerged operation produces higher cumulative integrated spectral power within the analyzed bandwidth compared with the freeboard condition, reflecting the combined contribution of combustion and bath-induced excitation. At greater submersion depths, increased acoustic damping within the slag layer attenuates a portion of the transmitted pressure fluctuations, resulting in cumulative spectral power that is comparable to, but slightly moderated relative to, shallow submersion despite continued bubble activity.

4.5. Lance Motion Measurements

Lance motion was recorded using the tri-axial IMU described in Section 3.3.5. The X-axis represents relative vertical acceleration of the lance. Variations in this signal are interpreted as mechanical response of the lance to pressure fluctuations generated during gas injection beneath the bath surface, including bubble formation, detachment and plume oscillations.
Figure 20 shows the mean-centered vertical acceleration signal (X-axis) of the lance for four submersion depths at an air flow of 40 Nm3/h and 4.2 L/h diesel flow for the laboratory TSL unit. The 2 cm case exhibits only small fluctuations, indicating relatively weak vertical forcing of the lance. At 4 cm and 6 cm submersion depths, the fluctuation amplitude increases and the signal becomes more irregular, consistent with stronger interactions between gas and surrounding bath. At 10 cm submersion, the vertical acceleration shows the largest excursions. This depth-dependent increase in lance acceleration is consistent with stronger mechanical interaction between the lance and the bath at greater submersion depths. The acoustic and inertial measurements capture complementary aspects of the system response. While deeper lance submersion attenuates the transmitted acoustic signal due to propagation through the slag layer, the inertial sensor records increased mechanical forcing on the lance caused by higher hydrostatic pressure and stronger back-pressure fluctuations.
Figure 21 shows the planar acceleration envelope derived from the mean-centered Y and Z accelerometer signals, representing lateral acceleration components in the horizontal plane. The magnitude and spatial spread of the lateral acceleration generally increase with lance submersion depth. At 2 cm submersion, the planar acceleration envelope is compact and nearly symmetric, indicating relatively weak bath-induced forcing of the lance. At 4 and 6 cm, the envelope widens relative to the shallow case, indicating stronger lateral forcing of the lance. The increased angular spread suggests stronger anisotropic excitation in the horizontal plane, which is consistent with plume oscillations and transient bath motion. At 10 cm submersion, the lateral acceleration magnitude increases significantly and pronounced directional lobes develop in the polar envelope. This behavior indicates intensified bath-lance interaction at greater submersion depth, where plume oscillations and bath motion produce stronger lateral force fluctuations acting on the lance. In the present experiments the furnace geometry and slag inventory remained constant. The observed increase in planar lance motion with submersion depth is, therefore, attributed primarily to stronger plume-driven bath turbulence, sloshing and pressure fluctuations. Secondary effects such as intermittent splashing, wall interactions or slag dripping may contribute to local variability but do not alter the overall depth-dependent trend.
Figure 22 shows the lance motion response measured during the pilot-scale TSL trial at an air flow rate of 120 Nm3/h air and 13 L/h diesel flow. The mean-removed X-axis acceleration signal (left) compares lance combustion above the bath (non-submerged operation) with a submersion depth of 7 cm. When the lance operates above the bath, the X-axis acceleration shows relatively small fluctuations that are primarily associated with combustion-driven vibrations and mechanical background motion. After submersion to 7 cm, the acceleration fluctuations increase in amplitude and display a broader distribution of excursions, indicating stronger dynamic forcing on the lance during submerged gas injection. These fluctuations are attributed to pressure variations generated by plume formation, bubble detachment and bath motion beneath the lance tip. The planar motion envelope derived from the mean-removed Y and Z accelerometer components (right) provides complementary information on the lateral forcing acting on the lance. For the non-submerged case, the envelope remains relatively compact, indicating limited lateral excitation of the lance. In contrast, the 7 cm submerged condition produces a larger and more asymmetric envelope, reflecting increased lateral acceleration magnitudes. The increased radial magnitude indicates stronger lateral acceleration components acting on the lance. The directional lobes observed in the polar envelope indicate anisotropic excitation in the horizontal plane, which is consistent with plume oscillation and transient bath motion during submerged operation.

5. Discussion

5.1. Cold-Model Acoustics and Single-Bubble Dynamics

The cold-model experiments conducted in water-glycerin mixtures provide a controlled environment to examine the relationship between individual bubble events and their associated acoustic emissions. As shown in Figure 8 and Figure 9, individual high-amplitude transients in the acoustic waveform correspond to upward-sweeping energy bands in the spectrogram occurring at the same time location. At 60 L/h and 2 cm submersion, the waveform contains about four isolated transients per second with amplitudes near ±0.06, while at 300 L/h the rate rises to roughly ten events per second and amplitudes approach ±0.30. During each burst, the spectrograms show a distinct rising transient signal with increasing frequency over time, that starts around 300–400 Hz and sweeps upward to 1.5–3 kHz before decaying, whereas the low-frequency background below about 200 Hz remains almost constant. Comparison of the waveform and spectrogram on the same time scale show that the onset of each amplitude peak coincides with the initial low-frequency component (~250–400 Hz) and as the transient evolves over approximately 0.05–0.1 s, the dominant spectral power shifts progressively toward higher frequencies. This characteristic time-frequency evolution is consistent with bubble growth, rise and collapse dynamics near the liquid surface. At the onset of a burst, the bubble is relatively large and its characteristic oscillation frequency is lower. As collapse progresses and the effective bubble radius decreases, higher-frequency pressure fluctuations are generated before the acoustic signal decays.
This behavior is qualitatively consistent with Minnaert-type scaling (see Equation (6) [86]), which predicts that the natural oscillation frequency of a gas bubble varies inversely with its radius. Under lower gas flow conditions, larger and more isolated bubbles are expected to dominate the acoustic response, leading to lower characteristic emission frequencies. Increasing gas flow promotes stronger plume interaction, bubble breakup and smaller-scale collapse events, which contribute additional spectral energy at higher frequencies. However, the present acoustic measurements represent the coupled response of bubble collapse, plume turbulence and free-surface interaction rather than purely isolated radial oscillations. Consequently, Equation (6) should be interpreted as a scaling framework rather than a direct size-frequency mapping.
The ability to identify individual transient events in both the waveform and the spectrogram, with clear temporal alignment between amplitude peaks and upward-sweeping spectral transient signals, demonstrates that the acoustic analysis resolves discrete bubble-related emissions rather than only broadband integrated noise. These cold-model observations also provide a reference frequency range for the subsequent hot-slag experiments, where dominant acoustic emissions are later examined within the approximate range of 200–900 Hz with additional higher-frequency components extending into the kilohertz region. This frequency band corresponds to the spectral regions examined in Figure 14, Figure 15, Figure 16, Figure 17, Figure 18 and Figure 19 for the laboratory-scale and pilot-scale slag systems.
Although higher-frequency components are sometimes referred to as “harmonics”, the present data do not exhibit a strictly periodic harmonic series. In the present cold-model data, the observed upward-sweeping spectral bands represent broadband transient emissions rather than strictly periodic harmonic series, reflecting the non-linear and rapidly damped nature of bubble collapse in a viscous medium.
N = 1 2 π R   3 k p 0 ρ
where N = natural oscillation (collapse/resonance) frequency of the bubble, R = bubble radius, p 0 = ambient pressure around the bubble, κ = ratio of specific heat of the gas inside the bubble, ρ = density of surrounding liquid.

5.2. Translation to Hot Slag Environment

The laboratory furnace reproduces similar qualitative behavior under industrially relevant slag chemistry, viscosity and temperature. The fayalitic slag with a small spinel fraction, operated around 1200 °C and log p(O2) between −6 and −7, lies in a liquid slag plus spinel region that is typical for fayalitic slags encountered in industrial copper production [87]. Compared with the 80:20 water-glycerin bath, the high-temperature slag exhibits significantly higher viscosity and density. The water-glycerin mixture has a viscosity on the order of ~2–5 mPa.s and density of ~1050–1100 kg/m3, whereas the fayalitic slag shows viscosities in the range of ~0.1–1 Pa.s and density of ~3400 kg/m3 under the present conditions. As a result, bubble detachment occurs less frequently, and pressure pulses are more strongly damped as bubbles rise through the slag. This transition from discrete, clearly resolved events (Figure 8 and Figure 9) to more attenuated responses is visible in the laboratory-scale time-domain signals (Figure 12 and Figure 13). At 20 Nm3/h, the top microphone records a strong waveform when the lance combusts fuel above the bath (Figure 12). Once the lance is submerged to 2, 4 and 10 cm, the amplitude decreases in distinct steps, with the deepest submersion producing the lowest level. The bottom microphone remains consistently weaker than the top microphone, which confirms that the slag and refractory absorb and scatter pressure fluctuations before they reach the lower microphone.
The comparison between Figure 12 and Figure 13 demonstrates that the two-microphone arrangement captures distinct acoustic responses within the furnace. The top microphone, positioned with partial line-of-sight to the freeboard, captures stronger overall acoustic spectral power, while the lower microphone primarily records bath-transmitted components that have already undergone attenuation through the slag and refractory. Importantly, both microphones show consistent qualitative trends with increasing submersion depth. However, the lower microphone signal is substantially weaker and exhibits reduced signal-to-noise ratio. For this reason, the top microphone was selected for detailed frequency-domain analysis (Figure 14 and Figure 15), as it provides clearer resolution of bubble-related spectral features without requiring artificial amplification of the measured signal.
This trend agrees with findings from BOF studies (Section 2.2), in which microphones near the vessel mouth are dominated by combustion and structural noise, while deeper sensors capture process-specific features such as foam height and bubble collapse activity. The frequency-domain results (Figure 14 and Figure 15) further confirm this translation from the cold model to the slag system. In contrast to the sharply resolved upward-sweeping bands seen in Figure 8 and Figure 9, the hot-slag PSD curves show broader peaks and smoother spectral envelopes. This reflects the combined effects of higher viscosity, higher density and elevated temperature, which increase acoustic attenuation and shorten the effective transmission path of high-frequency components. In particular, the systematic PSD reduction with increasing submersion depth in Figure 15 indicates that lance depth primarily influences signal transmission and damping rather than fundamentally shifting the dominant collapse frequency range observed in the cold model.
In the pilot-scale TSL, more gas is injected and it penetrates deeper into the bath. The higher gas momentum (Section 1.2) produces stronger bath agitation, plume penetration and structural coupling. Because of this, submersion does not completely attenuate the high-frequency sound components (Figure 18c). In the laboratory-scale system, the smaller bath volume and lower gas momentum allow the slag layer to attenuate high-frequency components more effectively (Figure 14 and Figure 15).
Microphone positioning is also important. In the pilot setup (Figure 17), the microphones are placed farther from the lance tip and combustion zone compared to the laboratory configuration. Therefore, the recorded signal contains relatively less direct combustion noise and relatively greater contributions from vessel-wall transmission, freeboard reflections, slag damping, refractory lining and housing vibrations. This difference in geometric configuration contributes to the observed differences in high-frequency content and overall PSD levels between the laboratory-scale measurements (Figure 14 and Figure 15) and the pilot-scale results (Figure 18 and Figure 19). While direct visualization of bubble behavior is not feasible under high-temperature conditions, similar trends in spectral features are observed as operating parameters such as lance submersion depth and gas flow rate are varied. The consistency of these trends across cold-model and high-temperature experiments supports the interpretation that the observed spectral features are associated with bubble-related processes, although this attribution remains indirect.

5.3. Frequency-Domain Analysis, PSD and Cumulative Spectral Power

The hot slag environment produces complex overlapping sources such as combustion, turbulence, multiple bubble sizes, splashing and echoes. In this setting, interpreting only time-domain waveforms (Figure 12 and Figure 13) becomes ambiguous and persistent low-frequency oscillations like the 3–4 Hz bath motion observed in the pilot furnace (see Section 4.3 and Figure 22) may not be clearly resolved in a single FFT due to their intermittent nature and the dominance of broadband noise. To obtain a more stable and comparable representation of the spectral content, the signals are analyzed using PSD (Figure 14, Figure 15 and Figure 18), which averages frequency-domain information over multiple overlapping segments and reduces variance. This enables clearer separation of dominant frequency contributions and allows consistent comparison between operating states using identical processing parameters.
To ensure that peak locations were not dominated by processing choices, the PSD was recomputed with multiple window lengths and overlaps and the smoothing window was varied over a wide range. The dominant peak positions (e.g., ~200 Hz, ~600 Hz and ~1.5 kHz in the laboratory case, Figure 15) remained within the same frequency bands, while only the apparent peak sharpness changed. This confirms that the identified frequency regions are not artifacts of windowing or smoothing but represent stable spectral features across processing parameters.
These frequency bands should not be interpreted as representing three discrete bubble types. Instead, they correspond to dominant acoustic regions that are interpreted as different physical processes occurring simultaneously in the bath. The low-frequency region (1–10 Hz) is associated with large-scale bath or plume oscillations, as also reflected in the lance motion data (Figure 20, Figure 21 and Figure 22). The mid-frequency band (hundreds of Hz) is attributed to bubble formation and detachment dynamics, while the higher-frequency band (1–2 kHz) is linked to rapid pressure pulses from bubble collapse or fragmentation. Without optical access in the high-temperature system, these assignments cannot be validated directly. However, the same frequency bands were observed in the cold-model experiments, where synchronized high-speed imaging confirmed their association with bubble growth, detachment and collapse events (Figure 8 and Figure 9 [68,69]). The interpretation in the hot-slag system is, therefore, based on this experimentally validated correspondence, combined with consistent trends in flow rate and submersion depth (Figure 14, Figure 15 and Figure 16) and agreement with established hydrodynamic scaling (Section 2.1).
For the laboratory furnace, the PSD results (Figure 14 and Figure 15) show a consistent trend. When the lance operates above the bath, the acoustic power is the highest across almost the entire frequency range. Once the lance is submerged, the overall sound level drops, but clear frequency peaks appear near 200 Hz, 600 Hz and around 1.5 kHz. These peaks match the dominant acoustic emission bands observed in the cold-model tests (Figure 8 and Figure 9) and are consistent with numerical predictions for bubble and plume oscillations in TSL and ladle systems (Section 2.1).
The PSD does not allow direct quantification of bubble number or exact bubble diameter. However, the shift in spectral power with operating conditions provides indirect information on flow regime changes. For example, increased gas flow enhances spectral power in the mid and high-frequency bands (Figure 14c), indicating more intense bubble formation and collapse events, while deeper submersion (Figure 15) suppresses broadband combustion noise and strengthens damping through the slag layer.
Large-scale plume oscillations occur at low physical frequencies (~1–10 Hz), whereas the acoustic pulses generated during rapid bubble collapse appear in the hundreds of hertz to kilohertz range due to compressibility and rapid pressure transients. The very low-frequency oscillations themselves are easier to see in the spectrograms or in the lance-motion measurements (Figure 20, Figure 21 and Figure 22) rather than in a single averaged FFT, because their spectral power is spread over narrow bins and may occur intermittently.
Cumulative spectral power curves (Figure 16 and Figure 19) add a complementary view. Integrating the PSD shows how much of the total acoustic power is carried below any given frequency (Equation (5)). In the laboratory furnace (Figure 16), non-submerged noise curves rise steeply below about 300–400 Hz and then slowly accumulate, whereas submerged curves grow more gradually and, at 40 Nm3/h, exhibit an additional rise around 1.1 kHz. This additional rise corresponds directly to the high-frequency peak observed in the PSD (Figure 14c), demonstrating internal consistency between the two representations.
These trends suggest that combustion and structural noise dominate the lower-frequency range, while energetic bubble collapse or fragmentation events at higher flow conditions contribute additional spectral power in the kilohertz band. For pilot-scale operation (Figure 19), cumulative spectral power highlights the significant effect of shallow submersion. Marginal submerged conditions increase the integrated spectral power compared with freeboard operation with most of the excess below 3 kHz. At 7 cm depth the integrated spectral power falls back close to the freeboard level, consistent with stronger attenuation of bath-generated pressure fluctuations before they reach the microphone position (Figure 18). In particular, the emergence of characteristic frequency peaks under submerged conditions, compared to their absence or reduction in non-submerged operation, provides additional evidence linking these features to bubble-related activity rather than combustion noise alone.

5.4. Effect of Gas Rate and Submersion Depth

Combining PSD and cumulative spectral power across flow rates and depths clarifies the competing roles of gas momentum and bath damping. At laboratory scale, increasing air flow from 20 to 40 Nm3/h at constant 10 cm depth increases acoustic power in the 0.5 and 1.5 kHz regions but does not greatly change the low frequency band (<~200 Hz). This indicates that higher gas rates intensify mid and high-frequency acoustic activity associated with bubble detachment and collapse events, while the large-scale plume oscillation band remains comparatively stable. Comparing flows at the same depth allows the effect of gas velocity and penetration to be seen directly, without mixing it with changes in acoustic damping through the slag.
Varying submersion depth at fixed flow shows a different trend. At 40 Nm3/h, PSD levels decrease systematically with depth and cumulative spectral power curves for 2–10 cm depth sit well below the non-submerged reference. The slag bath behaves as an effective acoustic damping medium: low-frequency waves associated with bulk motion are transmitted more readily, whereas mid and high frequencies are more strongly attenuated. Pilot-scale data reinforces this interpretation (Figure 18 and Figure 19). The just-submerged lance generates the highest cumulative spectral power, consistent with coupling between combustion, near-surface bubble activity and limited acoustic attenuation. At 7 cm depth, bubbles are generated deeper in the slag bath and the resulting pressure pulses must propagate through a larger slag layer and their pressure pulses are increasingly damped before reaching the freeboard. The result is lower integrated spectral power (Figure 19) and a PSD closer to the freeboard combustion baseline (Figure 18).

5.5. Coupling Acoustic and Inertial Sensing

The lance-mounted motion sensor provides an independent indication of mechanical forcing on the lance caused by pressure fluctuations near the lance tip and hydrodynamic forces acting on the lance walls due to the bath movement. In the laboratory furnace, vertical acceleration magnitude in the X-axis grows systematically between 2 cm and 10 cm submersion at 40 Nm3/h and the waveform exhibits larger oscillatory excursions and a more structured fluctuation pattern. Planar motion in the Y-Z axes (Figure 21) shows even stronger sensitivity, where the polar envelope area at 10 cm depth is substantially larger than at 2 cm and exhibits clear directional lobes that point to asymmetric bubble plume behavior, lance-tip detachment and sloshing waves.
Pilot-scale measurements follow the same qualitative trend (Figure 22). With the lance above the bath, vertical and planar motions remain small and irregular, dominated primarily by mechanical vibration and combustion-induced fluctuations. After submersion to 7 cm, both vertical and planar motion amplitudes increase and exhibit more structured oscillatory behavior. Simultaneously, the PSD (Figure 18) shows enhanced spectral power below 2 kHz and the cumulative spectral power (Figure 19) exhibits a marked rise below 3 kHz under submerged conditions. The concurrent increase in inertial motion (Figure 22) and acoustic spectral power (Figure 18 and Figure 19) suggests that bubble growth, detachment and collapse dynamics generate both pressure waves detectable acoustically and mechanical forcing measurable at the lance. This multi-sensor agreement supports the interpretation that the mid-frequency acoustic band (~200–900 Hz) and associated higher-frequency components are linked to active bubble-bath interaction rather than arising solely from combustion noise. This behavior complements BOF studies discussed in Section 2.2, where low-frequency vibration modes (~5–15 Hz) track bath or vessel resonance and acoustic bands near ~1 kHz respond to foam evolution and droplet dynamics. The present results extend this principle to submerged-lance TSL operation, suggesting that coupling acoustic and inertial sensing can provide a more complete characterization of bath dynamics than either method alone.

5.6. Implications for Modeling and Industrial Application

Taken together, the cold-model, laboratory and pilot-scale results show that acoustic and inertial sensing provide consistent and scale-translatable indicators of TSL bath dynamics across scales and viscosities. The cold model establishes a clear correspondence between individual bubble events, collapse-related acoustic emission characteristics and spectrogram patterns (Figure 8 and Figure 9). The laboratory and pilot TSL furnaces (Figure 14, Figure 15, Figure 16, Figure 17, Figure 18, Figure 19, Figure 20, Figure 21 and Figure 22) then demonstrate that these signatures persist in real fayalitic slags, although filtered by higher viscosity, higher density and increased propagation distance to the microphones. The observed frequency bands, spectral power distributions and submersion depth trends are qualitatively consistent with established CFD and multiphase-flow predictions of plume penetration, bath sloshing frequencies and bubble-induced pressure fluctuations reported in the literature (Section 2.1), as well as with steelmaking experience on slag-foaming acoustics (Section 2.2).
The present methodology, therefore, offers a practical bridge between detailed multiphase simulations and plant operation. Frequency-resolved acoustic data and lance-motion signals can be used to compare experimentally observed dominant frequencies and spectral power trends with CFD-predicted plume oscillation frequencies and flow-regime transitions, rather than only time-averaged quantities such as mixing time. Importantly, the measurements rely on externally mounted microphones and a lance-mounted inertial sensor, both of which are technically feasible in an industrial TSL furnace environment without intrusive probes or optical access. Although the present data cover only one slag system and a limited set of operating conditions, they show that the combined acoustic-inertial sensing method can resolve meaningful qualitative differences in TSL behavior, including changes in gas rate, lance depth, bath geometry, foaming intensity and slag viscosity. Direct quantification of bubble size and release frequency was performed by the authors in the cold-model experiments using synchronized high-speed imaging and acoustic measurements [67,68,69] but such optical validation is not feasible under the opaque high-temperature slag conditions investigated here. In the present hot-slag experiments, bubble dynamics are, therefore, inferred indirectly through reproducible changes in spectral power distribution and lance-motion response that correlate systematically with variations in gas momentum and submersion depth. This suggests that the technique could be integrated with existing advanced process-control platforms such as OCT [64], X-Pact® Vision, SIMATIC PCS 7, CENTUM VP and similar systems, where it can support data-driven monitoring. In this context, acoustic-inertial features (e.g., dominant frequency bands, cumulative spectral power metrics and motion amplitudes) could serve as structured input variables for future data-driven or machine-learning approaches to operational control and anomaly detection.

6. Conclusions

This work demonstrates that coupled acoustic and inertial sensing can characterize key bath dynamics phenomena in TSL furnaces across cold-model, laboratory and pilot scales. The primary objective of the study was to determine whether frequency-resolved acoustic measurements and lance-mounted inertial sensing can provide physically interpretable indicators of bath dynamics that are comparable across experimental scales and consistent with multiphase-flow CFD predictions. Frequency-resolved acoustic signals and lance motion responses capture key dynamic bath phenomena, including bubble collapse, plume interaction and back-pressure effects under varying gas flow rates and lance submersion depths. The resulting frequency-domain metrics, including dominant PSD bands, cumulative spectral power distributions and inertial-motion data, provide experimentally grounded descriptors of bath dynamics that can be compared directly with CFD predictions and literature data.
Cold model tests captured individual bubble collapses with peak amplitudes of ±0.06 at 60 L/h and ±0.30 at 300 L/h and dominant acoustic emission bands associated with collapse between 300–900 Hz with high-frequency components above 1.5 kHz. Laboratory-scale high-temperature slag trials reproduced these dominant frequency regions while exhibiting stronger attenuation due to the higher viscosity and density of fayalitic slag. Pilot-scale trials conducted at high-flow operating conditions (120 Nm3/h air and 13 L/h diesel), confirmed the same qualitative behavior. Shallow submersion produced a substantial increase in cumulative acoustic spectral power below 3 kHz, whereas deeper submersion reduced collapse-related spectral peaks and increased acoustic damping (Figure 18 and Figure 19).
The lance-mounted inertial sensor independently recorded approximately 3–4× larger vertical acceleration magnitudes and several-fold larger planar acceleration amplitudes at deeper submersion depths (Figure 20, Figure 21 and Figure 22), correlating with increases in acoustic spectral power within the dominant 200–900 Hz band. Together, the results demonstrate a consistent cross-scale relationship between gas rate, submersion depth, acoustic spectral distribution and lance motion response, while direct bubble-size quantification remains limited to optically validated cold-model conditions.
The approach differs from earlier TSL acoustic studies in both scope and methodology. Prior studies were limited to qualitative FFTs or foam-level inference, whereas this study integrates waveform, spectrogram, PSD, cumulative spectral power and lance-motion measurements into a unified interpretation framework. The resulting dataset provides experimentally measured frequency-domain characteristics that can be directly compared with simulation outputs and hydrodynamic predictions reported in the literature. For example, collapse-frequency bands, PSD peak shifts with viscosity, depth-dependent attenuation and bubble-induced forcing on the lance are experimentally identified. Unlike steelmaking or converter acoustic monitoring, the TSL environment includes submerged injection, higher viscosities and deeper slag baths. The present work demonstrates that meaningful acoustic signatures can still be extracted and interpreted under these conditions despite high combustion noise environment and structural vibration.
The methodology is transferable to industrial TSL furnaces using externally mounted microphones and lance-mounted inertial sensors, without intrusive modifications to furnace internals. Each plant can establish its own acoustic baseline reflecting its slag chemistry, viscosity and gas-injection conditions. Once this baseline is defined, operators may use frequency-band monitoring to confirm stable lance penetration or use cumulative-spectral power trends to detect changes in surface agitation or foaming tendency. Such frequency-based indicators can support real-time monitoring and more consistent process control. In future work, structured acoustic and inertial features such as dominant frequency bands, cumulative spectral power metrics and motion amplitudes may serve as input variables for data-driven classification or anomaly-detection algorithms capable of identifying abnormal bath states.
Overall, the study demonstrates that acoustic and inertial measurements provide repeatable and physically interpretable insight into TSL bath dynamics. The methodology is applicable across laboratory and pilot scales and enables frequency-based diagnostics of plume dynamics, bubble collapse activity and bath agitation that previous TSL studies could not resolve with this level of frequency-domain detail. The approach offers a practical path toward real-time monitoring, improved operational stability and enhanced process safety in industrial TSL smelters. Future work could focus on applying this method in full-scale industrial trials and on developing machine-learning models to classify acoustic signals and predict bath conditions.

Supplementary Materials

The following supporting information can be downloaded at: https://www.mdpi.com/article/10.3390/met16050519/s1.

Author Contributions

A.K.: conceptualization, data curation, formal analysis, methodology, investigation, visualization, software and writing—original draft; M.A.R.: supervision, formal analysis, resources, writing—review and editing, funding acquisition; M.S.: supervision, formal analysis, resources, writing—review and editing, funding acquisition; A.R.: supervision, writing—review and editing; C.K.: supervision, review and editing; A.C.: supervision, formal analysis, resources, writing—review and editing, project administration. All authors have read and agreed to the published version of the manuscript.

Funding

The authors would like to thank the funding agency–BMBF, Germany for supporting the research done at INEMET, TU Bergakademie Freiberg, Germany, within the framework of the CIC-Virtuhcon (Grant Numbers: 03Z22FN11 and 03Z22FN12) between the years from 2015 to 2022.

Data Availability Statement

The original contributions presented in this study are included in the article/Supplementary Material. Further inquiries can be directed to the corresponding author.

Acknowledgments

The authors thank Robert Matusewicz and the late Joey Hoang from Metso (formerly Outotec) for their initial technical support during the installation of the OCT platform and for advising on the integration of the acoustic and inertial motion sensors. All cold and hot-model experiments, data processing, analysis and interpretation presented in this work were carried out independently by the authors.

Conflicts of Interest

Markus A. Reuter has the patent on Top-Submerged Injection Lances (US 9528766) issued to Outotec Oyj. Markus A. Reuter has the patent on Lances for Top-Submerged Injection (US 9771627) issued to Outotec Oyj. Markus A. Reuter has the patent on Fluid-Cooled Lances for Top-Submerged Injection issued to Outotec Oyj. Markus A. Reuter was previously employed by Outotec (AUSMELT) Australia and Finland (2006–2015). Alexandros Charitos was employed by Outotec GmbH & Co. KG in Germany between 2011 and 2018 in the field of fluidized bed roasting technology. Avinash Kandalam has been employed full-time at Glencore Nordenham since March 2022 and currently serves as Operations Metallurgical Manager.

Nomenclature

Acronyms
ACTAdvanced control technologies
ADCAudio-to-digital converter
ANNArtificial neural network
BBOCBottom blown oxygen converter
BOFBasic oxygen furnace
BMBFFederal Ministry of Education and Research
CFDComputational fluid dynamics
CSIROCommonwealth Scientific and Industrial Research Organization
DASDistributed acoustic sensing
FFTFast-Fourier transform
HSC SIMEnthalpy (h)–entropy (s)–heat capacity (c) simulation flowsheet
IECInstitute of Energy Process Engineering and Chemical Engineering
IMUInertial measurement unit
INCOInternational nickel company flash furnace
INEMETInstitute of Nonferrous Metallurgy and Purest Materials
KIVCETOxygen Flash Smelting and Reduction Furnace for Non-Ferrous Metals
LD ConverterLinz-Donawitz basic oxygen converter
LDLance diameter
LESLarge eddy simulation
OCTOptimization control technologies
PLICPiecewise linear interface calculation
P-S ConverterPeirce-smith converter
PSDPower spectral density
QSLQueneau–Schuhmann–Lurgi
SBFSide-blown Furnace
STFTShort-time Fourier Transform
SHAPShapley additive explanations
SKSShuikoushan
SNSwirl number
TBRCTop-blown Rotary Converter
TSLTop submerged lance
TUBAFTechnical University of Freiberg
UQPYUniversity of Queensland, Pyrosearch
VDVessel diameter
VIRTUHCONVirtual high temperature conversion
VOFVolume of Fluid
WAVWaveform audio file format
XLRExternal line return (audio connector)
XRDX-ray Diffraction
XRFX-ray Fluorescence
Units
°CDegrees Celsius
cmCentimeter
dBDecibels
dB/mDecibels per meter
HzHertz
kgKilograms
kHzKilohertz
L/sLiters per second
L/hLiters per hour
logLogarithmic scale
mMeter
m/sMeters per second
mmMillimeter
NL/minNormal liter per minute
Nm3/hNormal cubic meters per hour
p(O2)Partial pressure of oxygen
Pa.sPascal-second
sSecond
wt.%Weight percentage
Symbols
%Percentage
~Approximately
®Registered trademark
EcEnergy (cumulative spectral power or integrated spectral power)
f’Frequency (integration variable)
Ga-In-SnGallium–Indium–Tin (alloy)
p0Ambient pressure
QgGas flow rate
TMTrademark
πratio of circumference to diameter
ρDensity
µViscosity
σSurface tension
UInjection velocity
DLance diameter
fCharacteristic oscillation frequency
rRadius

References

  1. Floyd, J.M.; Waverley, G. Submerged Injection of Gas into Liquid-Bath Pyrometallurgical Bath. Patent 901,513, 1 May 1978. [Google Scholar]
  2. Floyd, J.M.; Conochie, D.S. SiroSmelt: The First Ten Years. In Extractive Metallurgy Symposium; AusIMM: Melbourne, Australia, 1984; pp. 1–8. [Google Scholar]
  3. Denholm, W.T.; Colin, W. SiroSmelt. Available online: https://csiropedia.csiro.au/sirosmelt/ (accessed on 25 October 2025).
  4. Denholm, W.T.; Floyd, J.M.; Errington, W.J.; Parry, A.N. High Intensity Lead Smelting Process. Patent 442,656, 18 November 1982. [Google Scholar]
  5. Floyd, J.M.; Waverley, G. Recovery of Tin from Slags. Patent 499,644, 22 August 1974. [Google Scholar]
  6. Foo, K.A.; Lightfoot, B.W. Operation of a 4 t/h Matte-Fuming Pilot Plant. Pyrometallurgy 1987, 87, 389–418. [Google Scholar]
  7. Walton, M.C. Refractories Performance in the Matte Fuming Process. In Extractive Metallurgy; AusIMM: Melbourne, Australia, 1984; pp. 17–23. [Google Scholar]
  8. Floyd, J.M. Converting an Idea into a Worldwide Business Commercializing Smelting Technology. Metall. Mater. Trans. B 2005, 36, 557–575. [Google Scholar] [CrossRef]
  9. Kandalam, A.; Reuter, M.A.; Stelter, M.; Reinmöller, M.; Gräbner, M.; Richter, A.; Charitos, A. A Review of Top Submerged Lance (TSL) Processing—Part II: Thermodynamics, Slag Chemistry and Plant Flowsheets. Metals 2023, 13, 1742. [Google Scholar] [CrossRef]
  10. Kandalam, A.; Reuter, M.A.; Stelter, M.; Reinmöller, M.; Gräbner, M.; Richter, A.; Charitos, A. A Review of Top-Submerged Lance (TSL) Processing—Part I: Plant and Reactor Engineering. Metals 2023, 13, 1728. [Google Scholar] [CrossRef]
  11. Floyd, J.M. Top Submerged Injection with a Shrouded Lance. Patent WO91/05214, 18 April 1991. [Google Scholar]
  12. Hughes, S.; Reuter, M.; Kaye, A. Ausmelt Technology—Developments in Copper. In Proceedings of the Metal-Expo Annual Exhibition, Moscow, Russia, 13–16 November 2007. [Google Scholar]
  13. Mounsey, E.N.; Li, H.; Floyd, J.W. The Design of the Ausmelt Technology Smelter at Zhong Tiao Shan’s Houma Smelter, People’s Republic of China. In Proceedings of the Copper 99–Cobre 99, Phoenix, AZ, USA, 10–13 October 1999; pp. 357–370. [Google Scholar]
  14. Nikolic, S.; Hogg, B.; Voigt, P. ISASMELT—Flexibility in Furnace Design. In Extraction 2018: Proceedings of the First Global Conference on Extractive Metallurgy; Springer: Cham, Switzerland, 2018; pp. 435–443. [Google Scholar]
  15. Glencore Technology Pty Limited. ISASMELT Gives You Flexible, Clean Smelting for the Real World. Available online: https://www.glencoretechnology.com/en/technologies/isasmelt (accessed on 2 October 2025).
  16. Metso. Ausmelt TSL Process. Available online: https://www.metso.com/portfolio/ausmelt-tsl-process/ (accessed on 2 October 2025).
  17. Denholm, W.T.; Taylor, R.N. Coal Firing of SiroSmelt Process. In Coal Power, Proceedings of the AusIMM Annual Conference, Nelson, New Zealand, 3–4 September 1987; AusIMM: Carlton, Australia, 1987; pp. 365–372. [Google Scholar]
  18. Wang, Y.; Wang, J.; Cao, L.; Cheng, Z.; Blanpain, B.; Reuter, M.; Guo, M. The State-of-the-Art in the Top Submerged Lance Gas Injection Technology: A Review. Metall. Mater. Trans. B 2022, 53, 3345–3363. [Google Scholar] [CrossRef]
  19. Wan, Z.; Yang, S.; Kong, D.; Li, D.; Hu, J.; Wang, H. Numerical Modelling of Stirring Characteristics of Gas–Slag–Copper Matte Multiphase Flow in Bath with Top Submerged Lance. Trans. Nonferrous Met. Soc. China 2023, 33, 2231–2244. [Google Scholar] [CrossRef]
  20. Lima, W.; Maia, B.T. BOF Lance and Functions. In AISTech 2022 Conference Proceedings; AIST Association for Iron & Steel Technology: Warrendale, PA, USA, 2022; pp. 480–493. [Google Scholar]
  21. Snigdha, G.; Bharath, B.N.; Viswanathan, N.N. BOF Process Dynamics. Miner. Process. Extr. Metall. 2019, 128, 17–33. [Google Scholar] [CrossRef]
  22. Yang, W. Modelling of Top Submerged Swirl and Non-Swirl Gas Injections into Liquid Baths. Ph.D. Thesis, Swinburne University of Technology, Melbourne, Australia, 2003. [Google Scholar]
  23. Liow, J.-L.; Dickinson, W.H.; Allan, M.J.; Gray, N.B. Study of Slopping and Splashing in a Cylindrical Bath with Top-Submerged Injection. Metall. Mater. Trans. B 1995, 26, 887–889. [Google Scholar] [CrossRef]
  24. Liovic, P.; Rudman, M.; Liow, J.L. Numerical Modelling of Free Surface Flows in Metallurgical Vessels. Appl. Math. Model. 2002, 26, 113–140. [Google Scholar] [CrossRef]
  25. Zhao, H.; Zhang, L.; Yin, P.; Wang, S. Bubble Motion and Gas–Liquid Mixing in Metallurgical Reactor with a Top Submerged Lance. Int. J. Chem. React. Eng. 2017, 15, 20160139. [Google Scholar] [CrossRef]
  26. Zhao, H.L.; Yin, P.; Zhang, L.; Wang, S. Water Model Experiments of Multiphase Mixing in the Top-Blown Smelting Process of Copper Concentrate. Int. J. Miner. Metall. Mater. 2016, 23, 1369–1376. [Google Scholar] [CrossRef]
  27. Haas, T.; Schubert, C.; Eickhoff, M.; Pfeifer, H. A Review of Bubble Dynamics in Liquid Metals. Metals 2021, 11, 664. [Google Scholar] [CrossRef]
  28. Neven, S.; Blanpain, B.; Wollants, P. Injection Dynamics in an Isasmelt Reactor. In EPD Congress 2002; TMS: Warrendale, PA, USA, 2002; pp. 449–459. [Google Scholar]
  29. Neven, S. Lance Injection Dynamics in an Isasmelt Reactor. Ph.D. Thesis, Katholieke Universiteit Leuven, Leuven, Belgium, 2005. [Google Scholar]
  30. Akashi, M.; Keplinger, O.; Shevchenko, N.; Anders, S.; Reuter, M.A.; Eckert, S. X-ray Radioscopic Visualization of Bubbly Flows Injected through a Top Submerged Lance into a Liquid Metal. Metall. Mater. Trans. B 2020, 51, 124–139. [Google Scholar] [CrossRef]
  31. Obiso, D.; Akashi, M.; Kriebitzsch, S.; Meyer, B.; Reuter, M.; Eckert, S.; Richter, A. CFD Modeling and Experimental Validation of Top-Submerged-Lance Gas Injection in Liquid Metal. Metall. Mater. Trans. B 2020, 51, 1509–1525. [Google Scholar] [CrossRef]
  32. Huda, N.; Naser, J.; Brooks, G.; Reuter, M.A.; Matusewicz, M. CFD Modelling of Gas Injection in Top Submerged Lance Smelting. In TMS Annual Meeting; The Minerals, Metals & Materials Society (TMS): Pittsburgh, PA, USA, 2009; pp. 95–102. [Google Scholar]
  33. Huda, N.; Naser, J.; Brooks, G.; Reuter, M.A.; Matusewicz, R.W. CFD Modeling of Swirl and Non-Swirl Gas Injections into Liquid Baths Using Top Submerged Lances. Metall. Mater. Trans. B 2010, 41, 35–50. [Google Scholar] [CrossRef]
  34. Huda, N.; Naser, J.; Brooks, G.; Reuter, M.A.; Matusewicz, R.W. Computational Fluid Dynamic Modeling of Zinc Slag Fuming Process in Top-Submerged Lance Smelting Furnace. Metall. Mater. Trans. B 2012, 43, 39–55. [Google Scholar] [CrossRef]
  35. Wang, Y. Physical and Numerical Modelling of Multiphase Flow in a Hot Stage Slag Engineering Process. Ph.D. Thesis, KU Leuven, Leuven, Belgium, 2019; pp. 63–96. [Google Scholar]
  36. Wang, Y.; Cao, L.; Vanierschot, M.; Cheng, Z.; Blanpain, B.; Guo, M. Modelling of Gas Injection into a Viscous Liquid through a Top-Submerged Lance. Chem. Eng. Sci. 2020, 212, 115359. [Google Scholar] [CrossRef]
  37. Zhao, H.; Lu, T.; Yin, P.; Mu, L.; Liu, F. An Experimental and Simulated Study on Gas–Liquid Flow and Mixing Behavior in an ISASMELT Furnace. Metals 2019, 9, 565. [Google Scholar] [CrossRef]
  38. Obiso, D.; Kriebitzsch, S.; Reuter, M.; Meyer, B. The Importance of Viscous and Interfacial Forces in the Hydrodynamics of the Top-Submerged-Lance Furnace. Metall. Mater. Trans. B 2019, 50, 2403–2420. [Google Scholar] [CrossRef]
  39. Obiso, D.; Reuter, M.; Richter, A. CFD Investigations of Bath Dynamics in a Pilot-Scale TSL Furnace. Metall. Mater. Trans. B 2021, 52, 3064–3077. [Google Scholar] [CrossRef]
  40. Obiso, D.; Reuter, M.; Richter, A. CFD Investigation of Rotational Sloshing Waves in a Top-Submerged-Lance Metal Bath. Metall. Mater. Trans. B 2021, 52, 2386–2394. [Google Scholar] [CrossRef]
  41. Obiso, D.; Schwitalla, D.H.; Korobeinikov, I.; Meyer, B.; Reuter, M.; Richter, A. Dynamics of Rising Bubbles in a Quiescent Slag Bath with Varying Thermo-Physical Properties. Metall. Mater. Trans. B 2020, 51, 2843–2861. [Google Scholar] [CrossRef]
  42. Cwudziński, A. Influence of Flow Control Devices on Mixing Phenomena in the Ladle with Top Lance Stirring System—Numerical and Physical Modeling. Materials 2024, 17, 6130. [Google Scholar] [CrossRef]
  43. Chen, S.; Yang, S.; Wang, H. AI-Based Modeling and Optimization of Top-Submerged Swirling Lance in Bath Smelting Furnace for Non-Ferrous Metals. Metall. Mater. Trans. B 2025, 56, 3950–3969. [Google Scholar] [CrossRef]
  44. Yang, A.; Wang, L. A Fundamental Study of Flotation Separation of Mineral Particles Using Ultrasound-Induced Bubbles. Miner. Eng. 2024, 207, 108573. [Google Scholar] [CrossRef]
  45. Wang, Y.; Liu, C.; Wu, H.; Sui, Q.; Yang, C.; Gui, W. Revolutionizing Flotation Process Working Condition Identification Based on Froth Audio. IEEE Trans. Instrum. Meas. 2023, 72, 1–12. [Google Scholar] [CrossRef]
  46. Li, Z.; Chen, L.; Aldrich, C.; Zanin, M.; Neumann, F.; Asamoah, R. SAG Mill Shell Vibration under Different Liner Wear Conditions. In Proceedings of the MEI Conference: Comminution 2025, Sydney, Australia, 26–28 November 2025. [Google Scholar]
  47. Hou, R.; Hunt, A.; Williams, R.A. Acoustic Monitoring of Hydrocyclones. Powder Technol. 2002, 124, 176–187. [Google Scholar] [CrossRef]
  48. Nathan, R.J.; Norton, M.P. Vibration Signature-Based Condition Monitoring of Bowl-Roller Coal Pulverizers. J. Vib. Acoust. 1993, 115, 452–462. [Google Scholar] [CrossRef]
  49. Zeng, Y.; Forssberg, E. Monitoring Grinding Parameters by Vibration Signal Measurement—A Primary Application. Miner. Eng. 1994, 7, 495–501. [Google Scholar] [CrossRef]
  50. Dular, M.; Griessler-Bulc, T.; Gutierrez-Aguirre, I.; Heath, E.; Kosjek, T.; Klemenčič, A.K.; Oder, M.; Petkovšek, M.; Rački, N.; Ravnikar, M. Use of Hydrodynamic Cavitation in (Waste) Water Treatment. Ultrason. Sonochem. 2016, 29, 577–588. [Google Scholar] [CrossRef]
  51. Fang, Y.; Hariu, D.; Yamamoto, T.; Komarov, S. Acoustic Cavitation Assisted Plasma for Wastewater Treatment: Degradation of Rhodamine B in Aqueous Solution. Ultrason. Sonochem. 2019, 52, 318–325. [Google Scholar] [CrossRef]
  52. Papadopoulou, K.A.; Shamout, M.N.; Lennox, B.; Mackay, D.; Taylor, A.R.; Turner, J.T.; Wang, X. An Evaluation of Acoustic Reflectometry for Leakage and Blockage Detection. Proc. Inst. Mech. Eng. C J. Mech. Eng. Sci. 2008, 222, 959–966. [Google Scholar] [CrossRef]
  53. Zhu, L.; Qiu, F.; Liu, C.; Gu, W.; Ma, C.; Song, T.; Hao, P.; Zhang, P. Distributed Optical Fiber Acoustic Wave Sensor Detection Technology for Gangue Slurry Pipeline Conveying Blockage. Sci. Rep. 2025, 15, 29653. [Google Scholar] [CrossRef]
  54. Heenatimulla, J.; Brooks, G.; Dunn, M.; Sly, D.; Snashall, R.; Leung, W. Attenuation of Sound Signals in Foams for the Basic Oxygen Furnace Using Physical Modelling Techniques. Ironmak. Steelmak. 2024, 51, 1001–1009. [Google Scholar] [CrossRef]
  55. Pylvänäinen, M.; Visuri, V.-V.; Liedes, T.; Laurila, J.; Karioja, K.; Pikkupeura, S.; Ollila, S.; Fabritius, T.; Ollila, S. Vibration-Based Assessment of Gas Stirring Intensity in Ladle Treatments. In Proceedings of the 5th International Conference on Process Development in Iron and Steelmaking, Luleå, Sweden, 12–15 June 2016. [Google Scholar]
  56. Heenatimulla, J. Sound Analysis of the Foaming Process during Gas Injection in Oxygen Steelmaking. Ph.D. Thesis, Swinburne University of Technology, Melbourne, Australia, 2025. [Google Scholar]
  57. Heenatimulla, J.; Brooks, G.A.; Dunn, M.; Sly, D.; Snashall, R.; Leung, W. Acoustic Analysis of Slag Foaming in the BOF. Metals 2022, 12, 1142. [Google Scholar] [CrossRef]
  58. Heenatimulla, J.; Brooks, G.A.; Dunn, M.; Sly, D.; Snashall, R.; Leung, W. Improving Acoustic-Based Slag Foam Control Systems in the BOF. In Proceedings of the AISTech—Iron and Steel Technology Conference, Columbus, OH, USA, 6–9 May 2024. [Google Scholar]
  59. Nissilä, J.; Pylvänäinen, M.; Visuri, V.-V.; Ruotsalainen, P.; Laurila, J.; Rankinen, A.; Palovaara, T.; Liedes, T. Vibration and Audio Measurements in the Monitoring of Basic Oxygen Furnace Steelmaking. Metall. Mater. Trans. B 2023, 54, 2929–2950. [Google Scholar] [CrossRef]
  60. Kadam, R. Acoustic Monitoring of Steelmaking Ladles. Ph.D. Thesis, Swinburne University of Technology, Melbourne, Australia, 2021. [Google Scholar]
  61. Kadam, R.; Brooks, G.; Dunn, M.; Sly, D.; Snashall, R. Use of Sound Signals in Analyzing Flow Behavior in Steel Vessels. In AISTech 2019 Conference Proceedings; AIST Association for Iron & Steel Technology: Warrendale, PA, USA, 2019; pp. 1123–1131. [Google Scholar]
  62. Jalili, A.; Saleki-Haselghoubi, N.; Rasouli, S.; Saleki, Z.; Luo, Y.-A. Spectral Statistics in Bubble Dynamics. Ocean Eng. 2024, 305, 1–9. [Google Scholar] [CrossRef]
  63. Jossic, L.; Séchet, P.; Magnin, A.; Hojeij, A.; Hattou, S. Bubbles Morphology, Frequency and Rising Velocity in Yield Stress Fluid under Downward Gas Injection. Chem. Eng. J. Adv. 2023, 16, 100527. [Google Scholar] [CrossRef]
  64. Metso. Optimization Control Technologies—Improve Your Processes Performance: Advanced Process Control (APC) Solutions. Available online: https://www.metso.com/portfolio/oct/ (accessed on 1 November 2025).
  65. Kandalam, A.; Kleeberg, J.; Stelter, M.; Reuter, M.A. Investigating the Temperature Profile in a Pilot Top Submerged Lance Furnace at TU Bergakademie Freiberg. In Proceedings of the European Metallurgical Conference (EMC) 2019, Düsseldorf, Germany, 23–26 June 2019; Volume 2, pp. 605–621. [Google Scholar]
  66. Kandalam, A.; Kleeberg, J.; Stelter, M.; Reuter, M.A. Investigating the Combustion Conditions of TSL Lance in an Ambient Atmosphere. In Proceedings of the 58th Conference of Metallurgists Hosting the International Copper Conference, Vancouver, BC, Canada, 18–21 August 2019. [Google Scholar]
  67. Kandalam, A.; Reinmöller, M.; Stelter, M.; Reuter, M.A.; Charitos, A. A Novel Method to Determine the Bubble Dynamics of the Top Submerged Lance Furnace Using Acoustic Measurements and High-Speed Photography. In Proceedings of the TMS 2020 Annual Meeting & Exhibition, San Diego, CA, USA, 23–27 February 2020. [Google Scholar]
  68. Kandalam, A.; Stelter, M.; Reinmöller, M.; Reuter, M.A.; Charitos, A. Novel Methods to Determine the Bubble Dynamics of a Top Submerged Lance (TSL) Smelter. In Proceedings of the EMC 2021, Nicosia, Cyprus, 10–12 November 2021. [Google Scholar]
  69. Kandalam, A.; Stelter, M.; Reinmöller, M.; Reuter, M.A.; Charitos, A. Determining the Bubble Dynamics of a Top Submerged Lance Smelter. In REWAS 2022: Developing Tomorrow’s Technical Cycles; TMS: Warrendale, PA, USA, 2022; Volume 1, pp. 541–551. [Google Scholar]
  70. Behringer. ECM8000: Ultra-Linear Measurement Condenser Microphone. Available online: https://coutant.org/behringer/ecm8000c.pdf?utm_source=chatgpt.com (accessed on 1 November 2025).
  71. x-IO Technologies. x-IMU: First Generation IMU for Real-Time Wireless and Data Logging Applications. Available online: www.x-io.co.uk/x-imu/ (accessed on 1 November 2025).
  72. Focusrite. Scarlett 18i20 (3rd Gen). Available online: www.focusrite.com/products/scarlett-18i20 (accessed on 1 November 2025).
  73. Kinsler, L.E.; Frey, A.R.; Coppens, A.B.; Sanders, J.V. Fundamentals of Acoustics, 4th ed.; Wiley: New York, NY, USA, 2000. [Google Scholar]
  74. Fahy, F.; Thompson, D. Fundamentals of Sound and Vibration; CRC Press: Boca Raton, FL, USA, 2015. [Google Scholar]
  75. Oppenheim, A.V. Discrete-Time Signal Processing; Pearson Education India: New Delhi, India, 1999. [Google Scholar]
  76. Cohen, L. Time-Frequency Analysis: What We Know and What We Don’t. In Landscapes of Time-Frequency Analysis: ATFA 2019; Birkhäuser: Cham, Switzerland, 2020; pp. 75–98. [Google Scholar]
  77. Welch, P. The Use of Fast Fourier Transform for the Estimation of Power Spectra: A Method Based on Time Averaging over Short, Modified Periodograms. IEEE Trans. Audio Electroacoust. 1967, 15, 70–73. [Google Scholar] [CrossRef]
  78. Chebykin, D.; Heller, H.-P.; Dubberstein, T.; Korobeinikov, I.; Volkova, O. Viscosity Measurement of Slags Using Rotating Bob and Vibrating Finger Viscometer. ISIJ Int. 2017, 57, 1319–1326. [Google Scholar] [CrossRef]
  79. Webber, G.; Stephens, R. Transmission of Sound in Molten Metals. In Applications to Quantum and Solid State Physics; Academic Press: Cambridge, MA, USA, 1968. [Google Scholar]
  80. Blairs, S. Sound Velocity of Liquid Metals and Metalloids at the Melting Temperature. Phys. Chem. Liq. 2007, 45, 399–407. [Google Scholar] [CrossRef]
  81. Kamioka, H.; Sumino, Y. Attenuation of Sound in Indium at Melting Point. J. Phys. Soc. Jpn. 1985, 54, 2190–2193. [Google Scholar] [CrossRef]
  82. Pyrosearch, The University of Queensland. UQPY Database. Available online: https://chemeng.uq.edu.au/research/metallurgy-and-minerals-processing/pyrometallurgy-innovation-centre/pyrosearch-facilities/factsage (accessed on 1 November 2025).
  83. Lauterborn, W.; Thomas, K.; Mettin, R.; Philipp, K.; Kroeninger, D.; Schanz, D. Acoustic Cavitation and Bubble Dynamics. Arch. Acoust. 2008, 33, 609–617. [Google Scholar]
  84. Landau, L.D.; Lifshitz, E.M. Fluid Mechanics: Chapter VIII: Sound, 6th ed.; Elsevier: Amsterdam, The Netherlands, 1987. [Google Scholar]
  85. Yasui, K. Acoustic Cavitation. In Advances in Acoustic Cavitation; Springer: Cham, Switzerland, 2017; pp. 1–35. [Google Scholar]
  86. Minnaert, M. On Musical Air-Bubbles and the Sounds of Running Water. Lond. Edinb. Dublin Philos. Mag. J. Sci. 1933, 16, 235–248. [Google Scholar] [CrossRef]
  87. Zhao, B.; Hayes, P.; Jak, E. Effects of CaO, Al2O3 and MgO on Liquidus Temperatures of Copper Smelting and Converting Slags under Controlled Oxygen Partial Pressures. J. Min. Metall. B 2013, 49, 153. [Google Scholar] [CrossRef]
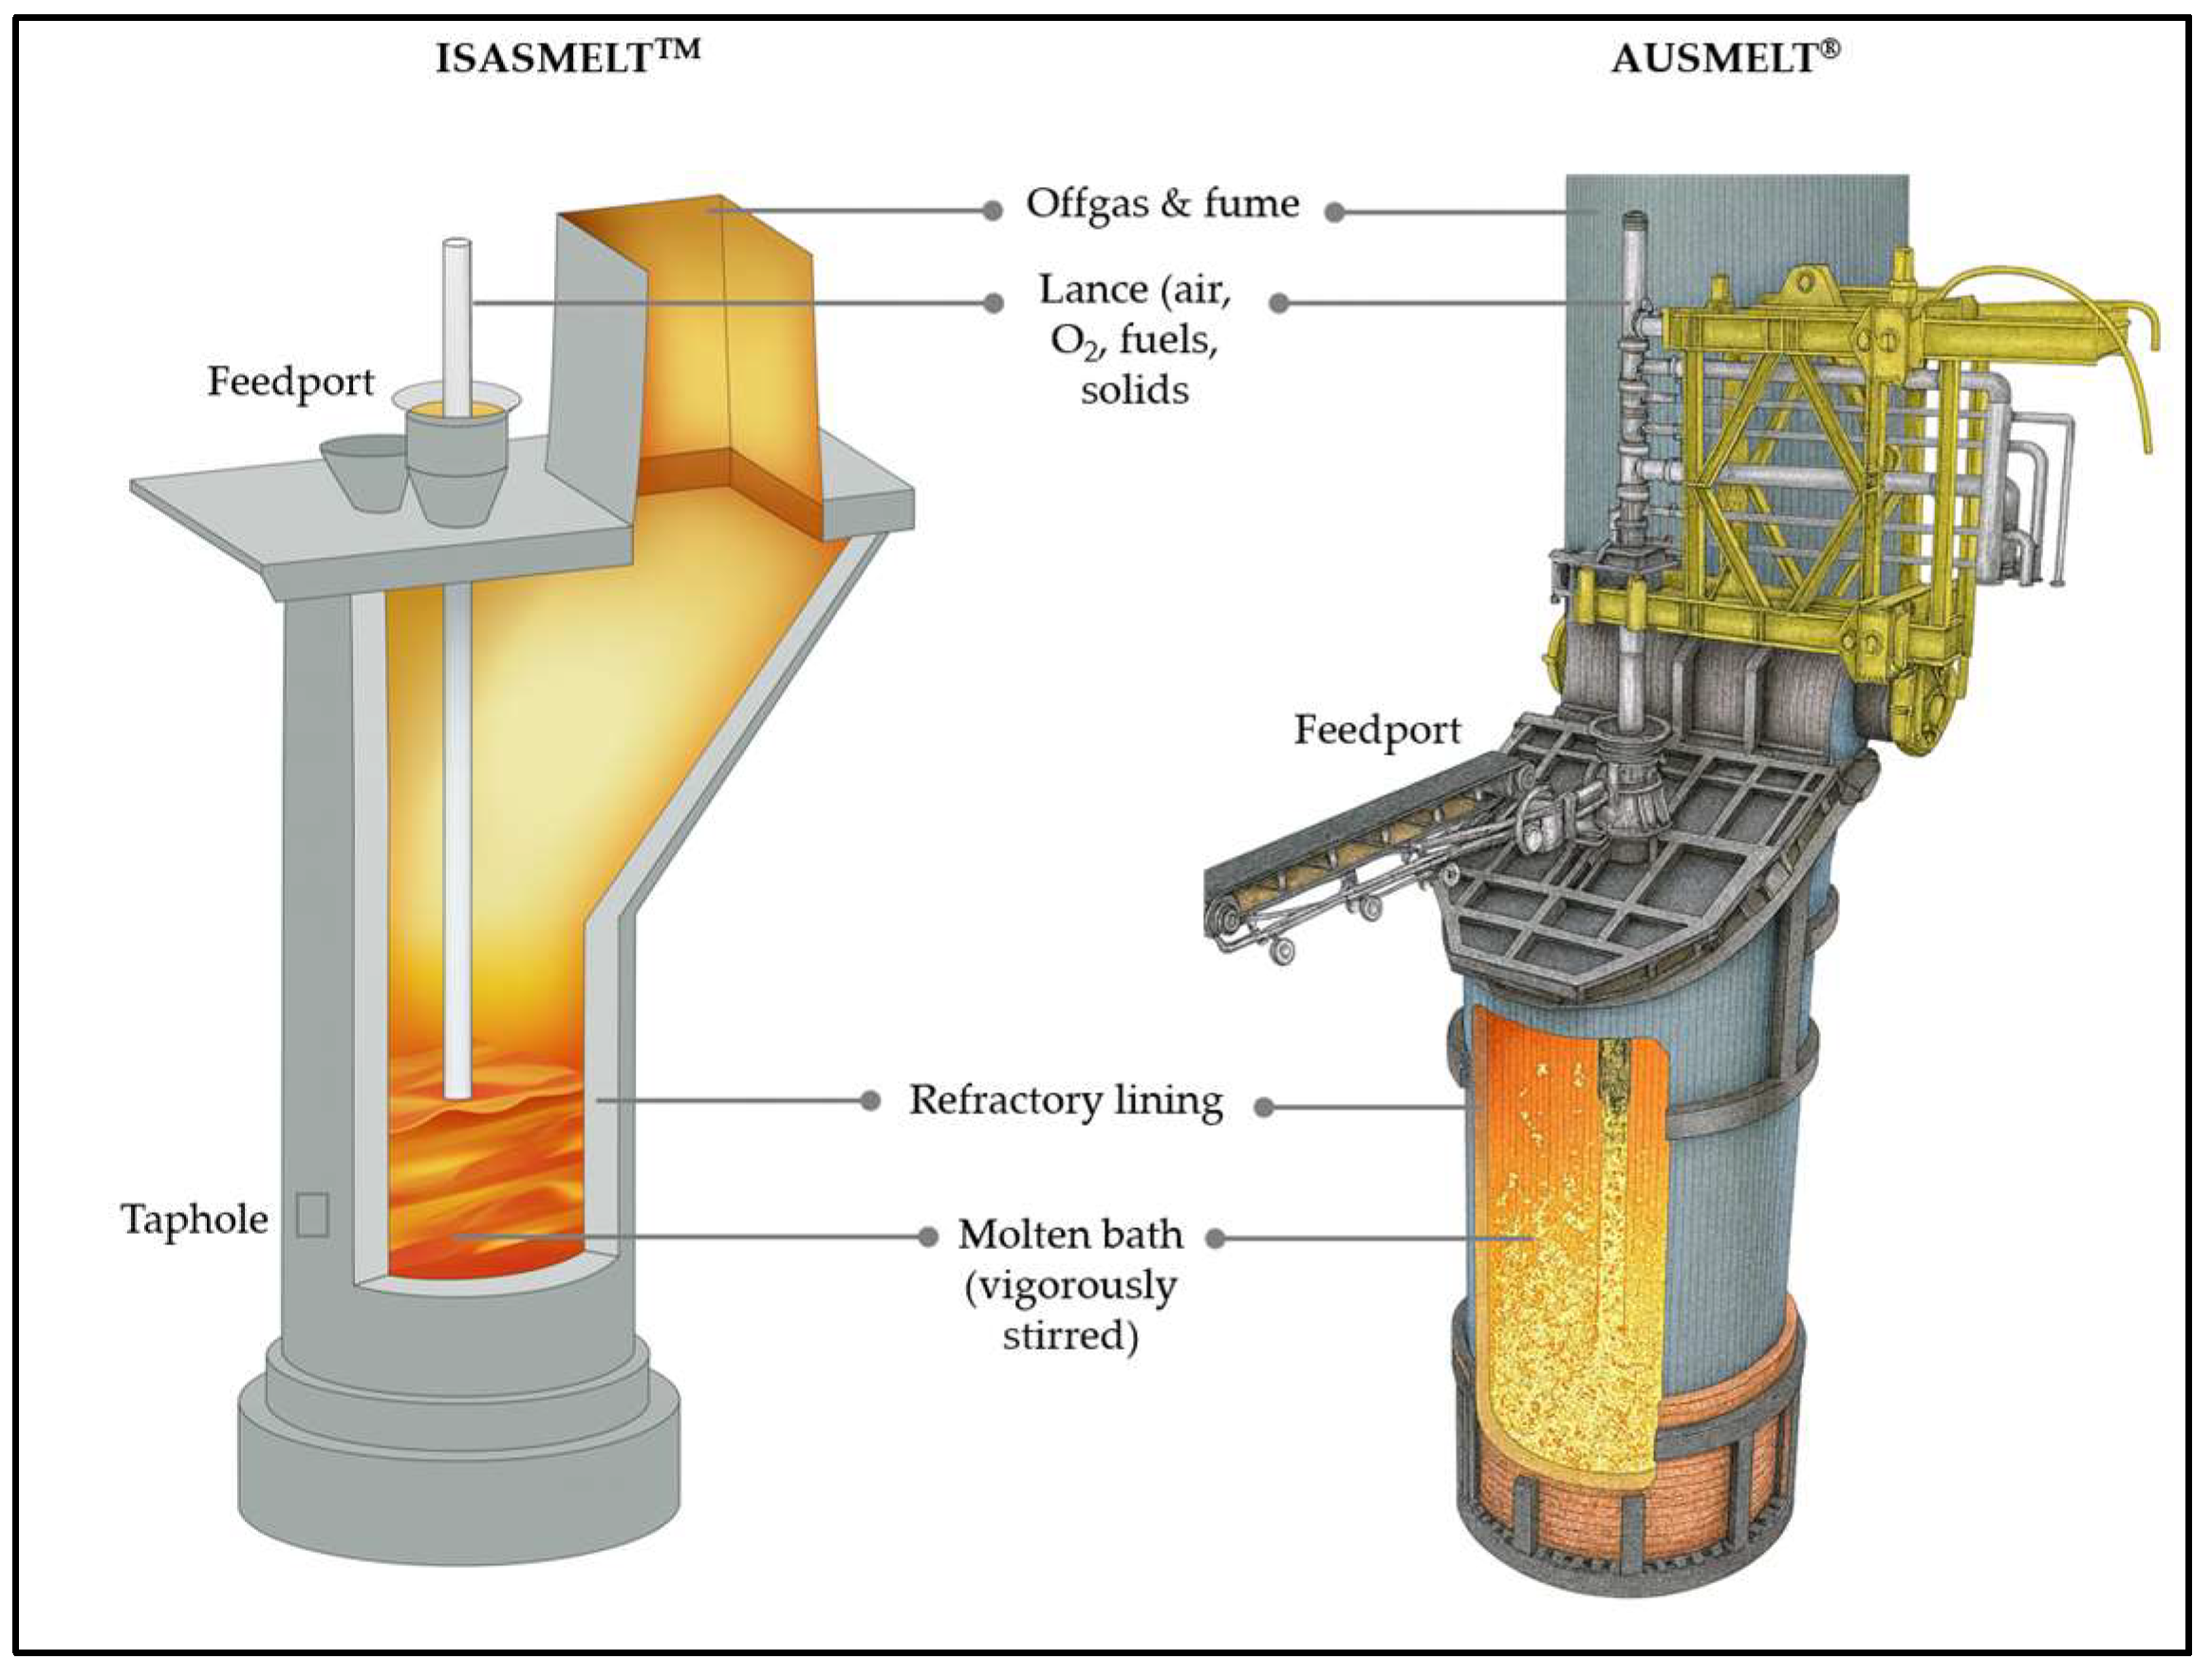
Figure 1. Cutaway diagram. Left: ISASMELTTM TSL furnace from Glencore Technology [15]; Right: AUSMELT® TSL furnace from Metso (formerly known as Outotec) [16], Note: Images are recreated by the authors using GenAI.
Metals 16 00519 g001
Figure 2. Conceptual schematic of bubble and plume dynamics for side-blown, bottom-blown and top-submerged lance systems. The schematics are intended to illustrate the dominant gas injection modes and qualitative bath circulation patterns rather than the detailed multiphase plume structure Actual plume geometry, bubble size distribution and flow instabilities depend on gas momentum, injection velocity, bath properties and furnace scale and may involve complex transitional regimes including bubble coalescence, jetting, spouting and cavity formation.
Metals 16 00519 g002
Figure 3. Schematic representation of different regions in a TSL furnace (Adapted from [18]).
Metals 16 00519 g003
Figure 4. Schematic 2-D representation of forces exerted on a single bubble inside a molten bath without reaction at the surface of the bubble.
Metals 16 00519 g004
Figure 5. Key parameters that affect bubble dynamics in TSL furnace.
Metals 16 00519 g005
Figure 6. Laboratory-scale TSL furnace at the Institute of Nonferrous Metallurgy and Purest Materials (INEMET), TU Bergakademie Freiberg, Germany featuring (A) TSL with acoustic, motion sensors and auxiliary equipment, (B) off-gas analyzers and (C) the control room.
Metals 16 00519 g006
Figure 7. Overview of furnace hall at INEMET, TU Bergakademie Freiberg, Germany, showing pilot-scale TSL furnace, off-gas cleaning unit and auxiliary equipment.
Metals 16 00519 g007
Figure 8. Waveform (top) and spectrogram (bottom) of the acoustic signal (1 s) recorded at an air flow rate of 60 L/h and a lance submersion depth of 2 cm in water-glycerin solution (80:20 wt.%).
Metals 16 00519 g008
Figure 9. Waveform (top) and spectrogram (bottom) of the acoustic signal (1 s) recorded at an air flow rate of 300 L/h and a lance submersion depth of 2 cm in water-glycerin solution (80:20 wt.%).
Metals 16 00519 g009
Figure 10. Viscosity of the fayalitic slag used in this study, measured with a vibrating finger viscometer under inert atmosphere (continuous purging of Argon gas), where multiple curves indicate repeatability of the measurements.
Metals 16 00519 g010
Figure 11. Isothermal FeO-p(O2) phase diagram at 1200 °C for the ferro-silicate slag used in the hot trials, where the operating region is marked in a red circle.
Metals 16 00519 g011
Figure 12. Time-domain acoustic signal from the “top-positioned” microphone at 20 Nm3/h air flow and 2.1 L/h diesel, comparing non-submerged lance combustion with lance submersion depths of 2, 4 and 10 cm.
Metals 16 00519 g012
Figure 13. Time-domain acoustic signal from the “bottom-positioned” microphone at 20 Nm3/h air flow and 2.1 L/h diesel, comparing non-submerged lance combustion with lance submersion depths of 2, 4 and 10 cm.
Metals 16 00519 g013
Figure 14. Smoothed power spectral density (PSD) of “top-positioned” microphone acoustic signals for air flow rates of 20, 30 and 40 Nm3/h at 10 cm lance submersion, plotted together with corresponding non-submerged combustion baselines. (a) Full frequency range, (b) zoomed low-frequency region (0–1000 Hz), (c) zoomed mid-to-high frequency region (0–10,000 Hz). Identical signal-processing and smoothing parameters were applied to all cases to ensure direct comparability.
Metals 16 00519 g014
Figure 15. Smoothed PSD curves of the “top-positioned” microphone for 40 Nm3/h lance air flow rate, showing the effect of lance submersion depth (2, 4, 6 and 10 cm) together with the non-submerged combustion baseline (noise). (a) full frequency spectrum, (b) zoom of the low frequency range, (c) zoom of the mid-to-high frequency region.
Metals 16 00519 g015
Figure 16. Cumulative spectral power (relative units) for submerged (solid lines) and non-submerged (noise/combustion baselines) signals (dashed lines) at 20, 30 and 40 Nm3/h lance flow rate. The zoomed y-axis highlights differences in spectral power accumulation between flow rates that are less visible in the full-scale plot.
Metals 16 00519 g016
Figure 17. Images of pilot-scale campaign featuring (a) fayalitic slag (b) preheating the TSL furnace (c) lance motion sensor coupled to the lance and protected against radiative heat and splash droplets (d) feed conveyor system (e) feed (slag) entering the TSL via feed port (f) lance submerged into the molten bath creating high agitation (g) tapping of the slag (h) slag freeze lining on the lance surface due to splashing.
Metals 16 00519 g017
Figure 18. Smoothed PSD curves of the top microphone for the pilot-scale TSL at 120 Nm3/h air and 13 L/h diesel, comparing background noise, non-submerged lance operation and two lance submersion depths (shallow and 7 cm). (a) Full frequency range (b) zoom of the 0–5 kHz region highlighting low-mid frequency features (c) zoom of the 0–10 kHz region illustrating high-frequency range.
Metals 16 00519 g018
Figure 19. Cumulative acoustic spectral power as a function of frequency for pilot-scale TSL tests at 120 Nm3/h air and 13 L/h diesel, comparing background noise, freeboard operation, shallow lance submersion (~1–2 cm) and 7 cm submersion.
Metals 16 00519 g019
Figure 20. Mean-centered vertical acceleration (X-axis) of the lance measured by the inertial sensor for the laboratory-scale TSL furnace at 40 Nm3/h air and 4.2 L/h diesel for different lance submersion depths. The signal is mean-centered and represents acceleration fluctuations rather than absolute displacement.
Metals 16 00519 g020
Figure 21. Planar acceleration envelope derived from mean-centered Y and Z accelerometer signals for the laboratory-scale TSL furnace 40 Nm3/h air and 4.2 L/h diesel for different lance submersion depths. Increased envelope size indicates stronger lateral dynamic forcing acting on the lance.
Metals 16 00519 g021
Figure 22. Pilot-scale lance motion response measured by the inertial sensor during TSL operation at 120 Nm3/h air flow rate and 13 L/h diesel flow rate. Left: mean-removed X-axis acceleration over a three-second analysis window comparing freeboard lance combustion (lance above the bath) and 7 cm lance submersion. Right: planar motion envelope derived from the mean-removed Y and Z accelerometer components.
Metals 16 00519 g022
Table 1. Elemental analysis of the slag system using XRF technique by Bruker AXS S8 Tiger.
Elementswt.-%
Fe39.2
Si12.1
Al1.60
Ca1.54
Zn1.23
Mg0.91
Cu0.76
K0.72
S0.39
Pb0.19
Table 2. Phase composition of the slag system using XRD technique by Bruker D8.
Phase NameCompositionwt.-%
Fayalite magnesianFe2SiO4.Mg2SiO474.55
Hematite (Iron III)Fe2O30.35
LarniteCa2SiO43.50
Magnetite (Iron II, III)Fe3O413.79
PericlaseMgO7.03
Aluminum Copper (metallic entrainments)Al2Cu0.78
Disclaimer/Publisher’s Note: The statements, opinions and data contained in all publications are solely those of the individual author(s) and contributor(s) and not of MDPI and/or the editor(s). MDPI and/or the editor(s) disclaim responsibility for any injury to people or property resulting from any ideas, methods, instructions or products referred to in the content.