Article

Online Classification for Resistance Spot Weld Quality Using Dual-Interval Mean Discretization and Gradient-Boosting Models


Guangdong Provincial Welding Engineering Technology Research Center, Guangdong University of Technology, No. 100 West Waihuan Road, Higher Education Mega Center, Panyu District, Guangzhou 510006, China
*
Author to whom correspondence should be addressed.
Metals 2026, 16(5), 503; https://doi.org/10.3390/met16050503
Submission received: 25 March 2026 / Revised: 22 April 2026 / Accepted: 29 April 2026 / Published: 5 May 2026

Abstract

Accurate and interpretable weld-quality assessment is essential for ensuring the reliability of resistance spot welding in industrial production. This study develops a data-efficient classification framework that integrates dual-interval mean discretization (DIMD) of dynamic-resistance signals with gradient-boosting models. The proposed DIMD method applies fine discretization during the rapid heating–melting and coarse discretization during the subsequent slow-evolving period, effectively preserving the peak–valley morphology of resistance curves while reducing feature dimensionality. Using these compact features, XGBoost and CatBoost classifiers were trained on a dataset of DC01 low-carbon steel, covering five weld conditions. CatBoost achieved the highest accuracy of 98.9%, attributed to its ordered-boosting mechanism and symmetric-tree structure. Validation on an independent 198-sample dataset confirmed the generalization capability of the proposed approach. SHapley Additive exPlanations (SHAP)-based interpretability analysis further revealed that resistance-peak characteristics and energy-related descriptors dominate model decisions, aligning with the physical process of nugget formation and expulsion. Experimental results demonstrate that the DIMD–CatBoost framework provides a physically consistent, interpretable, and high-accuracy solution for intelligent weld-quality inspection.

1. Introduction

Resistance spot welding (RSW) is widely used in automotive, rail transit, and aerospace manufacturing due to its high efficiency, low cost, and suitability for mass production [1,2,3]. The process joins metal sheets through resistive heating under electrode pressure [4]. A typical welding cycle consists of pre-loading, heating, and cooling, during which a molten nugget forms and solidifies [5]. In automotive body assembly, RSW accounts for nearly 90% of welding operations, with each vehicle containing approximately 5000–8000 spot welds [6,7], making weld quality critical for structural integrity, mechanical strength, and safety. However, variations in process parameters, electrode conditions, and material surface states can lead to defects such as expulsion, porosity, and weak joints [8,9]. Conventional quality control mainly relies on destructive testing, which is labor-intensive, costly, and unsuitable for real-time monitoring [10]. Therefore, intelligent non-destructive methods for online weld-quality evaluation are urgently needed [11]. Among various welding defects, welding expulsion—the ejection of fine molten metal particles from the faying interface during electric heating—is one of the most common and detrimental [12]. The root cause of expulsion lies in the rupture of a molten nugget surrounding, leading to sudden metal discharge. Excessive expulsion not only degrades joint strength but also increases post-process polishing workload, affecting production efficiency [13]. High-speed imaging and multi-sensor fusion studies have revealed that welding status could be detected by the weld imaging characteristics [14,15]. Previous studies have shown that welding parameters, particularly current, electrode force, and pulse pattern, are key factors influencing expulsion formation. Comparative investigations have demonstrated that secondary-pulse welding significantly enhances mechanical strength and suppresses porosity formation compared with single-pulse welding [16]. Optimized preheating in double-pulse modes stabilizes nugget encapsulation, and reduces expulsion probability by up to 90%. These findings indicate that appropriate multi-pulse control can improve both structural performance and process stability [17,18].
Despite advances in process optimization, real-time intelligent defect detection remains challenging. Traditional monitoring methods rely on manually defined thresholds, which cannot capture nonlinear and transient signal characteristics [19]. Multi-sensor fusion approaches based on electrode displacement and visual sensing improve performance but still depend on handcrafted features and BP neural networks, limiting scalability and adaptability [20,21]. Recent sensing and machine-learning techniques enable data-driven weld-quality prediction. Signals such as dynamic resistance, current, voltage, and electrode displacement have been used to characterize welding behavior [22]. However, most methods rely on manual feature extraction, introducing subjectivity and limiting generalization. In addition, uniform discretization or direct time-domain sampling fails to capture the non-uniform temporal characteristics of dynamic resistance, especially during rapid transient stages. Although machine-learning models show promising performance, their lack of physical interpretability makes it difficult to relate predictions to welding mechanisms. Therefore, a method that preserves physical characteristics while providing compact and interpretable features is required. Similar limitations exist in other industrial defect detection tasks, where threshold-based methods struggle with variability and deep-learning approaches with attention mechanisms improve robustness [23,24].
To address these challenges, this study develops a weld-quality classification approach based on dynamic resistance signals. Multimodal feature construction and ensemble learning are further introduced to enhance representation and classification performance. A dual-interval mean discretization (DIMD) strategy is developed, applying fine resolution in the early transient stage and coarse resolution in the later stage, thereby preserving peak–valley characteristics while reducing feature dimensionality.
The extracted features are fed into gradient-boosting models, including XGBoost v2.1.0 and CatBoost v1.2.3 were used for classification. SHAP analysis is employed to quantify feature contributions and relate model outputs to nugget formation mechanisms. The main contributions are summarized as follows: (1) A dual-interval discretization method that captures non-uniform temporal characteristics of dynamic resistance signals; (2) A gradient-boosting-based classification framework for weld-quality identification; (3) Feature importance analysis linking model predictions with welding mechanisms; (4) Validation on both primary and independent datasets to assess generalization performance.

2. Experimental Setup and Data Acquisition

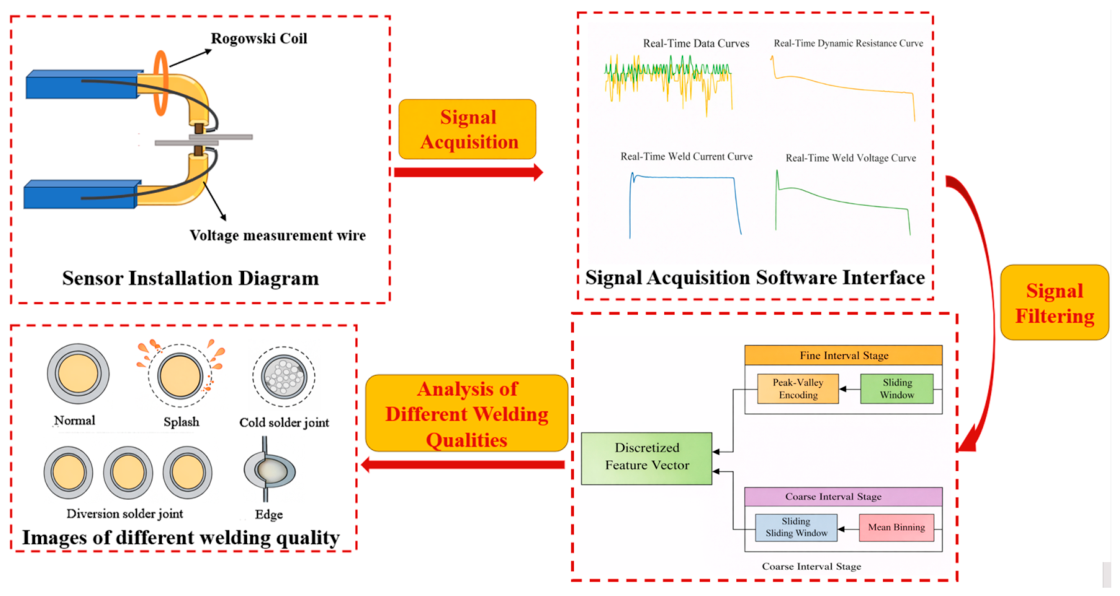
The experiments were carried out on DC01 low-carbon steel sheets. The chemical composition and mechanical properties of the material are summarized in Table 1 and Table 2, respectively. The sheets were assembled in a lap-joint configuration commonly used in resistance spot welding. The specimen geometry, sensor installation, signal acquisition process, and weld-quality analysis workflow of resistance spot welding are illustrated in Figure 1.
The mechanical properties listed in Table 2 are obtained from standard material specifications for DC01 low-carbon steel rather than from repeated experimental measurements.
All welds were produced using a mid-frequency direct-current (MFDC) resistance spot welding system equipped with a welding gun. As shown in Figure 1, the workflow of signal acquisition, processing, and quality analysis is presented. Welding current and voltage were synchronously measured using a Rogowski coil and voltage measurement equipment, respectively, as illustrated in the sensor installation diagram. The signals were transmitted to a high-speed data acquisition system and sampled at 100 kHz via dedicated acquisition software, enabling accurate capture of transient phenomena such as electrode contact evolution, nugget formation, and expulsion.
The raw current and voltage signals were then filtered, and dynamic resistance was calculated from the processed signals, as shown in the signal processing stage of Figure 1. The extracted dynamic resistance characteristics were further analyzed to distinguish different welding quality conditions, corresponding to the welding images and analysis results presented in Figure 1.

3. Dynamic Resistance Analysis and Feature Extraction

3.1. Dynamic Resistance Signal Characteristics

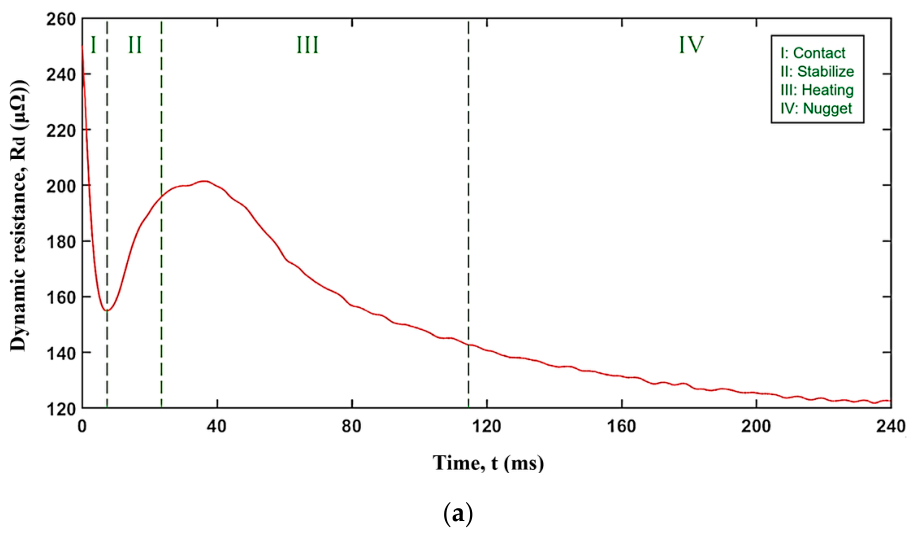
The dynamic resistance curve reflects the coupled thermal–electrical behavior during resistance spot welding and exhibits a characteristic evolution closely associated with nugget formation. As shown in Figure 2a, the signal progression can be divided into four phases, corresponding to electrode contact stabilization, heating, melting, and nugget solidification. At the initial stage (Phase I), microscopic asperities and oxide films dominate the interface, resulting in high resistance that rapidly decreases as surface softening increases the real contact area. During the heating stage (Phase II), continuous Joule heating raises the workpiece temperature, leading to a gradual resistance increase due to the positive temperature coefficient of resistivity.
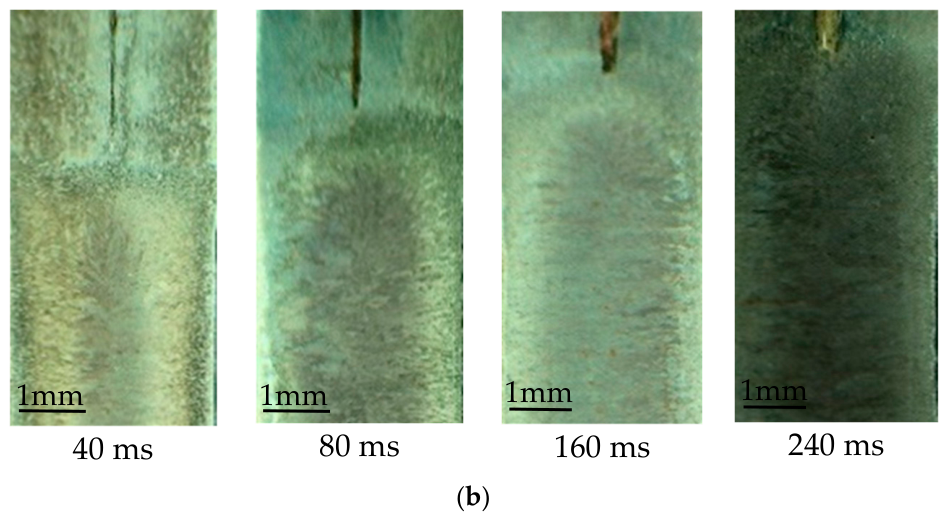
The microstructural evolution of the weld nugget results at different welding times is shown in Figure 2b. As shown in Figure 2b, no distinct nugget is observed at 40 ms, indicating that the resistance increase in Phase II is mainly governed by temperature rise rather than phase transformation. When the interface approaches the melting point (Phase III), the dynamic resistance reaches a maximum. Early melting competes with thermal resistivity increase, resulting in a temporary peak. This is supported by the microstructure at 80 ms, where initial nugget formation is observed, indicating the onset of melting and solid–liquid transformation. As molten metal accumulates, the lower resistivity of the liquid phase dominates, causing a decrease in resistance. At 160 ms, the nugget in Figure 2b grows significantly compared with that at 80 ms, suggesting that the increasing liquid fraction governs the subsequent resistance drop. This peak–valley transition is the most informative part of the curve, reflecting the balance among heat input, nugget formation, and process stability. Finally, the resistance stabilizes as the nugget solidifies and heat dissipation becomes dominant in Phase IV. As shown in Figure 2b, the nugget morphology at 240 ms stabilizes, indicating that nugget growth approaches saturation under the given parameters, which is consistent with the stabilized dynamic resistance.
Overall, the microstructural evolution at different welding times agrees well with the phase-dependent characteristics of the dynamic resistance curve, supporting the proposed four-stage interpretation.
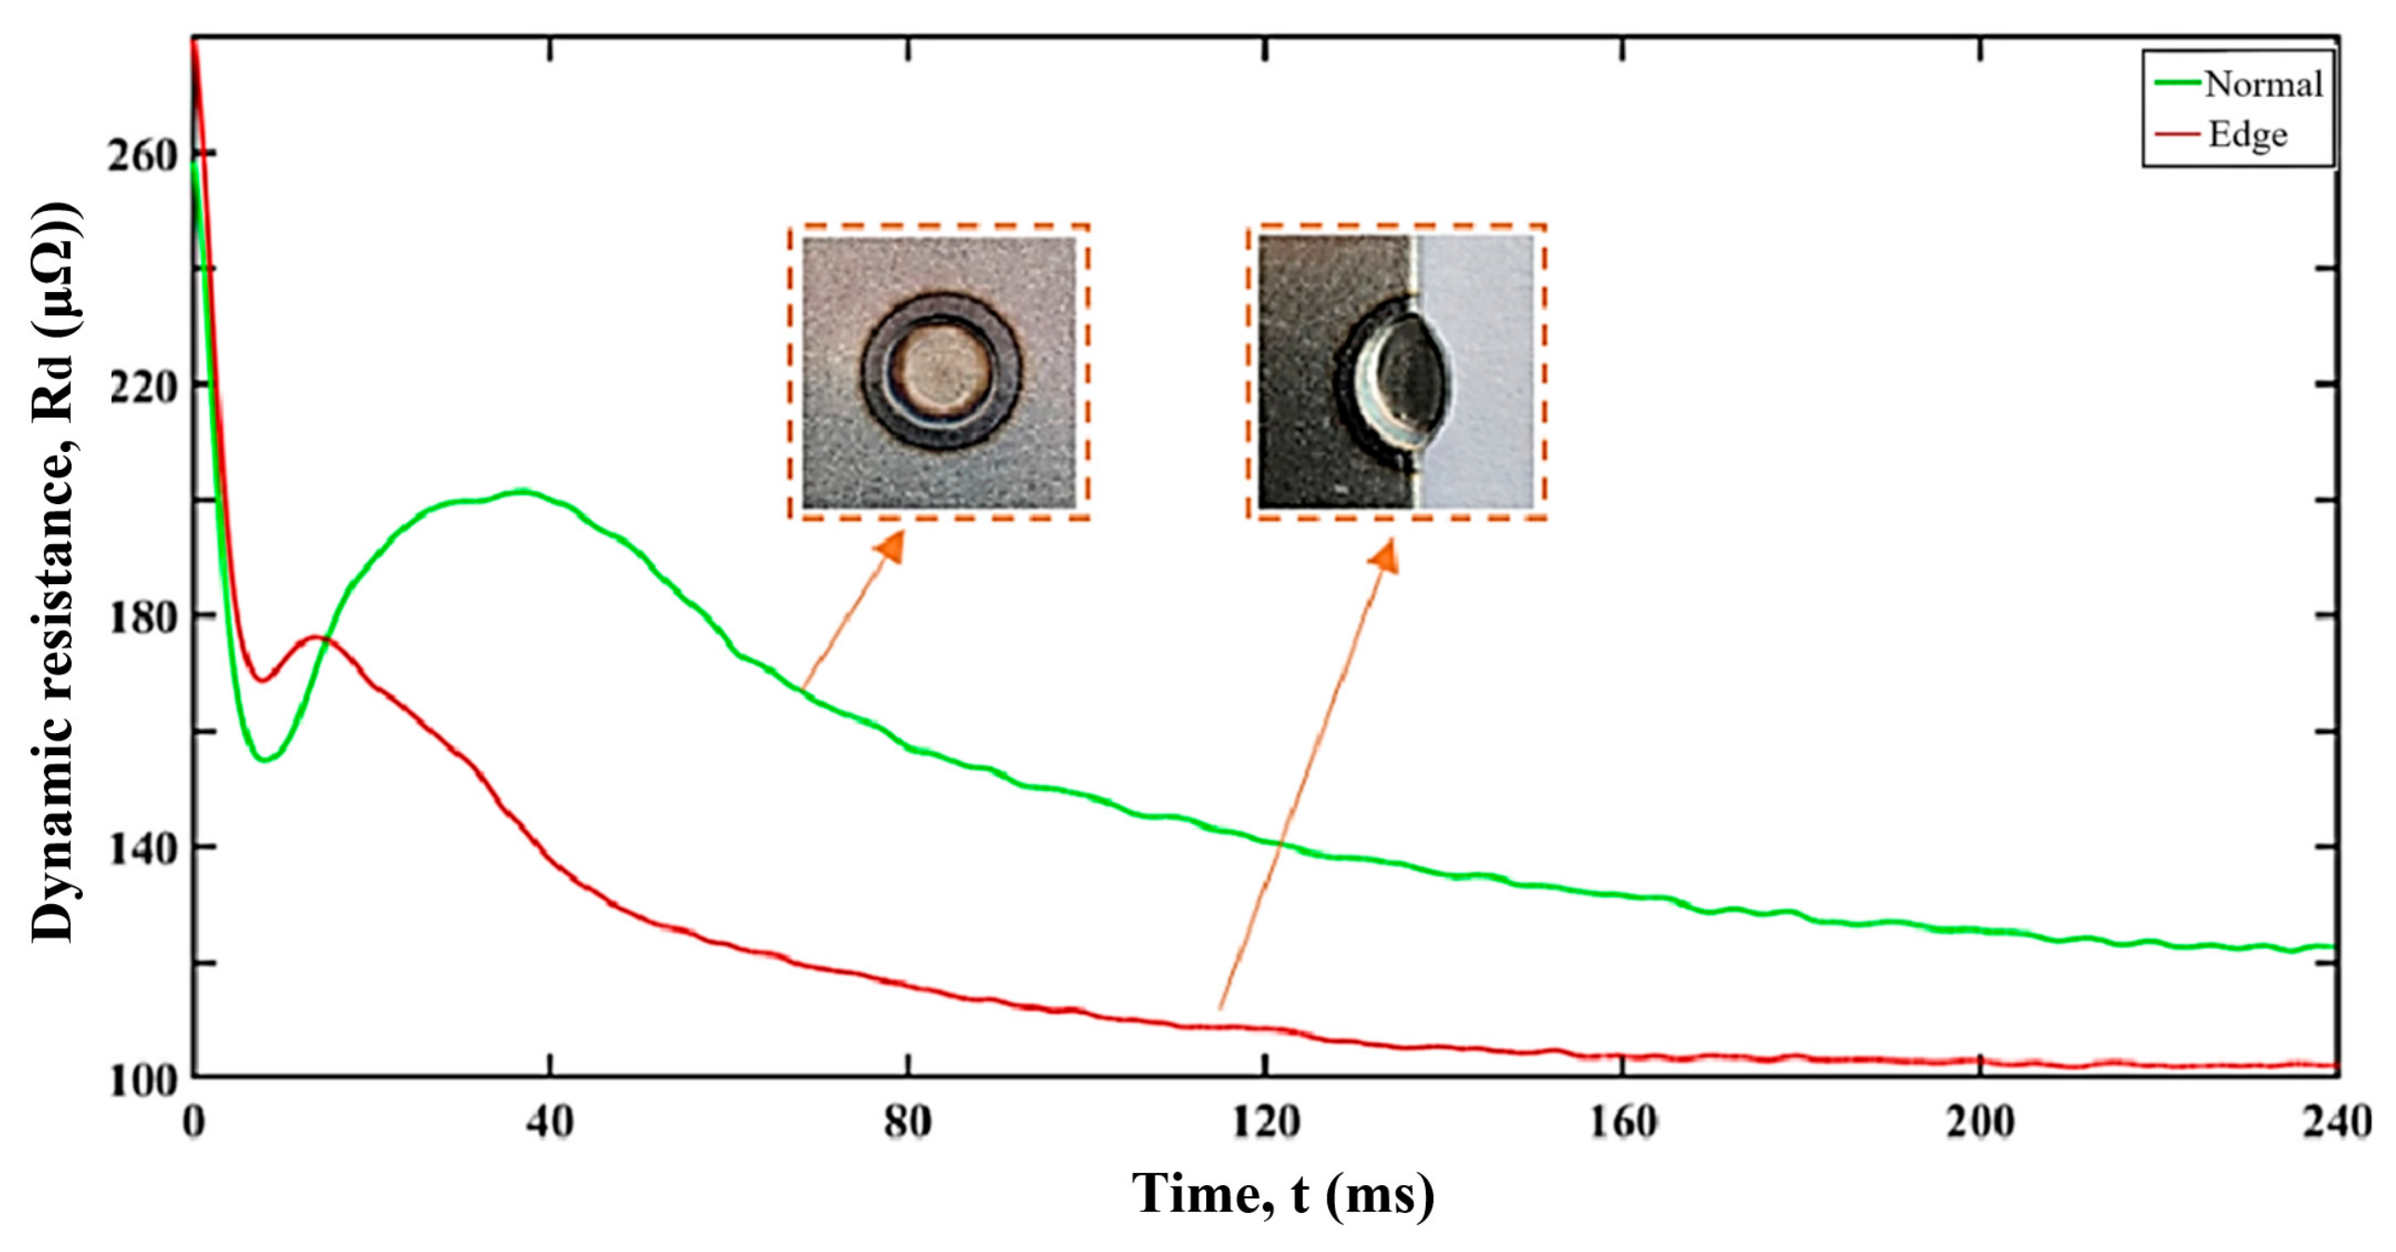
It can be seen that weld defects modify the evolution of dynamic resistance in physically meaningful ways. As shown in Figure 3, edge deviation results in a higher initial resistance due to the reduced effective electrode contact area near the sheet boundary. The insufficient lateral constraint shortens the heating period, often leading to premature metal expulsion and a lower final resistance level. These observations indicate a clear correspondence between weld defects and the dynamic resistance profile.
Among weld defects, expulsion produces the most abrupt dynamic resistance response. The resistance curve typically reaches its peak earlier and then drops sharply, reflecting the sudden ejection of molten metal under excessive internal pressure. This rapid decline corresponds to the collapse of the molten region and the loss of heat and conductive volume. In contrast, incomplete fusion (cold welds) lacks a distinct valley-to-peak transition. Insufficient heat input prevents nugget formation, resulting in a smooth and flattened resistance profile with minimal variation during Phases II and III. Overall, the normal four-phase resistance pattern provides a stable reference, while variations in peak amplitude, timing, slope, and final resistance level form distinct electrical signatures for different weld quality conditions. These defect-dependent characteristics provide the physical basis for subsequent feature discretization and classification.

3.2. Dual-Interval Mean Discretization (DIMD) Method

The dual-interval mean discretization (DIMD) method provides an adaptive strategy for transforming continuous dynamic-resistance signals into compact feature vectors for machine-learning classification. Unlike uniform discretization, which applies a fixed averaging interval over the full welding cycle, DIMD explicitly accounts for the nonuniform temporal behavior of the resistance waveform by assigning different averaging windows to transient and steady-state phases.
The welding cycle is divided into two temporal regions based on the rate of change in the dynamic resistance signal. During the initial 0–100 ms, where electrode contact stabilization, heating, and melting occur, the resistance exhibits rapid variations. To retain these transient features, a fine averaging interval of 5 ms is applied. Beyond 100 ms, the signal enters a slower regime dominated by molten-metal contraction and solidification, where a coarser interval of 10 ms is used to reduce feature dimensionality while preserving the overall trend.
The selection of the interval boundary and window sizes is based on the physical characteristics of the dynamic resistance evolution in the welding process. As described in Section 3.1 and illustrated in Figure 2, the early stage corresponds to electrode contact stabilization, rapid temperature rise, and the onset of melting, during which the resistance signal exhibits strong fluctuations, high gradients, and distinct peak–valley transitions. To accurately capture these transient features, a smaller window size (5 ms) is adopted in the 0–100 ms interval.
After approximately 100 ms, the welding process gradually enters a relatively stable regime dominated by molten metal growth and solidification. As observed from the dynamic resistance curves, the signal evolves more smoothly, and its variation rate decreases significantly. Therefore, a larger window size (10 ms) is sufficient to preserve the overall trend while effectively reducing feature dimensionality and suppressing noises.
Furthermore, preliminary comparisons with alternative window configurations indicate that excessively small windows increase noise sensitivity, while overly large windows lead to loss of critical peak information. The selected combination provides a balanced trade-off between temporal resolution and computational efficiency.
For each interval, the mean resistance value is computed and stored as one feature dimension. If the dynamic resistance signal R ( t ) is sampled at discrete time points, the DIMD feature for interval k is defined as
R ¯ k = 1 n k i = 1 n k R ( t i )
where R ( t i ) denotes the dynamic resistance at sampling time t i , n k represents the number of raw samples within the k -th averaging window, and R ¯ k denotes the mean resistance used as the feature value for that interval. The resulting feature vector concatenates the time-ordered interval means, forming a compact representation that preserves the characteristic morphology of the resistance waveform.
Table 3 summarizes the performance of different discretization strategies. The proposed DIMD method achieves an optimal balance between feature preservation and computational efficiency. Compared with the single-interval 5 ms method, DIMD reduces feature dimensionality by approximately 29% (48→34 features) while maintaining equivalent classification performance.
The DIMD results for different weld conditions show that the discretized curves follow the main temporal evolution of the original signals while significantly reducing data density. By applying phase-dependent resolution, the method preserves the physical characteristics of the resistance curve, and the resulting features remain interpretable and effective for subsequent gradient-boosting classification.

3.3. Motivation for Feature Discretization

Although the dynamic resistance curve contains rich temporal information reflecting nugget formation, its raw form is high-dimensional, noisy, and not directly suitable for machine-learning classification. As welding progresses from initial electrode contact to melting and solidification, the signal exhibits both rapid transient variations and slowly varying segments, resulting in inconsistent resolution requirements across different stages. This mismatch motivates the development of an efficient representation that preserves essential physical characteristics while reducing computational complexity.
Therefore, a dual-interval mean discretization (DIMD) strategy is introduced, applying finer sampling in the early transient stage and coarser sampling in the later steady stage. This approach also provides the basis for selecting stage-dependent window sizes in the proposed discretization scheme.
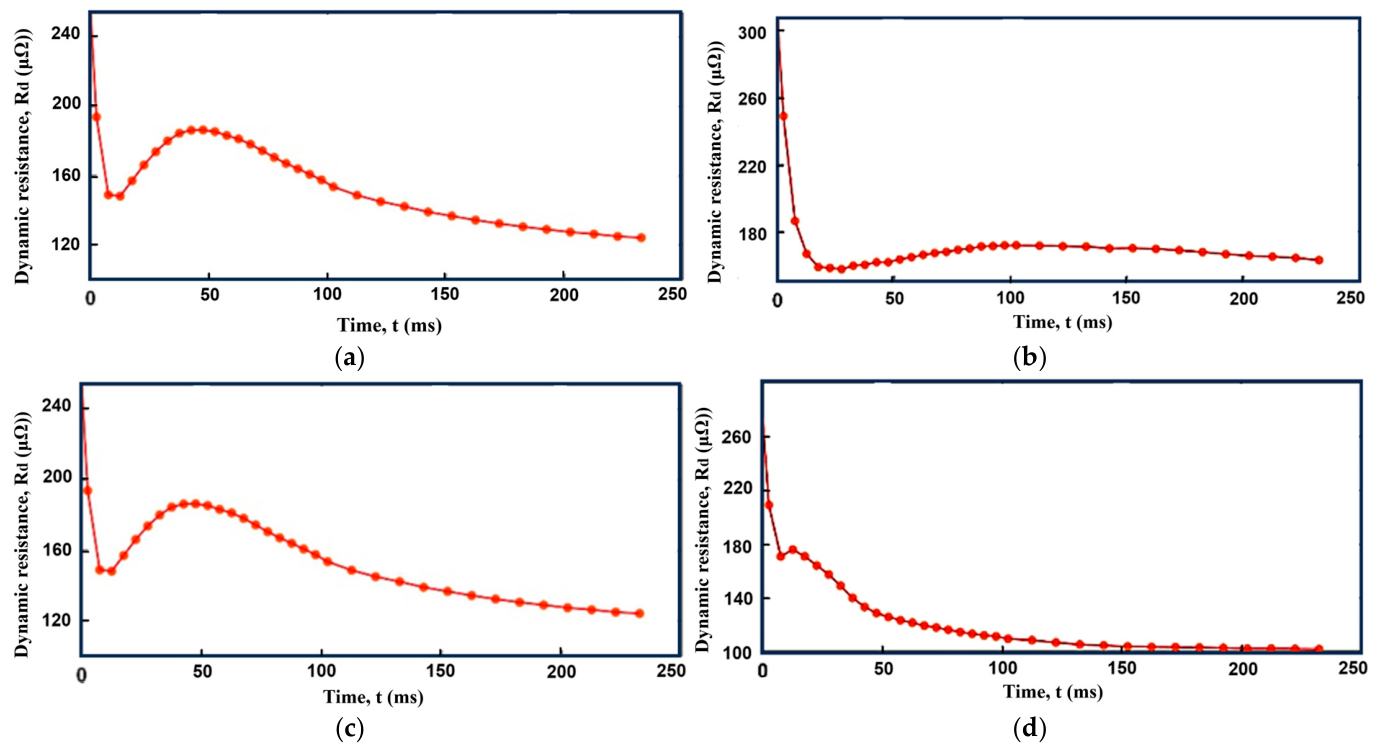
These limitations become more evident in defective welds. Figure 4 shows that normal, incomplete-fusion, shunt, and edge-deviation welds retain their characteristic rising slopes, peak shapes, and decline patterns after dual-interval discretization, but not under coarse single-interval sampling. The flattened curve of a cold weld, the reduced peak of a shunt weld, and the shortened rise of an edge weld remain distinguishable both visually and numerically when appropriate temporal resolution is applied. In contrast, uniform coarse sampling masks these features, causing different weld defects to collapse into similar discretized profiles.

4. Gradient-Boosting-Based Classification Results

4.1. Classification Framework

The dual-interval mean discretized (DIMD) dynamic-resistance features described in Section 3 are used as inputs for weld-quality classification. Two gradient-boosting models, XGBoost and CatBoost, are employed due to their effectiveness in handling nonlinear tabular data. All samples are labeled into five weld categories—normal, expulsion, cold weld, shunt, and edge deviation—based on weld morphology and mechanical characteristics observed in the experiments. The dataset is obtained from controlled resistance spot welding experiments, where parameters such as current, welding time, and electrode pressure are systematically varied. Typical defect conditions, including expulsion, insufficient fusion, shunting, and edge welding, are intentionally introduced to ensure representative weld-quality classes.
An 80/20 training–testing split is applied to the 450-sample dataset to evaluate baseline classification performance. To further assess robustness, an independent dataset consisting of 198 samples, obtained from separate experiments under different process conditions, is used for validation. This dataset follows the same five-class structure and labeling criteria as the primary dataset, based on weld morphology and mechanical characteristics. The training set is used to build the models, while the testing set is used for performance evaluation.
Both classifiers follow the boosting paradigm [25], where successive trees are trained to correct residuals from previous iterations [26,27]. XGBoost optimizes an objective function that balances prediction accuracy and model complexity.
T ( m ) = i l ( y i , y ^ i ( m 1 ) + f m ( x i ) ) + Q ( f m )
where T ( m ) denotes the objective function at iteration m , l ( ) represents the loss function, y i is the true label, y ^ i ( m | 1 ) denotes the prediction from the previous iteration, f m ( x i ) represents the output of the m -th regression tree for input x i , and Q ( f m ) is a regularization term used to control model complexity and mitigate overfitting.
CatBoost follows the same boosting principle but incorporates ordered boosting and symmetric tree structures to mitigate prediction shift and enhance stability on medium-sized datasets [28], particularly when class distributions are imbalanced [29,30]. The model initialization and iterative training of CatBoost are shown as Equation (3) and Equation (4), respectively.
F 0 = a r g m i n i L ( y i , s ) 2
where F 0 denotes the initial prediction of the model, L ( ) is the loss function, y i represents the true label of the i -th sample, and s is the prediction label.
D i ( m ) = L ( y i , F m 1 ( x i ) ) F m 1 ( x i )
where D i ( m ) denotes the negative gradient of the loss function for sample i at iteration m , F m 1 ( x i ) represents the prediction from the previous iteration, and the gradient is used to guide the training of the new decision tree.
No handcrafted statistical features are introduced beyond the DIMD representation, and the models operate solely on discretized dynamic-resistance signatures. The evaluation metrics include accuracy and confusion matrices, and the comparative performance of the two models is reported in Section 4.2.

4.2. Results on the Sample Dataset

To provide a comprehensive evaluation of classification performance, precision, recall, and F1-score are introduced in addition to accuracy. As weld-quality classification involves multiple defect categories, these metrics enable a detailed assessment of false-positive and false-negative predictions. The models were evaluated on a 450-sample dataset, including 90 normal welds and 360 defective welds. The DIMD feature vectors enabled high recognition accuracy across all five weld-quality categories. An 80/20 training–testing split was used for baseline evaluation. To assess stability, three additional random splits were performed, with accuracy variations within ±2%, indicating consistent performance across different data partitions.
XGBoost achieved an accuracy of 93.3% with six misclassified samples, mainly between cold welds and expulsion (spatter), reflecting partial overlap in their resistance-peak characteristics. CatBoost outperformed XGBoost, achieving 98.9% accuracy with only one misclassification. Precision, recall, and F1-score further confirm that DIMD–CatBoost maintains high classification performance across all weld categories, demonstrating strong capability in distinguishing defect types.
Table 4 summarizes the performance comparison between XGBoost and CatBoost. The consistently high F1-scores indicate a good balance between false positives and false negatives, which is critical for reliable weld-quality detection. The superior performance of CatBoost is attributed to its ordered boosting and symmetric tree structure, which provide more stable decision boundaries, particularly for incomplete-fusion and shunt welds with similar early-stage resistance gradients.
CatBoost demonstrates superior performance across all evaluation metrics, with the error rate reduced by 83.3% compared to XGBoost. This improvement is attributed to its ordered boosting and symmetric tree structure, which yield more stable decision boundaries, particularly for incomplete-fusion and shunt welds with similar early-stage resistance gradients. For multi-class evaluation, macro-averaging is adopted to ensure equal importance of each class and avoid bias toward dominant categories, confirming stable performance across both normal and defective welds.
Overall, results on the 450-sample dataset indicate that DIMD effectively preserves defect-specific features, while CatBoost provides a more reliable classification baseline. It consistently outperforms XGBoost in accuracy, precision, recall, and F1-score, consistent with the reduced number of misclassified samples, especially for challenging defect types such as edge-deviation welds.
This performance advantage is further validated on an independent dataset collected under different welding conditions, indicating that the results are not dependent on a specific data split. Despite differences in data distribution, consistent classification performance is maintained. In particular, CatBoost shows stable behavior across defect types, suggesting that the proposed DIMD features effectively capture representative characteristics of dynamic resistance signals. These results demonstrate strong robustness under varying welding conditions and highlight the potential for practical industrial applications.

5. Multimodal Fusion and Ensemble Learning

5.1. Multimodal Feature Construction

To evaluate generalization and the contribution of additional sensing channels, a multimodal feature set is constructed using welding current, voltage, and dynamic resistance signals. These signals capture complementary aspects of the electro-thermal process: current reflects instantaneous heat input, voltage characterizes electrode–workpiece contact conditions, and dynamic resistance represents their coupled behavior. The combined modalities therefore provide a more complete description of weld dynamics than resistance alone.
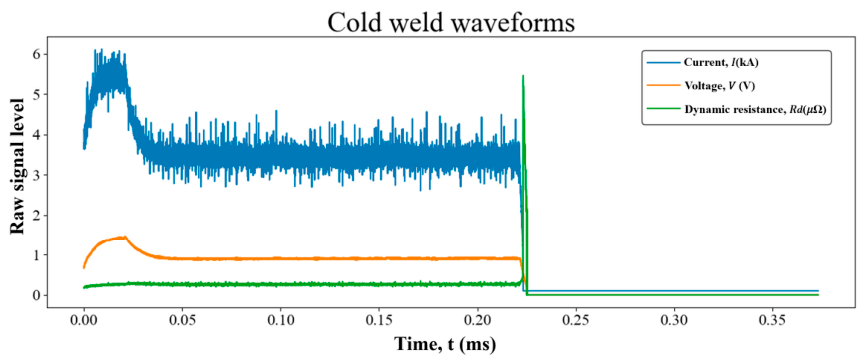
Before preprocessing, the raw waveforms are examined as a reference. As shown in Figure 5, the signals exhibit distinct amplitude levels and fluctuation patterns: current follows a periodic profile imposed by the power-control system, voltage varies gradually with contact evolution, and dynamic resistance changes relatively smoothly. All signals are normalized for comparison. The signals show limited variation, indicating insufficient heat input and incomplete nugget formation. High-frequency disturbances from electrode vibration and measurement circuitry are also observed. These signals provide a baseline for interpreting the transient behavior in Figure 6 and the smoothing effects in Figure 7.
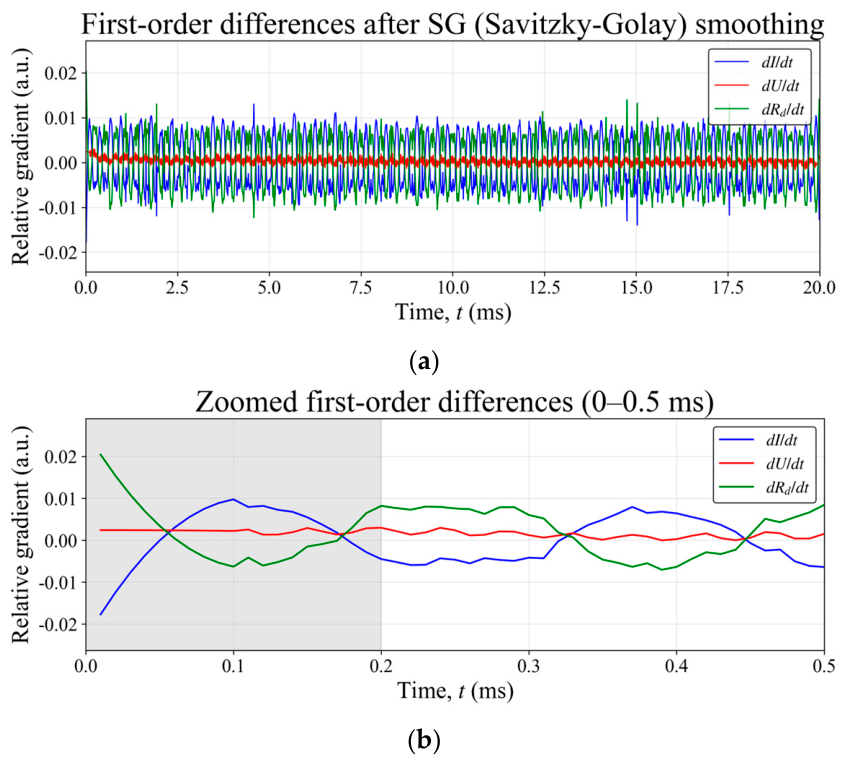
The first-order derivatives of welding current I , voltage U , and dynamic resistance R d reveal signal dynamics over the full welding cycle and the early transient stage. As shown in Figure 6a, d I / d t exhibits pronounced periodic oscillations with clear rise–fall transitions induced by the power-control system, whereas d U / d t and d R d / d t are smaller and smoother, reflecting slower variations during the steady stage. Figure 6b shows an enlarged view of the 0–0.5 ms interval. In the shaded 0–0.2 ms region corresponding to electrode–workpiece contact establishment, d I / d t displays a distinct peak–valley pattern, while d U / d t and d R d / d t show only mild fluctuations. This indicates that the current signal contains richer high-frequency transient information at the initial stage. For clarity, all gradients are presented on a relative scale. Overall, the combined use of current, voltage, and resistance signals provides a more complete description of early welding dynamics and supports multimodal weld-quality assessment.
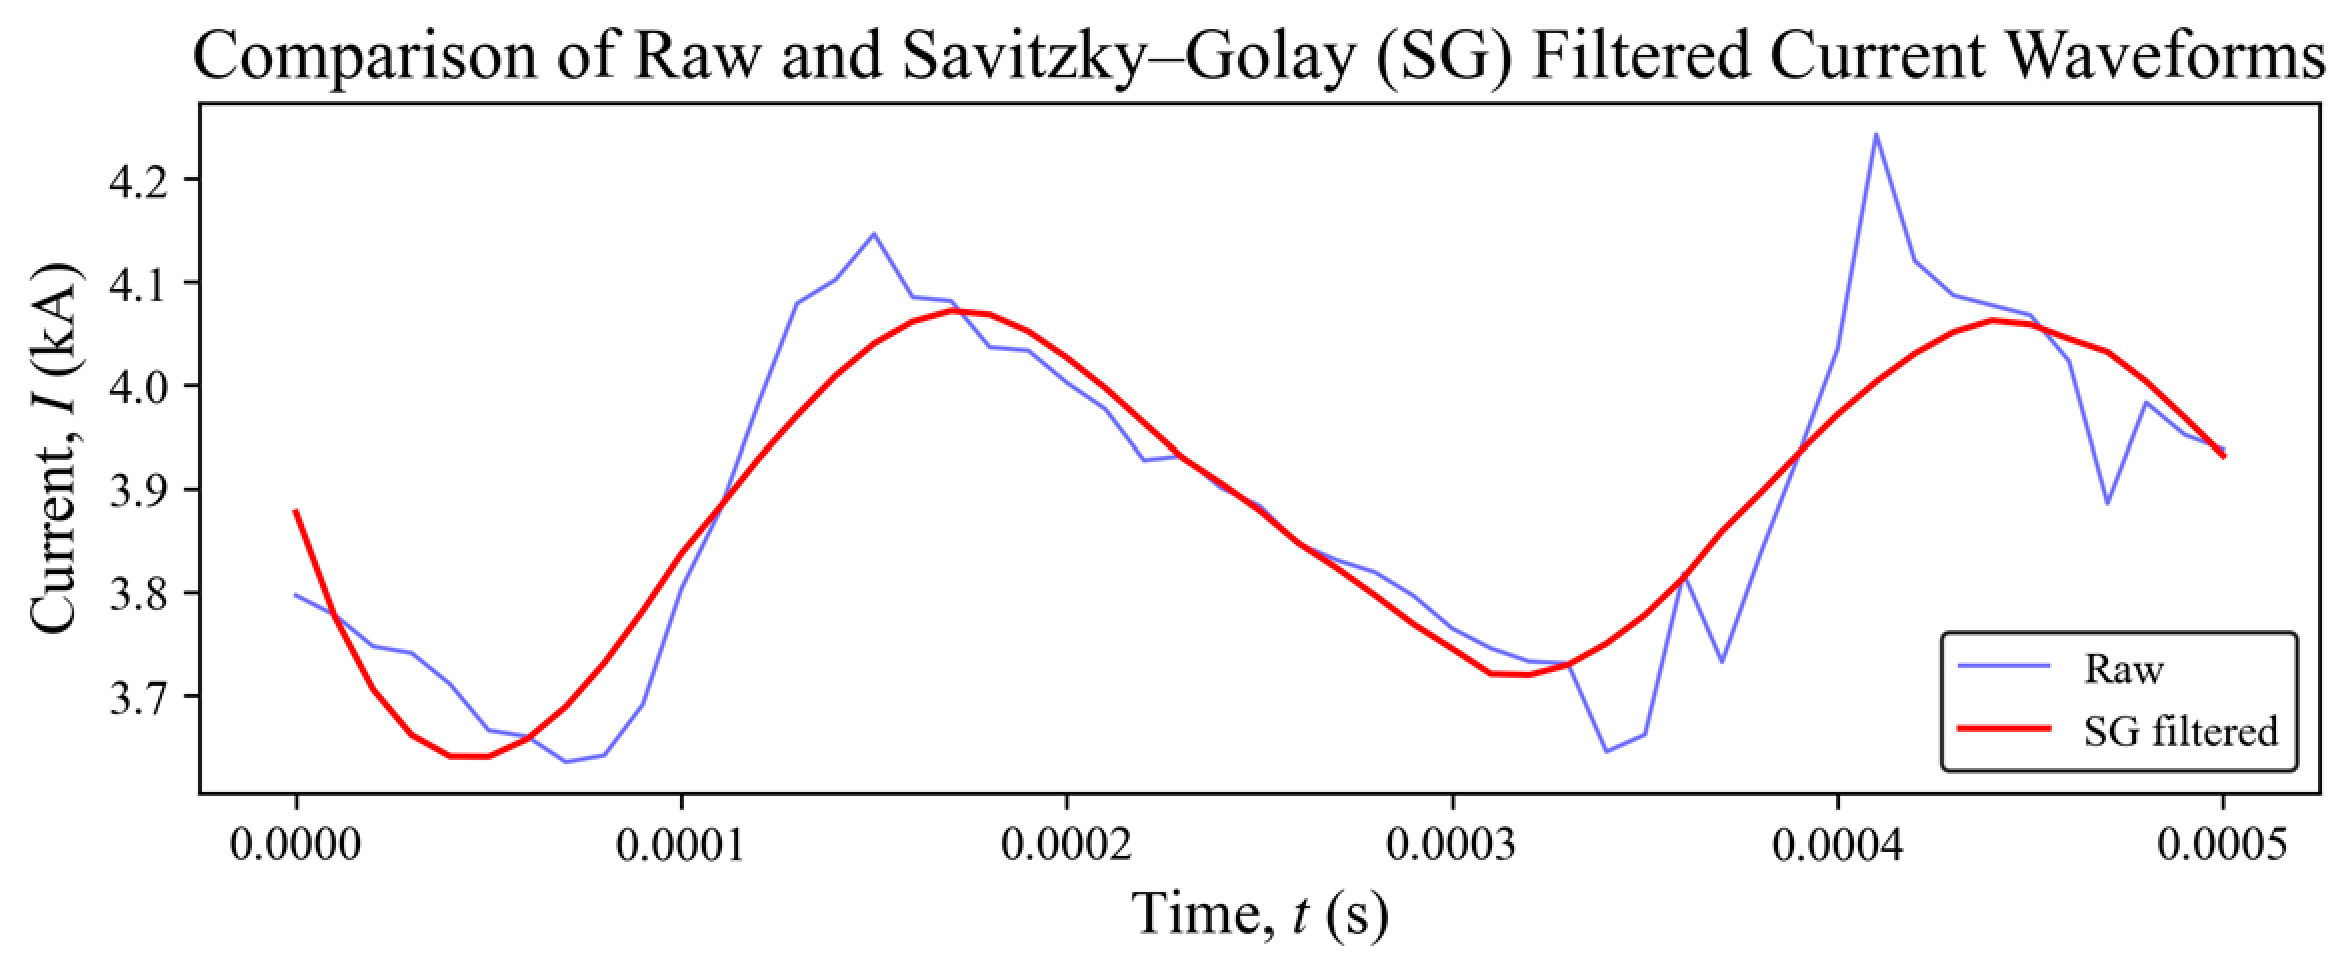
Figure 7 compares the raw welding current waveform I with the Savitzky–Golay (SG) filtered result. The raw signal contains pronounced high-frequency fluctuations, which are effectively suppressed by the SG filter [31]. Meanwhile, the smoothed waveform preserves the overall rising and falling trends as well as key transient transitions. Compared with the raw signal, the filtered curve exhibits reduced fluctuation and improved continuity, providing a more reliable basis for feature extraction, gradient computation, and transient-response analysis. This preprocessing step reduces the influence of measurement disturbances on subsequent multimodal fusion and weld-quality assessment.
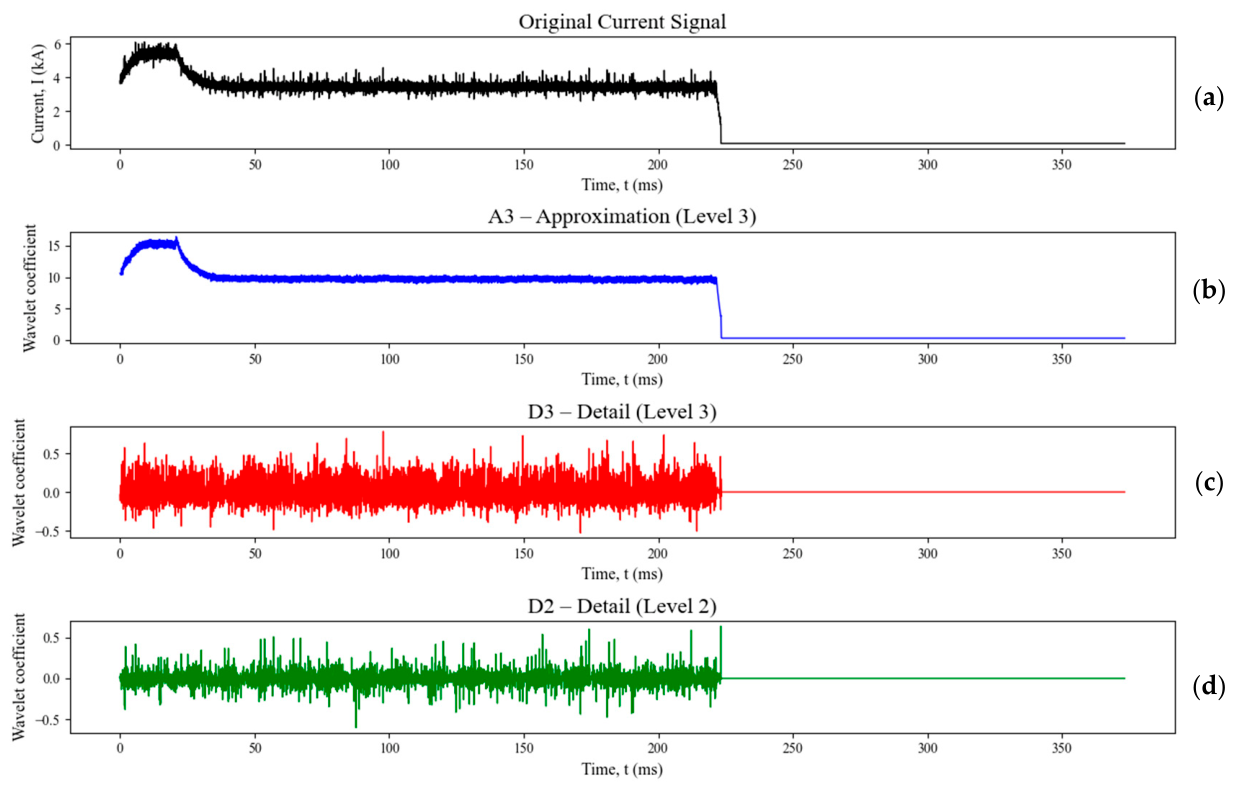
To investigate the multi-scale characteristics of the welding current signal, a three-level discrete wavelet transform (DWT) with the Daubechies-4 (db4) wavelet was applied [32]. The approximation component A 3 captures the low-frequency trend, while the detail components D 1 , D 2 , and D 3 represent transient variations at different frequency bands.
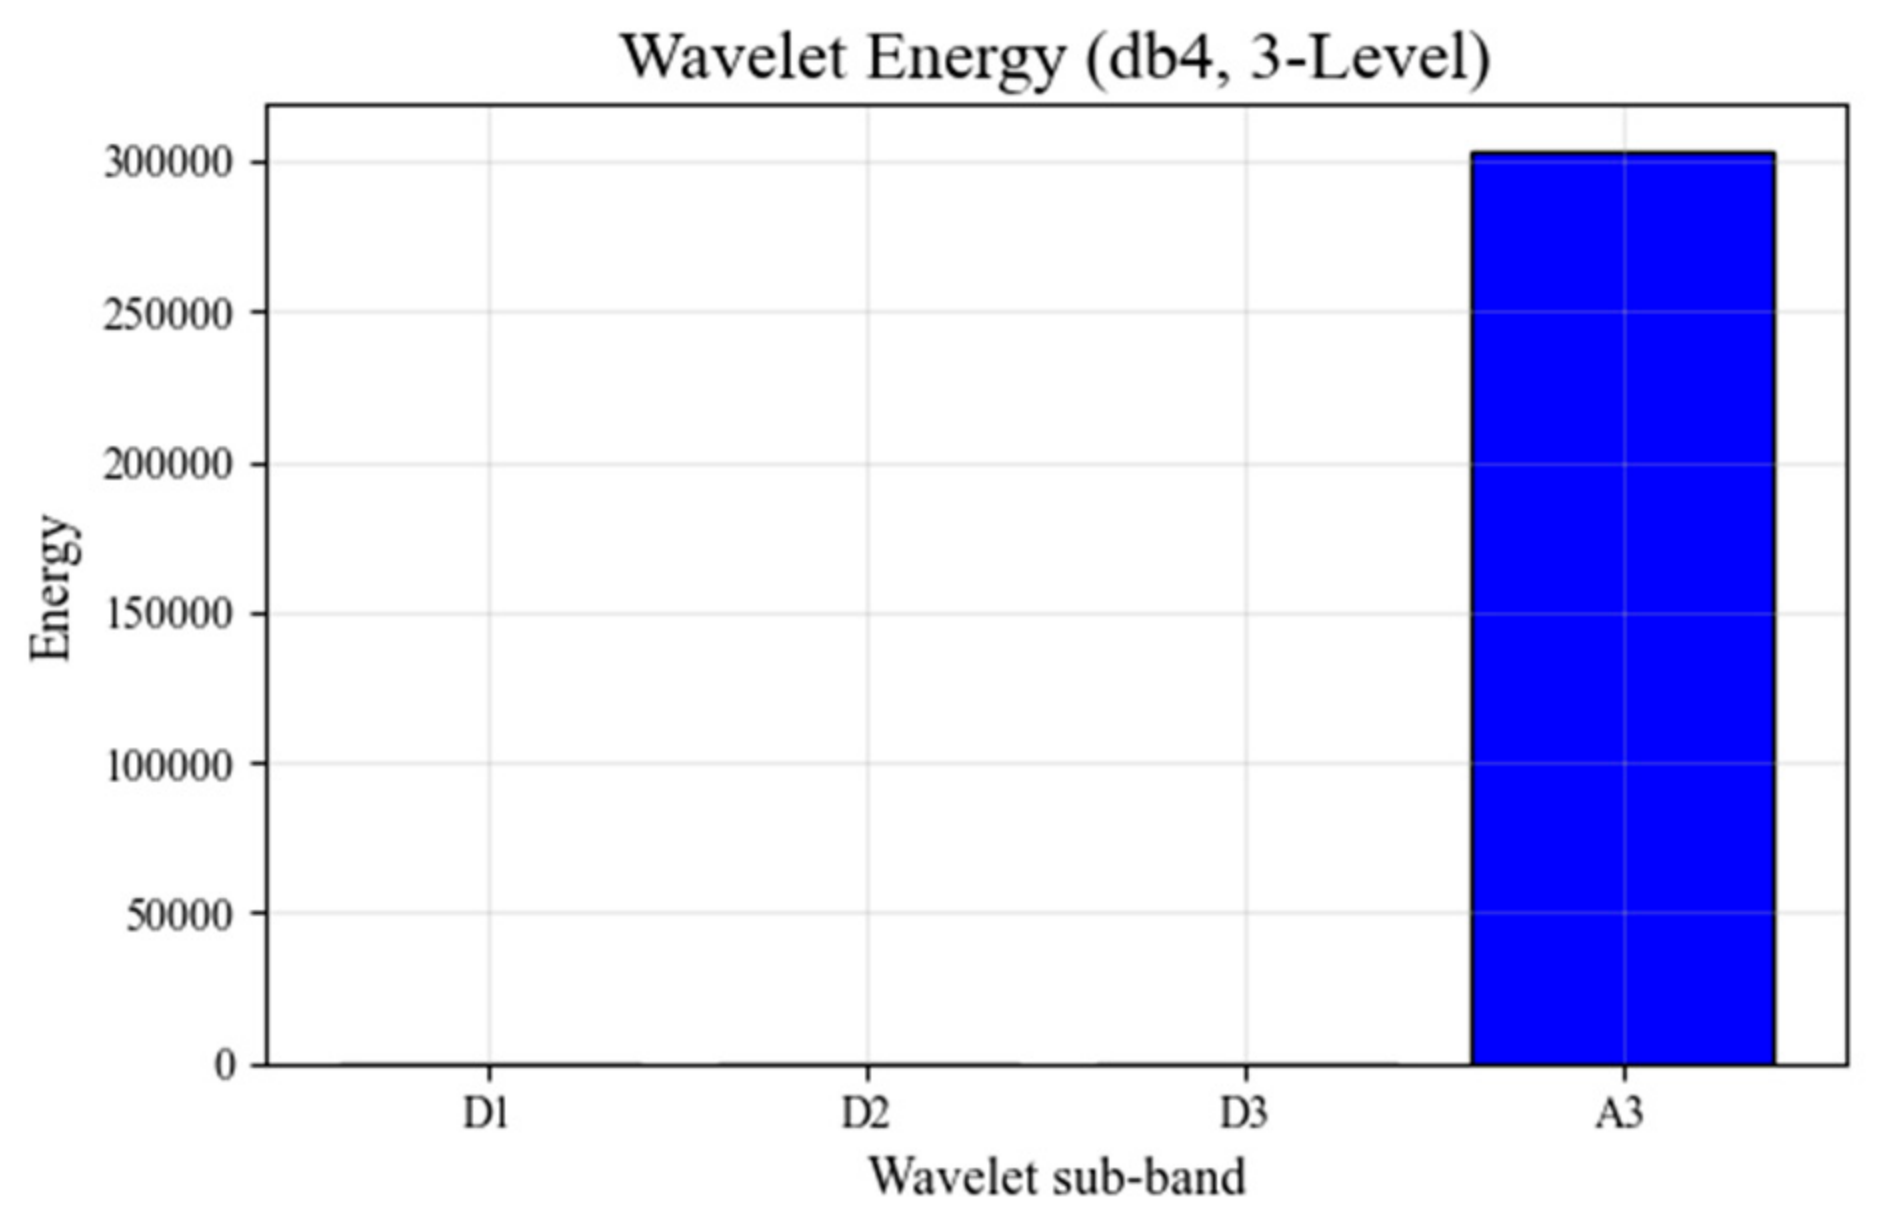
Figure 8 shows the corresponding wavelet energy distribution. The A 3 sub-band contains most of the total energy, indicating that the current signal is dominated by low-frequency components. Although the detail sub-bands have lower energy, they retain localized transient features sensitive to weld-interface instability, making them useful for defect diagnosis. Figure 9 shows the wavelet energy distribution of the db4 three-level decomposition. These results demonstrate that wavelet decomposition provides an effective multi-resolution framework for extracting physically meaningful features related to weld quality. The approximation sub-band A 3 contains most of the signal energy, indicating that the welding current is dominated by low-frequency components. In contrast, the detail sub-bands D 1 D 3 have much lower energy and mainly correspond to transient disturbances and high-frequency fluctuations.
Given the heterogeneous and partially correlated nature of the multimodal features, a two-stage selection strategy was adopted. First, Pearson correlation filtering was applied to remove redundant variables with strong pairwise dependence [33]. The remaining features were then projected into a lower-dimensional space using PCA (Principal Component Analysis) to preserve the dominant variance structure [34]. Finally, SHAP-based importance analysis was employed to verify the physical relevance of the selected features, with key descriptors consistently associated with current harmonic energy, resistance wavelet energy, and integrated current intensity, all closely related to nugget growth and expulsion behavior. The resulting multimodal feature set provides a compact and informative representation that integrates electrical, thermal, and electrode contact characteristics, forming the basis for the ensemble-learning experiments in Section 5.2.

5.2. Ensemble Learning Models

To leverage the complementary information in multimodal features, an ensemble-learning framework was adopted to improve classification robustness under varying weld conditions. Although individual models such as SVM (support vector machine), Random Forest, XGBoost, LightGBM, and CatBoost capture different aspects of the nonlinear feature space, their performance may vary with feature distribution, noise, and class imbalance. Ensemble integration mitigates these effects and improves generalization.
Two strategies were investigated: soft voting and stacking. In the voting scheme, XGBoost, LightGBM, and CatBoost were selected as base learners due to their strong performance on tabular data. Their probability outputs were combined using a weighted average (2:2:1), leveraging XGBoost’s capability for sparse data, LightGBM’s efficiency on high-dimensional features, and CatBoost’s robustness to correlated variables.
Stacking further extends this approach by training a meta-classifier on out-of-fold predictions from the base learners [35]. A logistic regression or XGBoost model is used to capture cross-model dependencies and refine the decision boundary, reducing systematic errors in overlapping defect regions. All models were trained using stratified five-fold cross-validation, with hyperparameters tuned via grid or randomized search to balance accuracy and stability. Performance was evaluated using accuracy, F1-score, and confusion matrices. Overall, the ensemble framework more effectively exploits multimodal features, improving robustness and providing a basis for the comparative analysis in Section 5.3.

5.3. Comparative Results and Discussion

The ensemble-learning models described in Section 5.2 were evaluated using a multimodal feature set composed of current, voltage, and dynamic-resistance descriptors. All experiments were conducted using stratified five-fold cross-validation on the 198-sample dataset. The reported accuracy (86.7%) and other metrics represent mean values across all folds, with standard deviations below 3%, indicating consistent performance. Compared with the DIMD-based baseline in Section 4, this multimodal framework captures a broader range of electrothermal interactions and provides a more rigorous assessment of model robustness. The dataset includes normal, expulsion, and cold-weld categories.
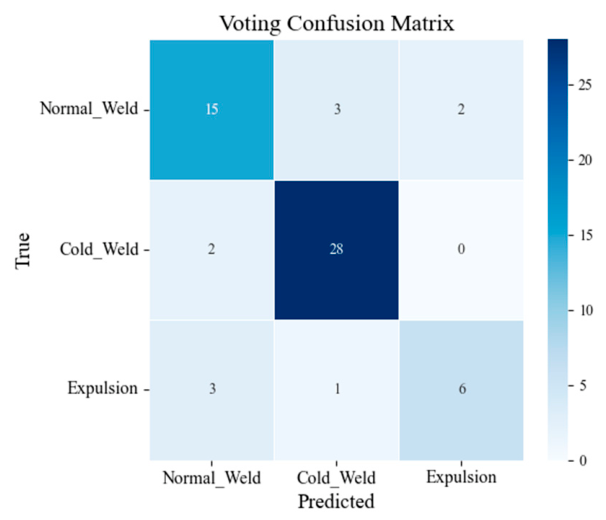
Individual classifiers—SVM, Random Forest, XGBoost, LightGBM, and CatBoost—exhibited different performance levels due to their sensitivity to nonlinear multimodal coupling. Among them, gradient-boosting models achieved the highest accuracy. The soft-voting ensemble delivered the most stable performance across all weld classes, reaching an accuracy of 86.7%. As shown in Figure 10, most misclassifications occurred between normal and expulsion welds, reflecting their partially overlapping transient behaviors, whereas cold-weld samples were identified with high precision due to the absence of peak formation.
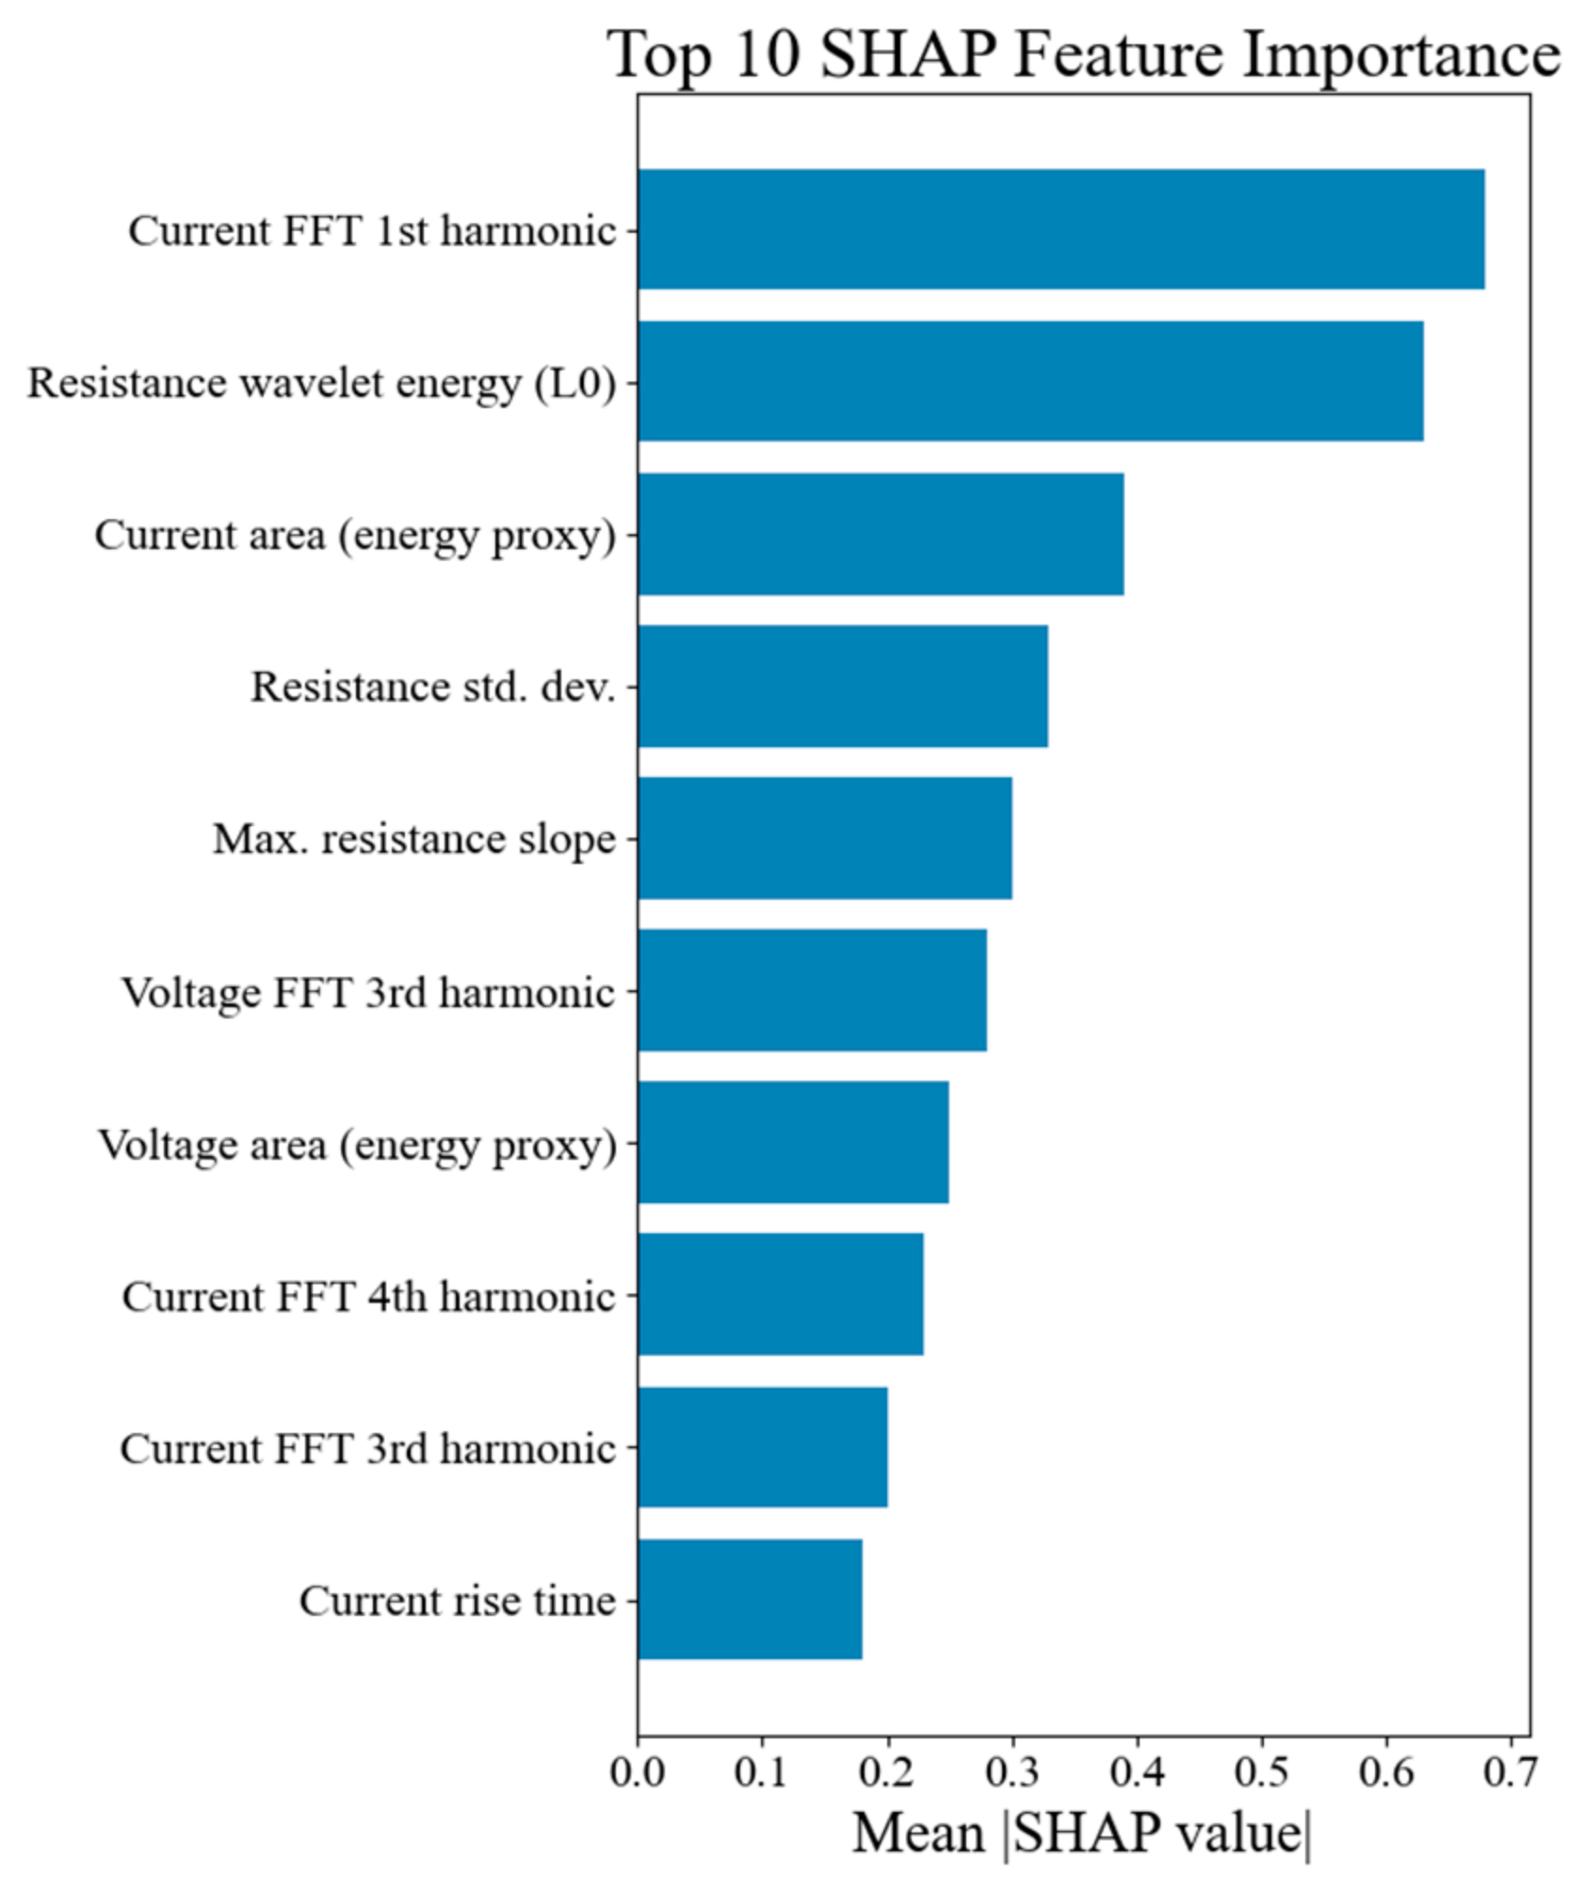
To further examine class separability, a PCA projection was constructed. The results show that the ensemble model produces smoother and more stable decision boundaries than individual classifiers, particularly in regions where single learners exhibit inconsistent predictions. This confirms that multimodal fusion provides complementary information beyond the DIMD-only baseline. Model interpretability was evaluated using SHAP to quantify feature contributions [36]. As shown in Figure 11, frequency-domain features obtained via FFT (Fast Fourier Transform) [37] are the most influential, especially the first harmonic amplitude, which reflects molten-metal instability associated with expulsion. The wavelet-energy component of the dynamic-resistance signal (L0 level) also contributes significantly, capturing low-frequency variations related to nugget growth. Additional important features include current-area-based energy metrics and resistance standard deviation, representing cumulative heat input and contact-state fluctuations. These results demonstrate that the selected multimodal features are physically meaningful and closely related to welding-process behavior.
The SHAP analysis is consistent with the physical mechanisms discussed in Section 3. Stable welds exhibit smooth resistance peak–valley transitions and well-regulated current waveforms, whereas expulsion and cold welds introduce distinct disturbances in harmonic components and multiscale energy features. This agreement confirms that the multimodal features avoid spurious correlations and that the ensemble model remains physically interpretable.
Overall, the extended experiments demonstrate that multimodal fusion combined with ensemble learning provides a robust and physically meaningful framework for weld-quality classification. Although the DIMD–CatBoost baseline in Section 4 achieves higher peak accuracy using single-signal data, the multimodal ensemble shows better generalization under varying conditions, highlighting its value for practical weld-quality monitoring.

6. Conclusions

This study proposed a dual-interval mean discretization (DIMD) approach for processing dynamic resistance signals in resistance spot welding and constructed a CatBoost-based classification framework for weld-quality evaluation. The main findings are summarized as follows:
(1)
The DIMD algorithm effectively preserved peak–valley morphology of dynamic-resistance curves while reducing feature dimensionality by approximately 40%, providing a compact and interpretable representation for classification. Gradient-boosting classifiers, particularly CatBoost, achieved high defect-recognition accuracy (98.9%), outperforming XGBoost owing to its ordered-boosting and symmetric-tree mechanisms.
(2)
A test on an independent 198-sample dataset confirmed the robustness and generalization capability of the proposed framework, maintaining similar feature rankings and classification trends. An extended multimodal–ensemble framework further validates the robustness of the proposed baseline method and provides a complementary solution for scenarios requiring higher interpretability.
(3)
SHAP-based analysis verified that resistance peak (R_peak), resistance drop (R_drop), and current energy-related features dominated model decisions, aligning well with the physical process of nugget formation.
Although the proposed method demonstrates strong performance in weld-quality classification, it is developed based on resistance spot welding experiments using low-carbon steel under controlled conditions. Both the primary and independent datasets share the same material system and similar thickness ranges, with variations mainly introduced through welding parameters such as current, welding time, and electrode pressure. Therefore, the applicability of the method to different materials, wider thickness ranges, or substantially different welding conditions remains to be validated. Future work will extend the framework to more diverse material systems and process conditions to further assess its generalizability.

Author Contributions

Conceptualization, X.G.; methodology, P.G., Y.H., H.X., Y.Z., X.G. and X.C.; validation, P.G. and Y.H.; investigation, P.G., Y.H. and H.X.; resources, X.G.; data curation, P.G., Y.H., H.X. and Y.Z.; writing—original draft preparation, P.G., Y.H., H.X., Y.Z. and X.C.; writing—review and editing, X.G., Y.Z. and X.C.; visualization, P.G., Y.H. and H.X.; supervision, X.G. and X.C.; project administration, X.G.; funding acquisition, X.G. All authors have read and agreed to the published version of the manuscript.

Funding

This work was supported in part by the Production and Research Project (No. 23HK0610), and the Guangdong Provincial Natural Science Foundation of China (2023A1515012172).

Institutional Review Board Statement

Not applicable.

Informed Consent Statement

Not applicable.

Data Availability Statement

The original contributions presented in this study are included in the article. Further inquiries can be directed to the corresponding author.

Conflicts of Interest

The authors declare no conflicts of interest.

References

  1. Choudhari, R.; Adhaye, A.; Sulakhe, V.; Fegade, R. Recent Status of Research and Developments in Resistance Spot Welding. SSRG Int. J. Mech. Eng. 2025, 12, 1–27. [Google Scholar] [CrossRef]
  2. Cui, S.; Zhou, X.; Zhang, B.; Han, L.; Xue, B.; Liu, F. Research on an Online Intelligent Monitoring System for Resistance Spot Welding Based on Wireless Communication. Sensors 2025, 25, 2658. [Google Scholar] [CrossRef]
  3. Su, Y.; Song, K.; Du, Z.; Yu, K.; Hu, Z.; Jin, H. Quantitative Study of Predicting the Effect of the Initial Gap on Mechanical Behavior in Resistance Spot Welding Based on L-BFGS-B. Materials 2024, 17, 4746. [Google Scholar] [CrossRef]
  4. Domínguez, L.; Rivas-Araiza, E.A.; Jáuregui-Correa, J.C.; González-Córdoba, J.L.; Pedraza-Ortega, J.C.; Takács, A. Resistance spot welding insights: A dataset integrating process parameters, infrared, and surface imaging. Data Brief. 2025, 59, 111373. [Google Scholar] [PubMed]
  5. Prabitz, K.M.; Antretter, T.; Schubert, H.; Hilpert, B.; Gruber, M.; Sierlinger, R.; Mark, M.; Seibold, S.; Raninger, P.; Ecker, W. Electrode and process design for regulation of liquid metal embrittlement phenomenon during spot welding of dual-phase steel: Numerical modelling and experiments. Weld. World 2025, 69, 1–12. [Google Scholar] [CrossRef]
  6. Gale, D.M. A Comparison of RFSSW and RSW for Automotive Manufacturing. Master’s Thesis, Brigham Young University, Provo, UT, USA, 2024. [Google Scholar]
  7. Jha, K.; Jumdeb, A.; Kumar, G.; Datta, R.; Hardya, K.; Singh, S.K.; Choudhury, B. Design and Development of a Portable Resistance Spot Welding Machine for Small-Scale Industries. Appl. Mech. Mater. 2024, 919, 97–105. [Google Scholar] [CrossRef]
  8. Wang, P.E.; Ghassemi-Armaki, H.; Pour, M.; Zhao, X.; Ma, J.; Sattari, K.; Carlson, B. Applicable and generalizable machine learning for intelligent welding in automotive manufacturing. Weld. World 2025, 69, 1349–1384. [Google Scholar] [CrossRef]
  9. Nikitin, A.; Turabov, D.; Ermilova, E.; Evdokimov, A.; Ossenbrink, R.; Seidlitz, H. Using dynamic resistance to predict electrode surface degradation in resistance spot welding of 5182 aluminum alloy. Weld. World 2025, 69, 449–458. [Google Scholar] [CrossRef]
  10. Stavropoulos, P.; Sabatakakis, K. Quality assurance in resistance spot welding: State of practice, state of the art, and prospects. Metals 2024, 14, 185. [Google Scholar] [CrossRef]
  11. Say, D.; Qaisar, S.M.; Krichen, M.; Zidi, S. Artificial intelligence assisted non-destructive testing of welding joints: A review of techniques, X-ray image processing and applications. Eng. Appl. Artif. Intell. 2025, 160, 111792. [Google Scholar] [CrossRef]
  12. Durnagöz, S.; Mayer, M.; Huber, M.F. An approach for expulsion predicting in resistance spot welding. Procedia CIRP 2024, 130, 1732–1738. [Google Scholar] [CrossRef]
  13. Feizollahi, V.; Bahmani, A.; Nadimi, N.; Salmani, M.R.; Pouranvari, M.; Park, Y.-D.; Ashiri, R. Factors affecting weld quality in resistance spot welding of advanced high strength steels. Sci. Rep. 2025, 15, 30012. [Google Scholar] [CrossRef]
  14. Gao, X.; Chen, Y. Detection of micro gap weld using magneto-optical imaging during laser welding. Int. J. Adv. Manuf. Technol. 2014, 73, 23–33. [Google Scholar] [CrossRef]
  15. Liu, Y.; Gao, X.; Wen, Z.; Luo, H. Unsupervised Image Anomaly Detection and Localization in Industry Based on Self-Updated Memory and Center Clustering. IEEE Trans. Instrum. Meas. 2023, 72, 2512010. [Google Scholar] [CrossRef]
  16. Panza, L.; Bruno, G.; Antal, G.; De Maddis, M.; Russo Spena, P. Machine learning tool for the prediction of electrode wear effect on the quality of resistance spot welds. Int. J. Interact. Des. Manuf. 2024, 18, 4629–4646. [Google Scholar] [CrossRef]
  17. Lee, H.-T.; Chang, Y.-C. Effect of Double Pulse Resistance Spot Welding Process on 15B22 Hot Stamped Boron Steel. Metals 2020, 10, 1279. [Google Scholar] [CrossRef]
  18. Stadler, M.; Schnitzer, R.; Gruber, M.; Steineder, K.; Hofer, C. Influence of the Cooling Time on the Microstructural Evolution and Mechanical Performance of a Double Pulse Resistance Spot Welded Medium-Mn Steel. Metals 2021, 11, 270. [Google Scholar] [CrossRef]
  19. Fu, Y.; Gao, P.; Gao, X.; Zhang, Y. Quality Evaluation of Resistance Spot Welding Based on Dynamic Reactance Signal and Radar Diagram Method. IEEE Sens. J. 2024, 24, 6666–6676. [Google Scholar]
  20. Ullrich, M.; Wohner, M.; Jüttner, S. Quality monitoring for a resistance spot weld process of galvanized dual-phase steel based on the electrode displacement. Weld. World 2024, 68, 1791–1800. [Google Scholar] [CrossRef]
  21. Gao, X.; Sun, Y.; You, D.; Xiao, Z.; Chen, X. Multi-sensor information fusion for monitoring disk laser welding. Int. J. Adv. Manuf. Technol. 2016, 85, 1167–1175. [Google Scholar]
  22. Lv, Z.; Gao, X.; Xiao, H.; Gao, P. Resistance spot welding defect detection based on vectorized dynamic resistance signal and LightGBM classifier. Meas. Sci. Technol. 2024, 35, 086113. [Google Scholar] [CrossRef]
  23. Deng, H.; Gao, X.; Zhang, D.; Lu, W.; Gao, P.; Zhang, Y. Defect detection and data generation of shunt between three layers of resistance spot welding based on deep convolutional generative adversarial network and conditional variational autoencoder. Eng. Appl. Artif. Intell. 2025, 160, 111866. [Google Scholar] [CrossRef]
  24. Gao, P.; Yan, X.; He, J.; Yang, H.; Chen, X.; Gao, X. Processing of eddy current infrared thermography and magneto-optical imaging for detecting laser welding defects. Metals 2025, 15, 119. [Google Scholar] [CrossRef]
  25. Friedman, J.H. Greedy function approximation: A gradient boosting machine. Ann. Stat. 2001, 29, 1189–1232. [Google Scholar] [CrossRef]
  26. Wang, Z.H.; Liu, Y.F.; Wang, T.; Wang, J.G.; Liu, Y.M.; Huang, Q.X. Intelligent prediction model of mechanical properties of ultrathin niobium strips based on XGBoost ensemble learning algorithm. Comput. Mater. Sci. 2024, 231, 112579. [Google Scholar] [CrossRef]
  27. Chen, T.; Guestrin, C. XGBoost: A scalable tree boosting system. In Proceedings of the 22nd ACM SIGKDD International Conference on Knowledge Discovery and Data Mining, San Francisco, CA, USA, 13–17 August 2016; pp. 785–794. [Google Scholar]
  28. Prokhorenkova, L.; Gusev, G.; Vorobev, A.; Dorogush, A.V.; Gulin, A. CatBoost: Unbiased boosting with categorical features. Adv. Neural Inf. Process. Syst. 2018, 31, 6638–6648. [Google Scholar]
  29. Pemila, M.; Pongiannan, R.K.; Narayanamoorthi, R.; AboRas, K.M.; Youssef, A. Application of an ensemble CatBoost model over complex dataset for vehicle classification. PLoS ONE 2024, 19, e0304619. [Google Scholar]
  30. Hancock, J.T.; Khoshgoftaar, T.M. CatBoost for big data: An interdisciplinary review. J. Big Data 2020, 7, 94. [Google Scholar] [CrossRef]
  31. Savitzky, A.; Golay, M.J.E. Smoothing and differentiation of data by simplified least squares procedures. Anal. Chem. 1964, 36, 1627–1639. [Google Scholar] [CrossRef]
  32. Daubechies, I. Ten Lectures on Wavelets; SIAM: Philadelphia, PA, USA, 1992. [Google Scholar]
  33. Guyon, I.; Elisseeff, A. An introduction to variable and feature selection. J. Mach. Learn. Res. 2003, 3, 1157–1182. [Google Scholar]
  34. Abdi, H.; Williams, L.; Williams, L.J. Principal component analysis. Wiley Interdiscip. Rev. Comput. Stat. 2010, 2, 433–459. [Google Scholar] [CrossRef]
  35. Wolpert, D.H. Stacked generalization. Neural Netw. 1992, 5, 241–259. [Google Scholar]
  36. Lundberg, S.M.; Lee, S.-I. A unified approach to interpreting model predictions. Adv. Neural Inf. Process. Syst. 2017, 30, 4765–4774. [Google Scholar]
  37. Cooley, J.W.; Tukey, J.W. An algorithm for the machine calculation of complex Fourier series. Math. Comput. 1965, 19, 297–301. [Google Scholar] [CrossRef]
Figure 1. Schematic diagram of resistance spot welding test of steel plate overlap.
Metals 16 00503 g001
Figure 2. Correlation between dynamic resistance evolution and weld nugget microstructure during low-carbon-steel resistance spot welding. (a) Dynamic resistance versus time t. (b) Nugget microstructure at different welding times.
Metals 16 00503 g002aMetals 16 00503 g002b
Figure 3. Comparison of dynamic resistance versus time t for normal and edge-deviation welds.
Metals 16 00503 g003
Figure 4. Dual-interval mean discretized (DIMD) dynamic-resistance curves for four resistance spot welding conditions. (a) normal weld, (b) incomplete fusion, (c) shunt welding, (d) edge welding.
Metals 16 00503 g004
Figure 5. Raw waveforms of welding current I , voltage V , and dynamic resistance under a cold-weld condition.
Metals 16 00503 g005
Figure 6. First-order difference characteristics of the welding current I , voltage U , and dynamic resistance R d under a cold-weld condition after Savitzky–Golay (SG) smoothing. (a) First-order differences over the full 0–20 ms welding cycle. (b) Zoomed-in view of the transient interval from 0 to 0.5 ms.
Metals 16 00503 g006
Figure 7. Comparison of the raw welding current waveform I and the Savitzky–Golay (SG) filtered waveform in the 0–0.5 ms transient interval.
Metals 16 00503 g007
Figure 8. Three-level wavelet decomposition of the welding current using the Daubechies-4 (db4) wavelet. (a) Original current waveform; (b) level-3 approximation A3; (c,d) level-3 and level-2 detail components D3 and D2.
Metals 16 00503 g008
Figure 9. Wavelet energy distribution of the db4 three-level decomposition.
Metals 16 00503 g009
Figure 10. Confusion matrix of the ensemble-voting classifier for distinguishing normal, expulsion, and cold welds in resistance spot welding using the dataset.
Metals 16 00503 g010
Figure 11. SHAP-based feature-importance ranking for the multimodal ensemble model, highlighting the dominant contributions of current harmonic energy, resistance wavelet features, and current-area energy indicators.
Metals 16 00503 g011
Table 1. Chemical composition of DC01 low carbon steel (wt%).
Steel GradesCMnSPAlt (Al Total)
DC01<0.12<0.6<0.045<0.045<0.02
Table 2. Mechanical properties of DC01 low-carbon steel.
Yield Strength (MPa)Tensile Strength (MPa)
≤240≤410
Table 3. Experimental results of discretization methods for dynamic resistance signals.
MethodFeature DimensionsSampling (0–100 ms)Sampling (>100 ms)Peak-Valley Preservation
Single-interval (10 ms)~2410 ms10 msGeneral
Single-interval (5 ms)~485 ms5 msExcellent
Table 4. Comprehensive performance comparison of XGBoost and CatBoost classifiers.
MetricXGBoostCatBoostImprovement
Accuracy (%)93.398.9+5.6 pp
Precision (%)93.398.9+5.6 pp
Recall (%)95.099.0+4.0 pp
F1-score (%)93.598.9+5.4 pp
Misclassified samples6/90 (6.7%)1/90 (1.1%)−83.3%
Accuracy (%)93.398.9+5.6 pp
Disclaimer/Publisher’s Note: The statements, opinions and data contained in all publications are solely those of the individual author(s) and contributor(s) and not of MDPI and/or the editor(s). MDPI and/or the editor(s) disclaim responsibility for any injury to people or property resulting from any ideas, methods, instructions or products referred to in the content.