Abstract
The influence of nitrate (NO3−) concentration on the corrosion resistance of the Inconel 625 (superalloy) was investigated. The surface of Inconel 625 was chemically modified by oxidation in an alkaline sodium nitrate(V) solution. The surface and microstructure of specimens were observed by a scanning electron microscope (SEM). The mechanical properties of Inconel 625 were characterized by microhardness (HV) measurements. The corrosion tests of materials were carried out by using the electrochemical method in the acidic chloride solution. The adsorption of the (MemOn)ads layer effectively separates the Inconel 625 surface from contact with the aggressive corrosive environment. The microhardness (HV10) value increased (about 13%) with the increase in nitrate concentration. A more-than-five-times-lower corrosion rate (CW) value was obtained for the Inconel 625 sample, whose surface was modified in an alkaline solution with the highest NO3− concentration. Chemical modification improves the structure and surface topography of the superalloy. After exposing Inconel 625 to an oxidizing environment (1.00 M NO3−), the surface coverage degree (SC) was 80%.
1. Introduction
Nickel-based superalloys, including Inconel, are currently used in a variety of industries, i.e., aviation, petrochemical, machinery, and other industries [1]. Inconel alloys possess numerous specific properties, such as low thermal expansion, high electrical resistivity, and unique magnetic properties [1]. Inconel 625 is a nickel-based alloy containing high amounts of chromium and molybdenum, and minor contents of niobium and iron. Inconel 625 is widely used in various industries because it exhibits excellent corrosion resistance and has excellent mechanical properties at both low and high temperatures [2]. However, the practical application of Inconel 625 is still limited due to the high cost of the superalloy. Therefore, various methods are used to reduce the consumption of this alloy [3]. For this reason, many processes have been developed to reduce the wear of Inconel-type alloys including the application of protective coatings (using various methods) [4] or the laser cladding technique, which ensures the formation of a metallurgical coating permanently attached to the substrate. Direct metal deposition (DMD) technology combines laser cladding with rapid prototyping into a solid freeform fabrication process. The DMD method was used to produce components free from relevant defects like cracks, bonding error, or porosity [5]. The authors of [6] evaluate the mechanical properties of different laser cladding tests on Inconel 718. The results show that the laser cladding strategy can have a significant influence on the mechanical properties of the part and that there is a high risk in obtaining lower mechanical properties than those of wrought Inconel 718. Moreover, components made of stainless steels can be well-protected by the Inconel 625 wire laser coatings since the thickness of the corrosion product was below 0.1 mm at the top surface of the multiple clad beads, which is about 4 mm thick [7]. The laser cladding method [8] was also used to coat the surface of low alloy steel with Inconel 625 powder. The samples were etched in the acidic solutions of fuse sulfates (i.e., MgSO4 and Na2SO4). These observations provide evidence that both the carbide precipitations and the local strains play an important role in the interface stability of the laser cladding of Inconel 625/steel structures upon heat chemical corrosions. Attempts have also been made to thermochemically modify various alloys based on chromium and nickel. One of the more promising methods involves boronizing the metal surface [9]. It has been found that boronized Inconel 718 exhibits significantly better wear resistance than carbonitrided or carburized materials. Moreover, boride layers (i.e., Fe2B, CrB) exhibit abrasion and wear resistance comparable to sintered carbides [10]. The effect of the type test of the nickel-based alloy was also investigated. For instance, it has been reported that the temperature of HCl solution can influence the corrosion properties of Inconel 625 [11]. At room temperature, the prepassive process was observed and the formed coating was inhomogeneous. The increase in temperature caused the transition of the prepassive state to the passive state. A thin homogeneous protective coating was obtained on the Inconel 625 surface in a chloride environment [11,12]. The corrosion behaviors of Hastelloy C-276, Inconel 600, and Monel 400 alloys were compared in 40 wt.% hydrofluoric acid at 50 °C [13]. It was found that the different corrosion resistances of these alloys are due to both the elemental composition and the microstructural inhomogeneity. The less stable passivation layer dominated by Mo and the severe intergranular corrosion induced by M6C result in the lower corrosion resistance of Hastelloy C-276 alloy. Whereas, Inconel 600 has a more stable passivation layer and thus the highest corrosion resistance among the nickel-based alloys tested. The influence of the microstructure of the Inconel 625 alloy produced by two different methods on corrosion resistance in sulfuric acid solution was also investigated [14]. The anti-corrosion properties depend on the production method of the superalloy. After long-term corrosion in sulfuric acid, a weaker corrosion resistance was observed, which is associated with a more refined microstructure with a higher density of preferential local corrosion sites. Phosphoric acid is weak; therefore, the corrosion process in this environment differs significantly from corrosion in strong acids. In the H3PO4 environment, the phosphate group can combine with metals, creating less soluble salts that precipitate on the surface of alloys, replenishing the passive layer, thereby significantly limiting the contact of the metal with the corrosive environment [15]. Therefore, the passive layer that was formed on Inconel 625 in the H3PO4 had a two-layer structure, the outer layer enriched with Fe compounds and the inner layer enriched with Cr2O3 compounds [16]. Moreover, the phosphate salts are incorporated into the passive film [17]. Attention was also paid to the electrochemical properties of Inconel 625, including the passivation in the environment of strong oxidizing acid, e.g., HNO3. The passivity of Inconel 625 in the nitric acid solutions of varying concentrations was assessed using a range of electrochemical techniques [18]. It was observed that with an increasing concentration of HNO3 solution from 0.01 M to 1.00 M, the corrosion resistance of the superalloy increases. It is likely that the thickness of the passive layer on the surface of the superalloy increases in more concentrated oxidizing electrolytes. The superalloys exhibit excellent stability in oxidizing environments due to the formation of passive layers on their surface. The passive layer can effectively isolate the passivated material from the corrosive environment and effectively prevent corrosion damage.
To date, there are no reliable literature reports regarding the passivation process and broadly understood electrochemical characterization at room temperature of Inconel 625 in aqueous alkaline nitrate solutions. Therefore, an attempt was made to determine the effect of chemical modification of the superalloy surface in order to increase its corrosion resistance in an aggressive environment.
In the present study, the influence of nitrate (NO3−) concentration on the corrosion resistance of Inconel 625 was investigated. The surface of Inconel 625 was chemically modified by oxidation in an alkaline sodium nitrate(V) solution. Corrosion tests of materials were performed in an acidic chloride solution. The corrosion parameters of the modified materials were determined by electrochemical methods. Other methods were also used to support a comprehensive investigation of the corrosion process of the modified superalloy.
2. Materials and Method
Inconel 625 was purchased in an 8 mm thick sheet form from VBC group Lough-borough, UK. The chemical composition of Inconel 625 is presented in Table 1.

Table 1.
Chemical composition of Inconel 625.
The measurement of microhardness of the tested materials was made by the Vickers method (HV), using the Falcon 500 hardness tester of the INNOVATEST (Maastricht, The Netherlands).
The surface and microstructure were observed by using a scanning electron microscope (SEM) (JOEL, Tokyo, Japan), JSM-5400, with an energy dispersive X-ray spectrometer (EDS). The accelerating voltage of SEM was 20 kV.
The topography and profile shape of the materials were analyzed using a Talysurf CCI-Lite non-contact 3D profiler (Taylor Hobson, Leicester, UK).
The electrochemical measurements (corrosion tests) were carried out by using PG-STAT 128N (Auto Lab, Amsterdam, The Netherlands) potentiostat/galvanostat.
The working electrode was made of Inconel 625. The working electrode surface modification was performed in an alkaline sodium nitrate(V) solution. The concentration of sodium hydroxide was 2 M, and NaNO3 concentrations were 0.25 M, 0.50 M, and 1.00 M. Therefore, the superalloy samples were named Inconel 625-0.25, Inconel 625-0.50, and Inconel 625-1.00.
The saturated calomel electrode (SCE(KCl)) was used as the reference, and the counter electrode (10 cm2) was made from platinum mesh (99.8% Pt).
The corrosion tests of materials were performed in an acidic chloride solution which was obtained by mixing the sodium chloride and hydrochloric acid (i.e., 1.00 M sodium chloride and 0.20 M hydrochloric acid) so the concentration of Cl− ions was 1.20 M, pH 1.5.
All reagents were purchased from POCH, Gliwice, Poland.
The kinetics and mechanisms of corrosion of cermet coatings were studied using the Linear Sweep Voltammetry (LSV) method. The potentiodynamic polarization curves were recorded. The curves were used to designate the corrosion parameters of the tested materials.
The chronoamperometric curves (ChA) were obtained for the potential values which were selected on the basis of the polarization curves. For this purpose, one potential value concerned the cathodic process and two for the anodic process.
All electrochemical measurements were performed three times for each sample. The measurements were carried out at a temperature of 25 ± 0.2 °C. The measuring temperature was maintained by an air thermostat of our own production. The electrolytes were not deoxygenated.
3. Results and Discussion
3.1. Microstructure Inconel 625 After Exposure in Nitrate Environment
The oxidation of metal surfaces is a process of covering the surface of metals or alloys with a thin layer of oxides. The oxide layer gives an aesthetic appearance and provides excellent protection of materials against corrosion. Most often, oxidation is performed on steel, and the oxidation process is called blackening. Therefore, an attempt was made to use the process of oxidation on the Inconel 625 surface in order to increase the material’s corrosion resistance. The modification of the superalloy surface was carried out chemically in a nitrate environment.
Figure 1 shows SEM images of Inconel 625 surfaces after 24 h exposure in an alkaline sodium nitrate(V) environment. The NO3− concentration were 0.25 M, 0.50 M, and 1.00 M, respectively. The compositions of the oxidizing solutions were selected experimentally. The solutions were vigorously stirred to ensure uniform contact of the samples with an oxidizing environment.
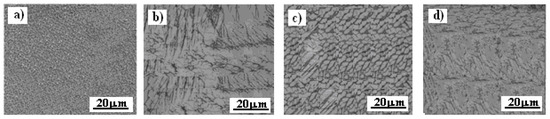
Figure 1.
SEM images of Inconel 625 surface: (a) before and after exposure in alkaline nitrate solutions: (b) 0.25 M, (c) 0.50 M, (d) 1.00 M NO3−.
Microstructural analysis of the Inconel 625 surface revealed an austenitic microstructure composed of equiaxed grains in the transverse and longitudinal directions of the tested sample (Figure 1a). The surface of the superalloy is homogeneous. The Inconel 625 surfaces after exposure in an alkaline nitrate environment are shown in Figure 1b–d. The surface structure of the superalloy changed after exposure in the alkaline nitrate solutions. As the NO3− concentration increased, the structure of the coating became more fine-grained. Thus, as a result of physico-chemical processes, the surface of Inconel 625 became more fine-grained. It can be assumed that as a result of exposure of the superalloy in an alkaline nitrate solution, the mechanical and anti-corrosion properties of the tested material change.
The SEM image of the microstructure of Inconel 625 after exposure in alkaline sodium nitrate of 1.00 M solution together with EDS maps of chemical elements distribution are shown in Figure 2.
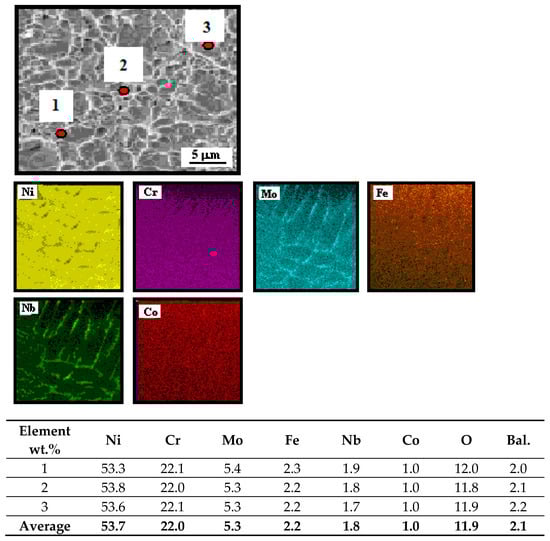
Figure 2.
SEM image of microstructure of Inconel 625 after exposure in alkaline sodium nitrate 1.00 M solution together with EDS maps of chemical elements distribution.
The contents (wt.%) of the most important elements on the superalloy surface were found to be similar to those listed in Table 1. The uniform distribution of elements on the surface of the superalloy was found. Furthermore, it was shown that after exposure in the nitrate environment, a relatively high oxygen content, i.e., about 12%, was recorded on the surface of Inconel 625 (Figure 2). The surfaces of the tested samples were covered with a thin layer of oxides of various metals in accordance with a simple chemical reaction:
where Me means the Ni, Cr, Mo, and other metals, k, m, n—stoichiometric coefficients.
Me + k NO3− → Me(NO3)k
m Me(NO3)k + n OH− → (MemOn)ads + n H+ + k NO3−
The surfaces of the Inconel 625 samples were covered with a thin homogeneous (MemOn)ads layer. As a result of oxide absorption, the surface of the samples became matte-black. The oxide layer adhered well to all of the Inconel 625 surfaces. It was found [18] that in the nitrate environment, a complex oxide layer is formed on the surface of the superalloy: NiO, Cr2O3, MoO2, MoO3, Fe2O3, and NiFe2O4. The process described by Reactions (1) and (2) is called metal passivation, and a protective oxide layer, also known as a passive layer. The structure of the oxide layer changed with increasing NO3− concentration (Figure 1b–d). It seems that the coarse crystalline structure of the (MemOn)ads will not provide sufficient corrosion protection to the substrate, i.e., Inconel 625 (Figure 1b,c). The finest of the (MemOn)ads structures was obtained after exposure of the superalloy in the solution with the highest concentration of nitrate, i.e., 1.00 M NO3− (Figure 1d). Therefore, it can be assumed that the fine-crystalline structure of the (MemOn)ads will have the best anti-corrosion properties.
3.2. Microhardness
The microhardness (HV10) measurements were also made of Inconel 625 surfaces before and after exposure in alkaline nitrate solutions. The measurement results are summarized in Table 2.
Table 2.
Microhardness of Inconel 625 surfaces before and after exposure in alkaline nitrates.
It turned out that as a result of modifications in the alkaline nitrate solutions, the microhardness (HV10) of the Inconel 625 surface increased with the increasing of NO3− concentration (Table 2). The microhardness value increased slightly (about 13%) for Inconel 625, which was oxidized in the solution with the highest nitrate concentration, i.e., 1.00 M NO3−. As a result of chemical modification in the oxidizing solution, the surface of Inconel 625 was hardened. The mechanical properties of the superalloy were improved because a more compact f the (MemOn)ads structure was obtained on the superalloy surface.
3.3. Microstructure of Inconel 625 After Exposure in Corrosive Environment
Corrosion tests are used to investigate the effects of corrosion of materials in a corrosive environment. Figure 3 shows SEM images of Inconel 625 surfaces after 24 h exposure in the corrosive environment (test solution), i.e., 1.2 M Cl−, pH was 1.5. The electrolyte solution was vigorously stirred, i.e., 500 L/min to ensure uniform contact of the test samples with the corrosive environment. A magnetic stirrer was used for this purpose.
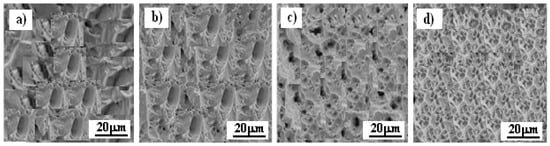
Figure 3.
SEM images of Inconel 625 surface: (a) before and after exposure in alkaline nitrate solutions: (b) 0.25 M, (c) 0.50 M, (d) 1.00 M NO3−. Test solution contained 1.2 M Cl− (pH 1.5).
It has been found that in an acidic chloride environment, the Inconel 625 surface undergoes intensive corrosion according to the following reaction:
where w is the stochiometric coefficient.
Me + 2 H+ + w Cl− → MeClw + H2
As a result of corrosion in the aggressive chloride environment (Reaction (3)), the surface of the superalloy was covered with numerous deep pits (Figure 3a).
In the case of the corrosion test of Inconel 625 samples after chemical modification of the surface in alkaline nitrate solutions, the following reaction took place:
where m, n, and w are the stochiometric coefficients.
(MemOn)ads + 2n H+ + w Cl− ↔ MemClw + n H2O
On the other hand, as a result of the dissolution of the (MemOn)ads, numerous pits appeared on the surface of the tested samples (Figure 3b–d). The highest destruction of the superalloy surface was observed for the sample after exposure in the environment containing 0.25 M NO3− (Figure 3b). As the NO3− concentration increases, the degradation of the Inconel 625 surface becomes smaller (Figure 3c,d). It can therefore be assumed that the concentration of nitrate ions clearly affects the thickness and structure of the (MemOn)ads. Obviously, a thicker layer of metal oxides protects the substrate significantly better against contact with an aggressive corrosive environment (Figure 3d).
The microhardness (HV10) of the superalloy surface was also measured after the corrosion test. It was found that the microhardness of the samples decreased slightly (approximately 5%). The reason for the decrease in HV10 value is the partial destruction of the (MemOn)ads coating (Reaction (4)) on the surface of chemically modified superalloy samples.
3.4. Corrosion Test
The corrosion test of Inconel 625 after exposure in alkaline nitrate solutions was carried out using an electrochemical method. The test solution contained 1.2 M Cl− (pH 1.5).
The kinetics and mechanisms of corrosion of the materials were studied using the Linear Sweep Voltametry (LSV) method. The potentiodynamic polarization curves were recorded. The working electrode potential was varied from −600 to +1150 mV vs. SCE(KCl). The potential was changed at a rate of 1 mV/s. The curves were used to designate the corrosion parameters, polarization resistance, and corrosion rate of tested materials. For this purpose, the method of extrapolation of rectilinear sections of the Tafel potentiodynamic polarization curves were used.
3.4.1. Open Circuit Potential
Open circuit potential (EOCP) measurements are one of electrochemical methods used to evaluate and estimate the corrosion performance of coating layers. Figure 4 shows an evolution of open circuit potential (EOCP) of Inconel 625 before and after exposure in an alkaline nitrate solution. The potential values at the start of the measurement were −275 mV, −230 mV, −185 mV, and −120 mV vs. SCE(KCl). The measurement time was 120 min.
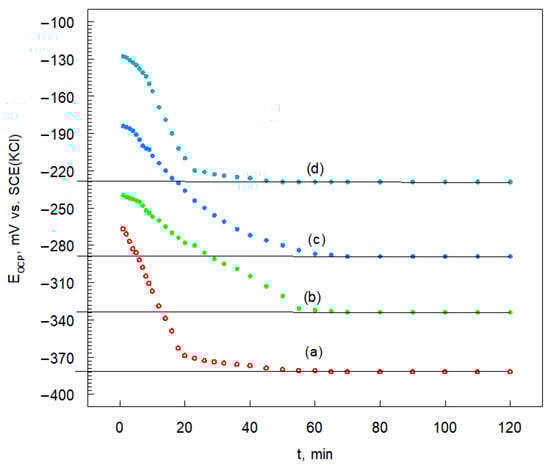
Figure 4.
Evolution of open circuit potential of Inconel 625 (a) before and after exposure in alkaline nitrate solutions: (b) 0.25 M, (c) 0.50 M, (d) 1.00 M NO3−. Test solution contained 1.2 M Cl− (pH 1.5).
The values of the open circuit potential of Inconel 625 samples before and after exposure in an alkaline sodium nitrate(V) solution are listed in Table 3.
Table 3.
Values of open circuit potential of Inconel 625 before and after exposure in alkaline nitrate solutions.
The composition of alkaline nitrate environments has a significant impact on the change in the EOCP values (Figure 4). As the NO3− concentration increases, the EOCP values shift towards positive values. The most favorable conditions for corrosion protection were obtained after exposing the superalloy in the highest concentrated alkaline solution, i.e., 1.00 M sodium nitrate(V), Table 3. The protective layer of the (MemOn)ads was formed on the superalloy surface. However, the dissolution reactions of protective coatings were slow, and after 60 min of the experiment the equilibrium of Reaction (2) was established. The open circuit potential stabilized at a constant level (Figure 4). This means that the protective oxide layer protects the superalloy surface from contact with aggressive corrosive environment.
3.4.2. Potentiodynamic Polarization Curves
Potentiodynamic polarization measurements were carried out in order to gain knowledge concerning the kinetics of cathodic and anodic reactions. The curves of Inconel 625 before and after exposure in alkaline nitrate solutions are exhibited in Figure 5.
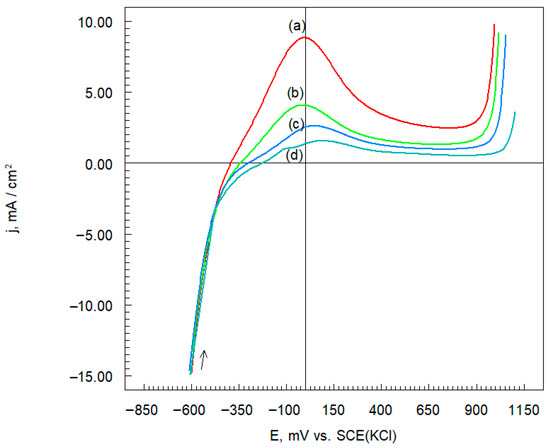
Figure 5.
Potentiodynamic polarization curves of Inconel 625 (a) before and after exposure in alkaline nitrate solutions: (b) 0.25 M, (c) 0.50 M, (d) 1.00 M NO3−. Test solution contained 1.2 M Cl− (pH 1.5), dE/dt 1 mV/s.
The process of hydrogen depolarization occurs in the cathode region of the potentiodynamic polarization curve (Figure 5). In an acid corrosive environment, the cathodic branch of the polarization curve corresponds to the simplified reduction of hydrogen ions [19,20]:
Me0 + 2 H+ → Me0 + H2 − x e−
On the other hand, the anodic reaction was as follows:
where x is number of electrons.
Me0 → Mez+ + x e−
The test chloride electrolyte was not deoxidized. Therefore, under experimental conditions, the following reaction is possible on the Inconel 625 surface that has not been chemically modified:
m Me + n/2 O2 → (MemOn)ads
The electrode surfaces were passivated, and the surfaces of the superalloy were covered with the (MemOn)ads coating. Therefore, the recorded potentiodynamic polarization curve has a characteristic course for materials that passivate; Figure 5, curve (a). In this case for a potential of −25 mV vs. SCE(KCl), the passivation current density (jp) was recorded at a level of 8.9 mA/cm2. As a result of a further increase in potential, there is a significant decrease in the current density value of the tested electrode. A wide potential range (approximately 500 mV) means that the (MemOn)ads adsorbed on the Inconel 625 surface is tight and protects the electrode material well against further oxidation. After exceeding the potential of about 1000 mV vs. SCE(KCl) (Figure 5, curve (a)) a sharp increase in current density is observed due to the destruction of coating in the acidic chloride environment (Reaction (4)).
Then, potentiodynamic polarization curves were recorded for the Inconel 625 electrodes whose surfaces were chemically modified in an alkaline sodium nitrate(V) solution. It was found that as a result of the chemical modification of superalloy surfaces, the passivation current density decreases with increasing concentration of sodium nitrate(V) solution (Figure 5, curves (b)–(d)). It can be assumed that in the environment of oxidizing solutions, the (MemOn)ads is additionally sealed, which significantly reduces contact between the superalloy and the aggressive corrosion environment. However, oxide metastable coatings can partially dissolve, especially when exposed to strong corrosive media and eventually become open ion channels that cause corrosion, leading to material failure. The coatings containing nickel, chromium, molybdenum, and other elemental oxides are generally considered to have excellent corrosion resistance even in strong electrolyte environments [21,22]. Therefore, the modification by chemical method in an alkaline sodium nitrate(V) solution of Inconel 625 surface is effective. The tightness passivation of the (MemOn)ads depends on the NO3− concentration in the oxidizing solution. For the Inconel 625 sample, the surface of which was not modified in an alkaline sodium nitrate(V) solution, the protective layer is stable in the potential range of about 600 mV (Figure 5, curve (a)). However, after the exposure of superalloy samples to an alkaline solution containing 1.00 M NO3−, the range of superalloy coating durability potential increases significantly to a value about of 1000 mV (Figure 5, curve (d)). Moreover, after exceeding the electrode potential of about 1000 mV vs. SCE(KCl), the passivation layer on the surface of all samples dissolves and a sharp increase in current density was observed due to the oxidation of superalloy surfaces; Figure 5, curves (b)–(d).
3.4.3. Chronoamperometric Curves
The study of current response as a function of time at suitably selected potentials is called chronoamperometry (ChA). Figure 6 shows the ChA curves of Inconel 625 after exposure in an alkaline nitrate, i.e., 1.00 M NO3− electrolyte. However, similar ChA curves were obtained for the remaining Inconel 625 samples whose surface structure was modified in the solutions containing 0.25 M and 0.50 M NO3−. The measurement time was 300 s.
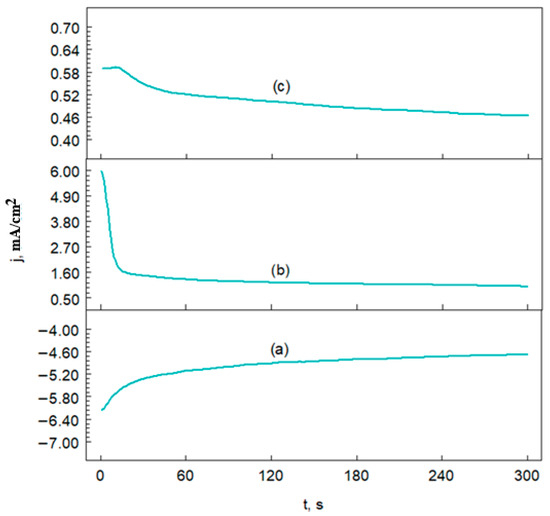
Figure 6.
Chronoamperometric curves of Inconel 625 after exposure in alkaline nitrate 1.00 M NO3− solution. Test solution contained 1.2 M Cl− (pH 1.5). Potential values were as follows: (a) −500 mV, (b) 100 mV, and (c) 600 mV.
The potentials of the working electrode were selected based on the potentiodynamic polarization curve, i.e., Figure 5, curve (d). However, for the potential of −500 mV vs. SCE(KCl), the H+ ion reduction process (Reaction (5)) took place on the surface of the working electrode (Figure 6, curve (a)). At the beginning of the cathode, current density increases. Thus, the H+ ion reduction process is stable under the experimental conditions. On the other hand, for the potential of 100 mV vs. SCE(KCl) (Figure 6, curve (b)), oxidation of the Inconel 625 surface is not observed. The passivation current density is constant and did not change during the experiment. The assumption was confirmed that the passive oxide layer on the surface of Inconel 625 was tight and protects the surface of the superalloy well against oxidation. For a more positive working electrode potential, i.e., 600 mV vs. SCE(KCl) (Figure 6, curve (c)), the oxidation current density of Inconel 625 decreases slightly with increasing experiment duration. This is probably because of passive layer on the superalloy surface being additionally sealed according to Reaction (7). Therefore, the (MemOn)ads is stable in a wide range of electrode potentials and protects the superalloy surface well against corrosion.
3.5. Corrosion Electrochemical Parameters
Potentiodynamic polarization curves of Inconel 625 (Figure 5) were used to designate the corrosion electrochemical parameters of tested materials; Figure 7.
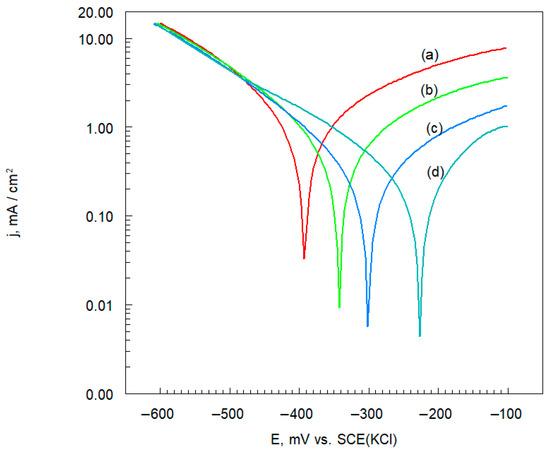
Figure 7.
Potentiodynamic polarization curves on a semi-logarithmic (Tafel) scale of Inconel 625, (a) before and after exposure in alkaline nitrate: (b) 0.25 M, (c) 0.50 M, (d) 1.00 M NO3−. Test solution contained 1.2 M Cl− (pH 1.5).
The corrosion electrochemical parameters of Inconel 625 before and after exposure in an alkaline sodium nitrate(V) solution are listed in Table 4.
Table 4.
Corrosion electrochemical parameters of Inconel 625 before and after exposure in an alkaline sodium nitrate(V) solution.
The values of the corrosion potential (Ecorr) of the tested materials move towards positive values with the increase in NO3− concentration—Table 4. This means that the resistance of the tested materials to corrosion in the chloride environment increases. The lowest value of the corrosion current density, jcorr = 0.27 mA cm−2 (Table 4), was recorded for Inconel 625-1.00. The best anti-corrosion properties were obtained for the superalloy after exposure in an alkaline solution that contained 1.00 M NO3−. The slopes of the Tafel sections, i.e., (−bc) of the potentiodynamic polarization curves, do not change significantly with increasing nitrate concentration (Table 4). The H+ reduction mechanism (Reaction (5)) is not influenced by the concentration of nitrate in the oxidizing solutions. However, the slopes of the anodic polarization curves (ba) decrease with the increase in nitrate concentration used for chemical modification of the Inconel 625 surface—Table 4. The oxidation mechanism (Reaction (6)) of the Inconel 625 surface depends on the nitrate concentration in the oxidizing solution.
3.5.1. Polarization Resistance
The polarization resistances (Rp) of the tested materials were determined on the basis of the slope of the potentiodynamic polarization curves (Table 4). The polarization resistance is described as [19,20] follows:
and
where ba and bc are the slopes of the Tafel sections of the potentiodynamic polarization curves.
The polarization resistance (Rp) values of Inconel 625 before and after exposure in an alkaline sodium nitrate(V) solution are collected in Table 5.
Table 5.
Polarization resistance of Inconel 625 before and after exposure in alkaline nitrates.
The polarization resistance (Equation (8)) of the Inconel 625 surface was determined on the basis of slope of the Tafel potentiodynamic polarization curves (Table 4). If the concentration of NO3− in the oxidizing solution increases, the value of the polarization resistance of the oxide layer also increases—Table 5. A thick layer of the (MemOn)ads was formed on the Inconel 625 surface according to the Reactions (1) and (2). The highest value of polarization resistance, 183,710 Ω cm2, was recorded for the superalloy after exposure in an environment with 1.00 M NO3−. Therefore, due to the high Rp value (Table 5), the exchange of mass and electric charge between the working electrode and the solution is significantly hindered. Moreover, the oxide coating on the surface of the superalloy effectively protects the material against corrosion.
3.5.2. Corrosion Rate
The corrosion rate (CW) values of the materials were calculated on the basis of Equation [20]:
where 3.268 is the coefficient if the corrosion rate is expressed in mm/year, jcorr (mA/cm2) is the corrosion current density (Table 4), Mi is the average value of the sum of the molar mass of the most important components of the superalloy, i.e., Ni, Cr, and Mo (Table 1), and ρ is the density of Inconel 625, i.e., 8.44 g/cm3 [23].
CW = 3.268 × (jcorr ∑Mi)/ρ
However, for the oxidation reaction of the basic component of the superalloy,
Ni0 − 2 e− → Ni2+
Cr0 − 3 e− → Cr3+
Mo0 − 4 e− → Mo4+
Therefore Equation (10) can be written as follows:
where 68.9 is the coefficient that is obtained after simplifying Equation (10).
CW = 68.9 jcorr
The CW values of Inconel 625 before and after exposure in alkaline nitrates are collected in Table 6.
Table 6.
Corrosion rate of Inconel 625 before and after exposure in alkaline nitrates.
The corrosion rate values of Inconel 625 systematically decrease with the increase in NO3− concentration (Table 6). The CW value, i.e., 18.6 mg/year is also the lowest for the Inconel 625-1.00 sample, whose surface structure was significantly changed by exposure in an alkaline solution that contained 1.00 M NO3−. On the other hand, the mentioned corrosion rate is more than five times lower compared to the corrosion rate of Inconel 625, the surface which was not modified in the oxidizing sodium nitrate(V) environment. However, the best anti-corrosion properties were demonstrated by the Inconel 625-1.00 sample. Therefore, the passive layer effectively separates the Inconel 625 surface from the aggressive corrosive environment.
3.5.3. Surface Coverage Degree
Based on the value of the degree of electrode surface coverage, it is possible to determine with a very high degree of probability the anti-corrosion protection of the material against the destructive effects of the environment. The surface coverage (SC) degree of Inconel 625 was calculated. For this purpose, the following equation was used [20]:
where j0corr is the corrosion current density for the sample before exposure in the solution with NO3−, jcorr is the corrosion current density for samples after exposure in the NO3− solution (Table 4). The calculation results of Inconel 625 samples after exposure in alkaline nitrate solutions are summarized in Table 7.
SC = ((j0corr − jcorr)/j0corr) × 100
Table 7.
Surface coverage degree of Inconel 625 after exposure in alkaline nitrate solutions.
Alkaline sodium nitrate(V) solutions have been shown to be very effective in protecting Inconel 625 surfaces against corrosion. Therefore, even for the lowest concentration of nitrate in the oxidizing solution of 0.25 M NO3−, the degree of electrode surface coverage was about 26%—Table 7. However, at the highest NO3− concentration in the oxidizing solution, the electrode surface coverage increased to a level close to 80% (Table 7).
An attempt was also made to further increase in SC value by increasing the sodium nitrate(V) concentration in the oxidizing solution. The concentration of 1.00 M NO3− in an alkaline oxidizing solution is adequate to obtain a tight passive layer which sufficiently protects the superalloy surface against corrosion in an aggressive chloride environment.
Therefore, it is recommended to use the chemical surface modification method of Inconel 625 in an alkaline sodium nitrate(V) environment to increase the electrochemical corrosion resistance of the superalloy in an aggressive chloride environment.
3.5.4. Surface Roughness
Surface roughness is the measurement of the relative smoothness of a surface’s profile, calculated via the microscopic deviations in a surface’s true form. However, the larger the deviation from its true form, the rougher the surface, whilst the smaller the deviation, the smoother the surface. Figure 8 shows the topography and profile shape of the Inconel 625 surface before and after exposure in an alkaline nitrate solution. Test solutions contained 1.2 M Cl− (pH 1.5).
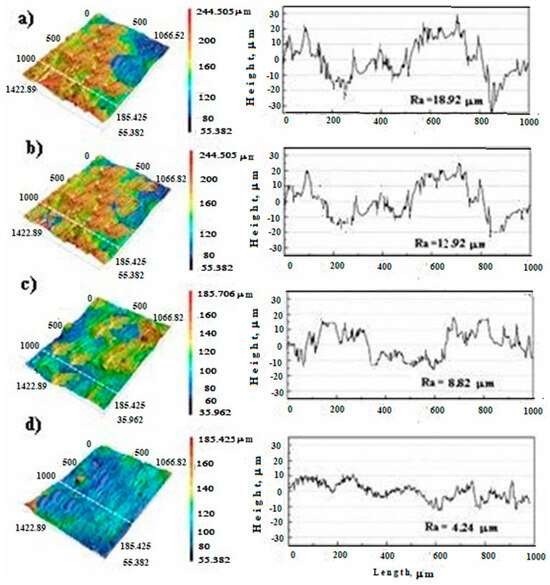
Figure 8.
Topography and profile shape of Inconel 625 surface: (a) before and after exposure in alkaline nitrate solutions: (b) 0.25 M, (c) 0.50 M, (d) 1.00 M NO3−. Test solution contained 1.2 M Cl− (pH 1.5).
Linear surface roughness (Ra) is commonly used to quantify the level of surface roughness. The Ra values are listed in Table 8.
Table 8.
Linear surface roughness of Inconel 625 before and after exposure in alkaline nitrates.
The linear surface roughness of Inconel 625 systematically decreases with increasing NO3− concentration in the tested solutions. The Ra varies from 18.92 µm to 4.24 µm before and after exposure in alkaline nitrates, respectively (Table 8). As a result of the formation of the oxide layer (Reactions (1) and (2)), the surface structure of Inconel 625 becomes smoother. Thus, chemical modification in a solution containing the highest NO3− concentration results in a superalloy surface about 4.5 times smoother compared to the Inconel 625 surface that was not modified in an alkaline nitrate solution.
4. Conclusions
The paper presents the results of research on the influence of nitrate (NO3−) concentration on the corrosion resistance of Inconel 625. The obtained research results allowed for the formulation of the following conclusions:
- The surfaces of Inconel 625 were chemically modified by oxidation in an alkaline sodium nitrate(V) solution. The surfaces were covered with a thin, smooth, and well-adhered layer of (MemOn)ads as passive coatings.
- As the NO3− concentration increases, the microhardness (HV10) of Inconel 625 surfaces increases slightly.
- The adsorption of the (MemOn)ads effectively separates the Inconel 625 surface from contact with the aggressive corrosive environment.
- The oxide coatings on the Inconel 625 surface were destroyed in the acidic chloride solution. The least amount of destruction to the coating was observed for the Inconel 625-1.00 sample after exposure in a solution containing 1.00 M NO3−.
- The highest polarization resistance (Rp) and the lowest corrosion rate (CW) values were recorded for the Inconel 625 sample after exposure in the solution with the highest concentration of nitrate in an alkaline environment.
- The (MemOn)ads layer on the Inconel 625 surface significantly impedes the exchange of mass and electric charge between the electrode and the electrolyte solution.
- For the highest NO3− concentration, a fairly high (approximately 80%) degree of electrode surface coverage (SC) and the lowest value of linear surface roughness (Ra) were achieved.
- To increase the anti-corrosion properties of Inconel 625, it is recommended to modify the superalloy surface by chemical means in an oxidizing environment.
Funding
The research was financed by the Jan Kochanowski University in Kielce, research topic no. SUPB RN 25 222.
Data Availability Statement
The original contributions presented in this study are included in the article. Further inquiries can be directed to the corresponding author.
Conflicts of Interest
The author declares no conflicts of interest.
References
- Verdi, D.; Garrido, M.A.; Munez, C.J.; Poza, P. Cr3C2 incorporation into an Inconel 625 laser cladded: Effects on matrix microstructure, mechanical properties and local scratch resistance. Mater. Des. 2015, 67, 20–27. [Google Scholar] [CrossRef]
- Cooper, D.; Thornby, J.; Blundell, N.; Henrys, R.; Williams, M.A.; Gibbons, G. Design and manufacture of high performance hollow engine valves by additive layer manufacturing. Mater. Des. 2015, 69, 44–55. [Google Scholar] [CrossRef]
- Petrova, R.S.; Suwattananont, N.; Samardzic, V. The effect of boronizing on metallic alloys for automotive applications. J. Mater. Eng. Perform. 2008, 17, 340–345. [Google Scholar] [CrossRef]
- Makuch, N.; Kulka, M. Microstructural characterization and some mechanical properties of gas borided Inconel 600-alloy. Appl. Surf. Sci. 2014, 314, 1007–1018. [Google Scholar] [CrossRef]
- Dinda, G.; Dasgupta, A.; Majumder, J. Laser aided direct metal deposition of Inconel 625 superalloy: Microstructural evolution and thermal stability. J. Mater. Sci. Eng. A 2009, 509, 98–104. [Google Scholar] [CrossRef]
- Tabernero, I.; Lamikiz, A.; Martínez, S.; Ukar, E.; Figueras, J. Evaluation of the mechanical properties of Inconel 718 components built by laser cladding. J. Int. J. Mach. Tools Manuf. 2011, 51, 465–470. [Google Scholar] [CrossRef]
- Abioye, T.E.; McCartney, D.G.; Clare, A.T. Laser cladding of Inconel 625 wire for corrosion protection. J. Mater. Process. Technol. 2015, 217, 232–240. [Google Scholar] [CrossRef]
- Liu, H.; Tan, C.K.I.; Wei, Y.; Lim, S.H.; Lee, C.J.J. Laser-cladding and interface evolutions of inconel 625 alloy on low alloy steel substrate upon heat and chemical treatments. Surf. Coat. Technol. 2020, 404, 126607. [Google Scholar] [CrossRef]
- Deng, D.; Wang, C.; Liu, Q. Effect of standard heat treatment on microstructure and properties of borided Inconel 718. Trans. Nonferrous Met. Soc. 2015, 25, 25437–25443. [Google Scholar] [CrossRef]
- Kurt, B.; Kucuk, Y.; Gok, M.S. Microabrasion wear behavior of VC and CrC coatings deposited by thermoreactive diffusion technique. Tribol. Trans. 2014, 57, 345–352. [Google Scholar] [CrossRef]
- Ren, Y.; Zhou, G.S.; Li, D.G. A protective state observed for the passive film formed on Alloy 625 in a hydrochloric acid solution. Appl. Surf. Sci. 2018, 431, 197–201. [Google Scholar] [CrossRef]
- Wang, Z.; Zhang, Z.-R.; Zhang, L.; Feng, Z.; Lu, M.-X. Comparison study on the semi-conductive and dissolution behaviour of 316 L and Alloy 625 in hydrochloric acid solution. Acta Metall. Sin. 2020, 33, 403–414. [Google Scholar] [CrossRef]
- Dai, H.; Shi, S.; Yang, L.; Hu, J.; Liu, C.; Guo, C.; Chen, X. Effects of elemental composition and microstructure inhomogeneity on the corrosion behavior of nickel-based alloys in hydrofluoric acid solution. Corros. Sci. 2020, 176, 108917. [Google Scholar] [CrossRef]
- Gola, K.; Ledwig, P.; Dubiel, B. Effect of microstructure of additively manufactured Inconel 625 on long-term corrosion behaviour in sulfuric acid media. JOM 2023, 75, 1242–1250. [Google Scholar] [CrossRef]
- Reffass, M.; Sabot, R.; Jeannin, M.; Berziou, C.; Refait, R. Effects of phosphate species on localized corrosion of steel in NaHCO3 + NaCl electrolytes. Electrochim. Acta 2009, 54, 4389–4396. [Google Scholar] [CrossRef]
- Zhang, Y.; Zhang, X.; Chen, S.; Liu, T.; Wang, L.; Wu, K. Corrosion behaviour and passive film properties of nickel-based alloy in phosphoric acid. Corros. Commun. 2023, 9, 77–88. [Google Scholar] [CrossRef]
- Thomas, A.; El-Wahabi, M.; Cabrera, J.M.; Prado, J.M. High temperature deformation of Inconel 718. J. Mater. Process. Technol. 2006, 177, 469–472. [Google Scholar] [CrossRef]
- Morshed-Behbahani, K.; Nasiri, A. On the corrosion and passivity of Inconel 625 in HNO3 solution. Corros. Commun. 2025, 17, 28–34. [Google Scholar] [CrossRef]
- Scendo, M.; Żórawski, W. Corrosion properties of cold-sprayed Cr3C2-25(Ni20Cr) coatings after heat treatment. Materials 2024, 17, 6289. [Google Scholar] [CrossRef] [PubMed]
- Scendo, M. Influence of sulphide concentration on the properties of Cr3C2-25(Ni20Cr) cermet coatings on Al7075 substrate. Metals 2025, 15, 273. [Google Scholar] [CrossRef]
- Zheng, Z.B.; Zheng, Y.G.; Sun, W.H.; Wang, J.Q. Erosion–corrosion of HVOF-sprayed Fe-based amorphous metallic coating under impingement by a sand-containing NaCl solution. Corros. Sci. 2013, 76, 337–347. [Google Scholar] [CrossRef]
- Bergant, Z.; Trdan, U.; Grum, J. Effect of high-temperature furnace treatment on the microstructure and corrosion behavior of NiCrBSi flame-sprayed coatings. Corros. Sci. 2014, 88, 372–386. [Google Scholar] [CrossRef]
- Lemos, G.V.B.; Farina, A.B.; Piaggio, H.; Bergmann, L.; Ferreira, J.Z.; Fernandez dos Santos, J.; Voort, G.V.; Reguly, A. Mitigating the susceptibility to intergranular corrosion of alloy 625 by friction-stir welding. Sci. Rep. 2022, 12, 3482. [Google Scholar] [CrossRef]


Disclaimer/Publisher’s Note: The statements, opinions and data contained in all publications are solely those of the individual author(s) and contributor(s) and not of MDPI and/or the editor(s). MDPI and/or the editor(s) disclaim responsibility for any injury to people or property resulting from any ideas, methods, instructions or products referred to in the content. |
© 2026 by the author. Licensee MDPI, Basel, Switzerland. This article is an open access article distributed under the terms and conditions of the Creative Commons Attribution (CC BY) license.