Article

Experimental Study on Fatigue Performance of Q355D Notched Steel Under High-Low Frequency Superimposed Loading

1
Department of Civil Engineering, Hangzhou City University, Hangzhou 310015, China
2
Zhejiang Engineering Research Center of Intelligent Urban Infrastructure, Hangzhou City University, Hangzhou 310015, China
3
Center for Balance Architecture, Zhejiang University, Hangzhou 310058, China
4
College of Civil Engineering & Architecture, Zhejiang University, Hangzhou 310058, China
*
Author to whom correspondence should be addressed.
Metals 2025, 15(9), 975; https://doi.org/10.3390/met15090975
Submission received: 30 July 2025 / Revised: 25 August 2025 / Accepted: 29 August 2025 / Published: 31 August 2025
(This article belongs to the Special Issue Fatigue and Damage in Metallic Materials)

Abstract

During the service life of steel bridges, the structural stress histories display combined cyclic characteristics due to the superposition of low-frequency thermal loading and high-frequency vehicle loading. To investigate the fatigue performance under such loading patterns, a series of constant-amplitude and high-low frequency superimposed loading fatigue (HLSF) tests were conducted on notched specimens fabricated from Q355D bridge steel. The influence of HLSF waveform parameters on fatigue life was systematically investigated. Based on the fracture evolution mechanism, a concept of low-frequency periodic damage acceleration factor was proposed to effectively model the block nonlinear damage effects, and the applicability of existing fatigue life prediction models was discussed. The results show that the effect of average stress on the fatigue life under HLSF can be effectively considered by Walker’s formula. Low-amplitude ratios and low-frequency ratios indicate unfavorable loading conditions that may accelerate the Q355D fatigue damage accumulation, and these conditions are not adequately accounted for in current life prediction models. Compared to constant amplitude loading, HLSF can lead to a 66% and 46% reduction in high-frequency life when the amplitude ratio reaches 0.12 and the frequency ratio reaches 100. Compared to Miner’s rule, the proposed damage correction method reduces the life prediction error for HLSF by 11%. These findings provide valuable references for the fatigue assessment of bridge steel structures under the coupled effects of temperature and vehicle loading.

1. Introduction

In practical engineering, numerous structures or mechanical components are simultaneously subjected to cyclic loads with significantly different frequencies. For example, gas turbine blades are exposed to low-frequency loads caused by centrifugal forces and high-frequency vibrations [1], while ship structures are affected by waves of varying frequencies [2]. For bridge steel structures, they are subjected to the superimposed cyclic stresses of low-frequency temperature loads and high-frequency vehicle loads during their service life [3,4,5,6,7,8,9,10] with the frequency ratio of these two load types reaching up to thousands of times per day. However, existing fatigue design codes for steel bridges [11,12] primarily focus on fatigue damage induced by vehicular loading, with limited attention paid to the effects of temperature effects. With the intensification of global climate change, the influence of thermal fluctuations on fatigue damage in bridge structures has attracted growing attention [13,14,15,16,17,18]. It is of significant engineering importance to investigate the damage mechanisms of bridge steel under high-low frequency superimposed loading fatigue (HLSF) and to develop corresponding fatigue life prediction models.
Current research on HLSF fatigue primarily focuses on materials used in the aerospace and maritime industries [1,2,19,20,21]. Sonsino et al. [22] and Schijve et al. [23] conducted extensive fatigue tests under HLSF and found that the inapplicability of Miner’s rule (Palmgren-Miner linear damage accumulation rule) becomes especially pronounced when the amplitude ratio between the two waveforms is large. Gao et al. [24] performed HLSF tests on two types of steel with varying frequency ratios and observed that both the frequency ratio and amplitude ratio interact to influence the fatigue response. However, in bridge engineering, there is a notable lack of relevant experimental research, and Miner’s rule remains the primary basis for fatigue assessments [4,25].
To better predict fatigue life under the HLSF loading mode, many models have been developed based on experimental studies of different metallic materials. These models can be broadly classified into three major categories: parameterized empirical models [2,26,27], modified versions of Miner’s rule that incorporate coupled damage increments [28,29,30], and modified versions of two-step nonlinear damage curve models [31,32,33]. The first category comprises parameterized empirical models. These models extract HLSF loading characteristics and calibrate model parameters based on extensive experimental data across various materials. The earliest research in this field was conducted by Trufyakov and Kovalchuk [26]. They performed HLSF tests on materials such as medium-carbon steel S43 and aluminum alloys, introducing a correction factor determined by both the frequency ratio and the amplitude ratio. They proposed a fatigue life prediction model for superimposed loading under dual-frequency conditions. Zhao et al. [27] proposed a modified version of T-K model by incorporating material properties such as yield strength and ultimate tensile strength, and the model demonstrated improved accuracy in predicting the HLSF fatigue life of TC11 titanium alloy under high-frequency ratios. Gan et al. [2] conducted HLSF tests on T-shaped notched specimens of Q345B steel. They examined the effects of load amplitude ratio, frequency ratio, stress ratio, and mean stress level on fatigue behavior. Based on their experimental results, they developed an empirical life prediction model for frequency ratios lower than 10. The second category is established based on Miner’s rule, with adding a damage component that accounts for high-low frequency coupling effects. Researchers such as Zhu et al. [28] and Wang et al. [29,30], through the analysis of a large data set involving superimposed loading tests on materials like Ti-6Al-4V and TC11 titanium alloys, have formulated additional damage component that consider factors including frequency ratio and amplitude ratio. The third category is proposed based on the two-step nonlinear damage curve models. Under the framework of nonlinear damage theory, fatigue damage can be equivalently accumulated across different loading level damage curves [31]. Yue et al. [32] and Hou et al. [33] further refined the two-step M-H model by incorporating the characteristic parameters of the HLSF stress waveform. Their proposed model exhibits enhanced accuracy in predicting the fatigue life of Ti-6Al-4V titanium alloy.
In summary, although research on HLSF has been conducted across various materials, the applicability of existing findings and models to bridge steels remains unconfirmed. Moreover, previous studies have not explored the effect of mean stress, which constitutes a loading condition in bridge structures. This study examines the effects of frequency ratio, amplitude ratio, and mean stress through a series of HLSF tests performed on notched specimens fabricated from Q355D bridge steel. By analyzing the fatigue fracture mechanisms, an exponential block damage correction factor was proposed to quantify the nonlinear interactions caused by high-low frequency coupling damage, thereby improving the predictive accuracy of Miner’s rule. The results provide experimental evidence and methodological guidance for assessing the fatigue life of bridge steel structures subjected to temperature and vehicle superimposed loading.

2. Experimental Design and Results

2.1. Material and Specimen

Q355D is a low-alloy structural steel widely used in railway and highway bridges due to its excellent ductility and high tensile strength. The letter D indicates the quality level. Compared to the Q355B and Q355C steels, Q355D has lower phosphorus and sulfur content and better low-temperature impact resistance [34]. The chemical composition of the material is presented in Table 1. This steel is a hot-rolled material without normalizing treatment, and its main production processes after continuous casting include controlled hot rolling at a finishing rolling temperature of 800 °C to 870 °C, controlled cooling with a final cooling temperature of 620 °C to 660 °C, and heat straightening at temperatures between 550 °C and 600 °C. Smooth round-bar specimens (Figure 1a) were prepared in accordance with GB/T 228.1-2021 [35] and uniaxial tensile tests were conducted under a constant strain rate of ε = 10−3/s. Each test was repeated three times, and the average value was recorded. The basic mechanical properties, summarized in Table 2, confirm that the material satisfies the mechanical performance requirements specified in GB/T 714-2015 [36].
As illustrated in Figure 1b, a type of 90° V-notched specimen was designed for fatigue testing. The specimens were cut and machined from a 10 mm thick Q355D steel plate, with the surfaces polished to a roughness of approximately Ra = 0.8 μm. The minimum radius at the tip of the V-notch was approximately 60 μm. The fatigue behavior of these notched specimens can partially simulate crack-like defects commonly found in welded structures [37].

2.2. Loading Conditions and Results

2.2.1. Generalization of HLSF Stress Waveform Patterns

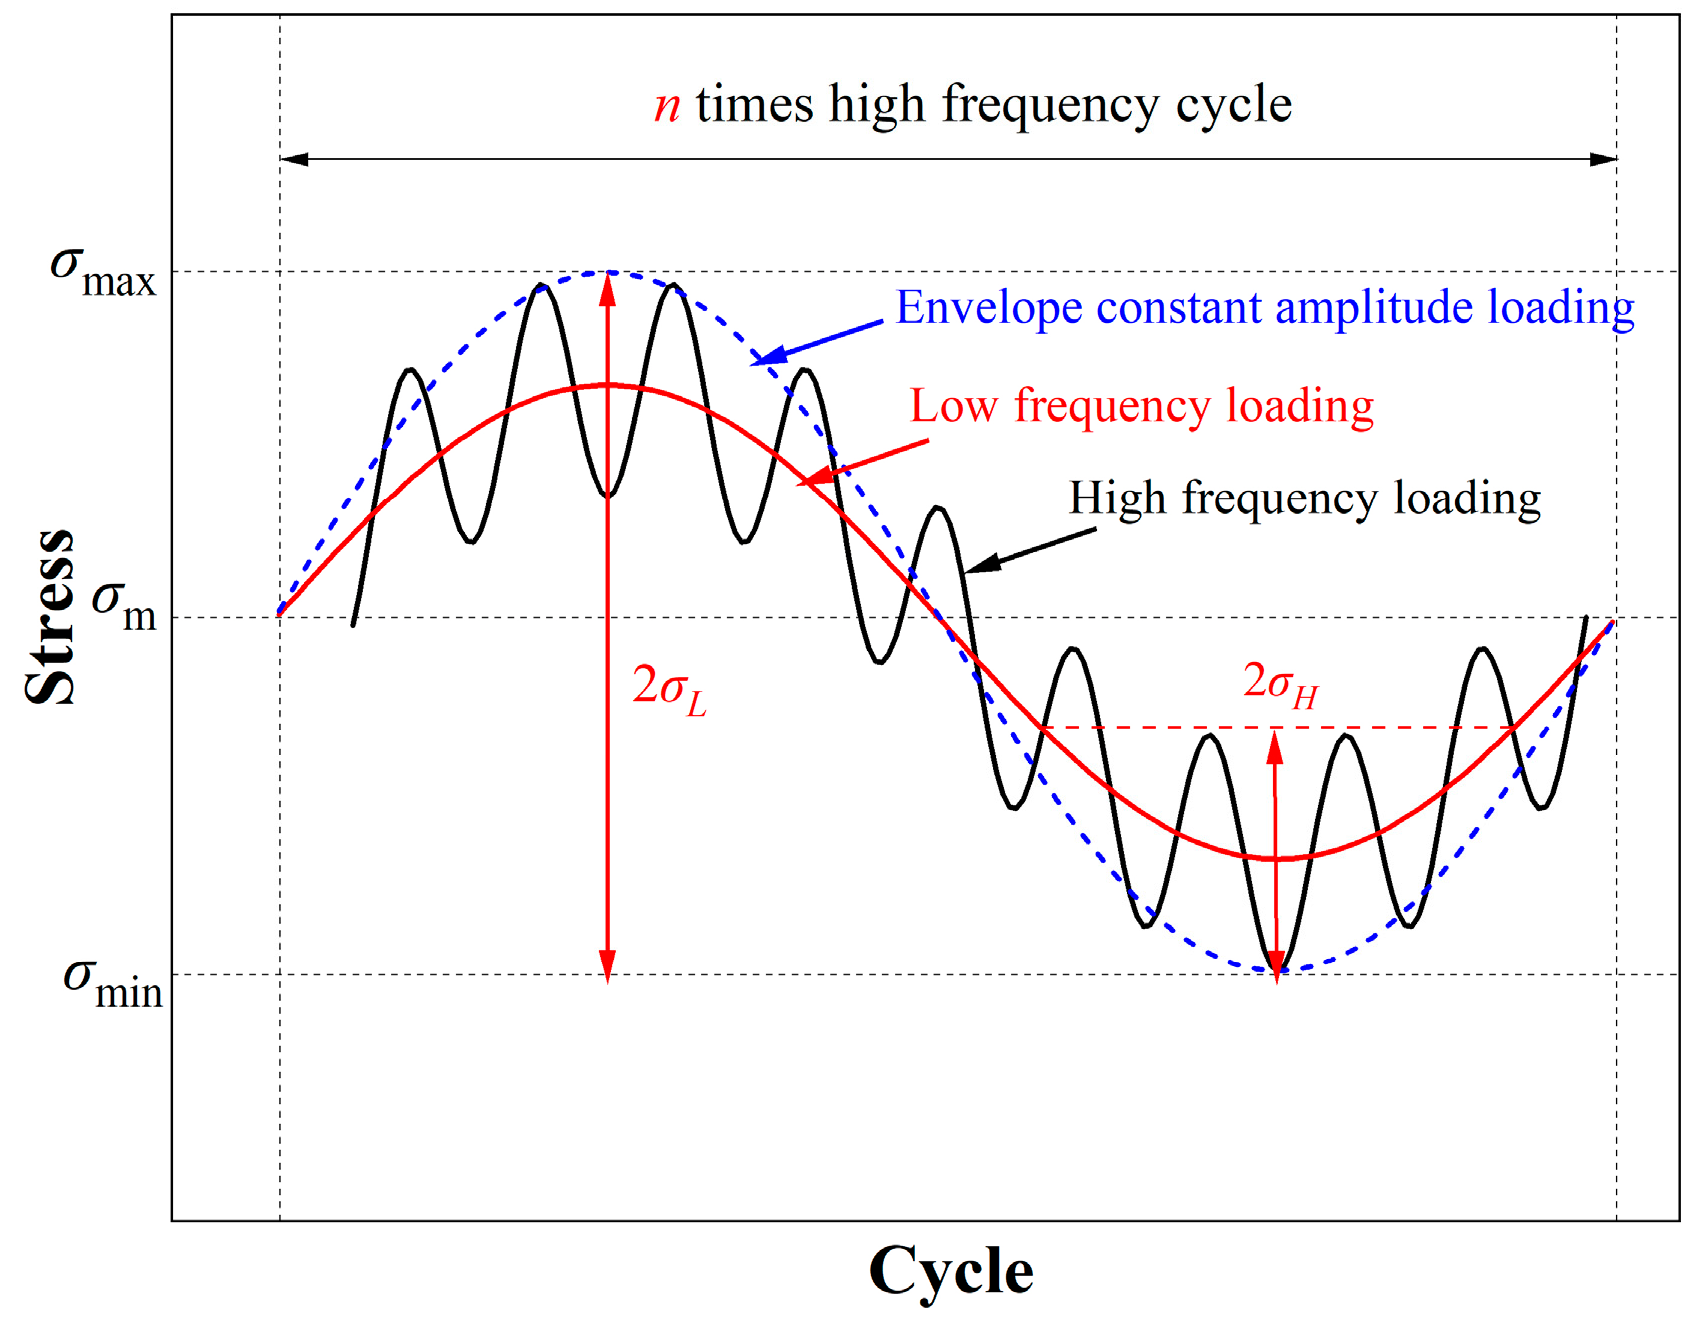
In actual bridge structures, although the stress histories at the fatigue details are typically complex and random, key waveform features can still be extracted to establish load spectra for modular loading studies [38,39]. As an initial investigation into such materials, and to identify more generalizable patterns, the waveforms in this study are simplified to a dual-frequency sine wave superposition, as illustrated in Figure 2. Mathematically, this waveform is composed of three components: the first and second terms represent the low-frequency and high-frequency load components, respectively, while the third term, σm, denotes the overall mean stress of the composite waveform. In this formulation, σaL and σaH denote the stress amplitudes of the low-frequency and high-frequency components, respectively. The envelope of the low-frequency stress amplitude is defined as σL = σaL + σaH, while the high-frequency stress amplitude is given by σH = σaH, fL and φL represent the frequency and phase of the low-frequency load component, respectively, whereas fH and φH correspond to the frequency and phase of the high-frequency load component. σm indicates the overall mean stress of the superimposed waveform. Based on the established literature, several key waveform parameters are introduced: the amplitude ratio α = σH/σL, the frequency ratio n = fH/fL, the maximum stress σmax = σm + σL, the minimum stress σmin = σmσL, and the master stress ratio Rm = σmin/σmax. A complete low-frequency load cycle is defined as a load block, which can be discretized into n high-frequency cycles with amplitude σH and one low-frequency cycle with amplitude σL. The number of cycles to specimen failure is denoted as Nb. The linear damage caused by the high-frequency and low-frequency cycles within each load block is represented by DH and DL, respectively. The total damage induced by each load block is Db = 1/Nb. This idealized waveform approximates, to some extent, the daily stress spectrum blocks experienced by bridge components. The low-frequency wave σaL represents the equivalent stress amplitude induced by standard thermal loading, while the high-frequency wave σaH corresponds to the equivalent stress amplitude due to standard fatigue vehicle loading. The frequency ratio n reflects the average daily number of standard fatigue vehicles, and σm denotes the mean stress under constant loading conditions for the component. Using a reference standard fatigue vehicle load and daily thermal loading cycles, the amplitude ratio α is defined, enabling the equivalent conversion of the random spectrum block based on its high-frequency damage component.

2.2.2. Constant Amplitude Tests

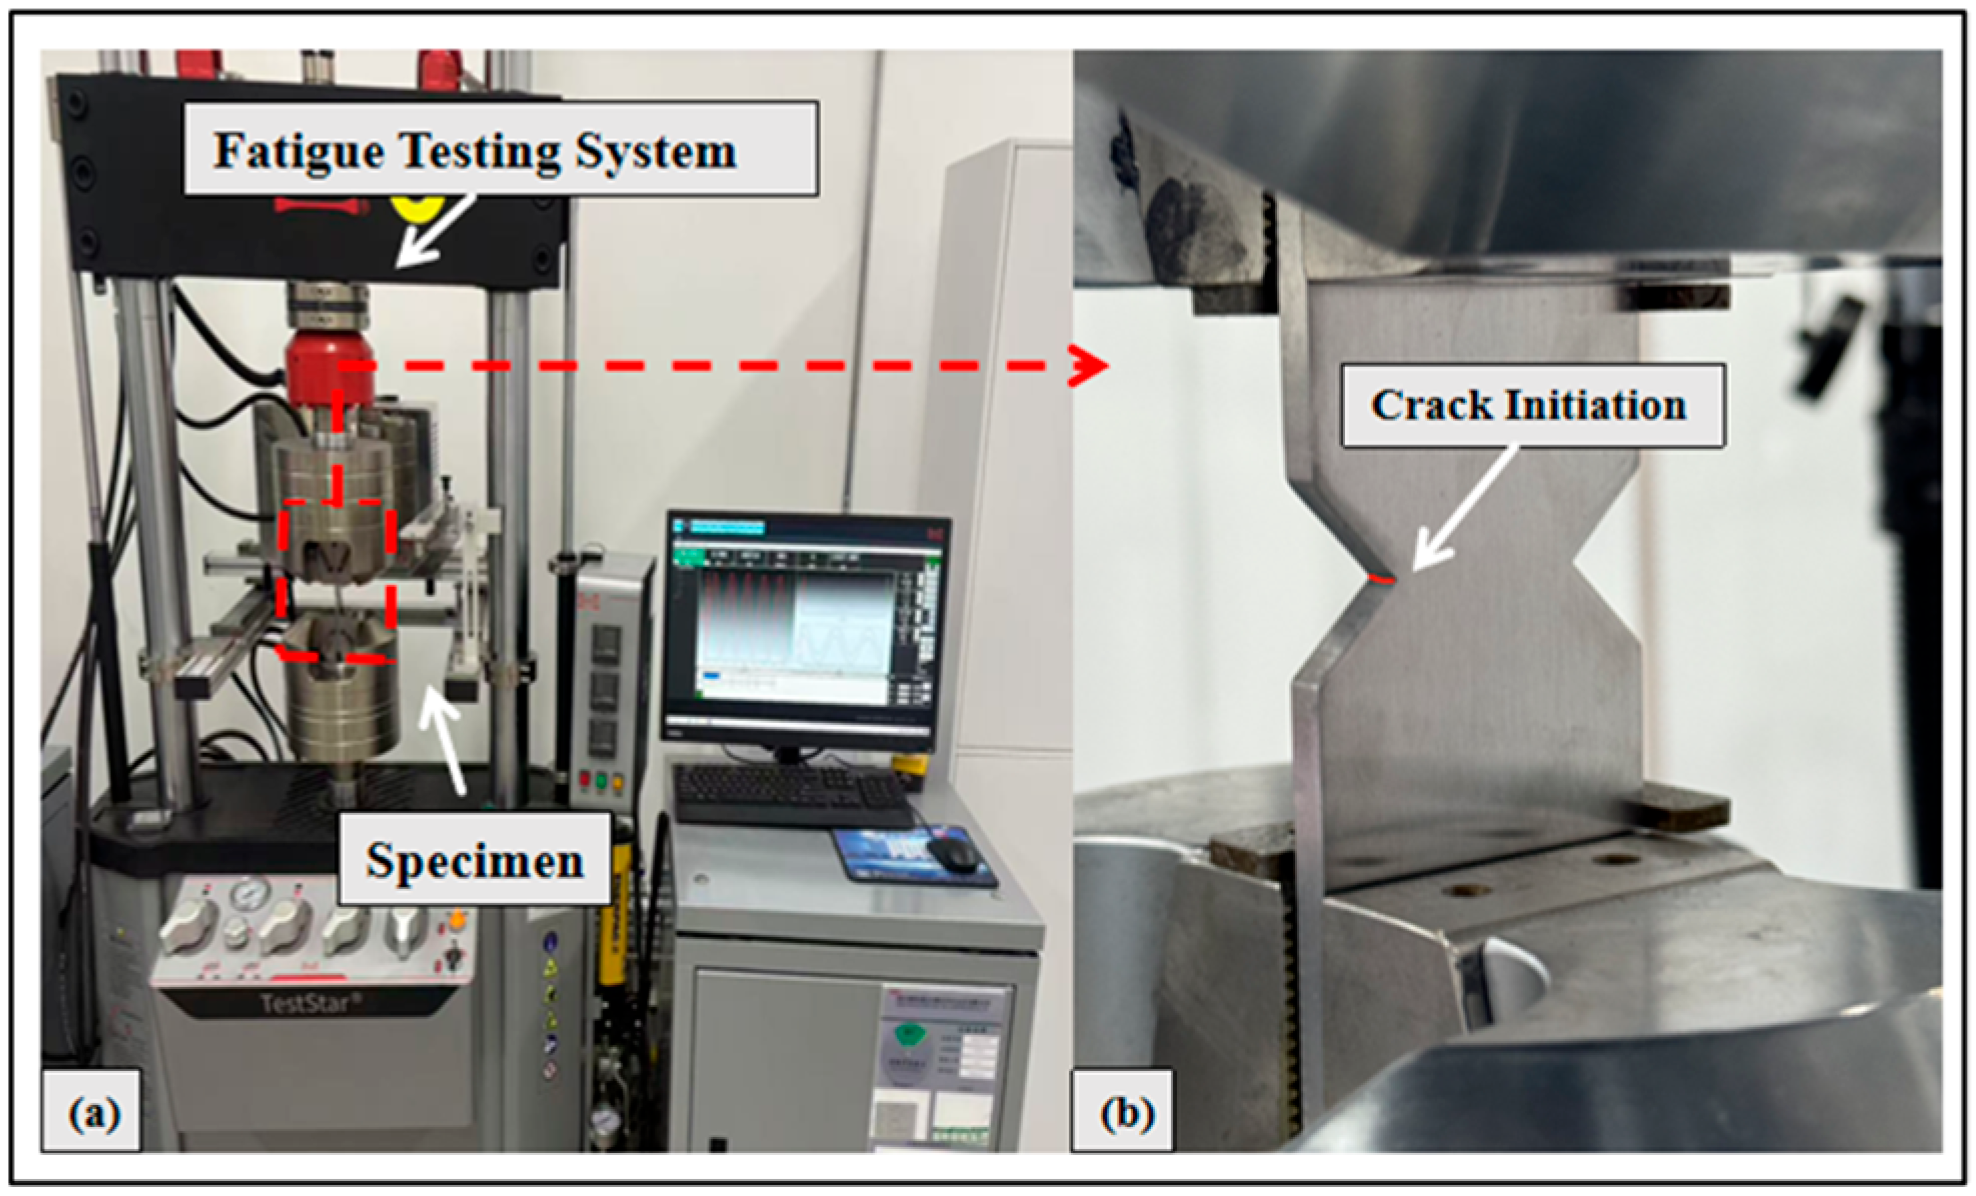
The fatigue tests were carried out using an HD105B-WANCE electro-hydraulic servo fatigue testing machine (Shenzhen, China), which can generate superimposed waveforms by integrating a dynamic electro-hydraulic servo system with a composite load coordination control algorithm. Constant amplitude fatigue tests were conducted under uniaxial force-controlled conditions at a loading frequency of 30 Hz. Fatigue life was determined as the number of cycles until either complete specimen fracture occurred or the loading was interrupted by the system’s protective mechanism due to axial displacement exceeding 10 mm. The fatigue test instrument is illustrated in Figure 3.
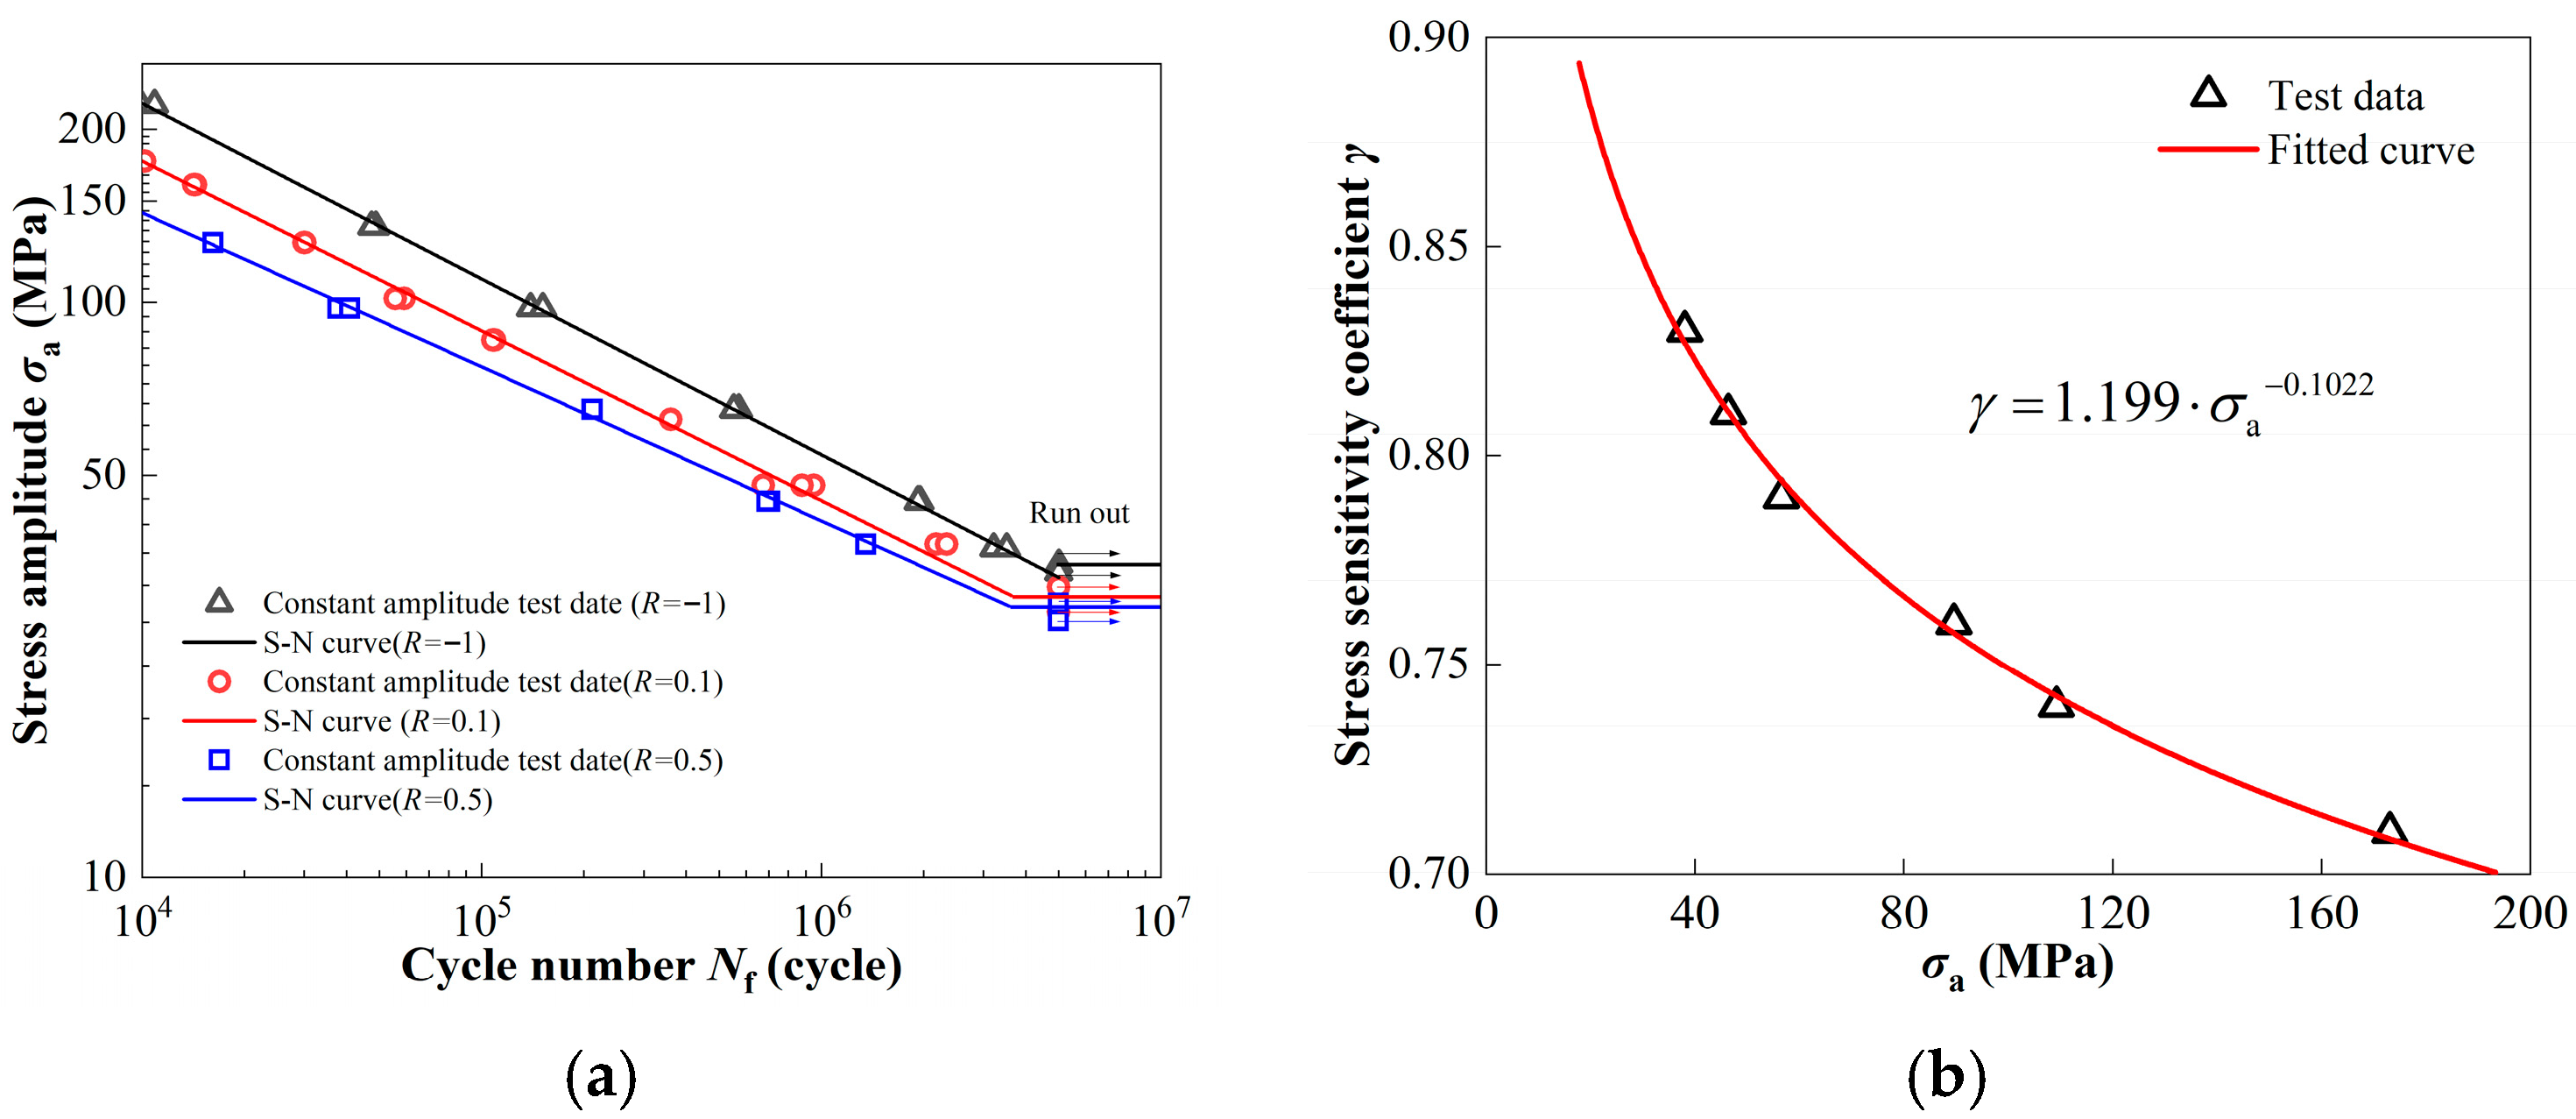
Three groups of constant amplitude fatigue tests were conducted under stress ratios of R = −1, R = 0.1, and R = 0.5. As illustrated in Figure 4a, the relationship between the nominal stress amplitude (defined as the ratio of the load amplitude to the cross-sectional area at the narrowest section of the notched specimen), denoted as σa, and the fatigue life N until complete fracture of the specimen was plotted in a double-logarithmic coordinate system.
Three S-N curves fitted from the experimental data are given by Equations (1)–(3):
For R = −1:
σ a 3.30 N = 5.43 × 10 11
For R = 0.1:
σ a 3.497 N = 6.71 × 10 11
For R = 0.5:
σ a 3.665 N = 8.27 × 10 11
Based on the above constant amplitude test results, the Walker’s formula [40] was adopted to construct a family of S-N curves that can account for the effect of mean stress. The expression of Walker’s formula is shown in Equation (4). By applying this formula, the stress amplitude σa under any given stress ratio R can be converted into the equivalent stress amplitude σ a under a reference stress ratio Rref [41]. This transformation enables the estimation of fatigue strength and life across different mean stress conditions, thereby establishing a basis for subsequent fatigue life analysis under superimposed loading scenarios.
σ a = σ a 1 R r e f 1 R 1 γ
where γ represents the stress sensitivity coefficient. Figure 4b presents the fitted stress sensitivity coefficient γ, which is derived from the results of the other two stress ratios relative to the reference stress ratio Rref = 0.1. It decreases as the stress amplitude σa increases.

2.2.3. Superimposed Loading Tests

As shown in Table 3, fifteen HLSF test conditions were designed and applied to the Q355D V-notched specimens with three repeated tests. The experimental setup was appropriately extended to encompass a range of typical loading scenarios encountered by bridge components. Specifically, the amplitude ratio α ranges from 0.12 to 0.54, the frequency ratio n ranges from 100 to 2000, and the master stress ratio Rm ranges from −1 to 0.1. For each factor (σH, σL, n, Rm), 4 to 5 parameter levels were established as control variables. During the tests, the high-frequency component frequency fH was fixed at 30 Hz, while the low-frequency load frequency was adjusted to achieve different frequency ratios.
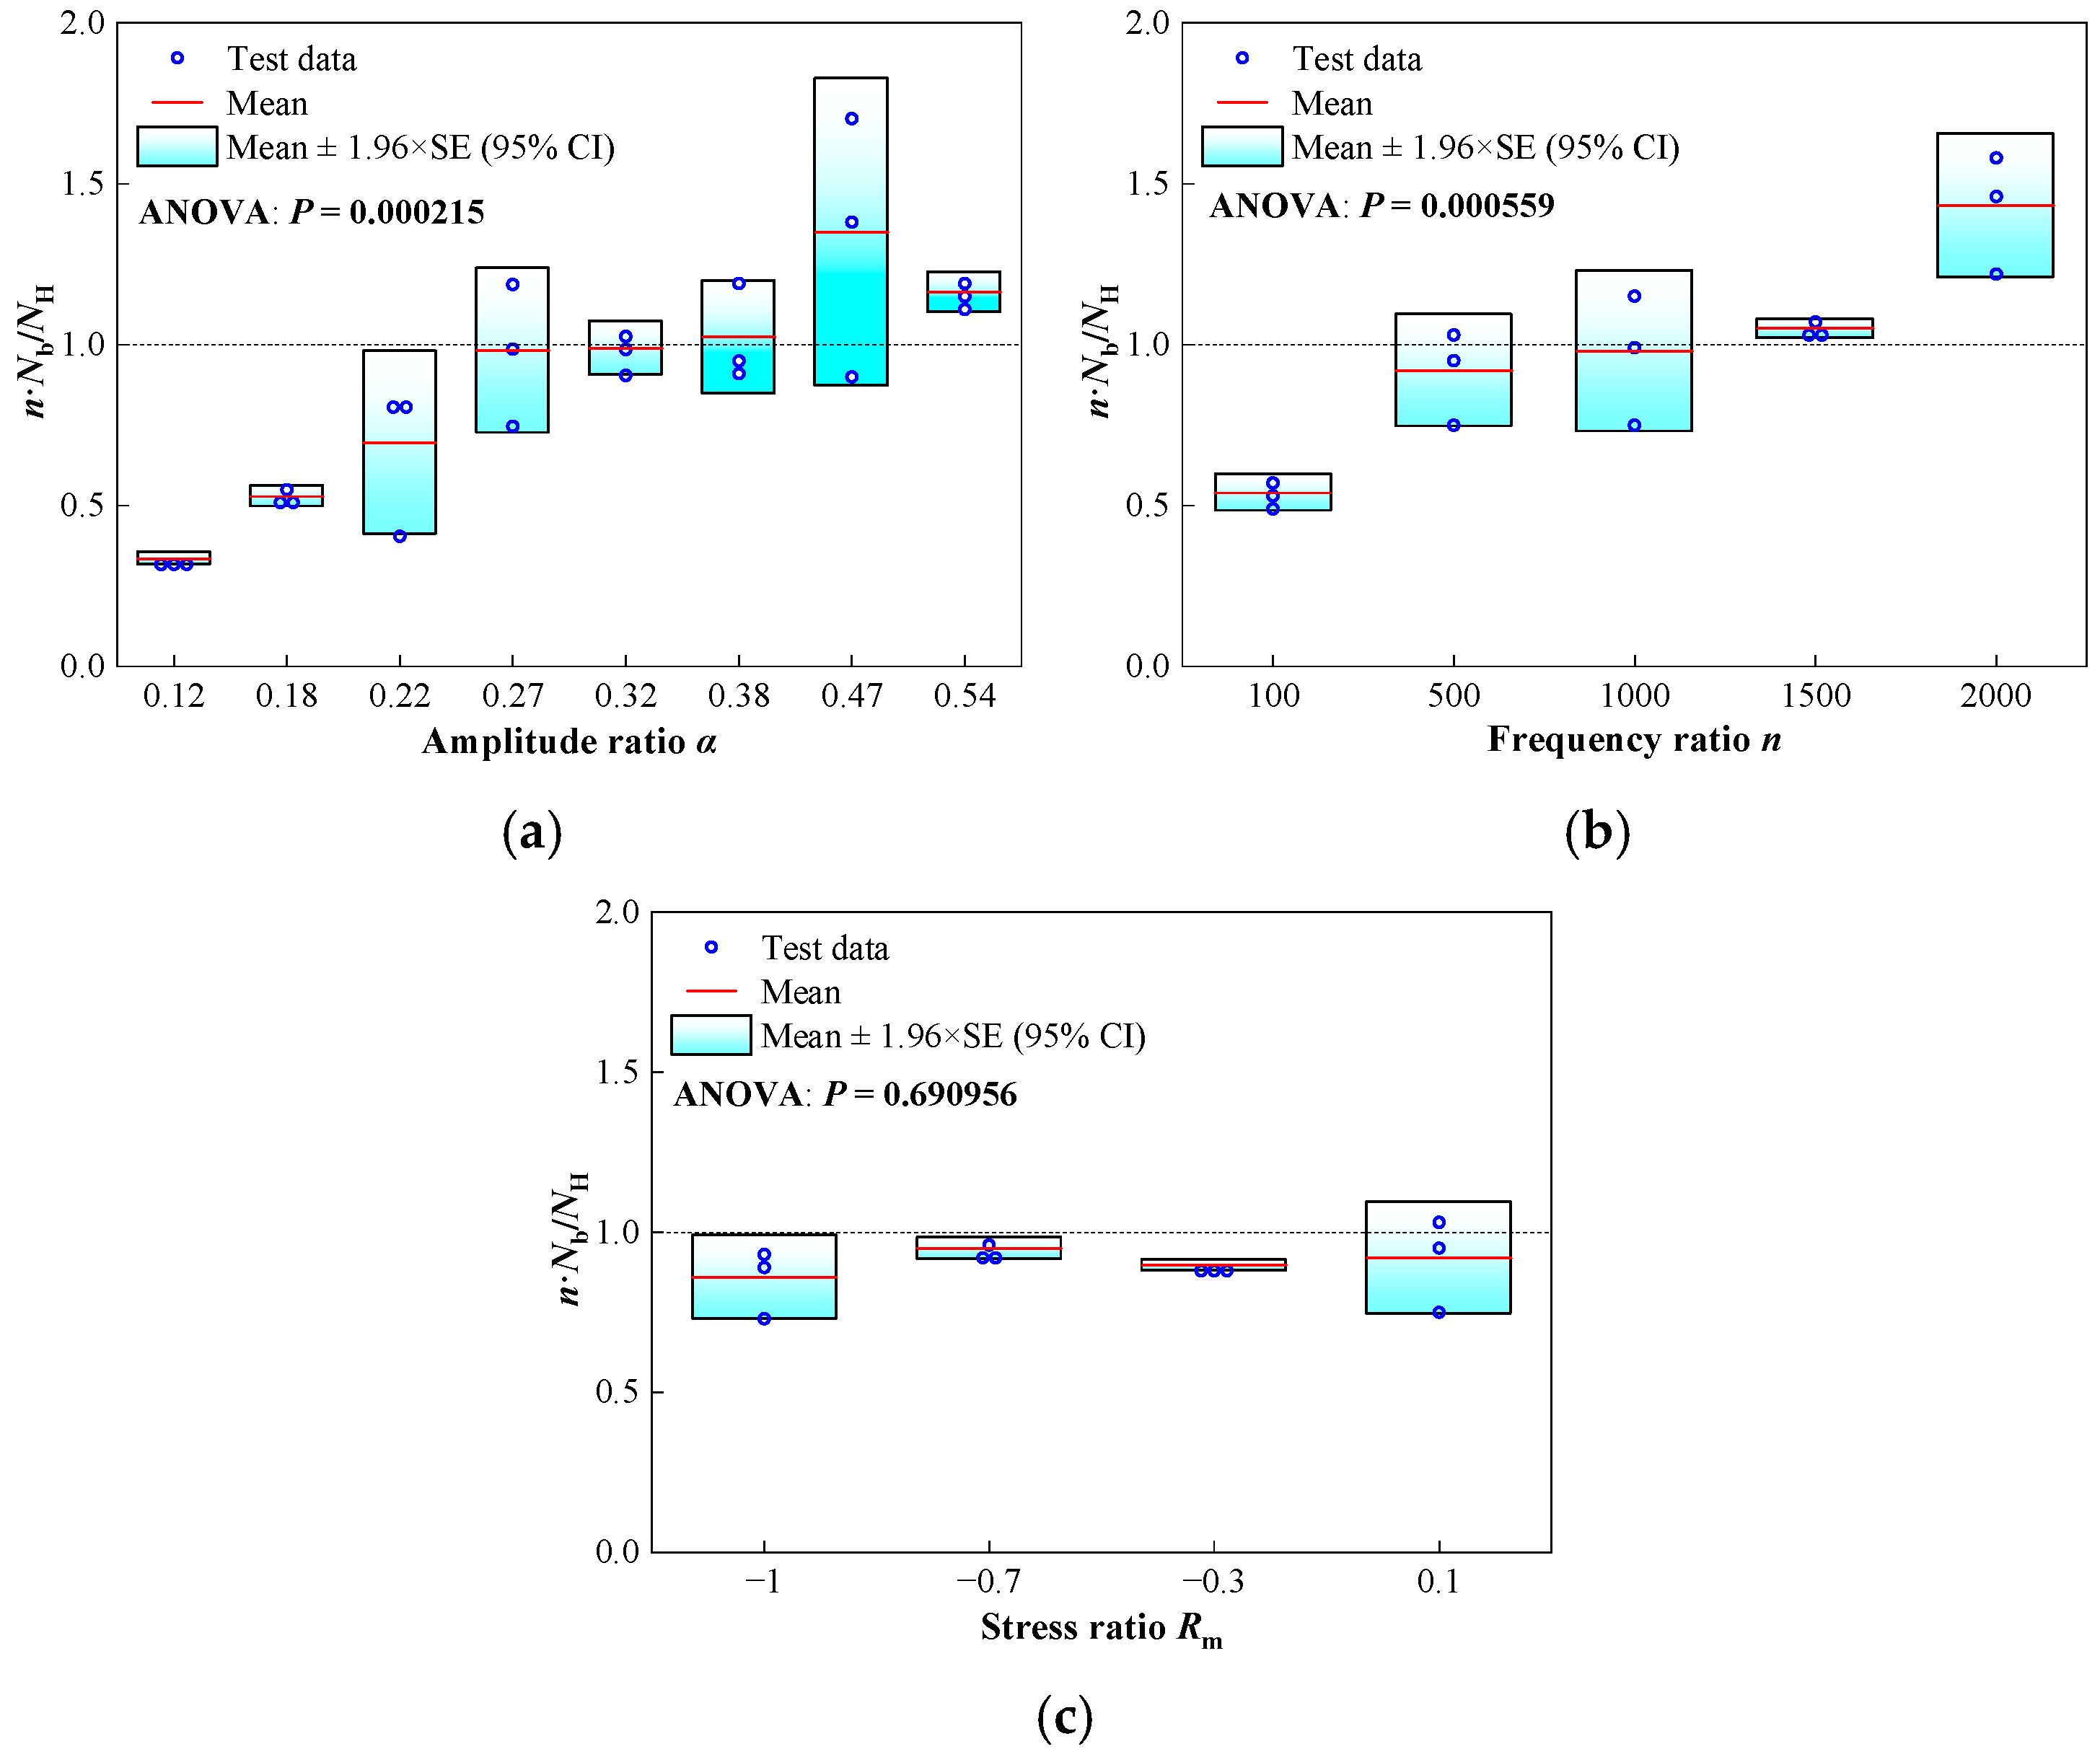
Based on the results presented in Table 3, the effects of different amplitude ratios, frequency ratios, and mean stresses on the fatigue life of specimens were further analyzed. The focus is on the ratio of total high-frequency cycles n·Nb to constant amplitude life NH. When the ratio is less than 1, it indicates that HLSF accelerates fatigue damage and reduces the high-frequency fatigue life. Conversely, when the ratio exceeds 1, it suggests that HLSF inhibits fatigue damage and enhances the high-frequency fatigue life. As shown in Figure 5a, under constant n = 1000 and Rm = 0.1, the ratio of n·Nb to NH increases with increasing amplitude ratio α. As shown in Figure 5b, under constant α = 0.27 and Rm = 0.1, the ratio of total cycles n·Nb to NH increases with the increase in frequency ratio n. When n reaches 2000, HLSF mainly suppresses fatigue damage. According to the results of the analysis of variance (ANOVA), both the amplitude ratio and frequency ratio have a significant impact on HLSF life, with p-values for both being less than 0.05. The influence of mean stress was investigated by varying the stress ratio, as depicted in Figure 5c. The ANOVA results indicate minimal fluctuation in the ratio of total cycles to NH with increasing stress ratio, suggesting that the coupling effect between loads is not significantly affected by changes in mean stress. The experimental results presented above further extend the conclusions derived from high-low frequency superimposed loading tests, wherein high-frequency loading becomes dominant under larger frequency ratios. These findings align with those reported by Gan et al. [2] for T-type welded joints and Zhao et al. [27,28] for the aerospace material TC11. When integrated with the low-frequency dominated results of high-low frequency superimposed tests conducted by these researchers, the following conclusions can be drawn: compared to high-frequency constant amplitude conditions, smaller frequency ratios n and amplitude ratios α tend to accelerate fatigue damage under HLSF, whereas larger values of n and α tend to delay fatigue damage.

2.3. Fracture Characteristics

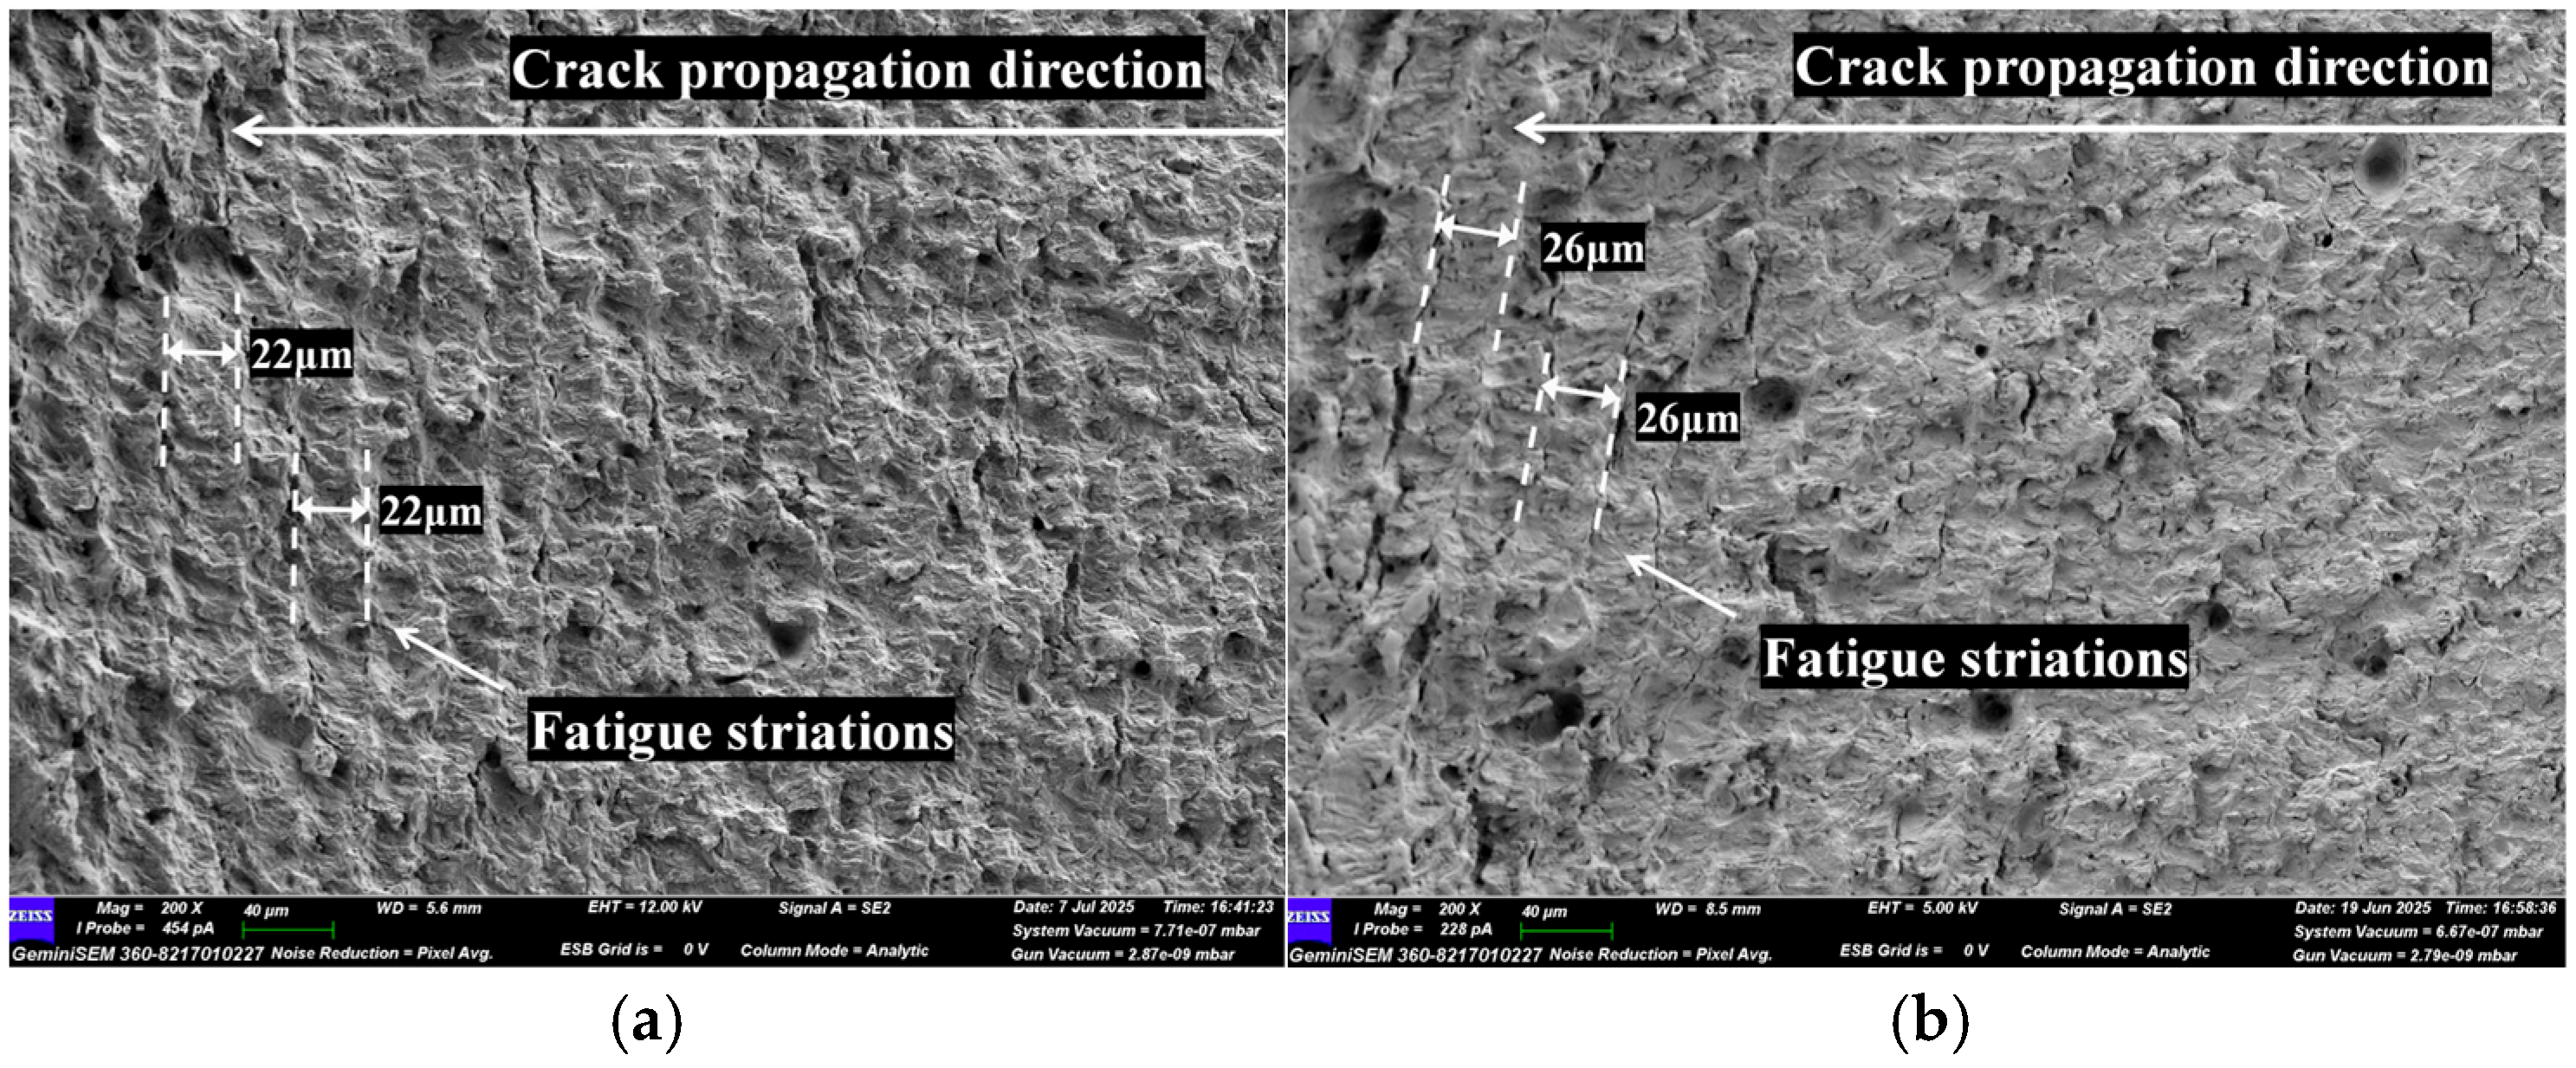
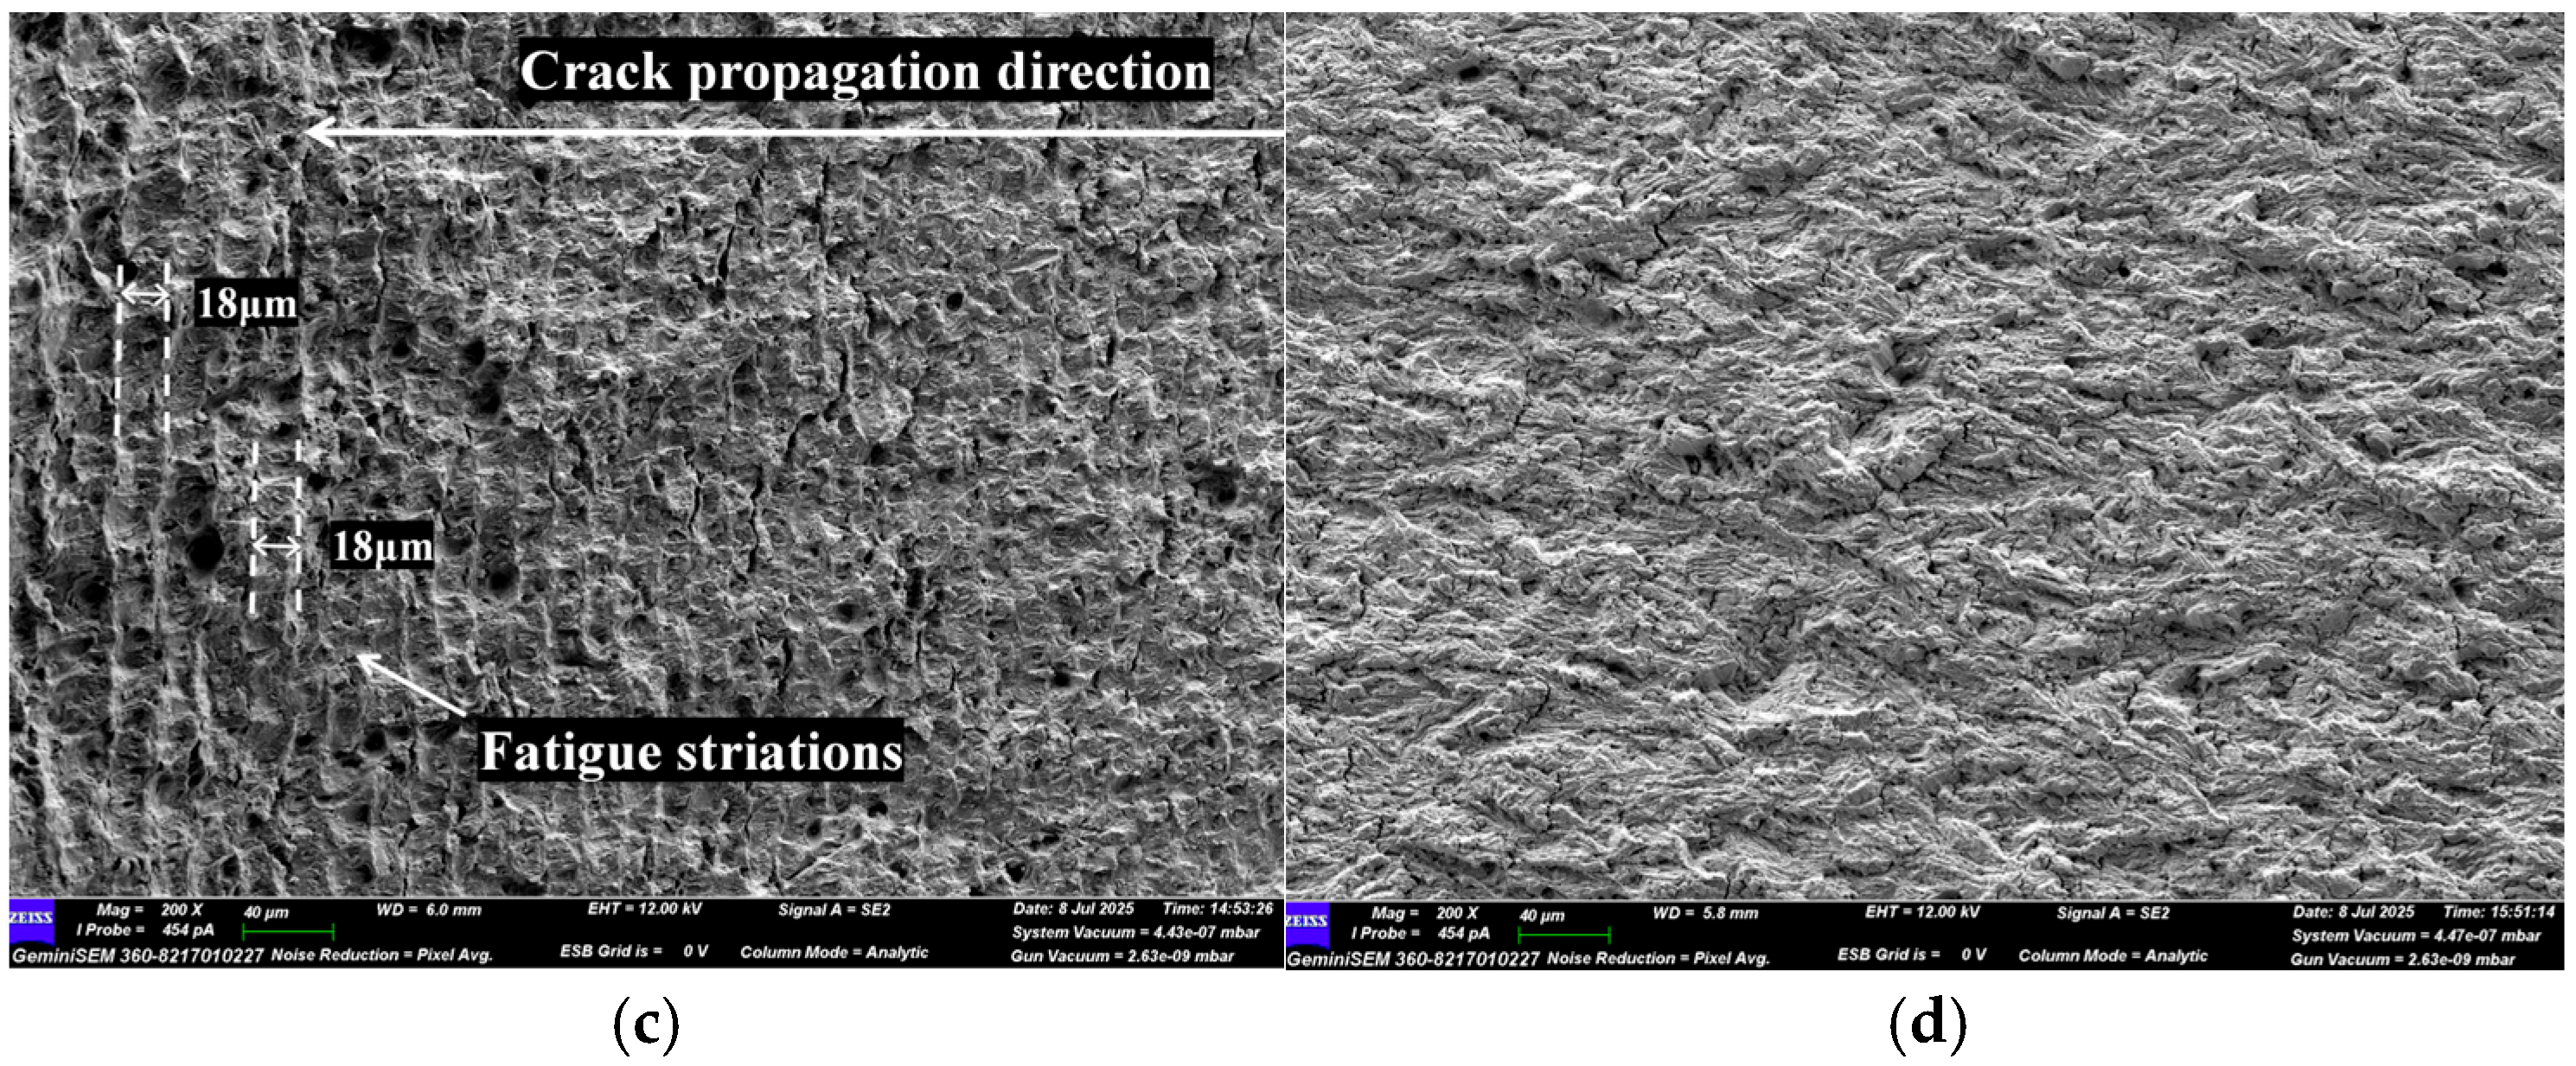
The fracture surfaces of the specimens were examined using a Gemini SEM360 field emission scanning electron microscope (Oberkochen, Germany), to analyze the differences in damage mechanisms under different HLSF test conditions. Near the critical crack depth, distinct crack propagation striation bands with low-frequency periodicity were observed in most of the superimposed fatigue test fractures (Figure 6a–c). The width of these bands increased with both the frequency ratio and the amplitude ratio. However, under the low mean stress condition (σm = 0), such prominent bands were not observed (Figure 6d), which may be attributed to the reduced effective amplitude for fatigue crack propagation under this condition. Another reason could be the plastic extrusion of the crack propagation surface under tension-compression cycles, as the contact pressure may lead to wear [42]. Mean stress, to some extent, acts as a parameter characterizing the low-frequency envelope waveform and influences the overall crack damage process. Under high mean stress, more pronounced microstructural plastic bulging on the crack propagation surface was observed compared to that under low mean stress (Figure 6a,d).

3. Fatigue Life Analysis and Discussion

3.1. Existing Life Prediction Models

A review of existing studies indicates that HLSF life prediction models can be broadly categorized into three types: linear cumulative damage model (Miner’s rule), nonlinear cumulative damage models, and empirical models. This study selects several representative models for analysis and comparison in terms of their accuracy in predicting fatigue life.
  • Miner’s rule
The Miner’s rule [22] is the most widely used for variable amplitude fatigue life prediction. Under the framework of this rule, the fatigue damage of HLSF blocks accumulates independently and linearly. In the case of a superimposed loading spectrum, both high-frequency and low-frequency stress amplitudes remain constant. Consequently, the fatigue damage induced by a single load block can be calculated using Miner’s rule, as presented in Equation (5). The number of load cycles Nb is defined as the reciprocal of the damage caused by a single load block, which is mathematically expressed in Equation (6).
D b = 1 N L + n N H
N b = 1 D b
where Nb represents the number of block cycles, NL represents the life cycles under constant low-frequency loading with a stress amplitude of σL, NH represents the life cycles under high-frequency loading with a stress amplitude of σH, and Db represents the fatigue damage induced by a single block.
2.
T-K model
The T-K model, which is proposed by Trufyakov and Kovalchuk [27] based on extensive experimental data, is an empirical model for HLSF that correlates fatigue life with load amplitude, frequency ratio, and other parameters. Its expression is as follows:
N b = N L 1 n ν σ H σ L
where ν is a material constant that typically ranges from 1.3 to 1.7. For low-alloy high-strength steel, a commonly used value of ν is about 1.3.
3.
Yue model
The Yue model [33] is a modified nonlinear cumulative damage model that draws on the damage equivalence principle of two-step loading. The damage model is expressed as shown in Equation (8), wherein an equivalent stress amplitude ratio, defined as αeq = 2σH/(σm + σH) is incorporated to account for the effects of load interactions.
D b = 1 n n N L N L N H 0.4 α eq + n N H
Based on the HLSF tests conducted in this study, the prediction accuracy of each model for fatigue life under various conditions is evaluated using the life prediction error, denoted as Perror. The formula for calculating Perror is as follows [43]:
P error = log 10 N fp log 10 N f t

3.2. Modeling of HLSF Block Nonlinear Damage Effects

The results of fracture analysis indicate that under superimposed loading conditions, fatigue cracks predominantly undergo a damage evolution process governed by low-frequency cyclic periods. The amplitude ratio, frequency ratio, and mean stress each contribute to crack propagation through distinct mechanisms. Consequently, it is feasible to develop a nonlinear damage accumulation model based on spectral block analysis. Firstly, modify the formulation of Miner’s rule (Equation (5)) to integrate the waveform characteristic parameters of HLSF:
D b = D L 1 + α m n
where DL = 1/NL represents the damage caused by the low-frequency fatigue loading, which is a function of the mean stress σm, m is the slope of the S-N curve.
In terms of cyclic damage, the term (1 + αmn) in the aforementioned equation can be interpreted as an acceleration factor that amplifies the superimposed fatigue cycle damage Db relative to the per-cycle damage DL induced by low-frequency fatigue loading. However, under Miner’s rule, this acceleration factor is assumed to be linear and thus unable to account for the potential coupling effects among the various parameters of the superimposed waveform. To address this limitation, a nonlinear exponent q is incorporated into the model, leading to the development of the Block Nonlinear Damage Model (BNDM), which is expressed as follows:
D b = D L 1 + α m n q
Unlike the T-K model and Yue model, the BNDM provides a certain physical interpretability for the coupling effect between low-frequency and high-frequency loads, and its formulation does not favor a particular frequency component.
Differing from the T-K model and Yue model, the BNDM provides a certain physical interpretability for the coupling effect between low-frequency and high-frequency loads, and its formulation is not biased towards particular frequency. The introduced parameter q represents the nonlinear damage effect under superimposed fatigue loading conditions. A higher value of q corresponds to a more pronounced nonlinear behavior, whereas values approaching 1 indicate that the fatigue damage accumulation tends toward linear characteristics. The DL configuration is selected as the reference case instead of DH, mainly due to the fact that, under identical low-frequency envelope waveforms, the fatigue crack propagation length is governed by the maximum stress σmax of the stress history, as confirmed by fracture surface analysis. For a given specimen, the nonlinear damage exponent q should be considered as a function of the amplitude ratio α, frequency ratio n, and master stress ratio Rm (or mean stress σm). As formulated in Equation (12), the nonlinear component of q is defined as the product of three individual functions—q1(α), q2(n), and q3(Rm)—which were derived through regression analysis of experimental data (as illustrated in Figure 7), leading to the expressions provided in Equations (13)–(15). Experimental findings demonstrate that q exhibits high sensitivity to variations in both amplitude ratio α and frequency ratio n, particularly under lower values of these parameters. In the fitting process, the nonlinear components of the exponents q1(α) and q2(n) consider only the values greater than 1, which correspond to a potentially underestimated fatigue damage according to the Miner’s rule. When the value of exponent q is less than 1, such as when n > 1500, this indicates an improvement in fatigue performance. Due to the inherent variability in fatigue test results and the limited range of loading conditions, the lower values are conservatively modeled using a linear approach. Regarding the mean stress effect, when the Walker formula is employed to account for this effect separately in NH, it does not lead to significant variations in the exponent (as illustrated in Figure 7c), and thus q3(Rm) is set to 1. However, if the mean stress effect is not explicitly considered in NH, such as when NH and NL represent fatigue lives under the same stress ratio, the exponent increases with increasing mean stress. Equations (13)–(15) are applicable to the first correction method of mean stress effect.
q = q 1 α q 2 n q 3 R m
q 1 α = 0.4 α 0.7 , α < 0.27 1 , α 0.27
q 2 n = 0.0004566 n + 1.228 , n < 500 1 , n 500
q 3 R m = 1

3.3. Life Analysis and Comparison

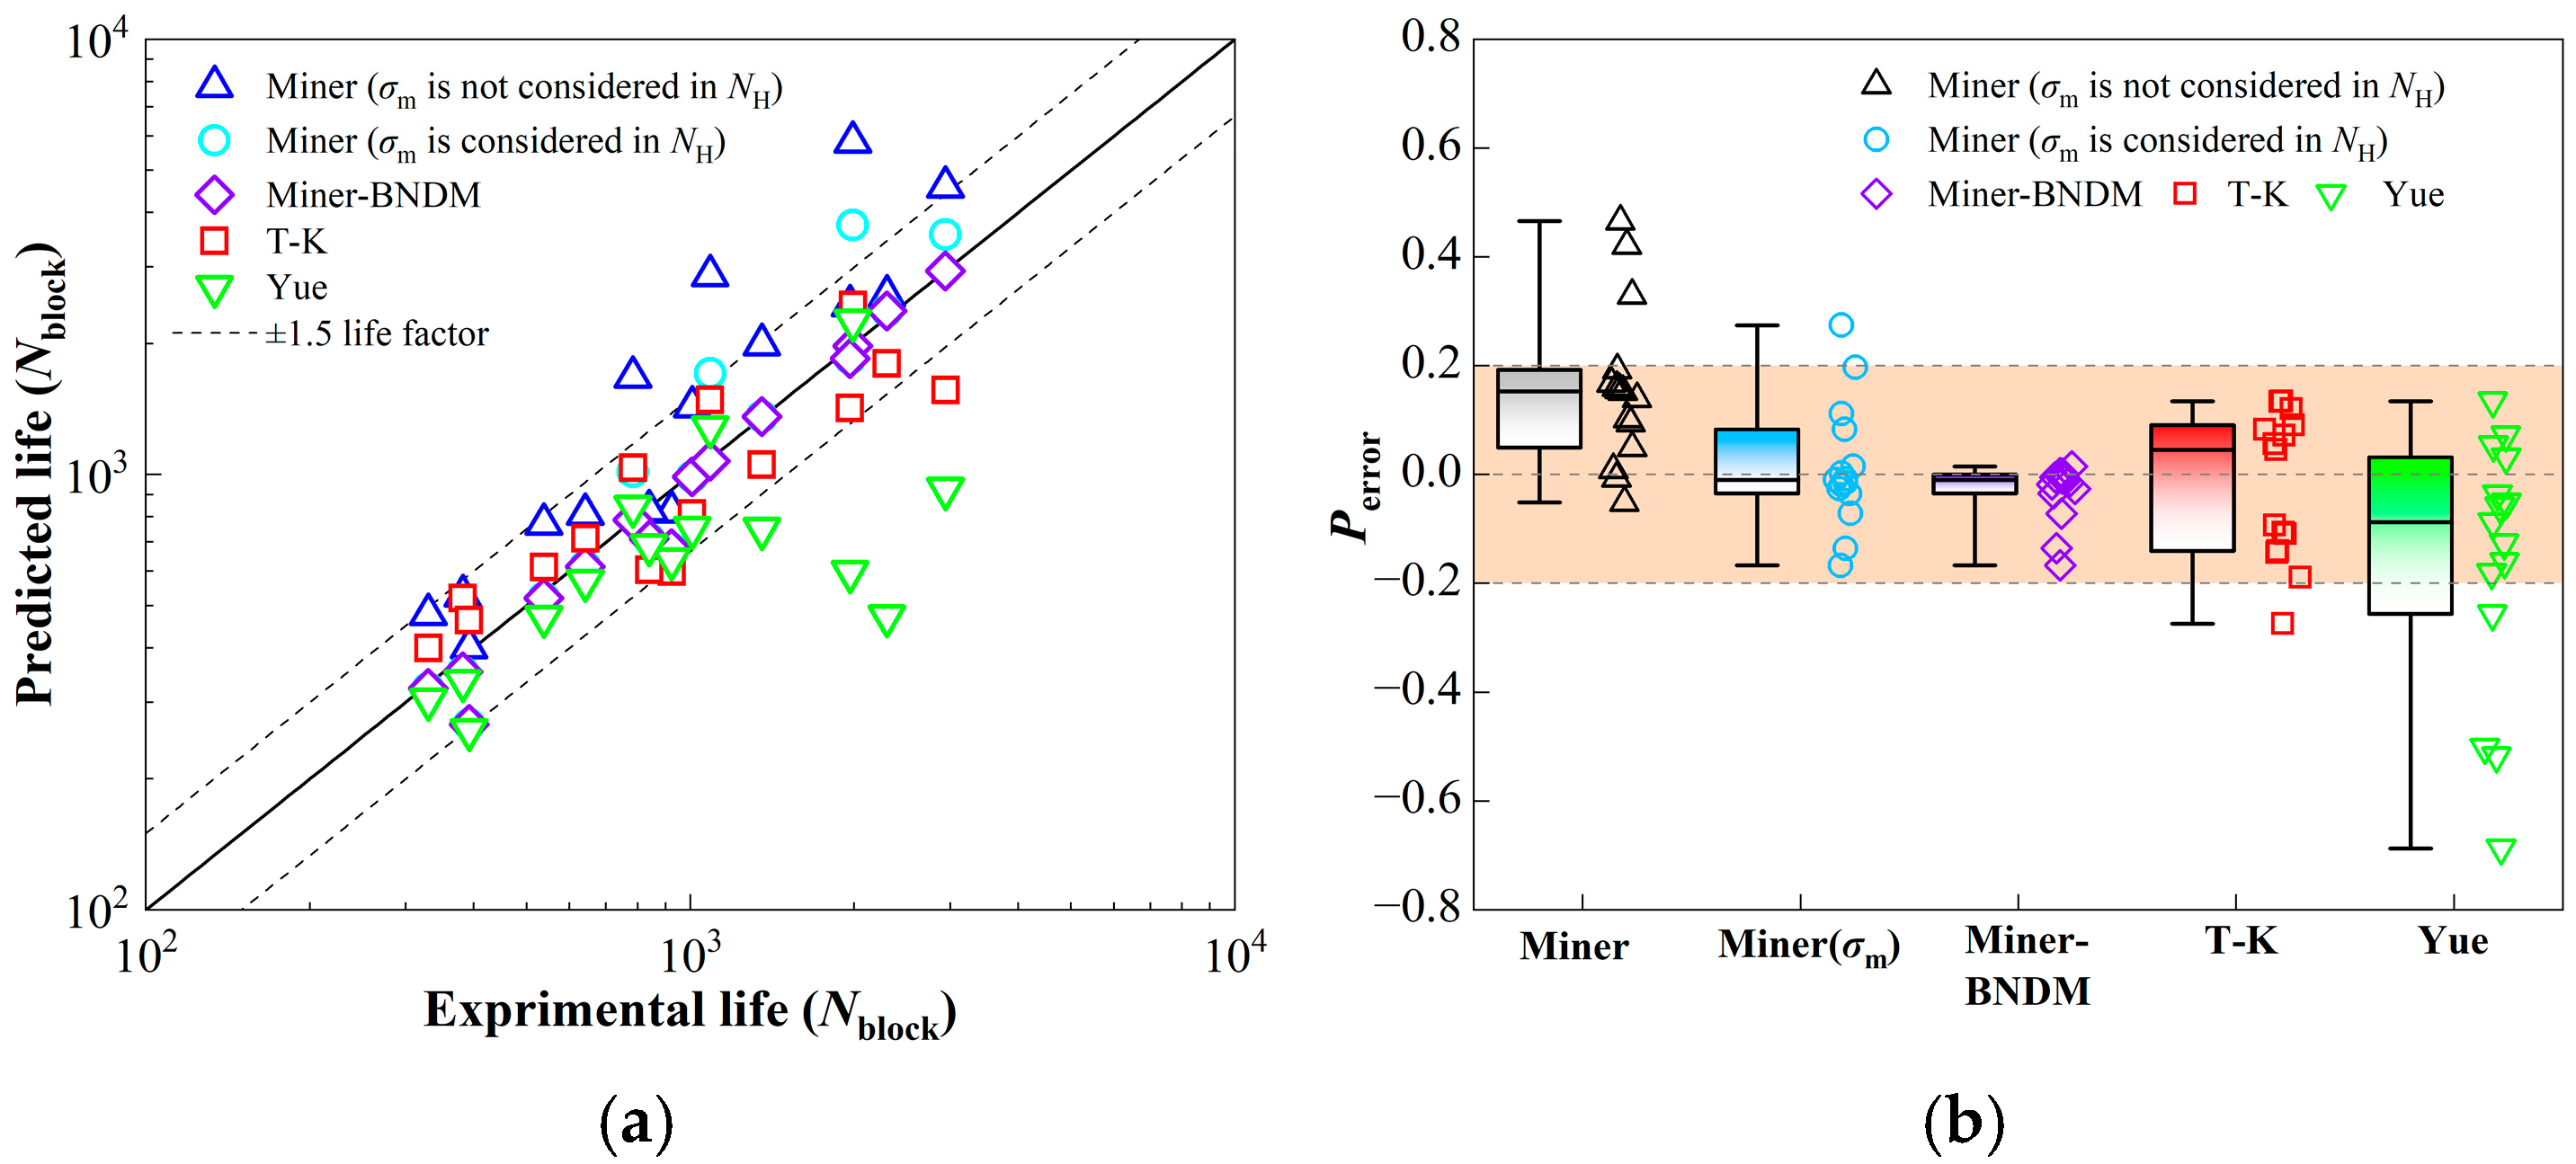
Fatigue life analysis and comparison are performed using the Miner’s rule, the T-K model, and the Yue model. The Miner’s rule includes two conditions: one where NH does not account for the mean stress correction, assuming the life is extrapolated from the S-N curve corresponding to the stress ratio of NL; and another where NH incorporates the mean stress correction, i.e., the case where NL and NH share the same mean stress σm. Additionally, the effectiveness of using the proposed BNDM to improve Miner’s rule will also be demonstrated, and this integrated method will be referred to as the Miner-BNDM method. A comparison of predicted and experimental lifetimes is shown in Figure 8a. When the predicted lifetime Nb equals the experimental lifetime, the data points lie on the 45° reference line. If the predicted lifetime is above this line, it indicates that the predicted life exceeds the experimental life, and the prediction is considered optimistic. Otherwise, the prediction is deemed conservative. Based on this comparison of lifetimes, a more detailed error analysis is presented in Figure 8b. When Miner’s rule does not incorporate mean stress correction, most predicted lifetimes tend to be overly optimistic. However, with the application of mean stress correction, the majority of predicted lifetimes fall within a ±20% error margin. The proposed Miner-BNDM method, which integrates mean stress correction, further improves predictive accuracy for non-conservative cases—such as those characterized by low amplitude and frequency ratios—by ensuring that the predicted lifetimes predominantly lie below the zero-error line. Regarding prediction scatter, neither the T-K model nor the Yue model demonstrates superior performance compared to Miner’s rule with mean stress correction. Notably, the predictions of Yue model tend to be overly conservative, particularly in scenarios involving low-frequency ratios n and low principal stress ratios Rm.
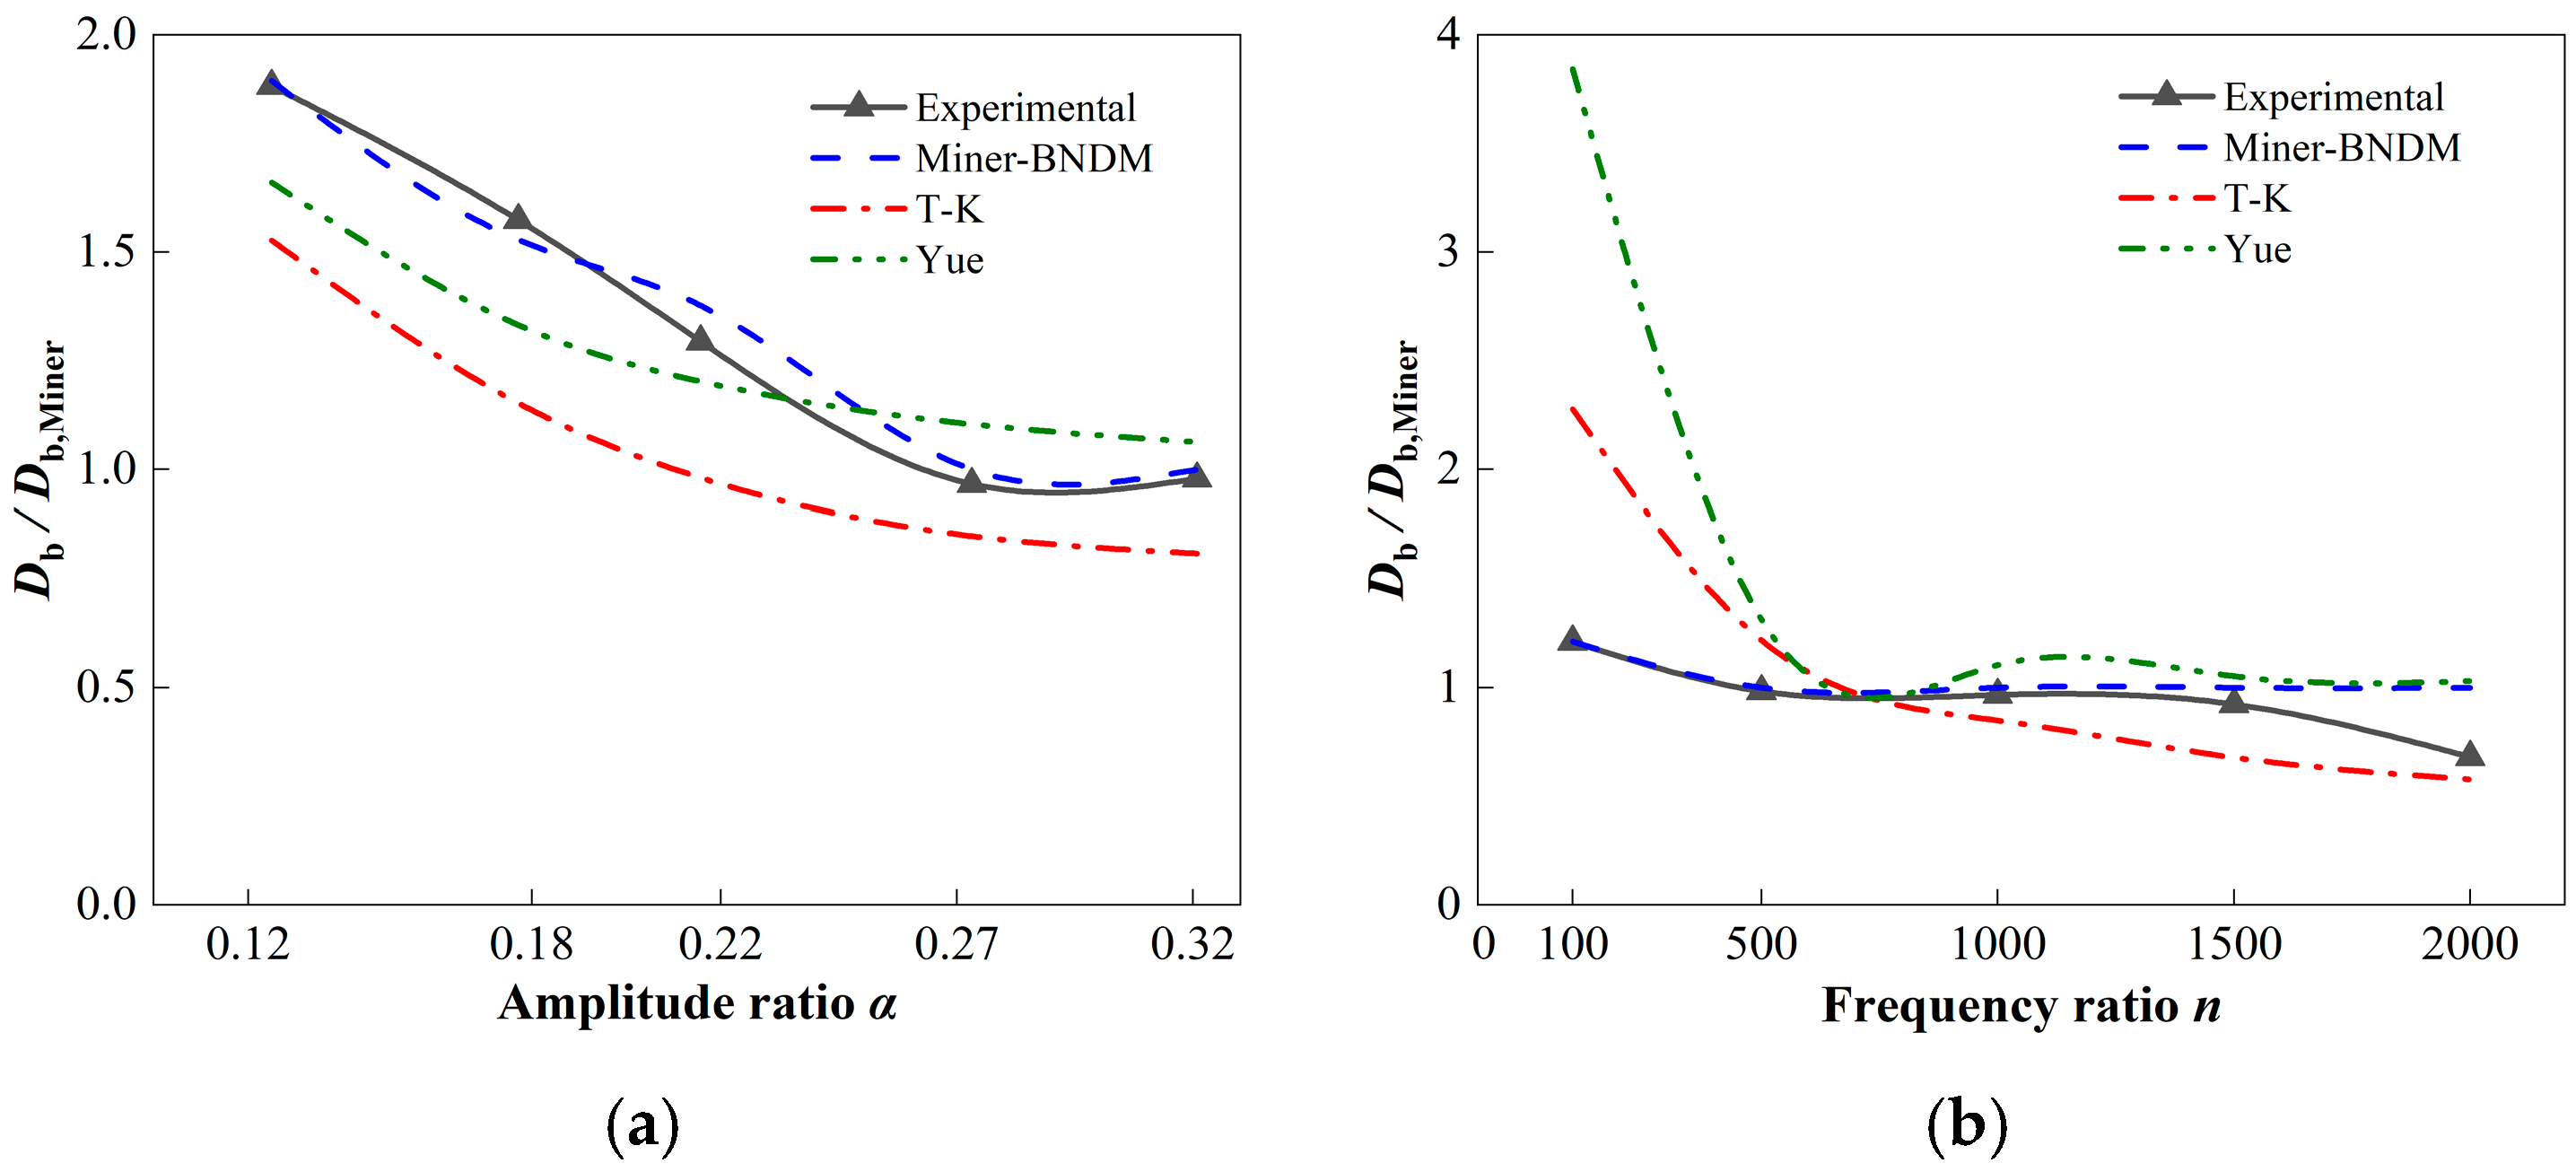
Figure 9 presents the ratio of the experimental and predicted fatigue damage Db of each model with the Miner’s rule considering mean stress effects. Deviations of this ratio from unity reflect the nonlinear fatigue damage effects observed in the HLSF tests and indicate the applicability and accuracy of each model. As shown in the figure, the condition where Db/Db,Miner > 1 primarily occurs under low-amplitude ratios (α < 0.27) and low-frequency ratios (n < 500), which corresponds to accelerated fatigue damage accumulation as illustrated in Figure 5a–c. In contrast, the condition where Db/Db,Miner < 1 mainly occurs at high-frequency ratios (n > 1500), indicating a deceleration in fatigue damage accumulation (see Figure 5c). Among the existing models, the T-K model and the Yue model demonstrate certain biases in estimating the nonlinear effects of amplitude ratio and frequency ratio. Specifically, they tend to underestimate the impact of amplitude ratio while overestimating the influence of frequency ratio. For the T-K model, although this may result in seemingly reasonable overall fatigue life predictions (Figure 8), the optimistic and pessimistic expectations it brings are contrary to the Miner’s rule. Overall, the BNDM method offers an effective solution for addressing the nonlinear effects of HLSF damage.

3.4. Discussion

It can be seen that the Miner’s rule tends to yield overly optimistic predictions in cases with low-amplitude ratios and low-frequency ratios. While the fatigue design goals for steel bridges under low-frequency ratios (which correspond to lower heavy vehicle traffic) are relatively easy to achieve, it is important not to be overly optimistic. Specifications should account for design redundancy resulting from variations in traffic volume. For low-amplitude ratios, this corresponds to higher temperature load effects and lower vehicle load effects, which in the context of this study, represent a more unfavorable scenario. This can even lead to the failure of the original infinite life design strategy. Because in most cases, the stress amplitudes induced by high-frequency vehicle loads are lower than the constant amplitude fatigue limit. For the C-1 loading condition, its high-frequency amplitude 27.87 MPa modified by σm is already below the constant amplitude fatigue limit of 29.23 MPa. The ratio of total fatigue life from the experiment to the predicted fatigue life using Miner’s rule is n·Nb:NH,Miner = 1,988,000 cycle:5,922,147 cycle. This difference in fatigue assessment is significant and requires attention.
The existing models do not appear to be optimal for the material and waveform parameters used in this study. This limitation may be attributed to the validation scenarios employed during their development. For example, the T-K model is primarily derived from tests involving low-frequency-ratio superimposed waveforms, whereas the Yue model is based on experimental data characterized by high mean stress and high-frequency ratios. As an enhancement of Miner’s rule, the Miner-BNDM model is a semi-empirical approach that retains the fundamental structure of the linear damage criterion while integrating insights from both experimental observations and mechanistic analysis. However, further refinement of this model necessitates additional research, including the investigation of variations in the exponent q across different types of bridge steels, notch geometries, and welding conditions, as well as the establishment of generalized correlations.
However, from the perspective of this study, the mean stress effect in HLFSL can be independently adjusted, regardless of the stress amplitude, which simplifies the evaluation process. If possible, it is recommended to use S-N curves under consistent mean stress conditions for both high- and low-frequency components. Alternatively, using the S-N curve corresponding to the higher stress ratio between the two frequency components can provide a more conservative evaluation.

4. Conclusions

This study conducted a series of high- and low-frequency superimposed loading fatigue tests on Q355D notched specimens, exploring the effects of HLSF stress waveform parameters such as amplitude ratio, frequency ratio, and average stress on the life and damage mechanism of the specimens. The rationality and correction strategies of existing life prediction models were discussed. The following conclusions have been drawn:
  • When other factors are held constant, the total number of high-frequency cycles is positively related to the amplitude ratio and the frequency ratio. Lower frequency ratios and lower amplitude ratios tend to accelerate fatigue damage, whereas higher frequency ratios and greater amplitude ratios contribute to the reduction of fatigue damage. When the amplitude ratio reaches 0.12 and the frequency ratio reaches 100, there is a reduction of at least 66% and 46% in HLSF high-frequency load cycles compared to constant amplitude loading.
  • Under HLSF test conditions, the fracture surface exhibit striation band crack propagation characteristics in units of low-frequency block cycles. The higher the amplitude ratio and frequency ratio, the more pronounced the band width becomes. Additionally, the plastic protrusion observed on the crack propagation surface increases with rising mean stress.
  • For fatigue life prediction of Q355D, the mean stress effect can be effectively accounted for by Walker’s formula without the other adverse effects on the number of high-frequency cycles. The T-K model underestimates the impact of low-amplitude ratios, while the Yue model overestimates the impact of low-frequency ratios and high mean stresses. The Miner’s rule tends to underestimate the impact of loading conditions with low-amplitude ratios and low-frequency ratios.
  • A proposed model BNDM is developed to modify the block nonlinear damage by introducing an exponential acceleration damage factor referenced to low-frequency cyclic damage. The application of this model achieved a reduction in the average prediction error of Miner’s rule for fatigue life from 19.9% to 7.5%, thus enabling a more accurate prediction of HLSF fatigue life.

Author Contributions

Conceptualization, X.Z.; methodology, X.Z.; software, J.Z.; validation, J.Z.; formal analysis, H.Z.; investigation, J.Z.; resources, X.Z.; data curation, X.Z.; writing—original draft preparation, X.Z. and J.Z.; writing—review and editing, X.Z. and H.Z.; visualization, J.Z.; supervision, H.Z.; project administration, H.Z.; funding acquisition, H.Z. and X.Z. All authors have read and agreed to the published version of the manuscript.

Funding

This research was funded by the National Natural Science Foundation of China (Grant Nos. 52208217 and U23A20659).

Data Availability Statement

The original contributions presented in the study are included in the article. Further inquiries can be directed to the corresponding author.

Acknowledgments

The authors gratefully acknowledge the financial support from the National Natural Science Foundation of China (NSFC). Special thanks are extended to Liao Wenqi and Kong Fanshu for their valuable assistance with data processing in this experimental study.

Conflicts of Interest

The authors declare no conflicts of interest.

Abbreviations

HLSFhigh-low frequency superimposed loading fatigue
αamplitude ratio
nfrequency ratio
σmmean stress
σastress amplitude
Rmmaster stress ratio
Eelastic modulus
νPoisson’s ratio
σyyield strength
σuultimate tensile strength
σLlow-frequency stress amplitude
σHhigh-frequency stress amplitude
fLlow-frequency stress amplitude frequency
fHhigh-frequency stress amplitude frequency
σmaxmaximum stress
σminminimum stress
Nbfatigue life (the number of cycle blocks)
Dbdamage caused by one block
NLconstant amplitude fatigue life (low frequency)
NHconstant amplitude fatigue life (high frequency)
γstress sensitivity coefficient in Walker′s formula
Aelongation after fracture
KROstrength coefficient in Ramberg-Osgood model
nROstrain hardening exponent in Ramberg-Osgood model

References

  1. Hu, D.Y.; Meng, F.C.; Liu, H.W.; Song, J.; Wang, R.Q. Experimental investigation of fatigue crack growth behavior of GH2036 under combined high and low cycle fatigue. Int. J. Fatigue 2016, 85, 1–10. [Google Scholar] [CrossRef]
  2. Gan, J.; Liu, X.; Wang, Z.; Wu, W.G. Experimental study on the fatigue damage of designed T-type specimen with high-low frequency superimposed loading. Int. J. Fatigue 2021, 143, 105985. [Google Scholar] [CrossRef]
  3. Guo, T.; Li, A.Q.; Wang, H. Influence of ambient temperature on the fatigue damage of welded bridge decks. Int. J. Fatigue 2007, 30, 1092–1102. [Google Scholar] [CrossRef]
  4. Guo, T.; Li, A.Q.; Li, J.H. Fatigue Life Prediction of Welded Joints in Orthotropic Steel Decks Considering Temperature Effect and Increasing Traffic Flow. Struct. Health Monit. 2008, 7, 189–202. [Google Scholar]
  5. Liu, Y.; Zhang, H.P.; Liu, Y.M.; Deng, Y.; Jiang, N.; Lu, N.W. Fatigue reliability assessment for orthotropic steel deck details under traffic flow and temperature loading. Eng. Fail. Anal. 2017, 71, 179–194. [Google Scholar] [CrossRef]
  6. Di, J.; Ruan, X.Z.; Zhou, X.H.; Wang, J.; Peng, X. Fatigue assessment of orthotropic steel bridge decks based on strain monitoring data. Eng. Struct. 2021, 228, 111437. [Google Scholar] [CrossRef]
  7. Wang, C.S.; Zhang, P.J.; Wu, G.S.; Li, P.Y.; Wang, Y. Fatigue damage evaluation of steel bridges considering thermal effect. Struct. Infrastruct. Eng. 2022, 18, 1020–1033. [Google Scholar] [CrossRef]
  8. Huang, K.X.; Zhang, H.; Jiang, J.Q.; Zhang, Y.Y.; Zhou, Y.H.; Sun, L.F.; Zhang, Y.N. The optimal design of a piezoelectric energy harvester for smart pavements. Int. J. Mech. Sci. 2022, 232, 107609. [Google Scholar] [CrossRef]
  9. Xiang, T.; Huang, K.X.; Zhang, H.; Zhang, Y.Y.; Zhang, Y.N.; Zhou, Y.H. Detection of Moving Load on Pavement Using Piezoelectric Sensors. Sensors 2020, 20, 2366. [Google Scholar] [CrossRef] [PubMed]
  10. Zhang, H.; Shen, M.Z.; Zhang, Y.Y.; Chen, Y.S.; Lü, C.F. Identification of Static Loading Conditions Using Piezoelectric Sensor Arrays. J. Appl. Mech. 2018, 85, 011008. [Google Scholar] [CrossRef]
  11. CEN. Eurocode 3: Design of Steel Structures-Part 2: Steel Bridges; European Committee for Standardization: Brussels, Belgium, 2006. [Google Scholar]
  12. AASHTO. AASHTO LRFD Bridge Design Specifications, 9th ed.; American Association of State Highway and Transportation Officials, Inc.: Washington, DC, USA, 2020. [Google Scholar]
  13. Tao, T.Y.; Wang, H.; Zhu, Q.X.; Zou, Z.Q.; Li, J.; Wang, L.B. Long-term temperature field of steel-box girder of a long-span bridge: Measurement and simulation. Eng. Struct. 2021, 236, 111924. [Google Scholar] [CrossRef]
  14. Fan, L.; Yang, W.P.; Zhou, D.; Li, Z.Y. Temperature Distribution and Mechanical Response of Orthotropic Steel Bridge Deck During Paving of Gussasphalt Pavement. Int. J. Steel Struct. 2021, 21, 315–328. [Google Scholar] [CrossRef]
  15. Guo, F.Q.; Zhang, S.H.; Duan, S.Y.; Shen, Z.L.; Yu, Z.W.; Jiang, L.Z.; He, C. Temperature gradient zoning of steel beams without paving layers in China. Case Stud. Constr. Mater. 2023, 18, e02054. [Google Scholar] [CrossRef]
  16. Li, Z.X.; Chan, T.; Ko, J. Fatigue damage model for bridge under traffic loading: Application made to Tsing Ma Bridge. Theor. Appl. Fract. Mech. 2001, 35, 81–91. [Google Scholar] [CrossRef]
  17. Xia, Y.; Chen, B.; Zhou, X.Q.; Xu, Y.L. Field monitoring and numerical analysis of Tsing Ma Suspension Bridge temperature behavior. Struct. Control Health Monit. 2013, 20, 560–575. [Google Scholar] [CrossRef]
  18. Gou, H.Y.; Chen, Z.H. Thermal Field of Composite Girder-Ballastless Track System on Arch in Plateau and Regions with Large Diurnal Temperature Variation Based on Measured Data. J. China Railw. Soc. 2024, 46, 159–170. [Google Scholar]
  19. Ding, X.; Huang, D.W.; Guo, Z.X.; Yan, H.; Yan, X.J.; Wang, Y.Z.R.; Yin, F.; Luan, X. Experimental investigations on combined high and low cycle fatigue: Material-level specimen design and strain response characteristic. Chin. J. Aeronaut. 2025, 38, 103246. [Google Scholar] [CrossRef]
  20. Han, L.; Huang, D.W.; Yan, X.J.; Zhang, Y.S.; Gui, M.; Tao, M.; Zhang, X.Y.; Qi, M.J. Effects of aluminizing and combined strengthening on the fatigue property of K403 super alloy component under combined high and low cycle loading. Int. J. Fatigue 2019, 125, 491–504. [Google Scholar] [CrossRef]
  21. Miner, M.A. Cumulative damage in fatigue. J. Appl. Mech. 1945, 12, A159–A164. [Google Scholar] [CrossRef]
  22. Sonsino, C.M. Course of SN-curves especially in the high-cycle fatigue regime with regard to component design and safety. J. Fatigue 2006, 29, 2246–2258. [Google Scholar] [CrossRef]
  23. Schijve, J. Fatigue of structures and materials. Int. J. Fatigue 1994, 16, 21–32. [Google Scholar] [CrossRef]
  24. Gao, H.Y.; Huang, H.Z.; Zhu, S.P.; Li, Y.F.; Yuan, R. A Modified Nonlinear Damage Accumulation Model for Fatigue Life Prediction Considering Load Interaction Effects. Sci. World J. 2014, 100, 180–194. [Google Scholar] [CrossRef]
  25. Alcover, I.F.; Andersen, J.E.; Chryssanthopoulos, M.K. Performance Assessment and Prediction of Welded Joints in Orthotropic Decks Considering Hourly Monitoring Data. Struct. Eng. Int. 2013, 23, 436–442. [Google Scholar] [CrossRef]
  26. Trufyakov, V.I.; Koval’chuk, V.S. Determination of life under two-frequency loading (Report no.2. Proposed method). Strength Mater. 1982, 14, 1303–1308. [Google Scholar] [CrossRef]
  27. Zhao, Z.H.; Lu, K.N.; Wang, L.F.; Liu, L.L.; Chen, W. Prediction of combined cycle fatigue life of TC11 alloy based on modified nonlinear cumulative damage model. Chin. J. Aeronaut. 2021, 34, 73–84. [Google Scholar] [CrossRef]
  28. Zhu, S.P.; Yue, P.; Yu, Z.Y.; Wang, Q.Y. A Combined High and Low Cycle Fatigue Model for Life Prediction of Turbine Blades. Materials 2017, 10, 698. [Google Scholar] [CrossRef]
  29. Wang, X.W.; Hou, J.; Guo, H.; Wang, Y.S.; Sun, Y.J.; Teng, B. A Miner’s rule based fatigue life prediction model for combined high and low cycle fatigue considering loading interaction effect. Fatigue Fract. Eng. Mater. Struct. 2023, 46, 4525–4540. [Google Scholar] [CrossRef]
  30. Liu, P.S.; Wang, X.W.; Shen, Q.; Li, F.J.; Liu, M.; Sun, Y.J. On the consideration of loading interaction in combined high and low cycle fatigue life prediction. Fatigue Fract. Eng. Mater. Struct. 2023, 46, 2651–2661. [Google Scholar] [CrossRef]
  31. Ye, D.Y.; Wang, Z.L. A new approach to low-cycle fatigue damage based on exhaustion of static toughness and dissipation of cyclic plastic strain energy during fatigue. Int. J. Fatigue 2001, 23, 679–687. [Google Scholar] [CrossRef]
  32. Yue, P.; Ma, J.; Zhou, C.H.; Jiang, H.; Wriggers, P. A fatigue damage accumulation model for reliability analysis of engine components under combined cycle loadings. Fatigue Fract. Eng. Mater. Struct. 2020, 43, 1880–1892. [Google Scholar] [CrossRef]
  33. Hou, J.; Wang, X.W.; Guo, H.; Wang, Y.S.; Li, F.J.; Shen, Q. Combined high and low cycle fatigue life prediction model based on damage curve method considering loading interaction effect. Int. J. Damage Mech. 2023, 32, 185–203. [Google Scholar] [CrossRef]
  34. GB/T 1591-2018; High Strength Low Alloy Structural Steels. SAC: Beijing, China, 2018.
  35. GB/T 228.1-2021; Metallic Materials-Tensile Testing-Part 1: Method of Test at Room Temperature. SAC: Beijing, China, 2021.
  36. GB/T 714-2015; Structural Steel for Bridge. SAC: Beijing, China, 2015.
  37. Berto, F.; Ferro, P.; Salavati, H. Fatigue strength of sharp V-notched specimens made of ductile cast iron. Eng. Fail. Anal. 2017, 82, 308–314. [Google Scholar] [CrossRef]
  38. Fu, T.T.; Cebon, D. Predicting fatigue lives for bi-modal stress spectral densities. Int. J. Fatigue 2000, 22, 11–21. [Google Scholar] [CrossRef]
  39. Huang, W.B. The frequency domain estimate of fatigue damage of combined load effects based on the rain-flow counting. Mar. Struct. 2017, 52, 34–49. [Google Scholar] [CrossRef]
  40. Walker, E.K. The Effect of Stress Ratio During Crack Propagation and Fatigue for 2024-T3 and 7075-T6 Aluminum. In Effects of Environment and Complex Load History on Fatigue Life; ASTM Selected Technical Papers; ASTM International: West Conshohocken, PA, USA, 1970; Volume 462, pp. 1–14. [Google Scholar]
  41. Dowling, N.E.; Calhoun, C.A.; Arcari, A. Mean stress effects in stress-life fatigue and the Walker equation. Fatigue Fract. Eng. Mater. Struct. 2009, 32, 163–179. [Google Scholar] [CrossRef]
  42. Polasek, M.; Krbaa, M.; Eckert, M.; Mikus, P. Contact Fatigue Resistance of Gun Barrel Steels. Procedia Struct. Integr. 2023, 43, 306–311. [Google Scholar] [CrossRef]
  43. Wang, R.Q.; Li, D.; Hu, D.Y.; Meng, F.C.; Liu, H.; Ma, Q.H. A combined critical distance and highly-stressed-volume model to evaluate the statistical size effect of the stress concentrator on low cycle fatigue of TA19 plate. Int. J. Fatigue 2017, 95, 8–17. [Google Scholar] [CrossRef]
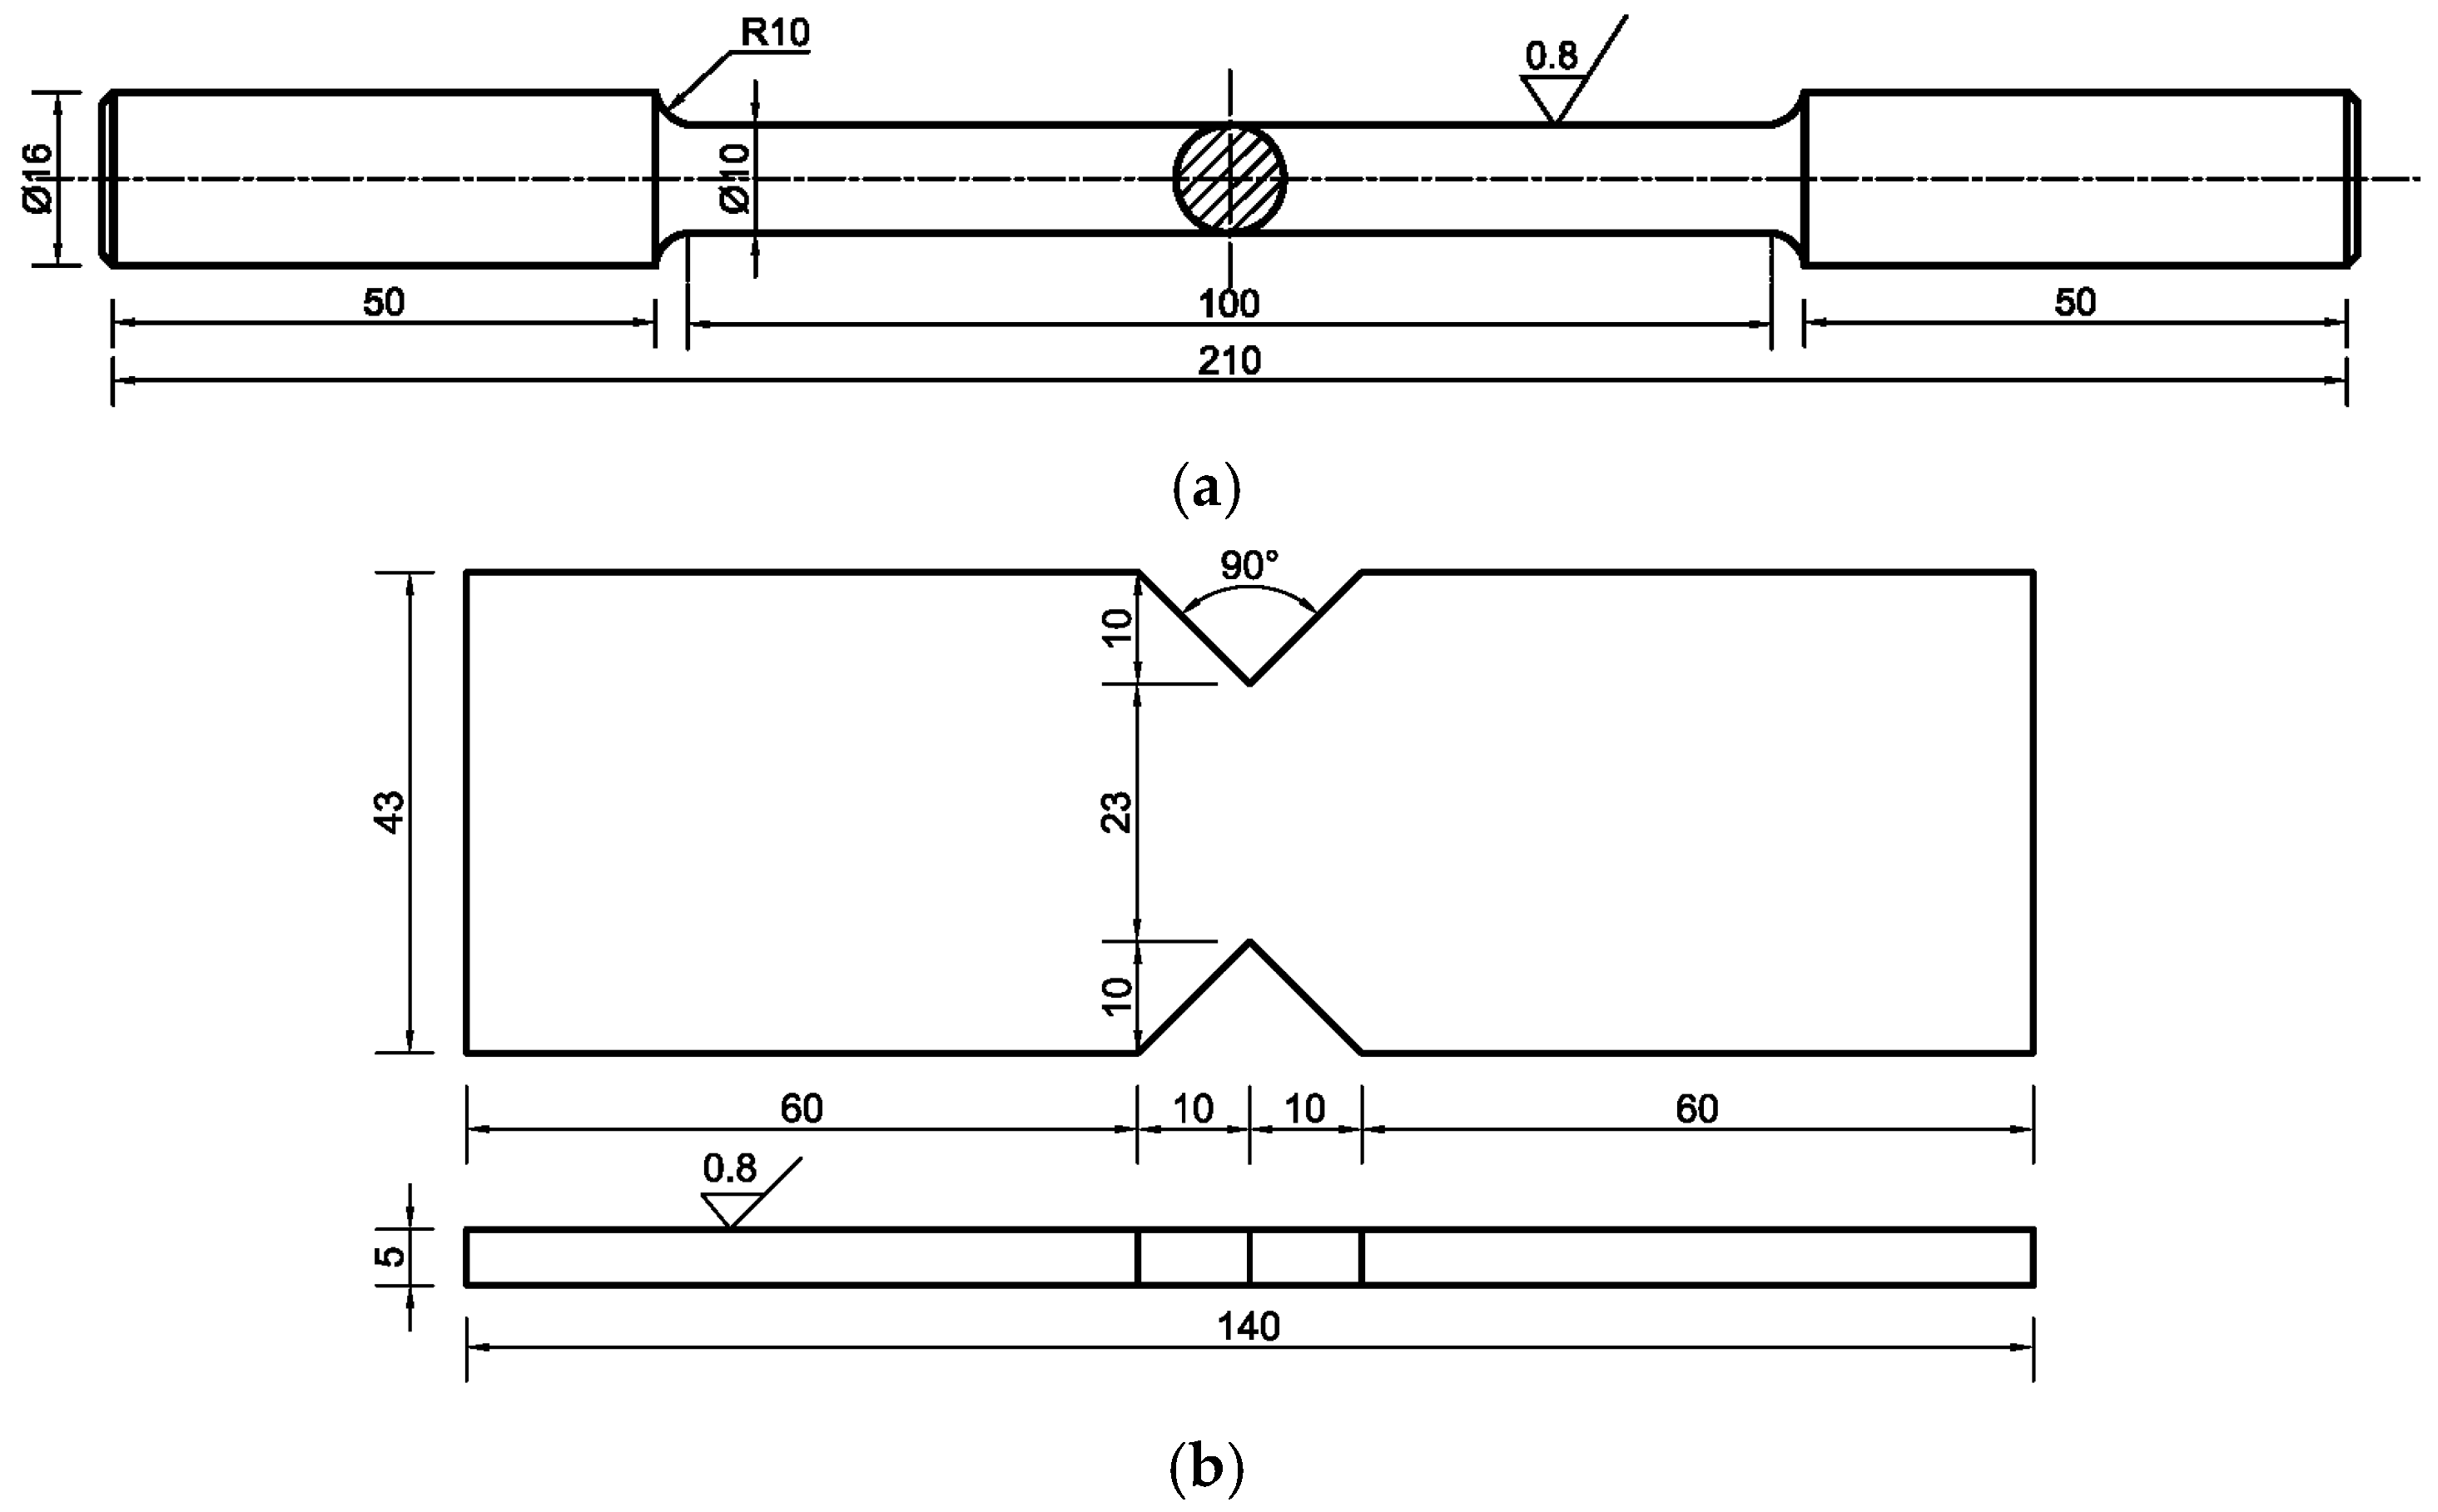
Figure 1. Sketch of specimens (units: size in mm, roughness in μm): (a) tensile specimen; (b) fatigue test specimen.
Metals 15 00975 g001
Figure 2. Schematic diagram of HLSF waveform parameters.
Metals 15 00975 g002
Figure 3. Test site and instrument layout. (a) fatigue test machine; (b) specimen detail.
Metals 15 00975 g003
Figure 4. S-N curves and sensitivity factor γ for Q355D V-notched specimens: (a) S-N curves under three stress ratios; (b) sensitivity factor γ and its fitting.
Metals 15 00975 g004
Figure 5. Analysis of the ratio of total cycles to high-frequency constant amplitude life: (a) n = 1000, Rm = 0.1; (b) α = 0.27, Rm = 0.1; (c) α = 0.27, n = 500.
Metals 15 00975 g005
Figure 6. Fracture morphology of different HLSF V-notched specimens at 200× magnification: (a) σL = 176.1 MPa, α = 0.27, Rm = 0.1, n = 500; (b) σL = 176.1 MPa, α = 0.27, Rm = 0.1, n = 1000; (c) σL = 176.1 MPa, α = 0.18, Rm = 0.1, n = 1000; (d) σL = 176.1 MPa, α = 0.27, Rm = −1, n = 500.
Metals 15 00975 g006aMetals 15 00975 g006b
Figure 7. Fitted curves of three nonlinear exponents: (a) q1 (α); (b) q2 (n); (c) q3 (Rm).
Metals 15 00975 g007
Figure 8. Comparison of the predicted Nb and error analysis between this model, Miner’s rule, Miner’s rule with mean stress correction, the T-K model, and the Yue model: (a) comparison of predicted Nb by each model; (b) boxplot of error analysis for each model.
Metals 15 00975 g008
Figure 9. Ratio of the experimental and predicted cycle block damage Db to Db,Miner: (a) σL = 176.1 MPa, n = 1000, Rm = 0.1; (b) σL = 176.1 MPa, α = 0.27, Rm = 0.1.
Metals 15 00975 g009
Table 1. Chemical composition (%) of Q355D steel used in this study.
SteelCSiMnCrNiNbCuAlsTiP
Q355D0.091.241.570.200.040.040.120.030.020.02
Table 2. Basic mechanical properties of Q355D steel used in this study.
Mechanical
Properties
E
(GPa)
ν
-
σy
(MPa)
σu
(MPa)
A
(%)
KRO
(MPa)
nRO
-
Q355D216.710.30440.33587.3932.33428.890.15
GB/T 714-2015 [36]--≥345≥490≥20--
Table 3. Summary of HLSF test conditions.
Test
Conditions
σL
(MPa)
σH
(MPa)
nασm
(MPa)
RmNbAverage
C-1176.121.110000.122150.11881, 2084, 19981988
C-2176.131.210000.182150.11048, 1058, 11541087
C-3176.13810000.222150.1953, 942, 457784
C-4176.148.110000.272150.1549, 409, 656538
C-5176.156.510000.322150.1341, 347, 302330
C-6127.248.110000.381550.1569, 604, 751641
C-7101.748.110000.471240.1962, 619, 1190924
C-889.648.110000.541100.1879, 808, 833840
C-9176.148.11000.272150.13210, 2966, 26442940
C-10176.148.15000.272150.11056, 1146, 8181007
C-11176.148.115000.272150.1394, 373, 380382
C-12176.148.120000.272150.1441, 402, 334392
C-13176.148.15000.2795−0.31356, 1372, 13281352
C-14176.148.15000.2731−0.71906, 1958, 20241963
C-15176.148.15000.270−12534, 2398, 19542295
Disclaimer/Publisher’s Note: The statements, opinions and data contained in all publications are solely those of the individual author(s) and contributor(s) and not of MDPI and/or the editor(s). MDPI and/or the editor(s) disclaim responsibility for any injury to people or property resulting from any ideas, methods, instructions or products referred to in the content.