Abstract
Blast furnace (BF) ironmaking remains one of the most efficient countercurrent processes; however, achieving further CO2 emission reductions through conventional methods is increasingly challenging. Currently, BF ironmaking emits approximately 2.33 tonnes of fossil-derived CO2 per tonne of crude steel cast. Integrating briquettes composed of biochar and in-plant fines into the BF process offers a promising short- to medium-term strategy for lowering emissions. This approach enables efficient recycling of fine residues and the substitution of fossil reductants with bio-based alternatives, thereby improving productivity while reducing energy and carbon intensity. This study investigates the reduction behavior of (i) biochar mixed with pellet fines, (ii) various in-plant residues individually, and (iii) briquettes composed of biochar and in-plant fines. The reduction rate of biochar–pellet fine mixtures was found to depend on biochar type, with pyrolyzed pine sawdust exhibiting the highest reactivity, and pyrolyzed contorta wood chips the lowest. A correlation between reduction rate and the alkali index of each char was established, although other factors such as char origin and physical properties also influenced reactivity. The effect of biochar addition (0, 5, and 10 wt.%) on the reduction of steelmaking residues was also studied. In general, biochar enhanced the reduction degree and shifted the reaction onset to lower temperatures. The produced briquettes maintained high mechanical integrity during and after reduction, regardless of biochar origin. Thermogravimetric and XRD analyses revealed that mass loss initiates with the dehydroxylation of cement phases and release of volatiles, followed by carbonate decomposition and reduction of higher oxides above 500 °C. At temperatures ≥ 850 °C, the remaining iron oxides were further reduced to metallic iron.
1. Introduction
Most iron is still produced in the blast furnace (BF), and it will remain so for some time due to its exceptionally high productivity and heat efficiency [1]. BF ironmaking is one of the most efficient countercurrent processes, and further reduction in CO2 emissions becomes extremely tough with the conventional routes. According to the World Steel Association [2], the BF-BOF route generates approximately 2.33 tonnes of CO2 per tonne of crude steel cast. In Sweden, the iron and steel industry is one of the most CO2 emission-intensive industrial sectors due to its dependence on fossil-based reducing agents. It contributes ~9% of the total CO2 emissions. According to the Swedish ambition of reducing CO2 emissions in the short to medium term, Swedish steel industries face environmental challenges that require further development of innovative solutions to reduce fossil CO2 emissions without undermining the process efficiency. Breakthrough concepts generally require large investments in infrastructure and novelty in knowledge compared to the existing concepts, which makes them difficult, time-consuming, and costly to implement.
Therefore, thoughts or concepts that need fewer modifications are of considerable interest to the steel industry. One such thought is the top charging of briquettes containing biochar and in-plant fines into the BF. The use of such allows the use of fine materials and the use of biochar as reductants while enhancing productivity due to improved reaction kinetics [3,4]. Heat and mass balance calculations confirmed that a combination of biomass introduced through top charging and injection and as an addition to coke making has the potential to decrease fossil CO2 emissions by an average of 30% [5]. The thermal reserve zone temperature is determined by the heat balance resulting from exothermic and endothermic reactions as well as the heat supply from the ascending gas flow. Thus, enhancing the gasification reaction, by introducing biochar with high reactivity, will lower the thermal reserve zone temperature [6], which shifts the CO/CO2 equilibrium with Fe/FeO to lower CO in reducing gas and improves the gas efficiency. Top charging of biochar-containing briquettes will decrease the dependency on fossil carbon [7,8,9] and lower coke and coal consumption [10].
Utilization of biochar–iron oxide agglomerates in BF iron-making, including different types of biomass [11] and different agglomeration techniques (pressing into tablets without a binder [12], as well as the production of pellets and briquettes with bentonite as a binder) was studied [13,14]. The amount of added biomass in the agglomerate varied from 2 wt.% up to 14 wt.% and even higher when the purpose was to produce direct-reduced iron (DRI), where the mechanical strength is not a significant concern [13,15]. Recently, the authors have investigated the reduction behavior and the mechanical properties of torrefied biomass–iron oxide (chemical grade) agglomerate on both lab and technical scales. The reduction characteristics of lab-scale briquettes with 10 wt.% biomass addition and cement as a binder were identified using a thermogravimetric analyzer. The following has been concluded: (i) the reduction in general was improved by adding biomass in the briquette; (ii) the contribution of residual volatiles to the reduction was observed; and (iii) ash composition had a catalyzing effect on devolatilization as well as gasification [16]. Further, the impact of top charging of torrefied biomass-containing briquettes into the BF on the process efficiency and stability was addressed. Briquettes of steel mill residues with the addition of 1.8 wt.% torrefied sawdust and 12 wt.% cement as binder were charged to the SSAB BF No.4 at two different rates: ~39 kg/tHM and ~46 kg/tHM. The following impacts were addressed: (i) higher gas utilization and sustained shaft permeability; (ii) no indication of heavy hydrocarbons in the top gas; (iii) heat and mass balance calculations of the latter case confirmed a lowering in the thermal reserve zone temperature by 45 °C, a decrease in the carbon consumption by ~10 kg/tHM, and a reduction in the CO2 emissions by 33–40 kg/tHM [17].
Considering the above-mentioned observations and reported results, it is obvious that top charging of biochar-containing briquettes with proper mechanical and reduction characteristics is beneficial to the BF performance. It enables the recycling of various types of in-plant generated fines as well as the utilization of highly reactive, renewable carbon-bearing materials. Therefore, this study aims to enable a high addition of biochar to the in-plant fines’ briquettes without deteriorating their properties, i.e., mechanical stability and reducibility. The specific aims of the present study are (i) to identify the reduction characteristics of biochar when mixed with pellet fines; (ii) to identify the reduction characteristics of in-plant fines, separately, when mixed with biochar; and (iii) to identify the reduction characteristics of developed biochar containing in-plant fines’ briquettes.
2. Experimental
2.1. Materials
Four biochar materials were used in the present investigation, namely birch, pine bark, and contorta pine (all in the form of wood chips), as well as pine sawdust. In addition, four different in-plant fines, namely filter dust, BF dust, pellet fines, and pre-mix (a blend of various in-plant by-products, typically including desulfurization scrap, LD coarse sludge, briquette fines, and mill scale). The biochar samples (~5 L each) were provided by the biochar producer Harads Arctic Heat AB, Harads, Sweden. The residue materials were provided by SSAB, Luleå, Sweden. Representative samples were prepared by coning and quartering.
2.2. Characterization
An electric mortar grinder (Fritsch pulverisette 2, FRITSCH GmbH, Idar-Oberstein, Germany) was used to grind the samples down to less than 150 µm. The carbonaceous materials were analyzed for proximate, ultimate, and ash analyses, as well as the heating value. The phase composition of the original materials, as well as partially and completely reacted samples, was identified using X-ray diffractometry. A PANalytical Empyrean X-ray diffractometer was used. The XRD pattern was measured at a step size of 0.026 deg/s. The measured data were evaluated for phase identification using HighScore Plus (v4.7, PANalytical B.V., Almelo, The Netherlands) software and the FIZ-NIST ICSD (Inorganic Crystal Structure Database) version 3.x database.
The chemical composition of the in-plant fines was determined using a Thermo Scientific ARL 9800 X-ray fluorescence (XRF), (Thermo Scientific, Waltham, MA, USA) instrument operating a rhodium tube. Samples were ground in acetone, oxidized, fused with lithium tetraborate, and cast into tablets for XRF Analysis. Carbon and sulfur content were measured using the LECO CS230 combustion infrared detection instrument (LECO Corporation, St. Joseph, MI, USA).
2.3. Procedure
2.3.1. Reaction Behavior of Bio-Carbon and Iron Oxide Mixtures
Mixtures of different biochar materials and pellet fines were prepared in such a way as to maintain the C/O molar ratio equal to unity, considering only the fixed carbon in the biochar and the reducible oxygen in the pellet fines. The reduction characteristics of the biochar iron oxide mixtures were studied by means of a Netzsch STA 409 thermogravimetric analyzer (TGA) (Netzsch-Gerätebau GmbH, Selb, Germany) with a detection limit of ±1 µg under argon atmosphere and a predefined heating profile that simulates the average blast furnace thermal profile (Figure 1). The evolved gases during the experiments were continuously monitored using a quadrupole mass spectrometer equipped with a SEM detector. Approximately 600 mg of each prepared mixture was hand-pressed in an alumina crucible with an inner diameter of 13.5 mm. The sample was then introduced into the even temperature zone of the furnace.
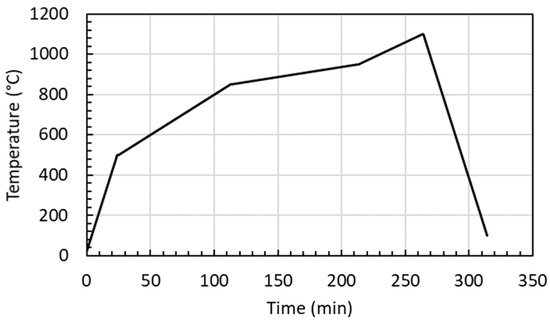
Figure 1.
Applied thermal profile during the TGA experiments.
2.3.2. Reduction Characteristics of the In-Plant Fines
The in-plant fines were mixed with either pellet fines, mainly comprising hematite or coke fines to reach a C/O molar ratio of 0.5, which was the average ratio in the industrial reference biochar free briquettes. The effect of biochar addition on the reduction characteristics of in-plant fines was studied by adding 5 or 10 wt.% of pyrolyzed birch wood chips. Nine mixtures were prepared according to Table 1. The selected biochar addition ratios (0, 5, and 10 wt.%) were chosen based on industrially relevant limits, where higher additions may compromise briquette strength and handling, while still enabling assessment of biochar’s effect on reducibility.

Table 1.
Constituents of in-plant fines mixtures with 0, 5, or 10 wt.% of biochar added.
2.3.3. Reduction Characteristics of Prepared Composite Briquettes
The materials, according to Table 2, were mixed in a SoRoTo 40 L-33 forced action mixer (SoRoTo, Glostrup, Denmark) with several impellers. Hexagonal briquettes approximately 7 cm high and 6.5 cm edge to edge were manufactured using a TEKSAM VU600/6 unit (Teksam Company NV, Genk, Belgium).
Table 2.
The corresponding recipes of the selected briquettes for lab-scale reduction.
The reduction characteristics of the briquettes were evaluated using an in-house fabricated vertical tube furnace; see Figure 2. The length of the uniform temperature zone in the tube was ~10 cm, detailed description of equipment can be found in [18]. The tests were conducted in an inert atmosphere maintained by a nitrogen flow of 2 L/min. There was a water-cooled box with a transparent front gas-tight door connected to the lower end of the tube, which was used to rapidly cool the sample after finalization of the test.
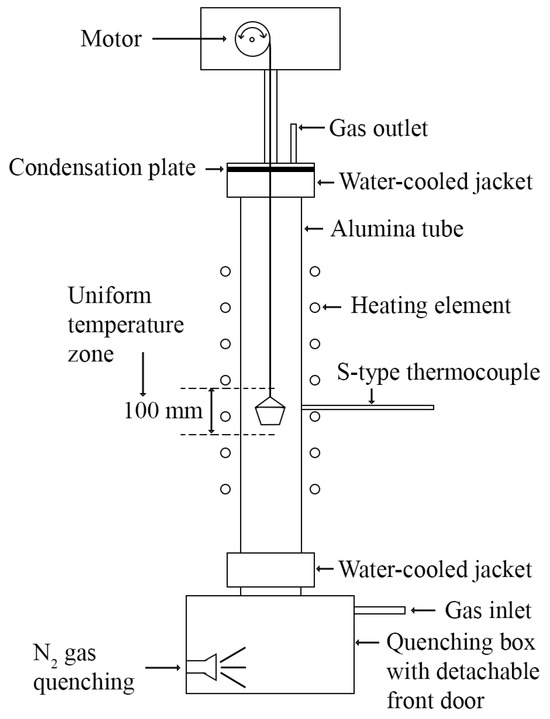
Figure 2.
A schematic drawing of the vertical tube furnace.
Each sample, which consists of three halves of briquettes randomly selected among halves produced by cutting several briquettes, was put in a steel basket connected by a chain to a motor at the top of the furnace. The samples were introduced, the gas-tight front door in the lower box was closed, and the furnace was flushed with nitrogen to prevent any presence of air in the furnace. When the furnace reaches 500 °C, a motor at the top lifts the sample slowly to the uniform temperature zone of the furnace and then heating continues according to the thermal profile depicted in Figure 1 to the preset experimental temperature. When the furnace reaches the desired temperature, the reaction is arrested by the rapid cooling facility inside the lower box. Thereafter, the sample is rapidly gas-cooled by showering the sample(s) with nitrogen at 25 L/min for 5 min.
3. Results and Discussion
3.1. Characterization
The ultimate, proximate analyses and the high heating value (HHV) of the studied carbon-bearing materials are given in Table 3. The carbon-bearing biochars were pretreated at 600 °C in an oxygen-deficient atmosphere. The carbon content of the biochars varies from 83 to 93 wt.% with the lowest content in the pine sawdust and the highest content in birch wood chips. Their H2 content is in the range of 1.6–3.3 wt.% with the highest H2 content in pine sawdust; correspondingly, the volatile content was also the highest, at approximately 24 wt.%. The fixed carbon of applied biochar materials was, on average, a bit higher than the coke due to the very low ash content, less than 1 wt.% compared to approximately 12 wt.% in coke. Their heating values vary from ~33 to ~29 MJ/kg. The major components of the ash are Al2O3, CaO, Fe2O3, K2O, MgO, P2O5, and S; see Table 4. The ash basicity (B2 = CaO/SiO2) is the highest in pyrolyzed pine sawdust with a value up to ~11 and lowest in coke with a value down to 0.02. The sulfur content is highest in coke ash with a value 40 times higher than the average sulfur content in the biochar ash. Unlike sulfur, the average phosphorus content in biochar ash is higher than in coke ash. However, considering the very low content of ash in biochar in general, the phosphorus content in the biochar is still lower than that of coke.
Table 3.
Proximate and ultimate analyses as well as the high heating value of carbon-bearing materials. All in wt.%, and the HHV is in MJ/kg.
Table 4.
Chemical composition of the carbon-bearing materials’ ash, in wt.%.
The chemical composition of the in-plant fines, given in Table 5, shows that the total iron content in the residues varies from 40 wt.%, as in BF dust, to 68.5 wt.%, as in pellet fines. The CaO is highest in the pre-mix with a value up to ~20 wt.%. Carbon content is low in most of the fines, except the BF dust with a value of ~28 wt.%, followed by the pre-mix with a value of ~5 wt.%.
Table 5.
Chemical composition of in-plant fines, in wt.%.
The phase compositions of the in-plant fines are given in Figure 3. It shows that hematite is the dominating phase in all fines, while calcite is the second dominating phase in the pre-mix. Traces of calcite were found in all in-plant fines while silica was only present in pellet fines. Carbon was found in the BF dust and pre-mix.
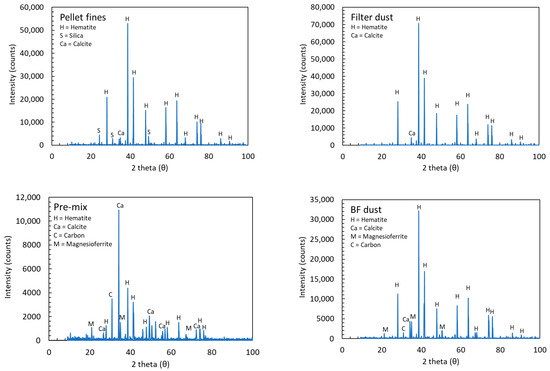
Figure 3.
The phase composition of the studied in-plant fines.
3.2. Reaction Behavior of Biochar–Pellet Fines Mixtures
Thoroughly mixed mixtures of pellet fines and biochar were investigated for their reduction characteristics with an aim to identify the differences between the various pyrolyzed biomass materials. Although the fixed carbon of the biochars varies from 75 to 88 wt.%, there was no significant difference in the net mass loss, indicating that the added carbon is more than the required carbon to completely reduce the hematite to metallic iron, provided that the carbon to oxygen molar ratio is one and no iron oxide is detected in the reduced sample. Figure 4 presents the remaining mass ratio, mass loss rate (DTG) curves, and off-gas composition for the different biochar–pellet fines samples. The early differences in the remaining mass (Figure 4a) are primarily due to variations in moisture and volatile matter content. This initial mass loss, caused by the release of water and volatiles, is followed by the stepwise reduction of iron oxide, from hematite to magnetite, wustite, and finally to metallic iron, as depicted by the DTG curves (Figure 4b). The reduction reaches completion at around 930 °C. The TGA/DTG results reveal a clear difference in the reaction rates, especially during the last stage, at temperatures above 850 °C. These differences are attributed to the varying reactivity of the biochars, which follows the order pine sawdust > pine bark wood chips > birch wood chips > pine contorta wood chips.
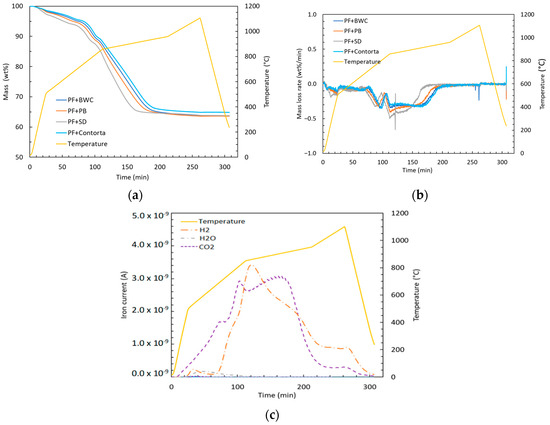
Figure 4.
(a) Remaining mass, (b) mass loss rate, and (c) representative example of evolved gases composition during the reduction test.
Figure 4c illustrates the off-gas composition as a function of temperature and time for the biochar (pine contorta)–pellet fines mixture. H2O, H2, and CO2 were detected. H2O is detected early in the heating process, primarily due to moisture removal. Its concentration decreases as the temperature increases and moisture is fully driven off. H2, primarily generated from secondary devolatilization of biomass [19], appears around 500 °C, with its concentration increasing above 700 °C. It peaks at approximately 850 °C and then gradually declines toward the end of the experiment. CO/CO2, originating from both devolatilization and reduction reactions, is first detected around 200 °C. Its concentration increases gradually until about 670 °C before it stabilizes. At around 750 °C, it increases again until 840 °C, then decreases slightly before reaching a second peak at approximately 910 °C. It then gradually declines. It was obvious that most of the biomass’s volatiles were already released during pretreatment (pyrolysis). Since the off-gas composition for other mixtures followed a similar pattern, only the results for the contorta mixture are presented here for brevity.
Char reactivity or conversion rate is an important property that, among other properties, affects the thermal reserve zone temperature in the BF when charged from the top. It is a function of many factors, like ash composition, internal structure of the original wood, porosity, etc. Some studies demonstrated a correlation between char reactivity and its composition in terms of the molar ratio of catalytic ash, i.e., alkali and alkaline earth metals (AAEM) [20]. Other inorganic substances, such as silica, alumina, and phosphates lower the reactivity of the char. Silica and alumina have been observed to reduce the impact of potassium. The effects of various ash components can be expressed by the alkali index. The alkali index (A value) is calculated by the following equation [21].
The calculated alkali indices and reaction rate peaks (in the temperature range 850–950 °C) are given in Table 6. The calculated alkali index for pine contorta is the lowest, which is in line with its observed reaction rate being the lowest among calculated rates. Although the alkali index for pine sawdust is not the highest, its reaction rate was the highest. Therefore, the estimated alkali index for different ashes cannot solely explain the observed reaction rate values for all biochars. This suggests that other factors, like nature, surface area, pore size, and pore size distribution, are equally important and need to be considered. Furthermore, the observed experimental mass loss (~38 wt.%) lies between the theoretical limits of 36 wt.% (CO2 as the sole gas product) and 43 wt.% (CO as the sole gas product), indicating that both CO2 and CO are likely formed, but with a gas product containing more CO2, particularly at lower temperatures. This indicates high biochar reactivity and the potential to lower carbon consumption and improve gas efficiency regardless of biochar type. In particular, the relatively high volatile content and porous structure of pine sawdust enhance gas diffusion and surface reactions, which explains its higher reactivity despite not having the highest alkali index. Therefore, factors such as pore size distribution, surface area, and microstructure must be considered alongside the alkali index.
Table 6.
Calculated alkali index and observed, maximum, reaction rates at 850–950 °C.
X-ray diffraction analysis of the sample products confirmed only the presence of metallic iron (Figure 5). The figure presents the XRD patterns of sample products of PF-BWC and PF-PS. Patterns for the remaining samples are omitted for brevity. Our findings align with recent kinetic modeling under hydrogen-rich conditions, which showed that biochar plays an increasingly dominant role in accelerating reduction at elevated temperatures [22].
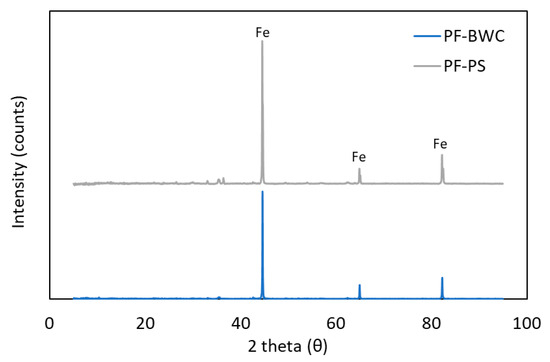
Figure 5.
XRD pattern of pellet fines–biochar sample products.
3.3. Reduction Characteristics of In-Plant Fines (With/Without Biochar)
The C/O molar ratio of the biochar-free in-plant fines samples was set to 0.5 by adding either iron oxide (pellet fines) or carbon (coke fines). Three samples of each material were prepared, namely biochar-free, 5 wt.%, and 10 wt.% added biochar. Table 7 shows the mass of added components in each mixture, the C/O molar ratio, and the bulk density of the packed sample inside the crucible before entering the furnace. With 5 wt.% added biochar, the average C/O molar ratio was increased to 0.75 while adding 10 wt.% increased the C/O molar ratio to 0.9–1.
Table 7.
List of in-plant fines samples, their constituent materials, the corresponding C/O molar ratio, and bulk density.
3.3.1. Filter Dust Mixture (FD)
Figure 6a,b present the TGA and DTG curves of the biochar–filter dust samples. Addition of biochar significantly increases the mass loss and shifts the reaction to lower temperatures. In particular, the onset moves from ~650 °C in the biochar-free sample to ~750 °C with biochar, indicating enhanced reduction kinetics in the 650–900 °C range. The DTG curves reveal two distinct reaction steps in the presence of biochar, which are less defined without it. Figure 6(c1,c2) compare the off-gas compositions of the biochar-free and 10 wt.% biochar samples. In the biochar-free case, CO2 peaks at ~850 °C, while in the biochar-containing sample, two CO2 peaks appear at ~750 °C and ~850 °C, consistent with the stepwise reduction observed in the DTG data. At higher temperatures (950–1100 °C), CO and CO2 are both generated, with a CO2 maximum at ~990 °C and CO at ~1100 °C (biochar-free) and ~1050 °C (biochar-added).
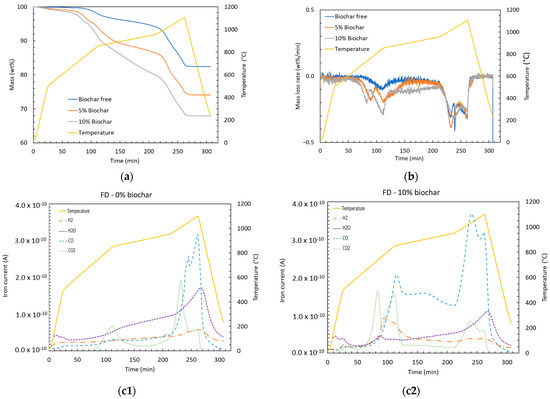
Figure 6.
(a) Remaining mass percent, (b) mass loss rate, and (c1,c2) off-gas composition of filter dust with/with no added biochar.
Figure 7 shows the phase composition of the reduced samples as a function of biochar content. Biochar addition results in a high metallic iron content after reaction, indicating a higher reduction degree, consistent with the TGA results. As the analysis is based solely on XRD, the findings are considered indicative.
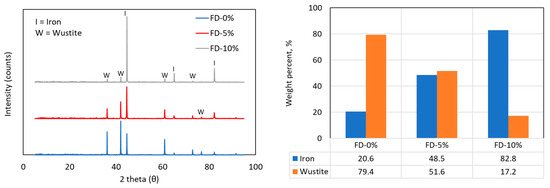
Figure 7.
XRD patterns of filter dust samples after reduction, with Rietveld analysis showing the quantities of Fe and FeO for filter dust mixed with 0, 5, or 10 wt.% of biochar.
3.3.2. BF Dust Mixtures (BFD)
Like the filter dust mixtures, the TGA results for BF dust show that biochar addition increases total mass loss and shifts the reduction onset from ~800 °C (biochar-free) to ~750 °C and ~720 °C for 5 wt.% and 10 wt.% biochar, respectively. In the 950–1100 °C range (Figure 8a), DTG curves (Figure 8b) reveal two distinct steps: the first becomes more prominent at lower temperatures with biochar, while the second diminishes, likely due to early oxygen consumption. Figure 8(c1,c2) compare the off-gas composition for BF dust mixtures, showing CO, CO2, and H2 as the main gaseous products. CO2 evolves first, corresponding to initial mass loss, followed by H2 and CO. Above 950 °C, CO levels increase, peaking at ~1100 °C for the biochar-free and ~1050 °C for the 10 wt.% biochar samples.
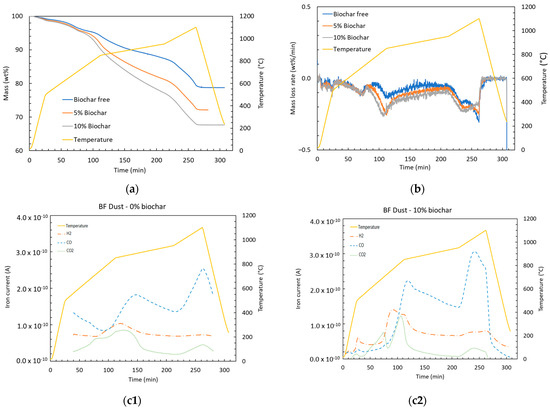
Figure 8.
(a) Remaining mass percent, (b) mass loss rate, and (c1,c2) off-gas composition of BF dust with 0 or 10 wt.% of biochar.
Figure 9 presents the phase composition of reduced BF dust samples with varying biochar content. The metallic iron content after reaction is higher with biochar addition, aligning with the TGA findings. Notably, no wustite was observed in the 10 wt.% biochar sample, suggesting full reduction of the iron oxides.
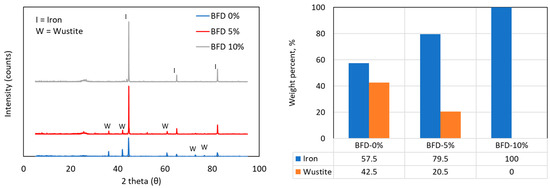
Figure 9.
XRD patterns of BF dust samples after reduction, with Rietveld analysis showing the quantities of Fe and FeO for samples with 0, 5, or 10 wt.% of biochar added.
3.3.3. Pre-Mix Mixture
Figure 10a,b show that the mass loss and the mass loss rate are similar for all samples up to ~750 °C. For the biochar-free sample, the reaction progresses slowly until the mass loss reaches ~25 wt.% at ~1100 °C, whereas the remaining mass decreases faster before they flatten out at ~850 °C for the biochar-containing samples. The reaction rate is slightly higher and the peak temperature slightly lower with more biochar added, as depicted in Figure 10b. Off-gas analysis reveals H2O, CO, CO2, and H2 as the main gaseous products. Early gas release (~500 °C) is attributed to the decomposition of crystalline water and related reactions. CO and CO2 concentrations rise until ~700 °C, then decline; in biochar-containing samples, CO levels increase again up to ~870 °C.
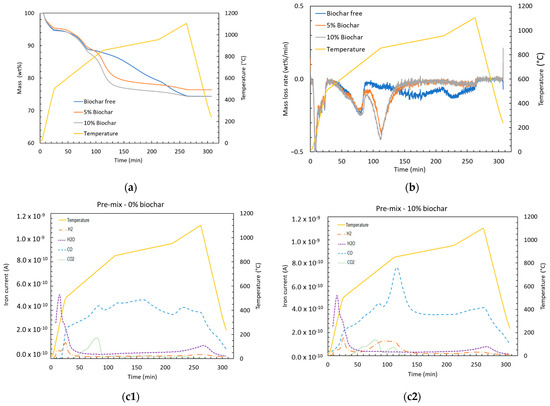
Figure 10.
(a) Remaining mass percent, (b) mass loss rate, and (c1,c2) off-gas composition of pre-mix with 0 or 10 wt.% added biochar.
Due to the pre-mix’s heterogeneous nature, including possible crystalline water and carbonates, the exact oxygen and carbon available for reduction is uncertain. As a result, excess carbon does not significantly increase total mass loss. The reduction in biochar-free samples extends up to ~1100 °C, while most reduction in biochar-containing samples occurs between 750 and 890 °C. XRD analysis (Figure 11) confirms that, even at a C/O ratio of 0.5, the reduction approaches completion, suggesting the presence of iron oxides other than hematite. The observed mass loss behavior can be explained by the mixture’s complex composition, including partially reduced iron species.
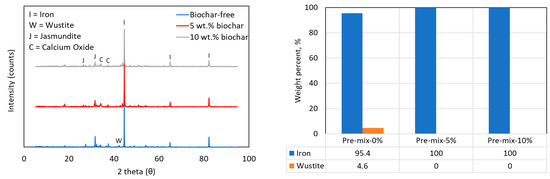
Figure 11.
XRD pattern of pre-mix-containing samples after reaction and the corresponding Rietveld analysis indicating quantities of Fe and FeO.
In summary, biochar addition consistently improves the reduction behavior of in-plant fine mixtures, enhances gas efficiency, and promotes earlier and more complete reduction. These benefits appear irrespective of the mixture type, though the extent of the improvement varies depending on the composition and structure of the specific material.
3.4. Reduction Characteristics of the Briquettes
Briquettes produced from in-plant fines and biochar were evaluated using both full-length and interrupted experiments. Three briquette recipes (R0, F10B, and R10C) were investigated for their reduction characteristics. Their composition is given in Table 2. All briquettes exhibited high mechanical stability during heating up to 1100 °C, with no major cracking or swelling (Figure 12). The compressive strength was not measured in accordance with blast furnace standards, as only half-briquettes were available and any values would have been misleading. However, all the briquettes maintained their structural integrity during reduction, with no major cracks or disintegration observed. Recent studies confirm that biochar-containing briquettes can achieve cold compressive strength in the range of 90–126 N, sufficient for BF top charging [22]. This supports our qualitative observation that the briquettes retained integrity under reduction conditions.
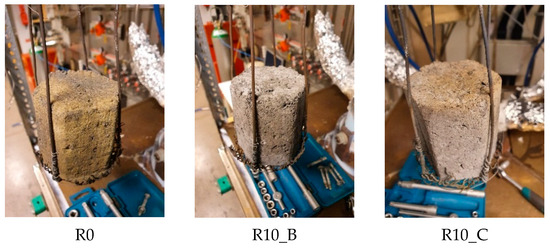
Figure 12.
Typical pictures of the studied briquettes after heating in inert atmosphere up to 1100 °C.
Thermogravimeteric analysis (Figure 13) showed that biochar-containing briquettes (R10B and R10C) experienced greater mass loss (~30 wt.%) compared to the biochar-free variant (~28 wt.%). This difference is attributed to the higher reactivity and reduction efficiency of biochar. For instance, 20 wt.% mass loss occurred by 920 °C in biochar-containing samples, while the same was only reached at 1100 °C in biochar-free ones. XRD analysis (Figure 14) revealed metallic iron as the dominant phase in all samples, with traces of complex oxide phases, such as CaSiAlFeOx.
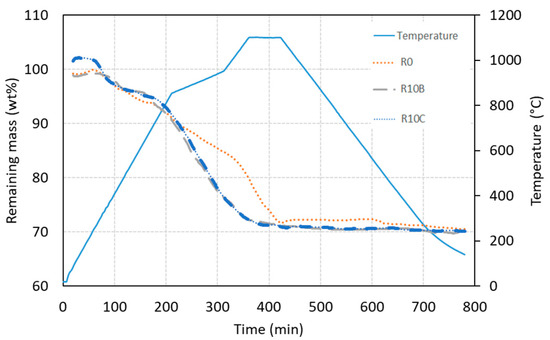
Figure 13.
The remaining mass loss of the briquettes as a function of time and temperature.
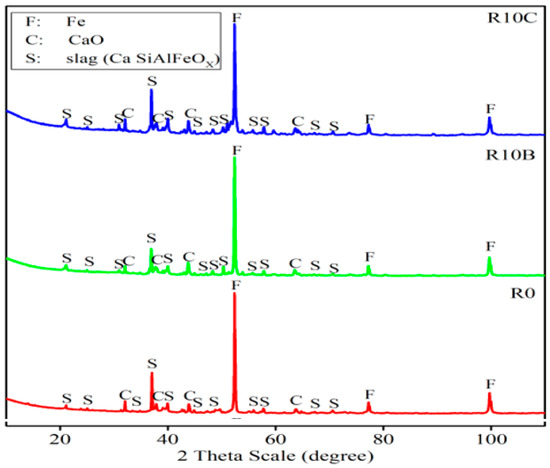
Figure 14.
XRD patterns of the reduced briquettes.
Interrupted tests at 500, 850, 950, and 1100 °C (Figure 15 and Figure 16) confirmed progressive reduction and stability of the briquettes. The observed mass loss in these tests corresponded well with the full-length curve (Figure 17). Early mass loss (up to 500 °C) is mainly due to dehydroxylation and volatile release, followed by carbonate decomposition between 500 and 850 °C, iron oxide reduction, and release of CO/CO2 above 850 °C.
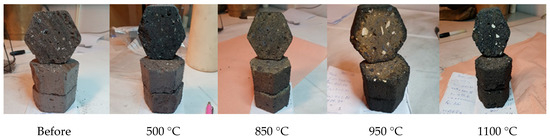
Figure 15.
Pictures of the arrested briquettes (R0) at predefined temperatures.
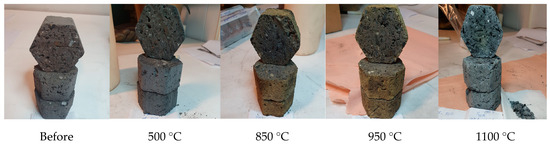
Figure 16.
Pictures of the arrested briquettes (R10B) at predefined temperatures.
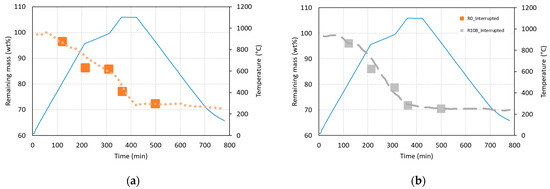
Figure 17.
Allocation of the mass loss values of arrested experiments on the mass loss curve of the full-length experiment, (a) R0 and (b) R10B.
Table 8 compares actual vs. calculated mass losses based on the behavior of individual briquette components. Slight discrepancies, especially at 950 °C, are likely due to differences in heating conditions and sample size between the TGA and briquette tests.
Table 8.
Actual mass loss from arrested experiments and calculated values based on the individual contribution of constituent by-products.
The XRD results of the arrested briquettes (Figure 18) support the proposed reaction pathway. Initial phases included hematite and calcite. Calcite decomposed below 950 °C. In biochar-free briquettes, magnetite persisted up to 950 °C, and metallic iron formed only at 1100 °C. In contrast, biochar-containing briquettes already showed metallic iron at 950 °C, and complete reduction by 1100 °C, while some magnetite and wustite remained in the biochar-free samples.
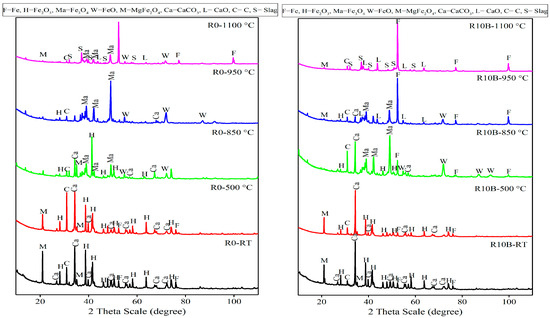
Figure 18.
XRD patterns of the arrested briquettes produced according to R0 and R10B recipes.
4. Conclusions
This study investigated the incorporation of biochar into in-plant fines-based briquettes and its influence on reduction behavior under simulated blast furnace conditions.
The reduction behavior of biochar–pellet fines mixtures varied depending on the type of biochar. Pyrolyzed pine sawdust showed the highest reactivity, while contorta wood chips-derived char was the least reactive. A correlation between the alkali index and reduction rate was observed, though other factors such as the char’s physical properties also played a role. High biochar reactivity contributed to improved gas utilization and lower carbon consumption, reflected in mass losses approaching the theoretical minimum.
Four types of in-plant residues, pre-mix, filter dust, blast furnace (BF) dust, and pellet fines, were studied with 0, 5, and 10 wt.% added biochar. Total iron content ranged from ~40 wt.% (BF dust) to ~69 wt.% (pellet fines), while calcite and carbon contents varied significantly across the residues. Biochar addition to filter dust and BF dust significantly increased mass loss and shifted reduction to lower temperatures. In contrast, for the pre-mix, biochar had little effect on overall mass loss but significantly enhanced reduction kinetics.
The briquettes maintained good mechanical stability during reduction, regardless of biochar content, with no significant cracking or swelling observed. Net mass loss was ~28 wt.% for biochar-free briquettes and ~30 wt.% for those with biochar. XRD analysis showed metallic iron as the dominant phase, with minor amounts of CaSiAlFeOx.
Interrupted experiments confirmed the stability of partially reduced briquettes and showed good agreement between measured and calculated mass losses based on individual component behavior. XRD analysis supported the proposed reaction mechanism: early mass loss (<500 °C) was due to dehydroxylation and volatile release; 500–850 °C involved carbonate decomposition; and 850–1100 °C corresponded to iron oxide reduction and CO/CO2 release.
Author Contributions
Conceptualization, H.A. and L.S.Ö.; formal analysis, M.E.; writing—original draft, H.A.; writing—review & editing, H.A., M.E., M.L. and L.S.Ö.; project administration, M.L. and L.S.Ö.; funding acquisition, M.L. and L.S.Ö. All authors have read and agreed to the published version of the manuscript.
Funding
This work was carried out as part of the project “Reduced CO2 Emission through Designed Bio-Coal in the Residue Briquette for the Blast Furnace—MICO,” supported by the Swedish Energy Agency with funding from the European Union, grant number 48843-1. The research was conducted within the Center for Advanced Mining and Metallurgy (CAMM) at Luleå University of Technology.
Data Availability Statement
The original contributions presented in this study are included in the article. Further inquiries can be directed to the corresponding author.
Conflicts of Interest
The authors declare no conflict of interest.
References
- Biswas, A.K. Principles of Blast Furnace Ironmaking; Cootha Publishing House: Brisbane, Australia, 1981. [Google Scholar]
- World Steel Association. Sustainability Indicators 2023; World Steel Association: Brussels, Belgium, 2023; Available online: https://worldsteel.org/sustainability/sustainability-indicators-2023-report (accessed on 27 July 2025).
- Dutta, S.K.; Ghosh, A. Study of nonisothermal reduction of iron ore-coal/char composite pellet. Metall. Mater. Trans. B 1994, 25, 15–26. [Google Scholar] [CrossRef]
- Sahoo, M.; Sarkar, S.; Das, A.C.; Roy, G.G.; Sen, P.K. Role of scrap recycling for CO2 emission reduction in steel plant: A model based approach. Steel Res. Int. 2019, 90, 1900034. [Google Scholar] [CrossRef]
- Sundqvist Ökvist, L.; Lagerwall, P.; Sundelin, B.; Orre, J.; Brämming, M.; Lundgren, M. Low CO2 ironmaking in the blast furnace: Roheisenerzeugung im Hochofen mit niedrigen CO2 Emissionen. Stahl Und Eisen 2017, 137, 29–37. [Google Scholar]
- Ueda, S.; Yanagiya, K.; Watanabe, K.; Murakami, T.; Inoue, R.; Ariyama, T. Reaction Model and Reduction Behavior of Carbon Iron Ore Composite in Blast Furnace. ISIJ Int. 2009, 49, 827–836. [Google Scholar] [CrossRef]
- Peacey, J.G.; Davenport, W.G. The iron blast furnace: Theory and practice. In International Series on Materials Science and Technology; Pergamon Press: Oxford, UK, 1979; Volume 31, p. 251. [Google Scholar]
- Kashiwaya, Y.; Kanbe, M.; Ishii, K. Reaction behavior of facing pair between hematite and graphite: A coupling phenomenon of reduction and gasification. ISIJ Int. 2001, 41, 818–826. [Google Scholar] [CrossRef]
- Ahmed, H.M.; Viswanathan, N.; Bjorkman, B. Composite Pellets—A Potential Raw Material for Iron-Making. Steel Res. Int. 2014, 85, 293–306. [Google Scholar] [CrossRef]
- Ariyama, T.; Murai, R.; Ishii, J.; Sato, M. Reduction of CO2 Emissions from Integrated Steel Works and Its Subjects for a Future Study. ISIJ Int. 2005, 45, 1371–1378. [Google Scholar] [CrossRef]
- Suopajärvi, H.; Kemppainen, A.; Haapakangas, J.; Fabritius, T. Extensive review of the opportunities to use biomass-based fuels in iron and steelmaking processes. J. Clean. Prod. 2017, 148, 709–734. [Google Scholar] [CrossRef]
- Ueda, S.; Watanabe, K.; Yanagiya, K.; Inoue, R.; Ariyama, T. Improvement of Reactivity of Carbon Iron Ore Composite with Biomass Char for Blast Furnace. ISIJ Int. 2009, 49, 1505–1512. [Google Scholar] [CrossRef]
- Luo, S.; Yi, C.; Zhou, Y. Direct reduction of mixed biomass-Fe2O3 briquettes using biomass-generated syngas. Renew. Energy 2011, 36, 3332–3336. [Google Scholar] [CrossRef]
- Kowitwarangkul, P.; Babich, A.; Senk, D. Reduction Behavior of Self-Reducing Pellet (SRP) for Low Height Blast Furnace. Steel Res. Int. 2014, 85, 1501–1509. [Google Scholar] [CrossRef]
- Guo, D.; Hu, M.; Pu, C.; Xiao, B.; Hu, Z.; Liu, S.; Wang, X.; Zhu, X. Kinetics and mechanisms of direct reduction of iron ore-biomass composite pellets with hydrogen gas. Int. J. Hydrogen Energy 2015, 40, 4733–4740. [Google Scholar] [CrossRef]
- El-Tawil, A.A.; Ahmed, H.M.; Ökvist, L.S.; Björkman, B. Self-Reduction Behavior of Bio-Coal Containing Iron Ore Composites. Metals 2020, 10, 133. [Google Scholar] [CrossRef]
- Mousa, E.; Lundgren, M.; Ökvist, L.S.; From, L.; Robles, A.; Hällsten, S.; Sundelin, B.; Friberg, H.; El-Tawil, A. Reduced carbon consumption and CO2 emission at the blast furnace by use of briquettes containing torrefied sawdust. J. Sustain. Metall. 2019, 5, 391–401. [Google Scholar] [CrossRef]
- Prasad, P.N.; Lennartsson, A.; Samuelsson, C. Volatilized and Condensed Sb-and As-Bearing Phases Produced During Roasting of Cu-Rich Complex Concentrate in Nitrogen Atmosphere with Oxygen in Traces. Metall. Mater. Trans. B 2021, 52, 1866–1885. [Google Scholar] [CrossRef]
- Biagini, E.; Tognotti, L. A generalized procedure for the devolatilization of biomass fuels based on the chemical components. Energy Fuels 2014, 28, 614–623. [Google Scholar] [CrossRef]
- Umeki, K.; Moilanen, A.; Gómez-Barea, A.; Konttinen, J. A model of biomass char gasification describing the change in catalytic activity of ash. Chem. Eng. J. 2012, 207, 616–624. [Google Scholar] [CrossRef]
- Yang, Y.; Xu, R.; Zhang, J.; Wang, W.; Wang, R.; Shi, J.; Dong, Y.; Huang, Y.; Ye, Y. Effect of Biochar Addition on the Strength Properties of Metallurgical Dust Briquettes. J. Sustain. Metall. 2025, 11, 529–541. [Google Scholar] [CrossRef]
- Zhang, T.; Liu, Y.; Tang, H. Reaction Behavior of Biochar Composite Briquette Under H2-N2 Atmosphere: Experimental Study. Metals 2025, 15, 236. [Google Scholar] [CrossRef]
Disclaimer/Publisher’s Note: The statements, opinions and data contained in all publications are solely those of the individual author(s) and contributor(s) and not of MDPI and/or the editor(s). MDPI and/or the editor(s) disclaim responsibility for any injury to people or property resulting from any ideas, methods, instructions or products referred to in the content. |
© 2025 by the authors. Licensee MDPI, Basel, Switzerland. This article is an open access article distributed under the terms and conditions of the Creative Commons Attribution (CC BY) license (https://creativecommons.org/licenses/by/4.0/).