Article

Determination of Final Ferrite Grain Size During Multiple-Stage Controlled Cooling of Low-Carbon, Low-Alloy Steels

1
Warwick Manufacturing Group (WMG), University of Warwick, Coventry CV4 7AL, UK
2
Tata Steel UK Ltd., Voyager Building, Warwick Science Park, Coventry CV4 7EZ, UK
*
Authors to whom correspondence should be addressed.
Metals 2025, 15(9), 956; https://doi.org/10.3390/met15090956
Submission received: 14 July 2025 / Revised: 22 August 2025 / Accepted: 25 August 2025 / Published: 28 August 2025
(This article belongs to the Special Issue Advances in High-Strength Low-Alloy Steels (2nd Edition))

Abstract

Ferrite grain size strengthening makes the predominant contribution to the overall strength of ferrite–pearlite structural hollow section steel grades. A fine ferrite grain size is achieved through a two-stage controlled cooling process. First, the material is rapidly cooled with water. This provides a large undercooling, which is the driving force for ferrite to form. The second stage involves slow natural (air) cooling, where the cooling rates and the transition temperature from water to air cooling are carefully controlled. This is crucial to prevent the formation of bainite or martensite. Ferrite grain sizes can be predicted for continuous cooling and isothermal transformation based on the prior austenite grain size, composition and cooling rate/isothermal transformation temperature. However, predictions for multiple-cooling-stage transformations have not been reported. In this work, EN S355-grade steel was used to study ferrite grain size development during continuous cooling, isothermal holding and complex (two-stage or multi-stage) cooling. Dilatometry and microstructure assessment was used to study the relationship between the final ferrite grain size and undercooling at which 40% of the ferrite formed. It was found that any changes in cooling rate/temperature (including a possible ‘bounce back’ in temperature due to latent heat formation) after 40% of the ferrite had formed had a negligible effect on the final ferrite grain size, assuming that re-austenitization or bainite formation was avoided.

1. Introduction

S-grade hollow sections are used in a wide array of construction applications, with 36.5 Mt of steel hollow sections being produced globally in 2024 [1]. For yield strengths below 690 MPa (grades EN S275, S355, S420 and S460), hollow sections are produced with a ferrite–pearlite microstructure [2]. To achieve the strength and toughness requirements for the various S-grade steels, the ferrite grain size needs to be controlled. Typically, grain size strengthening contributes to up to 60% of the total yield strength [3]. The remaining yield strength requirements comprise solid solution and/or precipitation strengthening. Most recent studies on S-grades and/or hollow section production have focused on improvements to precipitate control [4], toughness [5], strength [6], temperature control [7] and residual stress control [8], with few researchers focusing on ferrite grain size control.
During the manufacturing of hot finished hollow sections, the steel strip is formed and welded into a tube, which is then reheated in a furnace for around 30 min to re-austenitize the microstructure before cooling to form the desired ferrite–pearlite structure. Historically, structural steel hollow sections were naturally air cooled to ensure a ferrite–pearlite microstructure. However, recent changes to standards have allowed for controlled water cooling, provided that a ferrite–pearlite microstructure is attained [2]. Therefore, after soaking between 850 and 950 °C [9], hollow sections can be cooled by multiple sequential water-cooling banks rapidly (at rates ranging from 0.3 °C/s to 50 °C/s) [10,11] to initiate ferrite transformation at a lower temperature than during air cooling, which results in a finer ferrite grain size. Careful control is required to ensure that the cooling is not too severe such that undesirable brittle secondary phases, such as bainite or martensite, form. Hence hollow sections should exit the water-cooling stages at temperatures over 600 °C, after which they are naturally air cooled. This gives rise to complex cooling profiles for hollow steel sections with varying cooling rates and potential local reheating ‘bounce back’ at the surface due to through-thickness temperature variations.
Extensive work has been carried out to develop empirical relationships to predict ferrite grain size ( d α ) from cooling rate ( q ) and prior austenite grain size ( d γ ), such as Equation (1) for low carbon, low alloy steels under continuous cooling conditions.
d α = a q b d γ c
where a , b and c are fitting parameters that range from 5.7 to 30.4 for a , −0.26 to −0.16 for b and from 0.1 to 0.5 for c [12,13,14,15,16,17], that are dependent on the steel grade (primarily Mn content) and the range of prior austenite grain sizes studied. An alternate empirical equation proposed by Siwecki [18] that accounts for similar factors is Equation (2), however, this equation has different fitting factors ( A , B , C ) for a more general fitting that applies to a variety of low-carbon, low alloy steels.
d α = d γ 1 + [ A + B · q C ] · d γ
Relationships have also been developed between ferrite grain size and the transformation start temperature ( T s ) and chemical composition during continuous cooling [18,19,20,21,22], shown in Equation (3).
d α = F α 1 3 exp e d γ g Q n T s
where F α is the equilibrium ferrite fraction, e and g are fitting parameters and Q n is the effective activation energy for ferrite nucleation which is dependent on the carbon content. The fitting parameter, e , ranges from 13.5 to 52.3 for different low carbon low alloy steels. The fitting parameter, g , ranges from 0.024 to 0.11. Q n can be calculated using Equation (4).
Q n = 1,444,500 41,600 w c 0.104
where w c is the steel carbon wt.% content.
Sokolov [22] used this approach to predict the ferrite grain size for six different steels with a mean relative error of 11.3%. A wide range of cooling rates were considered by Sokolov, ranging from 0.1 to 60 °C/s. Significant grain refinement can be achieved through cooling rate control, for example, in structural grade A36, a cooling rate increase from 1 °C/s to 58 °C/s corresponds to a ferrite grain refinement from ≈13 μm to ≈5 μm from an initial austenite grain size of 15 µm [12]. The initial austenite grain size has a significant influence on the final ferrite grain size due to its effect on the ferrite nucleation rate and nucleation site distribution. It was proposed by Tamura and Umemoto [13,14] that the final ferrite grain size would be proportional to the austenite grain size with the following relationships d γ 1 3 ,   d γ 2 3 ,   d γ 1 depending on whether the ferrite nucleation was on grain surfaces, grain edges and/or grain corners, respectively, i.e., greater refinement with a larger number of nucleation sites. Umemoto [14] showed that increasing the cooling rate from 0.05 °C/s to 5 °C/s with a 126 μm austenite grain size resulted in a relationship change from   d γ 0.96 to d γ 0.72 , which suggests grain corner saturation and an increase in grain edge nucleation as the cooling rate increases.
A study regarding run-out table microstructure development by Duan et al. [23] identified that, regardless of austenite grain size (within the range of (34 μm to 17 μm), the Dγ to Dα ratio resulted in a value of 1.8; if the austenite grain shape is assumed to be a Kelvin-truncated octahedron [24], then this value would correspond with nucleation predominantly occurring at grain corners.
Suehiro et al. [19] developed a mathematical model for ferrite formation after hot rolling where they showed that the ferrite grain size was proportional to the predicted temperature when 5% of the ferrite had formed. The calculated transformation temperature took account of the effect of carbon partitioning on transformation, the effect of Mn and Si content and the assumed lack of incubation time for nucleation. The experimental data included cooling rates ranging from 1 °C/s to 30 °C/s and austenite grain sizes from 23 μm to 150 μm. It should be noted that since the cooling used was continuous Newtonian cooling, the final ferrite grain size should correlate with the temperature to form any amount of ferrite, and no evidence for ferrite nucleation being completed at 5% transformation was presented. Priestner and Hodgson [25] observed experimentally that grain coarsening and grain nuclei consumption resulted in nucleated grains being lost (consumed) up until the first 35% of ferrite was formed. This occurred in 35 μm and 65 μm sized austenite grains cooled continuously at a rate of 1 °C/s. After 35% of the ferrite was formed, the number of ferrite grains in the microstructure remained constant. The early stages, where grain boundary saturation occurs, was observed within the first 10% of transformation. As the cooling rate affects grain nucleation and growth rates, it can be expected to affect the extent of grain consumption during the early stage of transformation. Hence, it might be expected that changing the cooling rate during the ferrite grain formation and consumption stage during continuous cooling will lead to a change in grain consumption rate and hence a different ferrite grain size than that predicted by Suehiro et al., where only the first 5% of the transformation is considered.
Most of the work undertaken to predict ferrite grain size during its transformation from austenite has focused on understanding the continuous cooling transformation. To predict ferrite grain size during controlled cooling where varying cooling rates, including potential reheating, occurs, it is desirable to determine how much ferrite transformation is needed to define the final ferrite grain size. Previous reports have suggested this value could be between 5% and 35%. This paper reports on the fraction of ferrite formed that determines the final ferrite grain size, referred to as the critical ferrite percentage, using continuous cooling, isothermal holding and complex multi-stage cooling routes, using commercial steel. A single austenite grain size, representative of commercial furnace heat treatments, and a range of reheating and cooling conditions that are mostly industrially relevant for hot finished hollow sections have been explored.

2. Materials and Methodology

2.1. Materials

A 15.2 mm thick industrial S355 hot strip with a composition as shown in Table 1 was used. The hot rolled strip microstructure consisted of ferrite–pearlite with a ferrite grain size of 6.0 μm ± 0.4 μm. Industrial hollow section tube production typically involves reheating at 850–1000 °C for approximately 30 min. Due to the slow heating rate, the center of the strip may only experience the peak temperature for a short time, therefore the initial prior austenite grain size (PAGS) was generated using a thermal cycle of heating at 10 °C/s to 950 °C for 5 min.

2.2. Methodology

A Bähr DIL 805A/D differential dilatometer (TA Instruments, New Castle, DE, USA) was used for the heat treatments and to determine the continuous cooling transformation (CCT) diagram for the steel used. Samples were cut into 4 mm diameter × 10 mm length cylindrical rods and heated at 10 °C/s to 950 °C for 5 min, then subsequently cooled using helium gas at cooling rates varying from 0.12 °C/s to 100 °C/s. Six cooling regimes were used, two conventional transformation cooling profiles, three industrially relevant transformation cooling profiles and a single extreme profile
  • Continuous Cooling (CC): Samples were cooled from 950 °C to room temperature at rates ranging from 0.12 °C/s to 50 °C/s.
  • Isothermal Hold Transformation (IH): Samples were rapidly cooled at a rate of 100 °C/s from 950 °C to various temperatures (termed transition points (TP)) between 600 °C and 700 °C, then held isothermally until transformation was complete.
  • Cooling and Isothermal Hold Transformation (CI): Samples were cooled from 950 °C at rates ranging from 1 °C/s to 50 °C/s to TP temperatures above the bainite formation temperature. Once this temperature was reached, the samples were held isothermally until transformation was completed. Shown in Figure 1a.
  • Fast-Slow (FS): Samples were cooled from 950 °C at rates ranging from 1 °C/s to 20 °C/s to TP temperatures above the bainite formation temperature. Afterward, the cooling rate was reduced to 0.5 °C/s until room temperature was reached. Shown in Figure 1b.
  • ‘Bounce Back’ (BB): Samples were cooled from 950 °C at rates ranging from 5 °C/s to 15 °C/s to TP temperatures above the bainite formation temperature. The samples were then reheated by 10 °C to 40 °C at a heating rate of 10 °C/s and slowly cooled at 0.5 °C/s to room temperature. Shown in Figure 1c.
  • Slow-Fast (SF): Samples were cooled from 950 °C at rates of 0.12 °C/s and 1 °C/s to TP1 temperatures above the bainite formation temperature. Afterwards, the cooling rate was increased to 20 °C/s until 650 °C had been reached. Once at 650 °C, the cooling rate was decreased to 0.5 °C/s until full ferrite–pearlite formation had been achieved. Shown in Figure 1d.
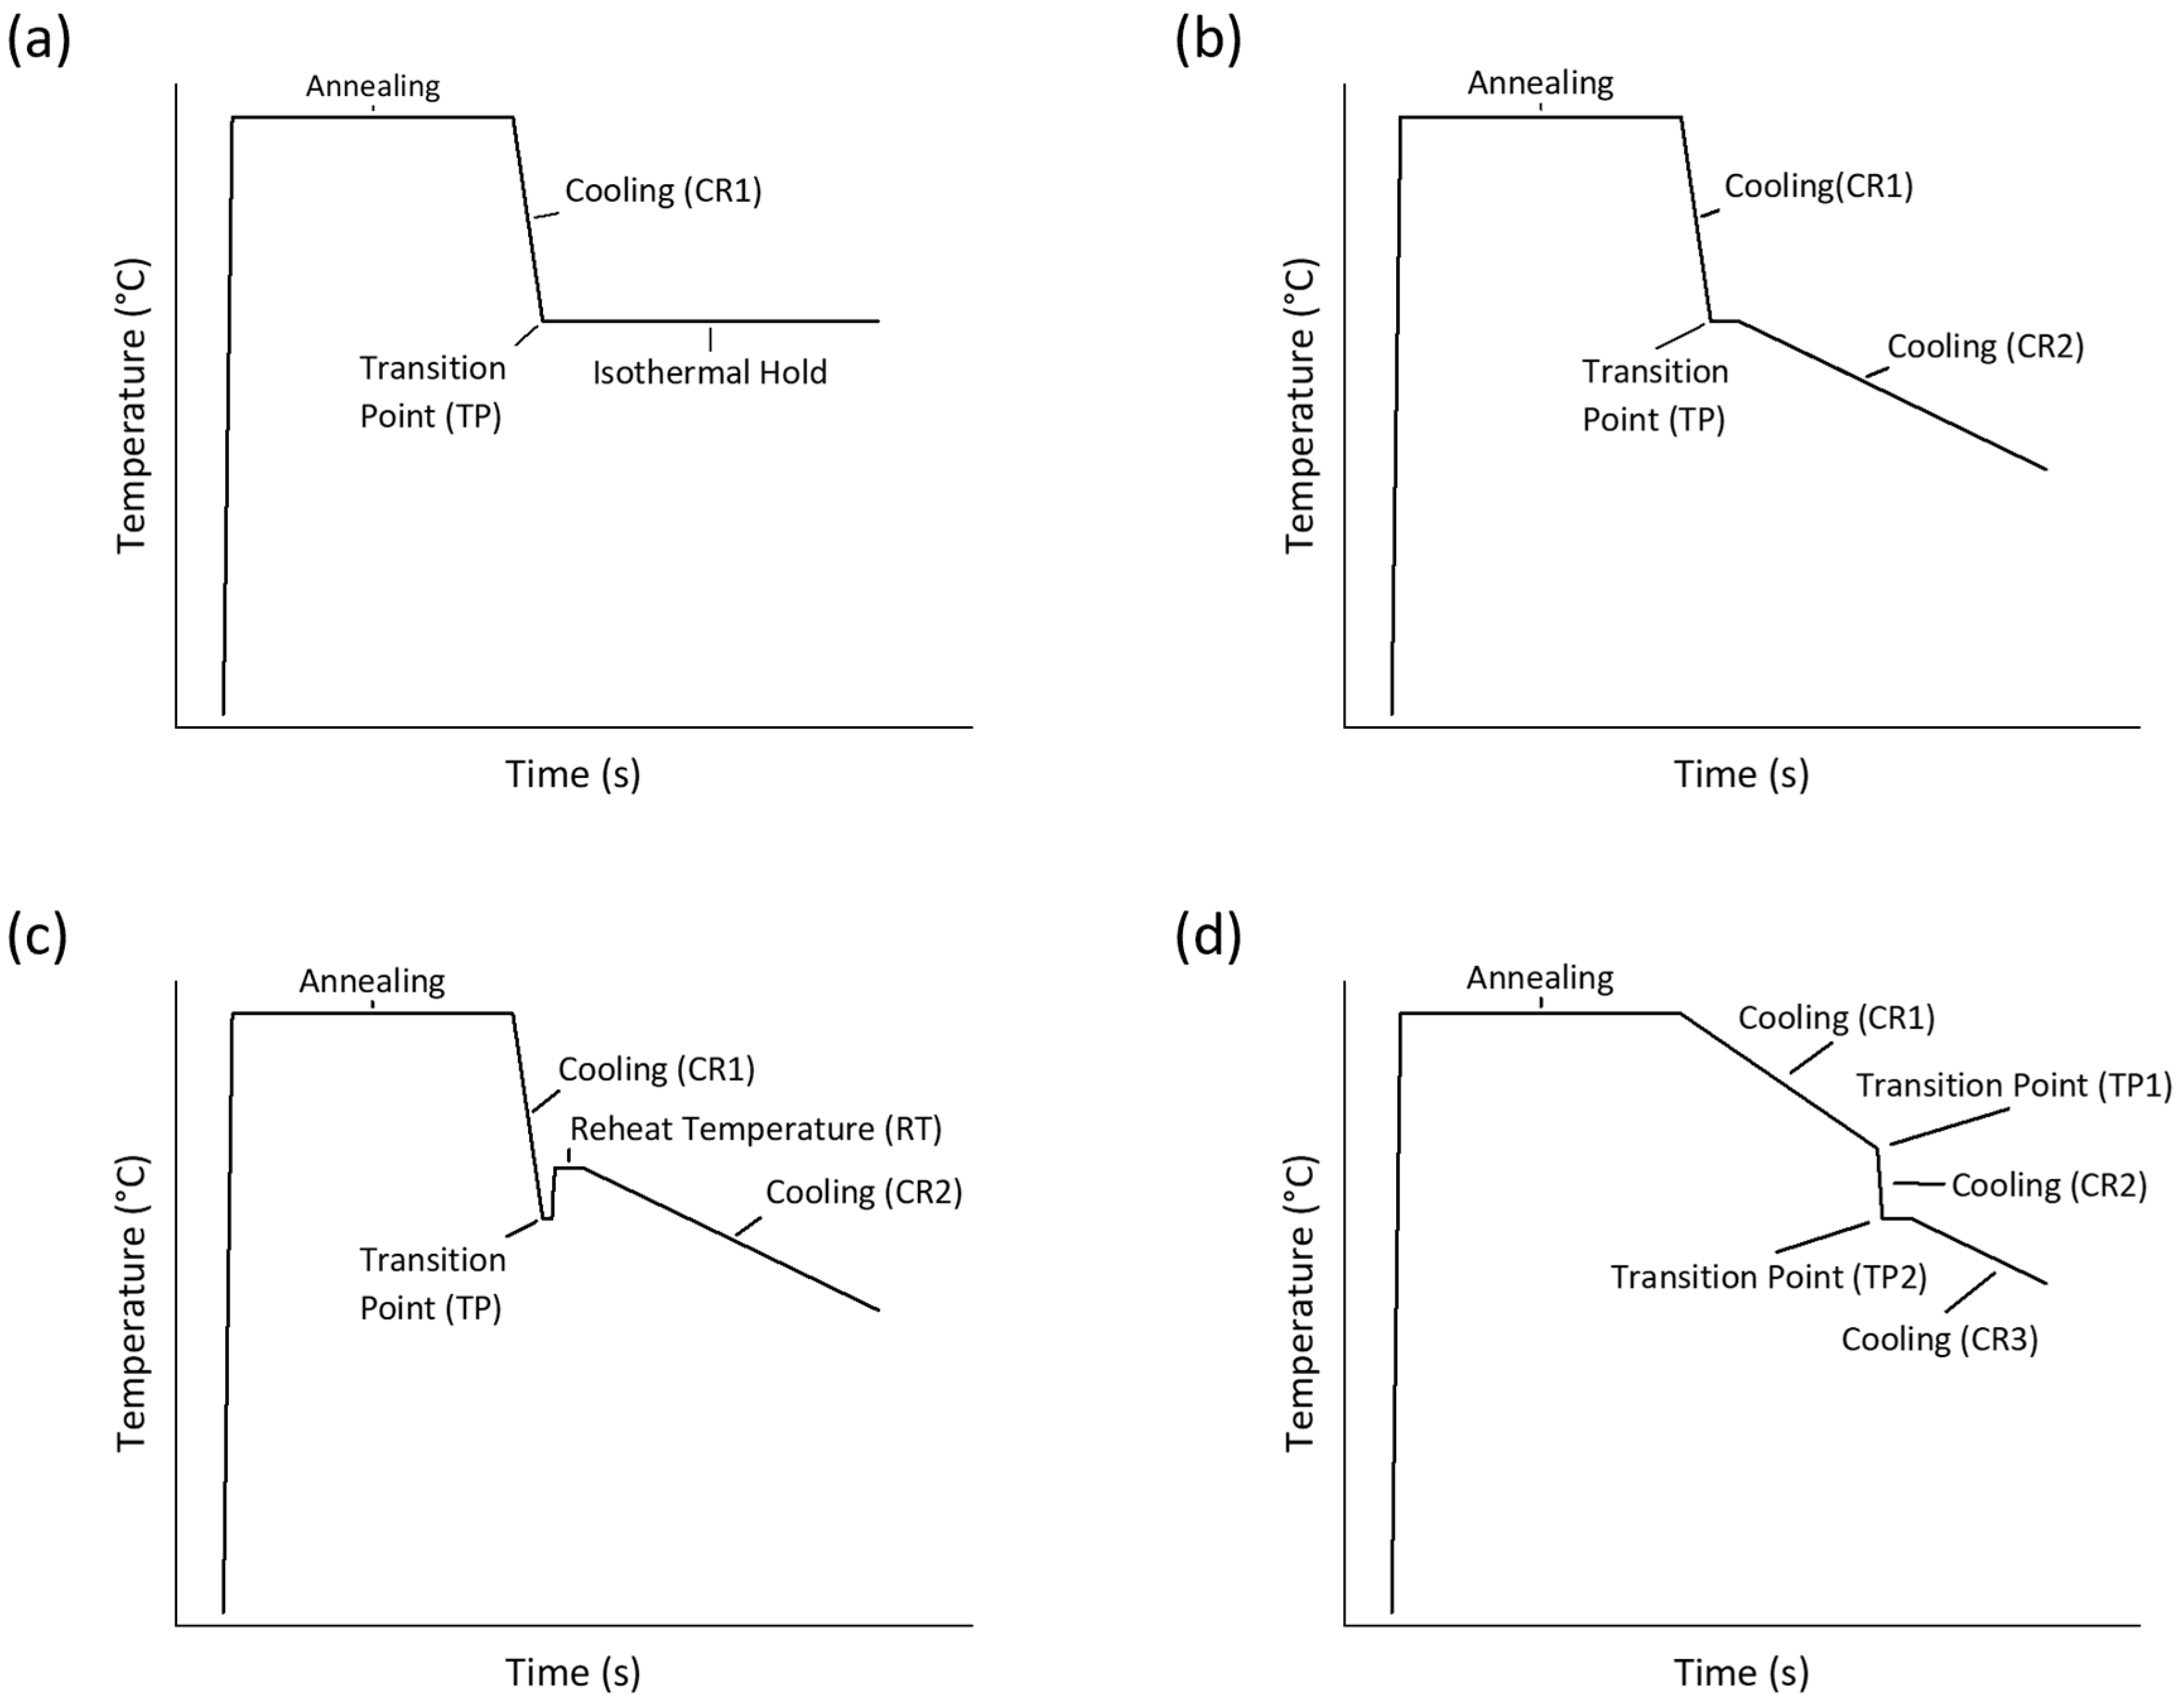
Figure 1. Schematic thermal profiles showing (a) cooling and isothermal hold transformation, (b) fast-slow cooling, (c) surface ‘bounce back’, (d) slow-fast cooling.
Metals 15 00956 g001
The TP temperatures were determined using the experimentally determined CCT diagram to achieve a range of ferrite transformation fractions before the change in cooling rate. The Ae1 and Ae3 temperatures were determined using the software ThermoCalc (version 2024.1.132110-55, Thermo-Calc Software AB, Solna, Sweden).
Samples were prepared via cutting to reveal the RD-ND face, followed by grinding and polishing. For ferrite grain size determination, samples were etched for up to 5 s with a 2% Nital solution. For prior austenite grain sizes, quenched martensitic samples were etched using Bechet and Beaujard’s etchant for between 5 and 10 min. Optical images were taken using a Keyence VHX7000 (Keyence, Osaka, Japan) and the equivalent circle diameter grain sizes were determined via contouring between 300- and 500-grain boundaries. Error bars shown for ferrite grain size data indicate the standard deviation from repeat tests with data points indicating the mean of the set, unless stated otherwise.
For dilatometry analysis, ferrite fractions were estimated using the lever rule [26,27]. The method is demonstrated in Figure 2. Since each final microstructure consists of ferrite-pearlite, the ferrite content can be estimated from the relative length change prior to pearlite formation. The measurement error determined for the ferrite transformation start and undercoolings is ±8.6 °C.

3. Results and Discussion

3.1. Austenization Behavior

During S355 production, reheat temperatures of tubes prior to controlled cooling can vary from 850 °C to 1000 °C [9]. Figure 3a shows the relative insensitivity of the austenite grain size to reheating temperature when heated for 30 min. The insensitivity to annealing temperature within the 850 °C to 1000 °C range can be attributed to Nb precipitate pinning preventing austenite grain growth [28,29]. For a normalization cycle of 950 °C for 5 min, the prior austenite grain size before cooling was determined to be 9.9 ± 0.3 µm, Figure 3b.

3.2. Continuous Cooling (CC) Transformation Behavior

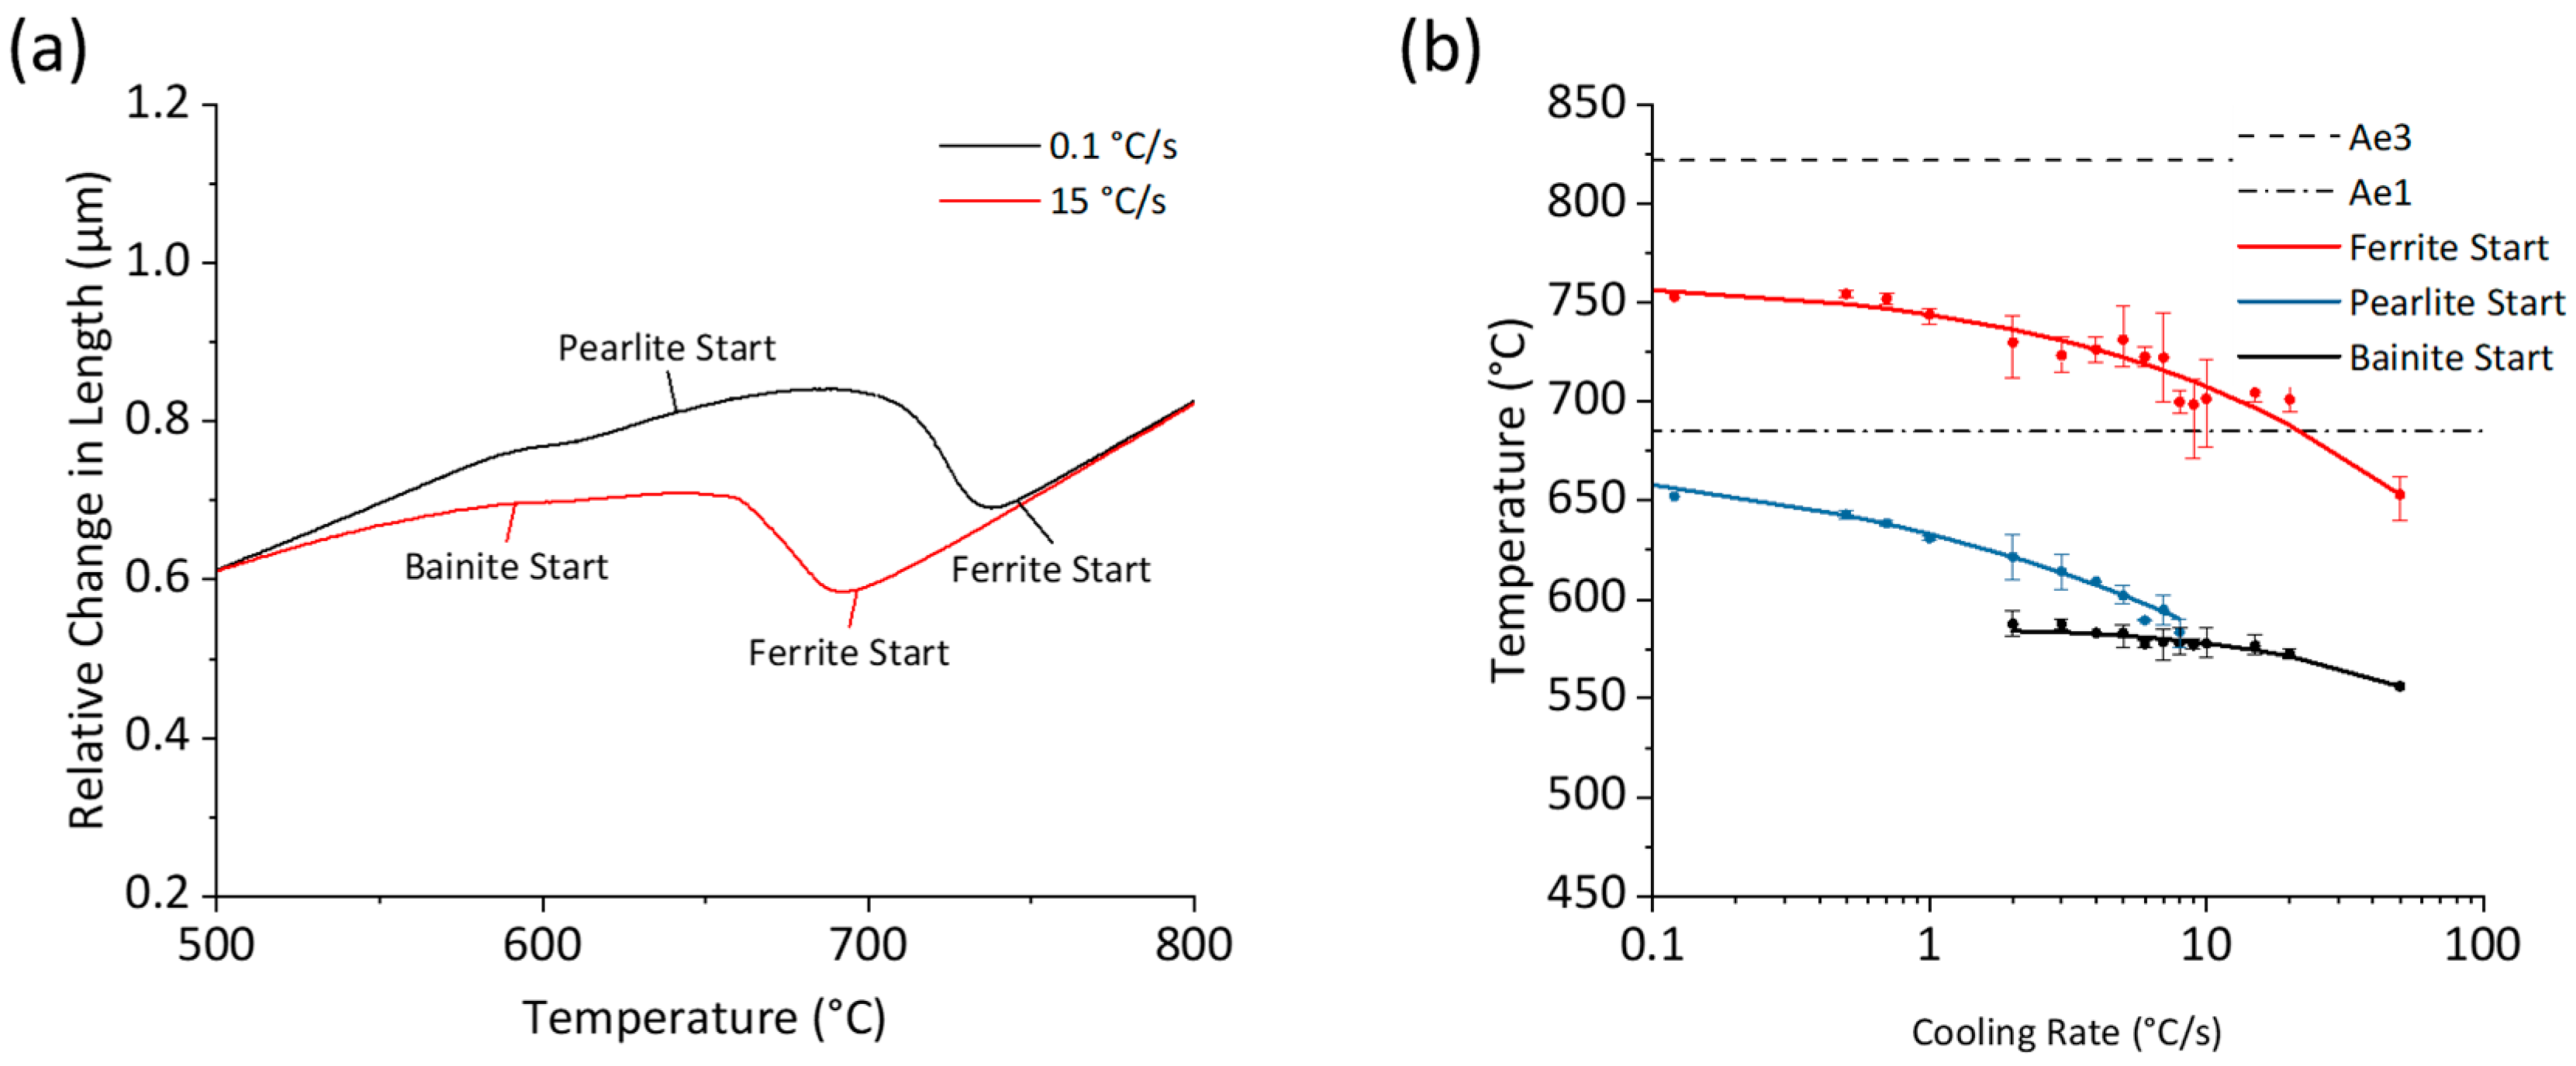
Prior to each cooling profile in the dilatometer, a 950 °C for 5 min austenization was used, which generated an average PAGS of 9.9 μm ± 0.3 μm. A 5 min austenization was chosen to replicate the industrial PAGS whilst avoiding decarburization. Figure 4a shows dilatometry curves for continuous cooling at 1 °C/s and 15 °C/s and Figure 4b shows the CCT for S355 derived experimentally from 16 continuous cooling rates with the Ae3 and Ae1 temperatures (calculated using ThermoCalc). The transformation temperature for pearlite and bainite was found using the second derivative method [30] to identify changes in transformation behavior. For cooling rates below 2 °C/s, ferrite–pearlite microstructures were observed, with ferrite–bainite microstructures present at cooling rates faster than 8 °C/s. Mixed ferrite–pearlite–bainite microstructures were observed at cooling rates between 2 °C/s and 8 °C/s.
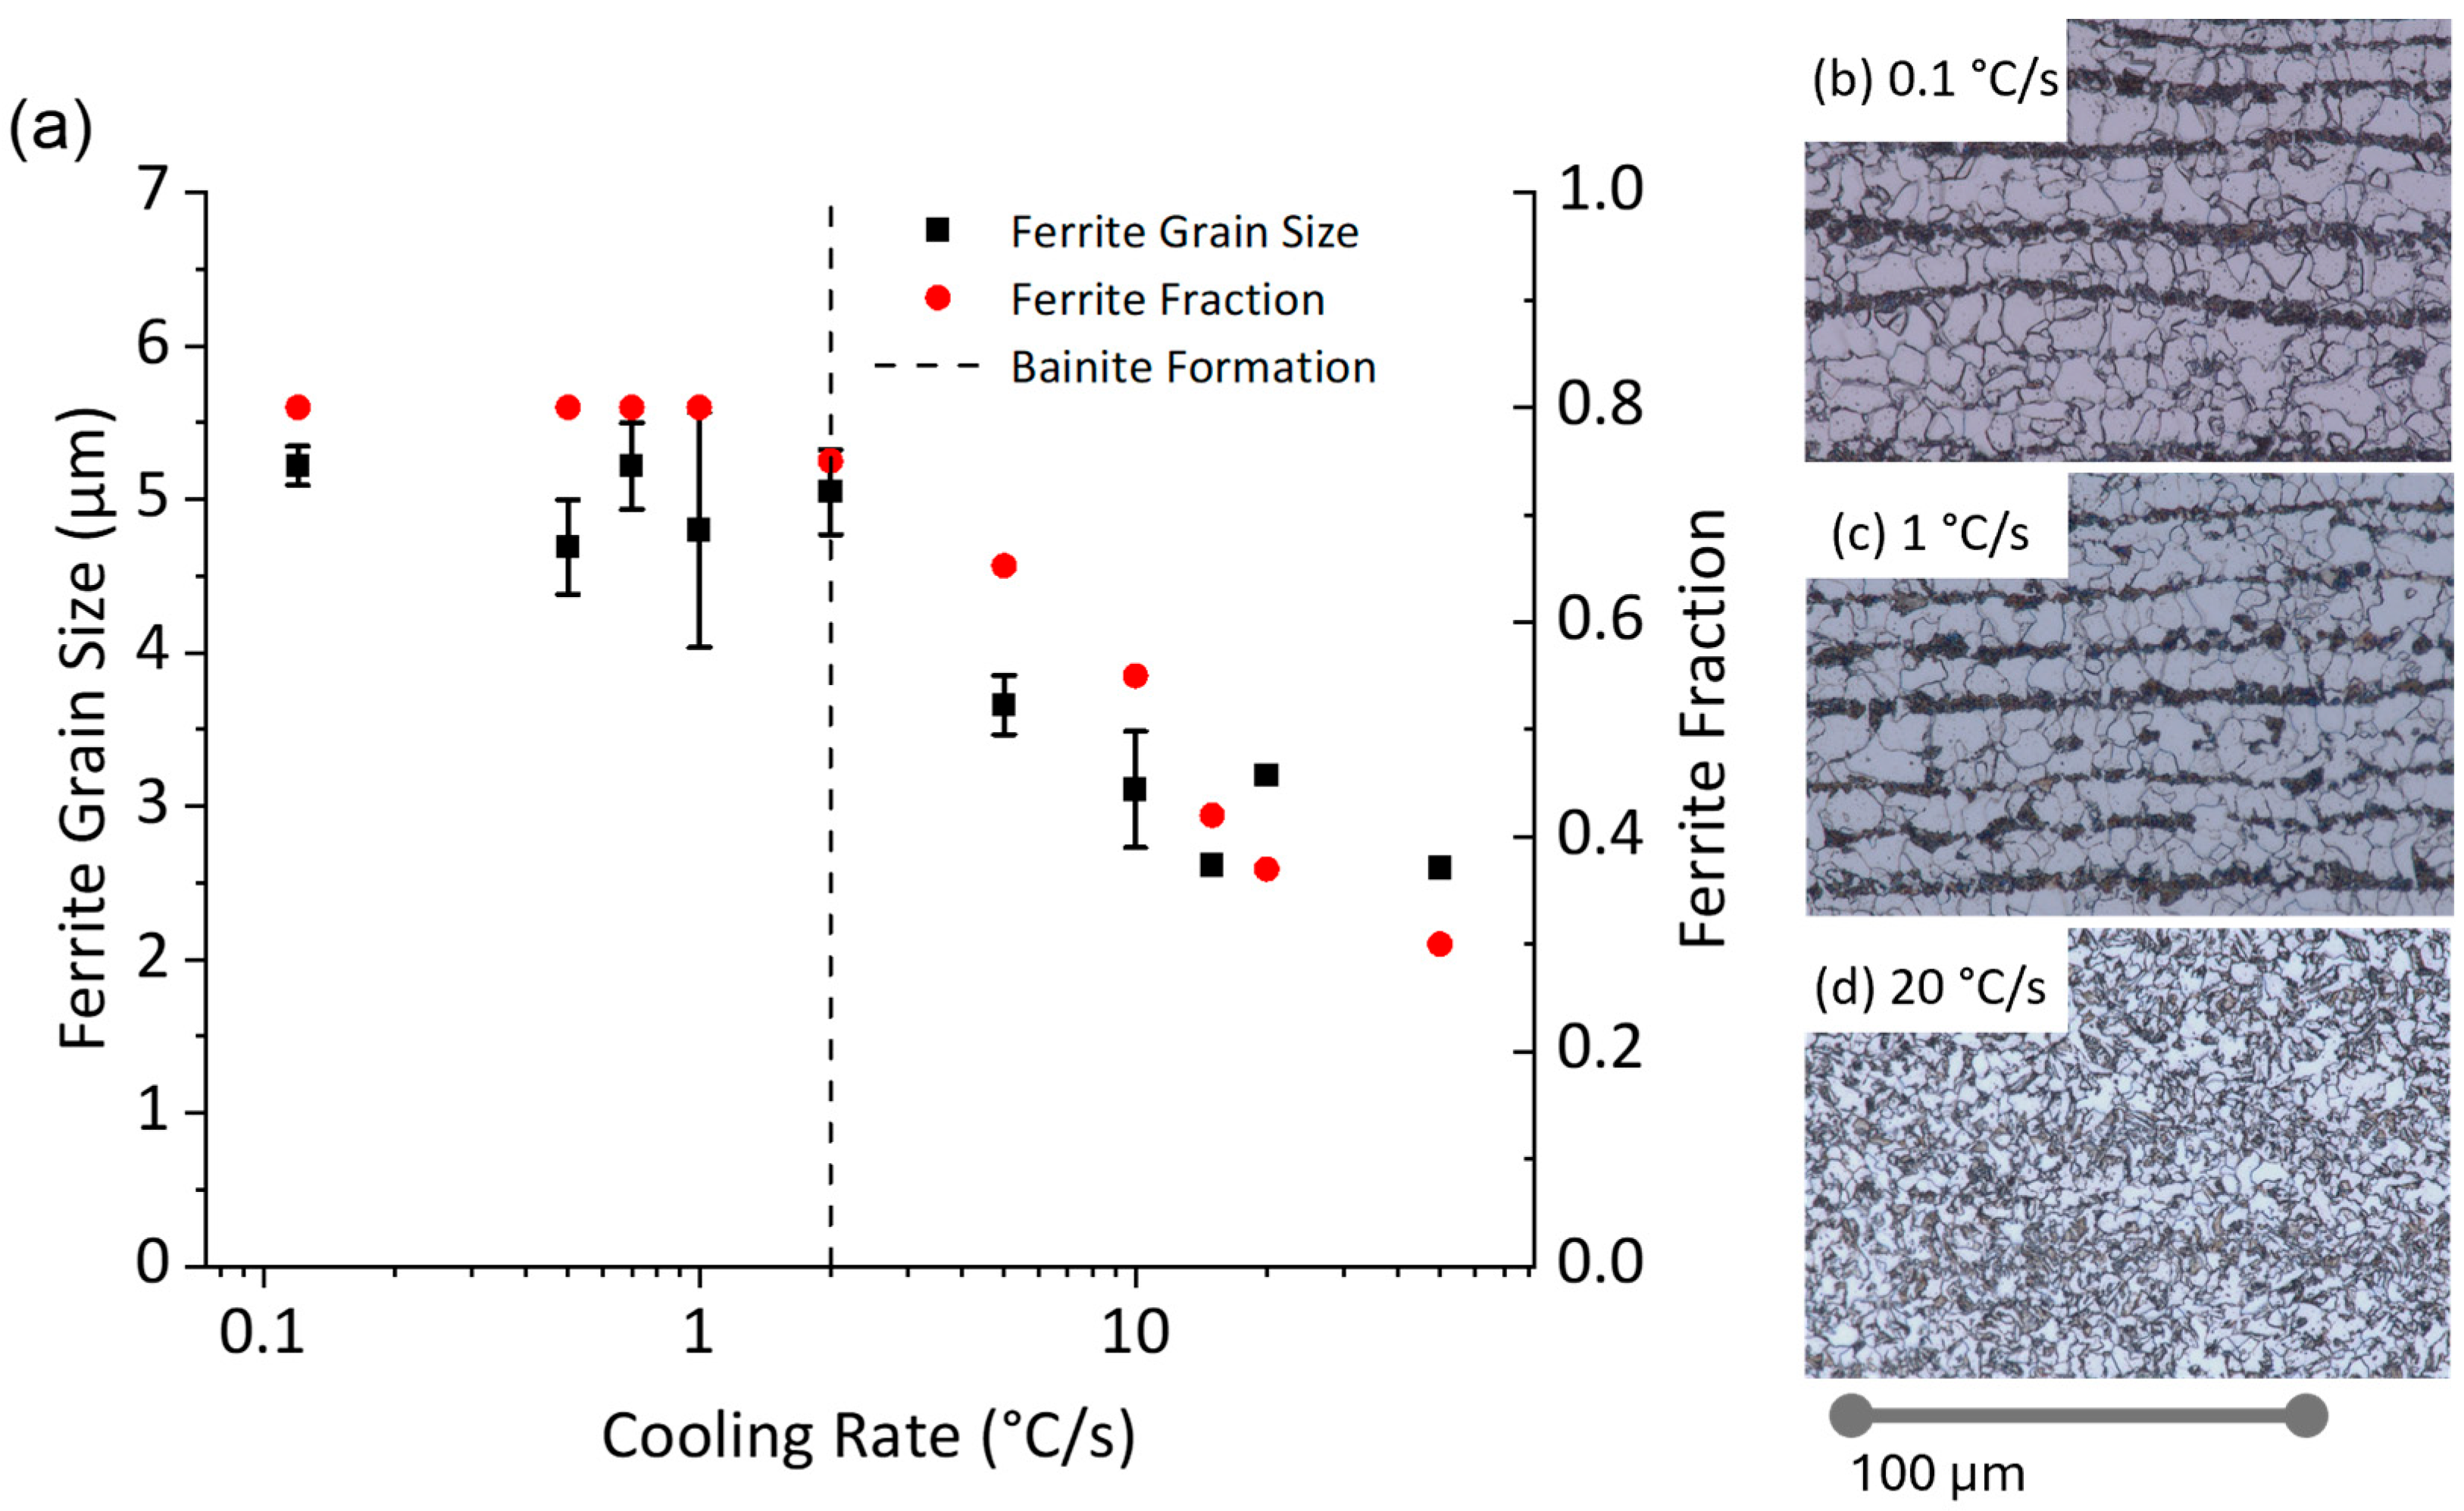
It can be seen from Figure 4b that the ferrite transformation temperature was suppressed by around 100 °C by increasing the cooling rate from 0.1 °C/s to 50 °C/s, with the increased undercooling for transformation expected to lead to increased nucleation and hence a finer grain size [19,22]. The effects of increased cooling rate during continuous cooling on the ferrite grain size are shown in Figure 5a–c. No noticeable ferrite grain size refinement was achieved through continuous cooling with an increased cooling rate from 0.12 °C/s to 1 °C/s; the microstructures can be seen at in Figure 5b,c. Ferrite grain refinement was only possible at continuous cooling rates faster than 2 °C/s; however, the ferrite–pearlite microstructure could not be maintained due to the relatively high hardenability of this material. In Figure 5d, the microstructure produced from a 20 °C/s continuous cool can be seen, where the microstructure consists of ferrite and bainite. The grain refinement achievable during continuous cooling of S355 is currently limited, which makes the recent changes to standards that allow for accelerated cooling unachievable using continuous cooling methods.

3.3. Isothermal (IH) Transformation Behavior

Isothermal transformation was investigated to understand the influence of a constant undercooling on the ferrite grain size compared to variable undercooling conditions during transformation with continuous cooling. The microstructures from the isothermal transformation tests are shown in Figure 6. An obvious grain size refinement can be seen with decreasing transformation temperature and the pearlite banding becomes less distinctive. At low undercooling, ferrite nucleation will be favored in the Mn-solute-depleted regions (solute-enriched and depleted regions being due to interdendritic segregation during casting, with the banded structure being further developed by rolling deformation) resulting in the ferrite forming in bands with carbon partitioning into the remaining austenite and hence banded pearlite. A high undercooling is sufficient to undercool both the solute-poor and rich regions, resulting in a greater number of ferrite nucleation events at all austenite grain triple points, which disrupts the banded microstructure appearance. In a similar 1.8% Mn steel, a 20 °C difference in Ae1 was measured [31].
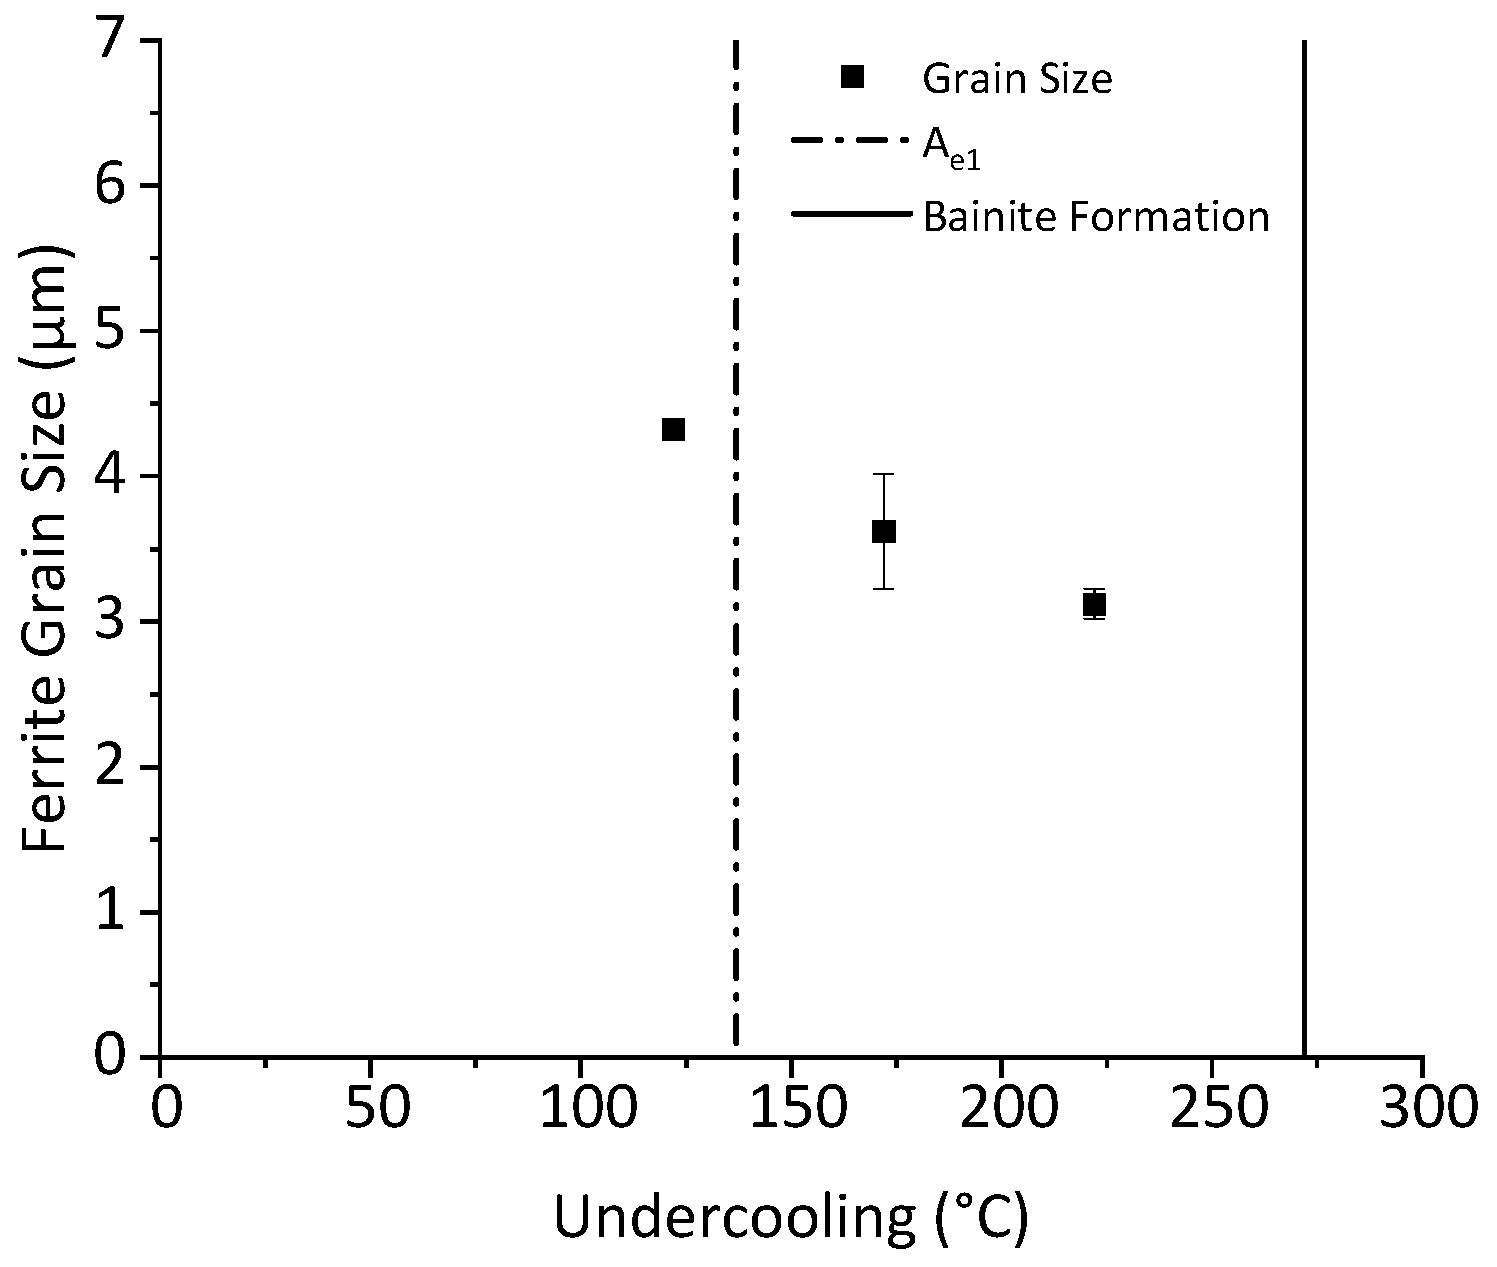
Using isothermal transformation, Figure 7 displays the final ferrite grain size produced using different undercoolings. For all the isothermal tests shown in Figure 7, the ferrite percentage formed was 80%, with the remaining area being pearlite. For the 700 °C test, a majority of the ferrite was formed during the isothermal hold, but as this temperature is above the Ae1 temperature, the remaining ferrite, to achieve 80%, formed after the hold during the slow cool at 0.5 °C/s. The other tests formed 80% ferrite during the isothermal hold. A clear trend can be seen, where increased undercooling allows for increased grain refinement whilst avoiding bainite formation.
During tube manufacturing an effective isothermal transformation with high undercooling can be achieved with initial fast water cooling followed by air cooling. However, the cooling rates achievable in industrial conditions for a thick S-grade strip (0.3 °C/s to 50 °C/s) [32,33,34,35] mean that ferrite transformation would likely occur before isothermal conditions are reached, making it important to determine the critical transformed ferrite fraction that defines the final ferrite grain size. This is considered in the next section.

3.4. Determination of Critical Ferrite Percentage

It is thought that the ferrite grain size can be determined within the first 5% to 35% of ferrite formation. Grain size is thought to be determined by the balance of early nucleation, growth, impingement and coarsening. Once nucleation sites are consumed/saturated and grain coarsening has occurred, the net number of grains should become constant. This is thought to be the critical ferrite percentage, the point at which ferrite grain size is determined.
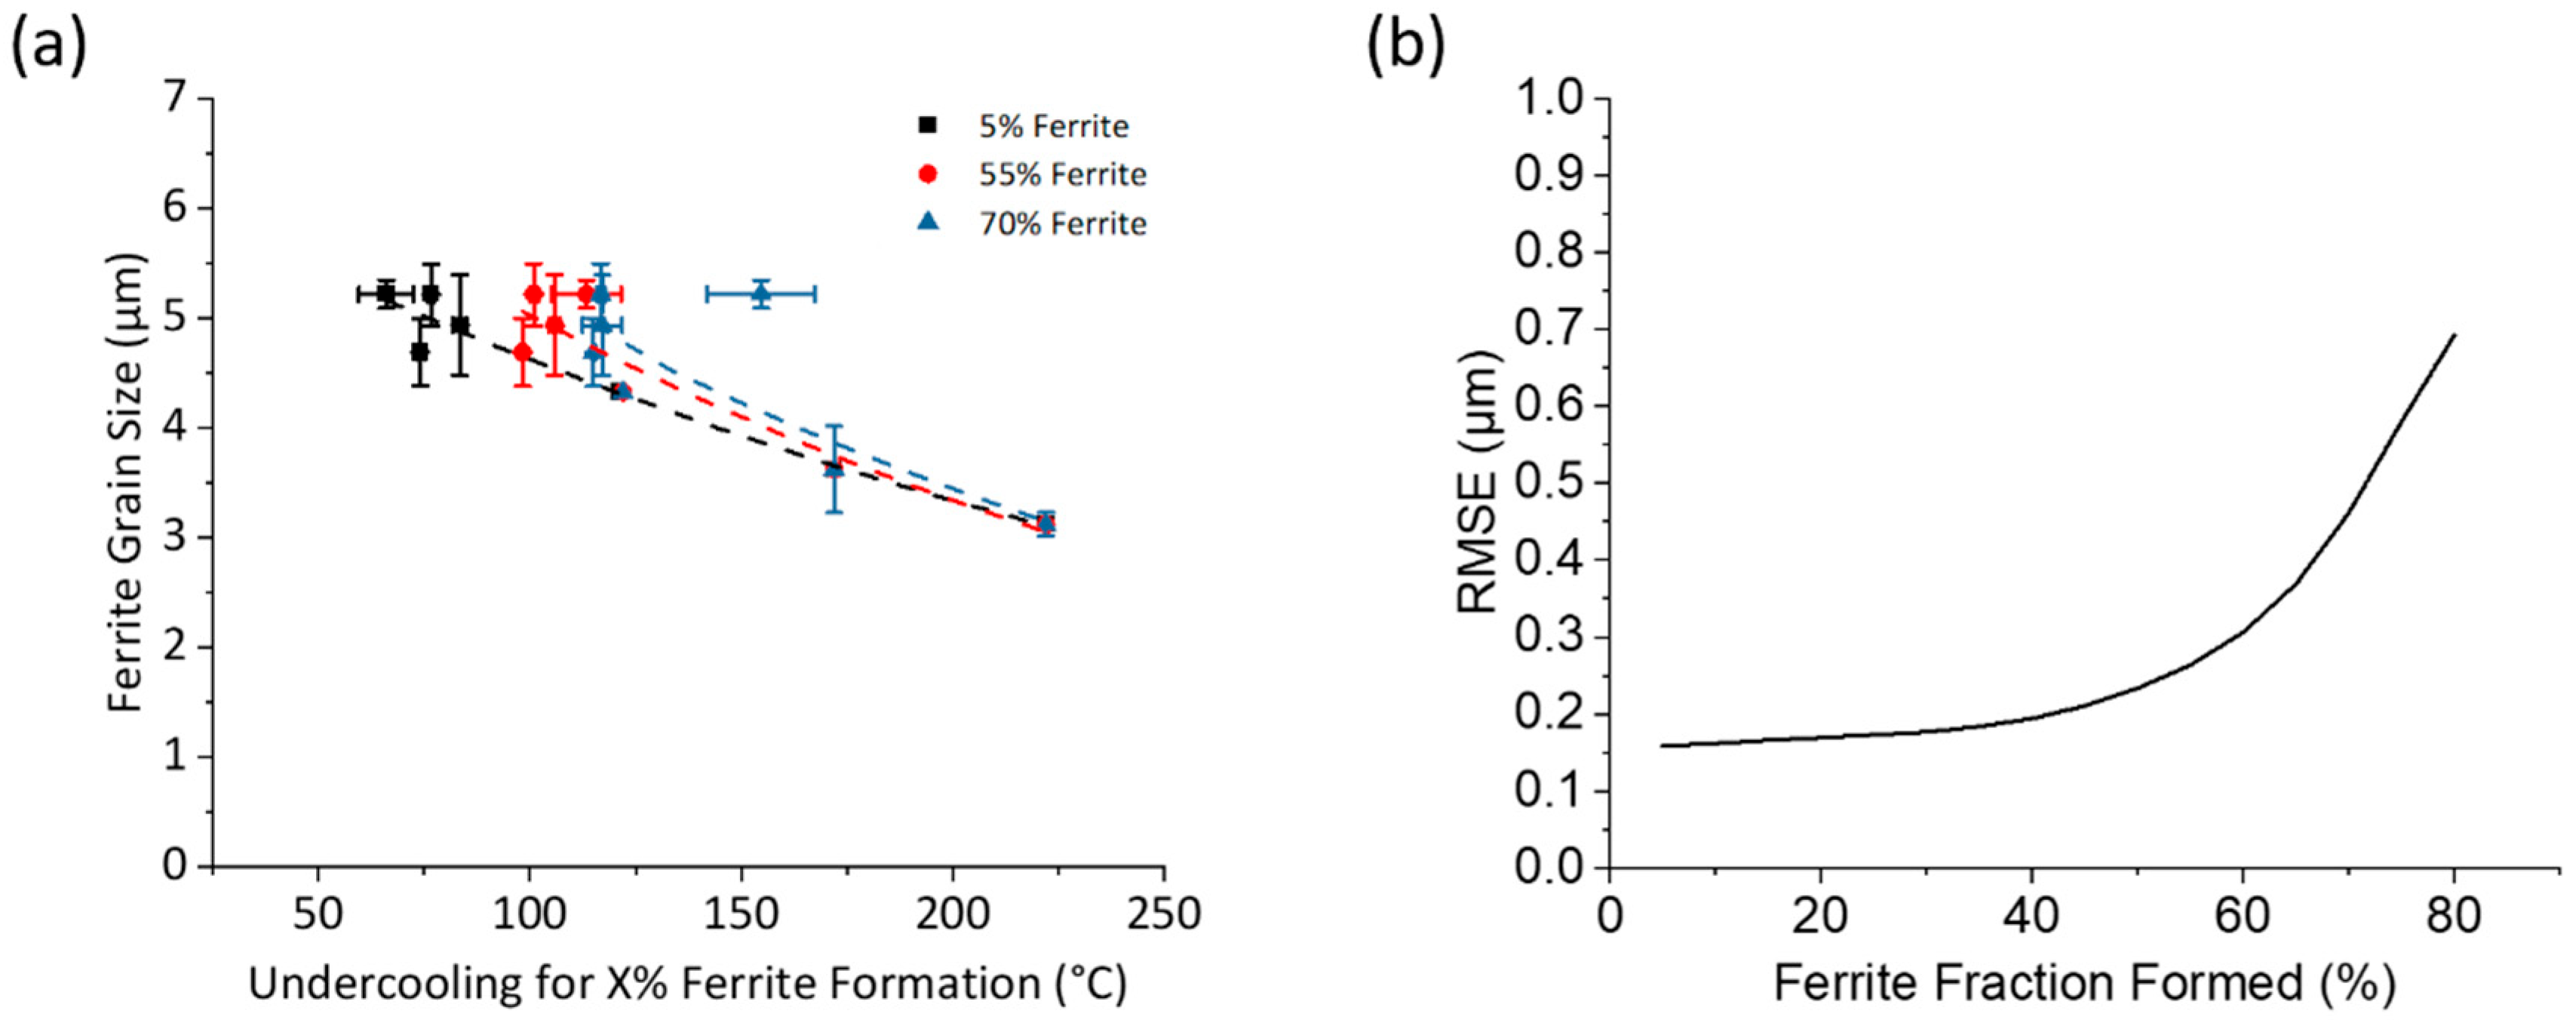
A comparison between continuous cooling and isothermal transformation was conducted. The ferrite grain size was predicted using undercooling for both continuously cooled and isothermally transformed material. To identify the critical ferrite percentage needed to establish the ferrite grain size, the transformed ferrite fraction was determined from dilatometry traces along with the undercooling (below Ae3) for that transformed amount. In Figure 8, the final ferrite grain sizes are plotted against the undercooling required to form different amounts of ferrite for all continuous cooling (CC) and isothermal holding (IH) tests. The ferrite percentages at every 5% interval have been considered, whilst the ferrite percentages chosen in Figure 8 are illustrative of the trends.
It can be seen in Figure 8a that there is scatter in the data around the best fit exponential line for all ferrite percentages considered, but a clear relationship of the ferrite grain size decreasing as the undercooling ( T ) increases can be seen in all cases. An exponential equation was used to correlate undercooling with final ferrite grain size. Unlike Equation (3), the shape of Equation (5) is better suited to undercooling. Fitting parameters of A and B are used, which unlike the fitting parameters seen in Equation (3), do not account for austenite grain size or ferrite fraction.
d α = A · exp B · T
From Figure 8a, the ferrite grain size shows a better fitting relationship with the undercooling at which 5% ferrite forms than the undercooling at which 70% forms. To quantify the correlation between ferrite grain size and undercooling to form a given percentage of ferrite, the root mean square error (RMSE) values for the exponential best fit curves have been calculated for each ferrite amount ranging from 5% to 80% in 5% increments, Figure 8b. Low scatter (low RMSE) from 5% ferrite to around 40% ferrite formed can be seen. This plateau suggests that the final ferrite grain size is determined within this range of ferrite formation, which aligns with the findings of Priestner and Hodgson, as well as Suehiro [19,25]. By determining the undercooling at which 5% to 40% ferrite transformation occurs, an accurate prediction of the final ferrite grain size can be made for both continuously cooled and isothermally transformed material.

3.5. Complex Cooling Routines

Ferrite transformation up to 40% was determined to be the most important stage for controlling the final ferrite grain size during simple cooling cases (i.e., continuous cooling and isothermal transformation). It is possible to design complex cooling curves to attain fine grain sizes in ferrite + pearlite microstructures by using initial fast cooling rates to provide high undercooling at the start of transformation (stimulating nucleation), then slow cooling for the remaining transformation to avoid bainite formation. Cooling strategies that form more or less than 40% ferrite during the initial cooling stage have been used to determine whether this is the critical amount of ferrite that must be formed during initial cooling of complex cooling to determine the final grain size.
Various complex cooling profiles, designed to simulate potential industrial conditions and ‘model’ scenarios to determine how much initial ferrite formation controls final ferrite grain size, have been tested. These profiles include cooling and isothermal hold transformation (CI), fast-slow cooling (FS), ‘bounce back’ (BB) and slow-fast cooling (SF), as shown in Figure 1. The first-stage cooling rate, CR1, and transition point (TP) temperatures were varied to attain different transformed ferrite fractions based on the CCT curve, after which the cooling conditions change. The final microstructure for all complex cooling profiles are ferrite/pearlite.
Figure 9a shows a series of SF samples where the initial cooling rate was set to 0.12 °C/s and 1 °C/s. These rates were chosen to produce a ferrite–pearlite microstructure across a full range of ferrite fractions at different TP temperatures. The results demonstrate a clear trend. For the 0.12 °C/s tests, when less than 40% ferrite was formed during the initial cooling stage (CR1), the subsequent cooling stages continued to successfully refine the grain size. However, for ferrite fractions greater than 40%, no difference in ferrite grain size was seen. For the 1 °C/s tests, the ferrite percentage at which no refinement in grain size was seen was between 40% and 60%. Figure 9b–d demonstrates this trend visually. The results suggest that once more than 40% ferrite was formed during CR1, the subsequent cooling stage had no effect, and the final grain size was comparable to that from simple, continuous cooling. This suggests that there is a window of opportunity to promote new nucleation by increasing the cooling rate (increasing undercooling) before the critical ferrite percentage is formed. After this point, the net number of grains is effectively set.
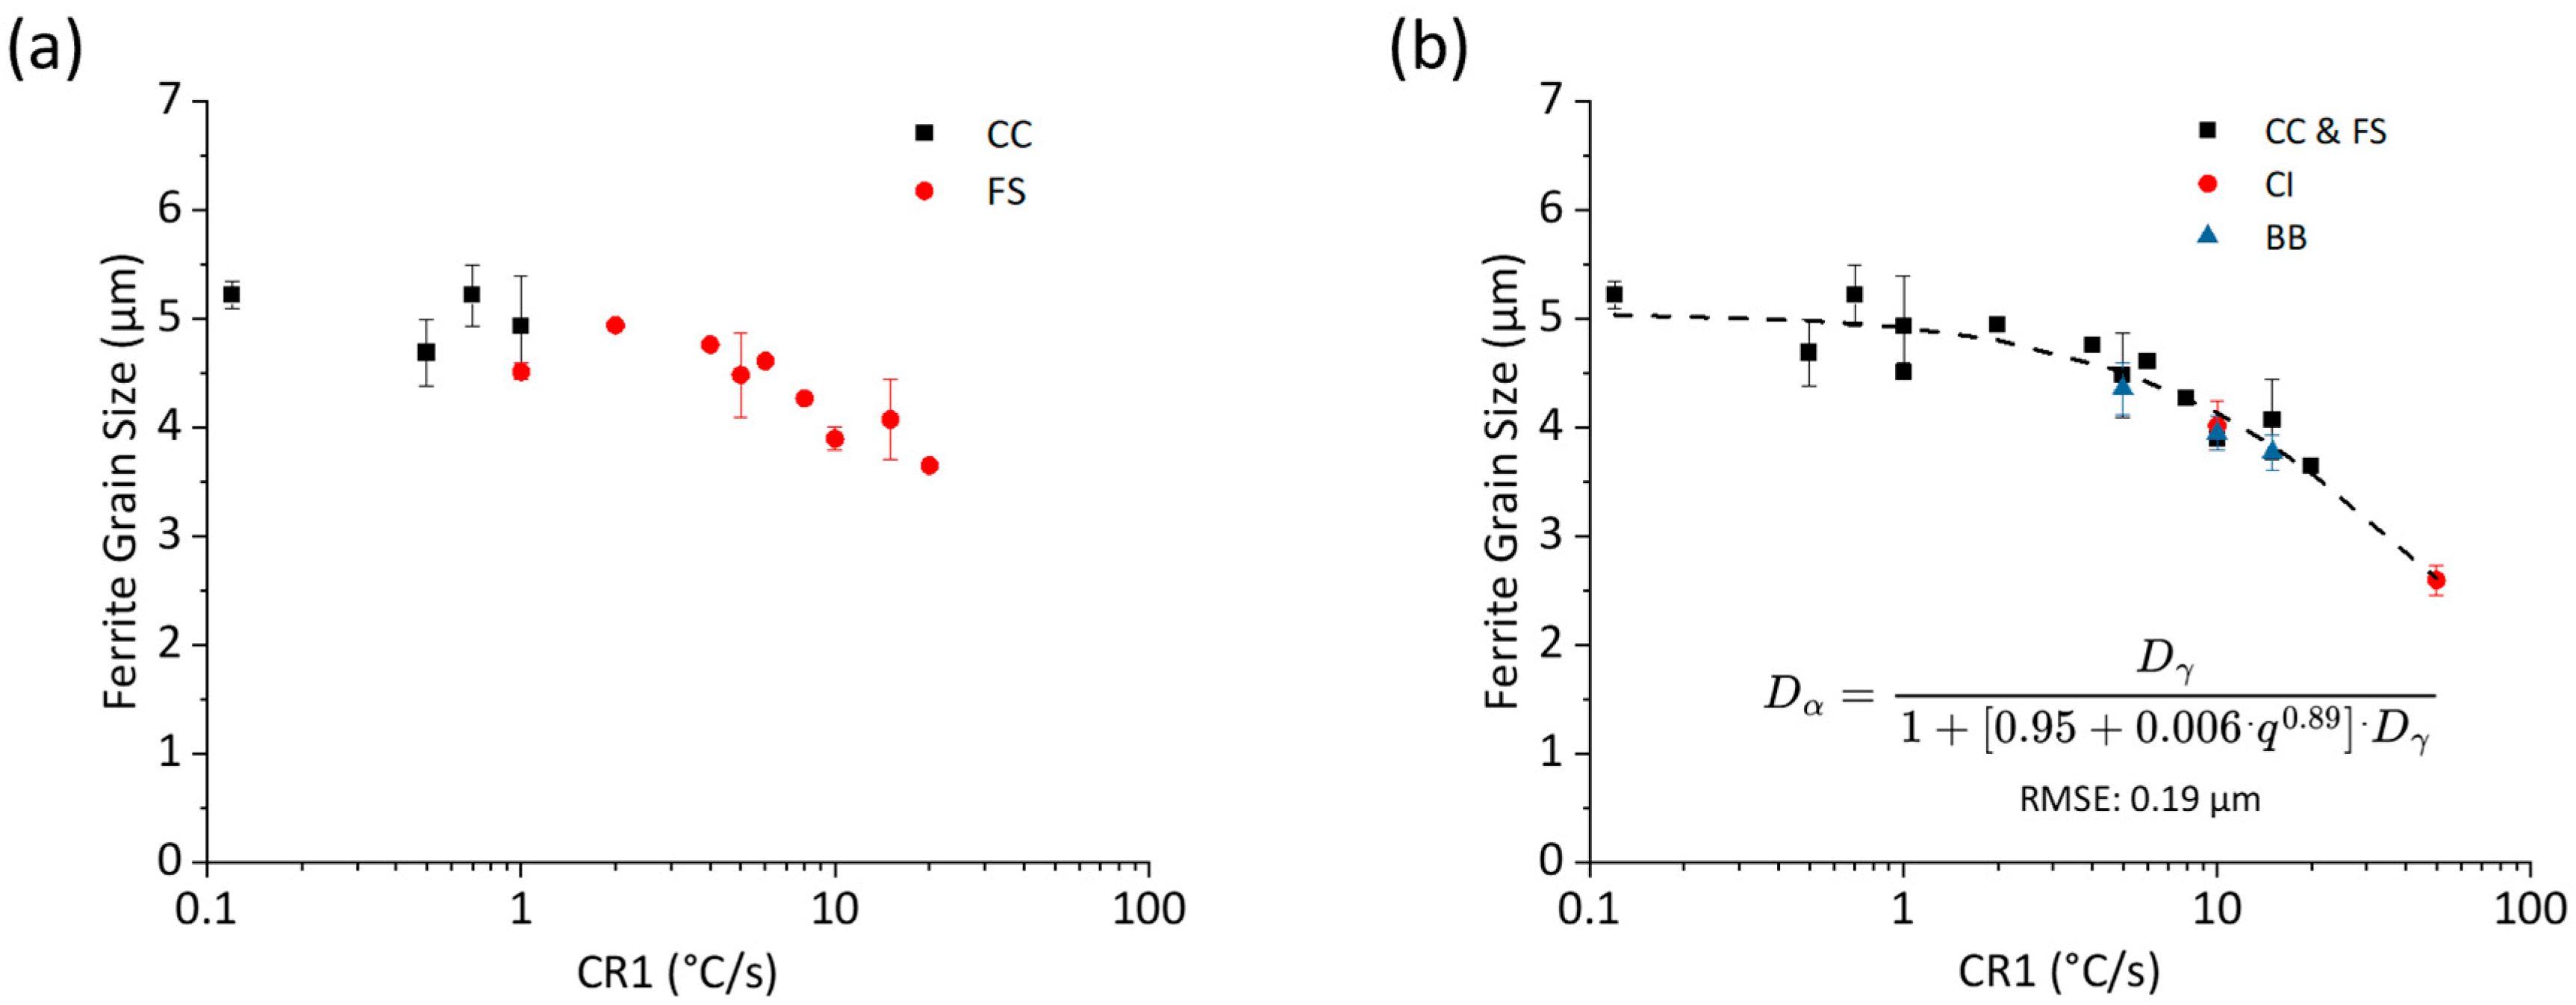
Figure 10a displays the final ferrite grain sizes from fast-slow (FS) tests, comparing them to the previous continuous cooling (CC) tests. The FS tests reveal a clear trend: the final ferrite grain size is strongly dependent on the initial cooling rate (CR1), closely matching the results from the standard CC tests. This holds true even when the amount of ferrite formed during CR1 varied between 10% and 65%. This suggests that the second, slower cooling stage in the FS profile has a limited effect on the final grain size and that no noticeable change to the balance of nucleation and growth occurs.
As shown in Figure 10b, the cooling and isothermal hold (CI) and ‘bounce back’ (BB) tests show a similar trend to the FS tests: the final ferrite grain size is primarily related to the initial cooling rate (CR1). The results show no significant difference in grain size between the FS, CI and BB tests, even when less than 40% ferrite was formed initially. This indicates that these subsequent thermal stages, whether holding, reheating or slow cooling, have a minimal effect on the balance of nucleation and growth that occurs during the critical first stage of transformation. Because these “industrially relevant” profiles (FS, CI and BB) all follow the same trend, their results can be accurately described by Equation (2). This equation demonstrates the strong relationship between the initial cooling rate (CR1) and the final grain size.
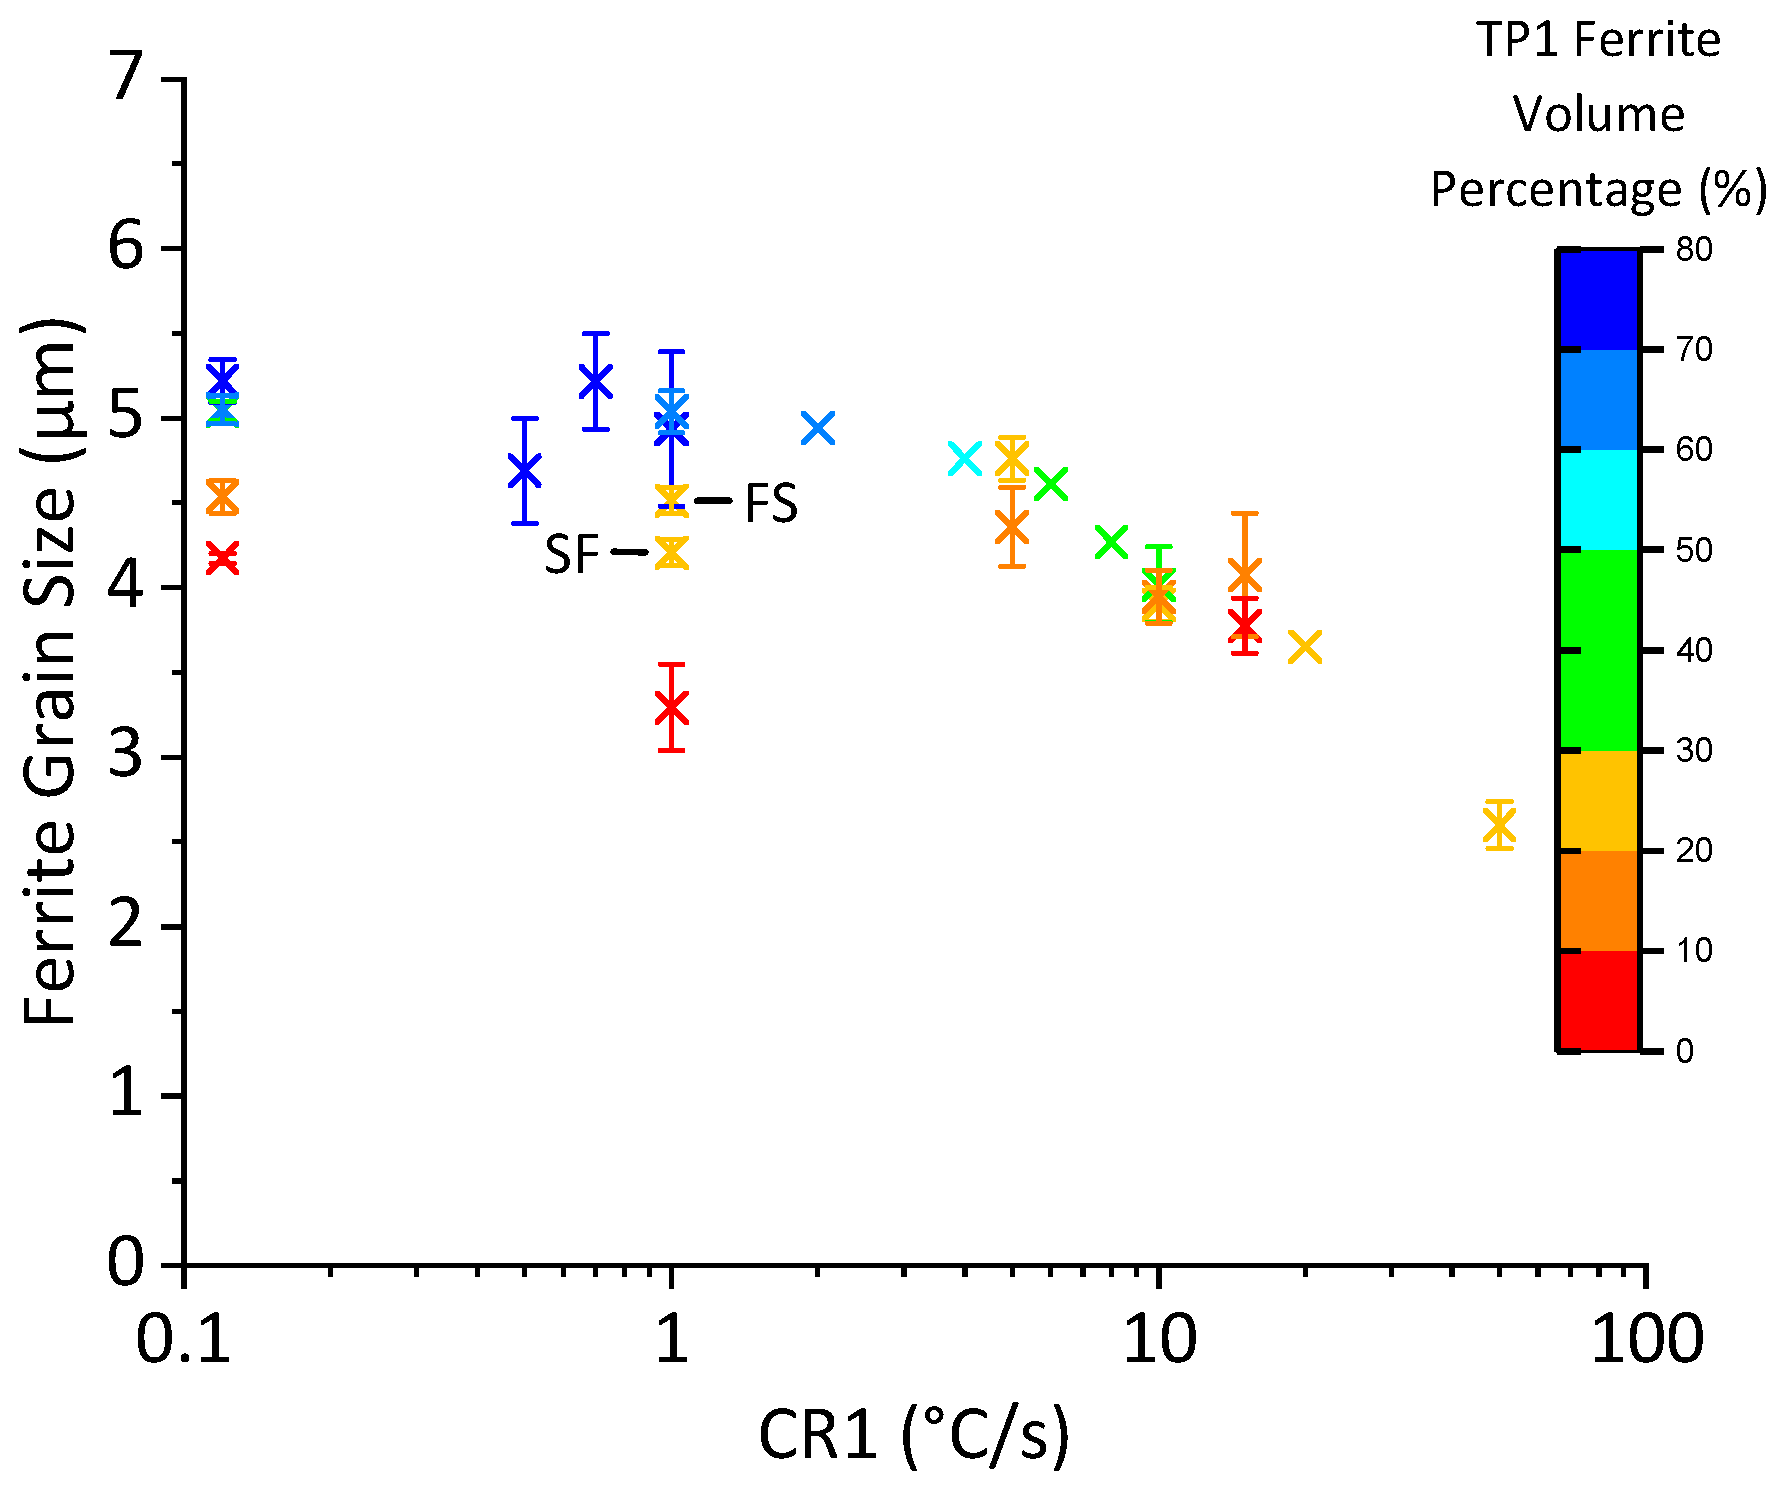
Figure 11 collates the previously shown ferrite grain size data for all complex cooling profiles and continuous cooling profiles. Each data point has been color coded according to the ferrite percentage measured at TP1. Figure 11 highlights that SF tests do not fit within the trend shown in Figure 10b, unless around 40% ferrite has been formed during CR1. Two data points are highlighted: the 1 °C/s FS and SF tests both formed around 26% ferrite during CR1. Despite forming the same amount of ferrite, the final grain sizes were different, with the FS grain size being comparable to a 1 °C/s cooling test; however, with an SF thermal profile, the grain size was refined. For the FS test, the final grain size related to the initial cooling rate and suggested no changes occurred to the balance of nucleation and growth. For the SF test, the rapid CR2 of 20 °C/s caused ferrite grain refinement and a noticeable difference in nucleation and growth behavior. This shows that a drastic change in undercooling can trigger further nucleation even after the initial transformation has begun. While most nucleation occurs at the start of transformation, rapidly increasing the cooling rate can force new grains to nucleate on less favorable sites. At the same time, the resulting low temperature slows the growth rate, protecting these new nuclei from being consumed. This change to the balance of nucleation and growth was what led to the refined grain sizes seen in the SF tests. For the FS, CI and BB tests, the amount of ferrite formed during the initial cooling stage does not appear to have had a noticeable effect on the final ferrite grain size; the latter stages were not significantly different enough to change transformation behavior in a noticeable way.
Ultimately, because the entire cooling path can influence the microstructure, predictive equations that rely only on cooling rate are not reliable for advanced controlled cooling processes. The significant deviation of the SF tests proves that the thermal profile within the first ≈40% of ferrite formation is important and that cooling rate may not be the best indicator of final grain size during controlled cooling processing.
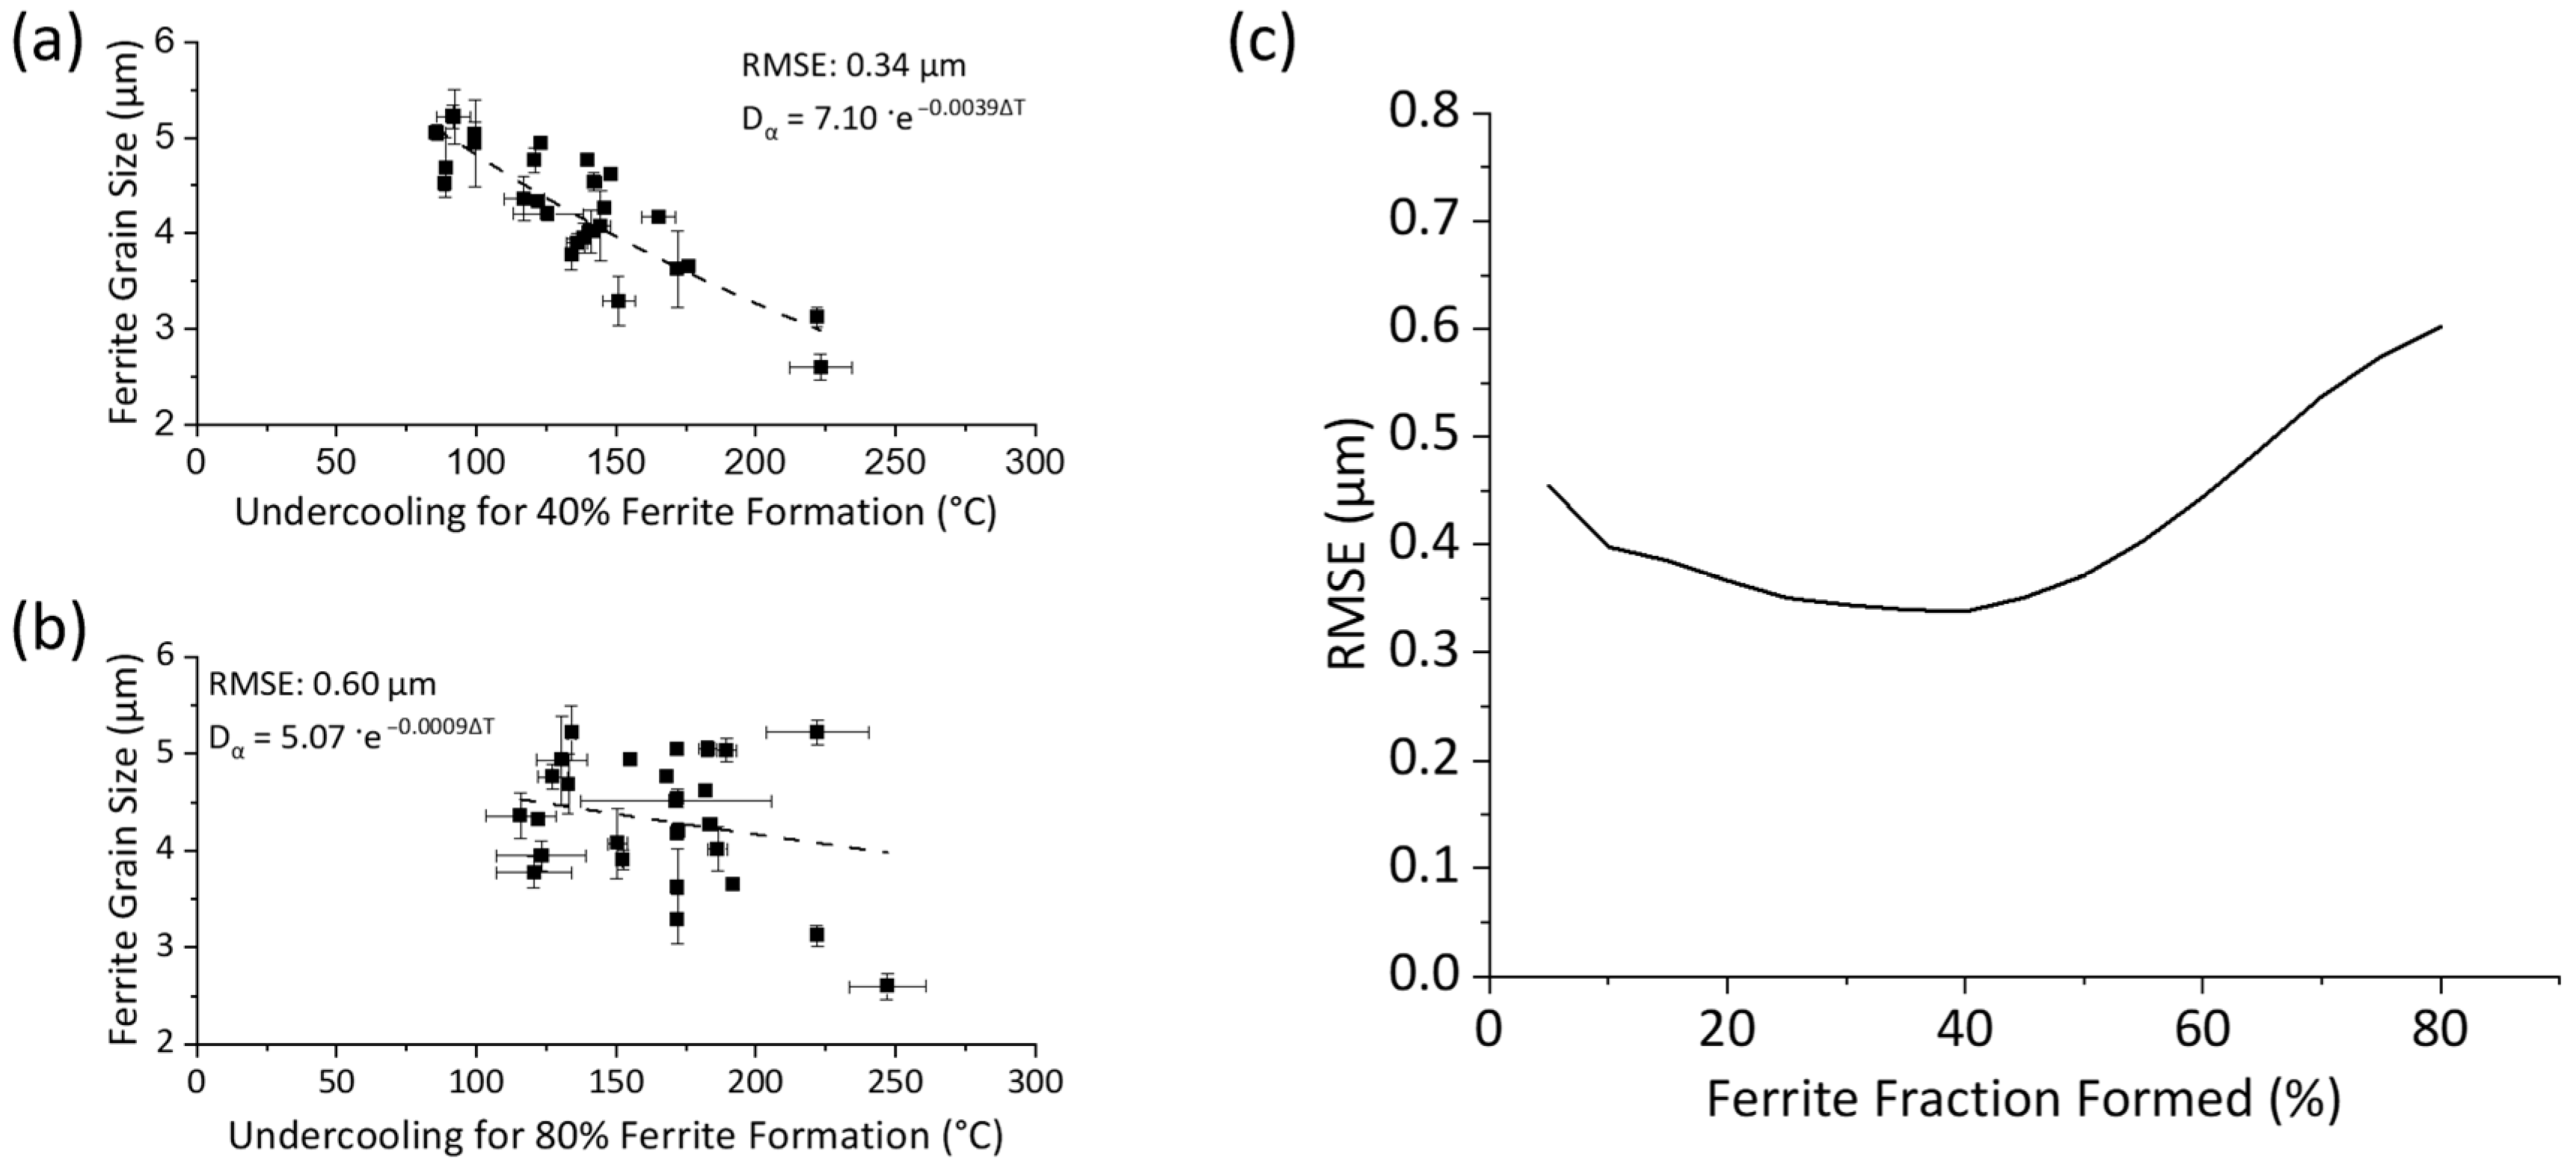
Given that “cooling rate” is an unreliable predictor for complex thermal histories, therefore undercooling is proposed as a more robust metric. Unlike cooling rate, undercooling can account for transformations that occur at a constant temperature (isothermal holds) and allows for a direct correlation between non-linear cooling profiles and the final microstructure. To test this approach, all previous data was re-assessed from the continuous, isothermal and complex cooling tests (including SF), the goal being to determine if the undercooling at which different amounts of ferrite form could provide a more accurate and universal model for predicting ferrite grain size. The results of this re-assessment are presented in Figure 12, where Figure 12a,b displays the relationship between the final ferrite grain size and undercooling at either 40% (a) or 80% (b) ferrite formation, whilst Figure 12c shows the RMSE value of each ferrite grain size against undercooling to form 5% to 80% ferrite. Each dataset has been fitted using Equation (5) to demonstrate the potential of this improved relationship.
Figure 12a,b shows that the quality of the fit varies depending on the undercooling chosen, with 40% showing a distinct relationship of increased undercoolings producing finer ferrite grain sizes. Every data point presented in this paper aligns with this trend, irrespective of the thermal profile. However, the trend is not clear when undercooling for 80% ferrite formation is chosen. The relationship between ferrite grain size and undercooling clearly depends on the ferrite percentage chosen. In Figure 12c, a distinct minimum is observed at 40% ferrite formation, indicating that the undercooling required to form 40% ferrite is a reliable predictor of the final ferrite grain size during complex cooling, given an initial austenite grain size of 10 µm. At lower ferrite fractions (<40%), the predictive ability decreases. This is caused by the SF tests, where the grain size is influenced not only by the initial transformation conditions, but by the transformation conditions until 40% ferrite is formed. At higher ferrite fractions than 40%, the ferrite grain size is poorly predicted by undercooling since complex cooling regimes can lead to fully transformed ferrite–pearlite microstructures through various paths, further complicating grain size predictions. This relationship is expected to hold as long as the chosen thermal profiles avoid bainite formation or re-austenitization. It is thought that once 40% ferrite has been formed, the final ferrite grain size can be determined, and that the subsequent thermal profile should not influence the final ferrite grain size. Prior to 40% ferrite formation, however, there remains potential to influence the ferrite grain size; this can be achieved by increasing undercooling to decrease grain size.
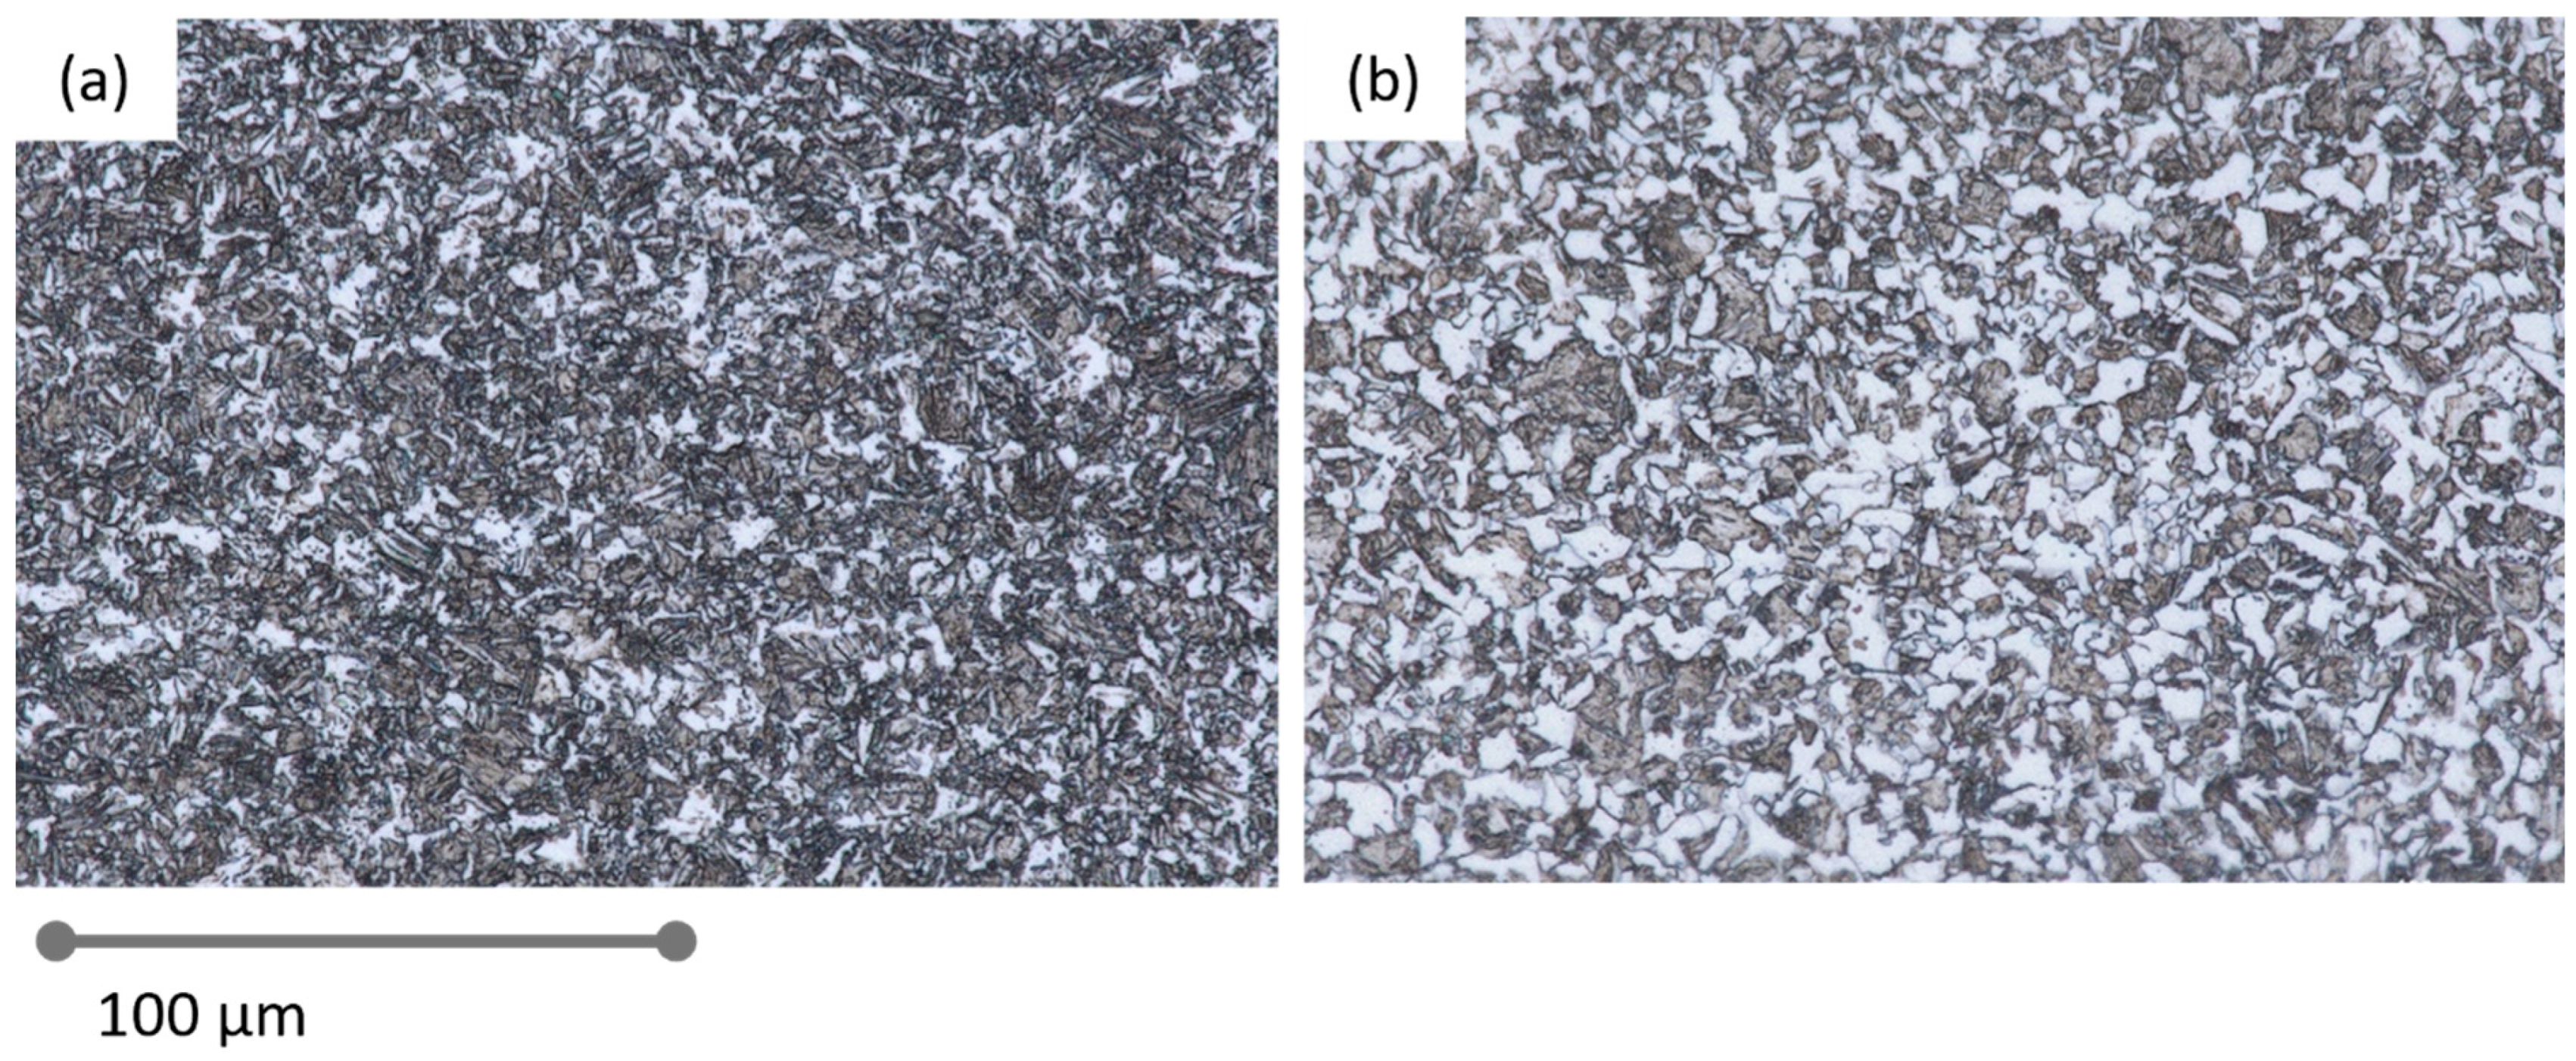
Figure 13a,b shows two ferrite–bainite/martensite microstructures, where the ferrite percentage is either 17.7% (a) or 37.4% (b). These microstructures were produced through interrupted cooling, where samples were cooled at 10 °C/s to form various amounts of ferrite and then quenched. In Figure 13a, where only 18% ferrite was formed, there are still austenite grain boundaries visible, and complete potential ferrite nucleation site saturation does not appear to have occurred. However, Figure 13b demonstrates that site saturation by complete coverage of the PAGB has mostly occurred once 37% ferrite has formed. Within the first 40% of transformation, it is likely that most ferrite nucleation and grain coarsening will occur and, beyond this point, further transformation is thought to involve ferrite growth and impingement, with little effect on the net number of ferrite grains. Therefore, within the first 40% of ferrite formation, there is an opportunity to change the ferrite nucleation and growth behavior and hence the final ferrite grain size.
This observation aligns reasonably well with the findings of Priestner and Hodgson [25], who suggested that the first 35% of a transformation is critical in determining the final grain size. They established that the net number of grains remain constant beyond 35% ferrite formation, noting that most nucleations in their structure were lost to grain coarsening, and the grain count only stabilized once 35% ferrite had formed. This phenomenon was attributed to deformation, which produced significant nucleation of unstable grains (finer than 1 µm) that subsequently impinged on boundaries and coalesced. In the present study, however, the transformation mechanisms were less complicated due to the absence of strain. Consequently, grain size determination here was likely more dependent on nucleation and early growth, with a less significant effect from grain coarsening and nucleation predominantly occurring at grain boundary sites.
This investigation identifies 40% as a critical ferrite fraction for determining the final ferrite grain size in S355 steel with an initial austenite grain size of 10 µm. A significant, and previously unreported, finding is that subsequent cooling profiles, including varying cooling rates or “bounce-back” temperature increases after 40% ferrite formation, do not influence the final ferrite grain size. Conversely, prior to 40% ferrite formation, alterations to the thermal profile are shown to impact ferrite grain size. Therefore, effective control over the initial 40% of ferrite formation is paramount for precise determination of the final ferrite grain size. These findings have direct implications for optimizing complex cooling strategies in structural hollow section steel product manufacturing. Significant grain size refinement can be achieved in ferrite–pearlite microstructures by maximizing undercooling during the initial 40% of ferrite formation. This is achievable during tube manufacturing by applying high cooling rates until 40% ferrite has formed, given that the subsequent thermal profile has negligible impact on the final grain size (provided there is no bainite formation/no re-austenitization). Consequently, optimized cooling profiles can be designed. This involves employing a low austenitization temperature (to maintain a small prior austenite grain size) and an initial rapid cooling rate (e.g., via a water-cooling section after tube reheating/shaping) to achieve high undercooling for ferrite formation. This rapid cooling can then be followed by air cooling to preclude bainite formation. Such a comprehensive strategy ensures maximal grain refinement and predictable ferrite grain size, directly correlating with enhanced strength.

4. Conclusions

This study investigated the factors influencing ferrite grain size in an EN S355-grade hot formed structural hollow section steel, specifically with a starting prior austenite grain size of 10 µm. Dilatometry tests were conducted, covering continuous cooling, isothermal transformation and complex cooling profiles (including varying cooling rates and “bounce-back” thermal profiles). The relationship between ferrite grain size and initial cooling rate, undercooling corresponding to different ferrite fractions and the influence of the cooling profile after initial ferrite formation have been revealed through this study. The practical implications in tube manufacturing processes of the findings for microstructure control of the steel product are in progress. The main conclusions are as follows:
  • Impact of Cooling Rate on Continuous Cooling: During continuous cooling, ferrite–pearlite microstructures were achieved only at cooling rates below 2 °C/s. Ferrite grain size was refined from 5.2 μm to 4.8 µm with a cooling rate increase from 0.12 °C/s to 1 °C/s.
  • Influence of Isothermal Transformation Temperature: During isothermal transformations, ferrite grain sizes were refined from 4.3 µm to 3.0 µm with a decrease in transformation temperature from 700 °C to 600 °C.
  • Early Transformation Determines Final Grain Size: During controlled cooling, the final ferrite grain size was primarily determined by the thermal profile during the first 40% of ferrite formation. The initial stage of transformation was critical for determining grain size, the thermal profile after 40% ferrite formation had a negligible effect on grain size. Therefore, to maximize refinement by stimulating nucleation and to reduce initial ferrite growth, transformation should be initiated at the lowest possible temperature. Utilizing this finding, grain refinement from 4.8 μm to 2.6 μm can be achieved by increasing the initial cooling rate from 1 °C/s to 50 °C/s with 40% ferrite undercoolings of 100 °C and 223 °C, respectively.
  • Negligible Effect of Subsequent Cooling: The thermal profile after initial cooling was found to not have a noticeable effect on the final ferrite grain size, provided 40% ferrite was formed during the initial cooling stage. This held true as long as the sample was not reheated above Ae1 or cooled to permit bainite formation.
  • Mechanism of Grain Size Determination: In ferrite–pearlite S-grade steels, ferrite grain size is thought to be determined during the early stages of transformation by the saturation or consumption of nucleation sites (i.e., austenite grain boundaries and triple points). Once these sites are saturated, the remaining transformation is primarily governed by growth and impingement.

Author Contributions

Conceptualization, N.D., C.S. and C.D.; methodology, N.D.; formal analysis, N.D.; investigation, N.D.; resources, J.D.; data curation, N.D.; writing—original draft, N.D.; writing—review and editing, C.S., J.D. and C.D.; supervision, C.S., J.D. and C.D. All authors have read and agreed to the published version of the manuscript.

Funding

This work was supported and funded via a PhD studentship from EPSRC and Tata Steel UK Ltd. EPSRC Industrial Studentship Voucher Number: 210069.

Data Availability Statement

The original contributions presented in this study are included in the article. Further inquiries can be directed to the corresponding author(s).

Acknowledgments

Support with materials and data was provided by the Tata Steel UK Hartlepool 20″ Pipe Mill. Experimental facilities have been provided by WMG (University of Warwick).

Conflicts of Interest

Author Jinlong Du was employed by the company Tata Steel UK Ltd. The remaining authors declare that the research was conducted in the absence of any commercial or financial relationships that could be construed as a potential conflict of interest.

References

  1. World-Steel-Association. World Steel in Figures 2024; Worldsteel.org; World-Steel-Association: Brussels, Belgium, 2024. [Google Scholar]
  2. BSI. Hot Finished Structural Hollow Sections of Non-Alloy and Fine Grain Steels; BSI: Boon, Germany, 2006. [Google Scholar]
  3. Tovee, J.P. Microstructural Influence on the Effects of Forward and Reverse Mechanical Deformation in Hsla X65 And X80 Linepipe Steels. In Department of Metallurgy and Materials; University of Birmingham: Birmingham, UK, 2014. [Google Scholar]
  4. Wang, Y.D.; Tang, Z.-H.; Xiao, S.-F.; Siyasiya, C.W. Effects of final rolling temperature and coiling temperature on precipitates and microstructure of high-strength low-alloy pipeline steel. J. Iron Steel Res. Int. 2022, 29, 1236–1244. [Google Scholar] [CrossRef]
  5. Kaijalainen, A.; Mourujärvi, J.; Tulonen, J.; Steen, P.; Kömi, J.I. Improvement on Impact Toughness of Cold Formed S420 Steel by Direct Quenching; Trans Tech Publications Ltd.: Bäch, Switzerland, 2021; Volume 1016, pp. 648–653. [Google Scholar]
  6. Tiwari, S.; Ahn, H.; Reddy, M.H.; Park, N.; Reddy, N.G.S. Mechanical Property Prediction of Industrial Low-Carbon Hot-Rolled Steels Using Artificial Neural Networks. Materials 2025, 18, 2966. [Google Scholar] [CrossRef]
  7. Chen, D.; Zhang, R.; Li, Y.; Li, Z.; Yuan, G. Online cooling system and improved similar self-adaptive strategy for hot-rolled seamless steel tube. ISIJ Int. 2021, 61, 2135–2142. [Google Scholar] [CrossRef]
  8. Abathun, M.Z.; Han, J.; Yu, W. Effects of manufacturing methods and production routes on residual stresses of rectangular and square hollow steel sections: A review. Arch. Civ. Mech. Eng. 2021, 21, 100. [Google Scholar] [CrossRef]
  9. Siddique, M. A Knowledge-Based System for Process Planning in a Seamless Steel Tube Plant. In Mechanical and Production Engineering; Aston University: Birmingham, UK, 1990. [Google Scholar]
  10. Manohar, P.A.; Chandra, T. Continuous cooling transformation behaviour of high strength microalloyed steels for linepipe applications. ISIJ Int. 1998, 38, 766–774. [Google Scholar] [CrossRef]
  11. Amirjani, N.; Ketabchi, M.; Eskandari, M.; Hizombor, M. Effect of cooling rate and finish rolling temperature on structure and strength of API 5LX70 linepipe steel plate. J. Mater. Eng. Perform. 2020, 29, 4275–4285. [Google Scholar] [CrossRef]
  12. Militzer, M.; Pandi, R.; Hawbolt, E.B. Ferrite nucleation and growth during continuous cooling. Metall. Mater. Trans. A 1996, 27, 1547–1556. [Google Scholar] [CrossRef]
  13. Tamura, I. Some Fundamental Steps in Thermomechanical Processing of Steels. Trans. Iron Steel Inst. Jpn. 1987, 27, 763–779. [Google Scholar] [CrossRef]
  14. Umemoto, M.; Hai Guo, Z.; Tamura, I. Effect of cooling rate on grain size of ferrite in a carbon steel. Mater. Sci. Technol. 1987, 3, 249–255. [Google Scholar] [CrossRef]
  15. Choquet, P.; Fabreque, P.; Giusti, J.; Chamont, B.; Pezant, J.N.; Blanchet, F. Mathematical Modelling of Hot Rolling of Steel; Yue, S., Ed.; Publisher: Hamilton, ON, Canada, 1990; pp. 34–43. [Google Scholar]
  16. Abe, T.; Honda, T.; Ishizaki, S.; Wada, H.; Shikanai, N.; Okita, T. Mathematical Modelling of Hot Rolling of Steel; Yue, S., Ed.; Publisher: Hamilton, ON, Canada, 1990; pp. 66–75. [Google Scholar]
  17. Militzer, M.; Giumelli, A.; Hawbolt, E.B.; Meadowcroft, T.R. Austenite and ferrite grain size evolution in plain carbon steel. In Proceedings of the Mechanical Working and Steel Processing Conference, Baltimore, MD, USA, 16–19 October 1994; American Iron and Steel Instituate: Pittsburgh, PA, USA, 1995. [Google Scholar]
  18. Siwecki, T. Modelling of microstructure evolution during recrystallization controlled rolling. ISIJ Int. 1992, 32, 368–376. [Google Scholar] [CrossRef]
  19. Suehiro, M.; Sato, K.; Tsukano, Y.; Yada, H.; Senuma, T.; Matsumura, Y. Computer Modeling of Microstructural Change and Strength of Low Carbon Steel in Hot Strip Rolling. Trans. Iron Steel Inst. Jpn. 1987, 27, 439–445. [Google Scholar] [CrossRef]
  20. Liu, D.; Fazeli, F.; Militzer, M. Modeling of Microstructure Evolution during Hot Strip Rolling of Dual Phase Steels. ISIJ Int. 2007, 47, 1789–1798. [Google Scholar] [CrossRef]
  21. Militzer, M.; Hawbolt, E.B.; Meadowcroft, T.R. Microstructural model for hot strip rolling of high-strength low-alloy steels. Metall. Mater. Trans. A 2000, 31, 1247–1259. [Google Scholar] [CrossRef]
  22. Sokolov, D.F.; Vasil’ev, A.A.; Kolbasnikov, N.G.; Sokolov, S.F. Predicting the Ferrite Grain Size in Low Alloy Steels. STEEL Transl. 2012, 42, 462–466. [Google Scholar] [CrossRef]
  23. Duan, J.; Farrugia, D.; Slater, C.; Li, Z.; Davis, C. Microstructure development during multi-pass deformation in a low carbon steel with a leaner composition, finer grain size, and higher strength. J. Mater. Res. Technol. 2025, 36, 10373–10382. [Google Scholar] [CrossRef]
  24. Chae, J.-Y.; Qin, R. Topology of the deformation of a non-uniform grain structure. ISIJ Int. 2009, 49, 115–118. [Google Scholar] [CrossRef]
  25. Priestner, R.; Hodgson, P.D. Ferrite grain coarsening during transformation of thermomechanically processed C–Mn–Nb austenite. Mater. Sci. Technol. 1992, 8, 849–854. [Google Scholar] [CrossRef]
  26. Dong, Z.; Chen, D.; Long, M.; Li, W.; Chen, H. Computation of Phase Fractions in Austenite Transformation with the Dilation Curve for Various Cooling Regimens in Continuous Casting. Metall. Mater. Trans. B 2016, 47, 1553–1564. [Google Scholar] [CrossRef]
  27. Suh, D.W.; Oh, C.S.; Han, H.N.; Kim, S.J. Dilatometric analysis of austenite decomposition considering the effect of non-isotropic volume change. Acta Mater. 2007, 55, 2659–2669. [Google Scholar] [CrossRef]
  28. Sun, L.-y.; Liu, X.; Xu, X.; Lei, S.-W.; Li, H.-G.; Zhai, Q.-J. Review on niobium application in microalloyed steel. J. Iron Steel Res. Int. 2022, 29, 1513–1525. [Google Scholar] [CrossRef]
  29. Zhang, L.C.; Wen, X.L.; Liu, Y.Z. Effect of Precipitates on austenite grain growth behavior in a low-carbon Nb-V microalloyed steel. In Materials Science Forum; Trans Tech Publication: Pfaffikon, Switzerland, 2017. [Google Scholar]
  30. Martín, S.D.; Cock, D.T.; García-Junceda, A.; Caballero, F.G.; Capdevila, C.; De Andrés, C.G. Effect of heating rate on reaustenitisation of low carbon niobium microalloyed steel. Mater. Sci. Technol. 2008, 24, 266–272. [Google Scholar] [CrossRef]
  31. Slater, C.; Bandi, B.; Dastur, P.; Davis, C. Segregation neutralised steels: Microstructural banding elimination from dual-phase steel through alloy design accounting for inherent segregation. Metall. Mater. Trans. A 2022, 53, 2286–2299. [Google Scholar] [CrossRef]
  32. Khulka, K.; Aleksandrov, S. Promising tube steels for gas pipelines. Metallurgist 2006, 50, 137–143. [Google Scholar] [CrossRef]
  33. Matrosov, Y.I.; Tskitishvili, E.O.; Popov, E.S.; Konovalov, G.N.; Kholodnyi, A.A. Accelerated cooling after controlled rolling during heavy plate pipe steel manufacture in 3600 mill at the azovstal metallurgical combine. Metallurgist 2014, 57, 837–844. [Google Scholar] [CrossRef]
  34. Matrosov, M.Y.; Efron, L.I.; Il, V.I.; Severinets, I.Y.; Lipunov, Y.I. Use of accelerated cooling to improve the mechanical and processing properties of rolled plates used to make large-diameter gas-line pipe. Metallurgist 2005, 49, 220–229. [Google Scholar] [CrossRef]
  35. Matrosov, Y.; Kichkina, A.A.; Efimov, A.A.; Efron, L.I.; Bagmet, O.A. Simulating structure-forming processes in tube steels during controlled rolling with accelerated cooling. Metallurgist 2007, 51, 367–376. [Google Scholar] [CrossRef]
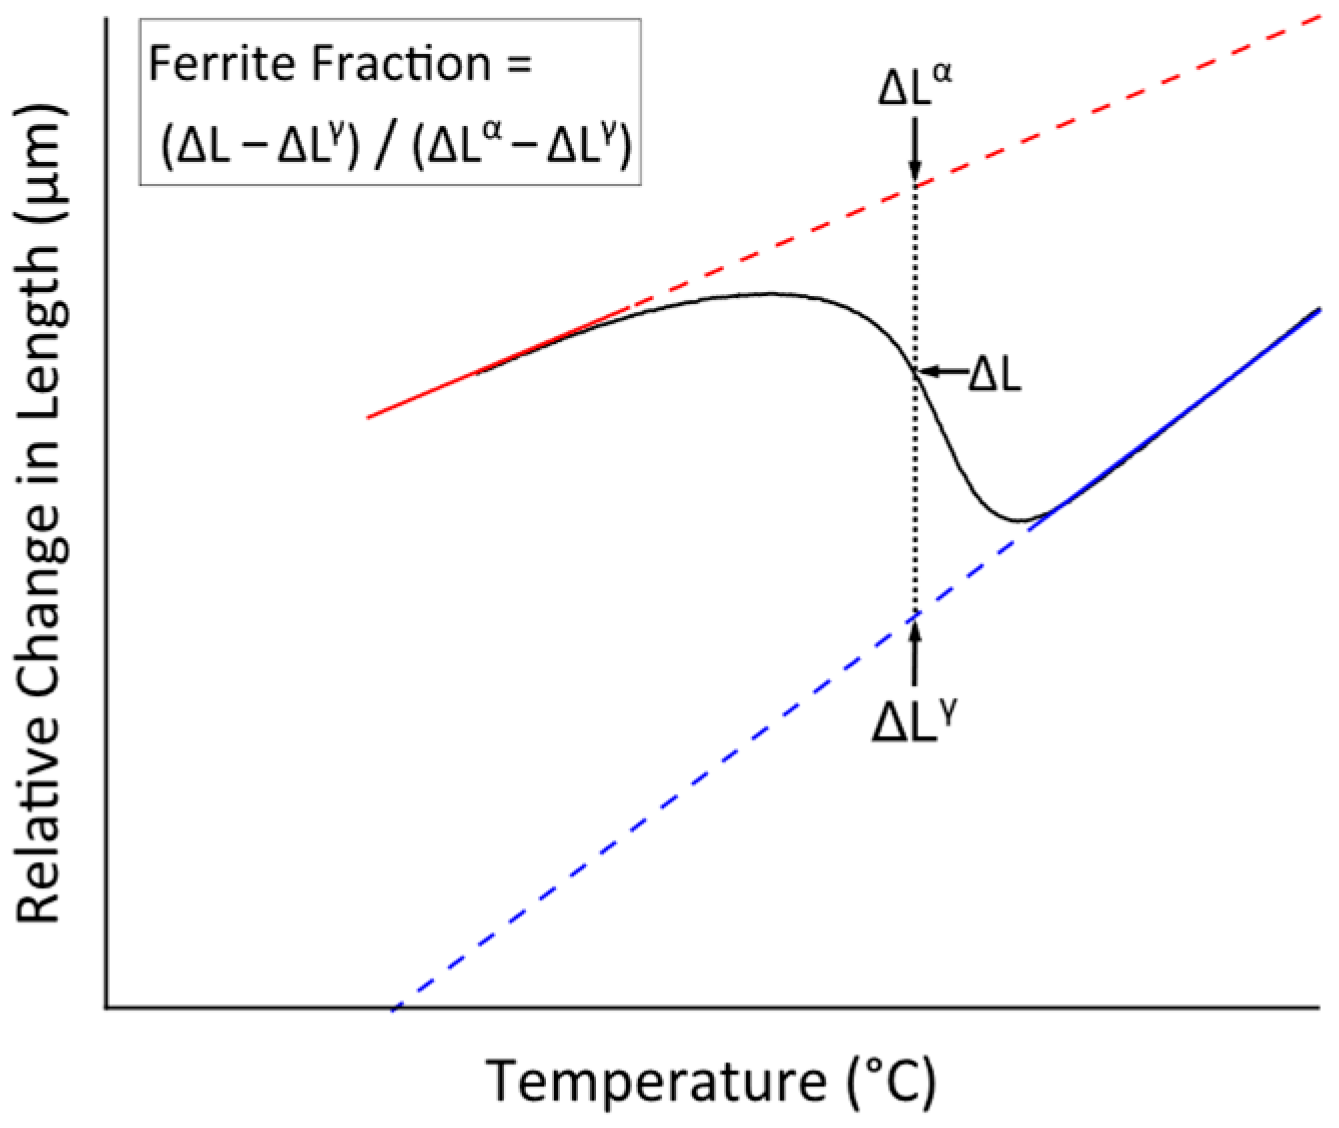
Figure 2. Schematic dilatometric curve demonstrating the attainment of ferrite fraction during transformation. Blue line indicates austenite contraction and the red line indicates ferrite-pearlite contraction.
Metals 15 00956 g002
Figure 3. (a) Austenite grain sizes produced by heat treatments at various austenization temperatures. Samples were held for 30 min. (b) Quenched martensitic microstructure showing the prior austenite grain boundaries produced from an austenitized sample at 850 °C for 30 min.
Metals 15 00956 g003
Figure 4. (a) Example dilation curves for continuously cooled tests at varying cooling rates with annotated phase starts. (b) Experimental S355 CCT diagram, including ThermoCalc-calculated Ae3 and Ae1.
Metals 15 00956 g004
Figure 5. (a) Ferrite grain sizes and ferrite fractions produced after continuous cooling. The bainite formation cooling rate is included to indicate the cooling rate at which pure ferrite–pearlite microstructures are no longer possible. (b,c) Ferrite–pearlite microstructures produced via continuous cooling transformation at (b) 0.1 °C/s, (c) 1 °C/s and (d) 20 °C/s.
Metals 15 00956 g005
Figure 6. Ferrite–pearlite microstructures for samples isothermally transformed at (a) 700 °C, (b) 650 °C, (c) 600 °C.
Metals 15 00956 g006
Figure 7. Ferrite grain sizes produced via isothermal transformation at different undercoolings.
Metals 15 00956 g007
Figure 8. (a) Ferrite grain size plotted against the undercooling required to form 5%, 55% or 70% ferrite. Undercoolings were calculated from dilatometry traces. Each graph is fitted using Equation (5) (dashed line). (b) RMSE value for ferrite grain size prediction from undercooling, plotted against the ferrite fraction. Continuous cooling and isothermal transformation data were used.
Metals 15 00956 g008
Figure 9. (a) Final ferrite grain size for slow-fast cooling and continuous cooling tests plotted against ferrite percentage. (bd) Micrographs for 1 °C/s SF tests at TP temperatures of (b) 740 °C, (c) 725 °C, (d) 700 °C.
Metals 15 00956 g009
Figure 10. Ferrite grain size against CR1 for various complex cooling profiles; previously shown results with (a) FS tests and (b) CI and BB tests. Equation (2) is fitted to industrially relevant cooling profiles, shown as the dashed line.
Metals 15 00956 g010
Figure 11. Final ferrite grain size against CR1 cooling rate, color coded by the amount of ferrite formed at TP temperature.
Metals 15 00956 g011
Figure 12. Ferrite grain size against undercooling at which (a) 40% and (b) 80% of the ferrite formed. Both plots (a,b) have been fitted using Equation (5). (c) RMSE value for ferrite grain size prediction from undercooling. Complex cooling, continuous cooling and isothermal data was used. Plotted against the ferrite fraction. γ.
Metals 15 00956 g012
Figure 13. Ferrite–bainite/martensite interrupted cooling microstructures; samples cooled at 10 °C/s and quenched at (a) 686 °C (17.7% ferrite formed) and (b) 646 °C (37.4% ferrite formed).
Metals 15 00956 g013
Table 1. Chemical composition (wt.%) for material used (industrial S355 grade).
CSiMnNb
0.150.191.400.03
Disclaimer/Publisher’s Note: The statements, opinions and data contained in all publications are solely those of the individual author(s) and contributor(s) and not of MDPI and/or the editor(s). MDPI and/or the editor(s) disclaim responsibility for any injury to people or property resulting from any ideas, methods, instructions or products referred to in the content.