Article

Kinetics of the Reduction of Iron Ore Pellets with Hydrogen: A Parametric Experimental and Modeling Study

Institute Jean Lamour, Université de Lorraine, CNRS, 54011 Nancy, France
*
Author to whom correspondence should be addressed.
Metals 2025, 15(9), 1034; https://doi.org/10.3390/met15091034
Submission received: 20 August 2025 / Revised: 14 September 2025 / Accepted: 16 September 2025 / Published: 18 September 2025
(This article belongs to the Special Issue Recent Developments and Research on Ironmaking and Steelmaking)

Abstract

The direct reduction of iron ore by hydrogen is a serious candidate for reducing greenhouse gas emissions in the iron and steelmaking industry by replacing traditional blast furnace technology. The reduction kinetics are key to this process. The present paper reports an extensive parametric study of the reduction of iron ore pellets with hydrogen that combines both experiments and modeling. A new model (modified grainy pellet model) was developed on the basis of the grainy pellet concept, the law of additive reaction times and the evolution of gas composition. The chemical kinetic constants of the three-step reduction reaction were determined from isothermal thermogravimetry experiments in the 600–900 °C temperature range. The model was then validated against laboratory-scale fixed-bed experimental results. A comparison with the experimental thermogravimetry results for a broad range of operating parameters shows the robustness of the model. The effects of temperature, gas dilution, gas flow rate, water content, pellet size, pressure, porosity, tortuosity, and specific surface area were investigated. The temperature, pellet size, pressure, gas composition and, particularly, the water content and gas flow rate have major influences on the reaction rate, in contrast to the initial porosity and specific surface area.

Graphical Abstract

1. Introduction

Hydrogen direct reduction of iron ore (H2-DR) is a promising technology for decreasing the high carbon emissions of the iron and steel industry. It relies on hydrogen rather than carbon monoxide, and it emits water vapor instead of CO2. In the H2-DR process, iron oxides are successively converted to metallic iron. The reaction proceeds in two steps below 570 °C (Equations (1) and (2bis)) and three steps above 570 °C (Equations (1)–(3)). Overall, it is a highly endothermic reaction, but it presents excellent kinetics compared to CO reduction [1].
3 F e 2 O 3 + H 2 = 2 F e 3 O 4 + H 2 O
F e 3 O 4 + 4 H 2 = 3 F e + 4 H 2 O
F e 3 O 4 + 16 19 H 2 = 60 19 F e 0.95 O + 16 19 H 2 O
F e 0.95 O + H 2 = 0.95 F e + H 2 O
These features make the hydrogen direct reduction shaft furnace (H2-DRSF) a great competitor to replace the traditional syngas shaft furnace and the blast furnace, and they explain the recent surge of interest in this technology (see, for instance, these reviews [2,3]) and the many R&D projects launched. The present work is part of the European MaxH2DR project, which intends to maximize the use of hydrogen in DR and its integration in steelmaking plants [4].
The kinetics of the reduction of iron ore pellets (10–15 mm) have been extensively studied, mostly using isothermal thermogravimetry analysis (TGA) [5,6,7,8,9,10,11,12,13,14]. The main findings concerning the kinetics are as follows:
-
The rate of reduction of a pellet is limited by different “resistances”, namely, the external mass transfer of the reactant gas from the bulk gas to the pellet surface, the diffusion of the reactant gas through the pores of the pellet, and the chemical reaction itself [15]. Oxygen solid-state diffusion in the iron layer is sometimes seen as a supplementary resistance, especially in the late stage of the reaction [16]. High temperatures and large pellet diameters promote gas diffusion control, whereas low temperatures and small pellet diameters lead to chemical control [13]. Likewise, high pressures and high temperatures also promote gas diffusion control [17].
-
The operating parameters have a major influence on the pellet reduction kinetics. Higher temperatures and pressures lead to faster reduction [10,18]. A higher gas flow rate, lower proportion of inert and lower proportion of water vapor in the gas mixture lead to faster reduction [19].
-
Suitable properties can greatly enhance the reducibility of the pellet. Smaller pellets are reduced faster because of the shorter diffusion distances [20]. Pellets with high porosity and low tortuosity are reduced faster [14], and the impact of porosity is more pronounced at higher temperatures [6]. In addition, natural hematite is more suitable than natural magnetite for reduction since the former is porous and the latter is dense [21]. The reduction is facilitated in pellets with microstructures that feature small grains and a high density of defects [22,23].
-
Models that can simulate the reduction of single pellets for a broad range of operating parameters and pellet properties are crucial for the optimization of the H2-DR process. Tsay applied a three-interface shrinking core model (3SCM) to simulate hydrogen reduction experiments with great success [24]. The three interfaces separate shells of Fe, FexO, Fe3O4, and Fe2O3. This model serves as a basis for most of the integrated models that simulate the behavior of the H2-DRSF [3]. However, SEM observations revealed that the oxides are reduced in a diffuse zone and not at sharp interfaces, as assumed in the 3SCM [1,3]. A more sophisticated model that better reflects the actual pellet structure (a porous pellet made up of small grains) is the grain model (GM) [15,25]. In principle, the GM requires numerical integration over the pellet radius. However, an approximation of the GM, which is based on the law of additive reaction times (LART), was proposed by Sohn [26]. The concept of additive reaction times is similar to the sum of mass transfer resistances in series. With a constant reduction temperature (isothermal conditions) and constant molar fractions of gas (static gas conditions), the GM-LART calculation is analytical, which considerably reduces the computation time when it is incorporated into multiparticle reactor models. Under nonisothermal and dynamic gas conditions, the GM-LART can still be applied in differential form, and the approximation made by applying the LART remains very satisfactory [26,27].
The traditional SCM, GM and GM–LART approaches cannot describe the effect of the gas flow rate on the reduction rate. Indeed, if the reactant gas flow rate is not sufficiently high compared with the quantity of oxides to be reduced, gas reactant depletion occurs in the furnace [13]. New studies tend to integrate hydrogen consumption and transport within a computational fluid dynamics (CFD) framework. This allows us to model the distribution of hydrogen and water vapor in a lab-scale reactor such as a TGA furnace [5,6,8,9] and thus to better calculate the reaction rate at each time step. However, to the best of our knowledge, no systematic study of the effects of reduction parameters, such as the gas flow rate, on the hydrogen reduction of iron ore pellets has been performed.
In this article, we report an extensive parametric study of the reduction of iron ore pellets with hydrogen on the basis of both experiments and modeling. The effects of reducing parameters such as temperature, gas dilution, gas flow rate, water content, pellet size, pressure, porosity, tortuosity, and specific surface area were investigated. The new model extends GM–LART to variable external gas conditions without resorting to CFD calculations. The kinetic constants were obtained by fitting the model to the experimental results in the range of 600–900 °C. Comparisons with the results of in-house TGA experiments, which were performed using two different devices, and partner lab-scale fixed-bed experiments show that the model can describe the reduction of pellets in a broad range of experimental conditions.

2. Materials and Methods

2.1. Raw Materials

Commercial DR-grade pellets from Vale, Brazil, were used. The pellets were carefully chosen to have a spherical shape and no surface cracks. Sampling and characterization of the pellets were performed by our partner Tata Steel (IJmuiden, Netherlands) within the MaxH2DR project, and the results of the chemical analysis are given in Table 1. An arbitrary diameter of 13 mm (approximately 4 g in mass) was chosen to separate the sets into small pellets D1 and large pellets D2. The initial porosity was measured by mercury intrusion ( ε = 0.295 ) and the initial specific surface area by krypton adsorption ( a s p = 60.4 m2 kg−1).
Hydrogen was produced on site using a lab-scale water electrolyzer, LNI Swissgas model HG PRO 4000 LN, with a purity >99.99999%.

2.2. TGA Devices

Iron ore pellet reduction experiments were carried out using two different TGA devices under isothermal conditions (Figure 1).
The main TGA device used in this study was a SETARAM thermobalance, model TG96. It can carry large pellets of up to 10 g. For each experiment, the sample (one pellet) was placed in a wired platinum basket and preheated to the desired temperature under a given helium flow rate. For reduction experiments in pure H2, the helium valve was then closed, and pure hydrogen was injected at the same flow rate. For reduction experiments in H2-He mixtures, the helium valve was kept open, and hydrogen was added at a given flow rate. Cooling was performed under a helium atmosphere.
A second TGA device was used to add water vapor to the gas mixture (Netzsch Jupiter, Figure 1b). As with the TG96 device, preheating and cooling were performed under a helium atmosphere. Then, the helium valve was closed, and reduction proceeded under H2/H2O. In contrast to the TG96 device, the pellet was placed on a dense alumina pan and not in a permeable basket: during reduction, the bottom part of the pellet was more difficult to access for the reducing gas. On the reduction curves, this translated into a brutal slowdown of the reduction at approximately 95% conversion; thus, when comparing the experimental and simulated curves for this device, conversion degrees greater than 95% were not considered.
The reproducibility of the reduction of pellets was assessed for the TG96 device, the Jupiter device, and both devices. In the latter case, reduction proceeded in the same manner until a conversion degree of 95% was reached for the reasons mentioned above. The repeatability was also checked, e.g., for a series of 5 identical runs at 900 °C with TG96, the times to reach 50% of conversion were 6.03 ± 0.55   m i n and to 90% of conversion 16.86 ± 1.19   m i n , which means a relative standard deviation below 10%.

2.3. Limits of Isothermal and Static Gas TGA

An isothermal TGA setup is used to provide a controlled atmosphere for the reduction of the samples, that is, isothermal and static gas conditions. However, previous studies have shown that the reduction of iron ore pellets could lead to the depletion of the gas reactant at low flow rates [8,13,29]. On the one hand, reduction is greatly hindered by reactant depletion, and the determination of the reaction kinetics from the experiment is biased; on the other hand, the mechanism of the reaction itself may change, e.g., the kinetics of the first and third subreactions become limited by nucleation and growth mechanisms [30]. Moreover, temperature gradients may appear in the pellet [31], especially for large diameters and low flow rates. However, the difference in terms of reduction efficiency is not as sensitive as it is for the evolution of the gas composition and was thus neglected in the model presented below, which considers the isothermal reduction of the pellets in a changing gas atmosphere (dynamic conditions).

2.4. Modified Grainy Pellet Model (MGPM)

On the basis of a previous GM–LART model from our research group [32], we developed a new model, the modified grainy pellet model (MGPM), which simulates the reduction of a single iron ore pellet in an atmosphere with a dynamic bulk gas composition. To this end, the TGA furnace was discretized in time and space. The corresponding in-house code was written in Python (version 3.9). The core features of the model are as follows:
-
The model describes the reduction of a spherical iron ore pellet in a gas mixture (H2, H2O, He, and N2) at T > 570 °C.
-
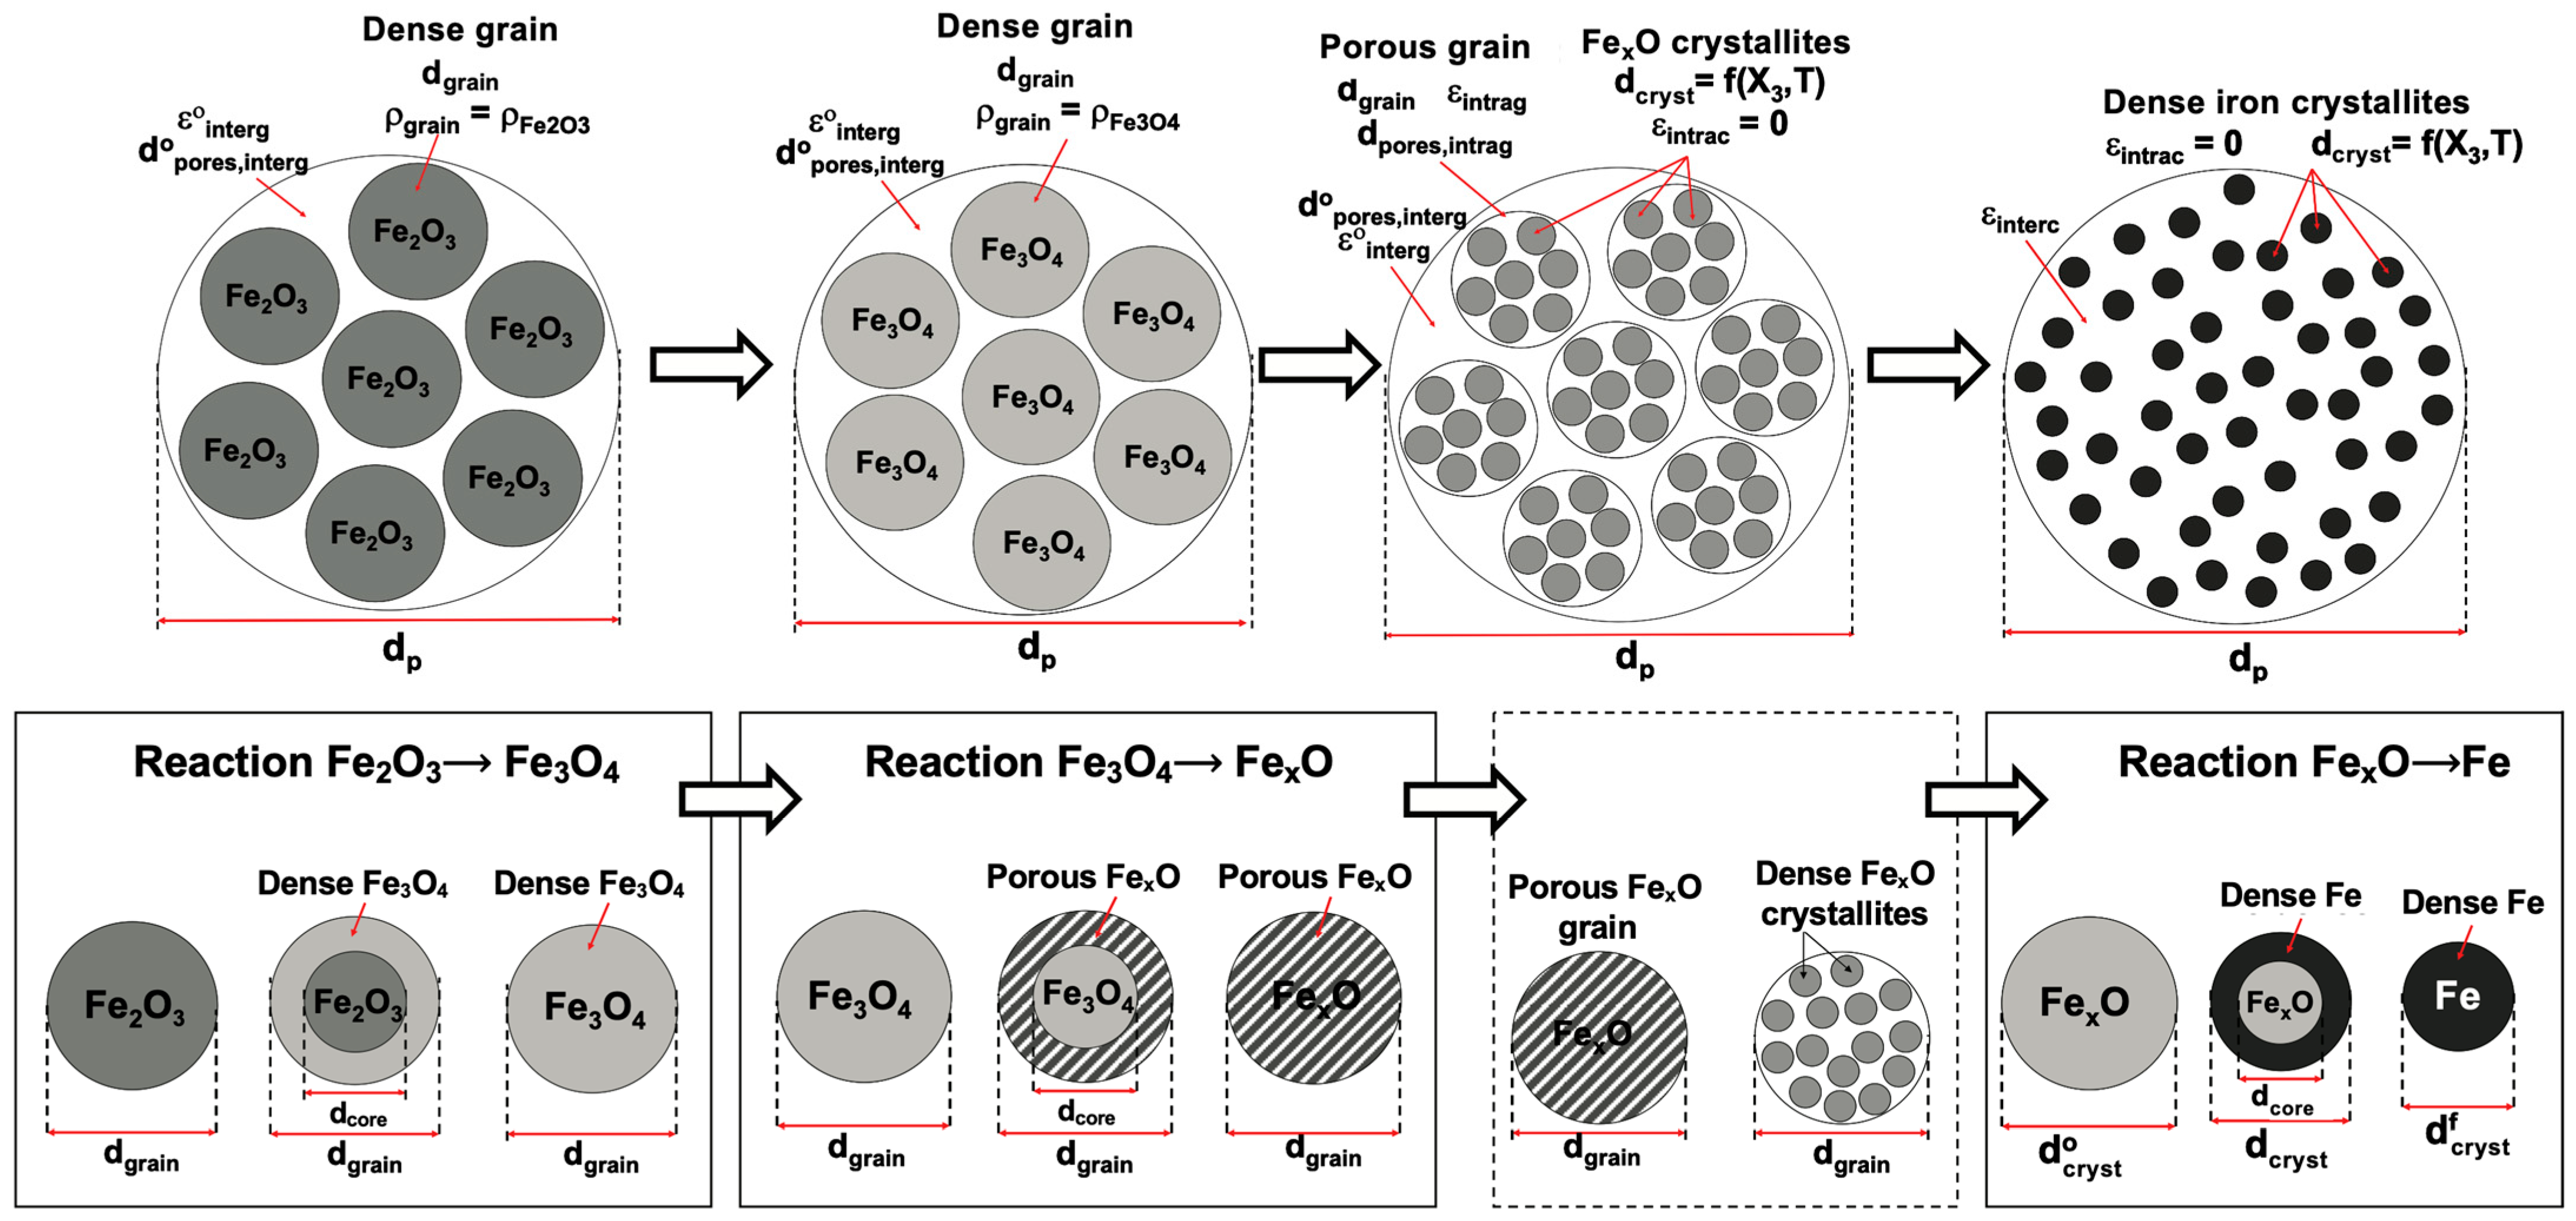
A pellet of constant size (usually in the range of 10–15 mm) is considered to be made up of monosized grains (Figure 2). The initial hematite grain diameter is derived from the known initial specific area of the pellet.
-
As in [32], the dense grains of hematite are converted to dense grains of magnetite, which are then converted to porous grains of wustite. These wustite grains are made of smaller dense particles called crystallites, which are converted to dense iron during the last reduction stage.
-
The TGA furnace is axially discretized. A time-dependent 1-D finite-volume method is implemented, and the numerical resolution is achieved through a Gauss-Seidel algorithm using an upwind scheme. We retained a 1-D model as a simplification able to consider the vertical gradients of gas composition resulting from the reactant gas consumption and product gas production. Horizontally, the average gas composition is considered; the radial gradients, if any, are not described.
-
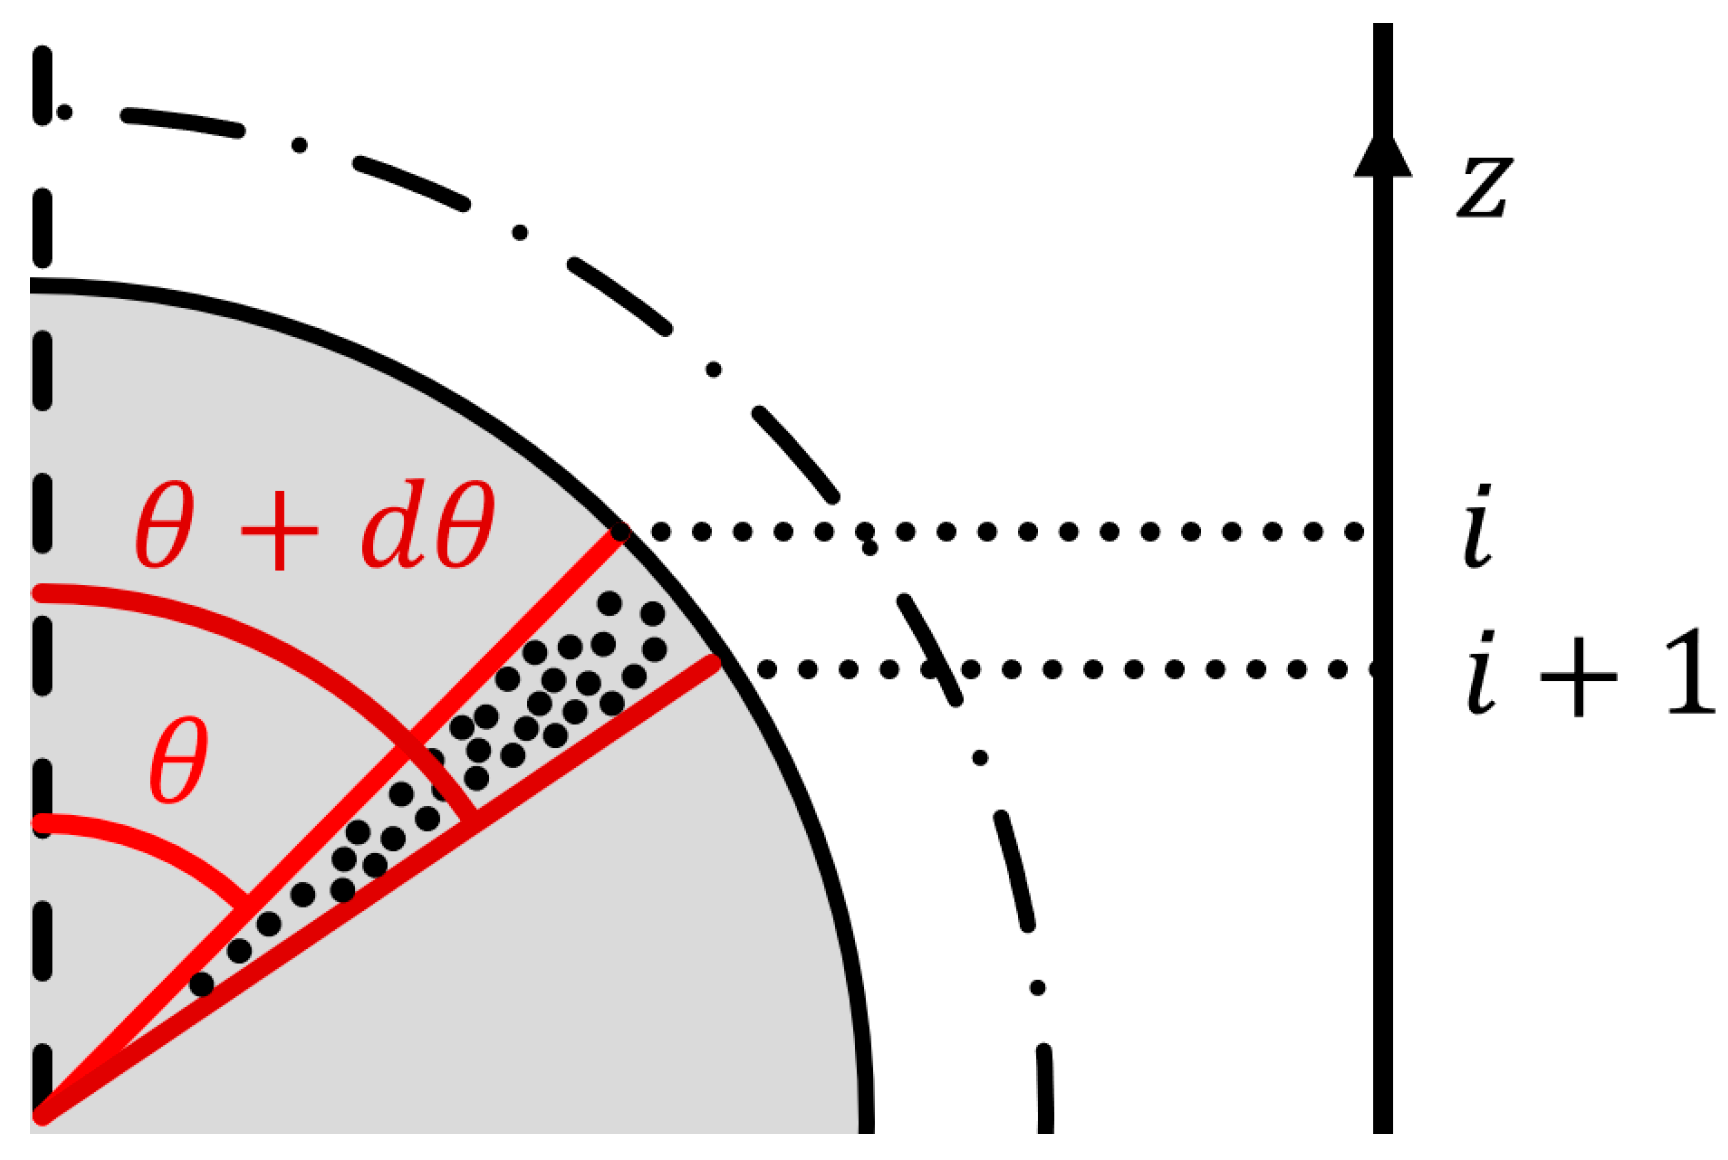
The pellet is discretized into slices, as shown in Figure 3, to match the axial discretization of the furnace. This enables us to relate the local bulk gas composition to the local reaction rate. The gas contained in the volume between the axial indices i and i + 1 is considered to reduce the grains of the pellet located between the polar angles θ and θ + .
-
Unlike other models in the literature, e.g., [6], the gas velocity is not calculated inside the pellet: it is assumed—for modeling—that the gas that reacts in a given slice enters and exits in the same slice. This leads to a much simpler calculation.
-
At each time step, the grains in the slice (θ, θ + dθ) react according to the GM–LART model [32]. Characteristic time constants are calculated for each solid slice and each subreaction on the basis of the local temperature and gas composition. Each of these time constants accounts for the influence of a potential rate-limiting phenomenon (namely, mass transfer of the reactant gas, pore diffusion, solid-state diffusion and local chemical reactions). All time constants used in the model are given in the Appendix A. The instantaneous rate of each subreaction is obtained from the law of additive reaction times in its differential form [26]:
r X = 1 τ c h e m f X + τ d i f f g ( X ) + τ e x t h ( X )
where the functions f ,   g and h are the time derivatives of the conversion functions related to each phenomenon (Table A1). Solid conversion is then readily obtained from first-order Euler integration.
-
Additionally, the gas composition is also calculated for each axial slice (i,i + 1) at each time step. x H 2 is obtained from a simplified mass balance:
c t d x H 2 , i d t = c t u z d x H 2 , i d z + S H 2 , i
The gas source term is obtained from the initial apparent molar density of hematite, a geometric factor relating the volume of the solid to the height of the axial slice, and the reaction rate of the global reduction reaction:
S H 2 , i = 3   ρ ~ F e 2 O 3 , i n i   Z i Z i + 1 d p   r X , i
For clarity, a computation flow chart of the new model is given in Figure 4.

3. Results

3.1. Kinetic Parameter Estimation

Since the chemical time constant for each subreaction depends on an Arrhenius equation, the reaction rate is ultimately determined by the kinetic triplets ( k 0 , j , E a , j ) for each subreaction (j = 1, 2, 3).
k j = k 0 , j exp E a , j R T
Owing to the intricacy in modeling the reaction of iron ore pellets with hydrogen, values reported in the literature differ quite dramatically among different authors. Figure 5 shows the scattered values of the activation energies most often reported, as well as those obtained in the present work. These factors, together with the associated frequency factors (Table 2), were determined by mathematical optimization on the basis of a comparison between the experimental and calculated kinetic curves.
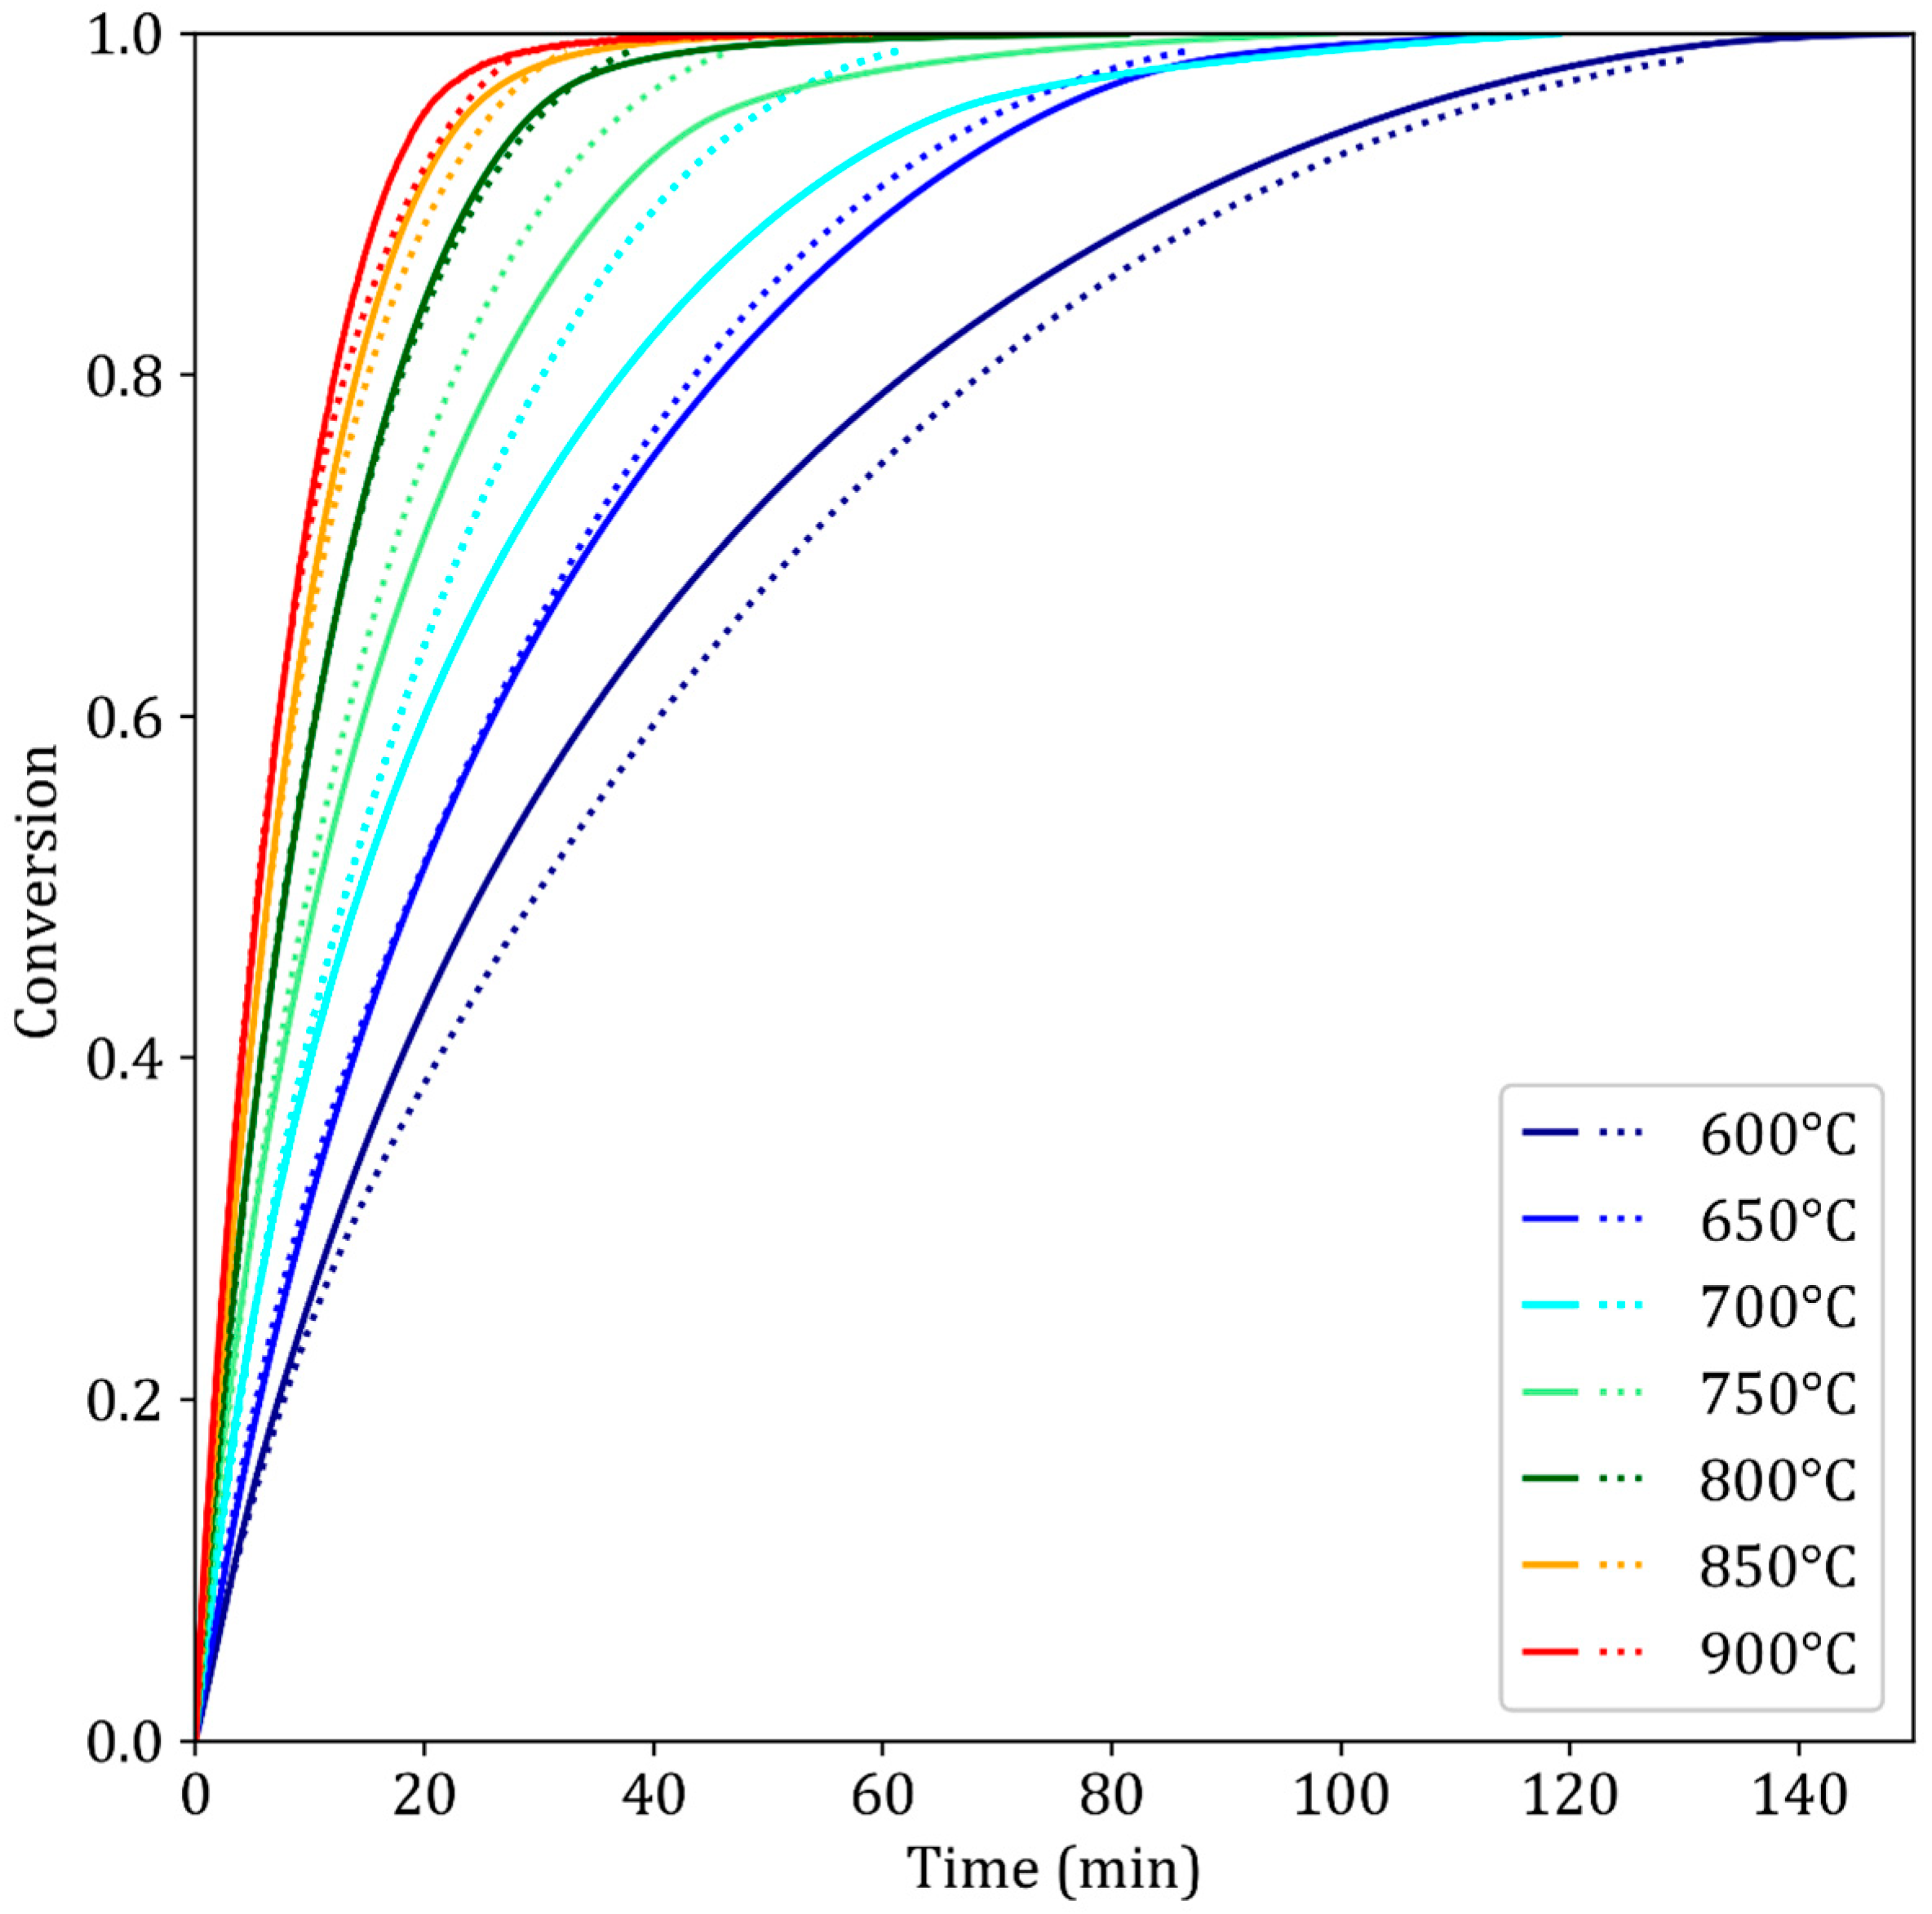
More precisely, this kinetic parameter calibration was achieved by fitting the conversion curves calculated using the parameters listed in Table 3 to the experimental conversion curves, for the temperatures from 600 to 900 °C. The temperature range was kept as broad as possible. However, low temperatures were disregarded because of changes in the kinetic regime due to thermodynamics [25,36]. High temperatures were also disregarded because cracks were observed in the pellets at these temperatures; these cracks greatly enhanced diffusion and were not considered in the model. The curve fitting was achieved with a pattern search algorithm using the pymoo framework in Python 3.11. To avoid overfitting at high conversion degrees, the optimization was limited to X between 0 and 99%.
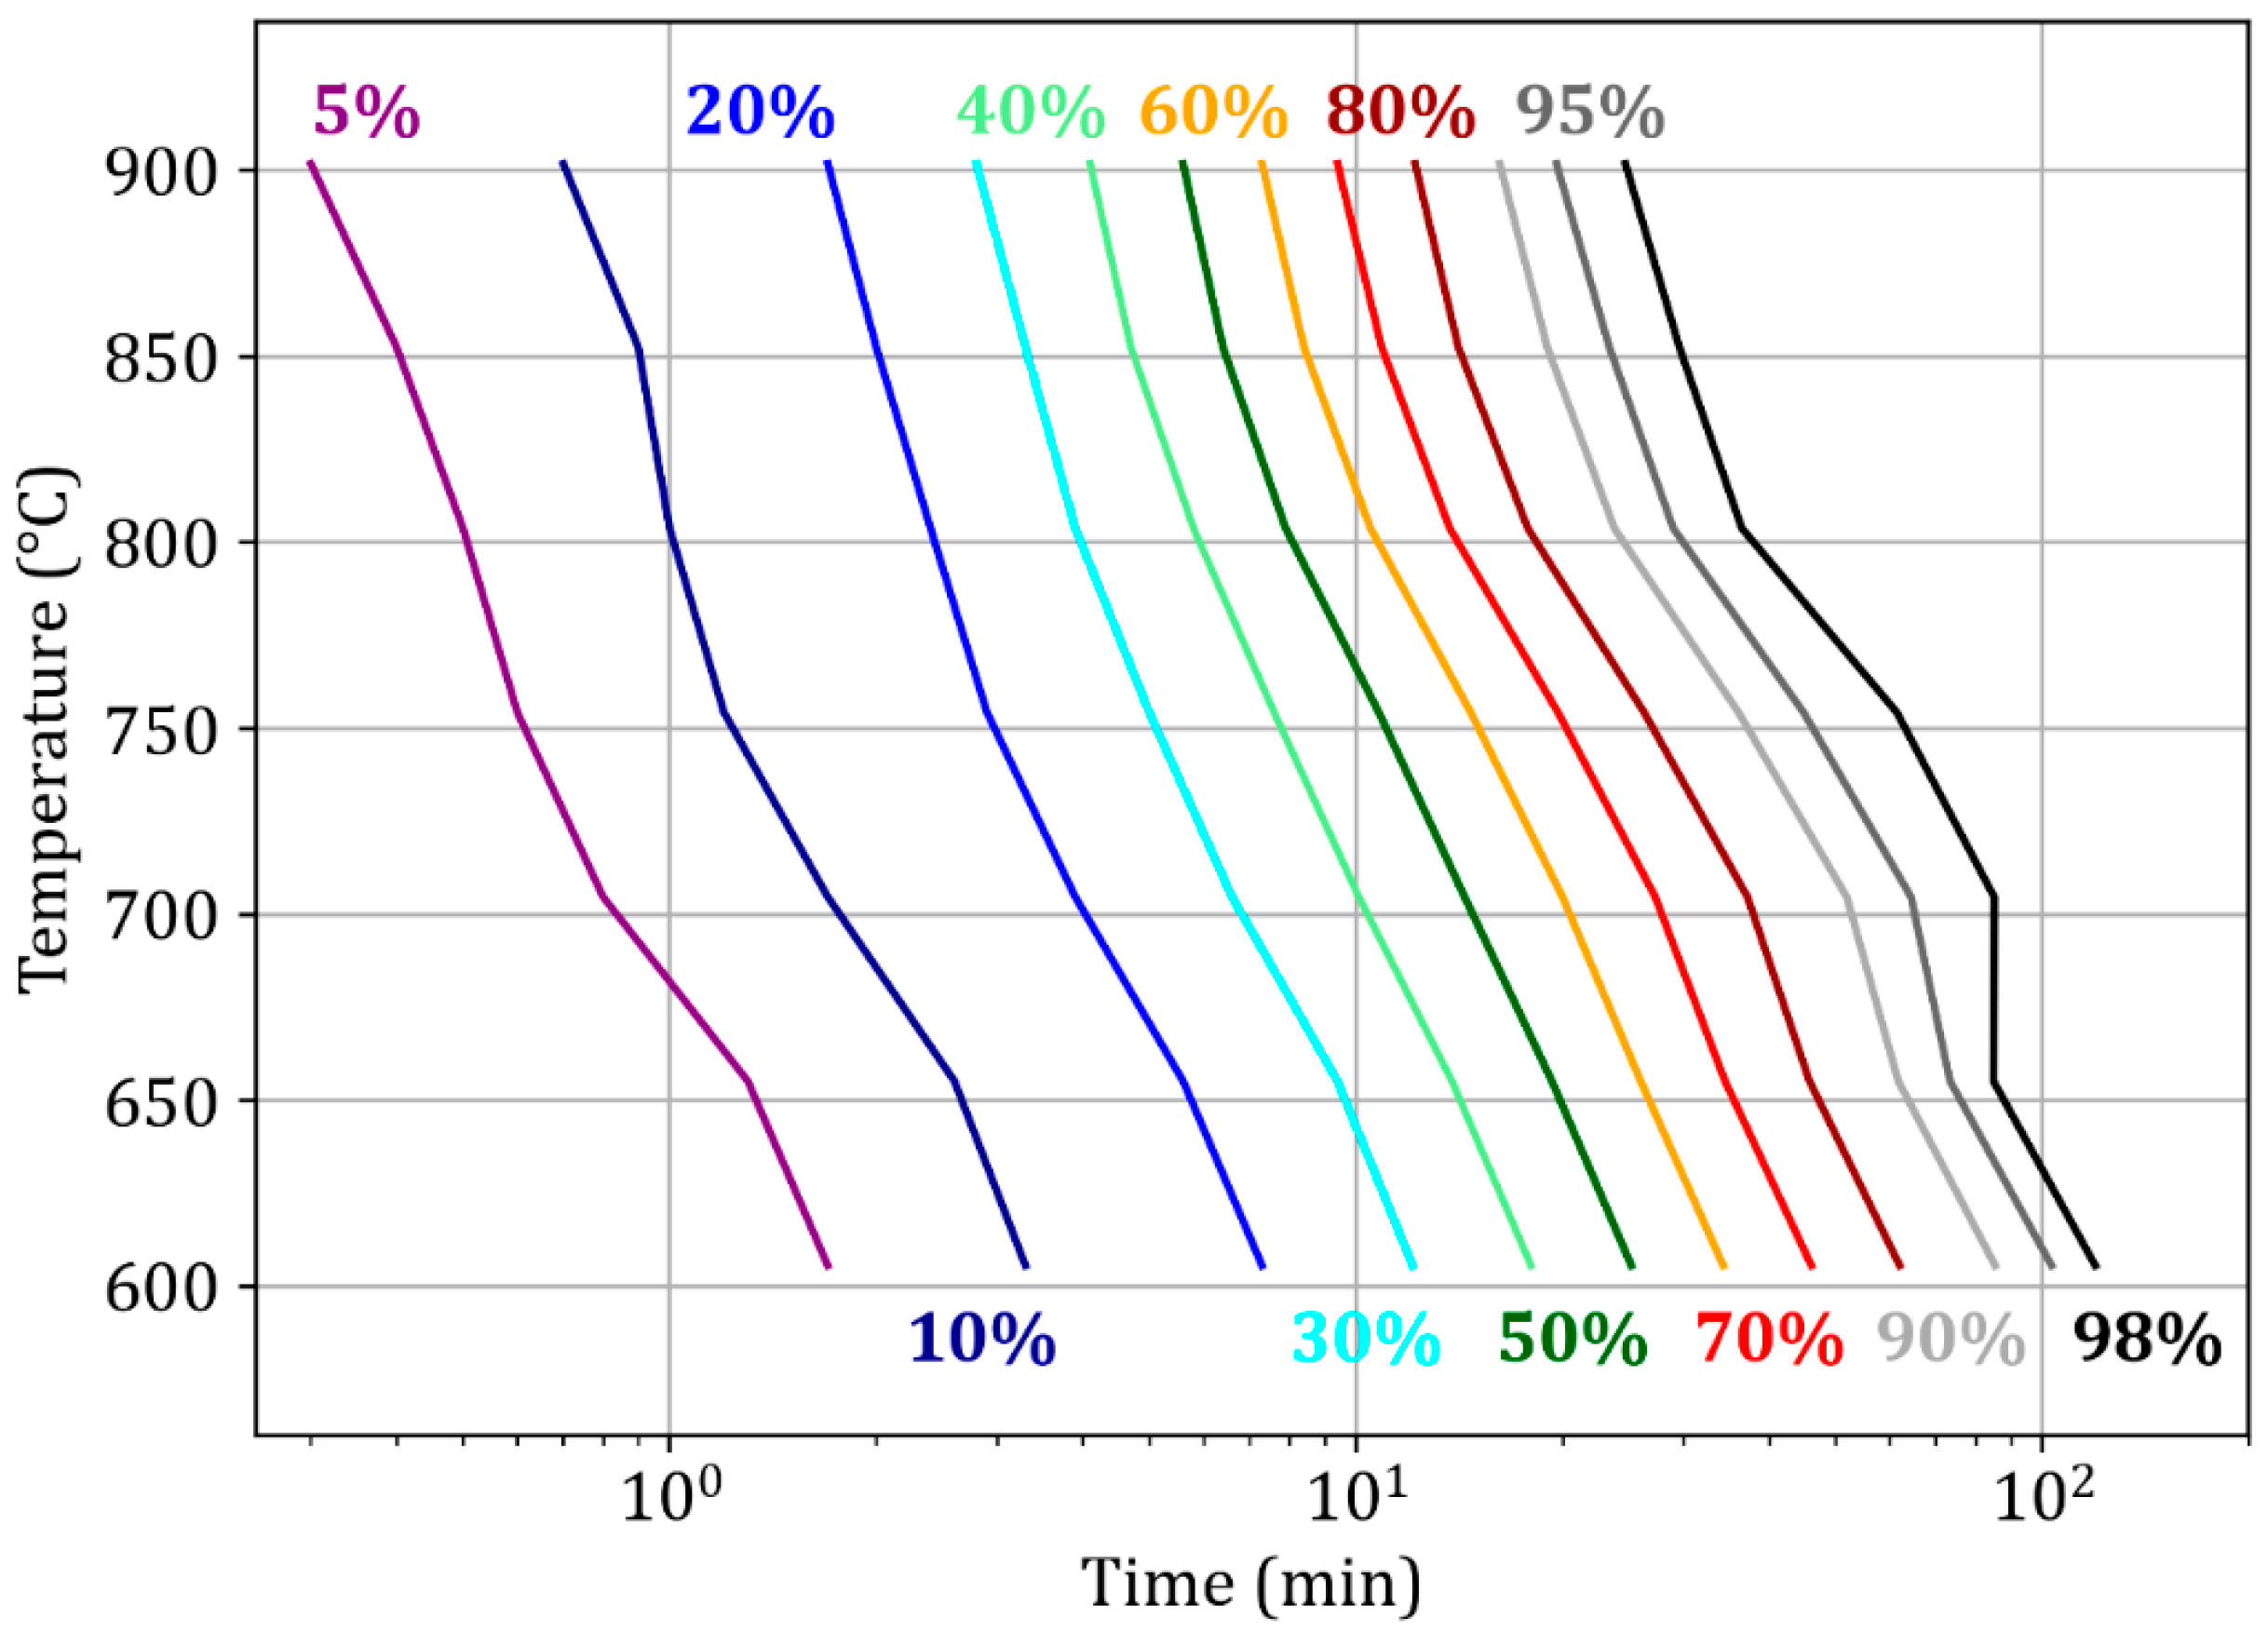
The obtained kinetic triplets allow us to simulate experiments with reasonable agreement in the given temperature range of 600–900 °C (Figure 6). The agreement is excellent at lower conversion degrees, X < 25%. At 700 °C and 750 °C and for X > 60%, the simulation overestimates the reaction rate. This is correlated with the experimental time–temperature–transformation (TTT) diagram (Section 3.4.1), in which kinetic slowdown is observed in this temperature range. This phenomenon has already been reported by previous authors, although no satisfactory explanation was provided [13].
The activation energies found with this method are in global agreement with other values reported in the literature (Figure 5). The short duration of the first reaction and experimental discrepancies related to gas injection explain the wide range of activation energies for this reaction. Most researchers find closer values for the activation energy of the second reaction. Models in which great importance is given to diffusion resistance rely on a relatively low activation energy for the third reaction, as shown in [5,24,33]. In the work of Ranzani Da Costa et al. [32], the activation energy of the third reaction was higher than that in our work: this is mostly due to the narrow temperature range (800–900 °C) that was used for the kinetic parameter evaluation, which resulted in underestimated reaction rates at lower temperatures.

3.2. Validation Against Fixed Bed Experimental Results

In addition to the successful simulation of the TGA experiments (Figure 6), the pellet model was further validated at another scale against fixed bed experiments. These lab-scale experiments were performed at Tata Steel IJmuiden, Netherlands, as part of the MaxH2DR project. A 500 g sample of D1 pellets (10–13 mm) was reduced by a 55% H2 45% N2 gas mixture flowing at 18 Nlpm. The objective was to observe any bed effect that could influence the reduction of the pellets. Reduction was performed until the overall conversion reached X = 0.933.
The simulations of the fixed-bed experiments were performed with two sets of kinetic triplets: one was obtained from curve fitting of the TGA experiments, as discussed in Section 3.1, and the other one was obtained from curve fitting of the fixed-bed experiments. For simplicity, a constant pellet diameter of 12 mm was used for the simulations: it corresponds to the mean diameter of the pellet D1 sample.
Figure 7a shows the experimental and simulated curves of the fixed bed with the “fixed-bed kinetic triplet”. The model greatly adapts to this new situation. Figure 7b shows the same results as those of the “TGA kinetic triplet”. Here, the simulations are slightly less accurate at the start of the reaction, which could be due to differences in gas injection between TGA and fixed bed devices. Likewise, the simulations are less accurate at the end of the reaction. This is probably due to the nonisothermal behavior of the fixed bed device. Owing to the low hydrogen flow rate and high endothermicity of hydrogen reduction, the furnace temperature slightly decreased during the reduction experiments, which explains why the reaction rate was slightly overestimated by our isothermal model. Overall, the agreement between the TGA experiment and the fixed-bed simulations is very satisfactory, which further shows that the model can adapt to multiple situations and different scales. Additionally, using either He or N2 as the inert gas only makes a minor difference in the obtained kinetics; all other experiments and simulations presented in Section 3 were performed with He as the inert gas.
In the next sections, simulations are first compared with experimental results for a broad range of operating parameters, such as temperature, pellet diameter, gas flow rate, water vapor content, and pellet size. To investigate the effects of parameters that could not be tuned during the experiments, a numerical parametric study of the pressure, porosity, tortuosity, and specific surface area is then presented. Unless explicitly mentioned, the parameters used are those given in Table 3 at 900 °C.

3.3. Kinetic Regime

Before the effects of these parameters are analyzed in the next sections, it is interesting to report important results from the model, which could be used to determine the type of kinetic regime. As mentioned in the Introduction, with iron ore pellets, the main cited mechanisms are control by the kinetic reaction itself and diffusion through the intergranular pores. A simple way to evaluate their respective resistances is to calculate the reaction modulus ϕ, so-called by Szekely et al. [15], which is equivalent to the Thiele modulus in catalysis.
ϕ = τ d i f f τ c h e m
When ϕ is small, the reaction is under chemical control; when it is large, it is controlled by diffusion; and if 0.1 < ϕ < 10, it is under mixed control. Table 4 lists the values of ϕ calculated under various conditions and at different overall conversion degrees. Globally, this shows that the reaction is in a chemical or mixed regime. In the base case (line 2), hematite and magnetite are reduced in the chemical regime, whereas wustite is reduced in a mixed regime. The results for the other cases are discussed later in their respective sections.

3.4. Parametric Study—Both Experimental and Numerical

3.4.1. Effect of Temperature

A comparison of the experimental and numerical conversion curves for different temperatures is shown and discussed (Figure 6, Section 3.1; Figure 7, Section 3.2). Note that the curves get closer to each other when the temperature increases. This trend indirectly supports the assumption of isothermicity since the temperature gradients, if any, were reported sizeable mostly above 800 °C [31].
A complementary time–temperature-transformation (TTT) diagram is presented below (Figure 8). It shows that the reduction rate globally increases with increasing temperature in the range of 600–900 °C. This is due to enhanced diffusion and chemical kinetics. One can note that 98% reduction is achieved in 120 min at 600 °C and 25 min at 900 °C. The kinetic control remains unchanged in this temperature range (Table 4, compare line 3 at 600 °C and line 2 of the base case at 900 °C), with the diffusion resistance slightly increasing with temperature. However, an unusual decrease in the reaction rate is observed at temperatures of 700 °C and 750 °C and above X = 80%. This anomaly may be due to the effects of temperature on the microstructure and the presence of wustite compared with lower temperatures [13]. This effect is more pronounced for smaller particles [32]. Specific investigations are needed to elucidate this phenomenon.

3.4.2. Effect of Dilution in Helium

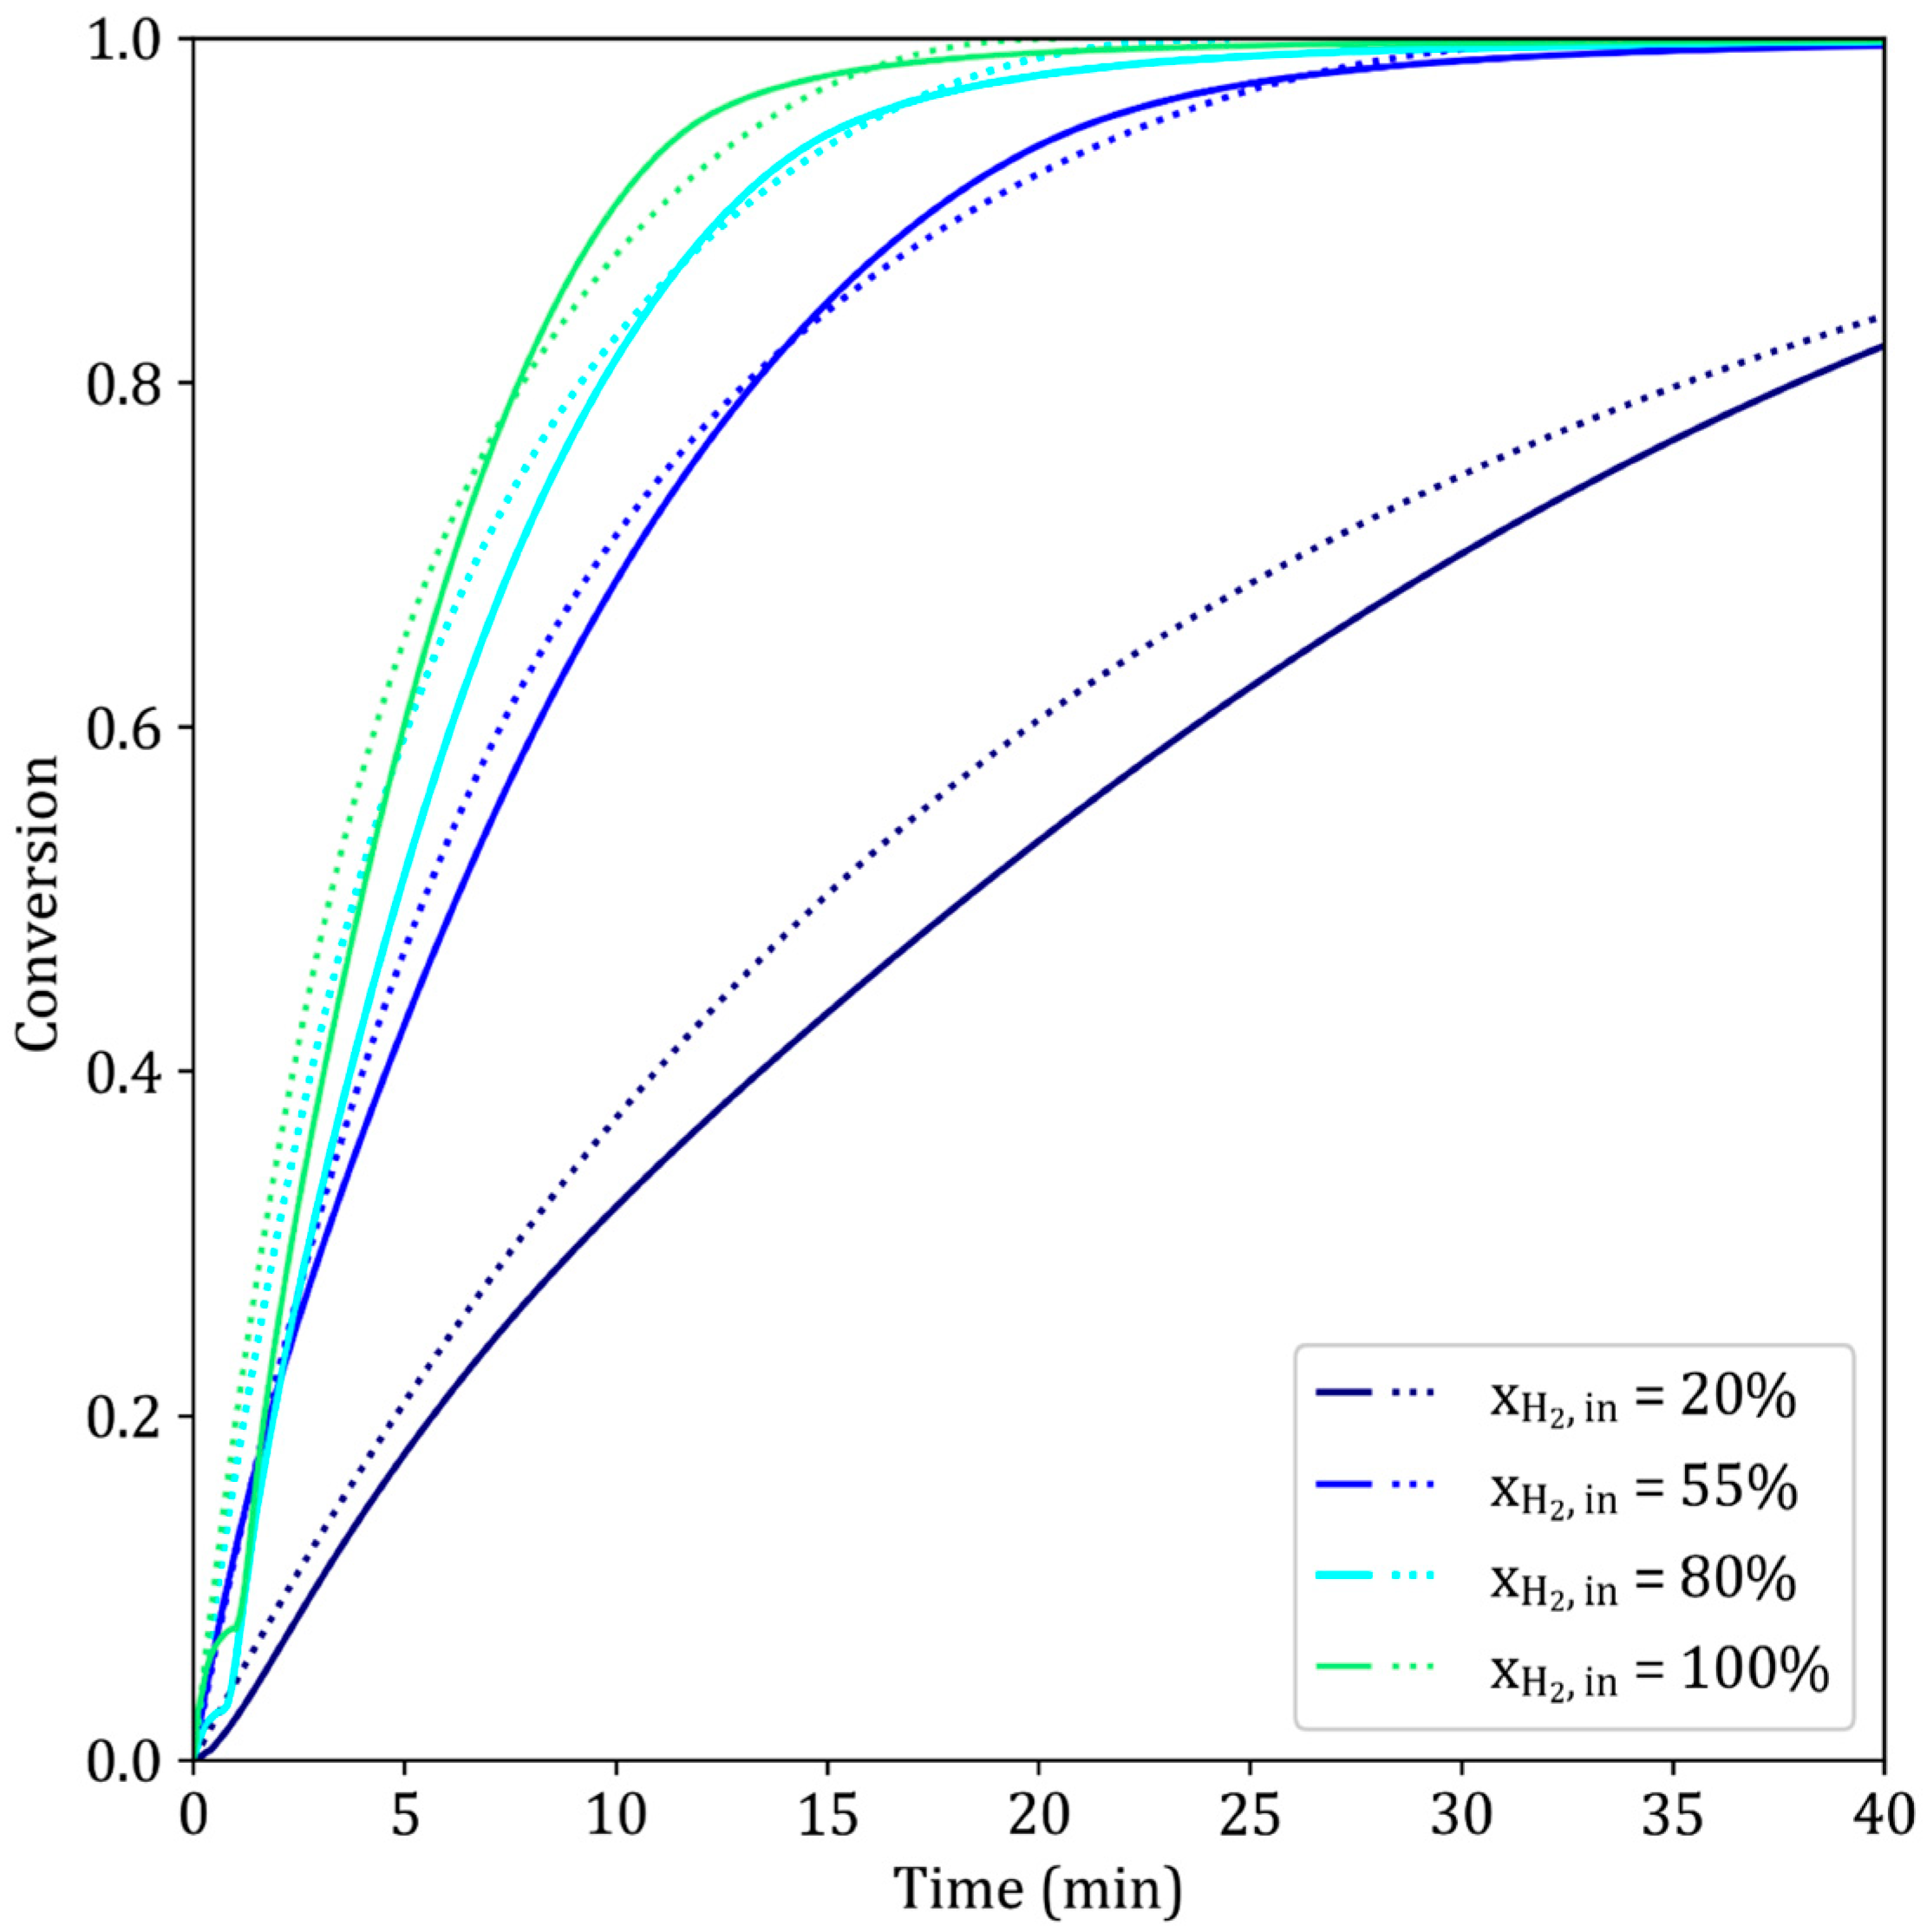
The presence of inert gas in the mixture slows the reaction, since it reduces the frequency of interactions between hydrogen and iron oxides. As shown in Figure 9, for a constant gas flow rate, a higher helium molar fraction leads to a decreased reaction rate. This experimental behavior is accurately represented by the model. The pressure can drop suddenly in the TGA experiment when shifting from He to H2–He, which disrupts the electrolyzer: this explains the discrepancies observed at the start of the reaction for the experiments where x H 2 = 80% and x H 2 = 100%.

3.4.3. Effect of the Gas Flow Rate

As discussed in Section 2.3, decreasing the gas flow rate can have quite dramatic effects on the reaction rate. First, it decreases the gas velocity, which in turn slows the external mass transfer of hydrogen. Second, it lowers the hydrogen content in the device, which may lead to hydrogen depletion. Very high gas flow rates (10 Nlpm of pure hydrogen for 15 mm pellets) are used to compensate for this effect [13].
The simulation results for pure hydrogen at low gas flow rates agree reasonably well with the experimental results above Fg = 0.15 Nlpm (Figure 10). In fact, there is a critical gas flow rate at which the reduction reaction greatly slows, as documented in [30]. This slowdown is first observed at the very start of the reaction and is linked to difficulties in replacing the helium atmosphere with hydrogen at such low flow rates. A second slowdown is observed at the start of the third step of the reaction, after which the calculated rate of reaction is again equal to the experimental rate at the same degree of conversion. This suggests that the slowdown may be due to a nucleation effect, as mentioned in [30]. In fact, the main consequence of a lower gas flow rate is reactant gas depletion and a high content of product gas [37]. The presence of a high water vapor content in the gas mixture was reported to hinder nucleation by the adsorption of H2O at reaction sites, thus leading to complicated nucleation before the reaction continues [38,39]. This change in the kinetic regime is not included in the present model.

3.4.4. Effect of the Inlet Water Vapor Content

The presence of water vapor in the gas mixture greatly slows the reaction (Figure 11). In these experiments using the Jupiter TGA system, the total gas flow rate was 0.25 Nlpm, and the inlet water vapor content was adjusted from 0 to 20%. A major inflection point in the reduction curve is observed at approximately X = 0.3. The high water vapor inlet content and low gas flow rate saturated the TGA atmosphere with water vapor. These results directly corroborate the experiments with low gas flow rates discussed in the previous section. In both cases, the high water vapor content poisons the reaction sites on the oxides. The nucleation of iron is hindered, leading to a slowdown at the start of the third reaction. As in the previous case, this effect, which was not included in the model, could not be simulated. Finally, the slowdown systematically observed above X = 0.90–0.95 reflects the difficulty in accessing the bottom part of the pellet by the gas in the Jupiter device, as explained in Section 2.2.

3.4.5. Effect of the Pellet Size

As shown in Figure 12, increasing the pellet diameter slows the reduction reaction. First, the characteristic times of external mass transfer and gas diffusion in the pores both increase with increasing pellet size. Second, the consumption of hydrogen during TGA increases with increasing pellet size. At sufficiently large pellet diameters, this leads to hydrogen depletion at the bottom of the pellet, which in turn slows the reduction reaction.
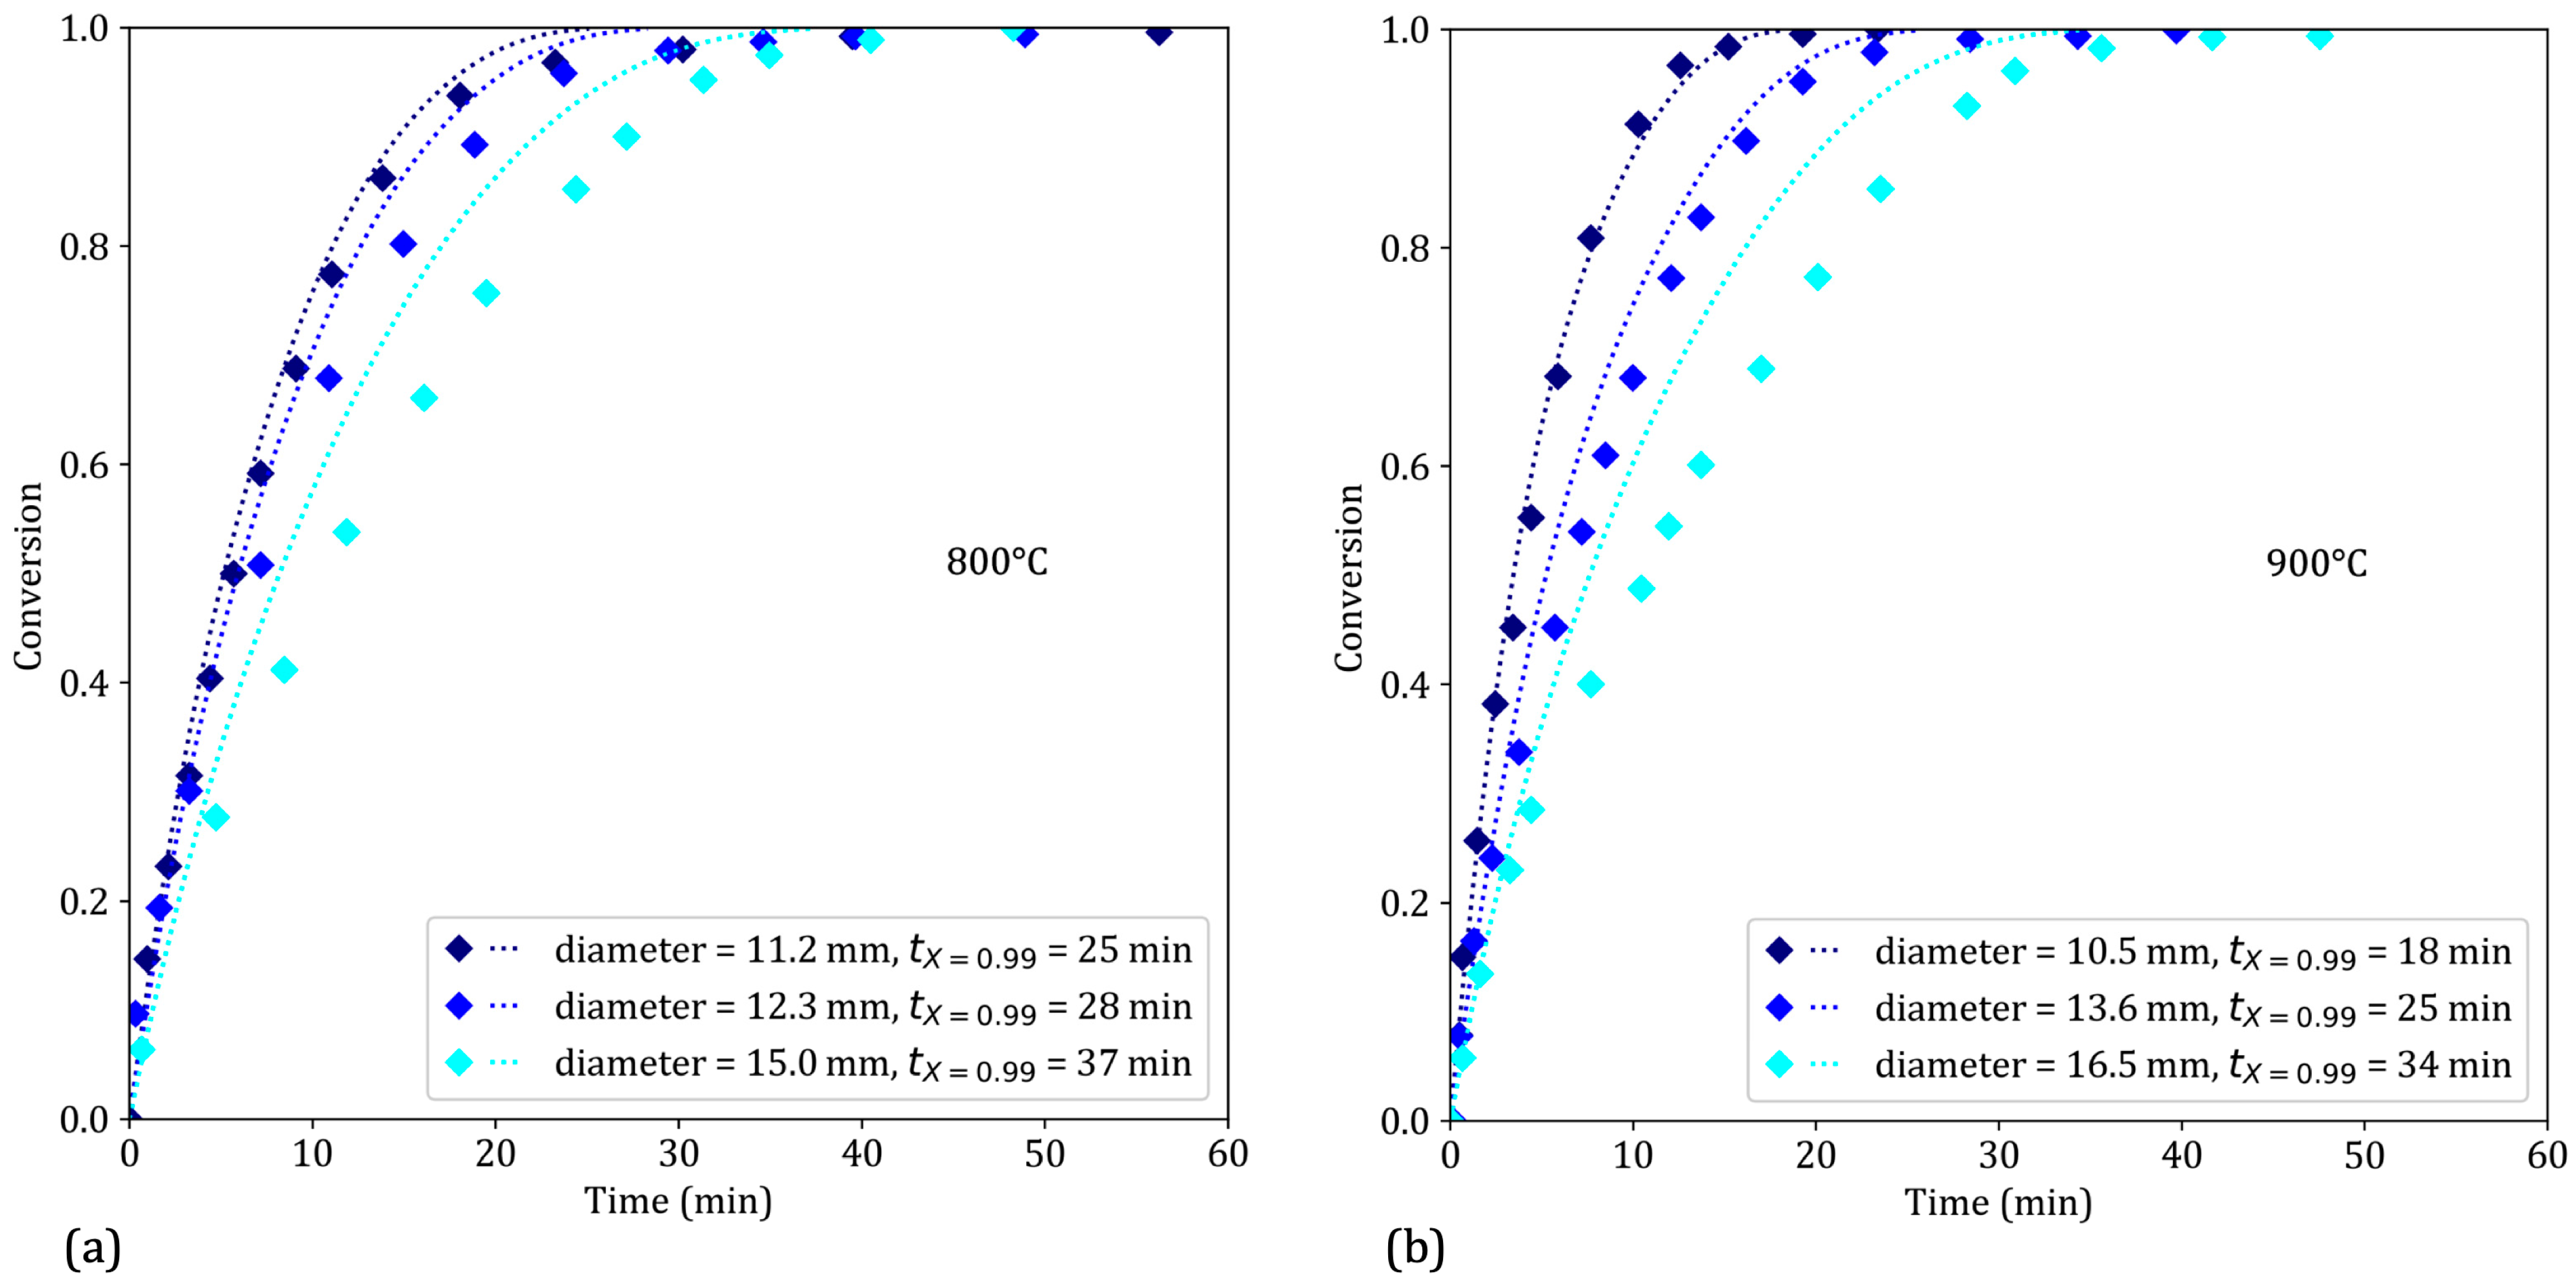
The model correctly simulates the reduction of pellets by pure hydrogen in the 10–13 mm range. However, for larger pellets at both temperatures, the model does not sufficiently reflect the kinetic slowdown. We selected the experimental data of Metolina et al. [10] for comparison to further test the ability of our model to simulate external results. Although the main experimental parameters were available to enable the simulation, the diffusion-related parameters used in our model may not be completely adaptable to the actual samples. The kinetics may thus be more limited by intergrain diffusion than predicted (Table 4, line 5). With the 15- and 16.5 mm pellets, a moderate slowdown occurs at the start of the third reaction, likely due to the high water vapor content generated by the reduction reaction, for the reasons mentioned in Section 3.4.3 and Section 3.4.4.

3.5. Parametric Study—Numerical

3.5.1. Effect of Pressure

According to the literature, increasing the partial pressure of hydrogen greatly decreases the reduction time [38]. In addition, above a certain threshold, increasing the pressure no longer affects the kinetics [16,18]. In fact, increasing the pressure gradually shifts the kinetic regime from mixed to diffusion controlled, as suggested by [17].
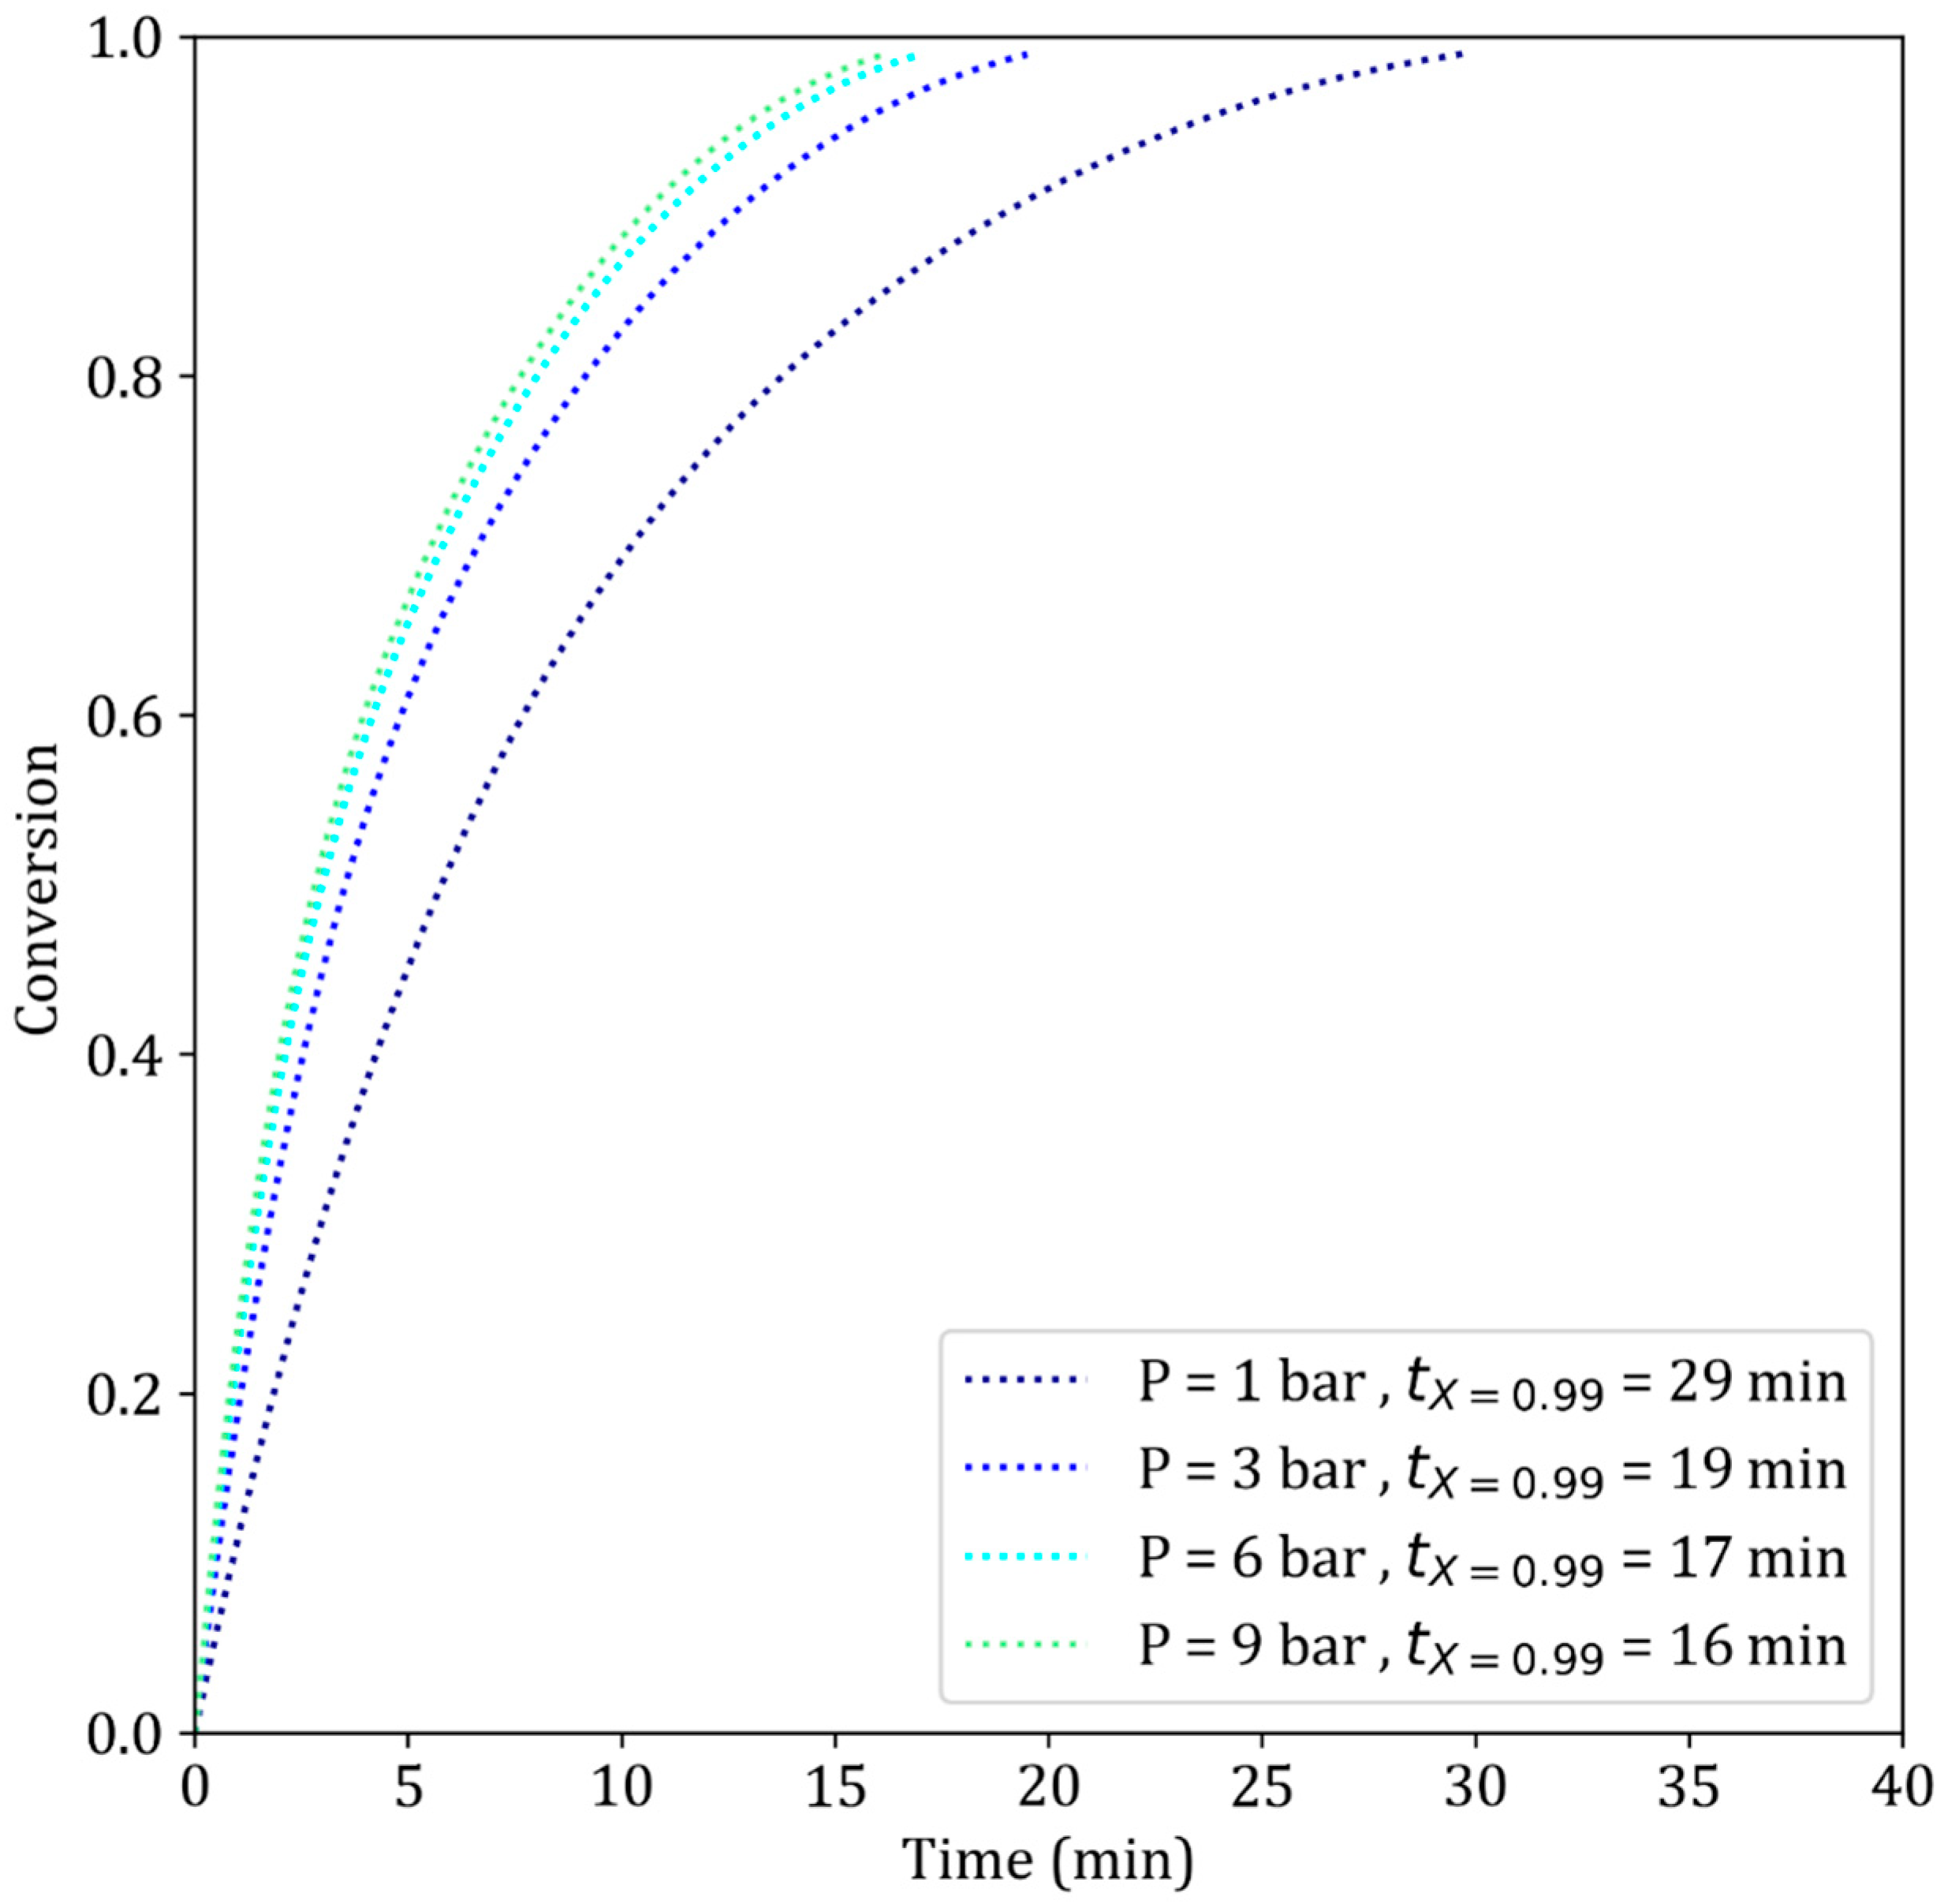
The same conclusions can be drawn from our simulations. Figure 13 shows that increasing the pressure from 1 to 3 bar greatly decreases the reduction time, whereas only a minor improvement is observed when the pressure is further increased from 6 to 9 bar. With more H2 available when passing from 1 to 3, 6 and 9 bars at constant x H 2 , the chemical reaction rates accelerate almost proportionally. Concurrently, the effect of pressure on diffusion remains negligible. As a result, the reaction becomes more limited by diffusion, as confirmed by the clear increase in the reaction modulus values (Table 4, lines 2 and 6). Thus, there is excellent agreement between the literature and our simulation results.

3.5.2. Effect of the Initial Porosity

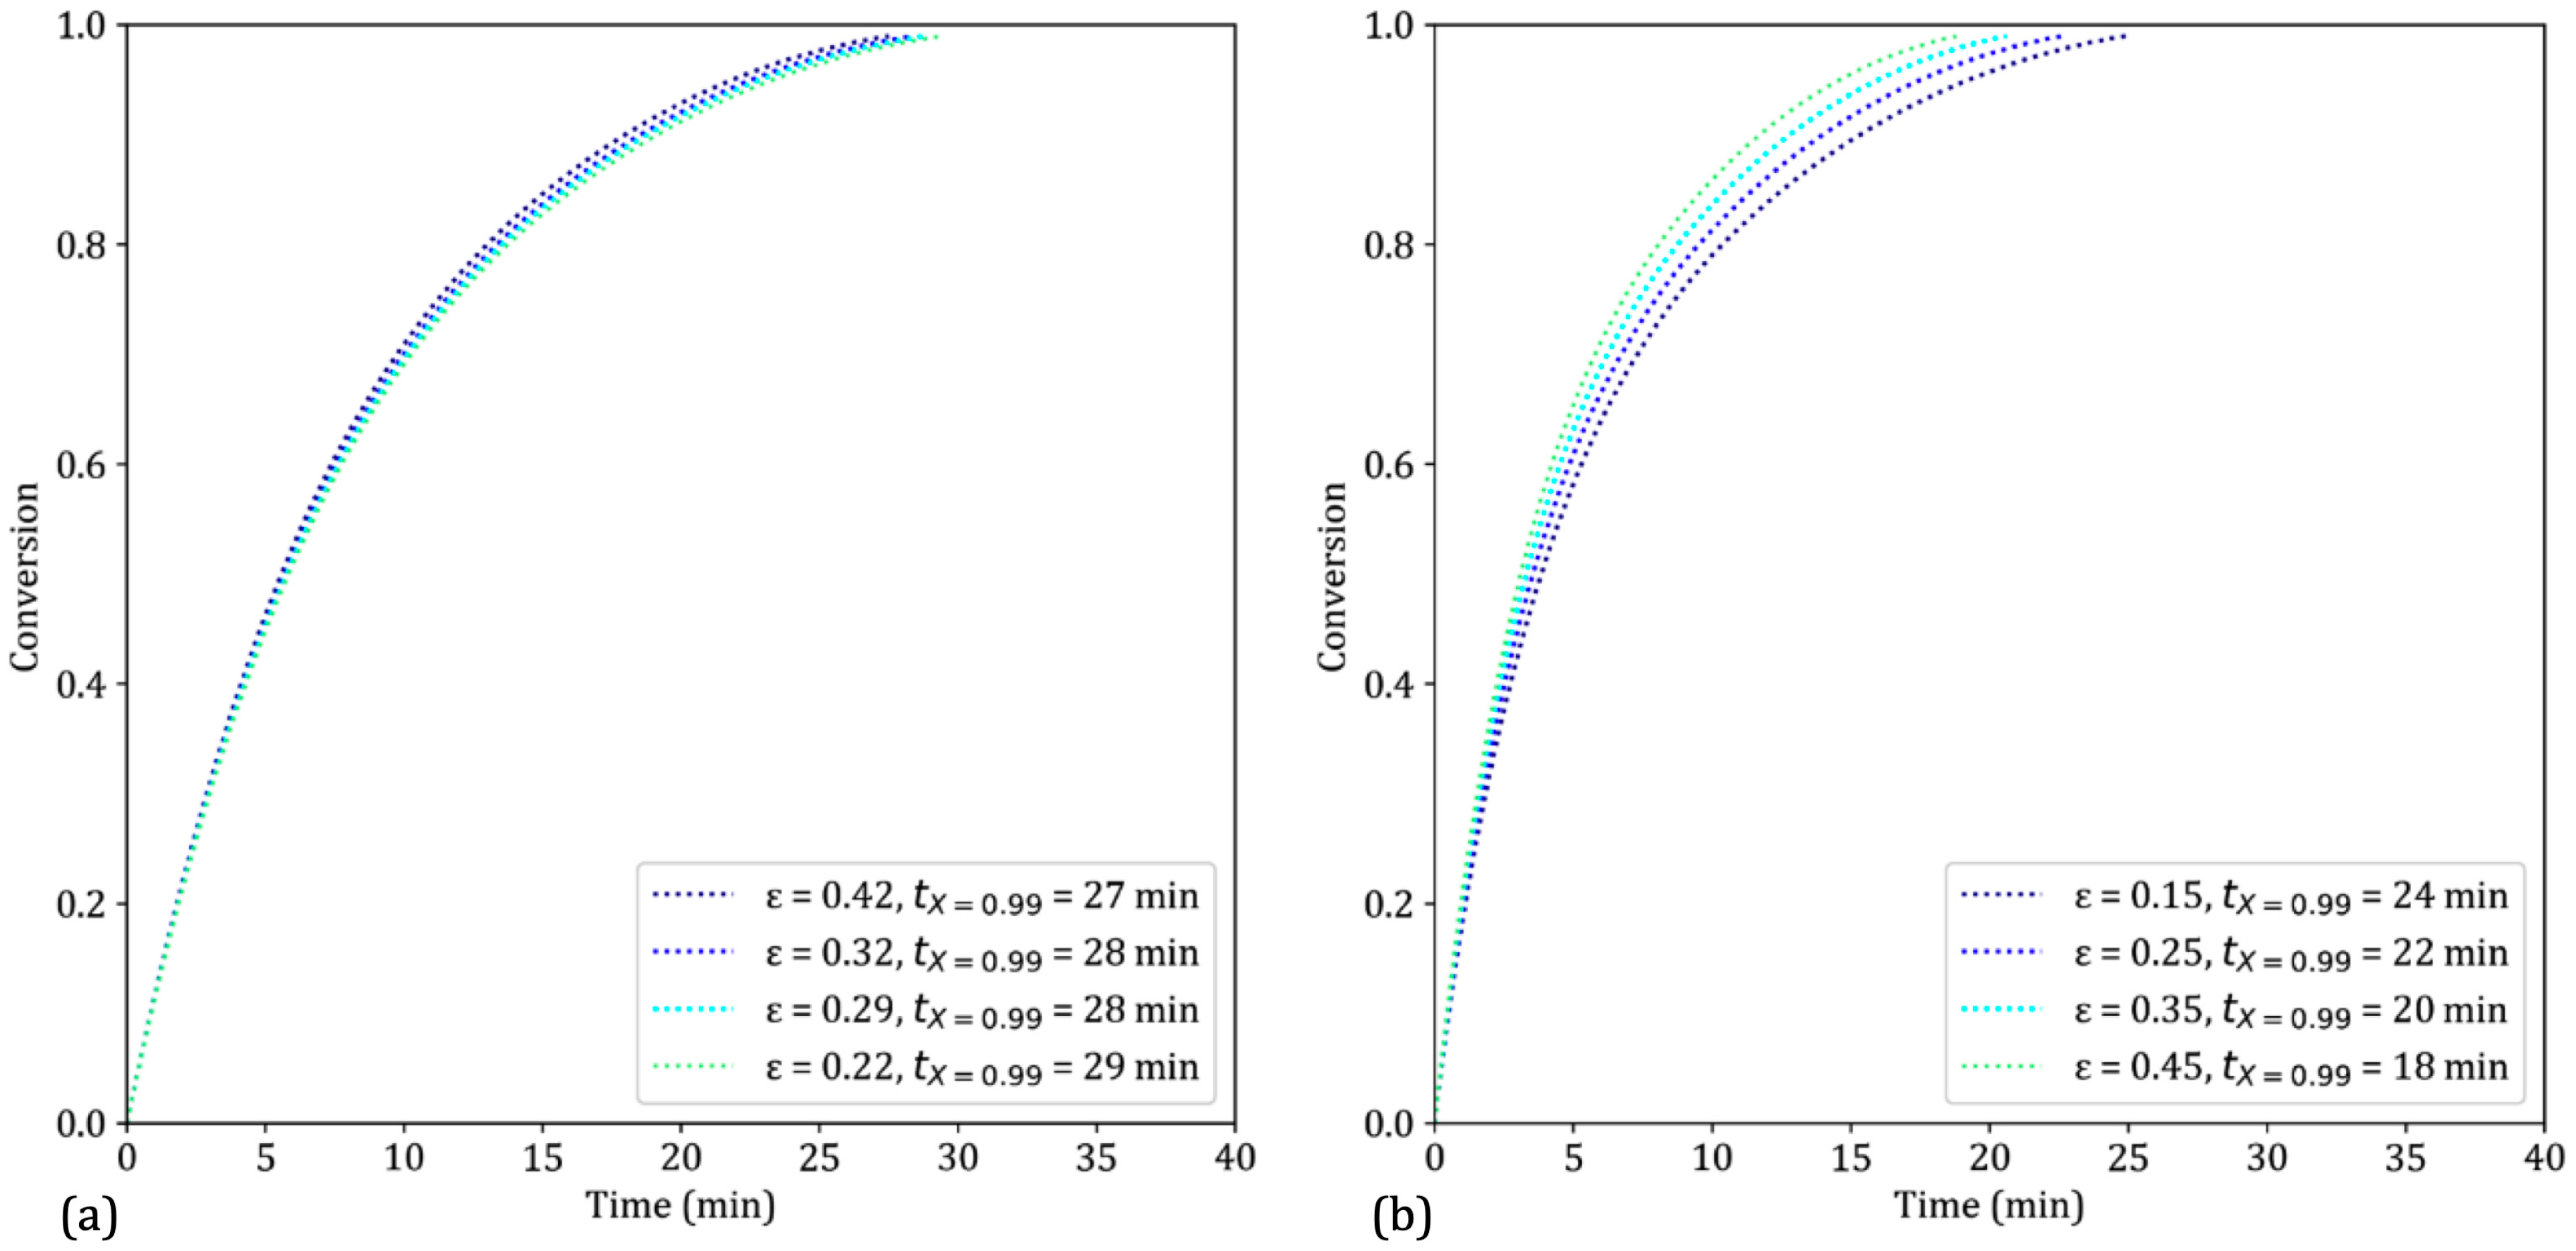
With a constant pellet mass, increasing the porosity implies increasing the pellet diameter. Since both parameters, respectively, increase and decrease the reduction rate, no marked effect is observed on the reduction curves (Figure 14a). However, with a constant diameter and a varying mass, the effect of porosity becomes appreciable. An increasing porosity means that there is less hematite to convert and less water vapor generated. Both combined effects led to a slight increase in the reduction rate (Figure 14b).
The effect of porosity remains limited in our simulations. This is due to the chemical control (or chemical-predominated mixed control) of the reaction (Table 4, lines 2 and 7). Therefore, enhanced diffusion only partially increases the overall reduction rate. These results are in good agreement with those presented by [10]. Conversely, the effect of porosity is more sensible in models that give greater importance to diffusion effects (e.g., [14]).

3.5.3. Effect of Tortuosity

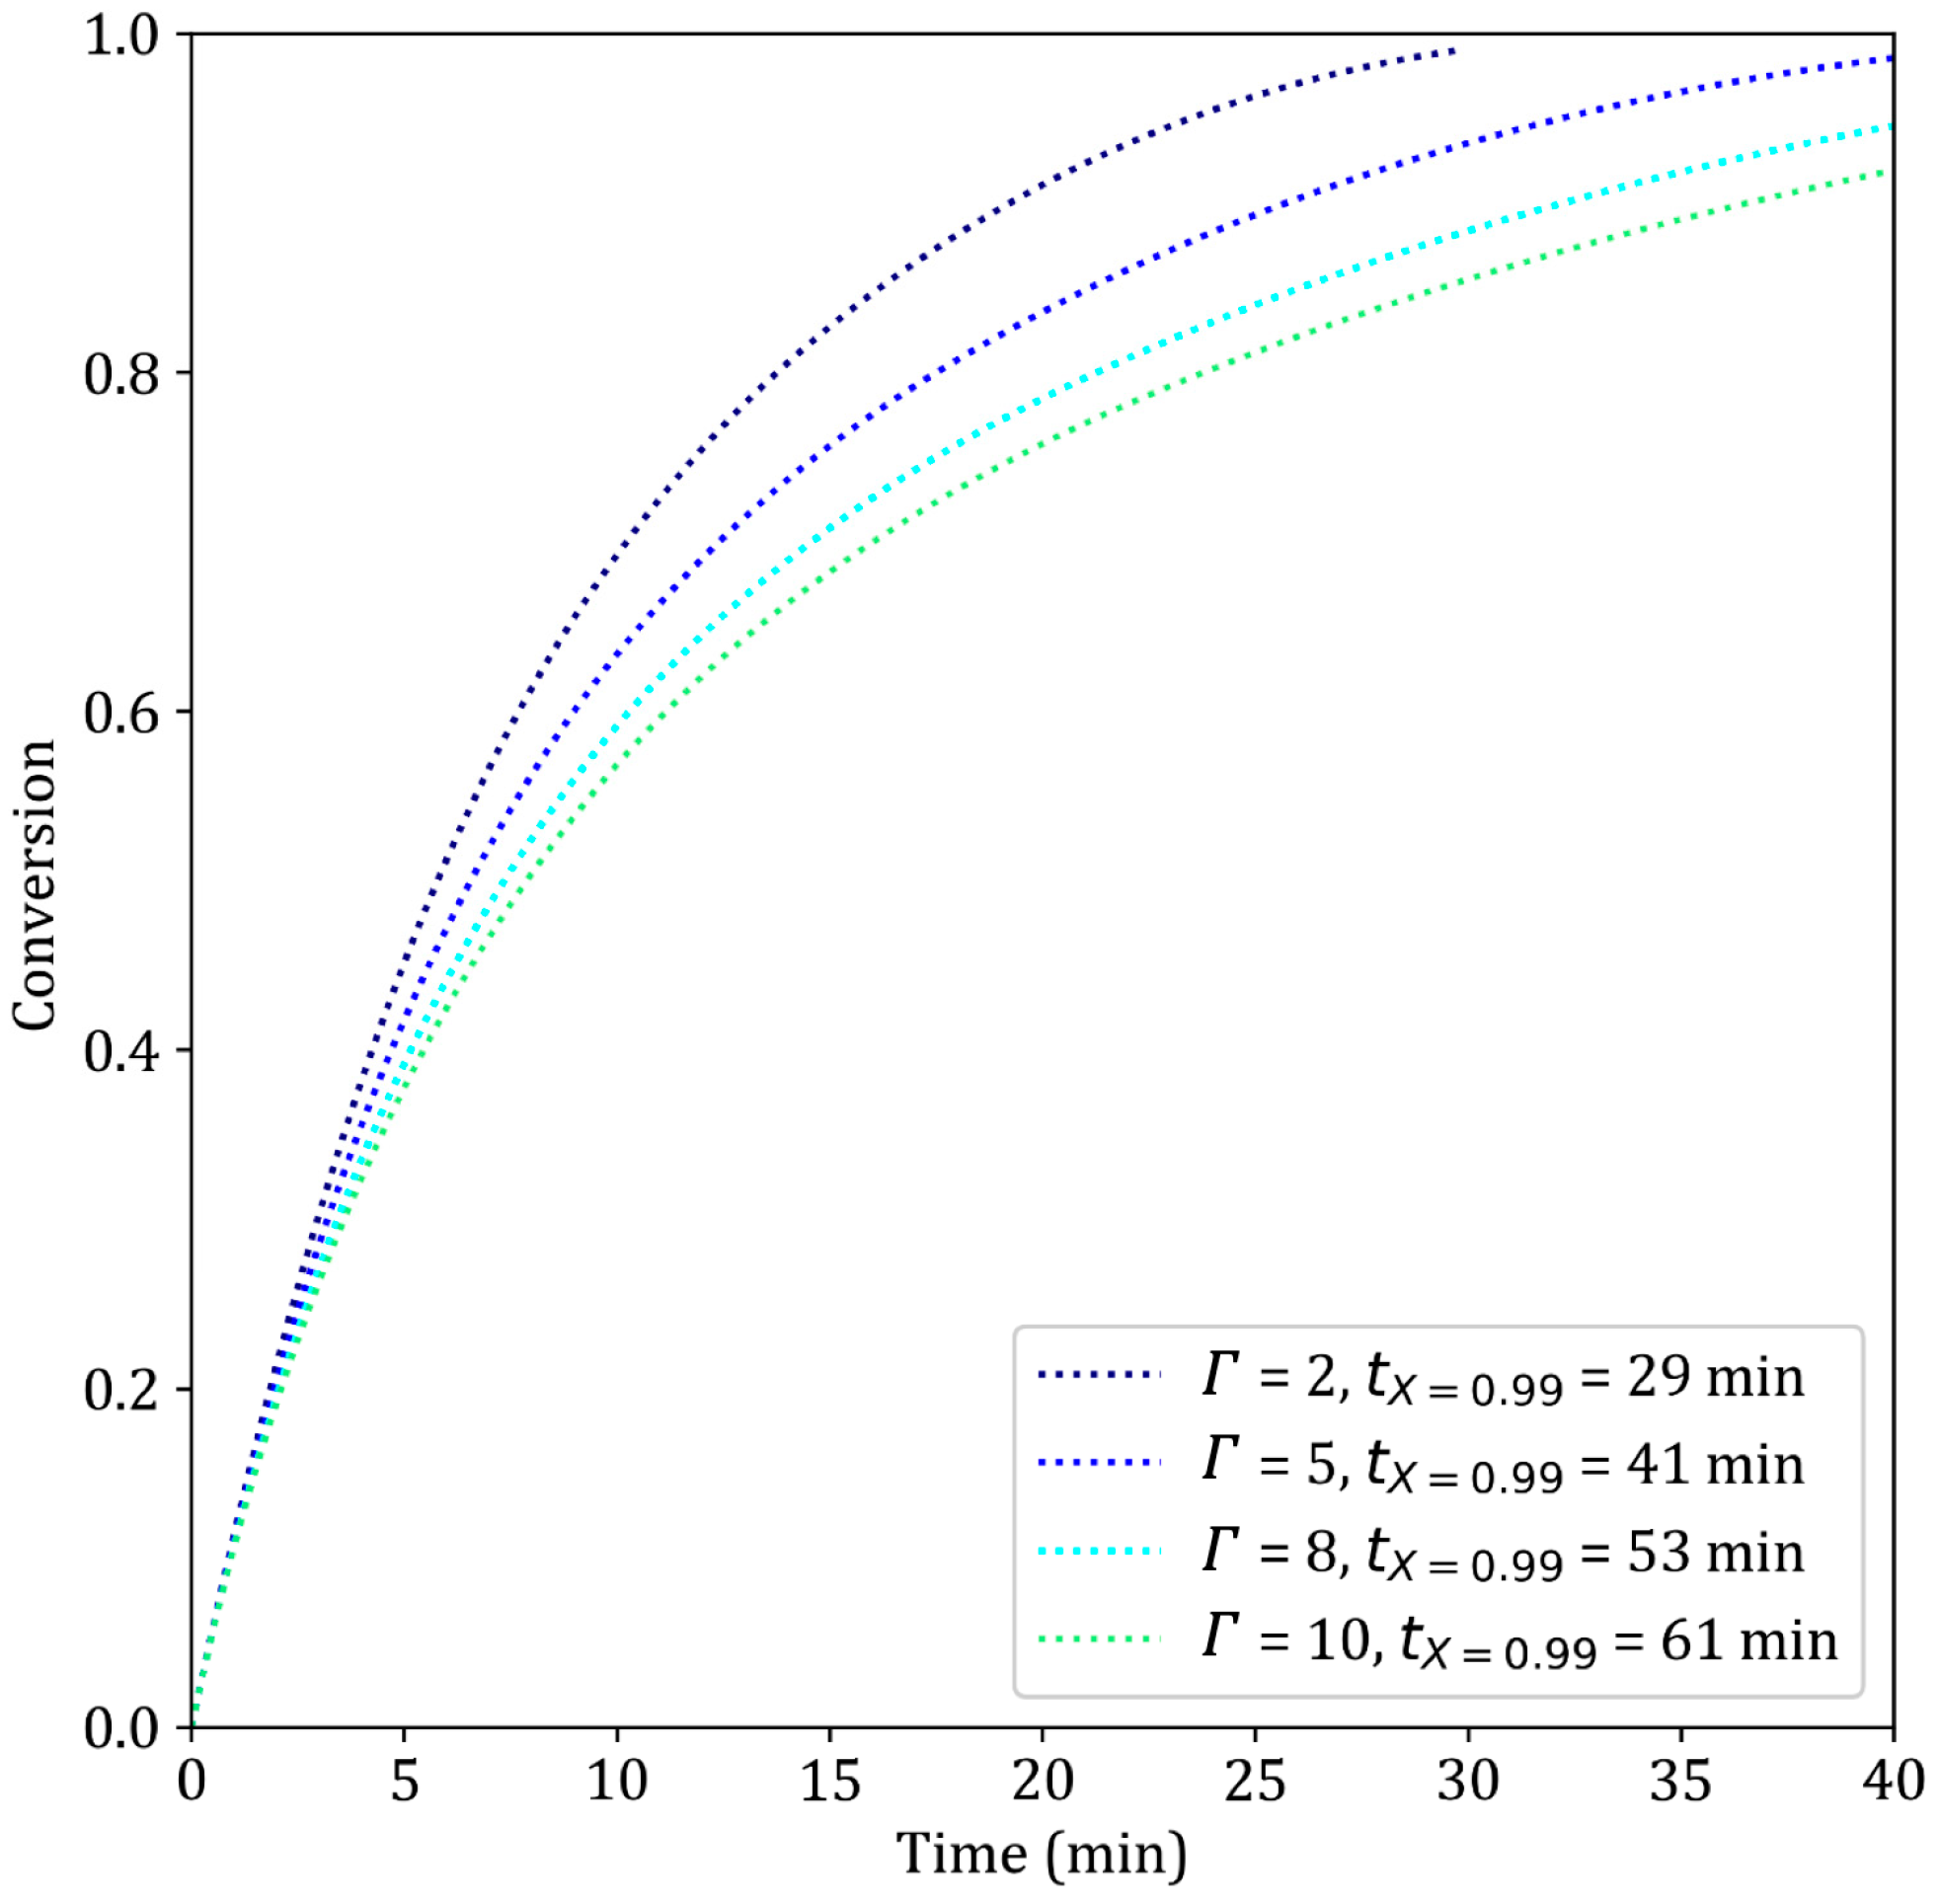
Tortuosity is an important parameter in regard to kinetic control since it is inversely proportional to the diffusion coefficient and proportional to the reaction modulus. An increase in tortuosity increases the characteristic time associated with diffusion and makes the kinetic regime more diffusion-controlled (Table 4, lines 2 and 8). As shown in Figure 15, increasing the tortuosity from 2 to 5 results in a 41% increase in the time necessary to reach 99% conversion, from 29 to 41 min. Models with greater tortuosity values usually exhibit lower activation energies, especially for the third reaction [40]. In contrast, situations in which chemical control is largely predominant give less importance to tortuosity, as shown in [9]. Physically, tortuosity should be in the range of 1–3 [34]; hence, we chose a moderate value of 2 in this work.

3.5.4. Effect of the Initial Specific Surface Area

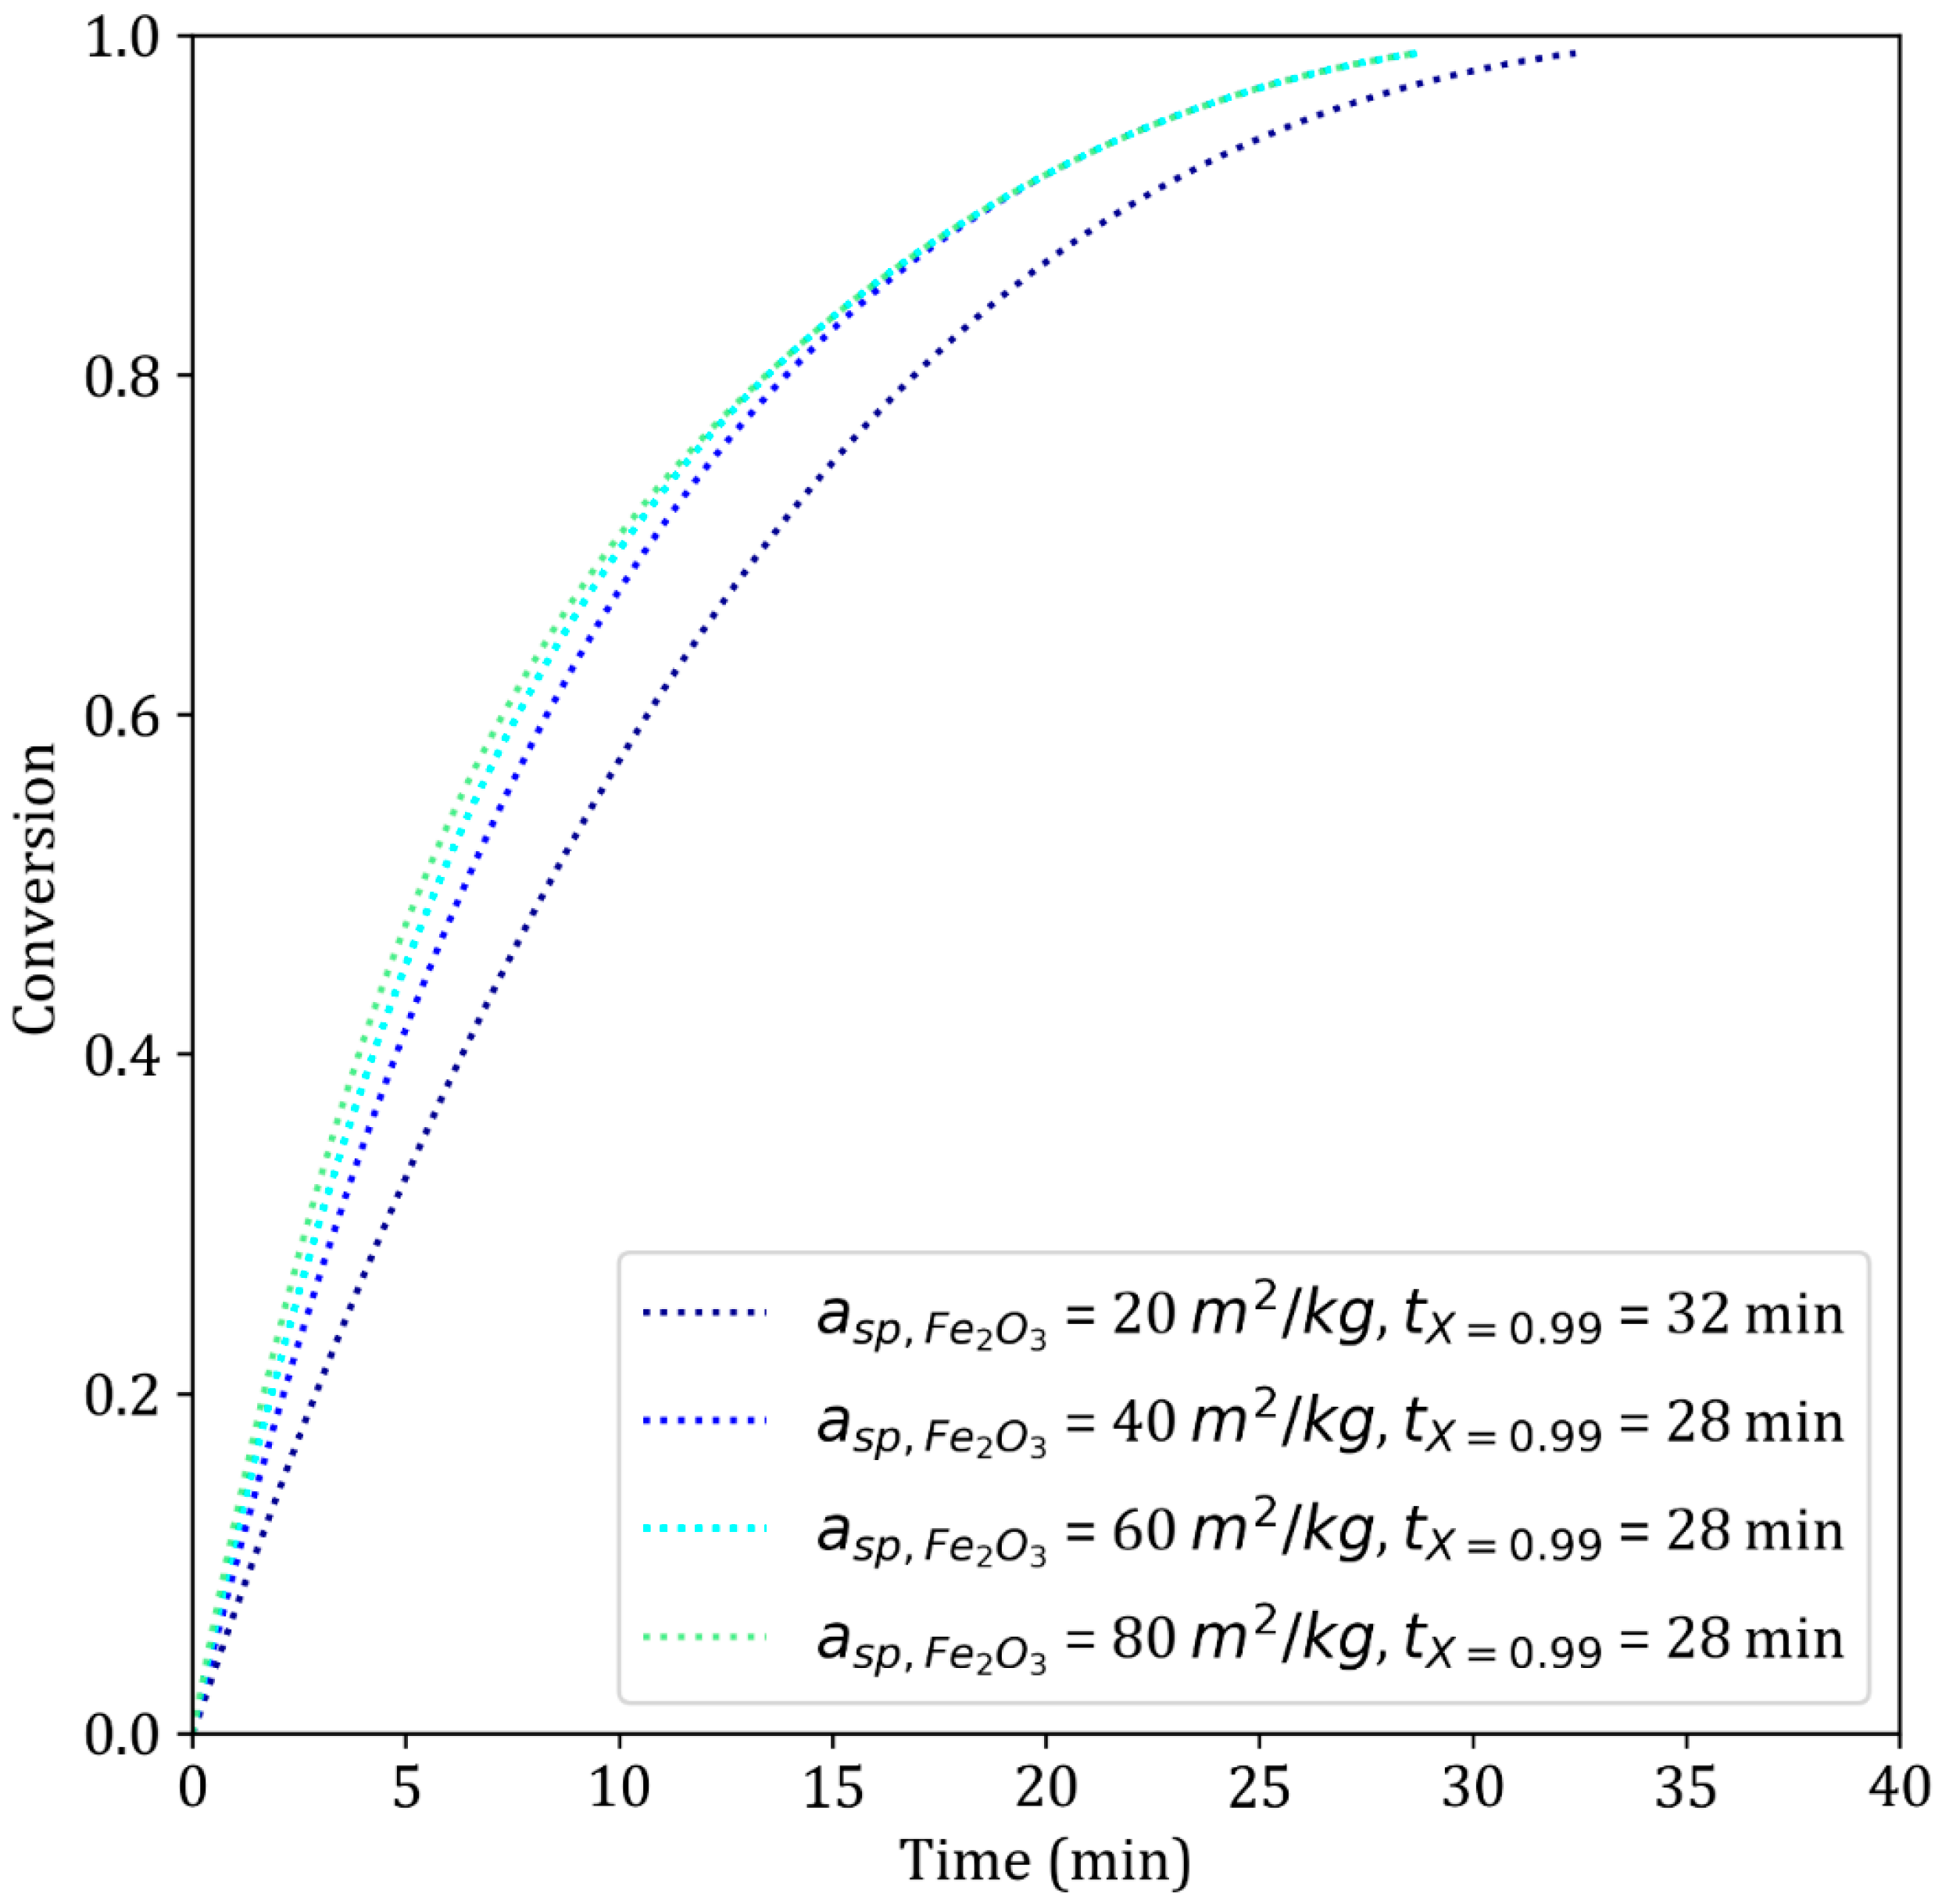
The specific surface area is highly valuable since it is a macroscopic parameter that can be easily measured. In the model, it is inversely proportional to the grain diameter, as suggested in [32]. Commercial pellets typically exhibit specific surface areas ranging from 20–60 m2 kg−1 [34]. Our simulations show (Figure 16) that increasing the initial specific surface area within this range has a minor effect on the reduction time. The reaction starts faster since the first two reactions are under chemical control (Table 4, lines 9 and 2). In the third reaction, the specific surface area is determined by the size of the crystallites (Figure 2), which is independent of the size of the initial grains and thus of the initial specific surface area.

3.6. General Discussion

Conclusions were drawn from the study of the hydrogen reduction of pellets with various single parameters. At this point, a few more general observations can be made:
-
The reduction of iron oxides with hydrogen is limited mainly by the local chemical reactions, also called phase-boundary control [38]. The numerical parametric study conducted with the model shows that decreasing the diffusion resistance, e.g., increasing the porosity, has quite limited effects on the reduction rate.
-
The results indicate that the major parameters to be tuned for the reduction of iron ore pellets are the reduction temperature and the pellet diameter, which agrees with [10]. The molar fraction of hydrogen also plays a great role (if it is diluted or not), as do the molar fraction of water vapor, the initial amount of oxides and the gas flow rate, as corroborated by [19]. Conversely, the initial porosity does not seem to play such an important role in the reduction reaction, as previously observed by [10].
-
For moderate flow rates (e.g., 1 Nlpm H2), a high reaction rate leads to substantial hydrogen depletion in the furnace. The atmosphere is partially replaced with water vapor, so assuming a static gas atmosphere is not reasonable. Thus, traditional single pellet reduction models (SCM and GM) cannot correctly describe the reduction reaction at low to medium flow rates in a laboratory furnace. More recent studies [8,9,40] tend to incorporate this evolution of the gas mixture during reduction using more complex models than the present model does. Note that industrial blast or shaft furnaces are not likely concerned by local hydrogen depletion in view of the high gas flow rates used.
-
In situations of high water vapor content and hydrogen depletion, discrepancies appear between the simulation and experimental results. This is the case for situations with low flow rates, large pellet diameters and high inlet water vapor contents. According to the literature, this is probably due to the poisoning effect of water vapor, which is adsorbed at reaction sites [38,39]. The decrease in the number of reaction sites available for hydrogen reduction hinders nucleation, which leads to a major slowdown at the start of the third reaction.
-
Most operating parameters are directly related to one another in such a way that the analysis is quite intricate. For example, increasing the size of the pellet also increases the amount of oxides to be reduced, which can lead to hydrogen depletion in the furnace and complicate the analysis.
-
One possible way to separate the contributions of gas diffusion and local chemical reactions is to study the reduction under specific operating conditions. The high temperature, large diameter and high pressure make the diffusion rate-limiting [13,17]. Conversely, low temperatures, small diameters and low pressures make the local chemical reaction rate-limiting.

4. Conclusions

An extensive parametric study of the reduction of iron ore pellets by hydrogen was carried out via both laboratory experiments and modeling.
A new single pellet kinetic model was developed to describe the reduction of an iron ore pellet with hydrogen under dynamic gas conditions. This model is based on the grainy pellet model, in which we incorporate the law of additive reaction times and the evolution of gas composition due to reactant consumption. This model was validated against results from both TGA and fixed bed devices. Kinetic parameters were obtained through curve fitting; the values of activation energies obtained are close to those reported in the literature. The main conclusions of this work are as follows:
-
The model can qualitatively and quantitatively describe the reduction of an iron ore pellet across a wide range of operating conditions, especially under dynamic gas conditions.
-
For the temperature range considered (600–900 °C), there is a direct link between the reduction of a pellet in a TGA system and the reduction of iron ore pellets in a small fixed bed. No particular effect of the bed on the reduction rate was observed.
-
The most decisive parameters for increasing the reaction rate are the temperature, pellet diameter, pressure, gas flow rate and gas composition. The initial porosity of a sample does not seem to have a major influence on the reaction rate. The graphical abstract schematically illustrates these results.
-
The measured rate of reduction of iron oxides in the presence of a high water vapor content is lower than what is simulated. The same is observed in situations where the pellet is large or the gas flow rate is very low. This is attributed to the poisoning effect of water vapor, which adsorbs on reaction sites instead of hydrogen.
In addition to the cases studied, this approach allows us to predict the behavior of pellets during reduction and can help identify suitable pellet properties. The MGPM can be implemented in multiparticle reactor models, such as shaft furnace simulation models. The above-mentioned current limitations of the model could be lifted as follows: introducing nucleation kinetics in connection with the water vapor poisoning effect, modeling the formation of cracks at high temperature that enhance gas diffusion, and further characterizing the pore and grain evolution to better describe the influence of the pellet diameter and the slowdown at 700–750 °C. The extension of the model to non-isothermal conditions) also deserves to be considered.

Author Contributions

A.M.: Conceptualization, Methodology, Investigation, Writing—original draft, Writing—review & editing. J.-B.L.: Methodology, Investigation. O.M.: Conceptualization, Validation, Writing—review & editing. F.P.: Conceptualization, Methodology, Validation, Writing—review & editing, Administration and Funding. All authors have read and agreed to the published version of the manuscript.

Funding

The authors gratefully acknowledge the financial support provided by the European Commission through the Horizon Europe MaxH2DR project (grant agreement 101058429).

Data Availability Statement

The original contributions presented in this study are included in the article material. Further inquiries can be directed to the corresponding author.

Acknowledgments

The authors warmly thank their partners in the MaxH2DR project, especially Pramod Gupta and Jan van der Stel from Tata Steel, (IJmuiden, The Netherlands), for the fixed bed experiments. The authors are also grateful to Emie Berthelet for her help with the optimization method.

Conflicts of Interest

The authors declare no conflicts of interest.

Abbreviations

The following abbreviations are used in this manuscript:
CFDComputational fluid dynamics
GMGrain model
H2-DRHydrogen direct reduction of iron ore
H2-DRSFHydrogen direct reduction shaft furnace
LARTLaw of additive reaction times
MGPMModified grainy pellet model
SCMShrinking core model
SEMScanning electron microscopy
TGAThermogravimetry analysis
TTTTime-temperature-transformation

Nomenclature

The following notations are used in this manuscript:
Latin
a s p , F e 2 O 3 Initial specific area of the hematite pellets, m2 kg−1
ctMolar concentration of the gas mixture, mol m−3
d0,crystDiameter of the crystallites at the wustite stage, m
dcrystDiameter of the crystallites at the iron stage, m
dfurnaceFurnace diameter, m
dgrainDiameter of the grains of the pellet, m
dpDiameter of the pellet, m
dsIron oxide characteristic diameter, m
DeffEffective diffusion coefficient of the gas inside the pores, m2 s−1
DKnKnudsen diffusion coefficient of the gas inside the pores, m2 s−1
DmixMolecular diffusion coefficient of hydrogen in the gas, m2 s−1
EaActivation energy related to a chemical kinetic constant, J mol−1
f, g, hConversion functions (Table A1)
FgGas flow rate, m3 s−1
fmReaction driving force, mol m−3
kKinetic factor associated with a characteristic time, m s−1
k0Frequency factor associated with a chemical kinetic constant, m s−1
mPellet mass, kg
PGas pressure, bar
RIdeal gas constant, J mol−1 K−1
rXReaction rate, s−1
SH2,iSource term, mol s−1 m−3
tTime, s
tXTime to reach a specific conversion degree, s
TTemperature, K
uzAxial superficial velocity of the gas, m s−1
wjPellet mass fraction of species j
xjGas molar fraction of species j
XConversion degree
zVertical coordinate, m
ZiVertical position of slice i
Greek
αStoichiometric factor associated with a characteristic time
ΓPellet tortuosity
ϵPellet porosity
θPolar angle
ρ s Iron oxide molar density, mol m−3
ρ p Initial mass density of the pellet, kg m−3
τCharacteristic time, s
Subscripts
jReduction reaction index, j = 1,2 or 3
zAxial coordinate
XIron oxide conversion
chemLocal chemical reaction
diffGas diffusion in the pores
extGas external diffusion

Appendix A. Characteristic Time Constants

Please refer to the main text for the notation and the reference.
Table A1. Characteristic times and conversion functions used in the model.
Hematite → MagnetiteMagnetite → WustiteWustite → Iron
External mass transfer τ e x t 1 , A = ρ ~ F e 2 O 3 d p 18 k g c t ( x A , x A , e q 1 ) τ e x t 2 , A = 8 ρ ~ F e 3 O 4 d p 57 k g c t ( x A , x A , e q 2 ) τ e x t 3 , A = ρ ~ F e 0.95 O d p 6 k g c t ( x A , x A , e q 3 )
Intergrain diffusion τ d i f f 1 i n t e r g , A = ρ ~ F e 2 O 3 d p 2 72 D i n t e r g 1 , A c t ( x A , x A , e q 1 ) τ d i f f 2 i n t e r g , A = 2 ρ ~ F e 3 O 4 d p 2 57 D i n t e r g 2 , A c t ( x A , x A , e q 2 ) /
Intragrain diffusion/ τ d i f f 2 i n t r a g , A = 2 ρ ~ F e 3 O 4 d g r a i n 2 57 D i n t r a g 2 , A c t ( x A , x A , e q 2 ) /
Intercrystallite
diffusion
// τ d i f f 3 i n t e r c , A = 2 ρ ~ F e 0.95 O d p 2 24 D i n t e r c 3 , A c t ( x A , x A , e q 3 )
Solid–state
diffusion
// τ d i f f 3 i n t r a c , A = ρ ~ F e 0.95 O d c r i s t , i n i 2 24 D s o l ( c O x , e q c O x , )
Local chemical reaction τ c h e m 1 , A = ρ ~ F e 2 O 3 d g r a i n 6 k 1 , A c t ( x A , x C , K e q , 1 ) τ c h e m 2 , A = ρ ~ F e 3 O 4 d g r a i n 2 k 2 , A c t ( x A , x C , K e q , 2 ) τ c h e m 1 , A = ρ ~ F e 0.95 O d c r i s t , i n i 2 k 3 , A c t ( x A , x C , K e q , 3 )
The conversion functions below are the same for the three subreactions
Chemical conversion function f X = 1 1 X 1 3
Diffusion conversion function g X = 1 3 1 X 2 3 + 2 1 X
External transfer conversion function h X = X
The kinetic parameters k1,A… are discussed in the main text. Note that the expressions of the chemical reaction times correspond to reactions that are first order with respect to hydrogen, as evidenced by many authors, e.g., [16].
The diffusion parameters are determined as follows. The effective diffusion coefficients (Dinterg, Dintrag, etc.) consider the complex gas diffusion through the pores of the pellet. For a gas species A, these are as follows:
D A , e f f   =   ϵ Γ 1 D A , m i x + 1 D A , K n  
where ε is the porosity of the ash layer, which is the layer through which the reactant gas diffuses to reach the oxide phase undergoing reduction; Γ is the tortuosity factor accounting for nonstraight pores; DA,mix is the molecular coefficient of diffusion of A in the gas mixture; and D A , K n is the Knuden coefficient of diffusion, which must be considered in the case of small pores. Their respective expressions are as follows:
D A , m i x   =   1 x A i A x i D A i
where xi is the molar fraction of each gas i and where D A i is the binary diffusion coefficient of gas A and gas i; the latter is derived from the Chapman–Enskog theory, e.g., [41]; and
D A , K n = d p o r e s 3 8 R T π M A
where d p o r e s is the mean diameter of the pores and where M A is the molecular mass of gas A.

References

  1. Patisson, F.; Mirgaux, O. Hydrogen Ironmaking: How It Works. Metals 2020, 10, 922. [Google Scholar] [CrossRef]
  2. Shahabuddin, M.; Brooks, G.; Rhamdhani, M.A. Decarbonisation and Hydrogen Integration of Steel Industries: Recent Development, Challenges and Technoeconomic Analysis. J. Clean. Prod. 2023, 395, 136391. [Google Scholar] [CrossRef]
  3. Zare Ghadi, A.; Radfar, N.; Valipour, M.S.; Sohn, H.Y. A Review on the Modeling of Direct Reduction of Iron Oxides in Gas-Based Shaft Furnaces. Steel Res. Int. 2023, 94, 2200742. [Google Scholar] [CrossRef]
  4. MaxH2DR. 2025. Available online: https://www.estep.eu/clean–steel–partnership/maxh2dr (accessed on 8 August 2025).
  5. Ali, M.L.; Fradet, Q.; Riedel, U. Particle-Resolved Computational Modeling of Hydrogen-Based Direct Reduction of Iron Ore Pellets in a Fixed Bed. Part I: Methodology and Validation. Int. J. Hydrogen Energy 2024, 87, 332–343. [Google Scholar] [CrossRef]
  6. Elsherbiny, A.A.; Qiu, D.; Wang, K.; Li, M.; Ahmed, M.; Hammam, A.; Zhu, Y.; Song, W.; Galal, A.M.; Chen, H.; et al. Parametric Study on Hematite Pellet Direct Reduction by Hydrogen. Powder Technol. 2024, 435, 119434. [Google Scholar] [CrossRef]
  7. Hessling, O.; Fogelström, J.B.; Kojola, N.; Martinsson, J. Influence of Water Content on the Kinetics and Mechanisms of Hydrogen Reduction Using Industrial Iron Ore Pellets at 873 K–1173 K. ISIJ Int. 2024, 64, 1493–1502. [Google Scholar] [CrossRef]
  8. Kazemi, M.; Pour, M.S.; Sichen, D. Experimental and Modeling Study on Reduction of Hematite Pellets by Hydrogen Gas. Met. Mater. Trans. B 2017, 48, 1114–1122. [Google Scholar] [CrossRef]
  9. Meshram, A.; Govro, J.; OMalley, R.J.; Sridhar, S.; Korobeinikov, Y. Modeling Isothermal Reduction of Iron Ore Pellet Using Finite Element Analysis Method: Experiments & Validation. Metals 2022, 12, 2026. [Google Scholar] [CrossRef]
  10. Metolina, P.; Ribeiro, T.R.; Guardani, R. Hydrogen-Based Direct Reduction of Industrial Iron Ore Pellets: Statistically Designed Experiments and Computational Simulation. Int. J. Miner. Met. Mater. 2022, 29, 1908–1921. [Google Scholar] [CrossRef]
  11. Ohmi, M.; Usui, T. Improved Theory on the Rate of Reduction of Single Particles and Fixed Beds of Iron Oxide Pellets with Hydrogen. Trans. Iron Steel Inst. Jpn. 1982, 22, 66–74. [Google Scholar] [CrossRef]
  12. Sadeghi, B.; Cavaliere, P.; Bayat, M.; Ebrahimzadeh Esfahani, N.; Laska, A.; Koszelow, D. Experimental Study and Numerical Simulation on Porosity Dependent Direct Reducibility of High-Grade Iron Oxide Pellets in Hydrogen. Int. J. Hydrogen Energy 2024, 69, 586–607. [Google Scholar] [CrossRef]
  13. Turkdogan, E.T.; Vinters, J.V. Gaseous Reduction of Iron Oxides: Part I. Reduction of Hematite in Hydrogen. Met. Trans. 1971, 2, 3175–3188. [Google Scholar] [CrossRef]
  14. Valipour, M.S.; Motamed Hashemi, M.Y.; Saboohi, Y. Mathematical Modeling of the Reaction in an Iron Ore Pellet Using a Mixture of Hydrogen, Water Vapor, Carbon Monoxide and Carbon Dioxide: An Isothermal Study. Adv. Powder Technol. 2006, 17, 277–295. [Google Scholar] [CrossRef]
  15. Szekely, J.; Evans, J.W.; Sohn, H.Y. Gas-Solid Reactions; Academic Press: New York, NY, USA, 1976. [Google Scholar]
  16. El-Geassy, A.A. Gaseous Reduction of Fe2O3 Compacts at 600 to 1050 °C. J. Mater. Sci. 1986, 21, 3889–3900. [Google Scholar] [CrossRef]
  17. Olsson, R.G.; McKewan, W.M. Diffusion of H2-H2O through Porous Iron Formed by the Reduction of Iron Oxides. Met. Trans. 1970, 1, 1507–1512. [Google Scholar] [CrossRef]
  18. Özgün, Ö.; Dirba, I.; Gutfleisch, O.; Ma, Y.; Raabe, D. Green Ironmaking at Higher H2 Pressure: Reduction Kinetics and Microstructure Formation During Hydrogen-Based Direct Reduction of Hematite Pellets. J. Sustain. Metall. 2024, 10, 1127–1140. [Google Scholar] [CrossRef]
  19. Fradet, Q.; Kurnatowska, M.; Riedel, U. Thermochemical Reduction of Iron Oxide Powders with Hydrogen: Review of Selected Thermal Analysis Studies. Thermochim. Acta 2023, 726, 179552. [Google Scholar] [CrossRef]
  20. Zhang, A.; Monaghan, B.J.; Longbottom, R.J.; Nusheh, M.; Bumby, C.W. Reduction Kinetics of Oxidized New Zealand Ironsand Pellets in H2 at Temperatures up to 1443 K. Met. Mater. Trans. B 2020, 51, 492–504. [Google Scholar] [CrossRef]
  21. Edström, J.O. The Mechanism of Reduction of Iron Oxides. J. Iron Steel Inst. 1953, 175, 289–304. [Google Scholar]
  22. Kim, S.-H.; Zhang, X.; Ma, Y.; Souza Filho, I.R.; Schweinar, K.; Angenendt, K.; Vogel, D.; Stephenson, L.T.; El-Zoka, A.A.; Mianroodi, J.R.; et al. Influence of Microstructure and Atomic-Scale Chemistry on the Direct Reduction of Iron Ore with Hydrogen at 700 °C. Acta Mater. 2021, 212, 116933. [Google Scholar] [CrossRef]
  23. Ma, Y.; Souza Filho, I.R.; Zhang, X.; Nandy, S.; Barriobero-Vila, P.; Requena, G.; Vogel, D.; Rohwerder, M.; Ponge, D.; Springer, H.; et al. Hydrogen-Based Direct Reduction of Iron Oxide at 700 °C: Heterogeneity at Pellet and Microstructure Scales. Int. J. Miner. Met. Mater. 2022, 29, 1901–1907. [Google Scholar] [CrossRef]
  24. Tsay, Q.T.; Ray, W.H.; Szekely, J. The Modeling of Hematite Reduction with Hydrogen plus Carbon Monoxide Mixtures: Part I. The Behavior of Single Pellets. AIChE J. 1976, 22, 1064–1072. [Google Scholar] [CrossRef]
  25. Skaf, A.; Tiruta-Barna, L.; Ahmadi, A. Assessing the Potential of Low-Temperature Ironmaking Using Pure Hydrogen in Shaft Reactors. Chem. Eng. Sci. 2025, 304, 121049. [Google Scholar] [CrossRef]
  26. Sohn, H.Y. The Law of Additive Reaction Times in Fluid-Solid Reactions. Met. Trans. B 1978, 9, 89–96. [Google Scholar] [CrossRef]
  27. Dussoubs, B.; Jourde, J.; Patisson, F.; Houzelot, J.-L.; Ablitzer, D. Modelling of a Moving Bed Furnace for the Production of Uranium Tetrafluoride. Part 2: Application of the Model. Chem. Eng. Sci. 2003, 58, 2629–2642. [Google Scholar] [CrossRef]
  28. MaxH2DR. 2025. Available online: https://www.estep.eu/assets/Projects/MaxH2DR/MaxH2DR_D2_D1.2_Procedures–for–the–determination–of–physical–properties–of–DR–raw–materials–intermediate–and–products.pdf (accessed on 8 August 2025).
  29. Ohmi, M.; Usui, T.; Naito, M.; Minamide, Y. Experimental Study of the Resistance Due to the Rate of Gas Flow on the Hydrogen Reduction of an Iron Oxide Pellet. ISIJ Int. 1983, 23, 81–89. [Google Scholar] [CrossRef]
  30. Kang, H.; Xu, Q.; Cao, Z.; Lu, X.; Shi, J.; Chen, B.; Guo, L. Influence of Hydrogen Flow Rate on Multistep Kinetics of Hematite Reduction. Int. J. Hydrogen Energy 2024, 49, 1255–1268. [Google Scholar] [CrossRef]
  31. Hessling, O. Some Aspects of Hydrogen Reduction of Iron Ore; KTH Royal Institute of Technology: Stockholm, Sweden, 2024. [Google Scholar]
  32. Ranzani Da Costa, A.; Wagner, D.; Patisson, F. Modelling a New, Low CO2 Emissions, Hydrogen Steelmaking Process. J. Clean. Prod. 2013, 46, 27–35. [Google Scholar] [CrossRef]
  33. Takahashi, R.; Takahashi, Y.; Yagi, J.; Omori, Y. Operation and Simulation of Pressurized Shaft Furnace for Direct Reduction. ISIJ Int. 1986, 26, 765–774. [Google Scholar] [CrossRef]
  34. Ranzani da Costa, A. La Réduction du Minerai de fer par L’hydrogène: Étude Cinétique, Phénomène de Collage et Modélisation. Ph.D. Dissertation, Institut National Polytechnique de Lorraine, Nancy, France, 2011. [Google Scholar]
  35. Hara, Y.; Sakawa, M.; Kondo, S. Mathematical Model of the Shaft Furnace for Reduction of Iron-Ore Pellet. Tetsu-to-Hagané 1976, 62, 315–323. [Google Scholar]
  36. Pineau, A.; Kanari, N.; Gaballah, I. Kinetics of Reduction of Iron Oxides by H2. Thermochim. Acta 2006, 447, 89–100. [Google Scholar] [CrossRef]
  37. Garg, P.; Hu, X.; Li, Y.; Li, K.; Nag, S.; Zhang, J. Kinetics of Iron Oxide Reduction in H2/H2O Gas Mixture: Global and Stepwise Reduction. Met. Mater. Trans. B 2022, 53, 1759–1774. [Google Scholar] [CrossRef]
  38. Spreitzer, D.; Schenk, J. Reduction of Iron Oxides with Hydrogen—A Review. Steel Res. int. 2019, 90, 1900108. [Google Scholar] [CrossRef]
  39. Tokuda, M.; Yoshikoshi, H.; Ohtani, M. Kinetics of the Reduction of Iron Ore. ISIJ Int. 1973, 13, 350–363. [Google Scholar] [CrossRef]
  40. Fradet, Q.; Ali, M.L.; Riedel, U. Development of a Porous Solid Model for the Direct Reduction of Iron Ore Pellets. Steel Res. Int. 2022, 93, 2200042. [Google Scholar] [CrossRef]
  41. Brodkey, R.S.; Hershey, H.C. Transport Phenomena: A Unified Aprroach; Brodkey Publishing: New York, NY, USA, 2003. [Google Scholar]
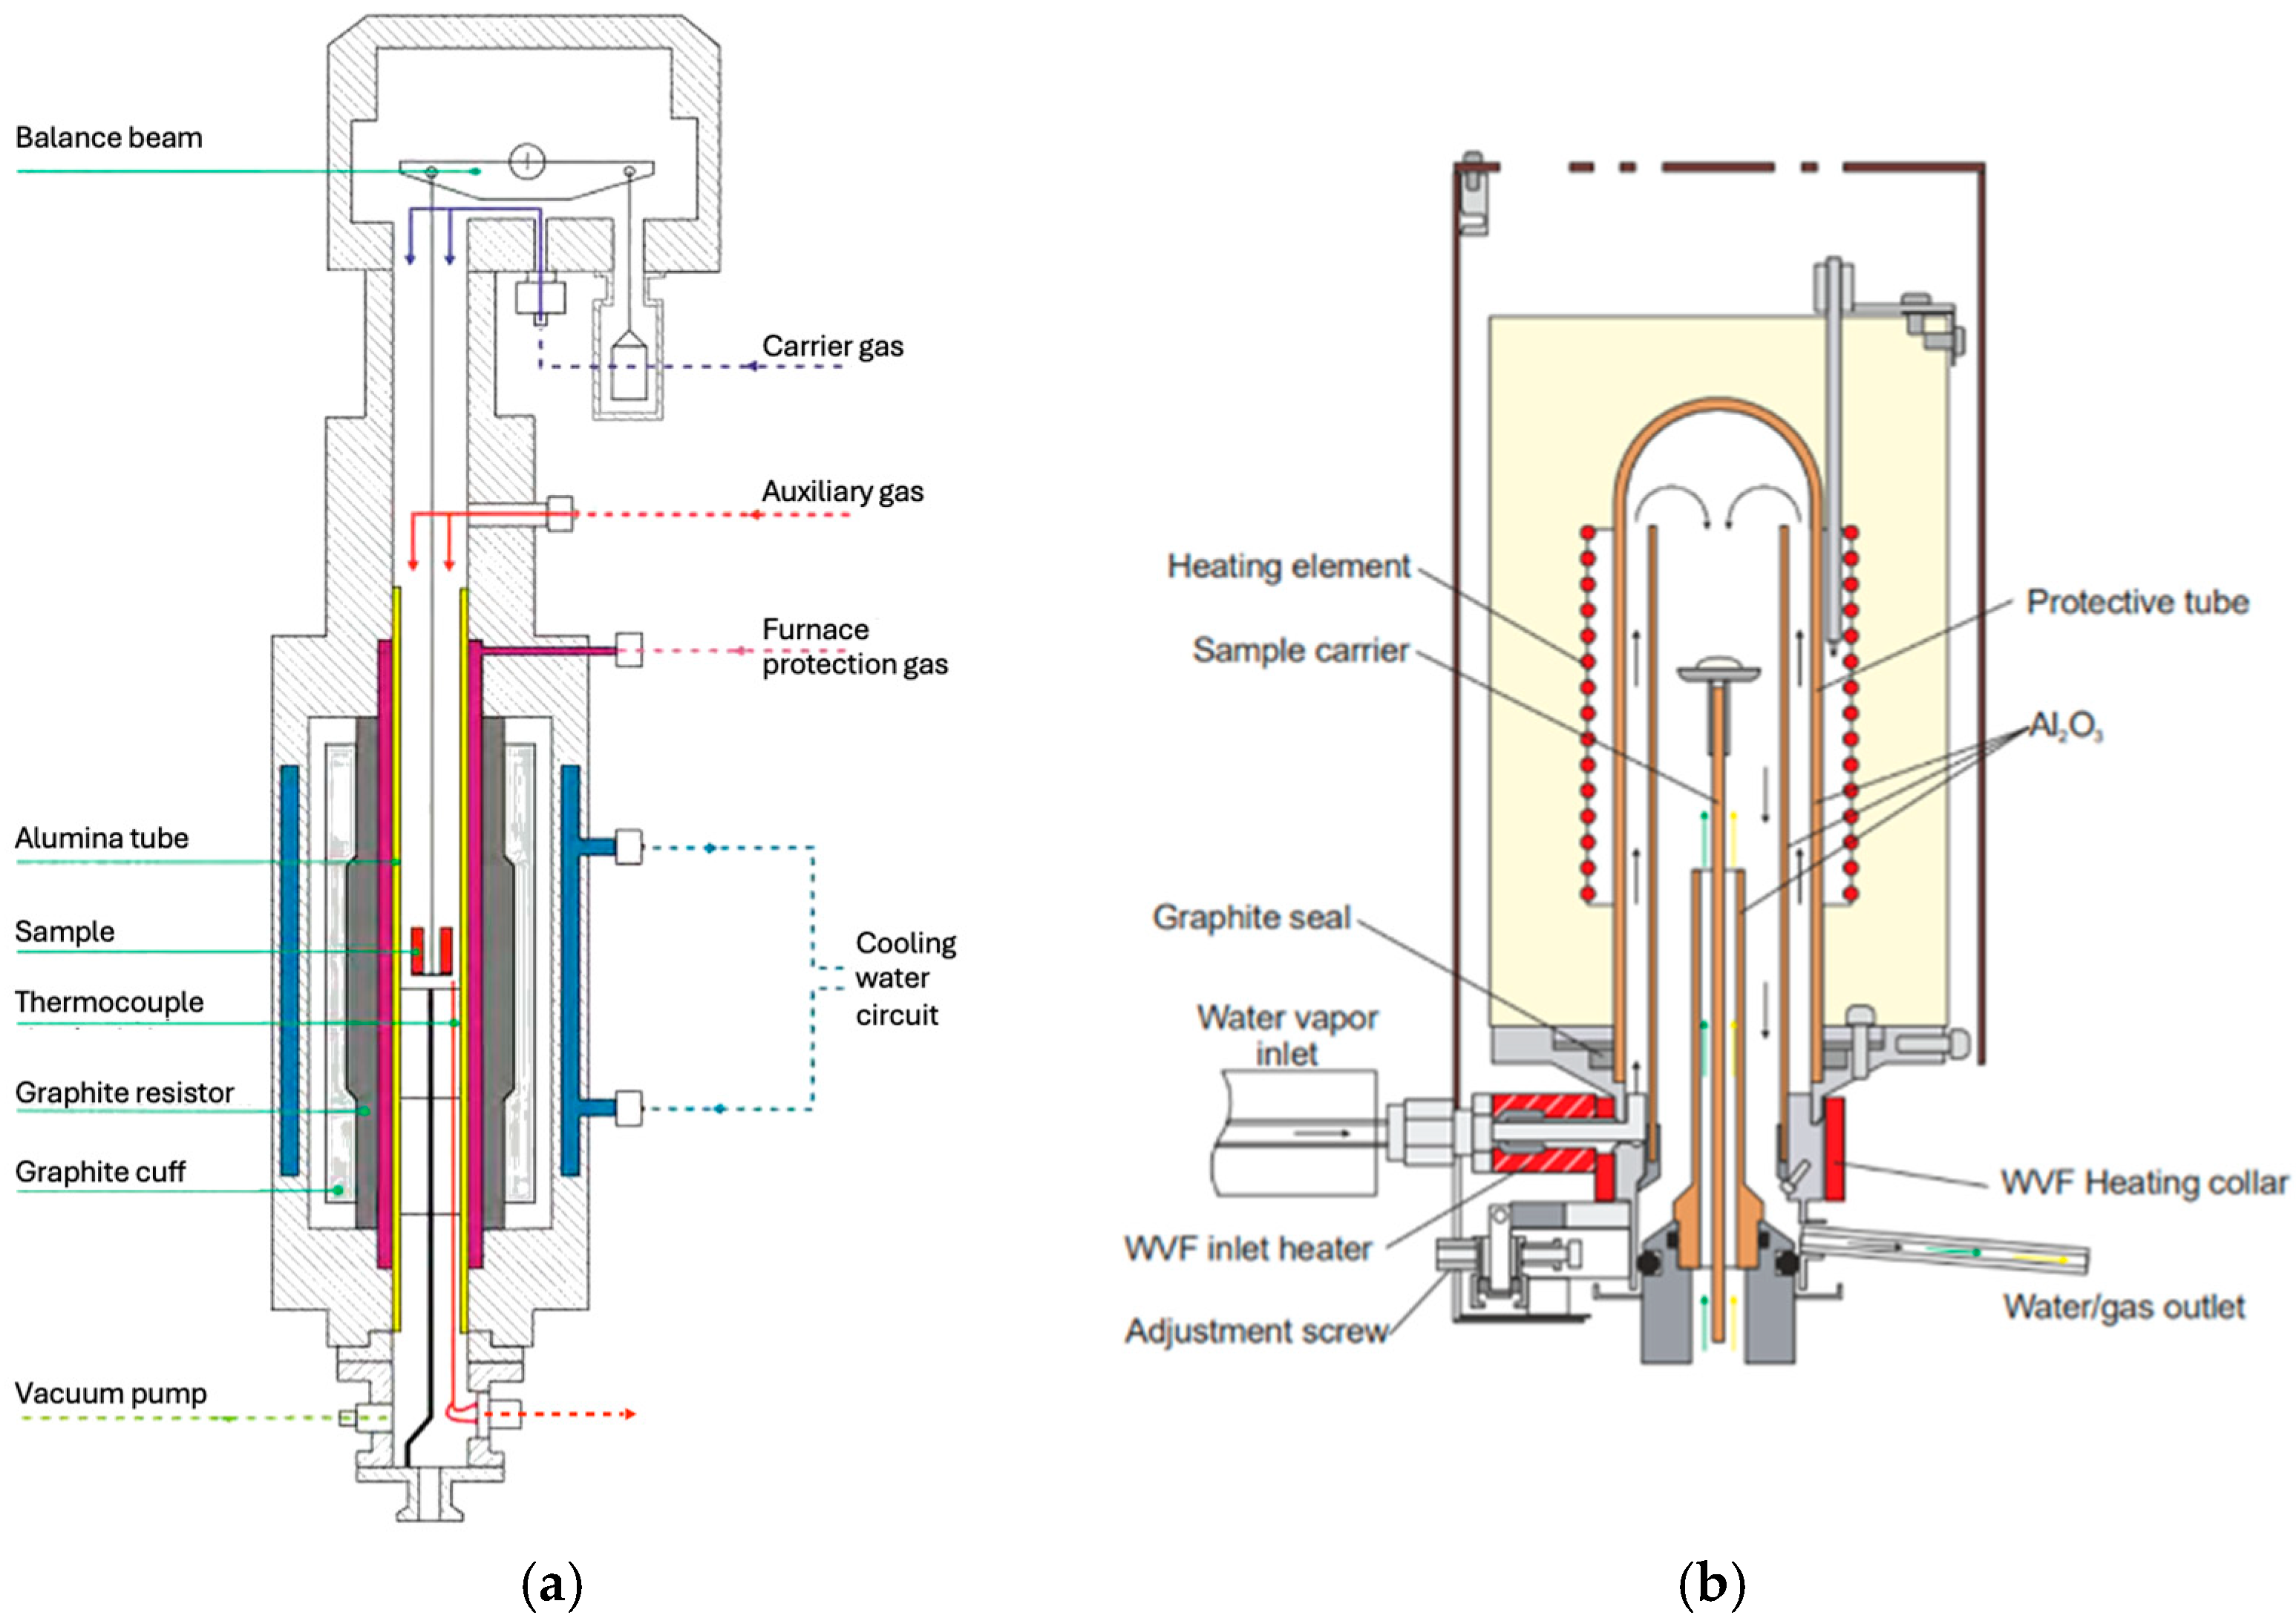
Figure 1. (a) Blueprint of the TG96 thermobalance (Setaram, France). In our setup, the carrier gas was He, the protection gas Ar, and the auxiliary gas H2. (b) Blueprint of the Jupiter thermobalance (Netzsch, Switzerland). In our setup, the carrier was He, the protection gas Ar, and the auxiliary gas a mix of H2 and H2O.
Metals 15 01034 g001
Figure 2. Modeled representation of the evolution of the pellet (top row) and grains (bottom row) during the reduction. Reprint from [1].
Metals 15 01034 g002
Figure 3. Discretization diagram. The gas present in the axial slice (i, i + 1) reduces the grains of the polar slice (θ, θ + ).
Metals 15 01034 g003
Figure 4. Flowchart of the MGPM computation.
Metals 15 01034 g004
Figure 5. Overview of the activation energies reported in the literature [5,24,33,34,35].
Metals 15 01034 g005
Figure 6. Simulated (dotted lines) Time and experimental (solid lines) reduction curves for the TG96 reduction experiments. The kinetic triplets were obtained through curve fitting of the experimental results.
Metals 15 01034 g006
Figure 7. Simulated (dotted lines) and experimental (solid lines) reduction curves for the fixed-bed experiments, with the kinetic triplets obtained through curve fitting achieved on (a) the fixed bed experimental results and (b) the TGA experimental results.
Metals 15 01034 g007
Figure 8. Time–temperature–transformation diagram for the reduction of medium-sized pellets by H2–He. dp = 13 mm, TG96 device.
Metals 15 01034 g008
Figure 9. Simulated (dotted lines) and experimental (solid lines) results of the reduction of iron ore pellets by H2–He at different helium dilution ratios. T = 900 °C, dp = 13 mm, TG96 device.
Metals 15 01034 g009
Figure 10. Simulated (dotted lines) and experimental (solid lines) results of the reduction of iron ore pellets by pure H2 at different gas flow rates. T = 900 °C, dp = 13 mm, TG96 device.
Metals 15 01034 g010
Figure 11. Simulated (dotted lines) and experimental (solid lines) results of the reduction of iron ore pellets by pure H2 for different water vapor molar fractions. T = 900 °C, dp = 13 mm, Jupiter device.
Metals 15 01034 g011
Figure 12. Simulated (dotted lines) and experimental (markers) results of the reduction of iron ore pellets by pure H2 for different pellet diameters at (a) 800 °C and (b) 900 °C. The experimental points were obtained from [10]. tX = 0.99 represents the time necessary to reach a conversion degree X = 99%.
Metals 15 01034 g012
Figure 13. Simulation results of the reduction of iron ore pellets by H2–He at different gas pressures. T = 900 °C, dp = 13 mm.
Metals 15 01034 g013
Figure 14. Simulation results of the reduction of iron ore pellets by H2–He for different initial porosities. T = 900 °C: (a) with constant pellet mass m = 4 g; (b) with constant pellet diameter dp = 13 mm.
Metals 15 01034 g014
Figure 15. Simulation results of the reduction of iron ore pellets by H2–He at different tortuosity values. T = 900 °C, dp = 13 mm.
Metals 15 01034 g015
Figure 16. Simulated results of the reduction of iron ore pellets by H2–He for different initial specific surface areas of hematite. T = 900 °C, dp = 13 mm.
Metals 15 01034 g016
Table 1. Chemical composition of the pellets [28].
PelletFeSiO2CaOAl2O3FeOB2MnOMgOTiO2P2O5
D1 ( d p < 13 mm)66.42.31.00.730.710.410.150.120.090.06
D2 ( d p > 13 mm)67.12.00.90.56<0.10.470.140.120.080.06
Table 2. Kinetic parameters obtained by model curve-fitting against TGA experiments.
Hematite → MagnetiteMagnetite → WustiteWustite → Iron
Frequency factor k 0,1 = 8.89 × 10 4   m   s 1 k 0,2 = 0.165   m   s 1 k 0,3 = 2.29   m   s 1
Activation energy E a , 1 = 30,584   J   m o l 1 E a , 2 = 80,721   J   m o l 1 E a , 3 = 115,864   J   m o l 1
Table 3. Base case parameters used in the simulations for the calibration of the kinetic triplets. Unless explicitly mentioned, these are also the parameters of the other experiments and simulations discussed in Section 3 and Section 4.
Operating parameters F g (Nlpm *) x H 2 x H e P (bar) d f u r n a c e (m)
1.80.550.4510.02
Pellet properties d p (m) w F e 2 O 3 w i n e r t ρ p (kg m−3) a s p , F e 2 O 3 (m2 kg−1)
0.012820.9630.037363060.4
* Nlpm stands for normo (standard)-liter per minute, 1.8 Nlpm = 3 × 10 5   m S T P 3   s 1 .
Table 4. Values of the reaction modulus ϕ under various conditions.
ϕ = τ d i f f τ c h e m ϕ 1   ( X = 5 % ) ϕ 2   ( X = 25 % ) ϕ 3   ( X = 60 % ) ϕ 4   ( X = 90 % )
B a s e   c a s e 0.030.100.430.69
T = 600   ° C 0.040.010.110.15
d p = 10.5   m m 0.010.050.240.38
d p = 16.5   m m 0.050.160.600.99
P = 6   b a r 0.210.632.394.12
ϵ = 0.15 0.070.160.50.8
Γ = 5 0.070.240.931.49
a s p = 20   m 2   k g 1 0.0060.020.440.60
Base case: T = 900 °C, dp = 13 mm, P = 1 bar, ε = 0.295, Γ = 2, and asp = 60.4 m2 kg−1. Each specific case was studied by varying one parameter at a time. In bold: base case; in blue: chemical control; in black: mixed control; in brown red: diffusion-predominated mixed control.
Disclaimer/Publisher’s Note: The statements, opinions and data contained in all publications are solely those of the individual author(s) and contributor(s) and not of MDPI and/or the editor(s). MDPI and/or the editor(s) disclaim responsibility for any injury to people or property resulting from any ideas, methods, instructions or products referred to in the content.