Article

Operating Solutions to Improve the Direct Reduction of Iron Ore by Hydrogen in a Shaft Furnace

Institut Jean Lamour, Université de Lorraine, CNRS, 54011 Nancy, France
*
Author to whom correspondence should be addressed.
Metals 2025, 15(8), 862; https://doi.org/10.3390/met15080862
Submission received: 24 June 2025 / Revised: 23 July 2025 / Accepted: 25 July 2025 / Published: 1 August 2025
(This article belongs to the Special Issue Recent Developments and Research on Ironmaking and Steelmaking)

Abstract

The production of iron and steel plays a significant role in the anthropogenic carbon footprint, accounting for 7% of global GHG emissions. In the context of CO2 mitigation, the steelmaking industry is looking to potentially replace traditional carbon-based ironmaking processes with hydrogen-based direct reduction of iron ore in shaft furnaces. Before industrialization, detailed modeling and parametric studies were needed to determine the proper operating parameters of this promising technology. The modeling approach selected here was to complement REDUCTOR, a detailed finite-volume model of the shaft furnace, which can simulate the gas and solid flows, heat transfers and reaction kinetics throughout the reactor, with an extension that describes the whole gas circuit of the direct reduction plant, including the top gas recycling set up and the fresh hydrogen production. Innovative strategies (such as the redirection of part of the bustle gas to a cooling inlet, the use of high nitrogen content in the gas, and the introduction of a hot solid burden) were investigated, and their effects on furnace operation (gas utilization degree and total energy consumption) were studied with a constant metallization target of 94%. It has also been demonstrated that complete metallization can be achieved at little expense. These strategies can improve the thermochemical state of the furnace and lead to different energy requirements.

Graphical Abstract

1. Introduction

The iron and steel sector accounts for 7% of global CO2 emissions and 8% of final energy demand [1]. Its sustainability relies on finding a breakthrough decarbonated alternative to the traditional blast furnace (BF), which uses coke to convert iron ore into pig iron before refining the latter in the basic oxygen furnace (BOF). The BF is responsible for 90% of the emissions and the vast majority of the energy needs of the BF-BOF route [2,3]. The hydrogen direct reduction shaft furnace (H2-DRSF) process is considered one of the most mature technologies to meet this decarbonization objective; it consumes hydrogen instead of coal and emits water vapor instead of carbon dioxide. Coupled with an electric arc furnace (EAF) for steelmaking, it could replace the usual BF-BOF route with an associated decrease in CO2 emissions that could reach 97%, assuming carbon-free hydrogen production [4]. This new route is the subject of many topical R&D and industrial projects; see [5,6] for recent reviews. The present work was carried out within the framework of such a project, namely MaxH2DR, funded by the European Commission.
A DRSF is a silo-like reactor made of a hollow cylinder sitting on top of a conical hopper. It is designed to work in a countercurrent way, meaning that iron oxide pellets fed at the top of the furnace travel downward and react with a hot ascending reducing gas fed at the bottom of the furnace or at the sidewall. DR shafts are currently used in industry in the Midrex and Energiron processes and constitute 5% of global steel production [7]. These processes rely on the use of syngas, a mixture of H2 and CO obtained from natural gas reforming, as a reducing agent. If the syngas is replaced with pure H2, one obtains the H2-DRSF process, which currently exists only at the pilot scale, as with the Swedish Hybrit project [8]. Passing H2-DRSF from the pilot scale to the industrial scale is an industrial challenge for which very few publications appear. While the switch from syngas to hydrogen with respect to the reduction reaction has been demonstrated as efficient, the design of the H2-DRSF process remains to be better specified. The present paper contributes to this topic by studying the influence of some unexplored operating conditions.
In a DRSF, the iron ore pellets are reduced by CO and H2. The resulting solid product, in the form of porous iron pellets, is called directly reduced iron (DRI) or sometimes sponge iron. It can further be compacted into hot briquetted iron (HBI) for storage and transportation. The reduction from hematite (Fe2O3) to iron occurs through intermediate oxides, magnetite (Fe3O4) and, above 570 °C, wustite (nonstoichiometric FeO). The reaction equations with H2 are as follows (with CO, replace H2 with CO and H2O with CO2). In these equations, wustite is written Fe0.95O, a composition which corresponds to the wustite/iron equilibrium at 800 °C; the reaction heats are taken from [2].
3 F e 2 O 3 s + H 2 g = 2 F e 3 O 4 s + H 2 O g                                                 Δ r H 800 ° C = 6020   J m o l 1
F e 3 O 4 s + 16 19 H 2 g = 60 19 F e 0.95 O s + 16 19 H 2 O g                           Δ r H 800 ° C = + 46,640   J m o l 1
F e 0.95 O s + H 2 g = 0.95 F e s + H 2 O g                       Δ r H 800 ° C = + 16,410   J m o l 1
The reduction of iron oxides with H2 as a whole is endothermic and is operated at high temperatures (800–1000 °C). In a DSRF, the necessary heat is provided by the reducing gas. Consequently, the furnace requires much more gas than the one required for the reduction reactions. To reach a full metallization at 900 °C, Chai et al. [9] indicate a molar ratio of hydrogen to iron of 3.6. This is much higher than the stoichiometric ratio of 1.5 and leads to a relatively low gas utilization degree (GUD) of approximately 0.33:
G U D = x H 2 O x H 2 O + x H 2 t o p
Since the gas utilization degree is limited and the specific (per unit of solid produced) gas consumption is high in H2-DRSF, the off-gas contains a massive amount of hydrogen that should be recycled via a top gas recycling setup. A gas loop is also present in natural gas-based DR processes, but it is even more necessary in the hydrogen-based DR process, for which the production of H2 represents by far the main energy needs of the process—the rest being split between gas heating and compression [10]. Such recycling requires the elimination of H2O from the off-gas by condensers and the purge of a part of the gas to avoid the accumulation of inert gas in the loop [11].
Numerous mathematical models of the DRSF have been developed to better understand the furnace behavior and help optimize the process. Recent comprehensive reviews of such models are available [12,13]. Thermodynamic models can predict the theoretical gas demand and relate gas and heat utilization in a DRSF [9,11,13]. Other thermodynamics-based models, such as modified Rist models, use graphical tools to determine operating points and perform process control [14]. For the most part, numerical models of the DRSF are based on the kinetics of the reduction of iron ore pellets derived from the three-interface shrinking core model (3-SCM) [15] or the grain model (GM) [16]. Kinetics play a central role in the reduction of iron ore pellets, especially for the wustite-to-iron reaction, the kinetics of which are often seen as the limiting step of the process. Both 3-SCM and GM rely on the idea that three phenomena can be rate-limiting for reduction: the mass transfer of gas to the surface of the pellet, its diffusion into the pores of the pellet, and the local chemical reaction between the reactant gas and iron oxide. An important feature of these models is their ability to describe reversible kinetics; otherwise, they fail to correctly describe the reduction [11]. To understand the intricate behavior of the countercurrent DRSF operation, numerical one-dimensional (1D) models using computational fluid dynamics (CFD) were developed [9,17,18,19,20] and validated against Midrex plant data [21,22,23]. To further study the issue of heat and reductant gas supply by considering the radial distributions of temperature and species, several models have been adapted in 2D [16,24,25,26,27,28,29,30]. Such models allow an accurate description of the cooling zone, the conical geometry of which has dramatic consequences for reactor behavior, especially when it is equipped with a so-called Christmas tree [28]. Novel approaches include 3D grids that model gas injections more accurately [31,32,33] or use the discrete element method (DEM) for solid flow description [34].
Some interesting conclusions can be drawn from these studies. High and narrow furnaces are preferable since they allow sufficient reduction time and avoid the presence of a cold zone when injecting from the sidewall [9,35]. Indeed, heat and reductant supply issues appear mainly at the center of the furnace because the reducing gas may not be able to reach this zone. To overcome this difficulty, increasing either the gas flow rate or the gas temperature appears to be a good option [31]. A higher bustle temperature also decreases the gas flow rate necessary for full metallization [18] and improves the degree of metallization and gas utilization [17]. A fraction of the feed gas may also be redirected to a central gas distribution system [27,30] or to a second lateral injection [24,36] to improve the distribution of H2 in the furnace and its overall thermochemical state. A second lateral injection located above the bustle gas injection can be fed with heated off-gas, thus avoiding the need for energy-intensive water [37]. Modifying the solid flow with a Christmas tree-type structure at the center of the furnace is another alternative to avoid the formation of a central “dead zone” [28]. Other solutions considered include the use of microwave heating in non-metallized zones to increase the temperature [38] and the charging of larger pellets at the center of the furnace to improve the permeability of the bed [26]. Small porous pellets are also good solutions for enhancing burden reducibility and strength at the cost of increasing the pressure drop.
In the present paper, we report further numerical simulations of an H2-DRSF associated with its gas circuit. The 2D axisymmetric model REDUCTOR [25,35] was modified and complemented with a model of the gas loop, as presented in Section 2. The results of a representative reference case with a 94% metallization degree are presented in Section 3. From this reference case, a parametric study was conducted to investigate the effects of hot charging, gas distribution and N2 content on the global furnace performances: metallization degree, gas utilization ratio and energy consumption.

2. Mathematical Model

2.1. Model of the H2-DRSF

2.1.1. Principle of the Mathematical Model

The 2D axisymmetric steady-state model REDUCTOR was adapted to simulate an H2-DRSF. REDUCTOR describes the solid and gas flows, the heat transfers and the chemical reactions taking place in a DRSF. Both the solid and gas phases are treated as continuous media, and the local mass, energy and momentum balance equations are solved via the finite volume method. The details of this model have been previously extensively presented [16,25,35,39], including a validation against plant data, which relied on a comparison between calculated and measured top gas and DRI characteristics. See [25] for further details. A summary, which includes the new features (gas flow numerical solution), is given below.
-
The solid burden is modeled as a pseudocontinuous stack of spherical pellets (dp = 15 mm) with a constant bed porosity ( ϵ b e d = 0.5 ). The solid flow is described according to Mullins’ model [40]. In this model, the radial velocity is proportional to the radial gradient of the axial velocity (Equation (5)):
u r , s = B u z , s r ( m   s 1 )
See the Nomenclature section for the notations.
-
The solid heat balance considers convection, conduction, heat exchange with the gas phase; the heat of the reactions is assumed to be entirely attributed to the solid phase (Equation (6)):
ρ b u z , s c p , s T s z + ρ b u r , s c p , s T s r = 1 r r r Γ r , e T s r + z Γ z , e T s z + a b h T g T s + n = 1 3 r n r H n           W   m 3
-
The gas flow through the packed bed of pellets is described via the Ergun equation [41], which can be combined with the gas continuity equation to solve for the pressure distribution (Equations (7) and (8)):
u g = 1 K P m   s 1
1 r r r c t K p r + z c t K p z = 0 m o l   m 3   s 1
-
The gas heat balance also considers convection, conduction and heat exchange, as well as a specific term related to the evolution of the gas heat capacity during the reaction:
ρ g u z , s c p , g T s z + ρ g u r , s c p , g T s r = 1 r r r Γ g T g r + z Γ g T g z + a b h T s T g + i S i T g T s c p , g , i d T           W   m 3
-
The pellets react according to a simplified grain model with the law of additive reaction times [42,43]. This kinetic model assumes that three distinct consecutive phenomena can be rate-limiting for each of the reduction reactions: gas diffusion in the bulk, gas diffusion in the pores of the pellet, and local chemical reactions. Each of these phenomena influences the reaction rate through a characteristic time τ , which can be expressed as:
τ = ρ s d p k f m   s   w i t h   f m = c H 2 c H 2 e q
where ρ s is the iron oxide molar density, k is a kinetic factor, and fm is the driving force of the reaction. For a specific set of gas compositions and temperatures, the instantaneous reaction rate of each reduction reaction is calculated with the law of additive reaction times:
v X = 1 τ c h e m f X + τ d i f f g X + τ e x t h X   s 1
where f, g, and h are conversion functions related to each phenomenon, and X is the conversion. See Ranzani et al. [16] for more details.
-
The temperatures and compositions of both phases at the inlets follow Dirichlet boundary conditions. The gas velocity is given at the gas inlet, the gas pressure is given at the top gas outlet, and the gas concentration is calculated according to the ideal gas law. The solid mass flow is given at the top of the furnace. Zero flux conditions are set at the symmetry axis and at the walls, except for the gas inlet.

2.1.2. Numerical Solution

The simulation domain is divided into 2000 cells in which the conservation equations are discretized according to the finite-volume method. The standard finite-volume method [44] is used in the upper cylindrical region of the furnace, whereas a deferred correction method [45] is used in the conical region to account for the nonorthogonality of the mesh there. The numerical solution is obtained by solving each equation for each cell via the Gauss–Seidel algorithm. This operation is repeated until the desired convergence for each variable and for mass, momentum and energy balance is obtained. The software is an in-house program (11,000 lines) written in Fortran 95. The pellet kinetic model is a subroutine of the main program. In terms of modeling, the innovations introduced in this article are the operation of a 100% H2-DRSF, the improvement of boundary conditions for thermal balance, and the integration of a more accurate subalgorithm for solving the gas flow, as explained below.
In this work, we introduced the SIMPLE algorithm [44] into REDUCTOR to improve the resolution of coupled gas pressure–momentum equations; this was accomplished by combining the Ergun equation and the continuity equation. A similar method was recently proposed by Korba et al. [46]. The procedure to solve coupled gas–pressure momentum equations comprises the following steps:
  • An arbitrary pressure field P is given.
  • A preliminary velocity field u g * is derived from P via the Ergun equation.
  • The pressure correction field P is first set to 0. It is then calculated across the whole computational domain with the combined Ergun-continuity equation.
  • P is added to P to correct it.
  • The velocity field is corrected with P via the Ergun equation, and the algorithm returns to step 2.
This update of the code proved to be very efficient since it allowed us to obtain a more accurate mass balance for the gas phase.

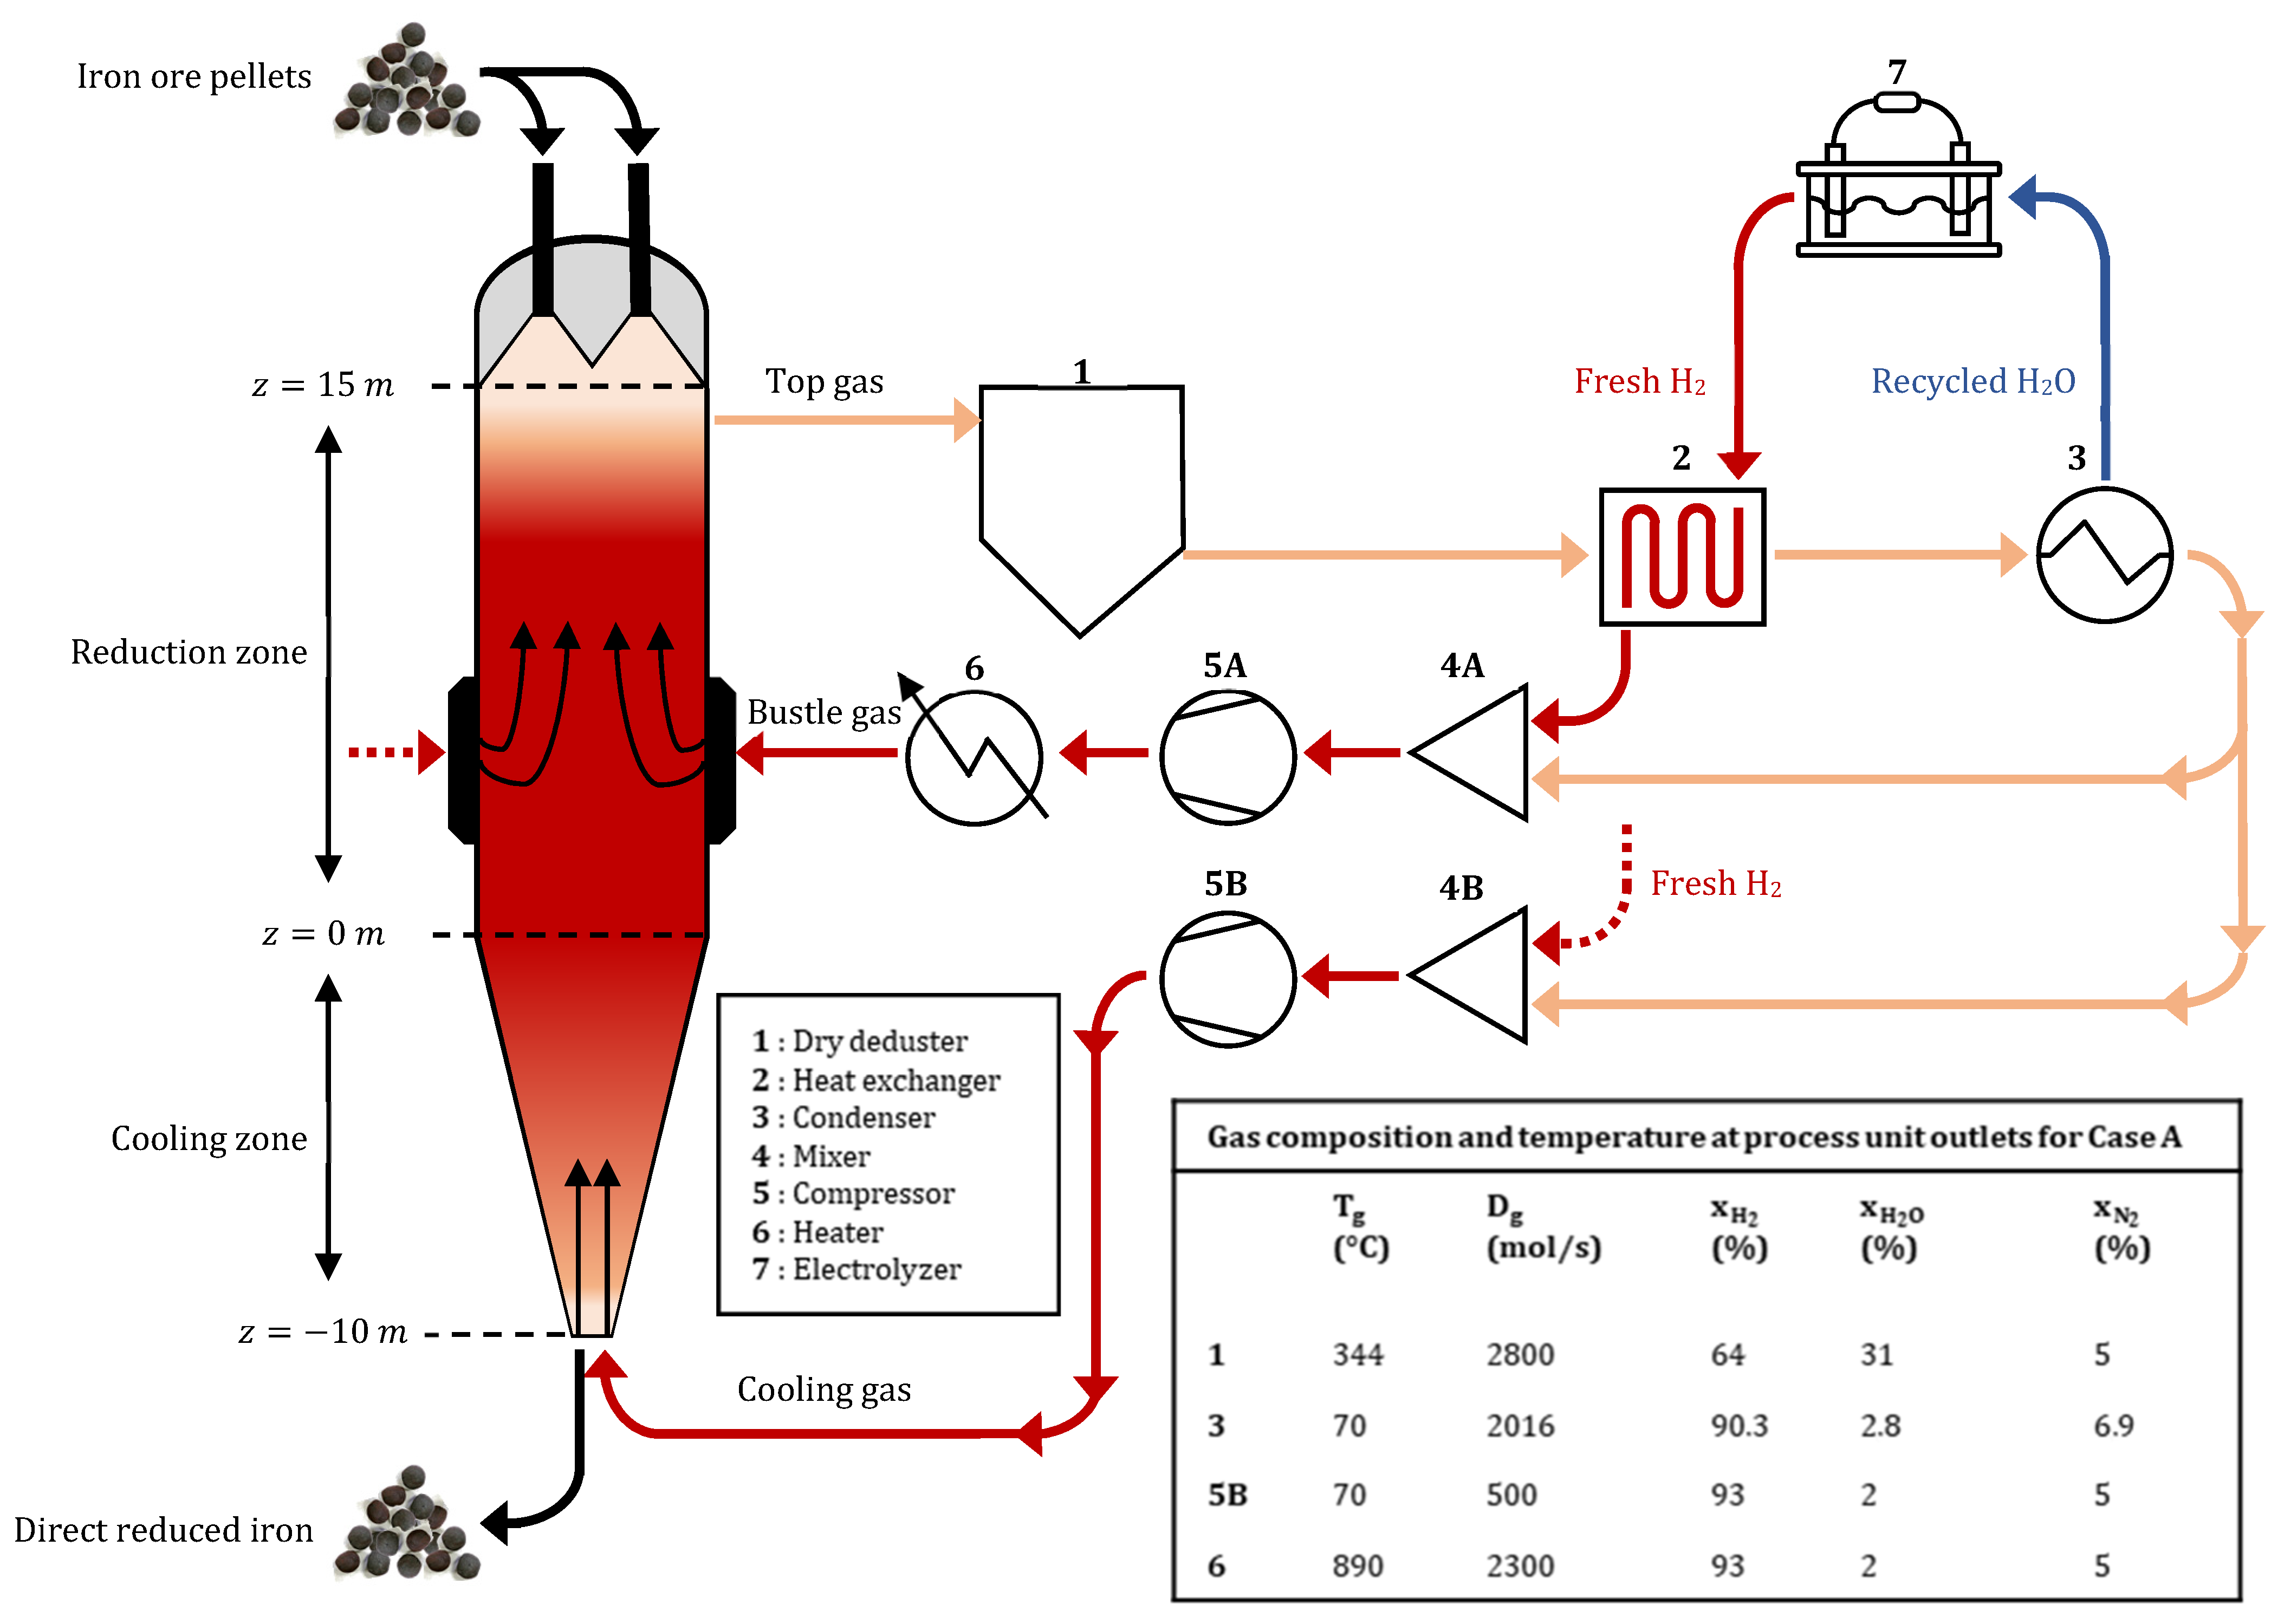
2.2. Model of the Gas Loop

To describe the gas loop, we retained the top gas recycling setup considered by Shao et al. [10]. The full gas circuit is shown in Figure 1. The off-gas leaving at the top of the furnace is dedusted before it enters a countercurrent heat exchanger. There, energy is recovered to heat the fresh hydrogen produced by electrolysis, which is mixed with recycled gas at the bustle. Water vapor is then removed from the off-gas in a condenser, and the rest of the gas exits the condenser at a temperature of 70 °C. This gas is recycled either to the bustle or in the cooling zone after mixing with fresh H2 and a compression step. Before injection at the bustle, the bustle gas is heated.
The gas loop model works in a postprocessing framework, meaning that the output results from REDUCTOR are input parameters for the gas loop model. Its main utility is to enable us to complete the energy balance of the process. We assumed that the only relevant energy needs for the whole process are those of water electrolysis, gas heating and gas compression.
H2 production by electrolysis is supposed to supply the shaft with fresh H2, and the energy required for this production is calculated considering the need for 18   M J / N m H 2 3 [10]. The countercurrent heat exchanger was modeled according to the number of transfer units (NTU) method [47] with NTU = 5. Its efficiency was high (0.98). The efficiency of the heater was taken equal to 0.7. The equations and process parameters for the considered units (e.g., the mixer, compressor, heater and electrolysis unit) were taken directly from [10].

3. Results and Discussion

3.1. Furnace Data and Operating Parameters

The operating parameters and the geometry of the H2-DRSF were derived from those of a Midrex DRSF [25]. The shaft furnace is made of a cylindrical upper part that is 15 m long and 2.6 m wide, and a conical lower part that is 10 m long and 1.31 m wide at the solid outlet. The plant delivers approximately 120 t/h of DRI with an average metallization degree close to 94%. The pellets are composed of hematitic ore (96.65 wt-%) and gangue (3.35%, of which CaO 1.39%, SiO2 0.98%, MgO 0.56%, Al2O3 0.42%). The shaft is operated with a high gas flow (2800 mol/s) at relatively low pressures (1.5–2 bar). The reducing gas composition was 93% H2, 2% H2O, and 5% N2 (molar fractions). The same mixture is injected at both inlets, at 890 °C at the bustle and at 70 °C at the bottom. The bustle inlet is located 4.9 m above the bottom of the upper part. The cooling gas both cools the hot DRI and brings fresh hydrogen to the upper part of the furnace. This reference case is labeled case A and is compared with four unlike H2-DRSF operations detailed below, labeled cases B, C, D and E. The operating parameters for each case are given in Table 1, and the distributions of process variables in the furnace are shown in Figures 3–9 below. Throughout this paper, the gas fractions are molar fractions, whereas the solid fractions are mass fractions.
In the next sections, results from the five cases will be discussed successively. To limit the number of figures, in Figures 3–9, the five cases are plotted together in columns. This facilitates the comparison between cases but makes it necessary to consider the same columns from several figures for the interpretation of a given case.

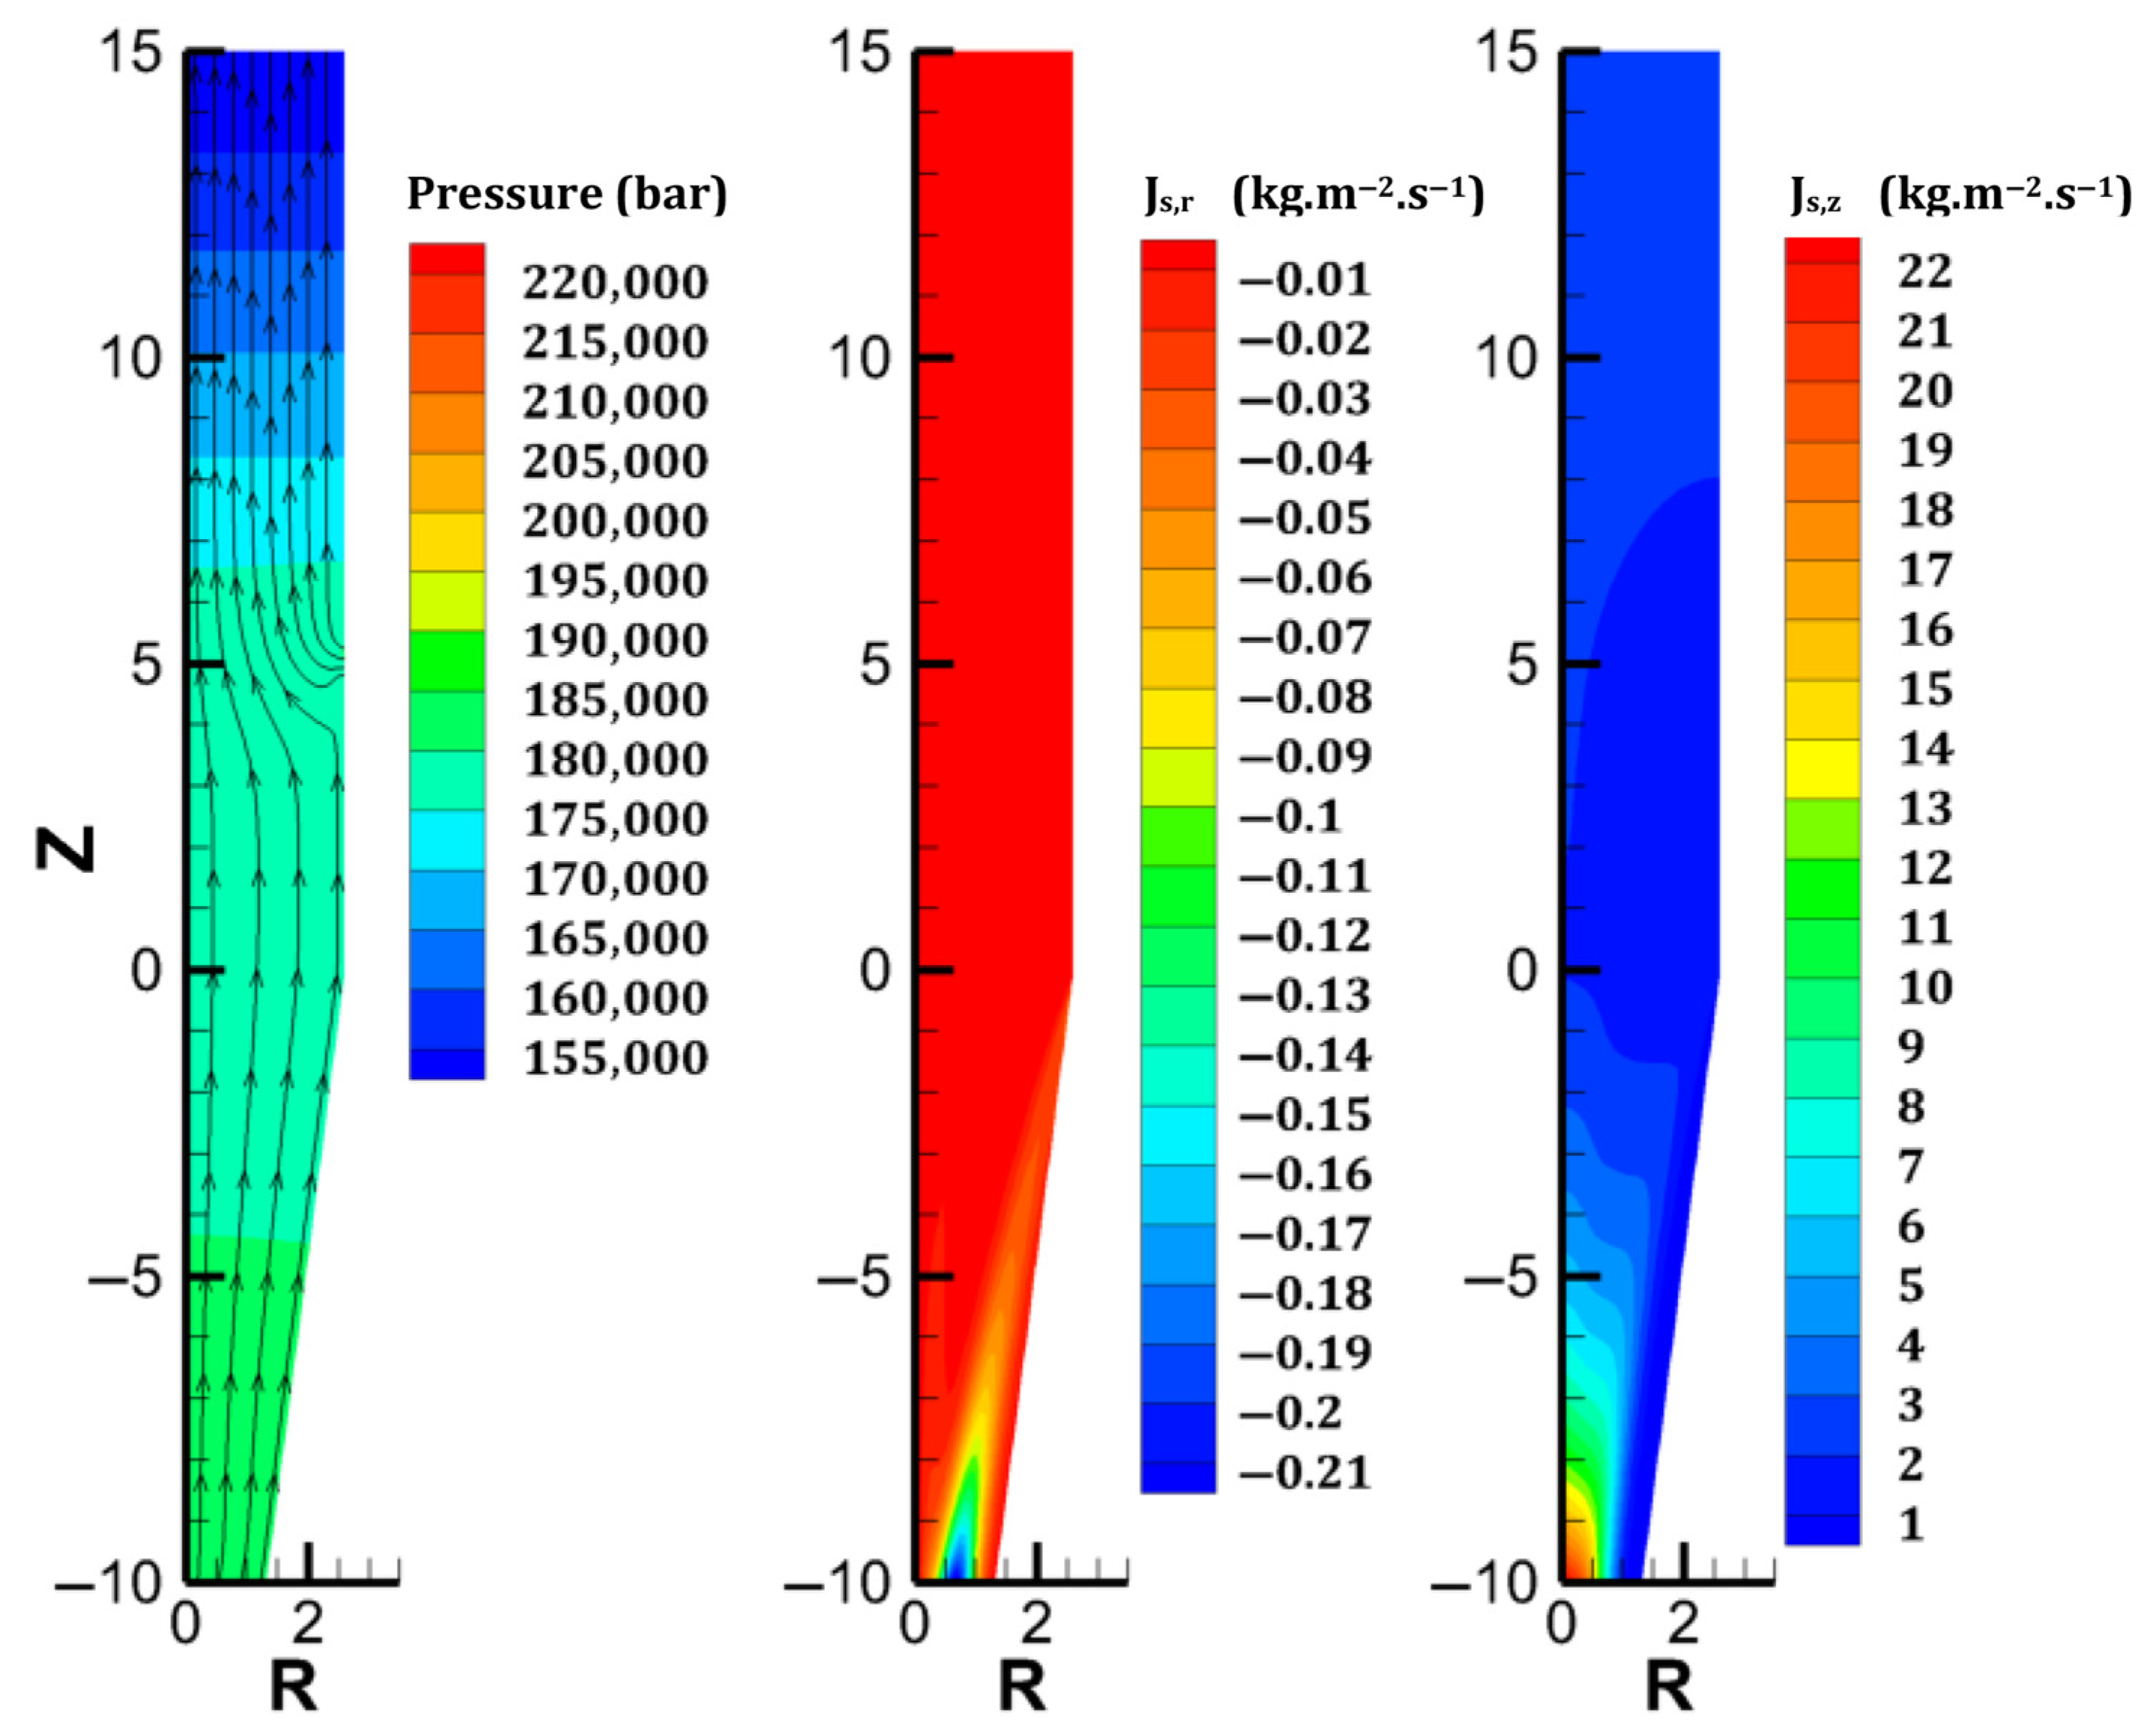
3.2. Case A—Reference Case Operation

The results revealing the furnace behavior in case A are illustrated in Figure 2 and the outer left colormaps of Figure 3, Figure 4, Figure 5, Figure 6, Figure 7, Figure 8 and Figure 9. As shown in Figure 2, the simple geometry leads to near-horizontal pressure drops and almost uniform gas velocity profiles, except at the bustle. In fact, the lowest gas velocities are reached in the furnace center, where hydrogen is not supplied easily. This causes the hydrogen content to decrease there, hindering the reduction of the burden, as shown in Figure 4. This was previously reported by [28]. The solid path follows plug flow behavior, at least until the hopper section (Figure 2). The conical geometry of the solid outlet breaks the flow uniformity and creates a strong gradient of axial mass flux density between the center and the lateral region of this zone; this, in turn, causes the solid to move centripetally with a nonzero radial mass flux density, which is in agreement with Mullins’ model.
The gas and solid temperatures are in equilibrium along the entire furnace height, except at the inlets. The solid exits the furnace at an average temperature of 261 °C, indicating that there could be potential for heat recycling by increasing the amount of gas sent to the cooling inlet [27]. Hematite is immediately converted as the burden enters the furnace (Figure 6). The moderate temperature region (500–650°) spanning from 14.5 to 8.5 m leads to a slow reduction in the magnetite in this region; actually, direct reduction of magnetite to iron is not described in the model, and this could induce little variation in the results. Wustite is rapidly converted above the bustle due to highly reducing conditions. After 9 m, complete metallization is reached in the peripheral zone, where the H2 content and temperature are high (see Figure 4 and Figure 9). The central region, which is hardly supplied with hydrogen and heat, is not metallized, which is in agreement with the findings of Li et al. [26]. Under these operating conditions, a GUD of 0.33 is reached.
For a given metallization degree, a simple oxygen balance gives the necessary flow of fresh hydrogen to reduce the iron ore [10]. With an inlet solid flow rate of 45 kg/s and a metallization degree of 94%, the required flow rate of fresh H2 is calculated to be 784 mol/s, and the associated energy consumption is 9.73 GJ/tDRI. As will be shown in Figure 11 (below, Section 3.6), the energy required to produce fresh H2 by electrolysis represents approximately 80% of the total energy consumption of the plant. The same conclusions hold for the other cases.
Two subcase simulations were performed to quantify the effect of nitrogen dilution. In the first simulation (A1), the nitrogen gas flow rate (140 mol/s) was “removed” from the gas mixture. The total gas flow rate decreased accordingly, from 2800 to 2660 mol/s, while the molar fractions of hydrogen and water vapor were set to 0.98 and 0.02, respectively. This led to degraded metallization (88% vs. 94%). This finding indicates that, to a certain extent, the sensible heat brought by N2 is more important than its dilution effect, as corroborated by [48]. In the second simulation (A2), hydrogen was partially replaced with nitrogen while keeping the total gas flow rate constant. The gas composition at both the bustle and cooling gas inlets was 88% H2, 10% N2 and 2% H2O. Compared with that of the base case, the metallization decreased (90% vs. 94%). In this case, the gain in sensible heat due to the superior thermal capacity of N2 was not sufficient to balance the decrease in the driving force due to dilution.

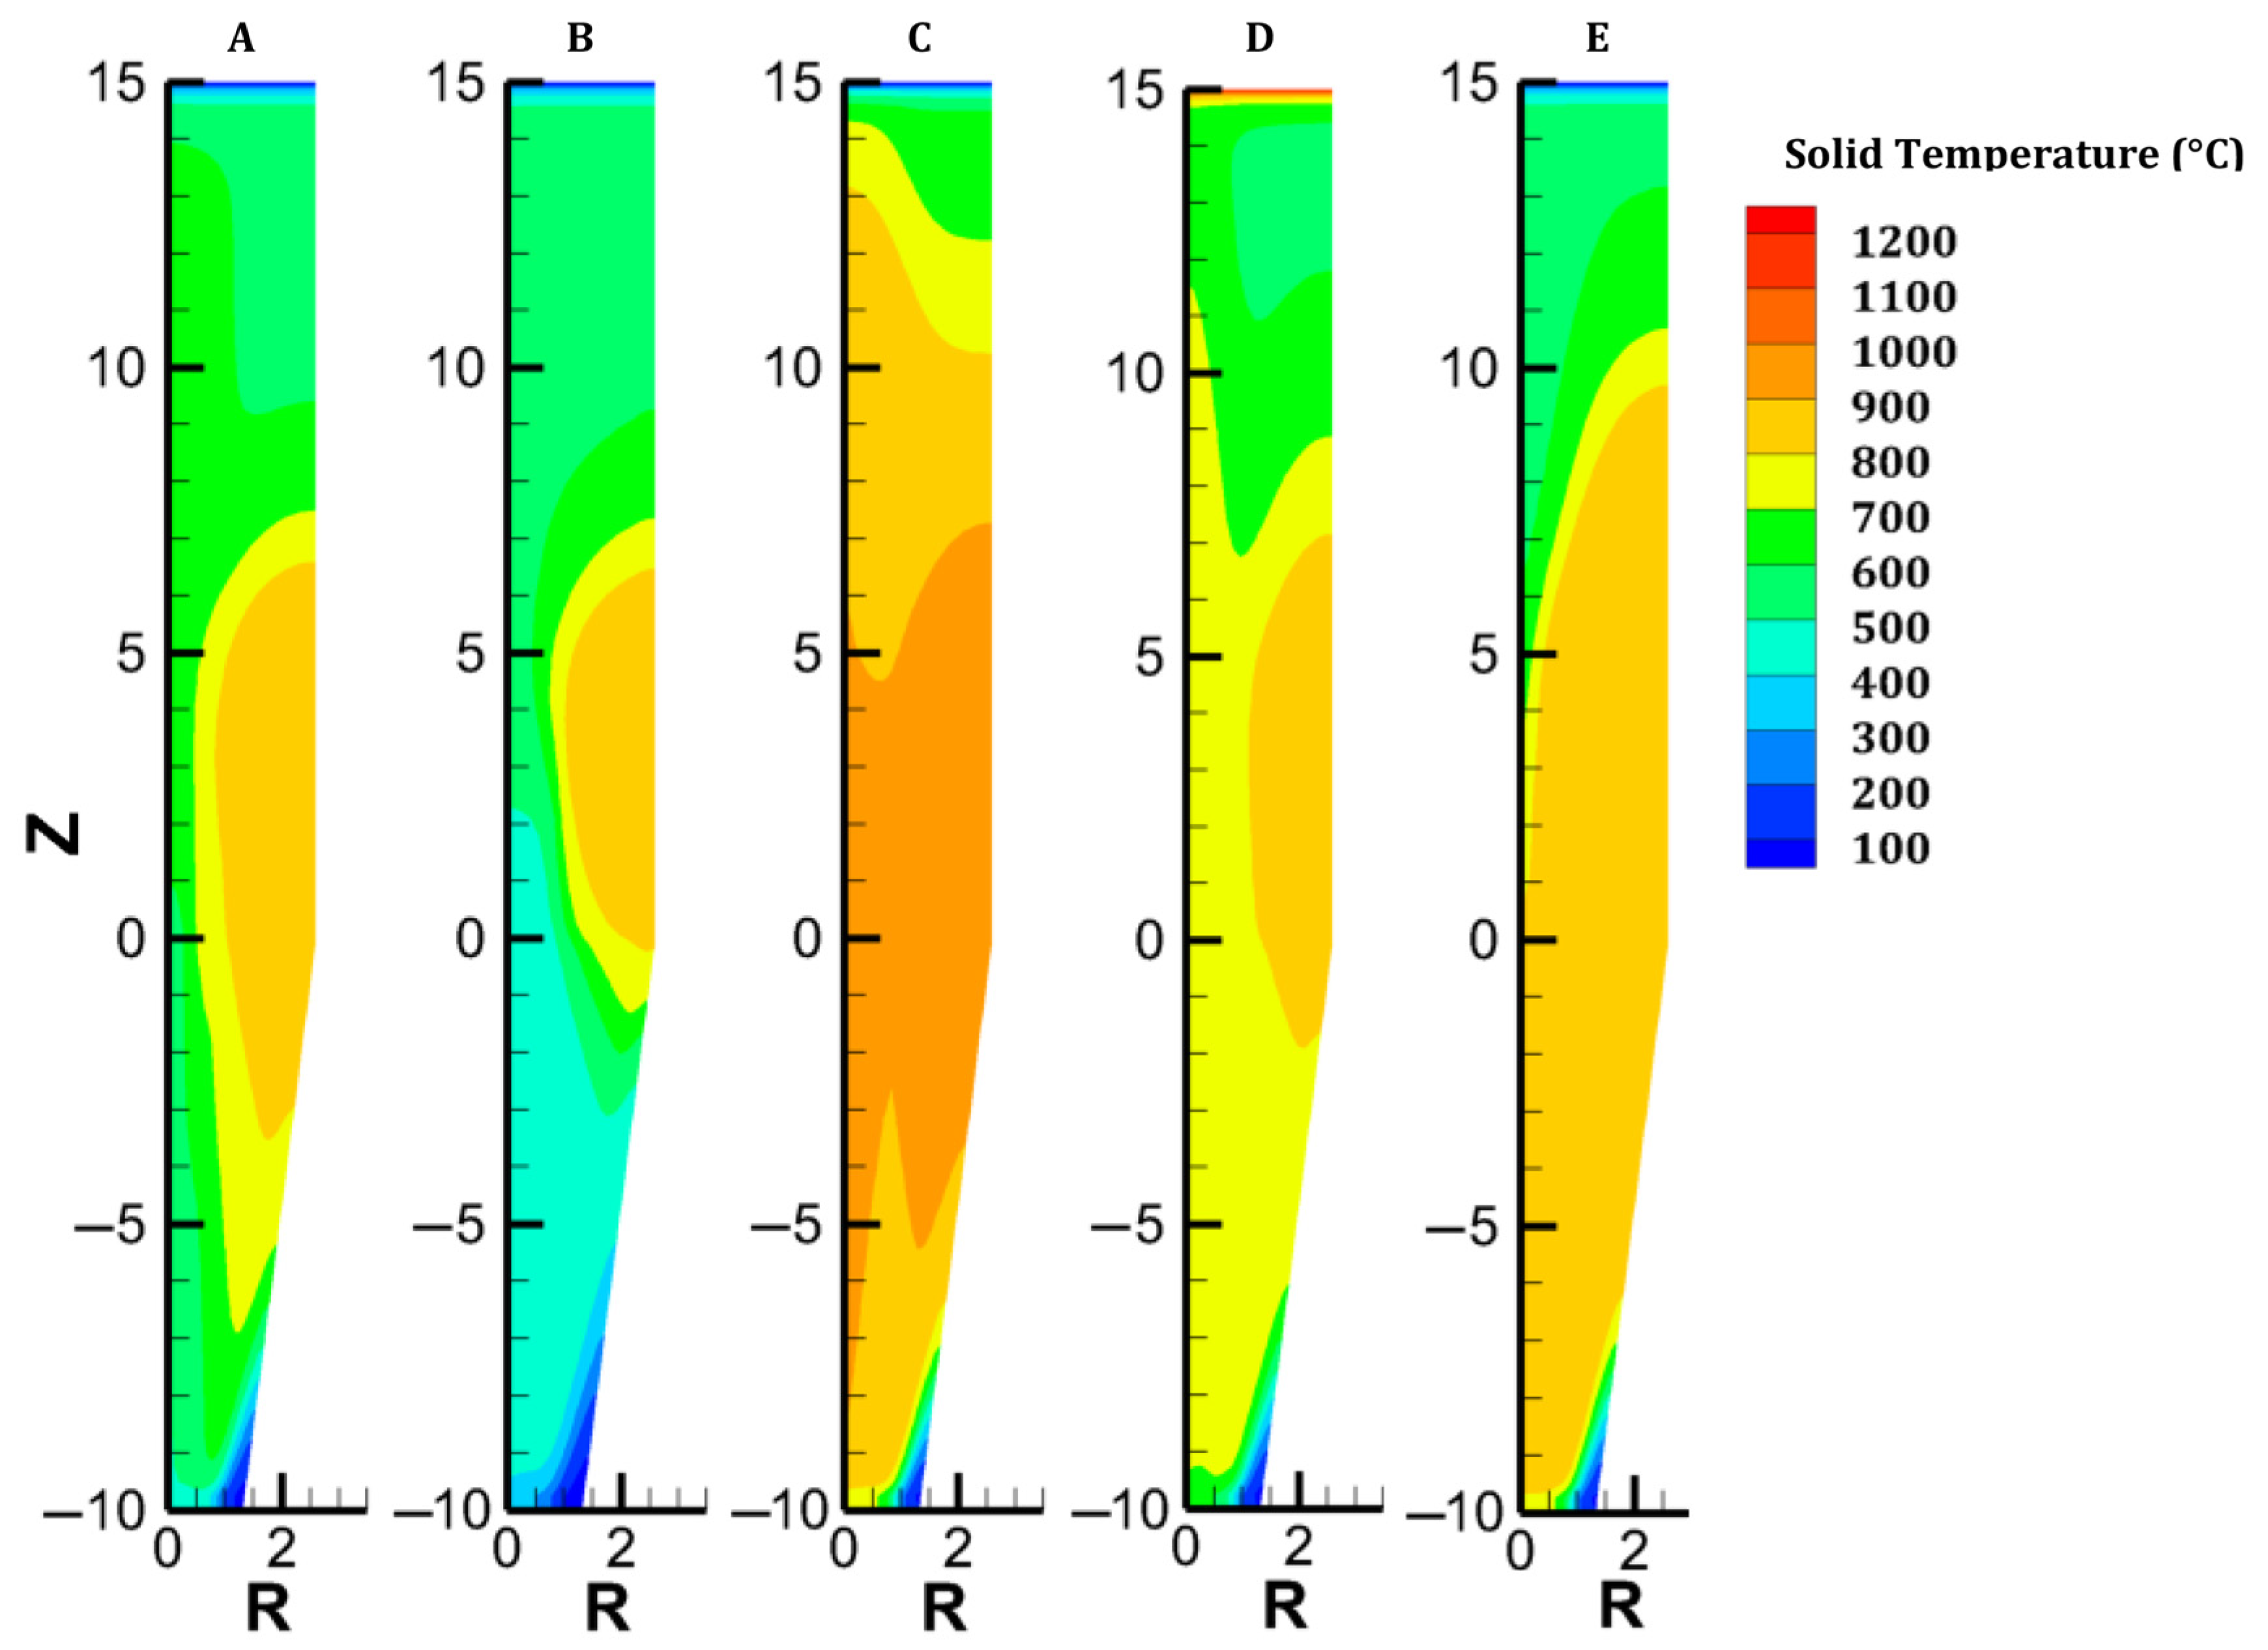
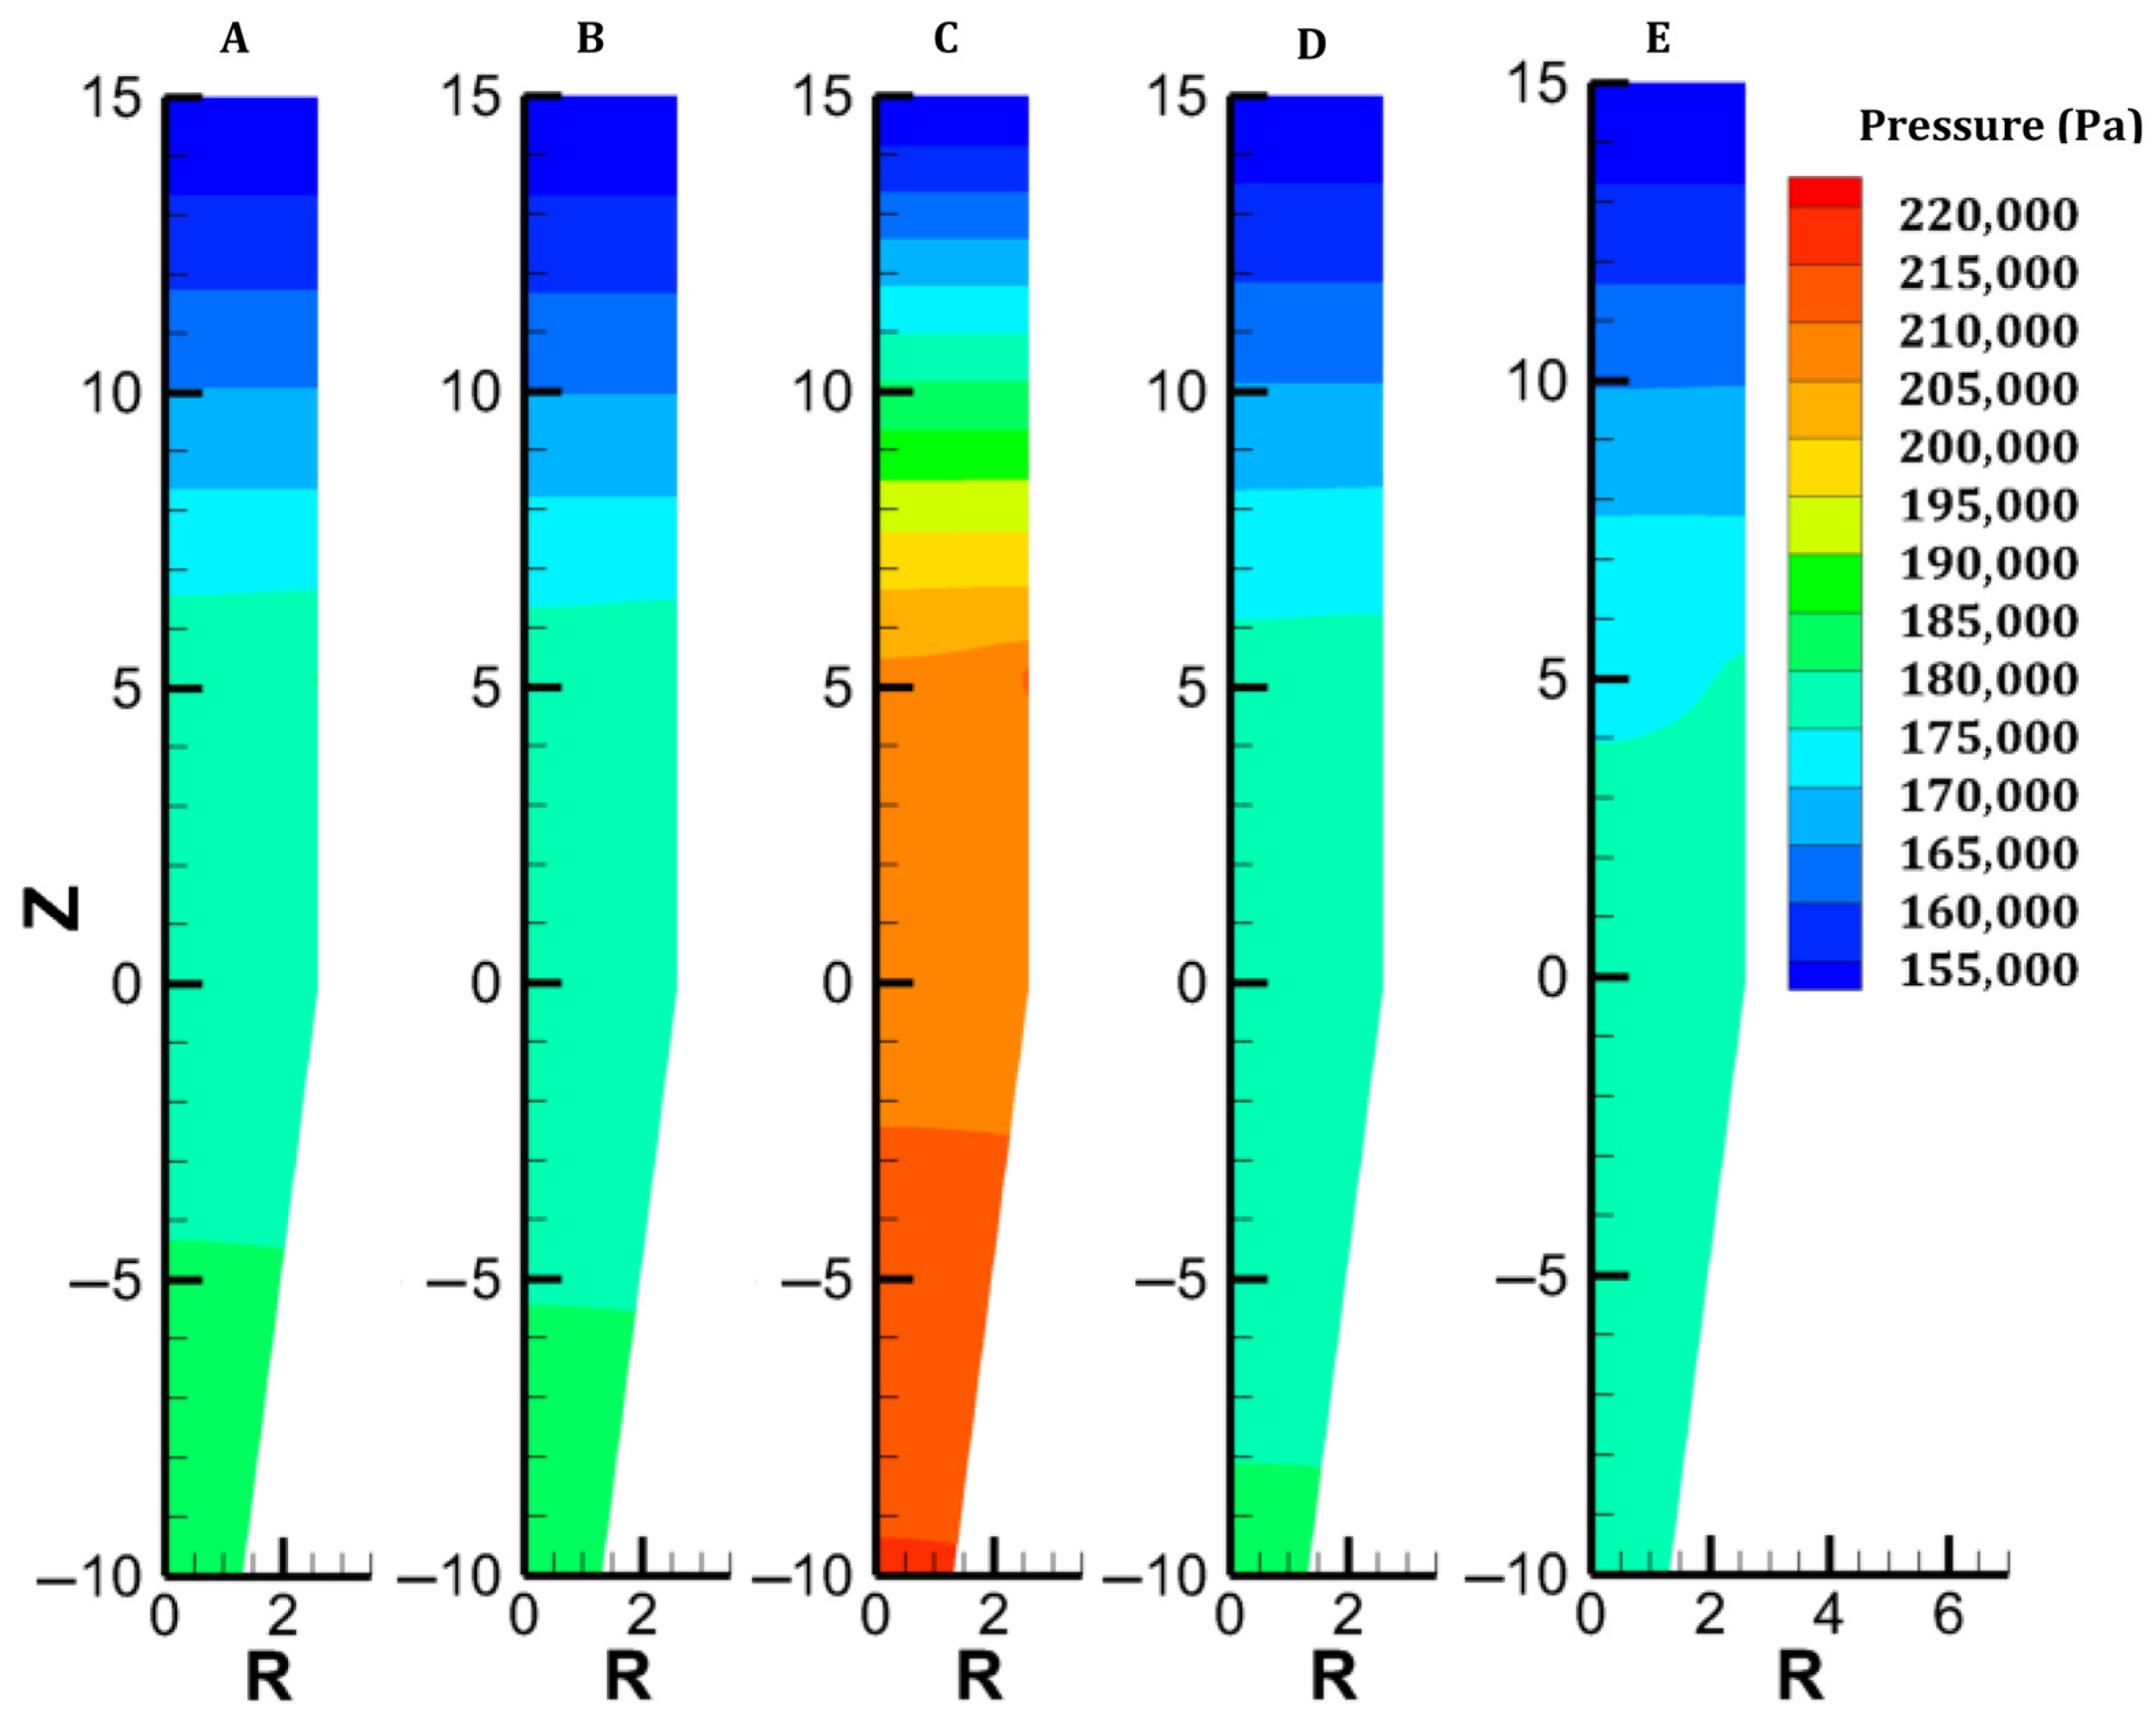
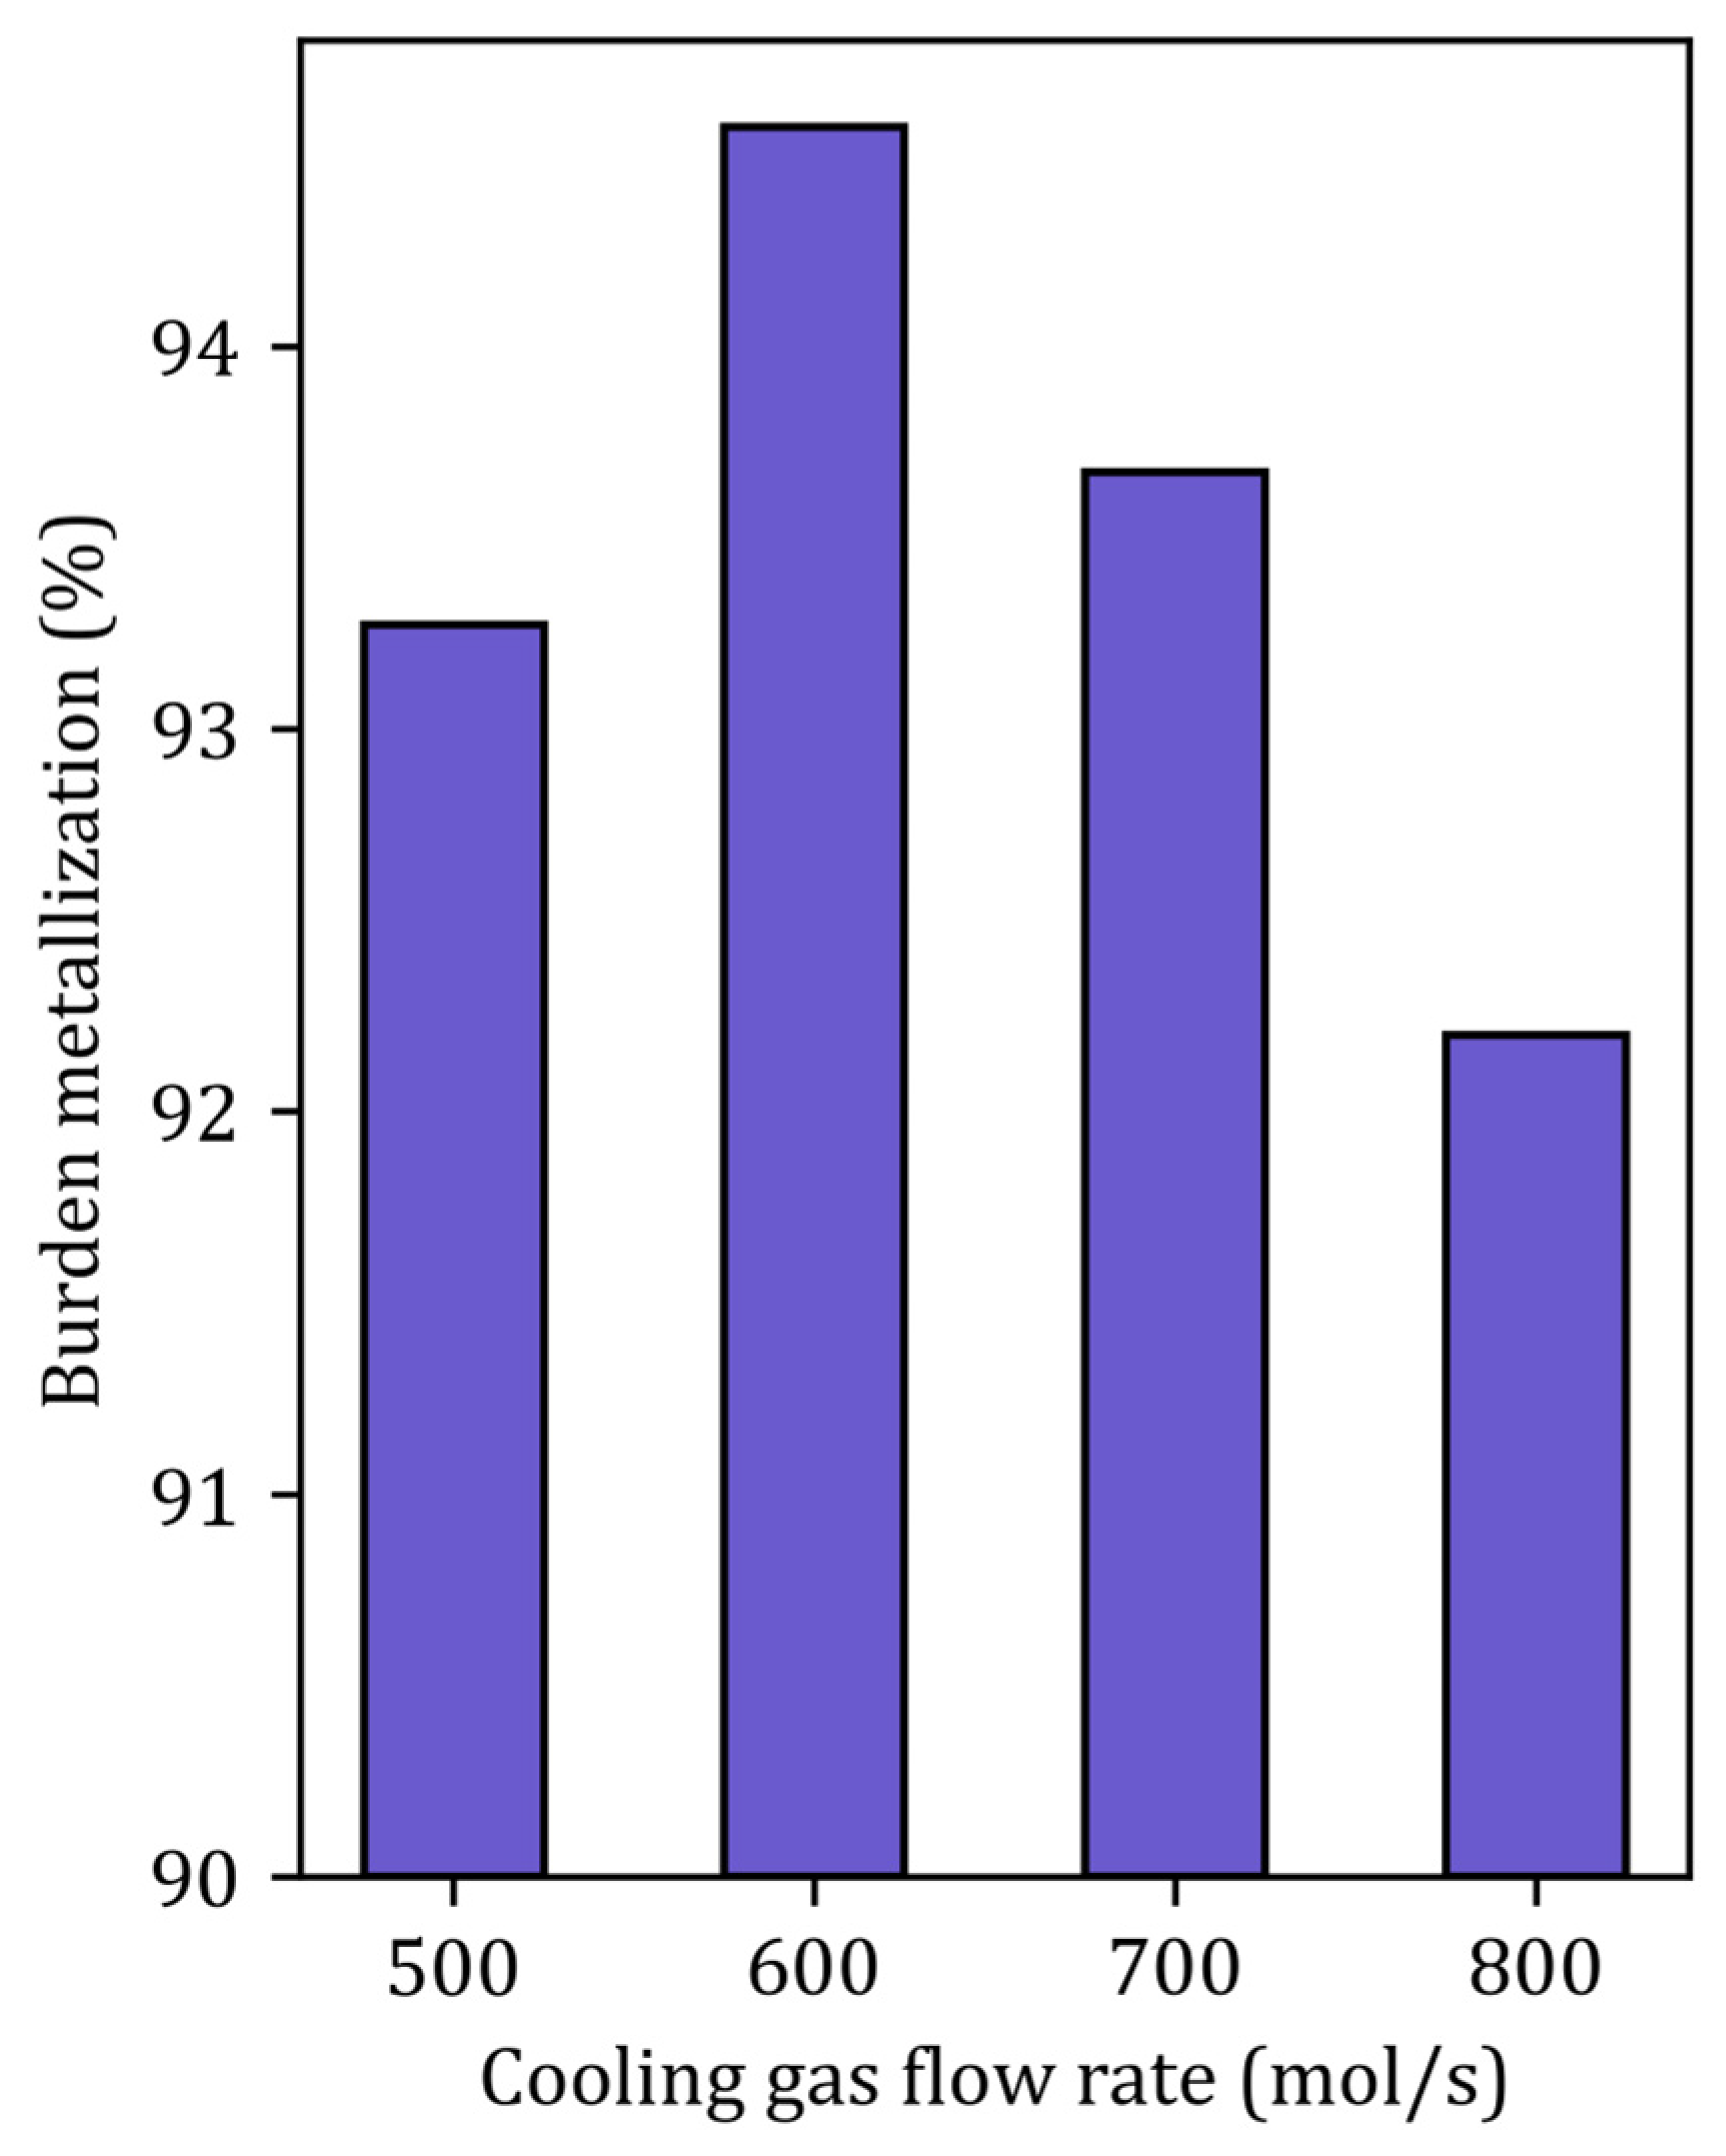
3.3. Case B—Redirecting Gas from the Bustle to the Cooling Inlet

In case B, the cooling gas flow rate was increased from 500 mol/s to 700 mol/s while keeping the total gas flow rate constant. The furnace behavior in this case remained quite similar to that in case A. The main differences between the two cases lie in the solid temperature and H2 content maps (see Figure 3 and Figure 4). On the one hand, a higher cooling gas flow rate better cools the lower region. Owing to this and the lower sensible heat carried at the bustle, the hot zone (T > 700 °C) shrinks. When the global energy consumption decreases, the heat is better valorized. On the other hand, the higher flow of H2 injected at the bottom homogenizes the H2 distribution and increases the driving force of the reaction in the furnace center. Overall, this solution remains almost constant for both the metallization layer and the GUD while decreasing the cost of H2 heating by 0.2 GJ/tDRI (–1.7%, compared with case A).
To further clarify the influence of the gas flow rate at the cooling inlet, subcase simulations were performed. Figure 10 highlights the effect of the cooling gas flow rate on the burden metallization. The optimum cooling gas flow rate is approximately 600 mol/s (the total gas flow rate is kept constant). This optimum physically represents the balance between high H2 content and sufficient sensible heat, since increasing the gas flow at the cooling inlet increases the H2 content at the center of the furnace while decreasing its temperature.

3.4. Case C—Bustle Gas Temperature and Nitrogen Content

Case C addresses the partial replacement of H2 with N2 in the feed gas, both at bustle and cooling injections, and with an increased bustle gas temperature. With an N2 content of 32% and a bustle temperature of 950 °C, the temperature distribution is greatly improved in the shaft, as shown in Figure 3. Despite weak H2 concentrations in the central part of the furnace, great reduction levels are obtained owing to the high temperature in this zone. Since less heat is consumed to reduce the burden in the lower central part, more heat is available in the upper part, which explains the faster reduction of oxides, particularly magnetite (Figure 7).
Overall, this solution offers a more uniform temperature distribution and an H2 distribution close to the reference case, as well as a higher GUD of 0.47. However, the higher thermal capacity of N2 implies greater needs for heating and compression of the gas: both processes account for a total of 2.80 GJ/tDRI, which represents an increase of 0.27 GJ/tDRI (+2.2%) compared with case A.

3.5. Case D—Introducing the Hot Burden

We considered the introduction of hot pellets into the shaft. This solution could be attractive if the H2-DRSF is located close to the pelletization plant. We selected 1200 °C as the maximum hot pellet temperature. The engineering details of hot conveying and charging devices were not investigated in the present parametric study. The sensible heat caused by the heat burden allows us to significantly reduce the temperature of the bustle gas (to 815 °C) while still reaching the DRI metallization target of 94%. In this case, complete conversion of hematite and magnetite is obtained 5 m below the solid inlet. Conversely, the reduction of wustite is not faster than in the previous cases, owing to H2 starvation in the upper central zone of the furnace. The low wustite-to-iron reduction rate in turn explains the higher temperature observed there, an effect also highlighted in [37]. Overall, introducing hot pellets thus favors the hematite and magnetite reductions but does not lead to better reducing conditions for the most demanding reaction, the wustite-to-iron reduction.
Regarding energy, assuming that the pellets directly come hot from the pelletizing plant and are not heated on purpose, this case decreases the total energy consumption of the process to 11.68 GJ/tDRI (–4.3% compared with case A; see Table 1 and Figure 11). This energy savings is limited by the high temperature of the top gas (806 °C). A large part of the sensible heat of the hot burden is evacuated by the off-gas, and the top gas heat utilization is limited by the necessity to condense its water. This is why this option is relevant only if the pellets are taken right after firing; otherwise, poor heat utilization and an increase in total energy consumption are to be expected, as pinpointed in [10].

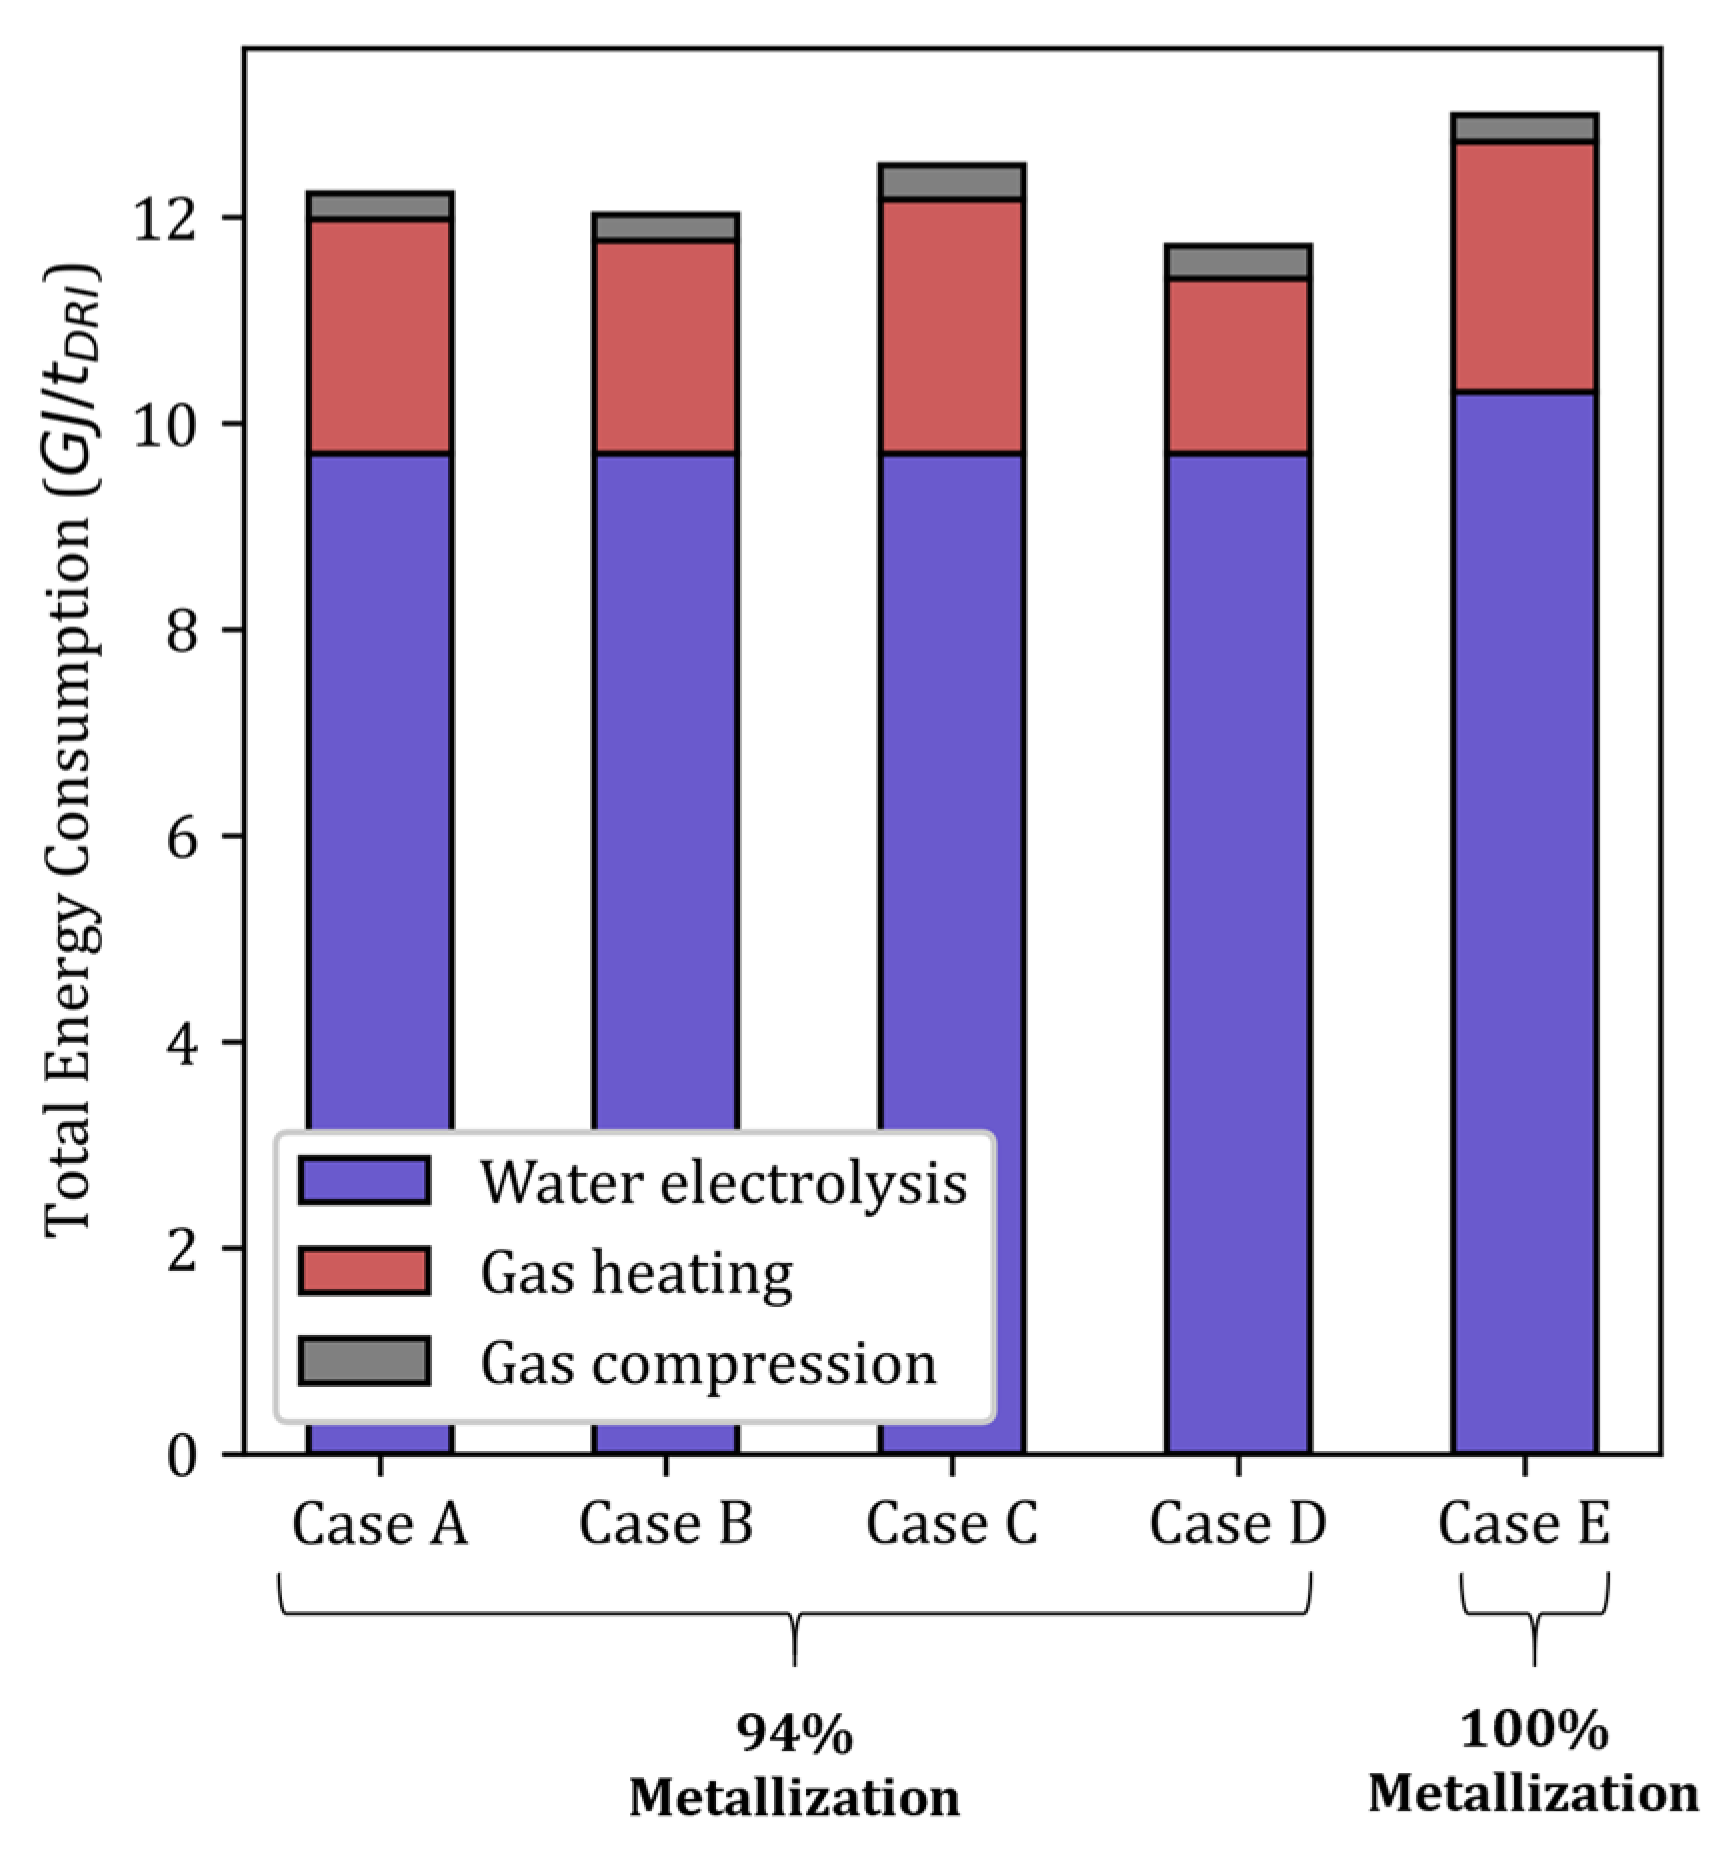
3.6. Case E—H2-DRSF with 100% DRI Metallization

The previous cases intentionally targeted a usual average metallization degree of 94%. However, a pure H2-DRSF can readily lead to 100% metallization. The complete metallization of the burden requires a sufficient supply of heat and hydrogen to the center of the furnace. This situation can be achieved simply by increasing the gas-to-solid flow rate ratio. We chose here to slightly decrease the burden flow rate from 45 to 43 kg/s at the inlet. Under such operating conditions, the shaft furnace behavior changes, resulting in much lower radial gradients and even 1D behavior in the cooling zone, where the oxides are fully reduced (Figure 3, Figure 4, Figure 5, Figure 6, Figure 7, Figure 8 and Figure 9). This allows complete metallization with a near-optimized operation.
We thus demonstrated that for H2-DRSF, only a slow dip in production allows a shift from a conventional metallization (94%) to a full metallization; this increases the molar ratio of hydrogen to iron from 3.26 to 3.4 and slightly lowers the GUD from 0.33 to 0.315. In terms of energy consumption, the hydrogen quantity required to reach full metallization is 780 mol/s; the energy required to produce this hydrogen to reduce 1 ton of DRI is 10.3 GJ/tDRI, and the total energy consumption reaches 12.98 GJ/tDRI. It should now be determined if spending +0.78 GJ/tDRI (+6.4%) is beneficial for the complete metallization that it brings to the EAF operation.

4. Conclusions

The iron and steel industry requires breakthrough technologies to mitigate its GHG emissions. The H2-DRSF seems to be a great candidate for fulfilling this objective. In this work, the finite-volume shaft furnace model REDUCTOR was enhanced and coupled with a gas loop model to perform an innovative parametric study. The influences of gas redirection from the bustle to the cooling inlet, high nitrogen content and temperature, and the introduction of a hot solid burden were compared to those of standard operation of a hypothetical H2-DRSF; a full metallization case operation was also presented. The main conclusions of this study are as follows.
The redirection of a portion of the gas flow rate from the bustle to the cooling inlet (case B) provides a better distribution of H2 in the furnace, although it slightly decreases the sensible heat brought by the gas. Overall, this strategy systematically lowers the energy consumption of the process.
The operation of the furnace at high temperature (950 °C) and a high nitrogen content (32%) in the gas mixture (case C) greatly increases the degree of gas utilization at the cost of a high thermal expense. This solution could be interesting if the top gas was not recycled.
The introduction of a hot (1200 °C) solid burden (case D) results in considerable sensible heat in the furnace, which is nevertheless poorly utilized because a large fraction of this heat is evacuated by the top gases. This solution is attractive if the pellets directly come hot from the pelletizing plant and are not heated on purpose; in this case, actual energy savings are to be expected.
The operation of H2-DRSF for full metallization is readily reached by slightly increasing the gas flow rate or decreasing the production rate. The better supply of heat and hydrogen to the center of the furnace results in quasi1D behavior in the lower half of the furnace. This complete metallization is obtained at the expense of +0.78 GJ/tDRI (+6.4%).
Overall, these cases show that considerable gains in efficiency are possible while improving the thermochemical state of the furnace. This work provides a set of strategies that could also be applied in most DR plants. Further studies should consider the connections among the pelletizing plant, the DR plant and the EAF. A better description of solid granular flow should also be considered when investigating the influence of pellet size and burden stacking strategies.
Beyond these, after additional studies, the modeling approach presented here could help to answer further topical questions related to hydrogen direct reduction of iron ore, such as the possible use of lower-grade ores, magnetitic or sideritic ores, and that of ammonia or ammonia–hydrogen mixtures as reactant gases.

Author Contributions

Conceptualization, all; methodology, all; software, A.M.; validation, O.M. and F.P.; investigation, A.M.; resources, F.P.; writing—original draft preparation, A.M.; writing—review and editing, all; visualization, A.M.; supervision, O.M. and F.P.; project administration, F.P.; funding acquisition, F.P. All authors have read and agreed to the published version of the manuscript.

Funding

The authors gratefully acknowledge the financial support provided by the European Commission through the Horizon Europe MaxH2DR project (grant agreement 101058429).

Data Availability Statement

The data will be made available upon request.

Acknowledgments

The authors thank Jean-Baptiste Letz for his help during the experiments.

Conflicts of Interest

The authors declare no conflicts of interest.

Abbreviations

The following abbreviations are used in this manuscript:
BFBlast furnace
BOFBasic oxygen furnace
CFDComputational fluid dynamics
DEMDiscrete element method
DRDirect reduction
DRIDirectly reduced iron
DRSFDirect reduction shaft furnace
EAFElectric arc furnace
GMGrain model
GPMGrainy pellet model
GUDGas utilization degree
HBIHot briquetted iron
NTUNumber of transfer units
SCMShrinking core model

Nomenclature

The following notations are used in this manuscript:
Latin
abSpecific area of the pellets per unit bed volume, m2 m−3
BConstant of Mullins’ model, m
cp,smass specific heat of the solid, J kg−1 K−1
cp,gmolar specific heat of the gas, J mol−1 K−1
cH2gas concentration in H2, mol m−3
ctgas concentration, mol m−3
dppellet diameter, m
Dggas flow rate, mol s−1
Dssolid flow rate, kg s−1
fmreaction driving force, mol m−3
hheat transfer coefficient, W m−2 K−1
kkinetic factor associated with a characteristic time, m s−1
Kpermeability coefficient in the Ergun equation, kg m−3 s−1
Pgas pressure, Pa
rradius, m
rnreaction rate of reaction number n, mol s−1 m−3
Sisource term associated with gas species i, mol m−3 s−1
Ttemperature, K
uvelocity vector, m s−1
u r , φ ,   u z , φ radial (axial) velocity of phase φ (solid or gas), m s−1
vreaction rate, s−1
ximolar fraction of gas species i
Xoxide conversion degree
zheight, m
Greek
ΔrHheat of reaction, J mol−1
εbedporosity of the pellet bed
ρbapparent mass density of the pellet bed, kg m−3
ρsiron oxide molar density, mol m−3
ρgmass density of the gas, kg.m−3
Γggas thermal conductivity, W m−1 K−1
Γr,e, Γz,eradial (axial) effective thermal conductivity of the pellet bed, W m−1 K−1
τcharacteristic time, s
Subscripts
chemchemical reaction
eeffective
eqequilibrium
extgas external diffusion
diffgas diffusion in the pores
ggas
ia species
nreduction reaction (1, 2 or 3)
ssolid
rradial coordinate
Xoxide conversion degree
zaxial coordinate

References

  1. IEA (International Energy Agency). Iron and Steel Technology Roadmap. 2020. Available online: https://www.iea.org/reports/iron-and-steel-technology-roadmap (accessed on 23 January 2025).
  2. Patisson, F.; Mirgaux, O. Hydrogen Ironmaking: How It Works. Metals 2020, 10, 922. [Google Scholar] [CrossRef]
  3. Wang, R.R.; Zhao, Y.Q.; Babich, A.; Senk, D.; Fan, X.Y. Hydrogen direct reduction (H-DR) in steel industry—An overview of challenges and opportunities. J. Clean. Prod. 2021, 329, 129797. [Google Scholar] [CrossRef]
  4. Vogl, V.; Åhman, M.; Nilsson, L.J. Assessment of hydrogen direct reduction for fossil-free steelmaking. J. Clean. Prod. 2018, 203, 736–745. [Google Scholar] [CrossRef]
  5. Shahabuddin, M.; Brooks, G.; Rhamdhani, M.A. Decarbonisation and hydrogen integration of steel industries: Recent development, challenges and technoeconomic analysis. J. Clean. Prod. 2023, 395, 136391. [Google Scholar] [CrossRef]
  6. Sun, M.; Pang, K.; Barati, X.; Meng, X. Hydrogen-Based Reduction Technologies in Low-Carbon Sustainable Ironmaking and Steelmaking: A Review. J. Sustain. Metall. 2024, 10, 10–25. [Google Scholar] [CrossRef]
  7. Somers, J. Technologies to Decarbonise the EU Steel Industry; EUR 30982 EN; Publications Office of the European Union: Luxembourg, 2022; ISBN 978-92-76-47147-9. [CrossRef]
  8. Öhman, A.; Karakaya, E.; Urban, F. Enabling the transition to a fossil-free steel sector: The conditions for technology transfer for hydrogen-based steelmaking in Europe. Energy Res. Soc. Sci. 2022, 84, 102384. [Google Scholar] [CrossRef]
  9. Chai, X.; Yue, Q.; Zhang, Y.; Wang, Q. Analysis of Energy Consumption and Its Influencing Factors in Hydrogen Metallurgy Process. Steel Res. Int. 2022, 93, 2100730. [Google Scholar] [CrossRef]
  10. Shao, L.; Wang, Q.; Qu, Y.; Saxén, H.; Zou, Z. A Numerical Study on the Operation of the H2 Shaft Furnace with Top Gas Recycling. Metall. Mater. Trans. B Process Metall. Mater. Process. Sci. 2021, 52, 451–459. [Google Scholar] [CrossRef]
  11. Shao, L.; Xu, J.; Saxén, H.; Zou, Z. A numerical study on process intensification of hydrogen reduction of iron oxide pellets in a shaft furnace. Fuel 2023, 348, 128375. [Google Scholar] [CrossRef]
  12. Zare Ghadi, A.; Radfar, N.; Valipour, M.S.; Sohn, H.Y. A Review on the Modeling of Direct Reduction of Iron Oxides in Gas-Based Shaft Furnaces. Steel Res. Int. 2023, 94, 2200742. [Google Scholar] [CrossRef]
  13. Fei, Y.; Guan, X.; Kuang, S.; Yu, A.; Yang, N. A Review on the Modeling and Simulation of Shaft Furnace Hydrogen Metallurgy: A Chemical Engineering Perspective. ACS Eng. Au 2024, 4, 145–165. [Google Scholar] [CrossRef]
  14. Quatravaux, T. A graphical tool to describe the operating point of the direct reduction shaft processes. Metals 2023, 13, 1568. [Google Scholar] [CrossRef]
  15. Tsay, Q.T.; Ray, W.H.; Szekely, J. The modeling of hematite reduction with hydrogen plus carbon monoxide mixtures: Part I. The behavior of single pellets. AIChE J. 1976, 22, 1064–1072. [Google Scholar] [CrossRef]
  16. Ranzani da Costa, A.; Wagner, D.; Patisson, F. Modelling a new, low CO2 emissions, hydrogen steelmaking process. J. Clean. Prod. 2013, 46, 27–35. [Google Scholar] [CrossRef]
  17. Takahashi, R.; Takahashi, Y.; Yagi, J.; Omori, Y. Operation and Simulation of Pressurized Shaft Furnace for Direct Reduction. Trans. Iron Steel Inst. Jpn. 1986, 26, 765–774. [Google Scholar] [CrossRef]
  18. Takenaka, Y.; Kimura, Y.; Narita, K.; Kaneko, D. Mathematical model of direct reduction shaft furnace and its application to actual operations of a model plant. Comput. Chem. Eng. 1986, 10, 67–75. [Google Scholar] [CrossRef]
  19. Tsay, Q.T.; Ray, W.H.; Szekely, J. The modeling of hematite reduction with hydrogen plus carbon monoxide mixtures: Part II. The direct reduction process in a shaft furnace arrangement. AIChE J. 1976, 22, 1072–1079. [Google Scholar] [CrossRef]
  20. Omori, T.Y. Reduction of iron oxide pellets in moving bed. Ironmak. Steelmak. 1979, 3, 93–100. [Google Scholar]
  21. Ajbar, A.; Alhumaizi, K.; Soliman, M. Modelling and parametric studies of direct reduction reactor. Ironmak. Steelmak. 2011, 38, 401–411. [Google Scholar] [CrossRef]
  22. Parisi, D.R.; Laborde, M.A. Modeling of counter current moving bed gas-solid reactor used in direct reduction of iron ore. Chem. Eng. J. 2004, 104, 35–43. [Google Scholar] [CrossRef]
  23. Shams, A.; Moazeni, F. Modeling and Simulation of the MIDREX Shaft Furnace: Reduction, Transition and Cooling Zones. JOM 2015, 67, 2681–2689. [Google Scholar] [CrossRef]
  24. Zare Ghadi, A.; Valipour, M.S.; Biglari, M. CFD simulation of two-phase gas-particle flow in the Midrex shaft furnace: The effect of twin gas injection system on the performance of the reactor. Int. J. Hydrogen Energy 2017, 42, 103–118. [Google Scholar] [CrossRef]
  25. Hamadeh, H.; Mirgaux, O.; Patisson, F. Detailed Modeling of the Direct Reduction of Iron Ore in a Shaft Furnace. Materials 2018, 11, 1865. [Google Scholar] [CrossRef]
  26. Li, Z.; Qi, Z.; Zhang, L.; Guo, M.; Liang, D.; Dong, Q. Numerical simulation of H2-intensive shaft furnace direct reduction process. J. Clean. Prod. 2023, 409, 137059. [Google Scholar] [CrossRef]
  27. Shao, L.; Yu, H.; Zhao, C. Effects of Room-Temperature Center Gas Distributor Injection on the H2 Shaft Furnace Process: A Numerical Study. Processes 2024, 12, 1666. [Google Scholar] [CrossRef]
  28. Tian, X.; Zhou, H.; Zhang, Y.; Zhang, T.; Huang, J.; Cai, H.; Kou, M.; Wu, S. Numerical simulation of the influence of operating parameters on the inner characteristics in a hydrogen-enriched shaft furnace. Int. J. Hydrogen Energy 2024, 55, 1131–1142. [Google Scholar] [CrossRef]
  29. Valipour, M.S.; Saboohi, Y. Numerical investigation of nonisothermal reduction of hematite using Syngas: The shaft scale study. Model. Simul. Mater. Sci. Eng. 2007, 15, 487. [Google Scholar] [CrossRef]
  30. Wu, S.; Xu, J.; Yagi, J.; Guo, X.; Zhang, L. Prediction of Pre-reduction Shaft Furnace with Top Gas Recycling Technology Aiming to Cut Down CO2 Emission. ISIJ Int. 2011, 51, 1344–1352. [Google Scholar] [CrossRef]
  31. Liu, Z.; Lu, S.; Wang, Y.; Zhang, J.; Cheng, Q.; Ma, Y. Study on optimization of reduction temperature of hydrogen-based Shaft Furnace—Numerical simulation and multi-criteria evaluation. Int. J. Hydrogen Energy 2023, 48, 16132–16142. [Google Scholar] [CrossRef]
  32. Xu, J.; Wu, S.; Kou, M.; Du, K. Numerical Analysis of the Characteristics Inside Pre-reduction Shaft Furnace and Its Operation Parameters Optimization by Using a Three-Dimensional Full Scale Mathematical Model. ISIJ Int. 2013, 53, 576–582. [Google Scholar] [CrossRef]
  33. Zhang, X.; Luo, Z.; Zou, Z. Numerical Analysis on Performance of COREX CGD Shaft Furnace with Top Gas Recycling. ISIJ Int. 2019, 59, 1972–1981. [Google Scholar] [CrossRef]
  34. Besseron, X.; Adhav, P.; Peters, B. Parallel Multi-Physics Coupled Simulation of a Midrex Blast Furnace. In Proceedings of the International Conference on High Performance Computing in Asia-Pacific Region Workshops, Nagoya, Japan, 25–27 January 2024; pp. 87–98. [Google Scholar]
  35. Hamadeh, H. Modélisation Mathématique Détaillée du Procédé de Réduction Directe du Minerai de fer. Ph.D. Dissertation, Université de Lorraine, Nancy, France, 2017. Available online: https://tel.archives-ouvertes.fr/tel-01740462 (accessed on 23 January 2025).
  36. Shao, L.; Zhang, X.; Zhao, C.; Qu, Y.; Saxén, H.; Zou, Z. Computational analysis of hydrogen reduction of iron oxide pellets in a shaft furnace process. Renew. Energy 2021, 179, 1537–1547. [Google Scholar] [CrossRef]
  37. Shao, L.; Zhang, X.; Zhao, C.; Zhai, Y.; Saxén, H.; Zou, Z. A study of options to enhance the operation of a H2 direct reduction shaft furnace using a two-dimensional model. Int. J. Hydrogen Energy 2024, 86, 124–131. [Google Scholar] [CrossRef]
  38. Yu, S.; Shao, L.; Zou, Z.; Saxén, H. A Numerical Study on the Performance of the H2 Shaft Furnace with Dual-Row Top Gas Recycling. Processes 2021, 9, 2134. [Google Scholar] [CrossRef]
  39. Ranzani da Costa, A. La Réduction du Minerai de fer par L’hydrogène: Étude Cinétique, Phénomène de Collage et Modélisation. Ph.D. Dissertation, Institut National Polytechnique de Lorraine, Nancy, France, 2011. [Google Scholar]
  40. Saleh, K.; Leturia, M. Stockage et écoulement des solides granulaires dans les silos: Concepts de base et théorie. Tech. Ing. 2020, 2258. [Google Scholar] [CrossRef]
  41. Ergun, S. Fluid Flow Through Packed Columns. Chem. Eng. Prog. 1952, 48, 89. [Google Scholar]
  42. Sohn, H.Y. The law of additive reaction times in fluid-solid reactions. Metall. Trans. B 1978, 9, 89–96. [Google Scholar] [CrossRef]
  43. Szekely, J.; Evans, J.W.; Sohn, H.Y. Gas-Solid Reactions; Elsevier: Amsterdam, The Netherlands, 2012. [Google Scholar]
  44. Patankar, S. Numerical Heat Transfer and Fluid Flow; CRC Press: Boca Raton, FL, USA, 2018. [Google Scholar]
  45. Ferziger, J.H.; Perić, M.; Street, R.L. Computational Methods for Fluid Dynamics; Springer: Berlin/Heidelberg, Germany, 2019. [Google Scholar]
  46. Korba, D.; Huang, W.; Randhir, K.; Petrasch, J.; Klausner, J.; AuYeung, N.; Li, L. A continuum model for heat and mass transfer in moving-bed reactors for thermochemical energy storage. Appl. Energy 2022, 313, 118842. [Google Scholar] [CrossRef]
  47. Karwa, R. Heat and Mass Transfer; Springer: Berlin/Heidelberg, Germany, 2020. [Google Scholar]
  48. Yu, S.; Shao, L.; Zou, Z. Operation enhancement of the H2 shaft furnace: A numerical study on the impact of N2 mixing in feed gas. Int. J. Chem. React. Eng. 2024, 22, 813–821. [Google Scholar] [CrossRef]
Figure 1. Flow chart of the H2-DRSF plant.
Metals 15 00862 g001
Figure 2. Gas and solid flows in Case A. From left to right: gas streamlines and pressure; radial density of solid mass flux; axial density of solid mass flux.
Metals 15 00862 g002
Figure 3. Distribution of the solid temperature in each case.
Metals 15 00862 g003
Figure 4. Distribution of H2 content in each case.
Metals 15 00862 g004
Figure 5. Distribution of gas pressure in each case.
Metals 15 00862 g005
Figure 6. Distribution of the hematite content in each case.
Metals 15 00862 g006
Figure 7. Distribution of the magnetite content in each case.
Metals 15 00862 g007
Figure 8. Distribution of the wustite content in each case.
Metals 15 00862 g008
Figure 9. Distribution of the iron content in each case.
Metals 15 00862 g009
Figure 10. Metallization degree as a function of the cooling gas flow rate in case B.
Metals 15 00862 g010
Figure 11. Energy consumption in each case.
Metals 15 00862 g011
Table 1. Operating parameters of cases A, B, C, D and E. The inputs and outputs are given in plain and bold letters, respectively.
Operating ParametersCase ACase BCase CCase DCase E
Bustle gasDg (mol/s)23002100230023002300
T (°C)890890950815890
% H29393669393
% H2O22222
% N2553255
P (Pa)180,400179,600212,400178,900176,700
Cooling gasDg (mol/s)500700500500500
T (°C)7070707070
% H29393669393
% H2O22222
% N2553255
P (Pa)181,600181,900215,500180,800178,200
Solid burden inletDs (kg/s)4545454543
T (°C)202020120020
% Fe2O396.6596.6596.6596.6596.65
Gangue3.353.353.353.353.35
∅ (mm)1515151515
bed porosity0.50.50.50.50.5
Top gasDg (mol/s)27962800279328022766
T (°C)344341394806353
% H264.165.136.162.964.6
% H2O30.929.931.932.130.4
% N2553255
P (Pa)150,000150,000150,000150,000150,000
Solid DRIDs (t/h)117.19117.22117.18116.86109.88
T (°C)261166402330403
% Fe2O300000
% Fe3O40.52.82000
% FeO7.715.048.267.110
% Fe87.1687.5187.1188.2495.15
% Gangue4.634.634.634.644.85
Metallization%93.393.793.294.1100
Gas utilization degree (GUD)-0.330.330.470.340.32
Energy demandGJ/tDRI12.2011.9912.4711.6812.98
Disclaimer/Publisher’s Note: The statements, opinions and data contained in all publications are solely those of the individual author(s) and contributor(s) and not of MDPI and/or the editor(s). MDPI and/or the editor(s) disclaim responsibility for any injury to people or property resulting from any ideas, methods, instructions or products referred to in the content.

