Article

Finite Element Analysis for Restraint Intensity and Welding Residual Stress of the Lehigh Specimen Made of Ti80 Alloy

1
School of Energy Engineering, Huanghuai University, Zhumadian 463000, China
2
Henan Dingli Pole & Tower Co., Ltd., Zhumadian 463000, China
*
Author to whom correspondence should be addressed.
Metals 2025, 15(9), 1019; https://doi.org/10.3390/met15091019
Submission received: 21 August 2025 / Revised: 9 September 2025 / Accepted: 11 September 2025 / Published: 13 September 2025
(This article belongs to the Special Issue Advances in Welding Processes of Metallic Materials—2nd Edition)

Abstract

Ti80 alloy is one of the most commonly used marine titanium alloys but faces cold cracking risks in thick plate welding. Understanding the relationship between restraint intensity and welding residual stress is critical for industrial applications. This study employs finite element methods to quantify the restraint intensity of Lehigh specimens and establish its quantitative link with welding residual stress in Ti80 alloy. Simulations reveal that restraint intensity increases linearly with plate thickness and decreases linearly with slot depth. A binary linear regression model accurately predicts restraint intensity with relative error of less than 6%. Furthermore, welding simulations demonstrate that residual stress on the weld bead’s upper surface increases exponentially with restraint intensity, while the lower surface shows a linear increase. Exponential and linear fits were applied to predict residual stress on the upper and lower surface, respectively. Validation confirms prediction errors for residual stress are below 9%. This work provides a methodology to assess cracking susceptibility and residual stress in actual Ti80 components by matching restraint conditions with Lehigh specimens.

1. Introduction

Ti80 alloy is the near-α titanium alloy with a nominal composition of Ti-6.0Al-2.5Nb- 2.2Zr-1.2Mo. It exhibits excellent strength–toughness balance, superior corrosion resistance, and good weldability. Consequently, Ti80 alloy finds widespread application in shipbuilding, marine engineering equipment, deep-sea pressure vessels, and high-performance structural components [1,2,3]. With the application of thick plates, welding cold cracks began to appear. Given the demonstrated correlation among cold cracking, restraint intensity, and welding residual stress, understanding their relationship continues to be of significant interest in the industry [4,5,6]. This is primarily because some catastrophic accidents are often caused by residual stress and cold cracks. For instance, in a large aerial work platform, a lifting structure suffered a catastrophic fracture during operation several months after passing initial load tests. Subsequent failure investigation revealed that incomplete welding beams acting as pre-existing cracks, combined with cyclic loading-induced fatigue propagation, were the direct cause of this fracture [7]. Research on joint restraint intensity has been conducted, with numerous self-constrained specimens designed specifically for cold crack sensitivity testing. In plate butt welding, common self-constrained test specimens comprise the Tekken test joint, slot weld joint, Lehigh specimen, and circular slotted specimen, with additional variants documented in the literature [8,9,10].
The Lehigh specimen, developed at Lehigh University, controls restraint intensity through the use of a plate containing precisely dimensioned slots on the plate sides. Compared to most self-restrained specimens, which can only adjust restraint intensity by changing the plate thickness, the Lehigh specimen offers significantly greater flexibility. In general, self-constrained specimens provide a relatively large restraint intensity; if cold cracking does not occur in such a specimen, the material at the corresponding thickness is generally considered safe for welding applications. However, this method fails to quantitatively compare the restraint intensity between the self-restrained specimen and the actual welded workpiece, making it difficult to accurately evaluate the actual welded component based on the test results of the specimen. Moreover, quantitative experimental measurement of restraint intensity poses significant technical challenges. This typically necessitates the use of custom loading equipment, and the applied loading conditions often struggle to satisfy the strict requirements inherent in the definition of restraint intensity [11,12,13].
Consequently, beginning in the 1990s, some scholars applied elastic–plastic mechanics theory to derive and calculate the restraint intensity for various classical specimens, including variable restraint crack (VRC), flat plate rigid restraint crack (RRC), and 2D restraint crack (BRC) specimens. They also analyzed the reliability of the engineering applications [14,15,16]. Subsequently, researchers conducted theoretical calculations on a series of novel specimens and welding workpieces. Sun et al. analyzed the restraint intensity of an H-type slit specimen based on the restraint mechanism and developed an analytical solution. Using this specimen, they evaluated the impact of restraint intensity on post-weld residual stress [17]. Kurj et al. proposed expressions for restraint intensity of WIC and M-WIC test specimens. Using these specimens, they simulated the constraint conditions of full-scale girth welds in energy pipelines and investigated the influence of welding parameters on residual stress [18,19,20]. Tao et al. used the thin shell theory to determine the radial displacement function of even circumferentially distributed force; he derived an analytical solution for calculating the fillet weld restraint intensity. The influence of key parameters, such as the cylindrical shell plate thickness, radius, and the shell ring length, on the restraint intensity was also analyzed [21]. However, theoretical computational approaches are typically limited to specimens or workpieces with relatively simple, geometrically regular shapes. Furthermore, they often require significant simplifying assumptions, making them difficult to apply to complex geometries, such as the Lehigh specimen featuring numerous slots.
In recent years, the finite element (FE) method has been widely used in the quantitative evaluation of restraint intensity and welding residual stress, owing to its robust numerical simulation capabilities, and the accuracy of its results has been widely recognized. Zhang et al. calculated the restraint intensity of typical specimens through the elastic–plastic FE method and verified the simulation accuracy through experiments, including the rigid restraint specimen, VRC specimen, T-joint specimen, etc. They analyzed the influence of geometric parameters on the restraint intensity and clarified the key influencing parameters [22,23,24]. More research focused on the relationship between residual stress and restraint intensity. Dirk et al. studied the interaction between interpass temperature and restraint intensity on the welding residual stress of S960QL high-strength steel, presenting the contour plot of the determined stress levels as a function of interpass temperature and restraint intensity. They pointed out that increased restraint intensity lead to higher stress levels but also an increasing influence of the interpass temperature [25]. Park et al. employed a thermal elastic–plastic FE method to analyze residual stress evolution under varying restraint conditions. Their analysis demonstrated that transverse restraint did not significantly alter the magnitude or distribution of residual stresses along the weld line direction. Conversely, restraint conditions substantially influenced both the size and distribution of residual stresses in the transverse direction. Moreover, the restraint triggered a stress inversion in the transverse direction: tensile stresses converted to compressive stresses at the weld root layer, while compressive stresses transformed to tensile stresses in mid-weld and cap regions [26]. Wang et al. investigated the influence of restraint conditions on residual stresses in 2219-T8 aluminum alloy TIG welded joints using FE analysis. They pointed out that the restraint conditions have different influences on welding residual stresses. Higher vertical pressing force results in an overall larger tensile stress area ratio on the cut plane, as well as greater distance between maximum tensile stress and the weld center. Higher horizontal clamping force further increases the distance between maximum tensile stress and the weld center but decreases the total tensile stress area compared with higher vertical pressing force, resulting in a steeper variation rate of tensile stresses in the HAZ [27]. Sun et al. investigated the impact of weld restraint on distortion and stress development during electron beam welding of a low-alloy steel. Using a validated 3D thermal–metallurgical–mechanical FE model, they found that welding without restraint caused significant inter-part gapping ahead of the beam, potentially leading to defects. While tack welds at the plate ends mitigated this gap, they induced high transient tensile stresses at the stop-end tack weld as the beam approached. Increasing tack weld width reduced this stress, but increasing the number of narrow tacks did not. Crucially, the restraint condition minimally affected the final residual stress field, which was dominated by martensitic transformation during cooling, resulting in compressive stresses within the weld/HAZ and a narrow band of high tensile stress immediately outside the HAZ [11].
Existing studies have established a qualitative correlation between restraint intensity and weld residual stress, confirming that residual stress increases with elevated restraint intensity. However, quantitative analyses remain scarce, and research has predominantly focused on steel materials with limited investigation of titanium alloys. This study proposed the following methodology: Lehigh specimens were analyzed via FE methods to quantify the relationship between restraint intensity and geometric parameters, and the obtained expression is Ri = 140.51t − 100.93h + 5934.64, where Ri is the restraint intensity, t is the plate thickness, h is the slot depth. Weld simulations under varying restraint conditions established quantitative restraint–residual stress correlations; the resulting expressions are Su = −453.7·exp[Ri/(−938.3)] + 735.0 and Sl = 548.1 + 0.04539·Ri, where Su and Sl are welding residual stresses on the upper and lower surfaces. In practical welding applications, fabricating Lehigh specimens matching the restraint intensity of actual components enables more effective assessment of crack susceptibility and preliminary evaluation of residual stresses.

2. FE Simulation and Verification

2.1. Fundamental Principles

For restraint intensity simulation, the software employed was ANSYS Workbench 2023 R2. The computational framework was based on the fundamental elastic–plastic theory for metals, encompassing three key components: The Von Mises yield criterion, used to determine whether plastic deformation occurs under a given stress state. The flow rule, characterizing the relationship between the plastic strain tensor and the current stress state. The isotropic hardening criterion, specifying that the material exhibits uniform yield responses in all directions [28].
On the other hand, the welding residual stress simulation based on the thermal elastic–plastic theory was performed utilizing the Visual Weld 10.7 software. The sequential coupling method was adopted. This approach first conducts a nonlinear transient thermal analysis under the prescribed welding and thermal boundary conditions to obtain the temperature history throughout the welding process. Subsequently, the temperature history from each load step is imported as a thermal load into the stress–strain field calculation for the model, thereby completing the thermal and mechanical coupling analysis [29].

2.2. Dimensions

The Lehigh specimen dimensions are illustrated in Figure 1; the plate is 300 × 200 × 20 (mm3). Ten slots were cut on each long side, and two on each short edge. All slots had a uniform width of 2 mm and a depth of 50 mm. The test weld bead length was 90 mm, located in the middle of the plate, with a U-shaped groove. The groove featured a 20° angle, a blunt edge thickness equal to half the plate thickness, and a root gap of 2 mm. Through-holes were drilled at both ends of the weld bead, with the size equal to the width of the upper surface of the groove. In this study, the restraint intensity was modulated by varying the plate thickness and slot depth.

2.3. Thermal and Mechanical Parameters

The measured composition of Ti80 alloy by the ICP (Inductively Coupled Plasma) method is shown in Table 1.
For restraint intensity simulation, elastic–plastic deformation at room temperature occurs, so some basic parameters acquired in experiments should be set. The density of Ti80 alloy is 4.51 g/cm3, yield strength is 814 MPa, Young’s modulus is 116 GPa, and Poisson’s ratio is 0.33. It should be noted that the tensile specimens parallel to and perpendicular to the rolling direction exhibited essentially identical mechanical properties, with yield strengths of 810.6 MPa and 817.8 MPa, tensile strengths of 875.8 MPa and 853.6 MPa, and elongation after fracture of 15.8% and 15.2%, respectively. This indicates that the alloy does not exhibit significant anisotropy. Consequently, the mechanical properties of the material were consistently defined as isotropic in the subsequent simulations, and the relationship between the welding direction and the rolling direction was not explicitly defined in the welding simulations. For welding residual stress simulation, thermal and mechanical parameters at varying temperatures were defined based on data from the literature and software databases, as detailed in Table 2 [30]. Temperature-dependent strain-hardening curves are presented in Figure 2.

2.4. Experimental Validations

To validate the FE method, experimental measurement and simulation were performed independently. The measurement method is shown in Figure 3. An electronic universal testing machine provided a 50 kN compressive load through a pressing plate and blocks to ensure uniform pressure distribution on the specimen’s top surface. The high-resolution CCD camera in fixed-focus mode captured groove root images before and after loading. Seven reference points were marked along the groove root, with initial distances precisely measured using calibrated vernier calipers. Displacements at the marked locations were determined by comparing the pictures before and after loading.
For comparison, the FE model with identical specimen geometry and loading conditions was established. A mesh-independent study was first conducted using SOLID186 elements (20-node hexahedral quadratic). The maximum equivalent stress and deformation results for varying element sizes are presented in Figure 4a. Results converged when the element size was reduced to 3 mm. Consequently, a uniform element size of 3 mm was adopted throughout the model, resulting in 49,264 elements and 224,846 nodes. The simulated deformation pattern under loading is shown in Figure 4b. The specimen displaced downward along the loading direction, with localized deformation concentrated near the loading area. At the groove root, deformation exhibited a characteristic maximum at the center, gradually decreasing toward both sides. Displacements at the groove root locations corresponding to the experimental measurement points were extracted and compared with test data (Figure 4c). The average error across all seven marked points was about 4.2%, verifying the accuracy of the finite element simulation.

3. Results and Discussion

3.1. Effect of Plate Thickness on Restraint Intensity

Using the verified FE simulation method described above, the plate thickness was varied to specific values of 20 mm, 28 mm, 36 mm, 44 mm, 52 mm, 60 mm, 68 mm, 76 mm, and 84 mm to investigate its influence on the restraint intensity. According to the definition of restraint intensity, it represents the force required to generate a unit elastic displacement per unit length of the weld groove root. Hence, in the simulation, one side of the groove root was fixed while a tensile load was applied to the opposing side. The resulting displacement was then extracted, and the restraint intensity was calculated using Formula (1).
R i = F l x
where Ri is restraint intensity with the unit of N·(mm·mm)−1, F is loading force with the unit of N, l is groove length with 75 mm, x is displacement of groove root with the unit of mm.
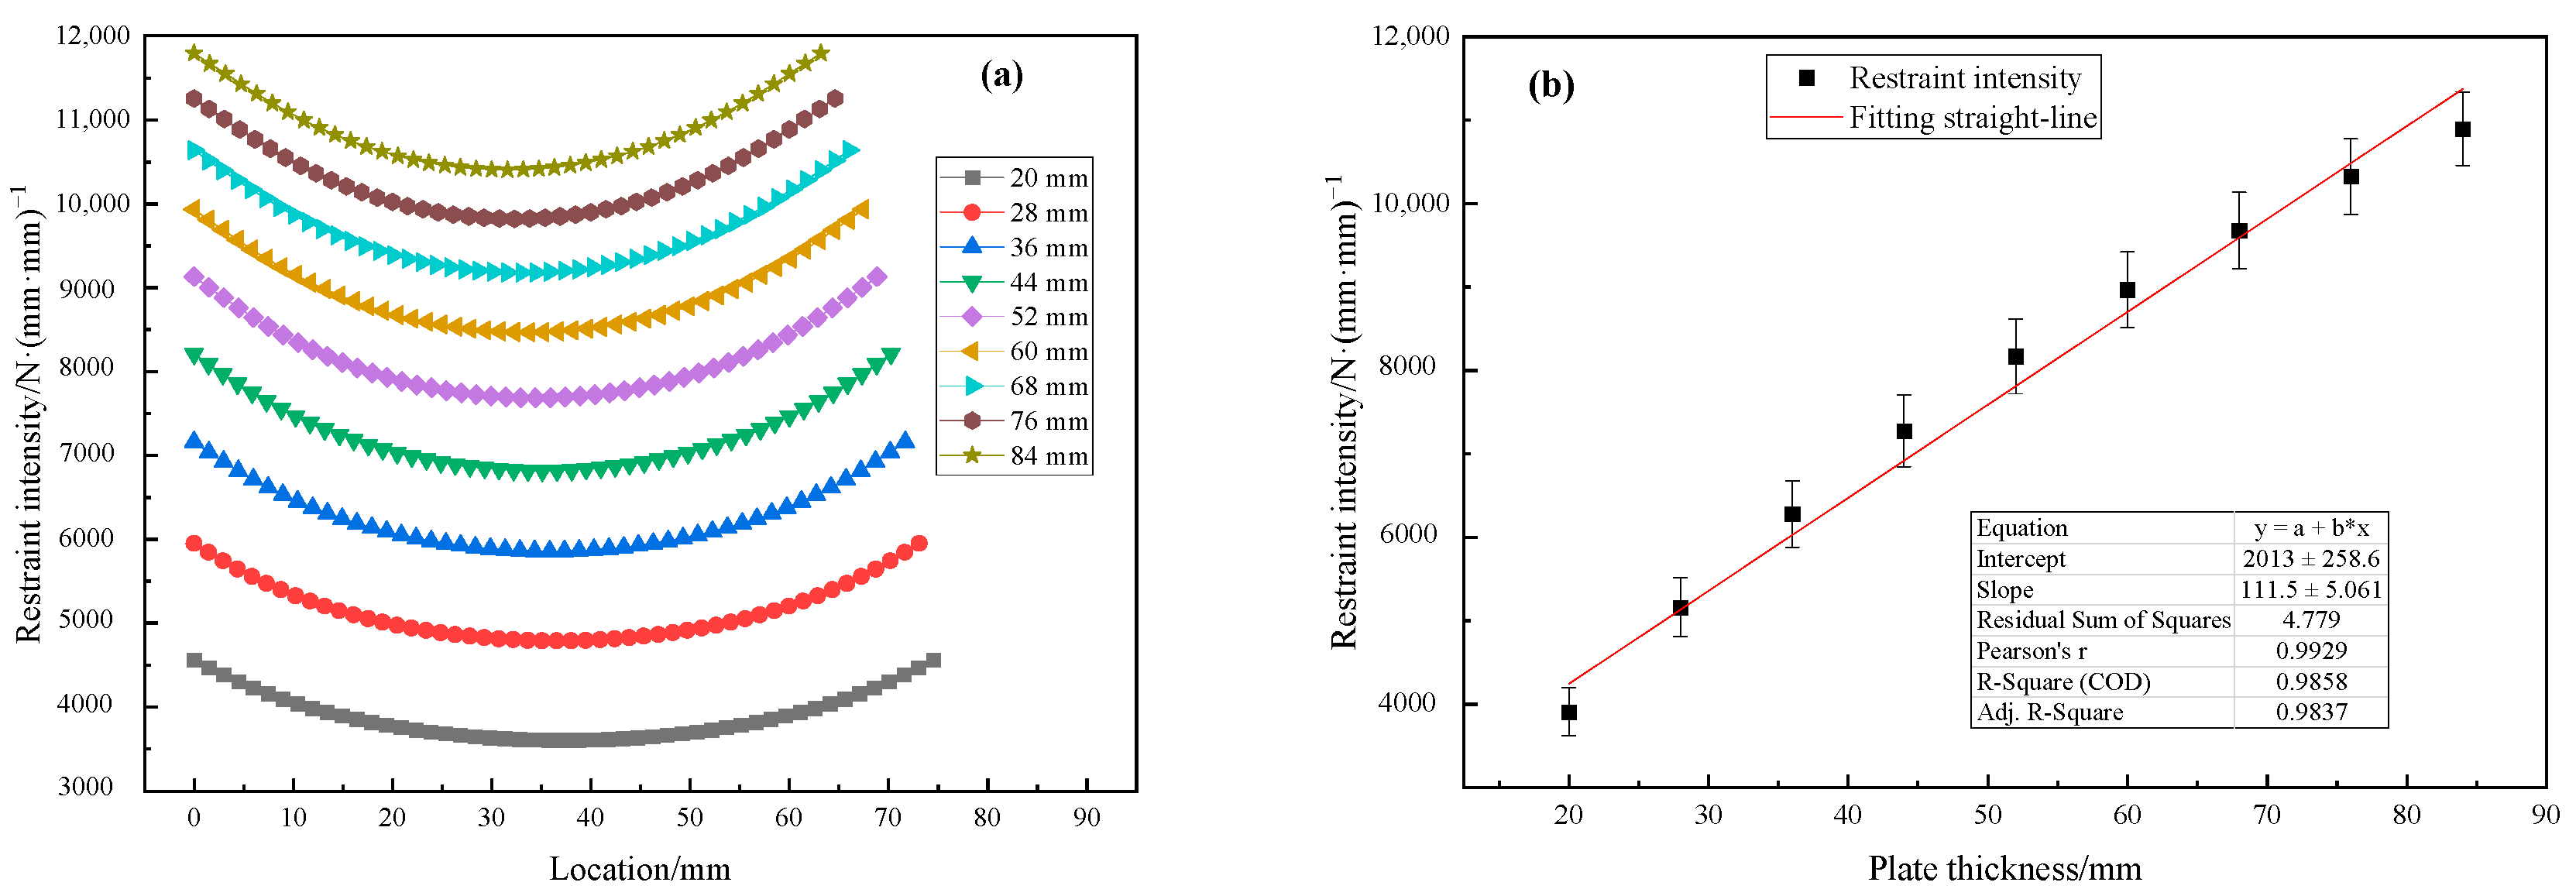
The restraint intensity results are presented in Figure 5a. Notably, the restraint intensity is significantly influenced by the plate thickness. As the thickness increases, the constraint effect intensifies, resulting in greater resistance to deformation and consequently, an increase in restraint intensity. It should be noted that increased plate thickness requires a larger through-hole diameter, resulting in a shorter groove length for thicker specimens. Furthermore, the restraint intensity exhibits a non-uniform distribution along the groove length. The overall pattern is characterized by lower values in the central region and higher values near the two ends, which is presumably attributable to the constraining effect of the plate material on both sides. This non-uniformity becomes more pronounced with increasing plate thickness. In the vicinity of through-holes, the increase in restraint intensity is moderated, which correlates with the stress-relieving effect of the holes. This characteristic aligns with the design intent of the Lehigh specimen, effectively mitigating abrupt changes in restraint conditions at the start and termination points of the groove. The Pearson correlation coefficient calculated between restraint intensity and plate thickness is 0.9929, indicating a strong positive linear relationship between the two variables. Further analysis involved performing a linear fit on the restraint intensity results, as shown in Figure 5b. The correlation coefficient R2 of 0.9858 demonstrates that variations in plate thickness account for nearly all the observed variation in restraint intensity. Furthermore, the significance level p-value is much less than 0.01, indicating that the effect of thickness is statistically significant. These results confirm an extremely robust model fit.

3.2. Effect of Slot Depth on Restraint Intensity

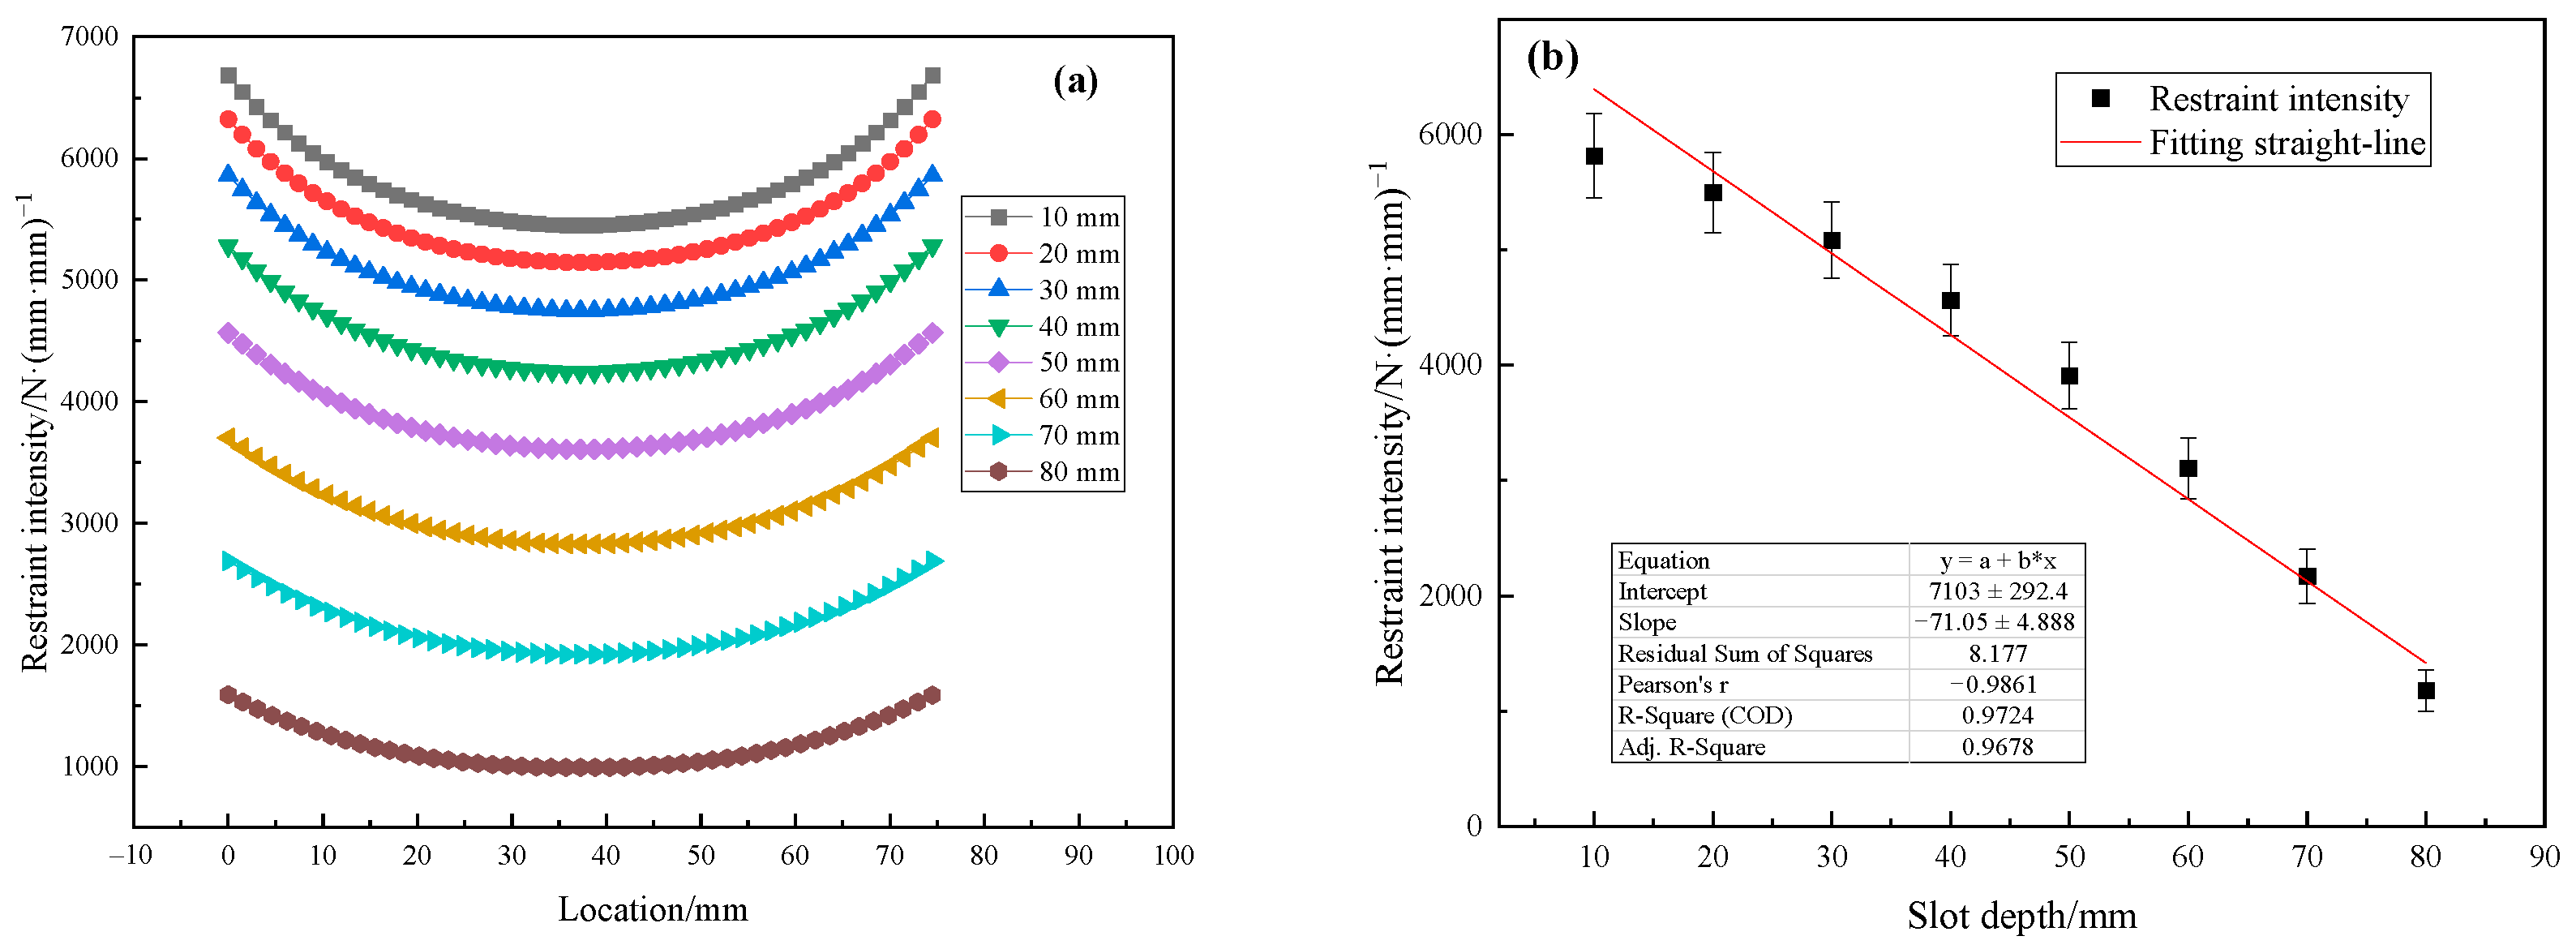
With the plate thickness held constant at 20 mm, slot depths were varied at 10 mm, 20 mm, 30 mm, 40 mm, 50 mm, 60 mm, 70 mm, and 80 mm to investigate their influence on restraint intensity. The simulation results are presented in Figure 6a. As the slot depth increases, the plate’s self-restraint effect diminishes, leading to a reduction in restraint intensity. The restraint intensity distribution along the groove length exhibits similarly lower values in the central region and higher values near both ends. Notably, this non-uniformity diminishes with increasing slot depth. The calculated Pearson correlation coefficient of −0.9861 indicates a marked negative linear relationship between restraint intensity and groove depth. The linear fitting result is shown in Figure 6b. The correlation coefficient R2 is 0.9724, and the p-value is much less than 0.01, confirming an exceptionally robust model fit.

3.3. Linear Regression Analysis

The aforementioned analysis indicates that restraint intensity exhibits significant linear relationships with both plate thickness and slot depth. Consequently, a binary linear regression model was established to predict restraint intensity. Firstly, set the range of the plate thickness (t) as 20 mm to 84 mm and the slot depth (h) as 10 mm to 80 mm. Using SimLab 2.2 software, randomly select 100 parameter sets via Latin Hypercube sampling. Subsequently, conduct FE simulation for each parameter to calculate the restraint intensity Ri. The SPSS 24 statistical analysis software was used for modeling, where the plate thickness and slot depth were independent variables, both in mm, and the restraint intensity was the dependent variable, in N·(mm·mm)−1. The fitting results show that the Durbin–Watson test statistic (DW = 2.205) fell within the acceptable range for residual independence, indicating no significant autocorrelation. With an adjusted coefficient of determination R2 of 0.9466, the model accounts for 94.66% of observed variance in restraint intensity. The overall regression proved statistically significant (p-value < 0.01) as determined by analysis of variance. The derived predictive equation takes the following form:
Ri = 140.51t − 100.93h + 5934.64
Ten specimens with varying plate thicknesses and slot depths were randomly selected and designated as No. 1 to 10. The regression model was employed to predict restraint intensity values, which were then compared against FE simulation results in Table 3. The prediction errors demonstrate random fluctuations, aligning with fundamental regression assumptions. Almost all errors remained within 10%, with a mean absolute error of 5.9%, indicating the model achieves satisfactory predictive accuracy for restraint intensity estimation.

3.4. Effect of Restraint Intensity on Welding Residual Stress

Using Visual Weld 10.7 software to simulate welding residual stress in specimens with different restraint intensities, a quantitative relationship between residual stress and restraint intensity was established. For Ti80 thick plate welding, the root pass is most susceptible to welding cracks; therefore, only this weld pass was simulated. Plates with a thickness of 20 mm were used, and different restraint intensities were achieved by varying slot depths of 10 mm, 20 mm, 30 mm, 40 mm, 50 mm, 60 mm, 70 mm, and 80 mm. The restraint intensities for these configurations had been obtained through FE calculations. In the simulation, a transition meshing technique was employed, fine elements with approximate sizes of 0.5 mm were used in the weld zone, while coarse elements with a maximum size of approximately 10 mm were applied in regions away from the weld. The mesh primarily consisted of hexahedral elements, with tetrahedral elements used for transitioning near the through-holes. The specific mesh configuration is illustrated in Figure 7a (taking the 50 mm slot as an example), and the mesh in the weld pass region is shown in Figure 7b.
The root pass is typically produced using the TIG welding process. This study employed the double ellipsoidal heat source model, which effectively simulates the TIG welding heat source. The heat input was determined based on the actual welding parameters.
The welding tests were completed using an automatic straight seam TIG welding machine from Luoyang Gengqin Intelligent Equipment Co., Ltd. (Luoyang, China). The welding power source was an AOTAI WSME315 (Aotai Electric Co., Ltd., Jinan, China) fully digital inverter welding power supply, with a travel mechanism stroke of 1200 mm and a clamping mechanism operated pneumatically. Through process optimization trials, the following optimized welding parameters were determined: the power source mode was set to direct current electrode negative (DCEN), the tungsten electrode type was ceriated tungsten with a diameter of 3.2 mm, and the distance from the tungsten electrode to the root of the groove was 3 mm. The filler material was a Ti80 alloy wire with a diameter of 1.6 mm, and the shielding gas was high purity argon with a flow rate of 15 L/min. Due to the high susceptibility of the alloy to contamination by air at elevated temperatures, an additional argon trailing shield was attached to the rear of the welding torch. The welding current was 140 A, the welding voltage was approximately 16 V, and the welding speed was 12 cm/min.
The welding simulation was conducted in two steps. First, a temperature field simulation was performed. Based on the actual welding process parameters, the calculated heat input was 1120 J/mm. Considering that the thermal efficiency η of TIG welding typically ranges from 0.7 to 0.8, a value of 0.75 was selected. Consequently, the final determined welding heat input was 840 J/mm. In the double ellipsoidal heat source model, the length of the front semi-ellipsoid af and the rear semi-ellipsoid ar were 4 mm and 8 mm, respectively. The front energy factor Qf and the rear energy factor Qr were 1.0 and 0.833, respectively. The half-width of the molten pool b was 4.5 mm, and the depth of the molten pool c was 2 mm. The simulation accounted for both convective heat loss and radiation heat dissipation. The ambient air temperature was set to 20 °C. Convective heat transfer followed Newton’s law of cooling, with a transfer coefficient of 20 W/(m2·K), representing a typical value for natural convection. Radiation heat dissipation was modeled according to Stefan–Boltzmann’s law, with a surface emissivity of 0.8. Material behavior was defined based on the software database, incorporating the α to β phase transformation at 995 °C. Further details can be found in the Visual Weld technical documentation. To validate the simulation accuracy, the FE simulation and corresponding welding experiment were conducted on specimens with a 50 mm slot depth.
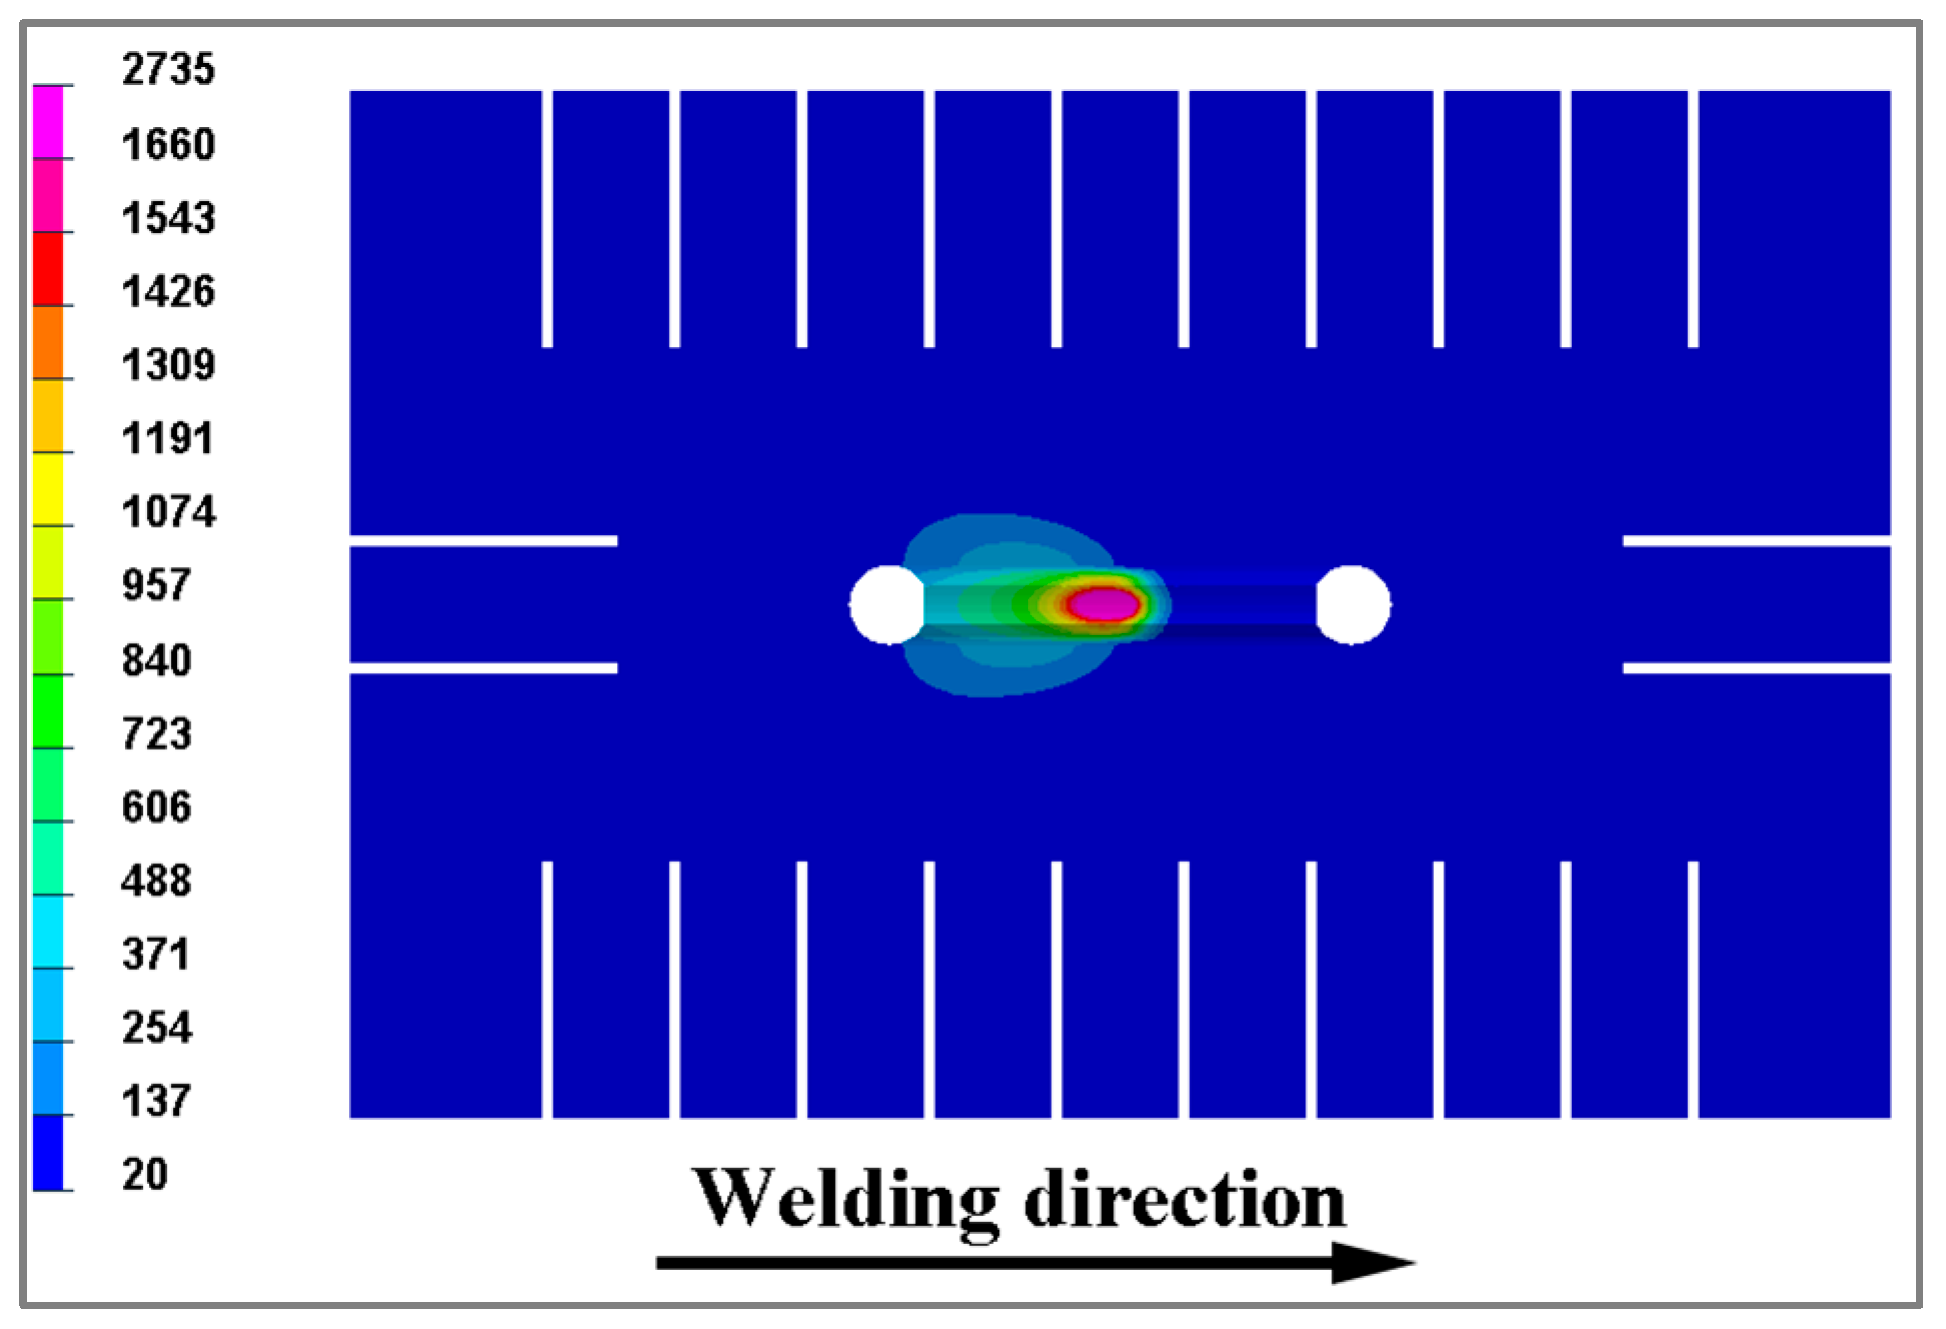
The temperature field during the welding process is shown in Figure 8. Due to the symmetry of the plate, the temperature field also exhibits a symmetrical distribution. Regions with temperatures above the melting point of 1660 °C are indicated in pink. It can be observed that the molten pool presents an elliptical shape. Owing to the low thermal conductivity of Ti80 alloy, the trailing phenomenon of the molten pool is not obvious, meaning the front and rear ends of the molten pool are similar. Since only a backing pass was deposited, the plate has substantial heat storage capacity, resulting in a large temperature gradient around the molten pool. Temperature increase is primarily concentrated near the weld bead.
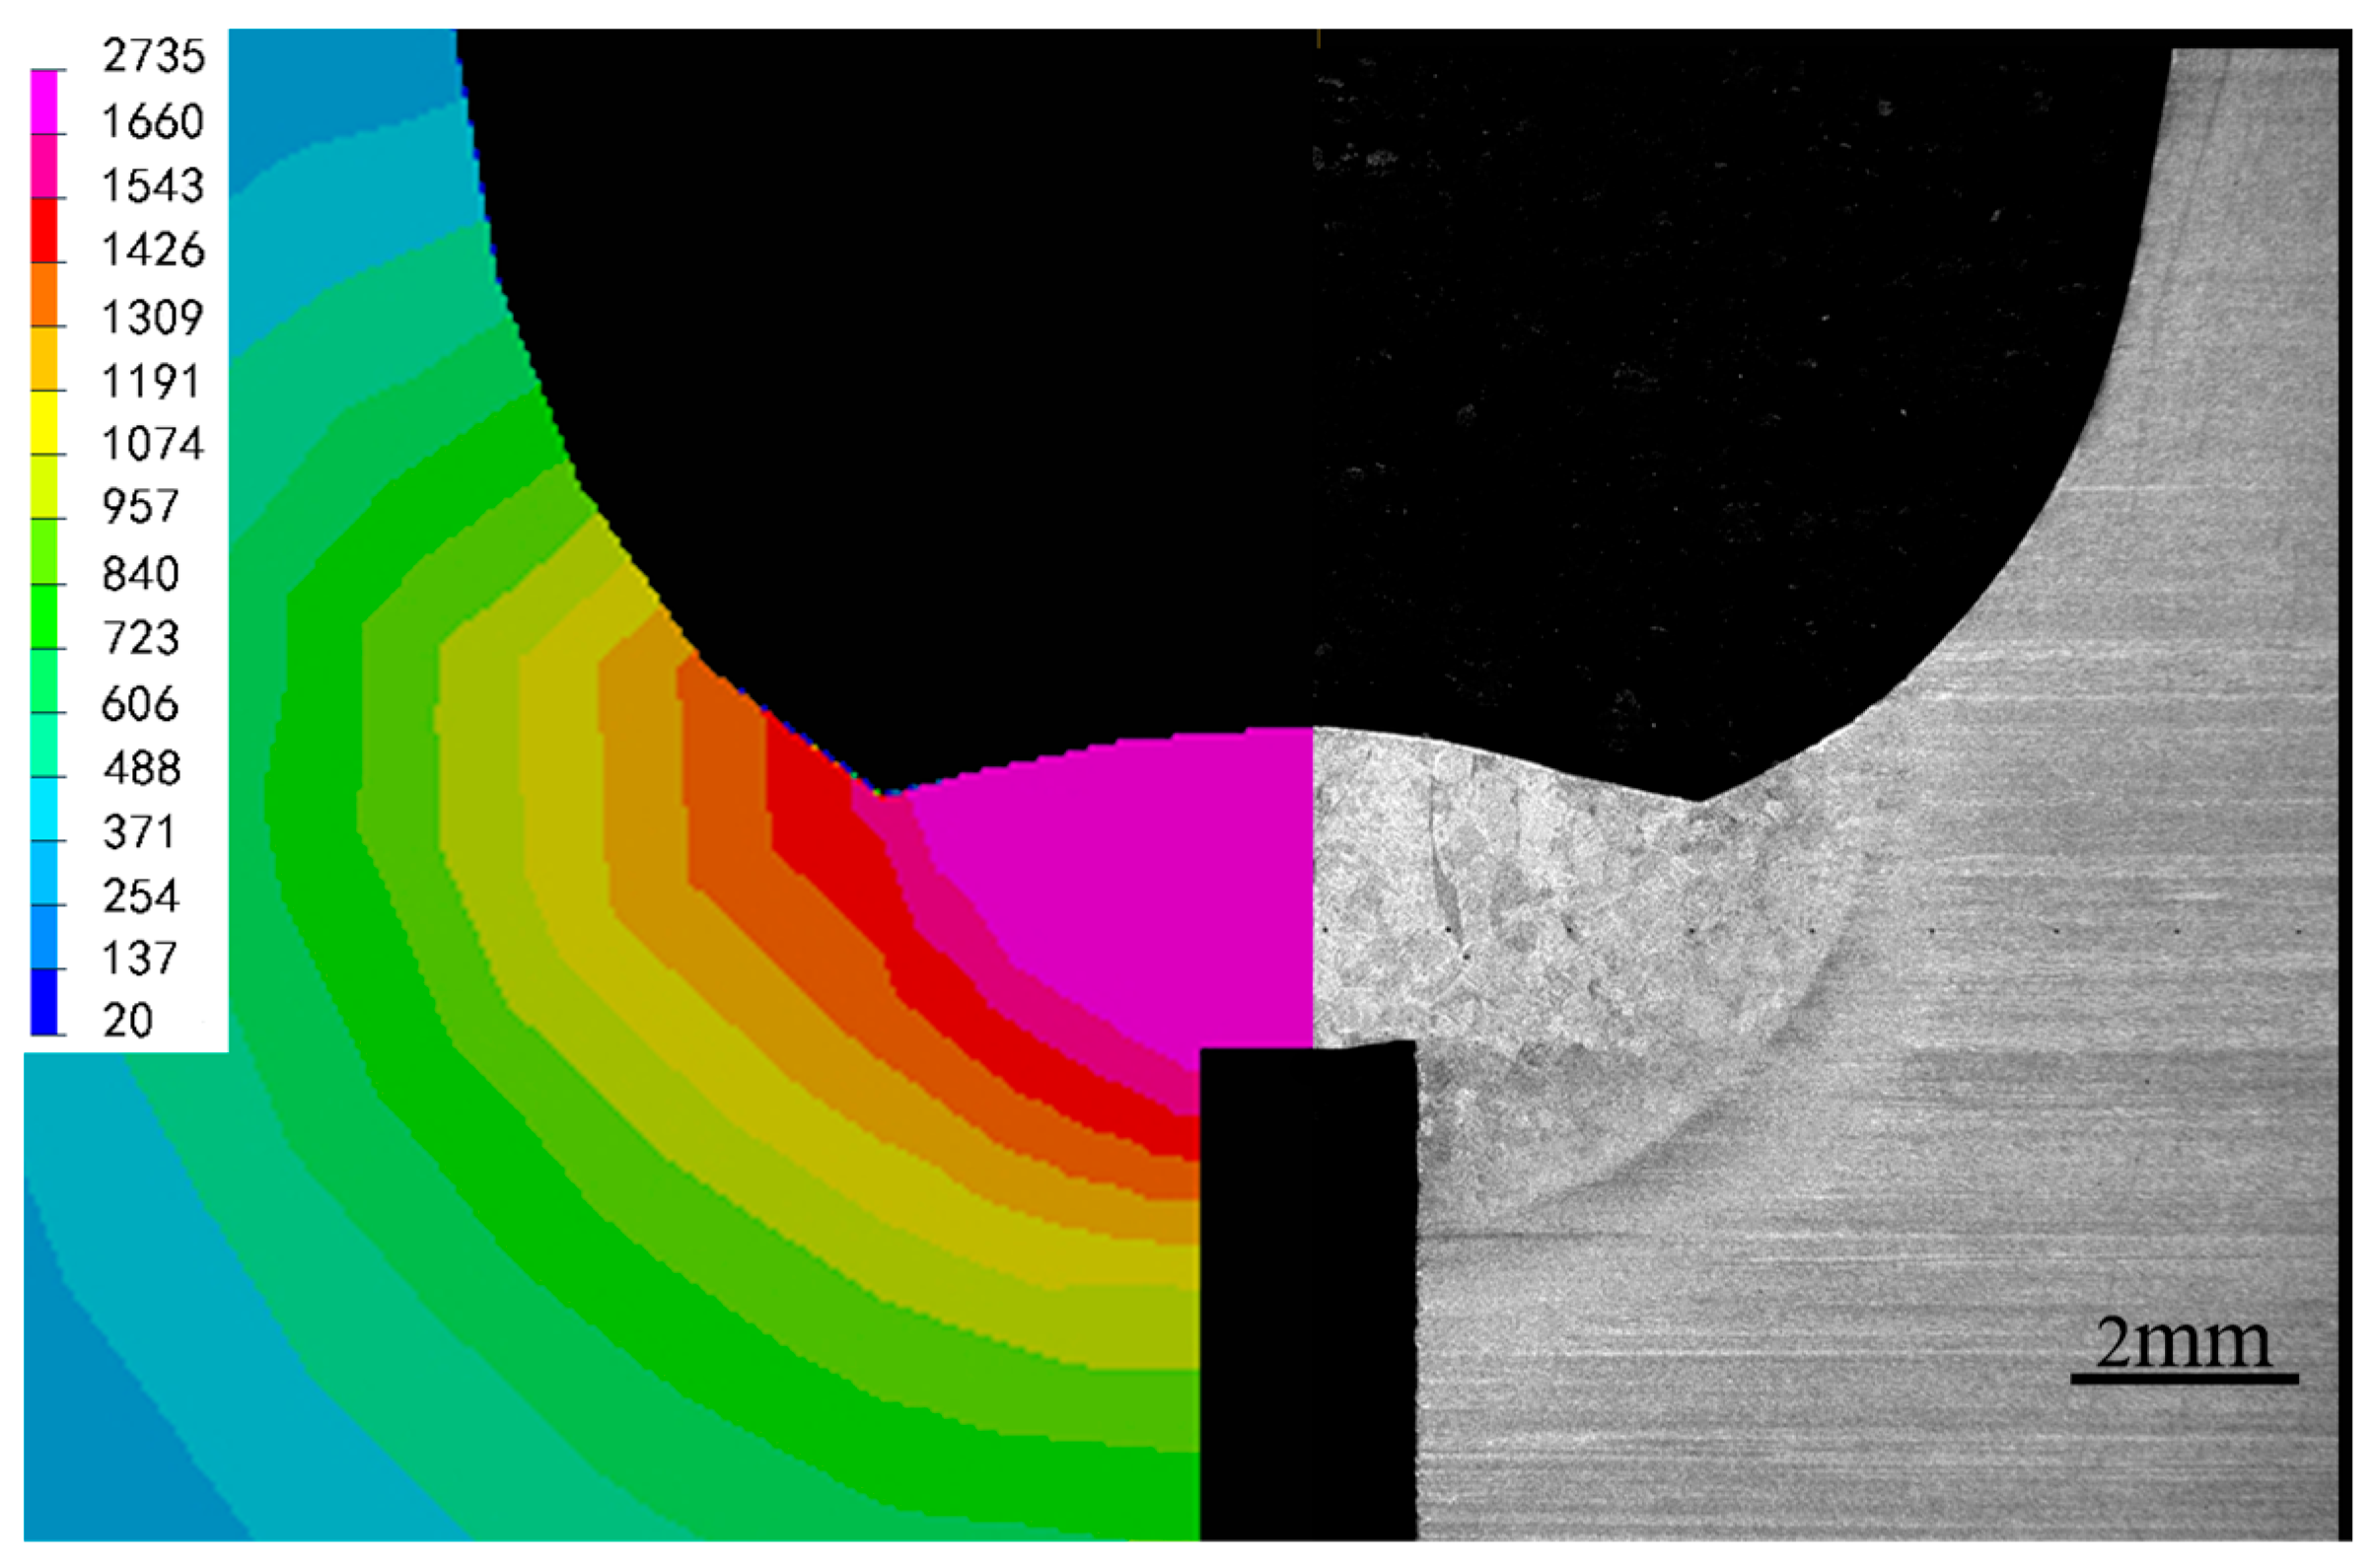
The simulated temperature field and actual weld joint are presented in Figure 9. The pink shaded regions represent areas above the melting temperature of 1660 °C. Good agreement was observed between the simulated and experimental weld bead morphologies, confirming the reliability of the simulation model.
After obtaining the welding temperature field, the temperature data was applied as a load to the mechanical analysis model to solve for the post weld residual stress. This two-step thermal–mechanical coupling simulation operated under the assumption that welding stress and deformation do not inversely affect the temperature field, a condition that generally holds true under normal circumstances. In the mechanical simulation, constraint conditions must be defined. Since this study focuses on the influence of self-restraint, meaning the welding process occurs under relatively weak external constraints, only the four corners of the plate’s bottom surface were set as fixed constraints. This approach minimized the impact of external restraint on the simulation results. The simulation duration extended to 200 s after welding completion. By this time, the maximum temperature of the plate had decreased to 112 °C, indicated that the model had essentially reached a stable state. The cooling rate at this stage was very slow, and further extending the computation time would have had negligible impact on the results while significantly consuming computational resources.
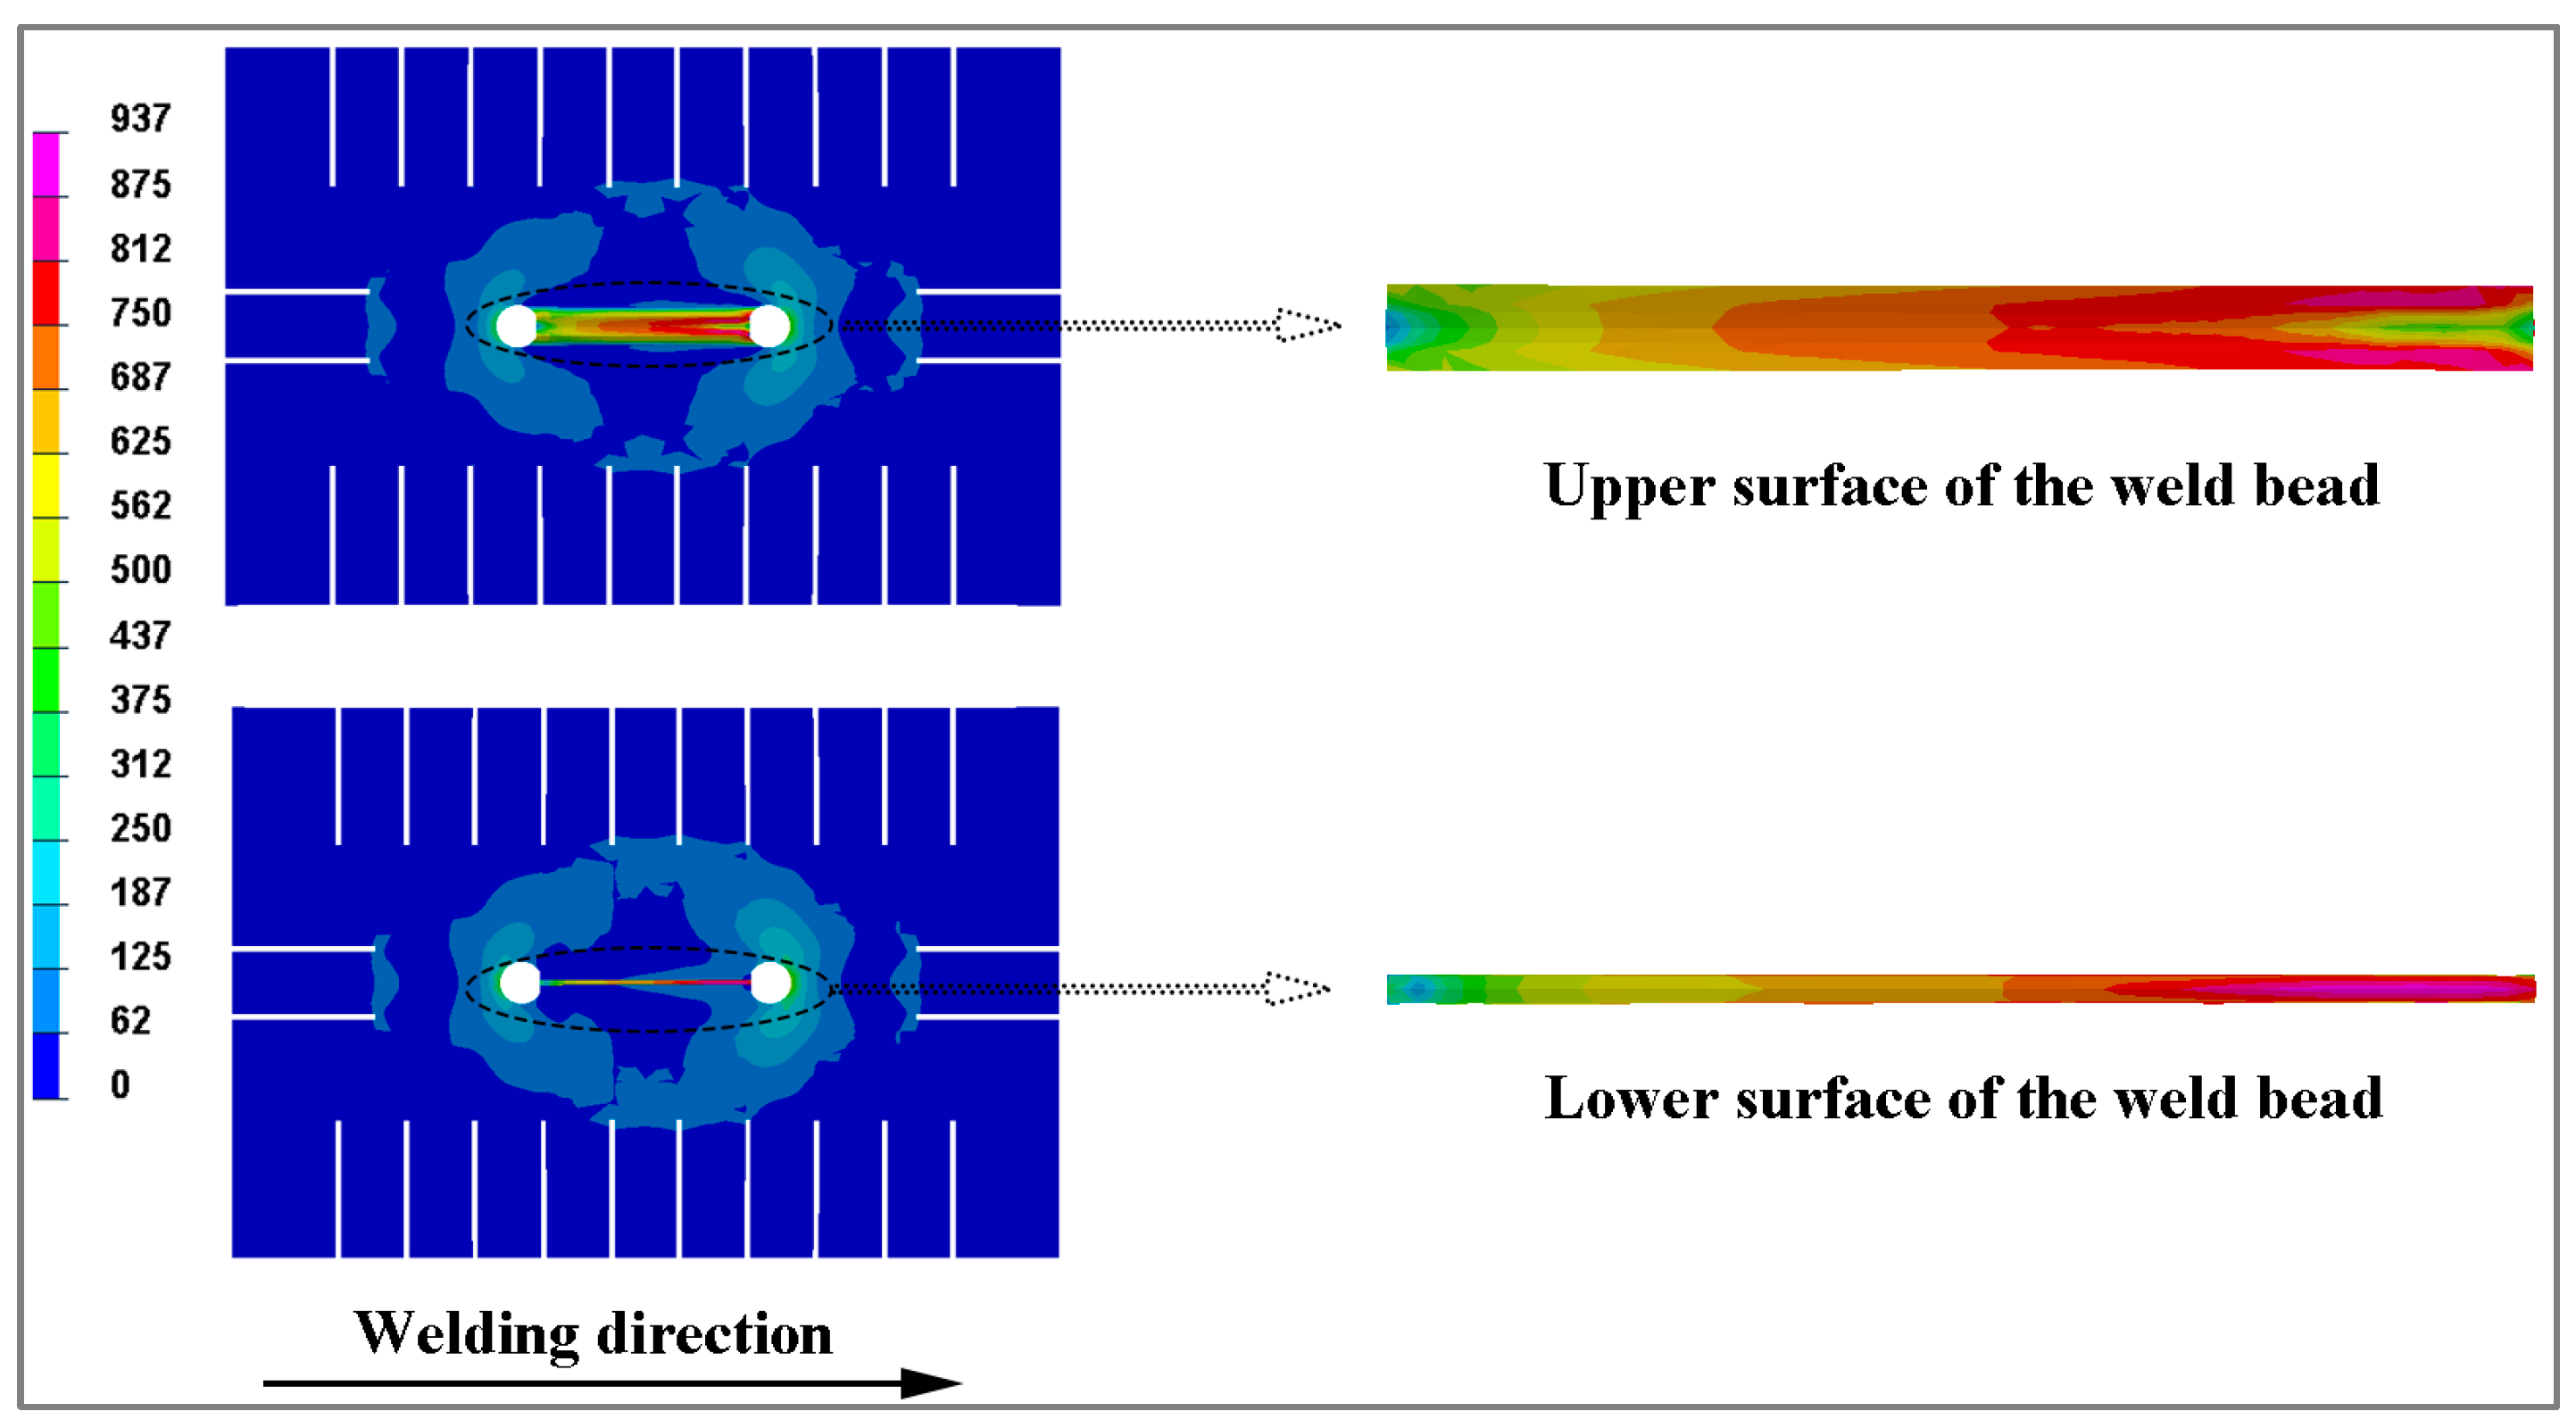
The final residual stress results are shown in Figure 10. The stresses primarily concentrate on the weld bead, exhibiting a tensile stress state. The residual stress distributions on the upper and lower surfaces of the weld bead demonstrate similarity, both gradually increasing along the welding direction. This phenomenon is mainly attributed to the non-uniform thermal expansion and contraction during the welding thermal cycle. As the heat source advances, accumulated plastic strain in previously deposited layers generates progressive constraint effects, thereby amplifying residual stresses toward the welding termination zone.
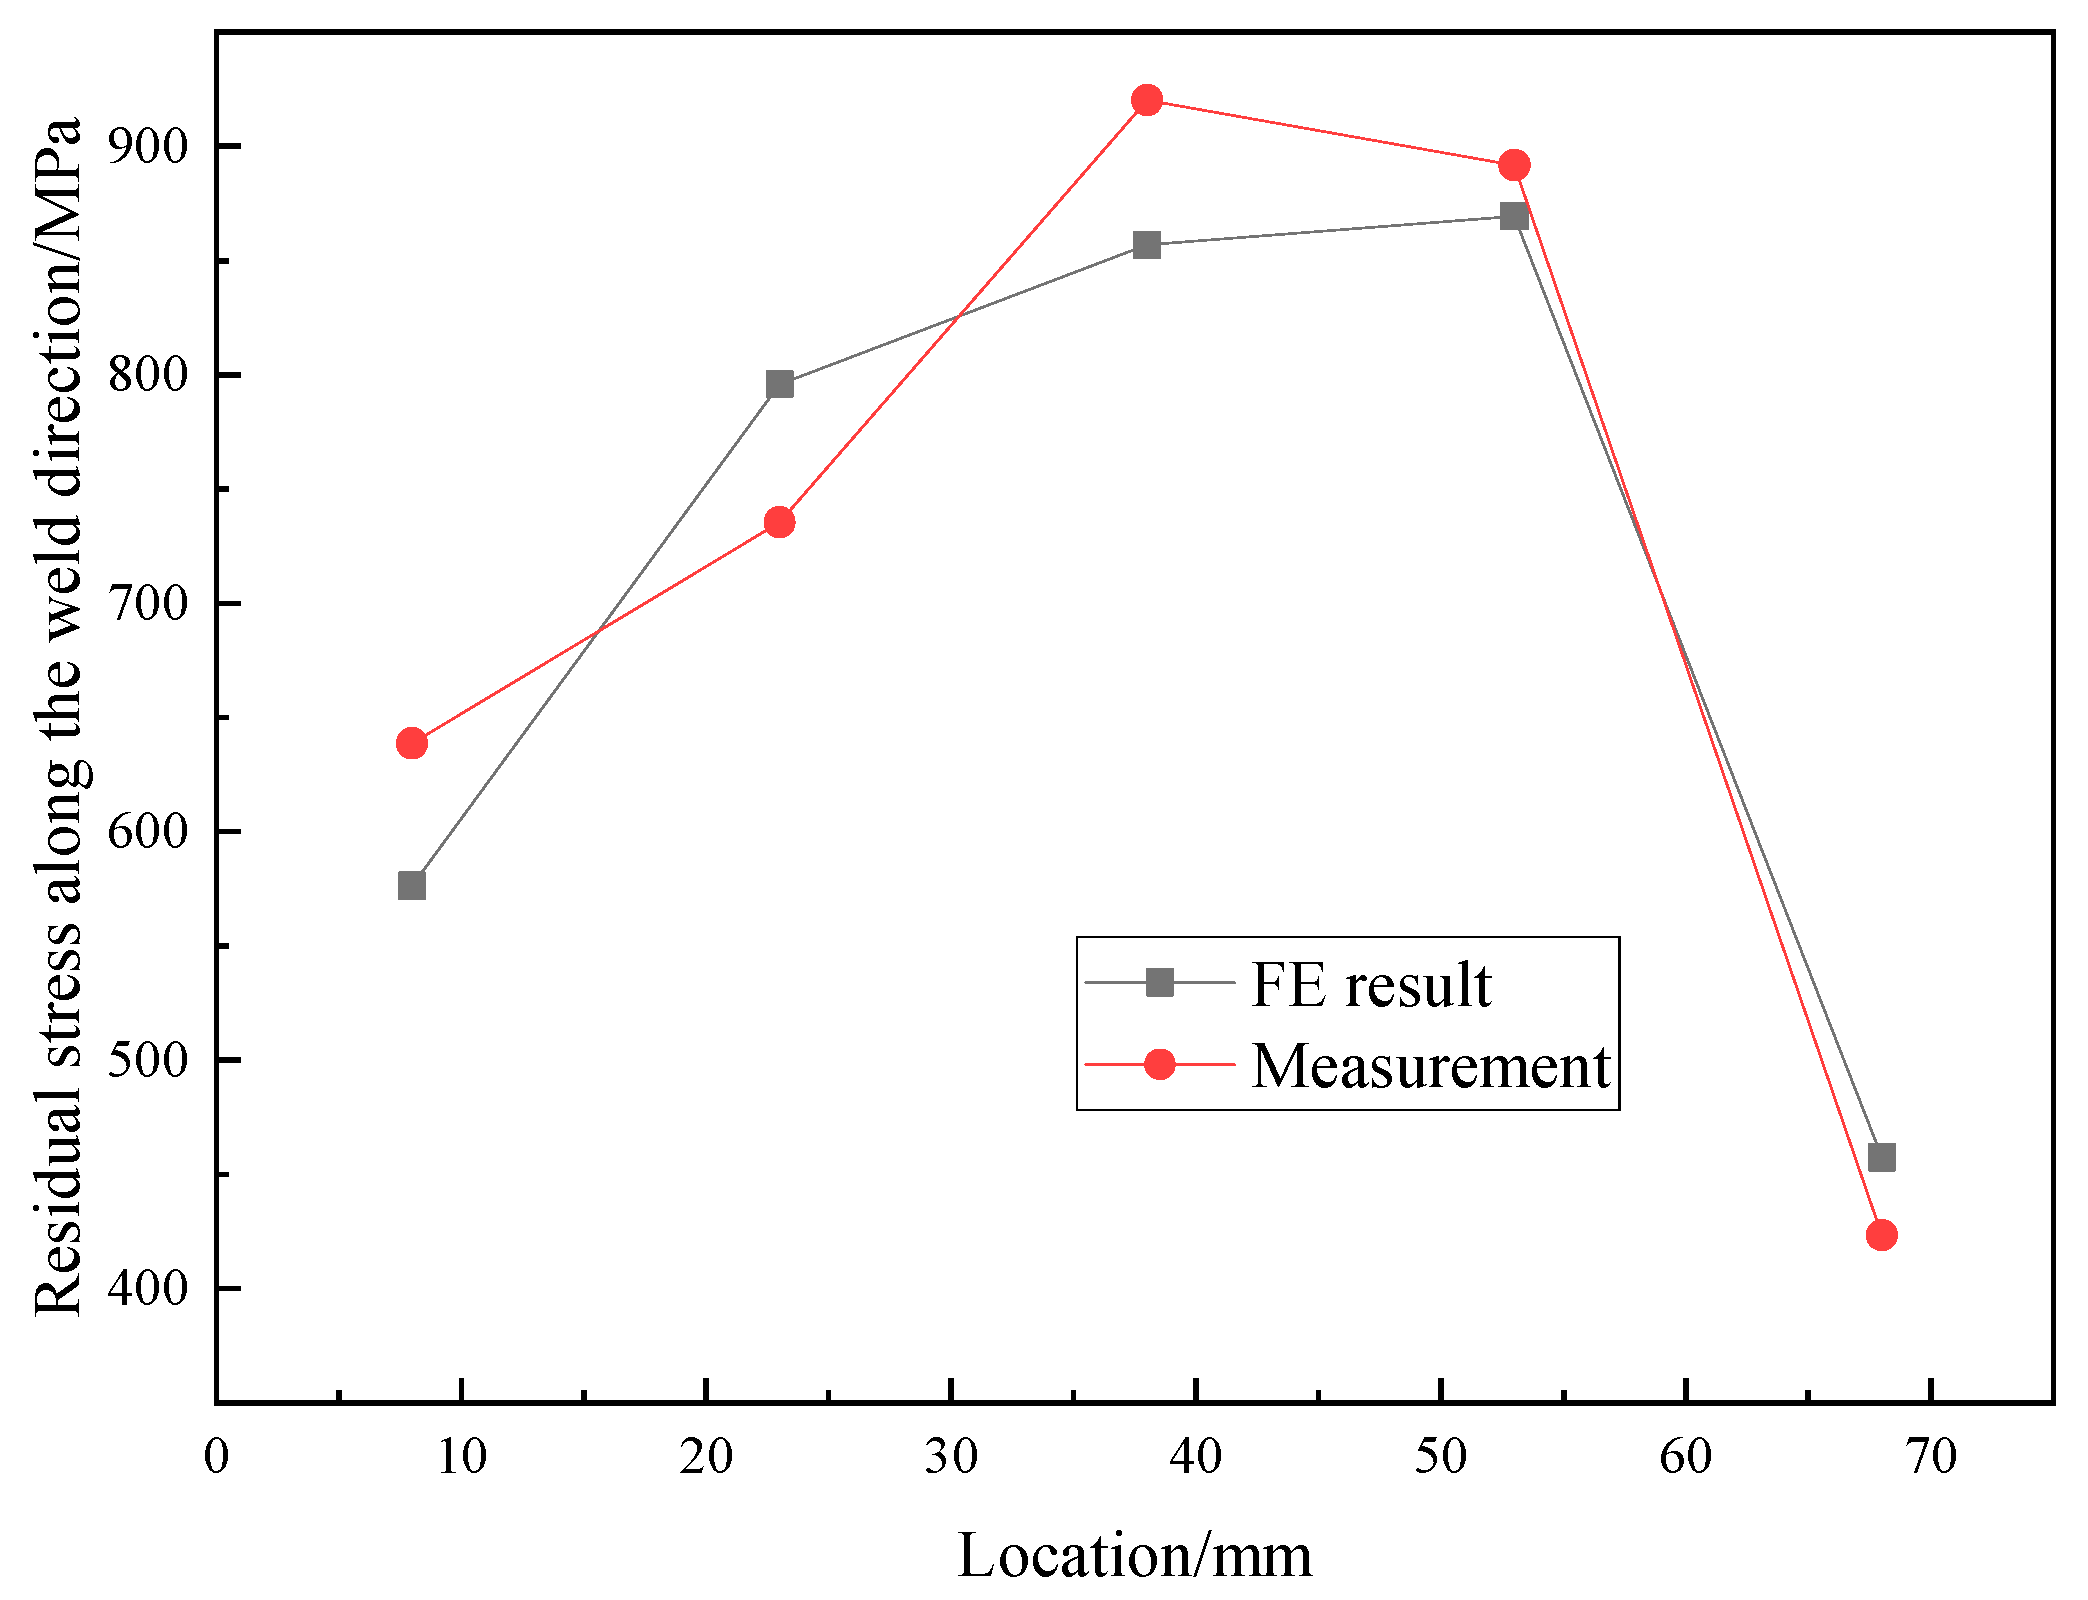
To validate the accuracy of the simulated results, residual stress measurements were conducted on the test plate using the X-ray diffraction method. The testing parameters included a copper target, the {213} crystallographic plane with a 2θ angle of approximately 140°, and the sin2Ψ method with Ψ angles set at 0°, 15°, 30°, and 45°. A collimator with a spot diameter of 0.5 mm was used, with an operating voltage of 30 kV and a current of 6 mA. Due to experimental constraints, only the residual stresses along the weld direction were obtained. These measured values were compared with the simulation results, as shown in Figure 11. The discrepancies between the two sets of data at all five measurement locations were less than 10%, with a mean absolute error of approximately 7%. This demonstrates the accuracy of the FE simulation in predicting welding residual stresses.
Residual stresses at the middle positions of the upper and lower surfaces, as well as at the weld toe regions, were extracted separately. The results are presented in Figure 12. On the upper surface, the stress distributions at the middle and the toe region exhibited opposite trends. At the middle position, stresses were higher and relatively stable in the central zone, decreasing towards the ends. Conversely, at the toe region, the stresses were higher at the ends and lower and relatively stable in the central zone. This contrasting behavior is primarily attributed to the mutual equilibrium of stresses. On the lower surface, the stress distributions at the middle and toe region were essentially coincidental, except for the latter half of the weld pass where a divergence occurred. This reduced differentiation compared to the upper surface is mainly due to the narrow width of the lower surface, limiting the distinctiveness between the middle and toe locations. Notably, a significant stress increase was observed in the latter half of the lower surface. This phenomenon is associated with the local restraint conditions specific to the lower surface of the weld pass.
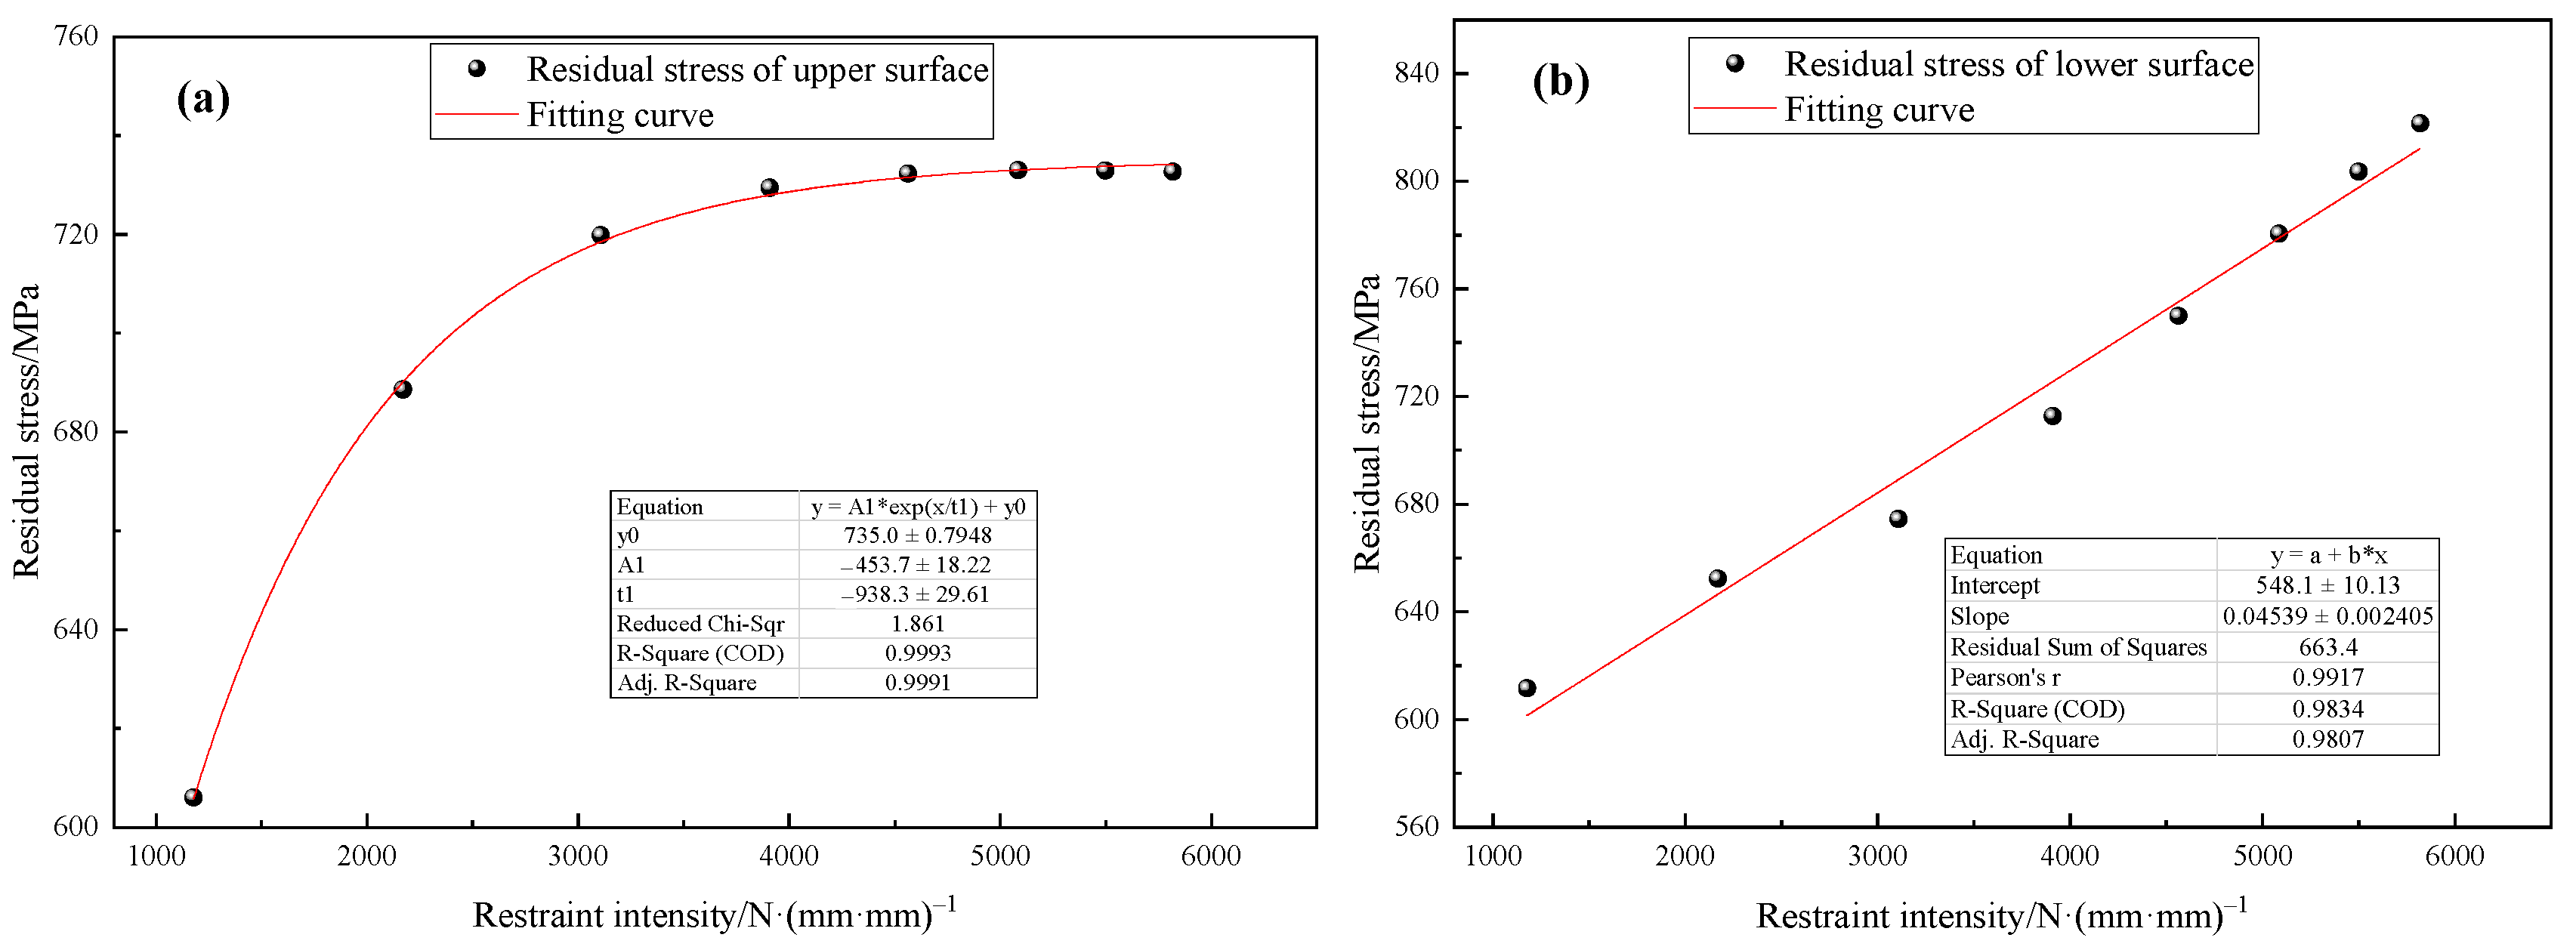
Similarly, residual stresses on the upper and lower surfaces were extracted for specimens with the other restraint intensities. The average values within the relatively stable midsection (20 mm to 60 mm) were taken as the characteristic residual stress values. The relationship between these characteristic residual stresses and restraint intensities is plotted in Figure 13.
Residual stresses increased with increasing restraint intensities in all cases, albeit with distinct patterns. The upper surface exhibited an exponential growth characteristic, featuring decelerating growth. In contrast, the lower surface displayed a linear increase. Exponential and linear fits were applied to the upper and lower surface data, respectively, yielding the quantitative relationships between residual stress and restraint intensities presented in Formulas (3) and (4).
Su = −453.7·exp[Ri/(−938.3)] + 735.0
Sl = 548.1 + 0.04539·Ri
where Su and Sl represent the predicted values of welding residual stress on the upper and lower surfaces. The adjusted R2 values for the prediction models were 0.9991 and 0.9807, respectively. Furthermore, the p-values for both models were significantly less than 0.01, demonstrating an excellent fit and indicating substantial predictive capability. To validate the prediction accuracy of the models, FE simulations were performed on a specimen with a plate thickness of 33 mm and a slot depth of 65 mm. The average residual stresses on the upper and lower surfaces of the weld pass obtained from simulation were 727.65 MPa and 723.70 MPa, respectively, while the corresponding model predictions were 792.91 MPa and 769.32 MPa. The relative errors between the simulation results and the model predictions were both within 9%, thereby validating the accuracy of formulas for predicting welding residual stress.
In subsequent research, this model will be employed to predict residual stresses in actual Ti80 alloy workpieces, with experimental measurements conducted to further verify its accuracy. Based on this predictive model, the residual stress magnitude in Ti80 alloy workpieces can be assessed prior to welding, thereby facilitating the formulation of appropriate cracking mitigation measures.

4. Conclusions

Through systematic FE simulations, this study quantitatively revealed the inherent relationship between geometric parameters of Lehigh specimen and restraint intensity and established a quantitative model correlating welding residual stress with restraint intensity in Ti80 alloy, leading to the following conclusions.
(1)
Restraint intensity in Lehigh specimens exhibits a strong positive linear correlation with plate thickness and a strong negative linear correlation with slot depth. A robust binary linear regression model effectively predicts restraint intensity across varied geometries with a mean prediction error of about 5.9%.
(2)
Residual stresses of root pass display significant spatial heterogeneity; the upper surface stresses concentrate in the weld center, while the lower surface stresses peak near the weld termination zone. This asymmetry arises from differential constraint conditions across weld regions.
(3)
Welding residual stress increases with higher restraint intensity. Residual stress on the upper weld surface follows an exponential growth trend, while the lower surface exhibits a linear increase. Predictions align with FE results with errors below 9%.

Author Contributions

Conceptualization, L.Z., G.S. and D.C.; Methodology, L.Z., Q.W. and X.G.; Software, L.Z., C.D. and W.B.; Validation, G.S., D.C. and X.G.; Formal Analysis, G.S. and C.D.; Data Curation, C.D. and W.B.; Writing—Original Draft, L.Z. and D.C.; Writing–Review and Editing, L.Z., Q.W. and X.G.; Visualization, Q.W., X.G. and W.B.; Supervision, L.Z. and Q.W.; Project Administration, D.C.; Funding Acquisition, L.Z. All authors have read and agreed to the published version of the manuscript.

Funding

This research was funded by the Henan Provincial Natural Science Foundation Project (242300420042), the Key Scientific Research Projects of Colleges and Universities in Henan Province (25CY023, 25B430030), the Scientific and Technological Research Projects of Henan Province (242102231058), the Science and Technology Innovation Youth Special Project of Zhumadian City (QNZX202315, QNZX202323), the Training Program for Young Backbone Teachers in Higher Education Institutions of Henan Province, and the Training Program for Young Backbone Teachers in Huanghuai University.

Data Availability Statement

The original contributions presented in this study are included in the article. Further inquiries can be directed to the corresponding author.

Acknowledgments

The authors would like to thank Haowang Wang and Lu Chen from Huanghuai University for their help with the sample preparations.

Conflicts of Interest

Author Gang Song was employed by the company Henan Dingli Pole & Tower Co., Ltd. The remaining authors declare that the research was conducted in the absence of any commercial or financial relationships that could be construed as a potential conflict of interest.

References

  1. Liu, H.; Bai, X.; Li, Z. Electrochemical evaluation of stress corrosion cracking susceptibility of Ti-6Al-3Nb-2Zr-1Mo alloy welded joint in simulated deep-sea environment. Materials 2022, 15, 3201. [Google Scholar] [CrossRef]
  2. Yang, Z.; Jia, Y.; Zhang, Y. Solidification microstructure and mechanical properties of laser additive manufactured near-α Ti-6Al-3Nb-2Zr-1Mo titanium alloy. J. Mater. Eng. Perform. 2025, 34, 2208–2218. [Google Scholar] [CrossRef]
  3. Zhu, J.; Xie, J.; Wang, J. Low-cycle and dwell fatigue properties for a near alpha titanium alloy Ti-6Al-3Nb-2Zr-1Mo. J. Mater. Res. Technol. 2024, 29, 2204–2215. [Google Scholar] [CrossRef]
  4. Guan, X.; Hirohata, M.; Chang, K. A streamlined FE method for deformation and residual stress prediction in butt welding using continuous heat input. Weld. World 2025, 69, 2471–2481. [Google Scholar] [CrossRef]
  5. Li, Y.; Li, Y.; Zhang, C. Effect of structural restraint caused by the stiffener on welding residual stress and deformation in thick-plate T-joints. J. Mater. Res. Technol. 2022, 21, 3397–3411. [Google Scholar] [CrossRef]
  6. Wu, Z.R.; Zhu, K.K.; Pan, L. Investigation of the correlation between mechanical chip morphology and surface residual stress for Ti6Al4V alloy. J. Mech. Sci. Technol. 2020, 34, 3997–4004. [Google Scholar] [CrossRef]
  7. Toribio, J.; Kharin, V.; Ayaso, F.J. Failure analysis of a lifting platform for tree pruning. Eng. Fail. Anal. 2010, 17, 739–747. [Google Scholar] [CrossRef]
  8. Kannengiesser, T.; Boellinghaus, T. Cold cracking tests—An overview of present technologies and applications. Weld. World 2013, 57, 3–37. [Google Scholar] [CrossRef]
  9. Li, S.; Li, J.; Sun, G. Modeling of welding residual stress in a dissimilar metal butt-welded joint between P92 ferritic steel and SUS304 austenitic stainless steel. J. Mater. Res. Technol. 2023, 23, 4938–4954. [Google Scholar] [CrossRef]
  10. Jiang, X.; Zhou, W.; Zhang, X. Guided wave-based crack detection in U-shaped flexural plate butt welds. Eng. Struct. 2024, 303, 117558. [Google Scholar] [CrossRef]
  11. Sun, Y.L.; Vasileiou, A.N.; Pickering, E.J. Impact of weld restraint on the development of distortion and stress during the electron beam welding of a low-alloy steel subject to solid state phase transformation. Int. J. Mech. Sci. 2021, 196, 106244. [Google Scholar] [CrossRef]
  12. Di, X.; Liu, C.; Guo, X.; Xue, Z. Numerical simulation and experimental verification of the restraint intensity of pipeline girth welding joint. China Weld. 2016, 25, 28–35. [Google Scholar]
  13. Schroepfer, D.; Witte, J.; Kromm, A. Stresses in repair welding of high-strength steels—Part 1: Restraint and cold cracking risk. Weld. World 2024, 68, 685–697. [Google Scholar] [CrossRef]
  14. Liu, B.; Chen, M. Calculation of the restraint intensity of VRC test assemblies. J. Southwest JiaoTong Univ. 1993, 2, 31–36. [Google Scholar]
  15. Hou, W.; Zhang, W.; Chen, B. Relationship between restraint intensity and restraint stress in elasto-plastic range. Trans. China Weld. Inst. 1992, 13, 103–108. [Google Scholar]
  16. Chen, B.; Qin, B.; Wang, L. Study on distribution of restraint intensity and restraint stress in slit weld specimen. Trans. China Weld. Inst. 1992, 13, 162–168. [Google Scholar]
  17. Sun, J.; Hensel, J.; Nitschke, P.T. Influence of Restraint Conditions on Welding Residual Stresses in H-Type Cracking Test Specimens. Materials 2019, 12, 2700. [Google Scholar] [CrossRef] [PubMed]
  18. Kurji, R.; Coniglio, N. Towards the establishment of weldability test standards for hydrogen-assisted cold cracking. Int. J. Adv. Manuf. Technol. 2015, 77, 1581–1597. [Google Scholar] [CrossRef]
  19. Alipooramirabad, H.; Paradowska, A.M.; Ghomashchi, R. Prediction of welding stresses in WIC test and its application in pipelines. Mater. Sci. Technol. 2016, 32, 1462–1470. [Google Scholar] [CrossRef]
  20. Obeid, O.; Leslie, A.J.; Olabi, A.G. Influence of girth welding material on thermal and residual stress fields in welded lined pipes. Int. J. Press. Vessel. Pip. 2022, 200, 104777. [Google Scholar] [CrossRef]
  21. Tao, S.; Zong, P.; Dong, J. The calculation method for welding restraint intensity of fillet weld in ring-stiffened cylinder. Trans. China Weld. Inst. 2013, 34, 97–100. [Google Scholar]
  22. Zhang, L.; Wang, Q.; Chen, P. Finite element analysis of restraint intensities and welding residual stresses in the Ti80 T-joints. Metals 2023, 13, 125. [Google Scholar] [CrossRef]
  23. Jing, H.; Xu, J.; Xu, L. Finite element simulation of the restraint intensity of rigid butt-jointed cracking specimen and VRC specimen. Trans. China Weld. Inst. 2018, 39, 1–5. [Google Scholar]
  24. Zhang, L.; Zhang, X.; Hu, Y. Finite element analysis on restraint intensity of Ti80 alloy rigid restraint specimen. Chin. J. Rare Met. 2021, 45, 1223–1229. [Google Scholar]
  25. Schroepfer, D.; Kromm, A.; Kannengiesser, T. Engineering approach to assess residual stresses in welded components. Weld. World 2017, 61, 91–106. [Google Scholar] [CrossRef]
  26. Park, J.; An, G.; Ma, N. Effect of transverse restraint on welding residual stress in V-groove butt welding. Metals 2022, 12, 654. [Google Scholar] [CrossRef]
  27. Wang, Q.; Zhao, Y.; Zhao, T. Influence of restraint conditions on residual stress and distortion of 2219-T8 aluminum alloy TIG welded joints based on contour method. J. Manuf. Process. 2021, 68, 796–806. [Google Scholar] [CrossRef]
  28. Čolić, K.; Kostić, S.M.; Sedmak, S. Structural Integrity and Life Assessment of Ti-6Al-4V Orthopaedic Implants. Metals 2025, 15, 333. [Google Scholar] [CrossRef]
  29. Jia, Y.; Saadlaoui, Y.; Hamdi, H. An experimental and numerical case study of thermal and mechanical consequences induced by laser welding process. Case Stud. Therm. Eng. 2022, 35, 102078. [Google Scholar] [CrossRef]
  30. Kenneth, C.M. Recommended Values of Thermophysical Properties for Selected Commercial Alloys; Woodhead Publishing Limited: Abington, MA, USA, 2002. [Google Scholar]
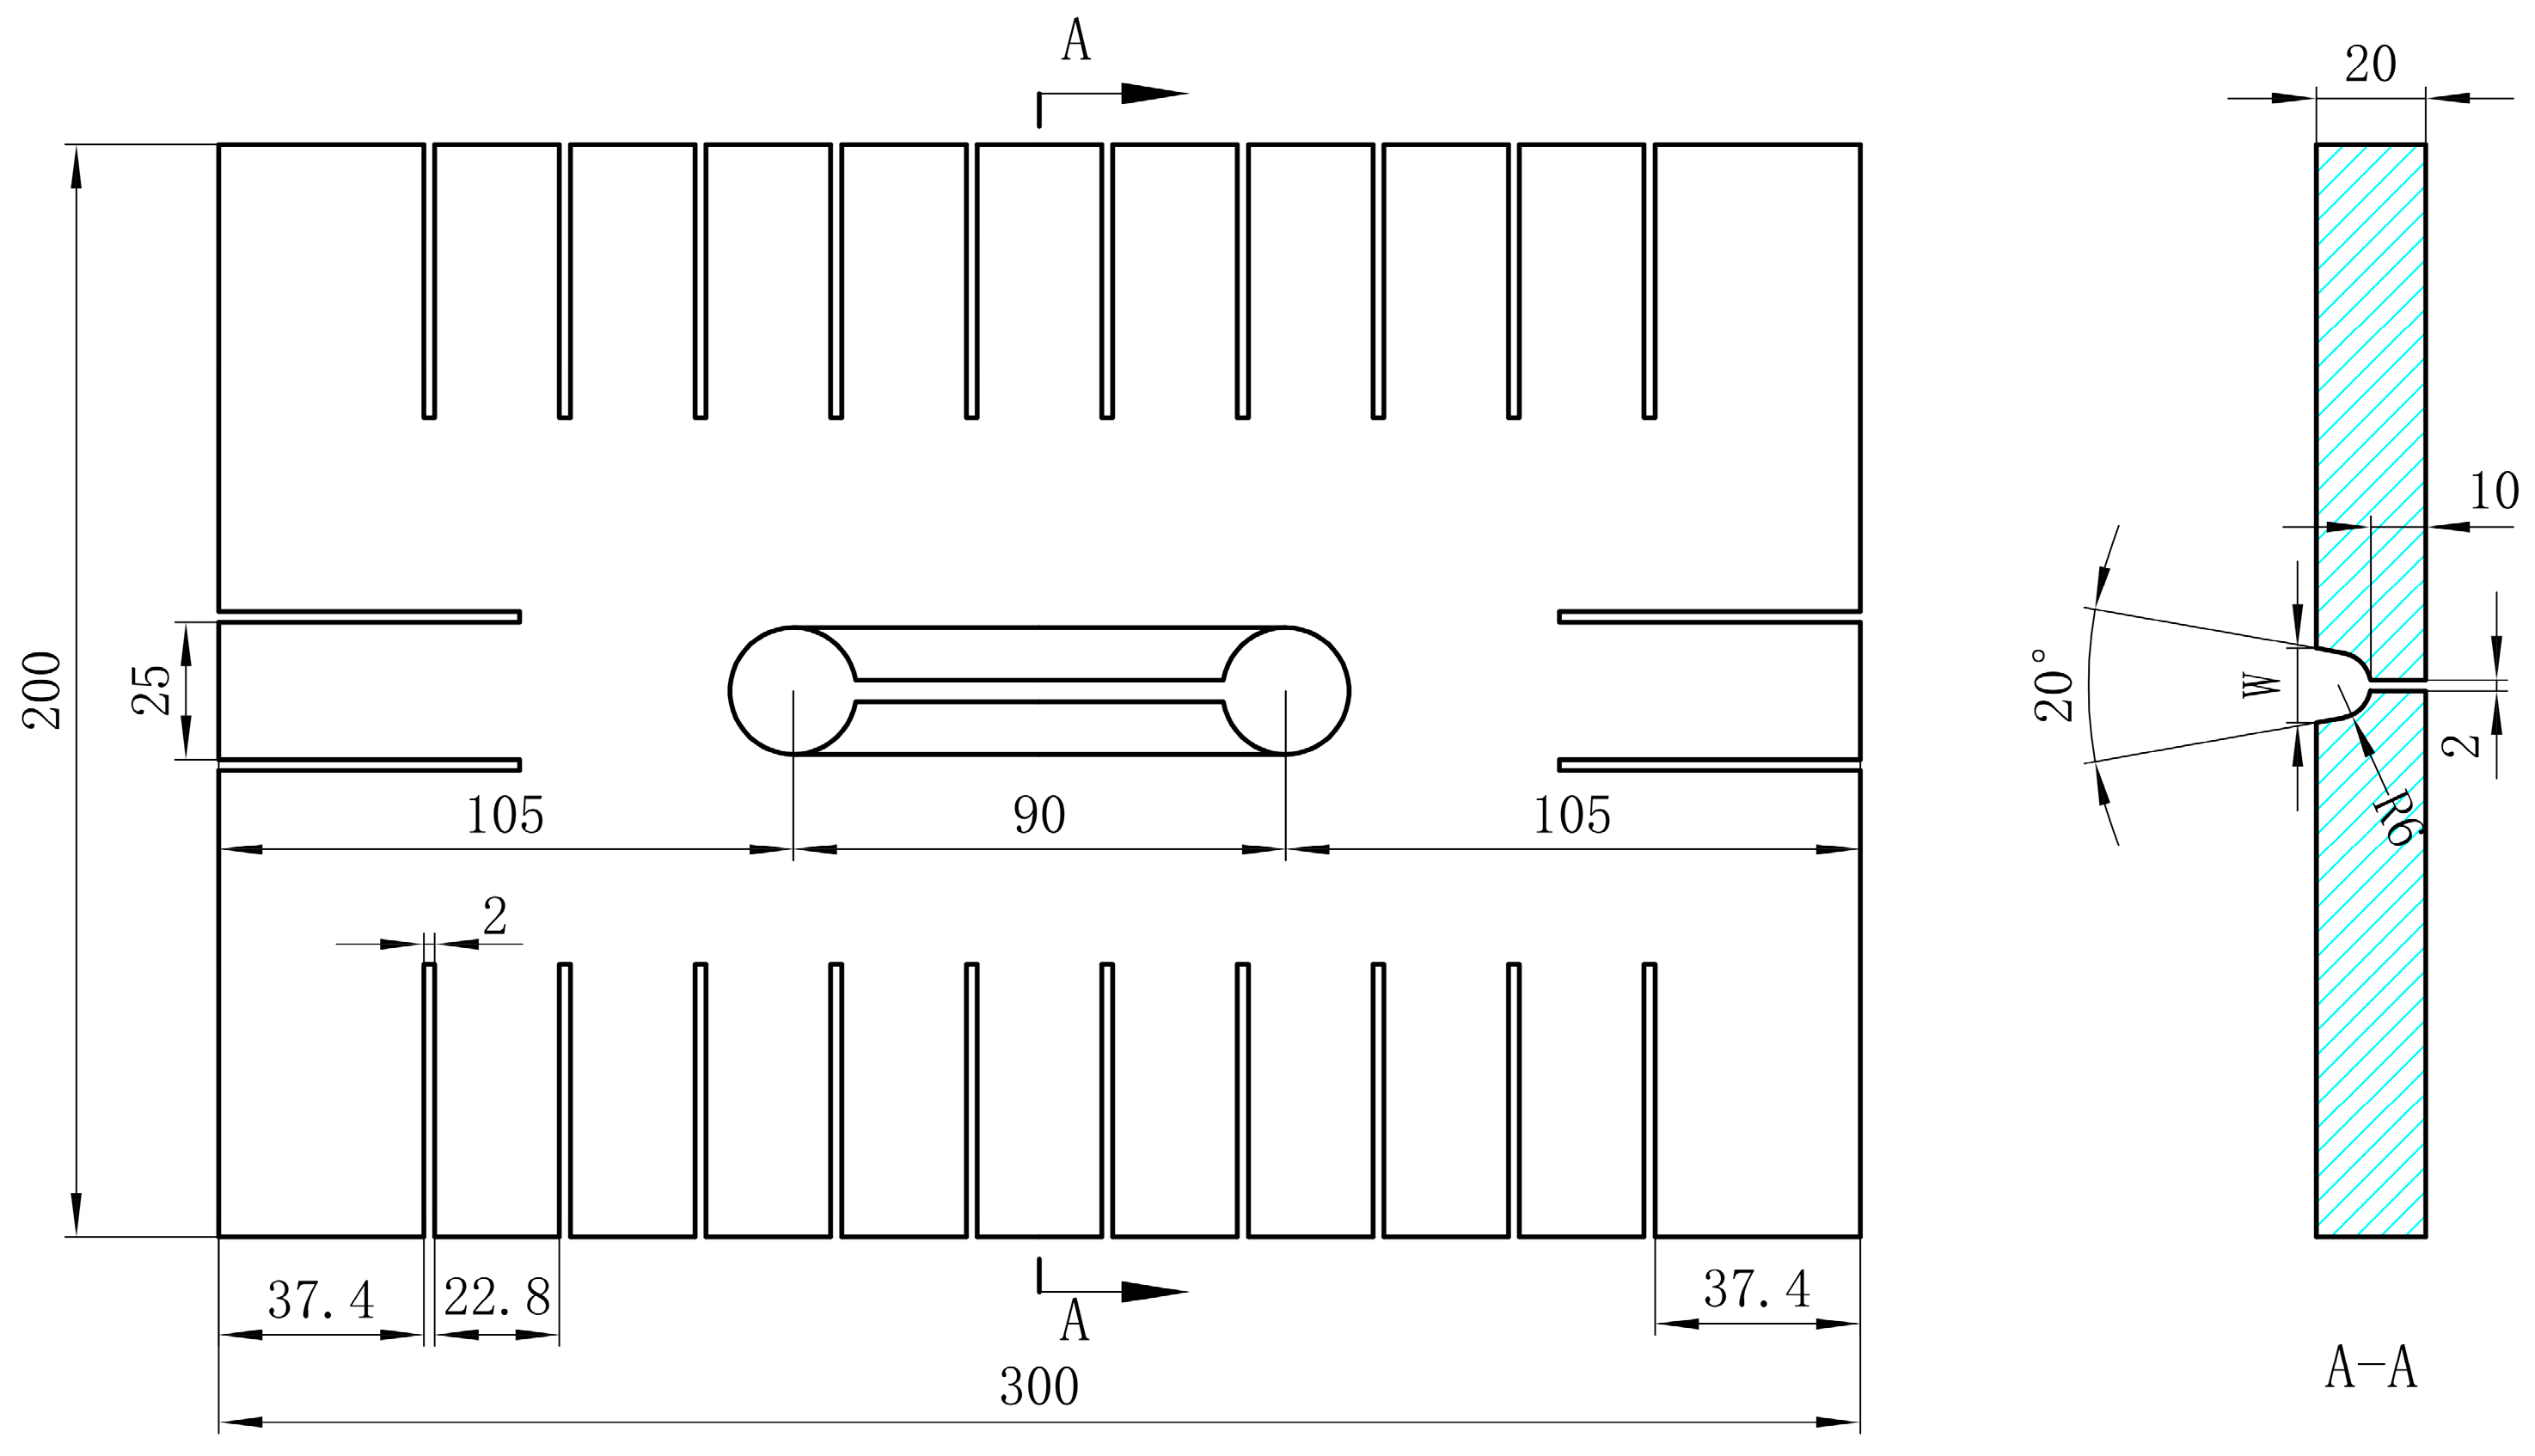
Figure 1. Dimensions of Lehigh specimen.
Metals 15 01019 g001
Figure 2. The strain-hardening curve of Ti80 alloy at different temperatures.
Metals 15 01019 g002
Figure 3. Experimental set-up and schematic of data acquisition system.
Metals 15 01019 g003
Figure 4. Results of experimental validations: (a) mesh-independent verification results; (b) FE deformation results; (c) comparison of FE and measurement results.
Metals 15 01019 g004
Figure 5. Restraint intensity of specimens with different thickness: (a) distribution of restraint intensities; (b) linear fitting result.
Metals 15 01019 g005
Figure 6. Restraint intensity of specimens with different slot depths: (a) distribution of restraint intensities; (b) linear fitting result.
Metals 15 01019 g006
Figure 7. FE mesh for welding simulation: (a) specimen overall mesh; (b) root pass local mesh.
Metals 15 01019 g007
Figure 8. Comparison of simulation result and actual joint macrograph (the scale unit is MPa).
Metals 15 01019 g008
Figure 9. Comparison of simulation result and actual joint macrograph (the scale unit is °C).
Metals 15 01019 g009
Figure 10. Simulation results of the welding residual stress (the scale unit is MPa).
Metals 15 01019 g010
Figure 11. Comparison of FE and measurement results of residual stress along the weld direction.
Metals 15 01019 g011
Figure 12. Residual stresses on the weld bead.
Metals 15 01019 g012
Figure 13. Relationship between welding residual stress and restraint intensity: (a) the upper surface; (b) the lower surface.
Metals 15 01019 g013
Table 1. Chemical composition of Ti80 alloy (wt.%).
AlNbZrMoFeCNOTi
6.242.861.940.950.0230.0090.00360.085Bal.
Table 2. Thermal and mechanical parameters of Ti80 alloy at different temperatures.
Temperature, °CDensity, g/cm3Thermal Conductivity, W/(m·K)Specific Heat Capacity, J/(kg·K)Coefficient of Thermal Expansion, 10−6/KYoung’s Modulus, GPaYield Strength, MPa
204.516.955479.1116814
1004.487.475629.1112800
2004.468.715839.2107700
3004.4410.046079.3102625
4004.4211.326289.596550
5004.4012.536509.790470
6004.3814.106741085385
7004.3615.5469310.581310
8004.3417.717131175225
9004.3220.157351172184
10004.3019.236421170138
11004.2820.88658116865
12004.2622.73679116334
13004.2523.62695115512
204.516.955479.1116814
Table 3. Comparison between regression model and FE simulation results.
Specimen No.Plate Thickness, mmSlot Depth, mmPredicted Value, N·(mm·mm)−1FE Simulation Value, N·(mm·mm)−1Error/%
145329027.839818.678.05
2721814,234.6216,131.5611.76
333654011.023868.723.68
4804212,936.3812,715.931.73
526771816.291774.152.37
6591113,114.5014,500.029.56
720533395.553686.317.89
8642912,000.3113,289.029.70
937565481.435585.091.86
1051478356.948604.382.88
Disclaimer/Publisher’s Note: The statements, opinions and data contained in all publications are solely those of the individual author(s) and contributor(s) and not of MDPI and/or the editor(s). MDPI and/or the editor(s) disclaim responsibility for any injury to people or property resulting from any ideas, methods, instructions or products referred to in the content.