Article

Self-Organization in Metal Plasticity: An ILG Update †

by
Avraam Konstantinidis
1,
Konstantinos Spiliotis
2,
Amit Chattopadhyay
3 and
Elias C. Aifantis
1,4,*
1
School of Civil Engineering, Faculty of Engineering, Aristotle University of Thessaloniki, 54124 Thessaloniki, Greece
2
Department of Civil Engineering, School of Engineering, Democritus University of Thrace, 67100 Xanthi, Greece
3
School of Business and Social Science, National College of Ireland, D01 K6W2 Dublin, Ireland
4
Mechanical and Aerospace Engineering, College of Engineering, Michigan Technological University, Houghton, MI 49931, USA
*
Author to whom correspondence should be addressed.
Dedicated to the memory of Ladislas Kubin: A great metal physicist and an even greater human being—A dear friend missed by both the materials science and the material mechanics communities.
Metals 2025, 15(9), 1006; https://doi.org/10.3390/met15091006
Submission received: 15 June 2025 / Revised: 5 August 2025 / Accepted: 3 September 2025 / Published: 10 September 2025
(This article belongs to the Special Issue Self-Organization in Plasticity of Metals and Alloys)

Abstract

In a 1987 article of the last author dedicated to the memory of a pioneer of classical plasticity Aris Philips of Yale, the last author outlined three examples of self-organization during plastic deformation in metals: persistent slip bands (PSBs), shear bands (SBs) and Portevin Le Chatelier (PLC) bands. All three have been observed and analyzed experimentally for a long time, but there was no theory to capture their spatial characteristics and evolution in the process of deformation. By introducing the Laplacian of dislocation density and strain in the standard constitutive equations used for these phenomena, corresponding mathematical models and nonlinear partial differential equations (PDEs) for the governing variable were generated, the solution of which provided for the first time estimates for the wavelengths of the ladder structure of PSBs in Cu single crystals, the thickness of stationary SBs in metals and the spacing of traveling PLC bands in Al-Mg alloys. The present article builds upon the 1987 results of the aforementioned three examples of self-organization in plasticity within a unifying internal length gradient (ILG) framework and expands them in 2 major ways by: (i) introducing the effect of stochasticity and (ii) capturing statistical characteristics when PDEs are absent for the description of experimental observations. The discussion focuses on metallic systems, but the modeling approaches can be used for interpreting experimental observations in a variety of materials.

1. Introduction

The initial efforts of the last author in [1]—with subsequent contributions in [2,3,4] and an update in [5]—for introducing the approach of self-organization in “chemistry” and “physics” to “metal plasticity” has resulted to a variety of groups—ranging from materials science and continuum mechanics to statistical physics and computational mathematics—to publish an abundance of related results on this topic. Despite this multidisciplinary activity, the topic is still open due to its multiscale nature and complexity as revealed by modern experimental techniques, as well as to an efficient connection with emerging problems in current engineering and technology.
An updated account of self-organization phenomena in metals is briefly presented herein by: (i) First, summarizing the basics of the internal length gradient (ILG) mechanics framework that we use to model the most representative deterministic aspects of localized or self-organized plastic deformation, as noted historically: stationary shear bands (SBs) or multiple shear bands (MSBs) and propagating Lüders bands (LBs) or Portevin Le Chatelier (PLC) bands, as well as persistent slip bands (PSBs). (ii) Second, extending the deterministic ILG mechanics framework to include stochasticity and using such combined gradient–stochastic models for capturing jerkiness and random serrations in stress–strain curves, as well as fractality or disorder in associated microscope images. (iii) Third, utilizing Tsallis q-statistics for describing the main characteristics of the irregular serrated stress–strain graphs and associated spatio-temporal patterns when deterministic or stochastic partial differential equations (PDEs) and multiscale computational codes are not available for this purpose.

2. The Deterministic ILG Mechanics Framework

The starting point of the gradient theory for metal plasticity, as utilized within the internal length gradient (ILG) mechanics framework, is to incorporate higher-order gradients in the form of Laplacians 2 of the relevant constitutive variables into the respective evolution or constitutive equations. In the simplest case, the resulting gradient modification of dislocation evolution and flow stress constitutive equations read, respectively [1,2,3,4,5]:
ρ t = D 2 ρ + f ρ ,
τ = κ γ c 2 γ ,
where ρ denotes the dislocation density and τ , γ denote effective von-Mises scalar stress and strain. The quantity f ρ is the standard source term of dislocation dynamics and κ γ is the standard homogeneous part of the flow stress. The gradient coefficients D in Equation (1) and c in Equation (2) denote gradient phenomenological coefficients, the value of which is to be determined from appropriate experiments and/or appropriate microscopic arguments depending on the prevailing deformation mechanisms and the underlying microstructure. The strain rate and temperature dependence have been suppressed in Equations (1) and (2) for convenience. Such dependence is particularly important for adiabatic shear banding and strain-rate-dependent viscoplastic materials. The gradient-dependent expressions of Equations (1) and (2) have been used successfully to predict dislocation patterning phenomena, as well as shear band widths and spacings (see, for example, [5] and references quoted therein).
The value of the gradient coefficients can be inferred from such dislocation pattern wavelengths and shear band widths measurements. Direct estimates for the gradient coefficients can also be obtained from properly designed experiments. For example, pure bending experiments of symmetrically deforming beams with an inhomogeneous engineered microstructure—e.g., spatially varying grain size distribution along the beam axis—can provide estimates of the gradient coefficient c in Equation (2). Preliminary results have already been obtained, and a brief outline of this possibility has already been discussed ([5] and references quoted therein). The aforementioned experimental estimates for the gradient coefficients seem to be in good agreement with theoretical estimates obtained by using self-consistent macroscopic continuum mechanics (for c ) and microscopic dislocation physics (for D ) arguments as discussed in the above-listed references. In particular, the self-consistent estimate of the gradient coefficient c gives the expression
c   ~   β + h d 2 / 10 ,
where β relates explicitly to the elastic constants of the material in a fashion depending on the self-consistent model used, while h is the plastic hardening modulus, and the parameter d stands for grain size.
The shear band thickness w was found to be proportional to the gradient coefficient c , i.e., w = A c , with A 0.4 and β = α G ( 7 5 ν ) 15 ( 1 ν ) , where α is a numerical constant, G is the shear modulus, and ν is Poisson’s ratio. This resulted in a correlation between the grain size and the shear band width, which was in good agreement with the experiment. A different procedure for deriving an analogous result is to utilize a statistical interpretation of the gradient coefficient c [6], i.e., c = h l c o r 2 , where l c o r is a corresponding correlation length. It finally turns out that w = A h l c o r , with the proportionality coefficient A h estimated as 0.85 from the 300 nm grain size specimen, for which the correlation length is measured as l c o r = 386 μ m . An optical micrograph of the shear-banded 300 nm grain size nanostructured Fe–10 at.% Cu specimen is depicted in Figure 1, where the corresponding macroscopic stress–strain curve (under compression) is given [7].

3. Effect of Stochasticity: Combined Gradient-Stochastic Models

A question associated with the aforementioned experimental observations in compressed metallic specimens is whether the evolution of shear bands and the respective stress–strain curves, like the ones shown in Figure 1, can be simulated through a gradient plasticity model, similar to the one of Equation (2). To this end, the following steps are taken. First, by standard bifurcation or stability analysis, the weakest slip plane is identified, providing the orientation of the shear band zones (see [7] and references quoted therein). Then the shear bands are assumed to nucleate and multiply in a combined gradient–stochastic manner, when the local shear stress attains a critical value, and propagate along this weakest slip plane direction and grow perpendicular to it. Starting from a 1D counterpart of Equation (2) along the weakest slip plane direction, and supplementing it with a stochastic term (see below), we end up with the following equations (see also [7]):
τ 0 = κ γ + α f γ , x c 2 γ x 2 ;   α f γ , x = α h γ g x , g x g x = ξ δ x x ,
where α is a small random number, h γ is a correlation function depending on strain, g x is a correlation function depending on space, and ξ is the respective correlation length. In Equation (4), τ 0 denotes the applied stress and c the gradient coefficient. Next, an illustrative cellular automaton is adopted for numerically solving Equation (4) with the homogeneous stress having the form κ γ = γ e x p ( γ 2 / 2 ) + k γ , with k denoting the standard linear hardening coefficient, and h γ a corresponding nonlinear part for the fluctuating stress, assuming h γ = γ   e x p ( γ 2 / 2 ) and next-neighbor correlations in space ( ξ = 1 ). The 2D space discretization assumes one side of the cellular automaton mesh parallel and the other perpendicular to the direction of the shear band growth. Figure 2 shows snapshots of the shear band pattern during the simulation, as well as the respective nominal stress–strain graph.

4. Serrated Stress–Strain Curves and Metallic Micropillar Compression

The occurrence of stress serrations as well as strain bursts—both present in the macroscopic response of material with random microstructures—has been reviewed in [8] by summarizing, in part, the efforts in [9,10,11]. The following constitutive relations are used for modeling micropillar compression experiments [10]:
σ i = E i ε i ε i p ,       β ε i p β l i 2 d 2 ε i p d x 2 = σ 0 Y i ,
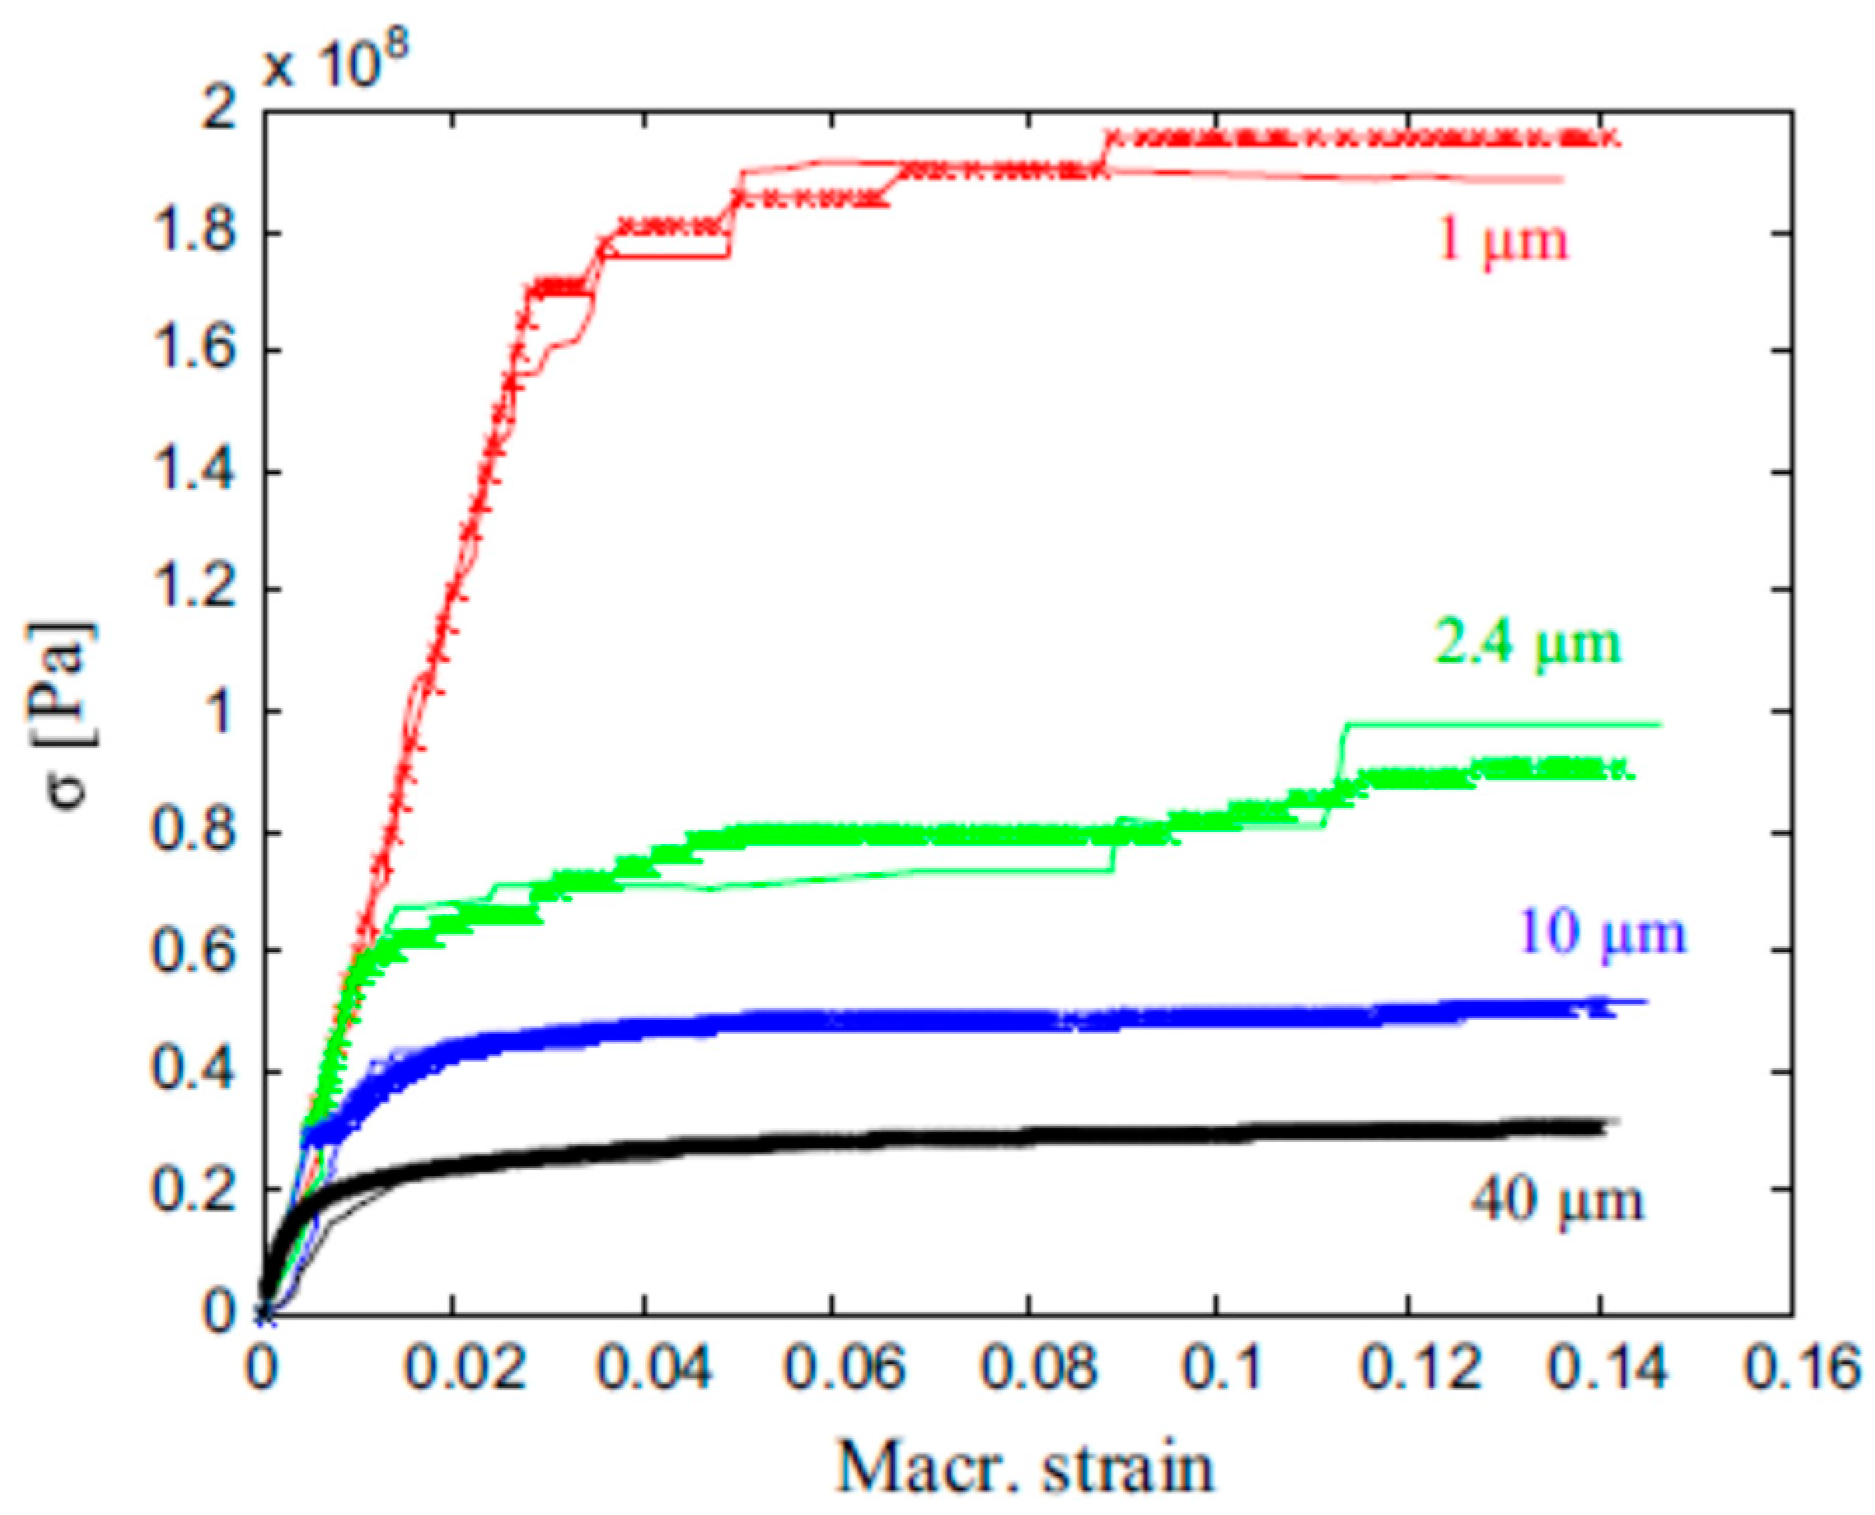
can be enhanced with stochasticity by assuming the local yield stress Y i to be of the form Y i = Y 0 + Y r a n d , where Y 0 is a mean deterministic value and Y r a n d being a random component assumed to follow a Weibull distribution. Cellular automata simulations based on Equation (5) can be used for modeling micropillars compression experiments of various diameters [9,12], as depicted in Figure 3.
Apart from the Weibull distribution, the local yield stress can be fitted with other known distributions (exponential, Gaussian, etc.), or even q-distributions [13] of the form S q P = q 1 1 1 + x P x q , with the parameter q 1 being the so-called entropic index. For the case of Mo-micropillar compression, the following expression for the local yield stress probability density function was derived [11]
p σ y = A 1 + q 1 B σ y 1 / 1 q ,
with A, B being the fitting parameters, from the respective probability density function of strain burst measurements [14]. Using the probability density function for the local yield stress given in Equation (6), cellular automata simulations based on Equation (5) were able to model the compressive behavior of Mo-micropillar compression [14], as shown in Figure 4 [11].
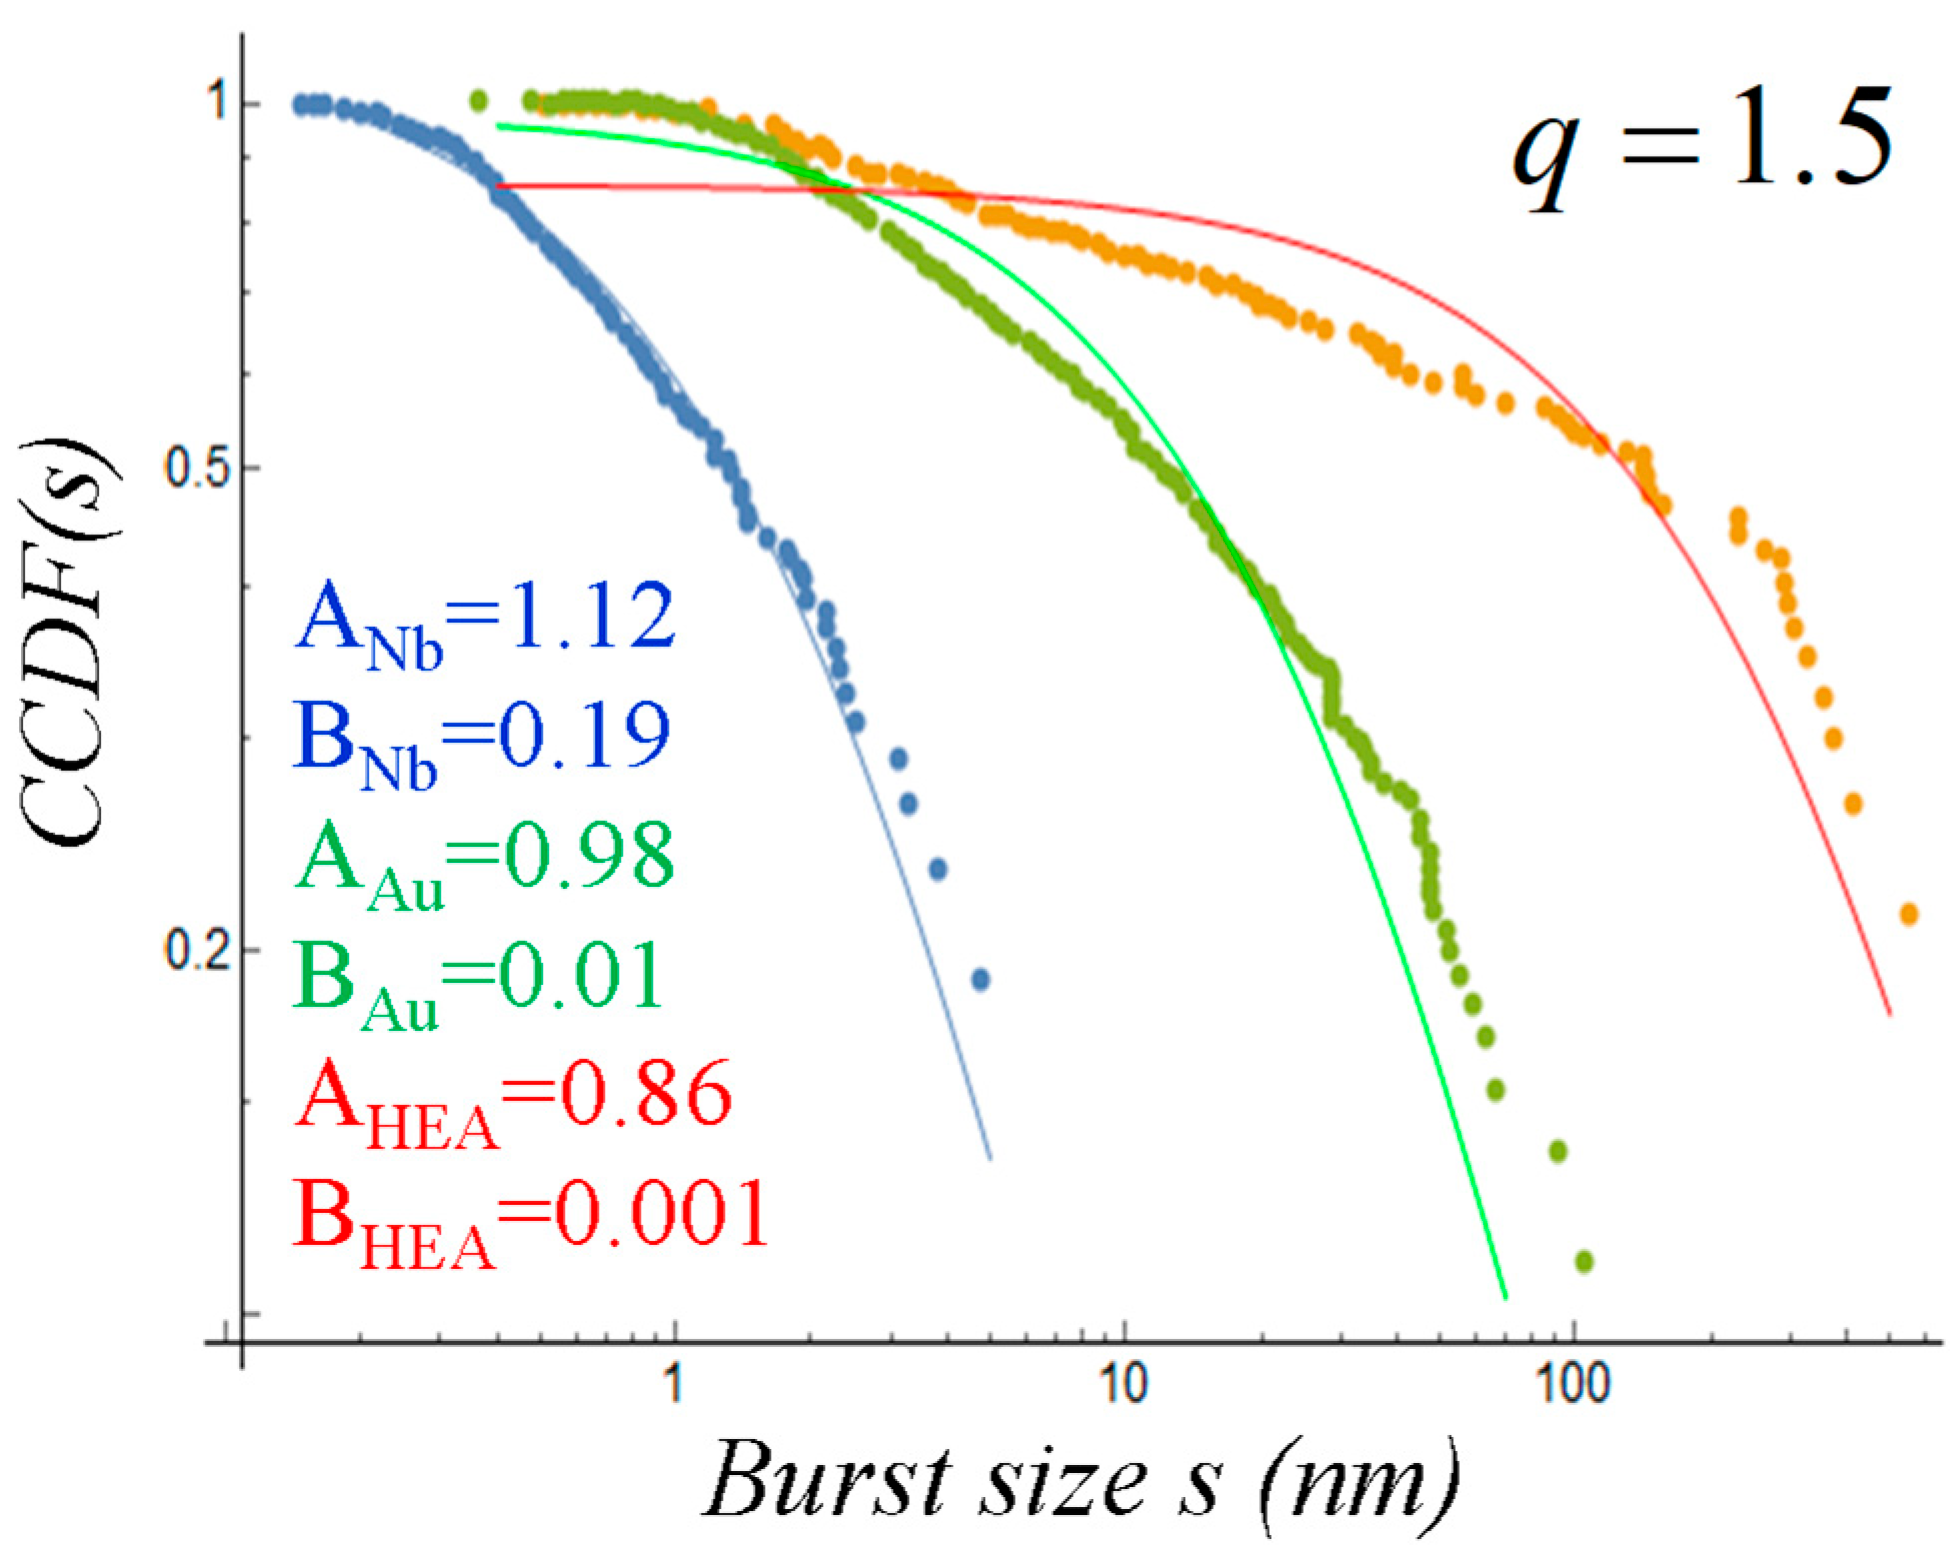
It is noted that a q-distribution equation similar to Equation (6) can, in general, be used to describe the probability density function of strain bursts in other cases of micropillar compression. Figure 5 shows the application of an equation similar to Equation (6) for modeling the complementary cumulative distribution functions (CCDF) in Nb, Au, and Al0:3CoCrFeNi micropillar compression experiments [15].

5. Propagating Lüders Bands (LBs) and Portevin-Le Chatelier (PLC) Bands in Metals and Alloys

5.1. Propagating Lüders Bands in Steel

While the occurrence of Lüders bands in tensile specimens has been known for a long time, there has not been a corresponding mathematical model available to predict their structure and their propagation speed. A simple model in this direction is possible based on an evolution equation for the plastic strain ε of the form [2]
ε ˙ + d i v j = g σ , ε ,
where j denotes the net flux of plastic strain within an elementary volume and g is the production of plastic strain within it. If a diffusive-like form is assumed for the flux j , then Equation (7) yields the following expression in one dimension:
ε ˙ = D ε x x + g σ , ε ,
where D is a diffusion-like coefficient and g is specified by a suitable viscoplastic model. The form chosen here is
g σ , ε = ε ˙ 0 s i n h σ σ L H ε s ,      H ε = H 0 ε 1 ε ε L n ,
where ε L ,   σ L ,   ε ˙ 0 ,   H 0 ,   s and n are constants ( ε L and σ L denote the Lüders strain and stress, respectively).
On searching for traveling wave solutions of the form ε z = ε x V t we obtain the following governing equation
D ε x x + V ε x + g ε = 0 ,     g ε = ε ˙ 0 s i n h H 0 ε s 1 ε ε L n ,
where it should be noted that g has two zeros at ε = 0 and ε = ε L . Linear stability analysis gives the usual expression for the propagating front, i.e., V = 2 H 0 ε 0 D / s , with the negative sign indicating that the front travels from right to left. The corresponding strain profiles are similar to those depicted in Figure 6 [16].

5.2. Traveling Portevin-Le Chatelier Bands in Al-Mg Alloys

As is very well known, the occurrence of these propagating strain heterogeneities is associated with the negative slope of the stress σ versus strain rate ε ˙ curve. This is schematically depicted in Figure 7, which also shows a periodic arrangement of PLC bands traveling through the specimen.
An interpretation of this periodic strain rate propagation phenomenon can be given in terms of the following gradient-dependent expression for the uniaxial flow stress [2]
σ = h ε + f ε ˙ + c ε x x ,
where σ and ε are the axial stress and strain, h is the strain hardening modulus, and the gradient coefficient c is taken as constant. The function f is the viscous part of the flow stress and is assumed to be a single loop or non-convex (negative slope regime, i.e., s = σ / ε ˙ < 0 for ε ˙ 1 < ε ˙ s < ε ˙ 2 ). When the applied stress rate σ ˙ 0 is such that the corresponding homogeneous steady state solution ε ˙ s   = σ ˙ 0 / h lies in the negative slope region ε ˙ 1 < ε ˙ s < ε ˙ 2 , the homogeneous solution becomes unstable, and a periodic succession of shear bands crosses the specimen with constant velocity.
With this simple expression of Equation (11) and on assuming a traveling wave solution of the form ε = Z x V t , μ = V / c h , Equation (11) can be written as
Z η η + μ f Z Z η + Z Z s = 0 ,
where η = h / c   x V t , μ = V / c h . Equation (12) is a well-known Lienard’s equation, a classical example of relaxation oscillations. Accordingly, as outlined by Aifantis [1,17], a stable periodic solution exists for ε ˙ 1 < ε ˙ s < ε ˙ 2 . Moreover, the natural speed for the traveling wave may approximately be obtained through the relation V = 2 c h / f Z s .
In concluding this section on traveling deformation wave fronts, we consider cases where the quasistatic equilibrium equation is replaced by its dynamic counterpart.
τ x = v ˙ ,
where v ˙ denotes the particle velocity of a material with unit density. The corresponding constitutive equation for the uniaxial flow stress is assumed to be of the simple gradient-dependent viscoplastic form.
σ = μ v x c v x x ,
with μ and c denoting, respectively, the viscosity and gradient coefficients. Then, upon substitution of Equation (14) in Equation (13), the following nonlinear differential equation is obtained for the material velocity v
v t + v v x + c v x x x = μ v x x ,
which is the Korteweg–de Vries–Burgers equation that reduces to the Burgers equation if the term with the third spatial derivative is neglected. It is well known [18] that Equation (15) has nearly periodic solutions if the dissipation is small, i.e., μ λ 1 ( λ is the wavelength).

6. Stationary PSBs in Cu Crystals and Extension of the Walgraef–Aifantis (W-A) Model: Finite Domains/Bifurcation Diagrams, the EFM Method, and DDD Simulations/Diffusion Maps

6.1. Finite Domains and Bifurcation Diagrams

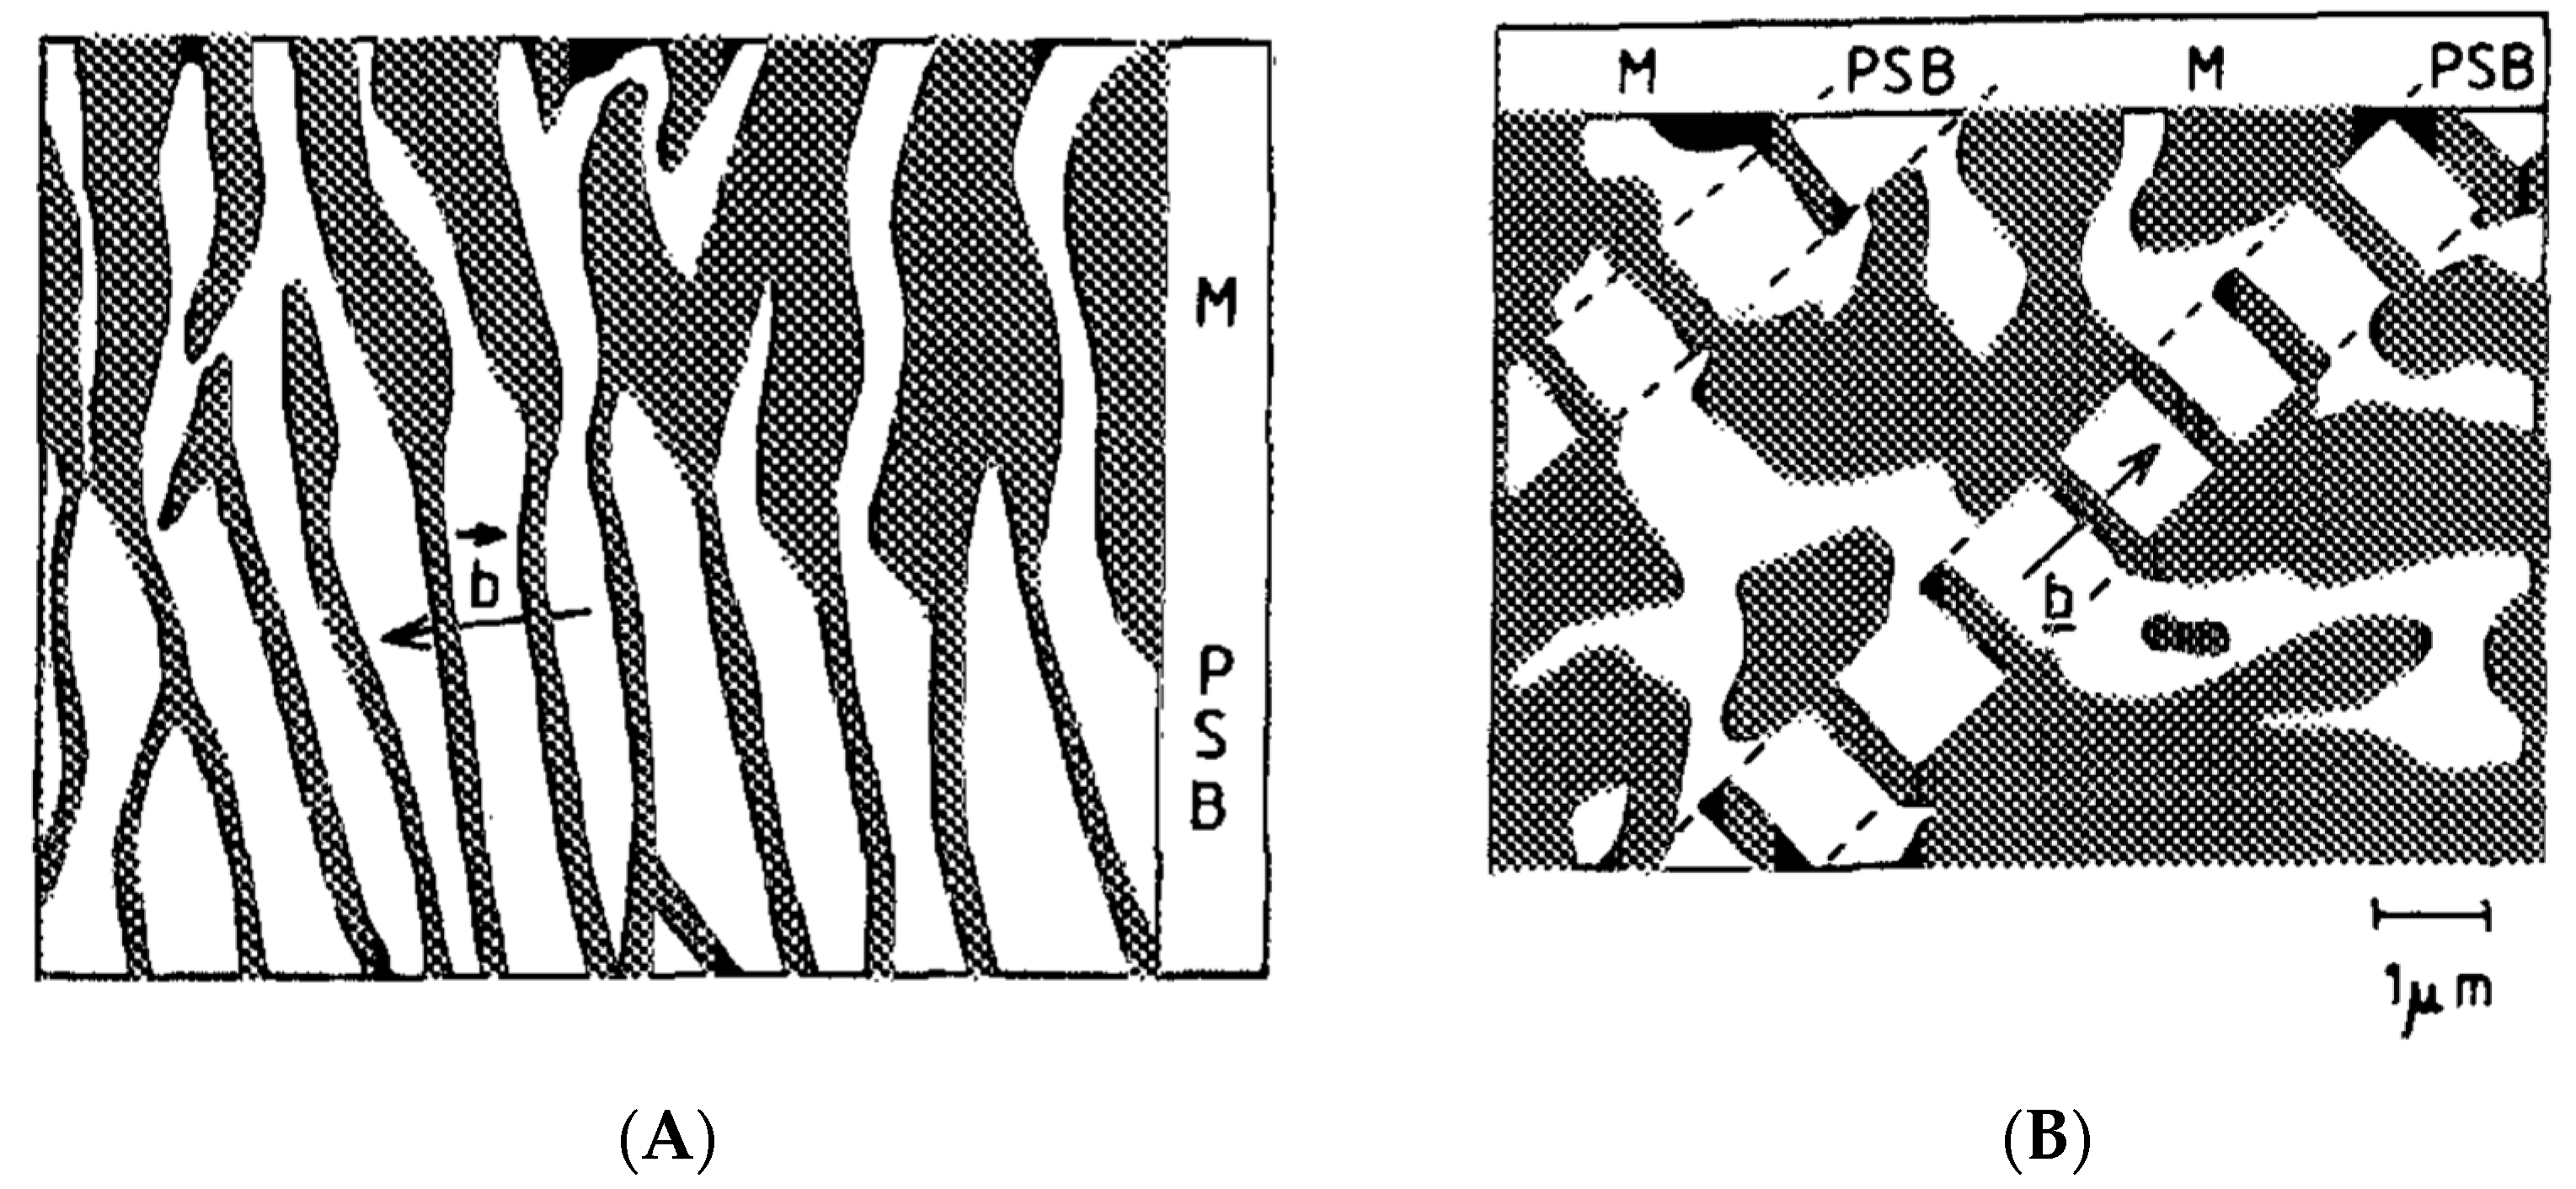
The initial W-A model [19] for dislocation patterning (PSBs—see Figure 8) under cyclic loading seems to continue inspiring research even in different scientific fields [20,21]. It has motivated many following works not only for continuum but also for the discrete dislocation dynamics (DDDs), as well as in the density-based statistical dislocation [22,23,24,25] simulations.
Its basic premise is to distinguish between two families of dislocation populations: the mobile (free to move due to stress in the slip plane) and the immobile (slow-moving on trapped sites). Let ρ m x , t and ρ i x , t be the corresponding dislocation densities for mobile and immobile dislocations, respectively, in space x and time t . The model reads [19]
ρ i t = D i 2 ρ i x 2 + a ( ρ 0 i ρ i ) β ρ i + γ ρ m ρ i 2 , ρ m t = D m 2 ρ m x 2 + β ρ i γ ρ m ρ i 2   ,
augmented with no-flux Neumann boundary conditions, where D i , D m are diffusion-like gradient coefficients generally dependent on stress and/or strain rate; γ is the rate at which immobile dipoles capture mobile dislocations; g ρ i = a ( ρ 0 i   ρ i ) describes the pinning rate of the newly produced dislocations, with ρ 0 i the initial density of immobile dislocations. The shear dependent parameter β depends on the stress/strain rate levels, i.e., the macroscopic control parameter determining the freeing of dislocations.
Here we extend the initial W-A results for infinite domains by obtaining new results for the W-A dynamics (in a one-dimensional finite domain) with respect to the shear parameter and the specimen size L —see also Glazov et al. [26]. From linear stability analysis [26,27], it turns out that the characteristic wavelength (for Turing-type spatial instability) is
n 0 = α γ D m D i 1 / 4 ρ 0 i L π   ;
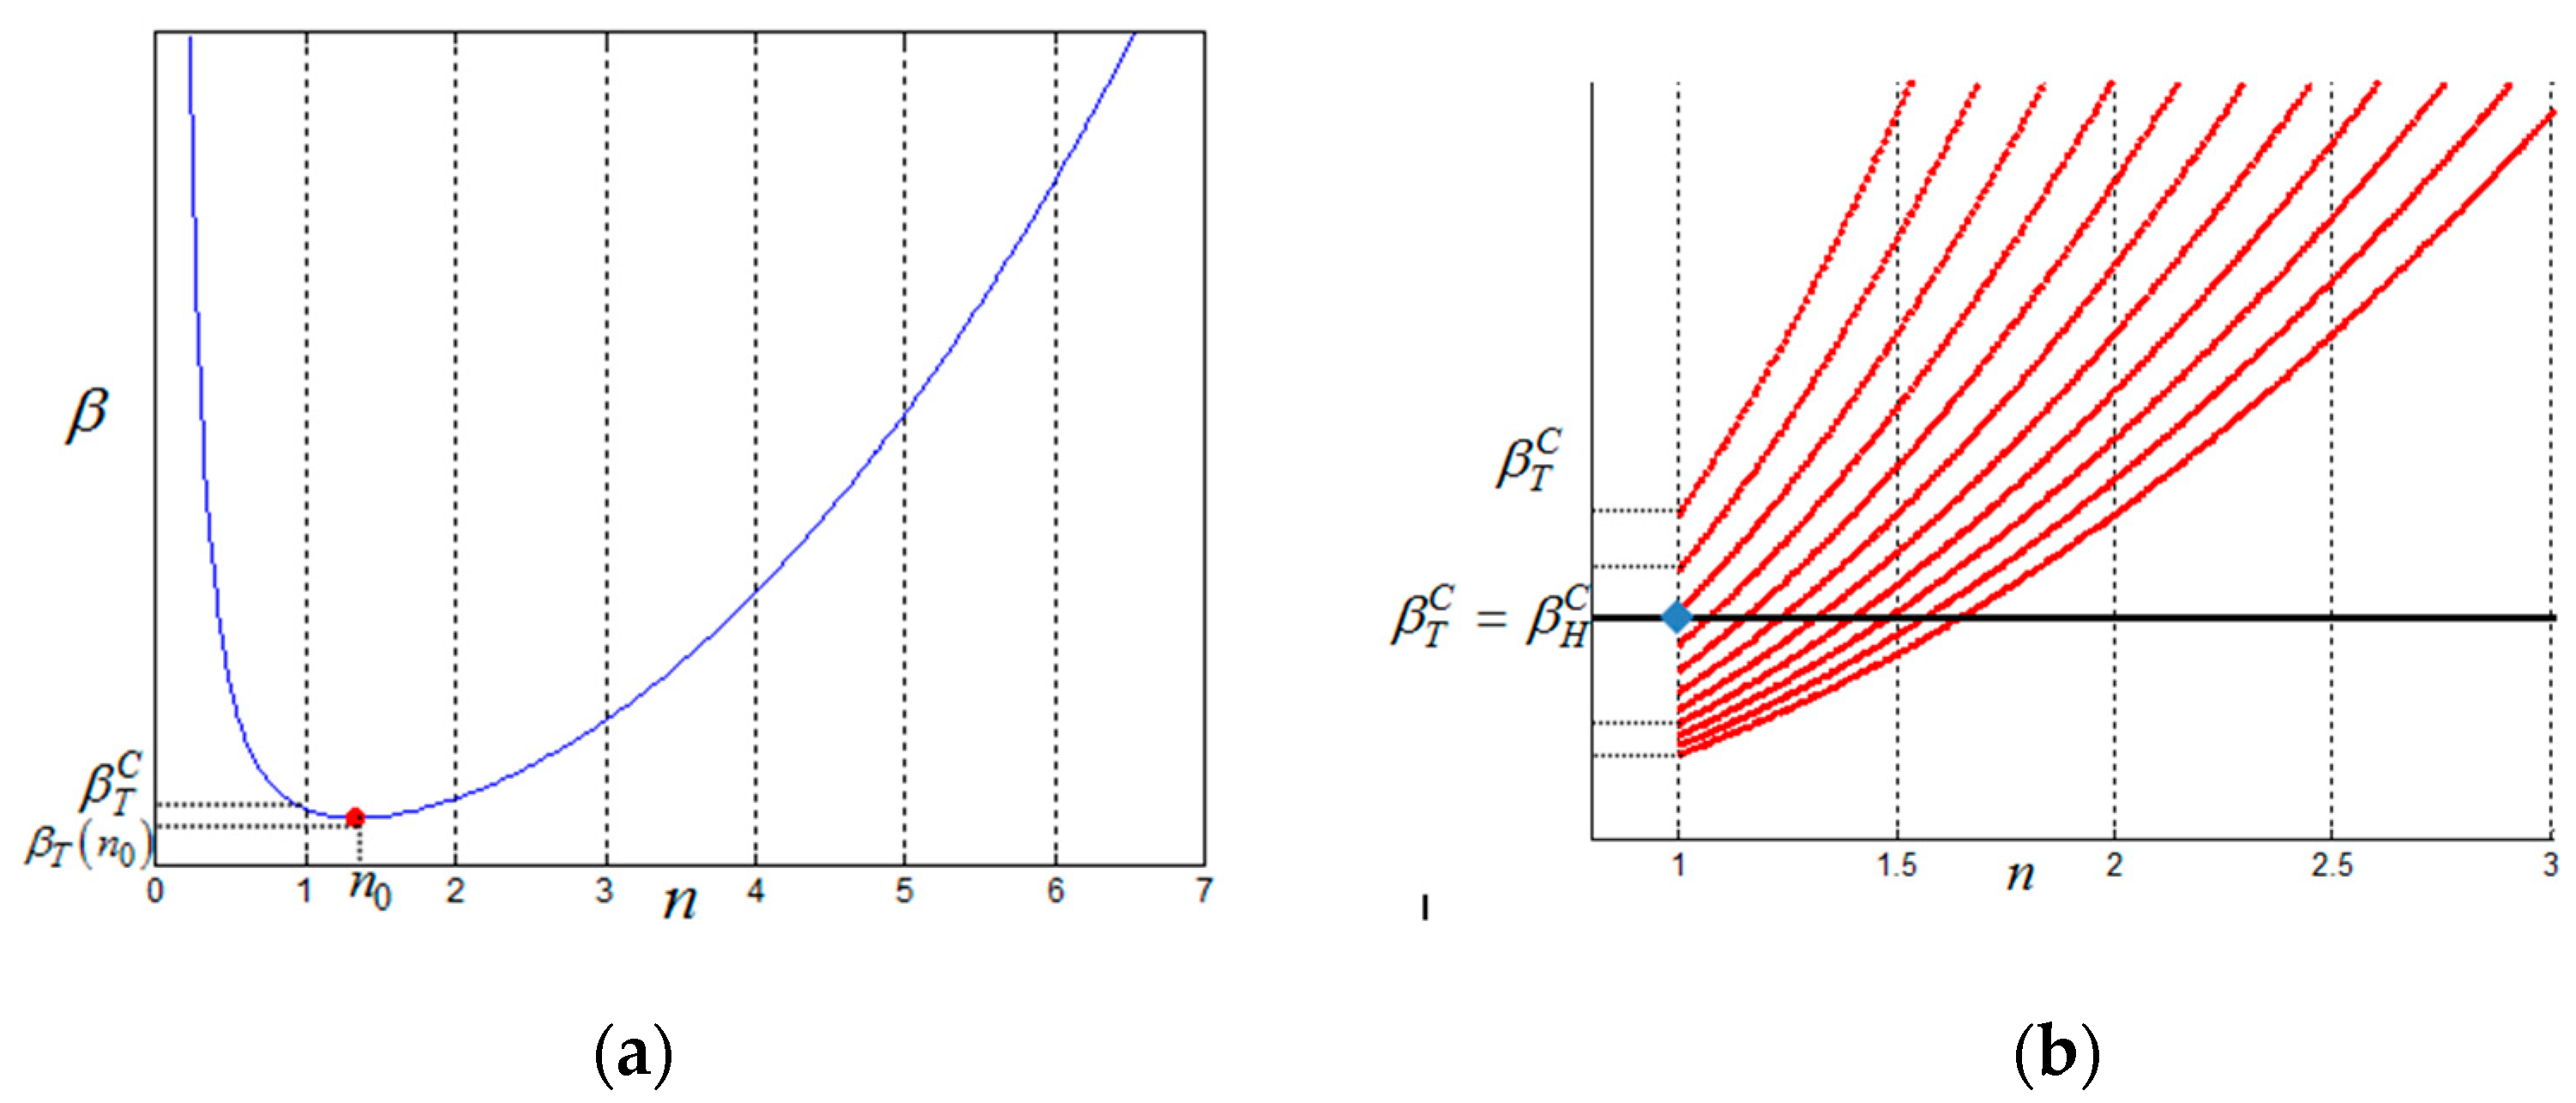
the resulting critical value (see Figure 9a), for the stress-controlled parameter β is [26,27]
β T C n 0 = α + α γ ρ 0 i 2 L 2 D m n 0 π 2 + D i n 0 π L 2 + D i D m γ ρ 0 i 2 = D i D m γ ρ 0 i + α 2 ,
while for homogeneous periodic solutions (Hopf bifurcation), the critical value is given by
β T C = γ ρ 0 i 2 + α .
Equation (18) may apparently indicate that the critical value for the existence of Turing instability is independent of the specimen. However, this is not true, especially in the small specimens. Turing instability exists only when n 1 , and since the β c = β c n is a strictly increasing function for n > n 0 (see Figure 9b), it implies that the characteristic wavelength must be corrected with n c = m a x 1 , n 0 .
In the case where L 0 , then from Equation (17) we obtain n 0 0 and thus, n c = m a x 1 , n 0   = 1. Consequently, the critical shear stress value is corrected with the following:
β T C = β T C 1 = α + α γ ρ 0 i 2 L 2 D m π 2 + D i π L 2 + D i D m γ ρ 0 i 2 .
Clearly, as L→0, the critical β T C →∞ (quadratically with respect to specimen L), meaning that Turing instability disappears as L 0 . In addition, there is always a critical value β H C for periodic instability (independent from L ). Consequently, the following picture of dynamics comes into play with respect to L (where L 0 ).
Let β be the shear stress parameter with β T C L < β < β H C (i.e., Turing instability has preceded). As L decreases, then β T C increases, and at some critical value of specimen size L the following equality holds:
β T C L = β .
The solution of Equation (20) gives the critical specimen size where the instability disappears through bifurcation, giving place to the stable homogeneous solution.
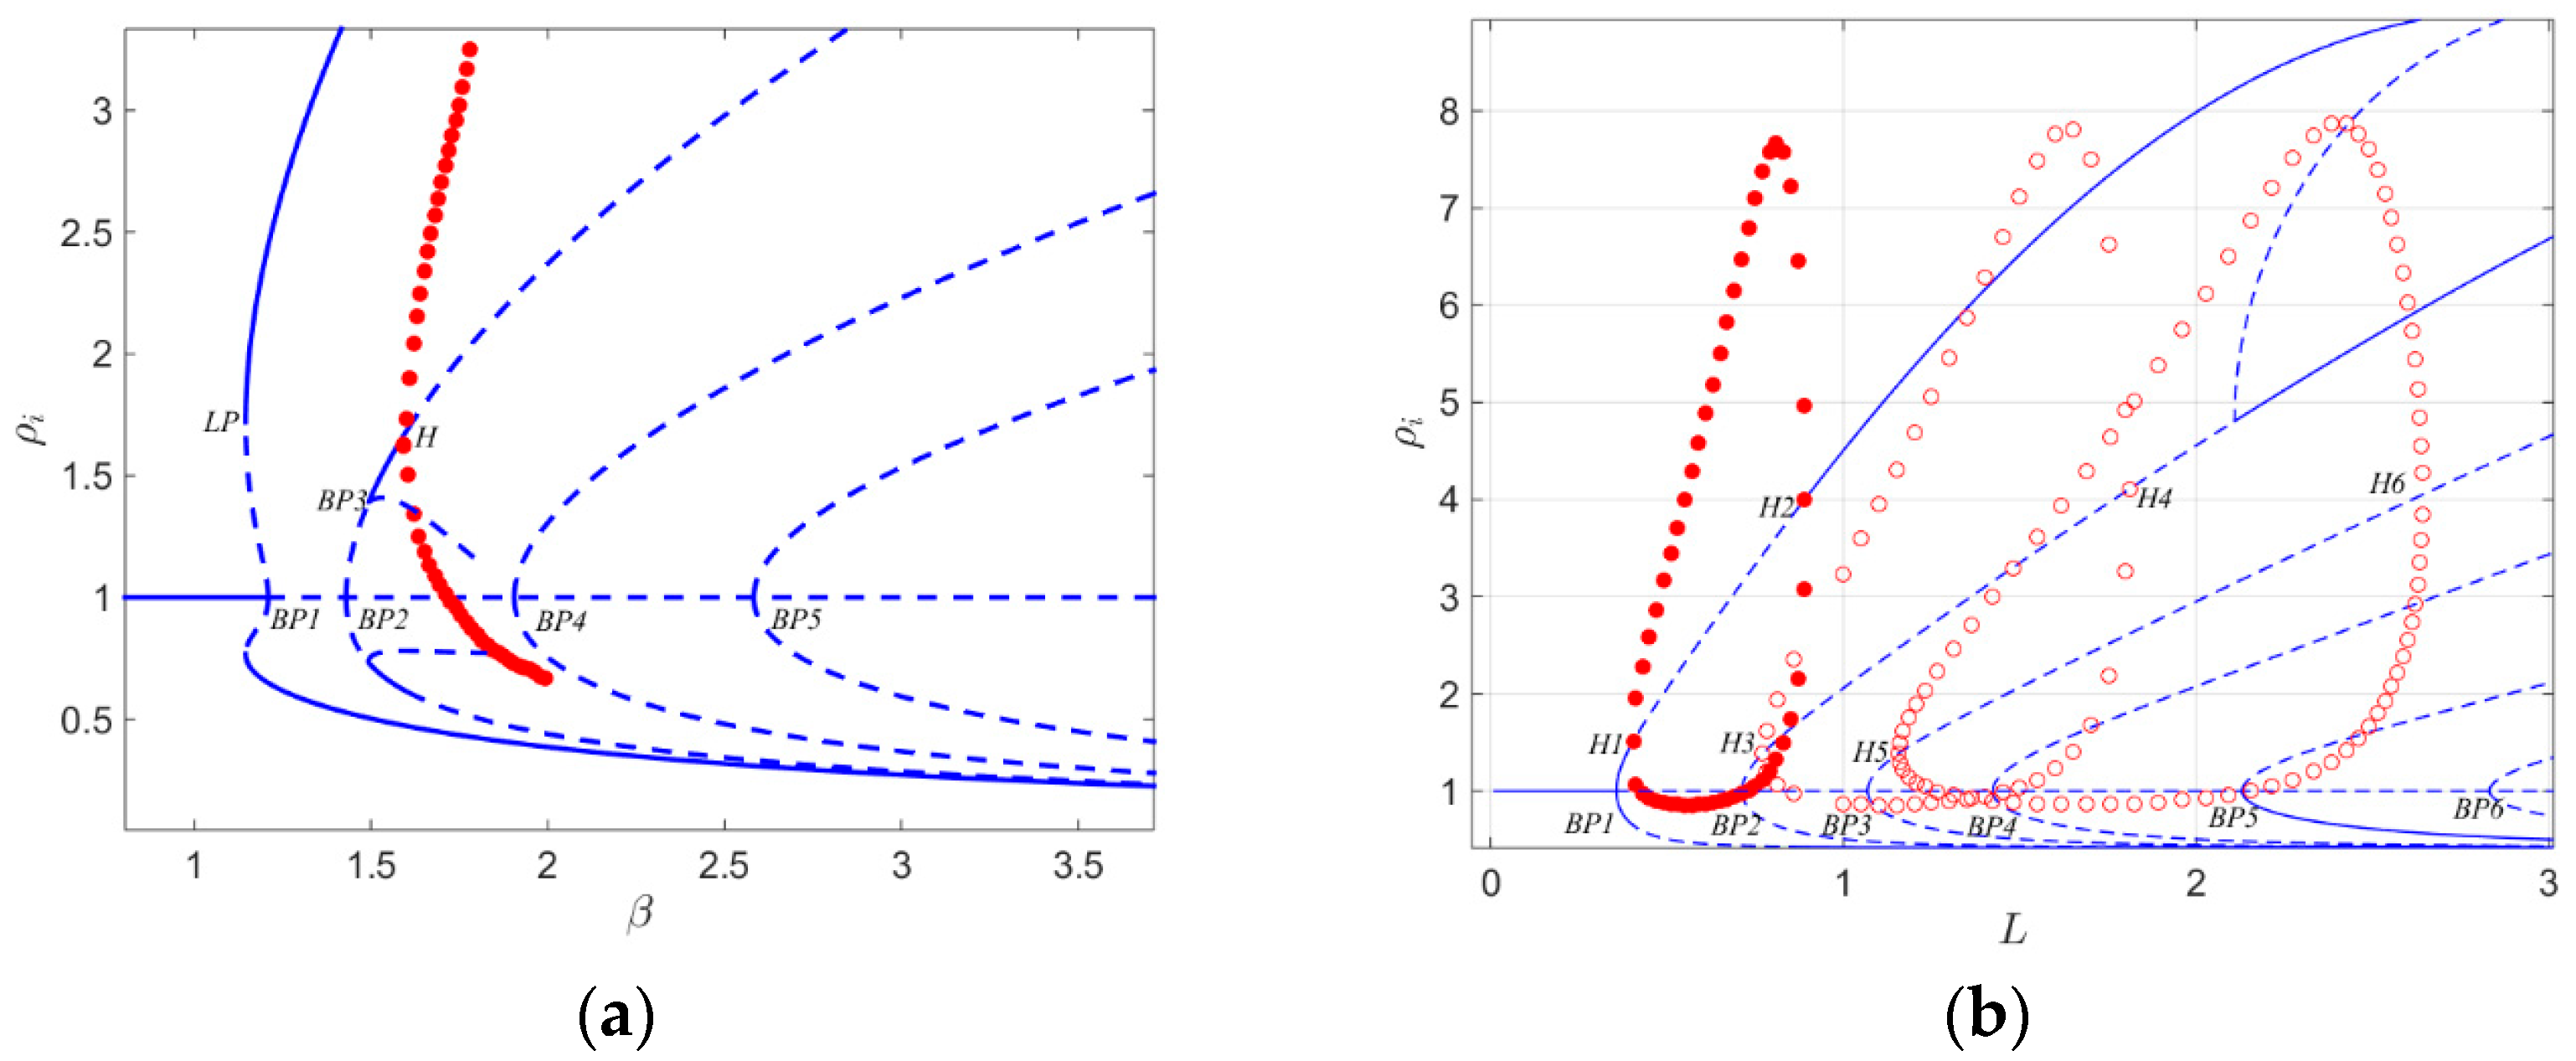
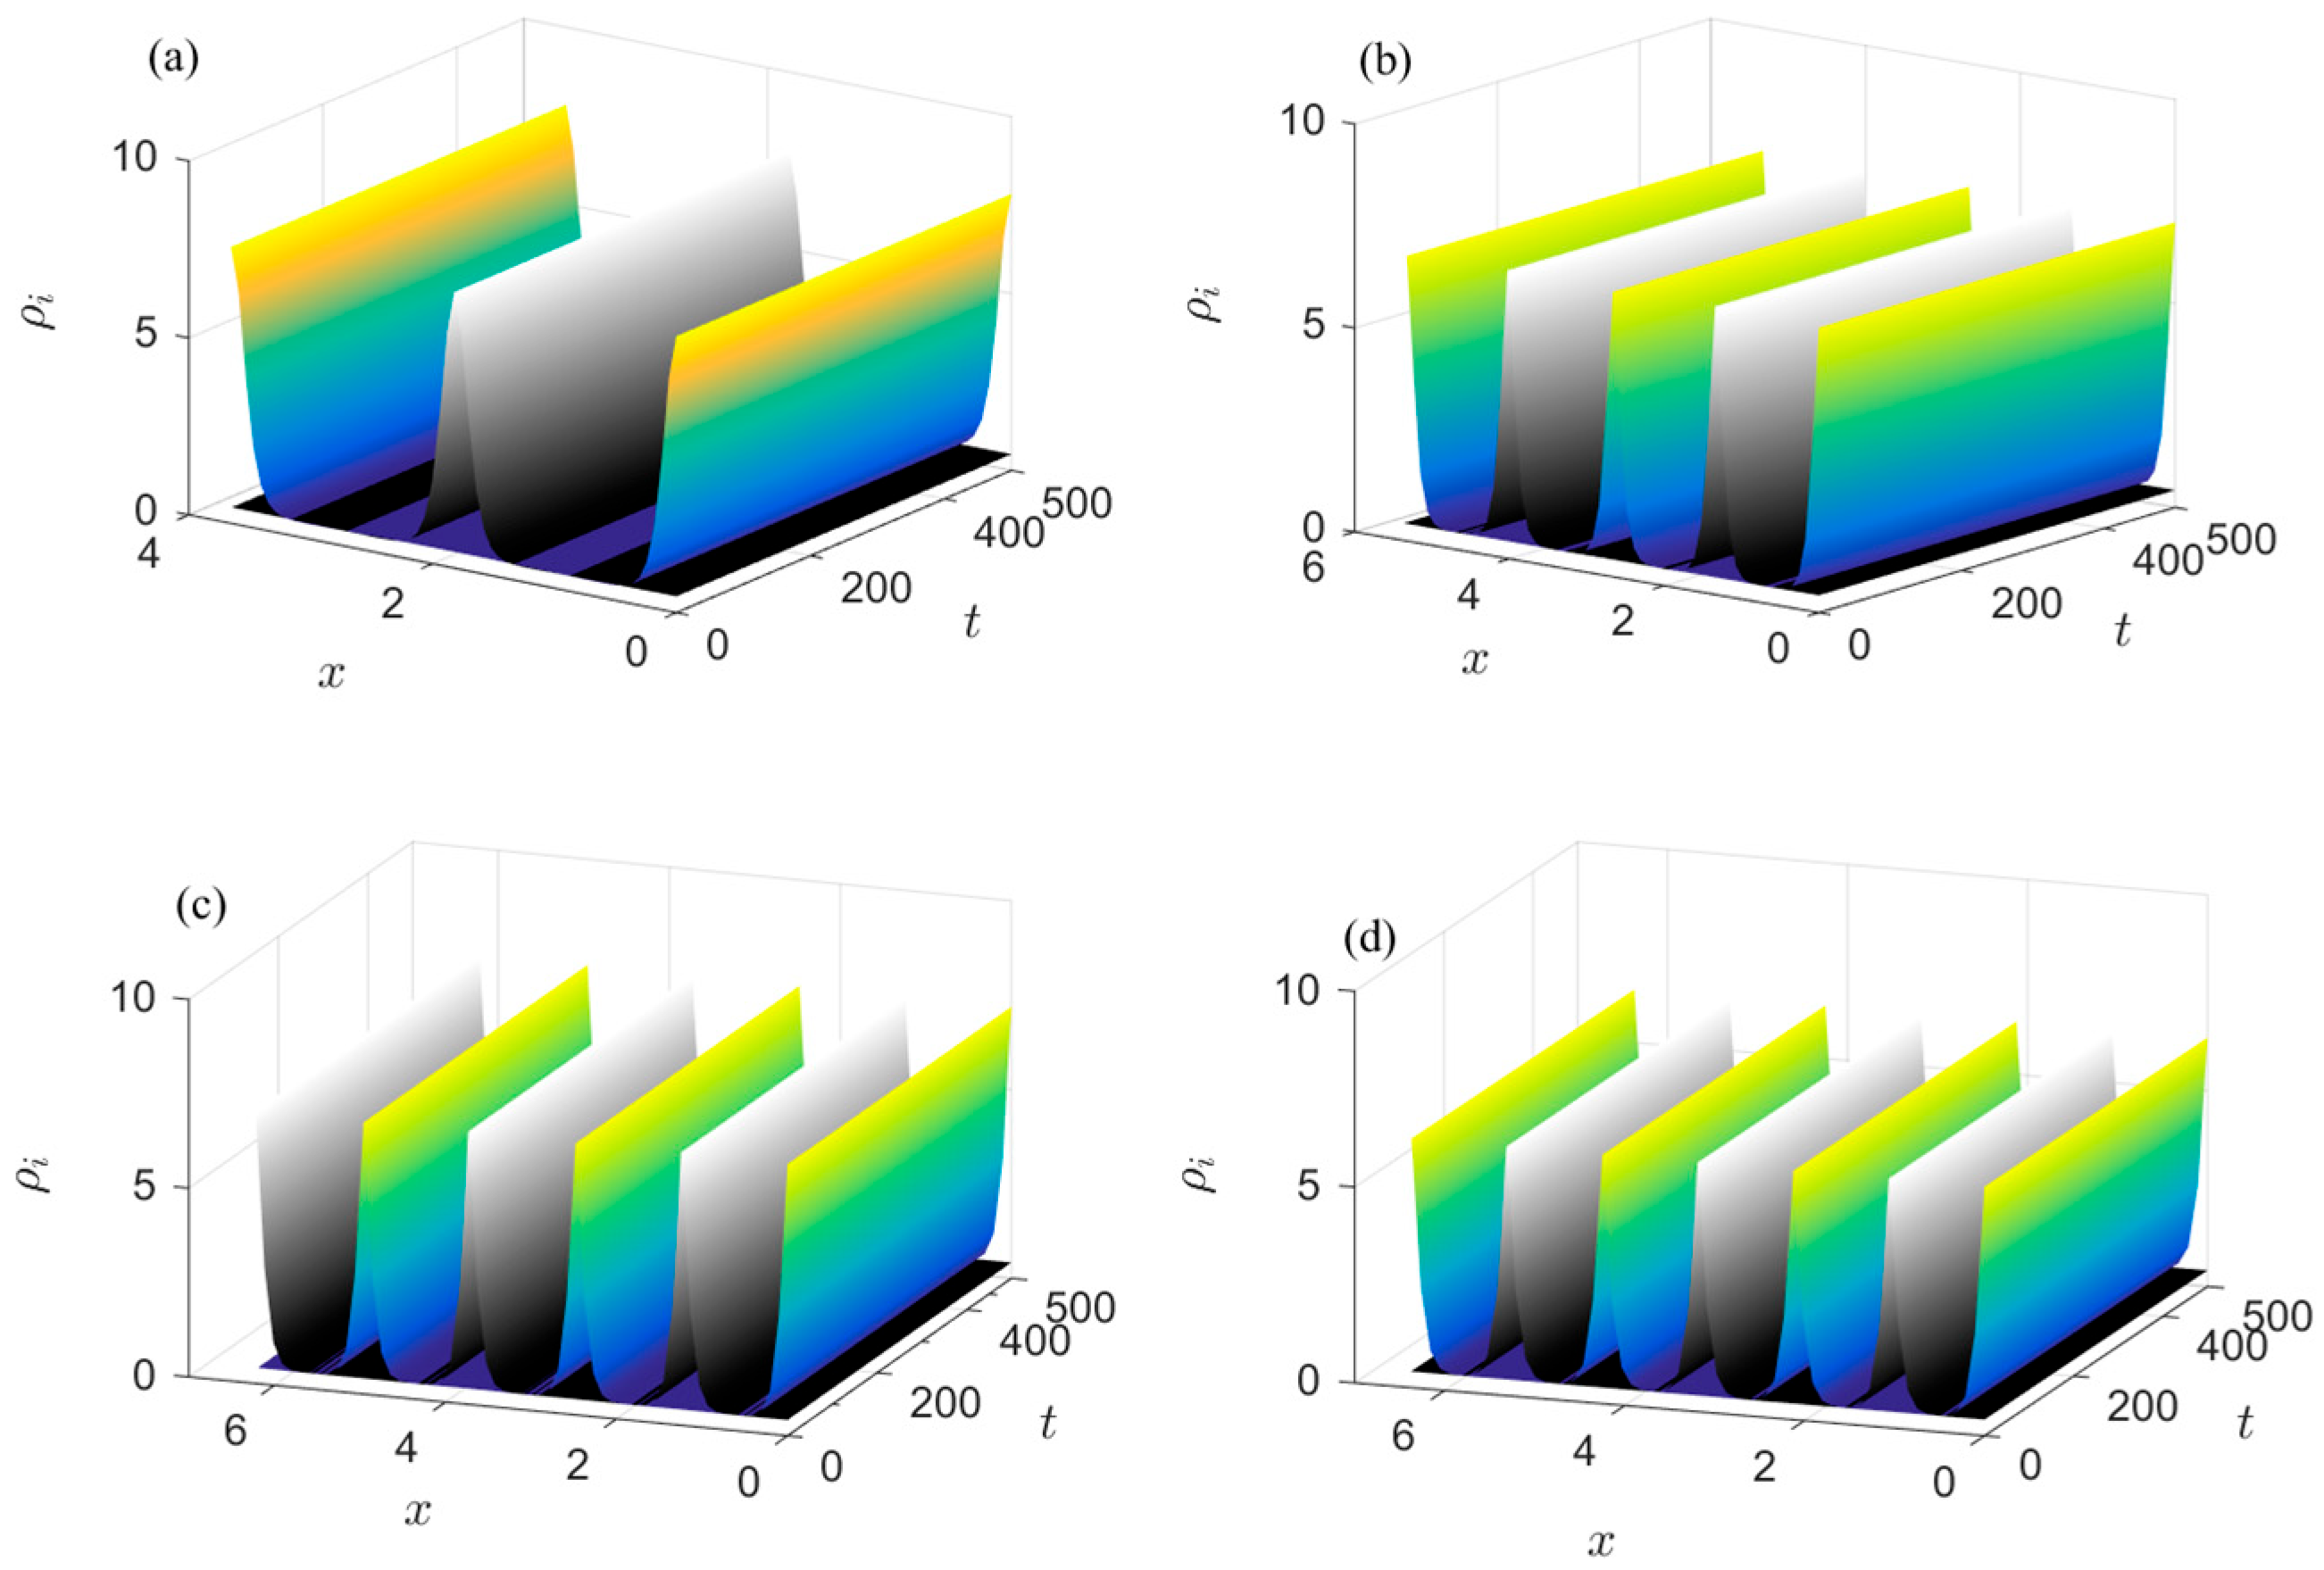
New methods of numerical bifurcation analysis [28,29] allow us to detect new nonhomogeneous solutions (even time periodic) and finally to construct the bifurcation diagrams with respect to the shear stress β , (Figure 10a), additionally, with respect to parameter L, the size of the domain (Figure 10b). The profiles of solutions for different values of L are depicted in Figure 11.
The following important conclusions for the W-A and specimen size L model are now presented. The model exhibits rich nonlinear dynamics for high values of L. The model shows multistability (e.g., for L > 2 , in Figure 10b), predicting thus the existence of different states of the material, depending on the initial conditions. The system displays symmetrical solutions with respect to the half size of the domain, i.e., Equation (16) with Neumann boundary conditions, is invariant under the transformation:
x L x .
Additionally, numerical bifurcation theory revealed the existence of periodic heterogeneous solutions that arise from secondary bifurcation points.

6.2. The EFM Method

We investigate the applicability of the Equation Free Method (EFM) in order to perform system-level analysis for the dynamics of dislocations in deforming metals. Under the EFM approach, macroscopic equations, which may not be available for complex phenomena, are circumvented, and system-level modeling tasks (prediction, bifurcation, and stability analysis) are performed directly through efficient and judicious exploitation of the fine-scale information.
For the present case, the (macroscopic) W-A partial differential equations (PDEs) system is transformed to an equivalent (mesoscopic) Lattice-Boltzmann (LB) description [30,31,32] through the equation
f l s x j + 1 , t k + 1 = f l s x j , t k + Ω l s x j , t k + R l s x j , t k ,
where the index s represents mobile and immobile species, i.e., s { i , m } , f l s x j , t k is the probability distribution of finding a dislocation (immobile or mobile, respectively) at the node x j in time t k and the index l { 1 ,   0 ,   1 } . The function Ω is the collision term and R the reaction term. The collision term Ω is defined according to [30,31,32], and the reaction terms for immobile and mobile dislocations are given by
R l i x j , t k = ν i Δ t a   ρ i , e q u i l x j , t k ρ i x j , t k β ρ i x j , t k + γ ρ i x j , t k 2 ρ m x j , t k
and
R l m x j , t k = ν i Δ t β ρ i x j , t k γ ρ i x j , t k 2 ρ m x j , t k ,
with the macroscopic densities given by
ρ s x j , t k = l = 1,0 , 1 f l s x j , t k
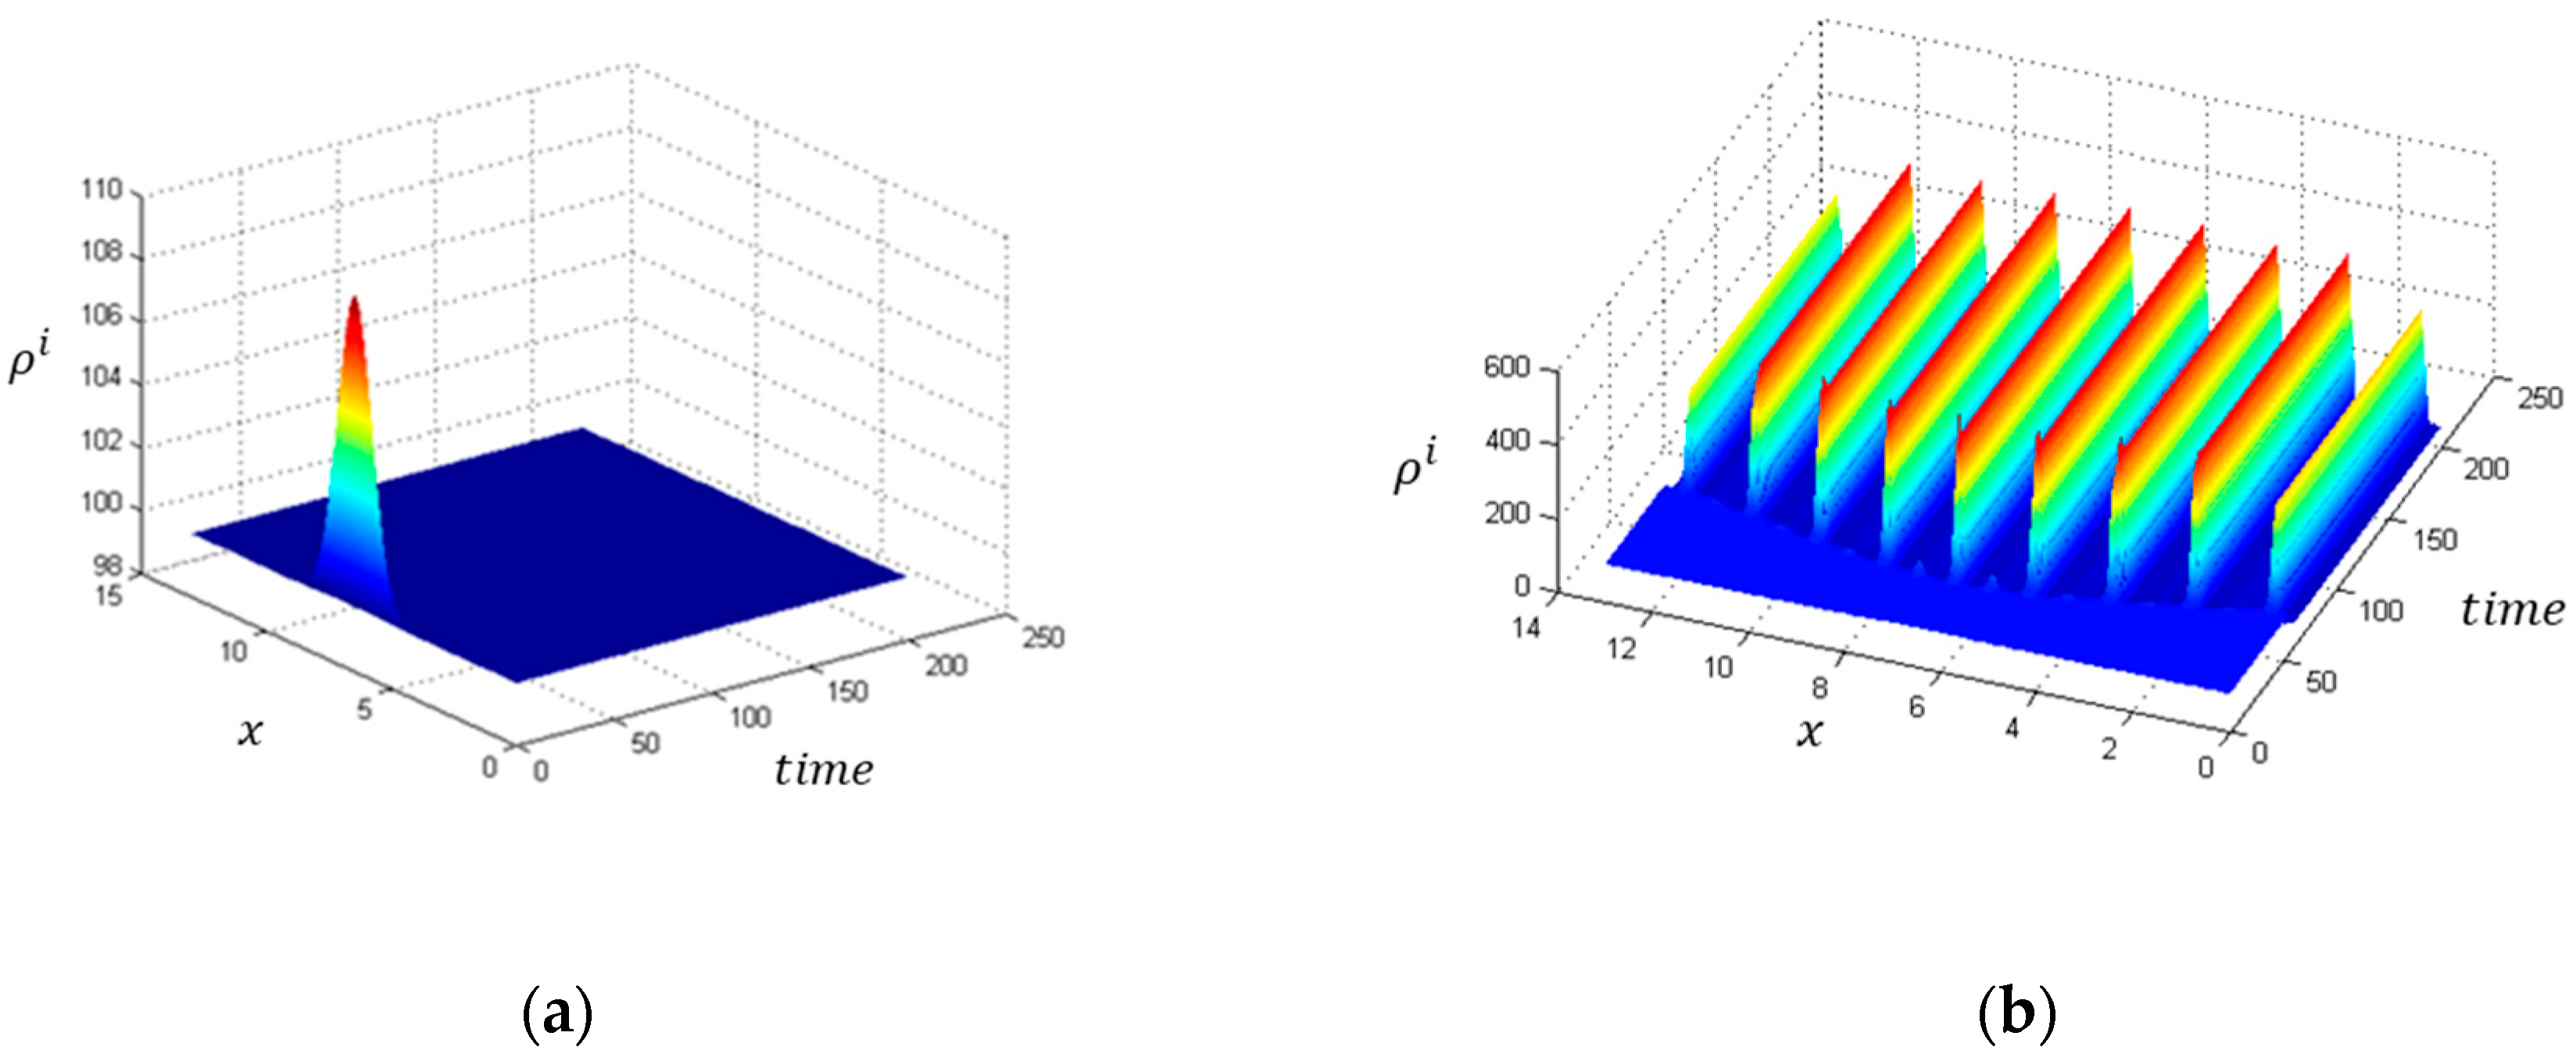
representing the densities of the W-A model, Equation (16), s { i , m } . Profiles of solutions, using the integration scheme of LB, i.e., Equations (23)–(26), are depicted in Figure 12 for different values of the shear stress parameter.
Under certain assumptions [33] (existence of white noise in the reaction term), the evolution of the probability density P ψ , t   ψ = ρ i , ρ m obeys the following master equation
P ( ψ , t ) t = ψ u ψ + 2 ψ 2 D ψ P ψ .
Here, u ( ψ ) = D ( 1 ) ψ and D ( ψ ) = D ( 2 ) ψ are the drift and the diffusion coefficients, respectively, which can be estimated by applying the Equation Free framework. Once the Fokker-Planck equation is reconstructed, one can calculate several global characteristics of the system, such as the effective free energy G ψ and the rates of transitions between different metastable states of the system using the following relation:
β G ( ψ ) = 0 ψ u ( ψ ) D ( ψ ) d ψ + ln D ( ψ ) + c o n s t .

6.3. DDD Simulations and Diffusion Maps

Changes concerning the form and the material properties, macroscopically, are related to the formation of dislocation patterns. The movements and interactions of dislocations at the micro/mesoscopic level can lead the system (depending on the type of externally applied stress) far from equilibrium through successive transitions of dislocation patterns.
In the subsequent discussion, only straight edge dislocations are considered. The slip direction is the x-axis (parallel to the Burgers vector), and the line of dislocation is parallel to the z-axis. Periodic boundary conditions are included, with half of the dislocation number having a positive Burgers vector direction ( s i = 1 ) and the other half negative ( s i = 1 ) . N dislocations are initially randomly placed in a square of D = 1 side. The force per length of dislocation, on dislocation i from dislocation j, is given by the Peach–Koehler force [34,35]. The equation of motion reads
x ˙ i = c s i j = 1 j i N σ x y i , j = c s i j = 1 j i N s j d x i j d x i j 2 d y i j 2 d x i j 2 + d y i j 2 2 + τ e x t .
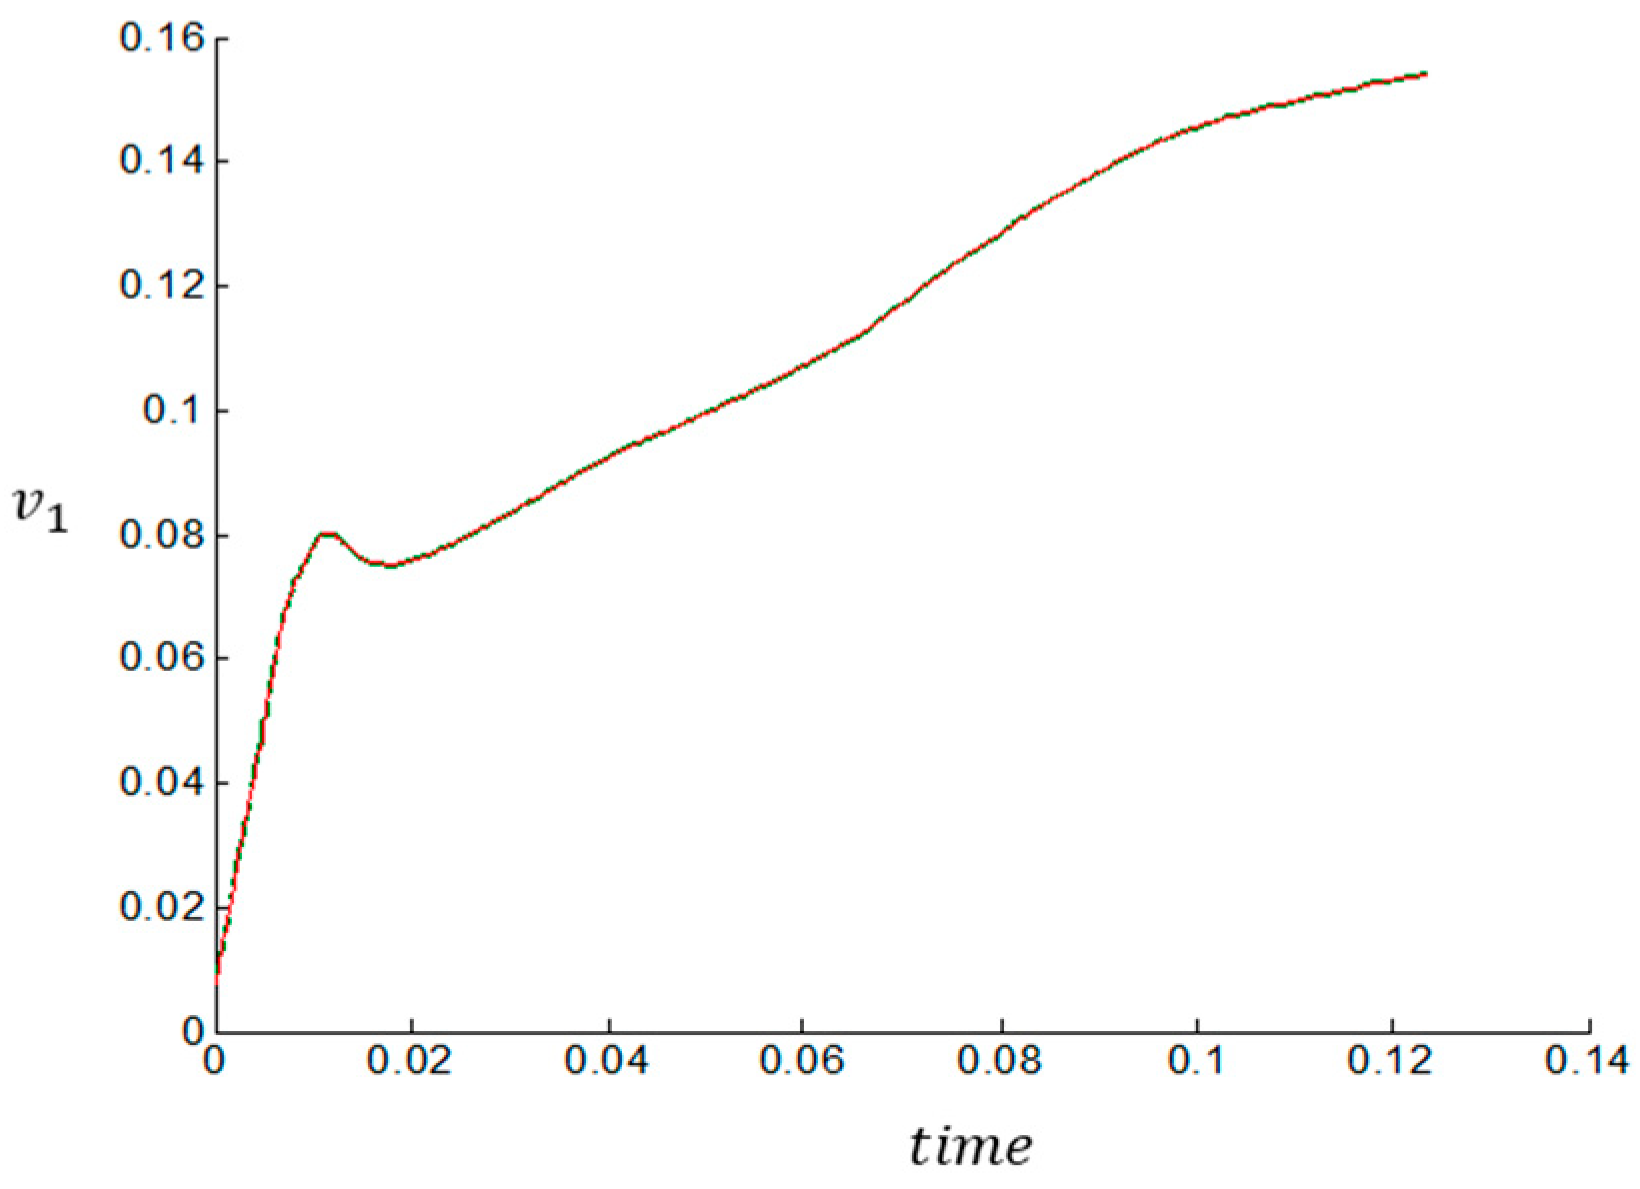
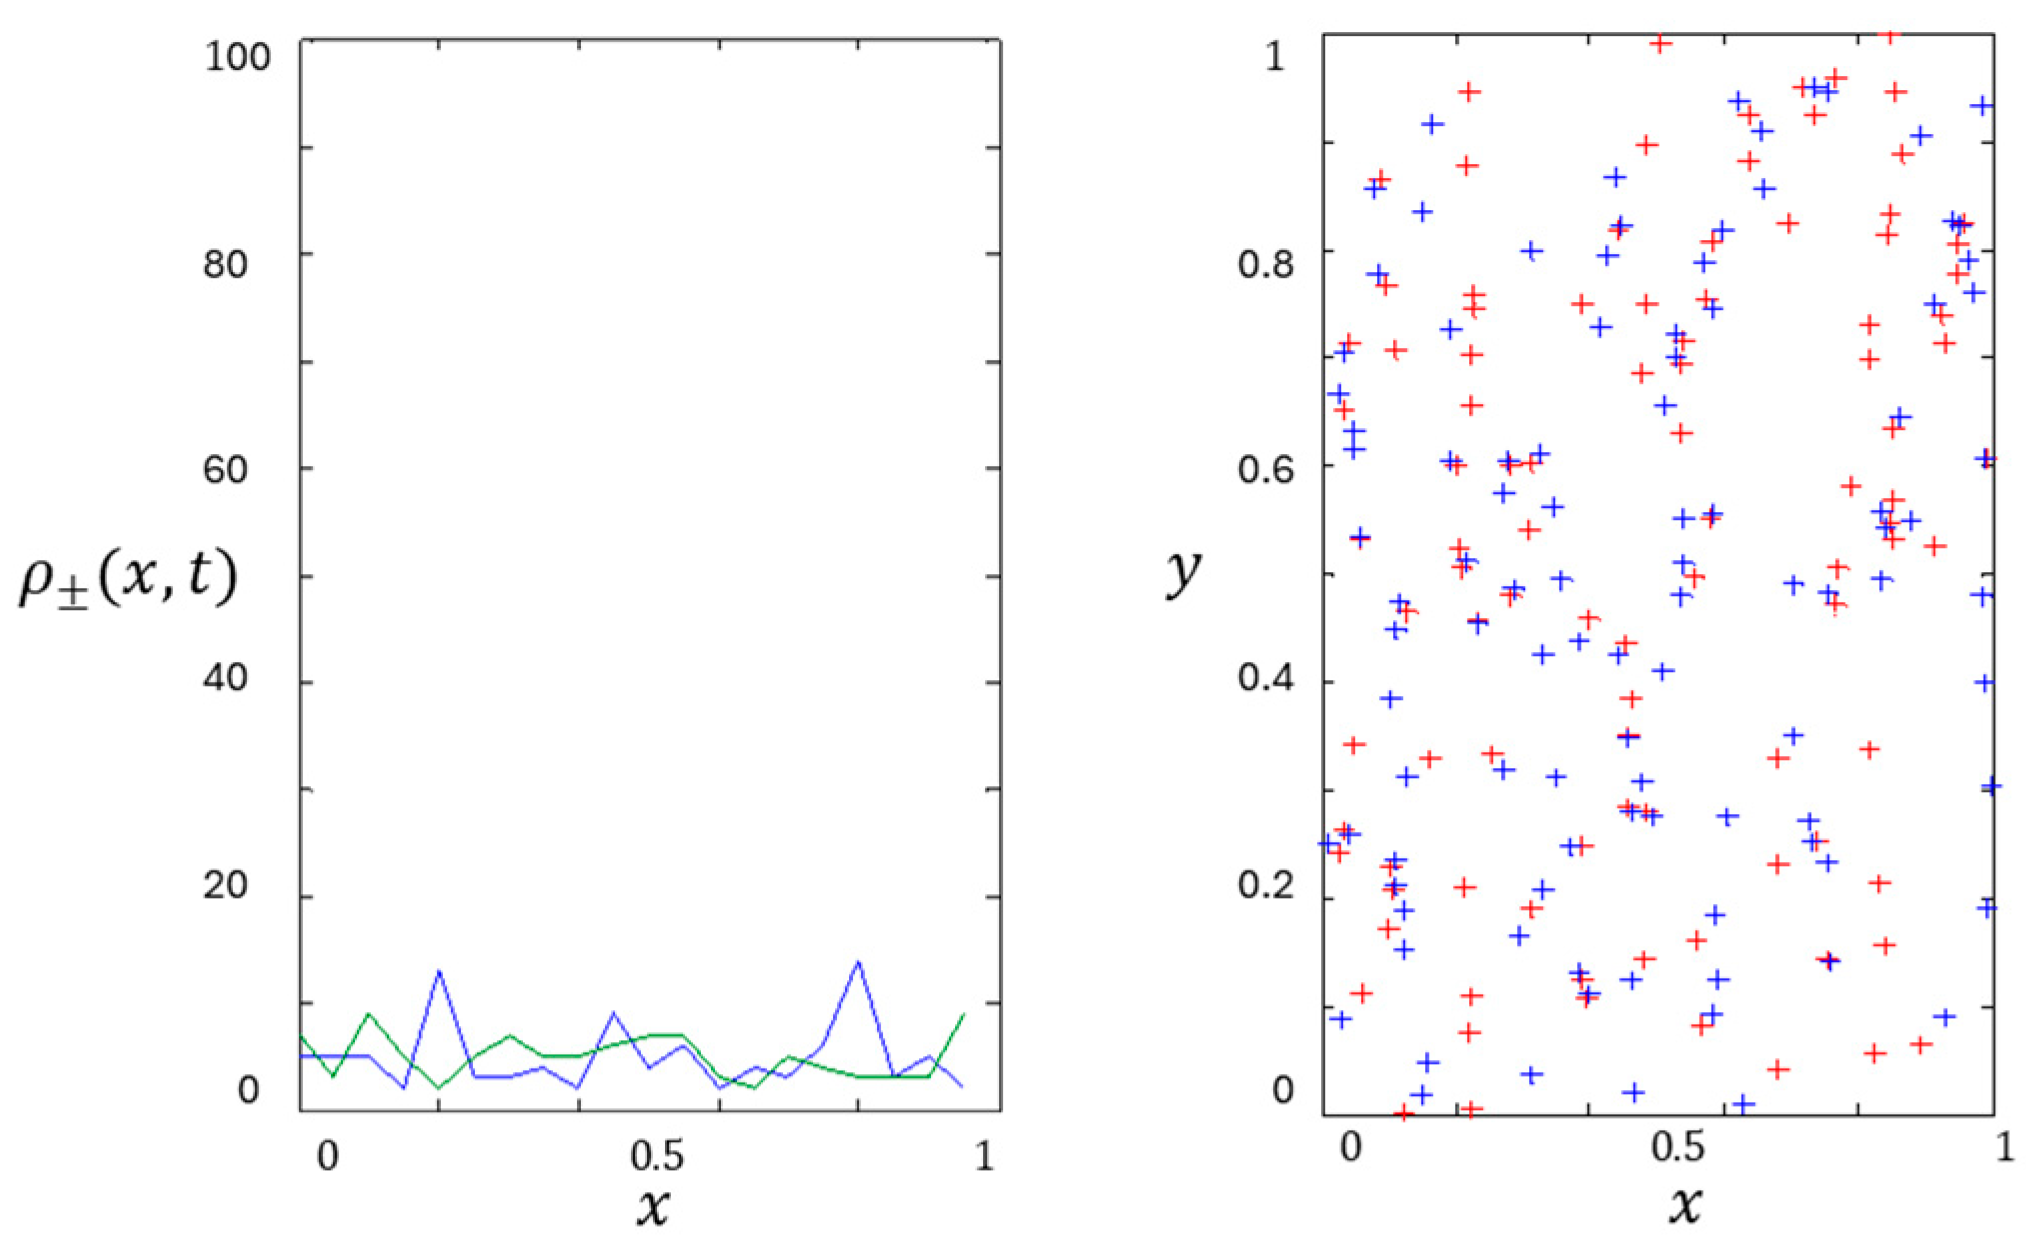
The solution of Equation (29) gives a matrix of simulated data: M = x i j R N × T   N where N is the number of dislocations and T is the length of the (usually high-dimensional) time vector. We can apply the theory of Diffusion maps [36]—developed through Data Mining techniques. Let M be the stochastic matrix of distances between the elements of the matrix and the corresponding eigenvalues and eigenvectors. Then, if there is a spectral gap, the data are low-dimensional and can be represented by the few eigenvectors of the matrix M [36]. Figure 13 shows that the first non-trivial eigenvector corresponds to a higher eigenvalue with respect to time, related to the strain-stress curve, while Figure 14 shows the spatial distribution of dislocations coming from the solutions of Equation (29).

7. No Equations—Tsallis Statistics

7.1. Methodology

Deformation-induced spatio-temporal features such as serrations and shear bands associated with highly dissipative irreversible processes cannot be easily interpreted with the usual Boltzmann–Gibbs (BG) entropy. On the contrary, the nonextensive statistical mechanics pioneered by Tsallis [37] offers an alternative framework—based on the q-generalization of the BG entropy—to describe far from equilibrium nonlinear complex phenomena. In this setting, the maximization of Tsallis entropy gives (for the case of self-organization in plasticity) rise to stress drops and optimum fractal structures, which are interpreted through Tsallis q-Gaussian distributions.
To show this, we can estimate Tsallis q s t a t index (or other indices) using experimental PDFs according to the Tsallis q-exponential distribution [37]:
P D F Δ Ζ A q 1 + q 1 β q Δ Ζ 2 1 1 q ,
where Aq and βq are the normalization constants and q q s t a t is the entropic or non-extensivity factor ( 1 <   q s t a t 3 ) related to the size of the distribution tail. When q s t a t = 1 , the usual BG statistical mechanics are obtained. More details about this statistical analysis can be found in [38].
We can also explore the capabilities of nonextensive Tsallis statistical analysis concerning UFG materials in two ways: First, to characterize the complex underlying dynamics of temporal stress discontinuities associated with deformation behavior; and second, to analyze various images depicting microstructures and/or multiple shear bands. In the latter case, in order to study complex shear band networks, we can analyze scanning electron microscopy (SEM) images. For this, we can use the Z-order transformation (Morton order) [39] as a function to map the 2D data to one dimension, preserving the locality and the distribution of the data points—pixels. Thus, for each image, we produce an “image” series, used to estimate Tsallis q s t a t exponent. Then, the Tsallis q s t a t exponent is used as an indicator of the strength of the pixels’ long-range correlations. We can also estimate the fractal dimension (FD) of the images, using the box counting method, which can also provide information concerning the presence (or not) of a (multi)fractal hierarchical geometry.

7.2. Serrated Stress–Strain Graphs in Ultrafine Grain (UFG) Materials

Nonextensive Tsallis statistical analysis can also be applied for the characterization of the underlying dynamics of temporal stress discontinuities associated with the deformation behavior of a UFG Al-Mg alloy. Preliminary results revealed a q s t a t = 1.29 ± 0.05. The value q s t a t > 1 suggests the presence of long-range interactions (a distinctive property of open and nonequilibrium systems) in the underlying dynamics, which is characterized by non-Gaussian (q-Gaussian) distributions. Thus, the system dynamics manifests through a series of metastable or nonequilibrium stationary states, which are described by a Tsallis q-Gaussian distribution with an entropic index q s t a t = 1.29 > 1. The results demonstrate that plastic flow in UFGs occurs simultaneously at various levels, giving rise to the formation of serrations with a Tsallis q-Gaussian distribution.
The analyzed micrographic images were taken from [40] and correspond to Al–5%Mg–1.2%Cr alloy processed by equal channel angular pressing (ECAP). The summary of the results is shown in Table 1.

7.3. Fractal Microstructures

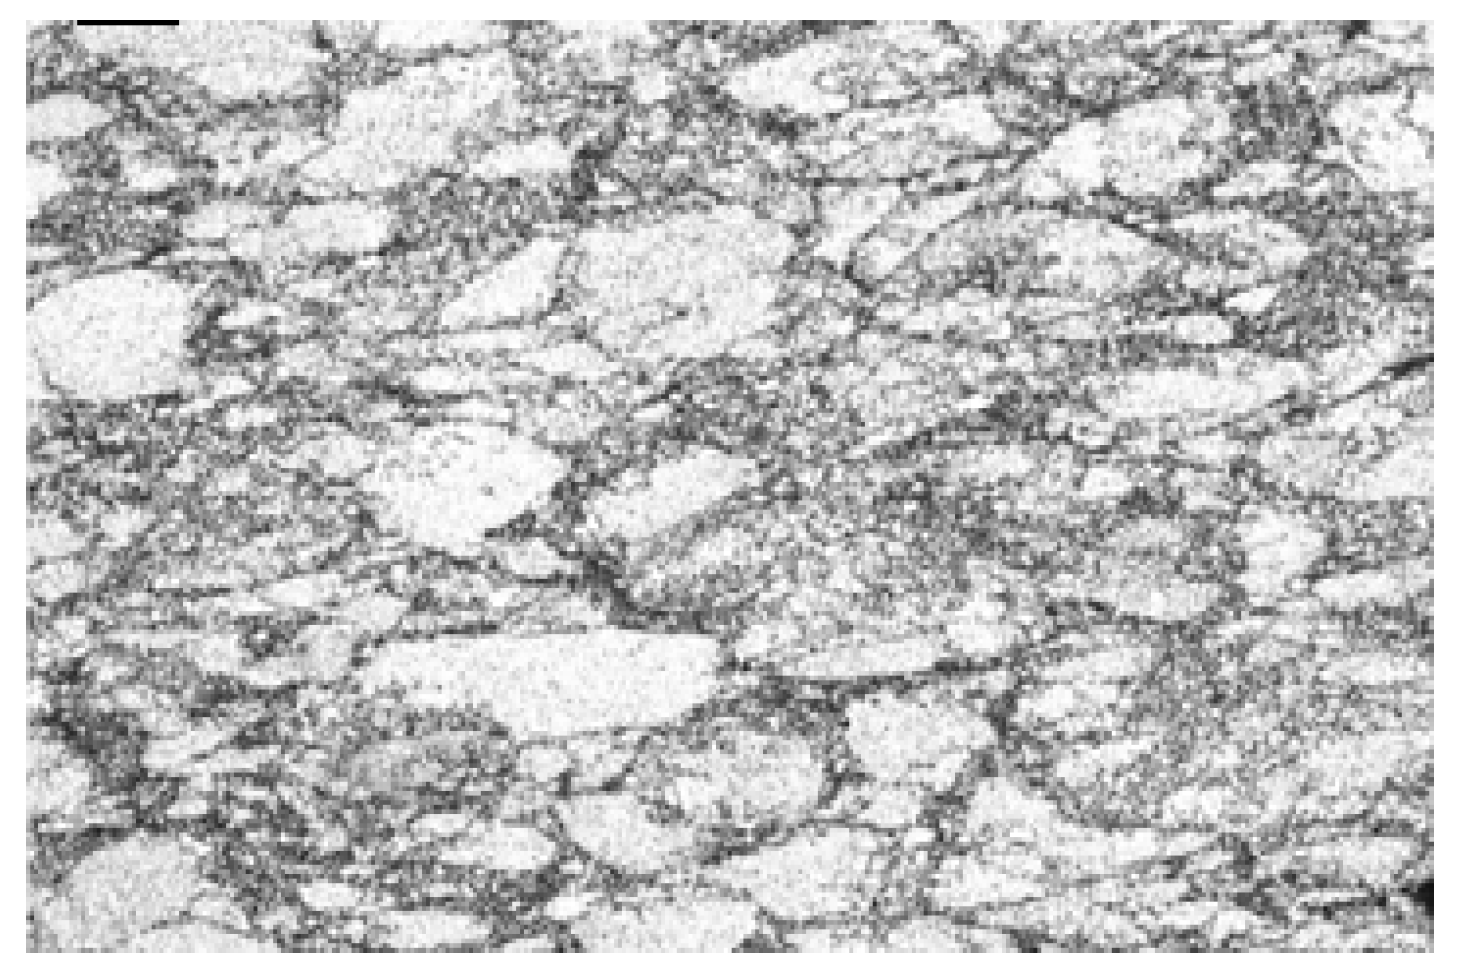
In this case, we analyzed images of optical microscopy (OM) in order to compare the microstructure (grain structure) of the powder metallurgy Al–5%Mg–1.2%Cr alloy before and after being subjected to equal channel angular pressing (ECAP). In particular, in Figure 15, the microstructure of the homogenized material strained up to fracture at a strain rate of 10−3 s−1 is shown.
In this case, the Tsallis q s t a t exponent was found to be 1.103 ± 0.03, indicating the presence of non-Gaussian, long-range correlations between pixels. This finding is also consistent with the strong fractal character revealed by the fractal dimension, which was determined to be equal to 2.5645.
On the contrary, the ECAP processes changed the microstructure to a more inhomogeneous—noisy character, since the Tsallis q s t a t exponent was found to be 1.0034 ± 0.01, with a FD = 2.9409. In this case, short-range or no correlations prevail between pixels, indicating Gaussian distributions.

7.4. Multiple Shear Bands

We also analyzed SEM images concerning shear band structures in homogenized Al–5%Mg–1.2%Cr alloys (Figure 16a), and ECAP-processed (two passes) at 200 °C and at 300 °C (Figure 16b) at a strain rate of 10−4 s−1. In general, the shear bands are comparable irrespective of the ECAP conditions and tensile strain rate. The bands are found oriented about 45° with respect to the tensile axis, and spread all over the grains in the whole gauge region, as observed for the case of the homogenized material [40]. However, the results of our analysis showed a significant difference between the homogeneous and the ECAP shear band structure, while no differences were found between the structures corresponding to different ECAP temperature conditions. The Tsallis q s t a t exponent was found to be 1.5477 ± 0.0465 in the homogenized case, 1.325 ± 0.03 in the ECAP (200 °C), and 1.393 ± 0.04 in the ECAP (300 °C). Correspondingly, the fractal dimensions were found to be: 2.2642, 2.1758, 2.2187. These results indicate the presence of fractal, non-Gaussian, long-range correlations between the pixels, which are decreased due to ECAP processes. This decrease could be due to the “noisy” microstructure of the ECAP alloy.

8. Guidelines for Future Work: Gradient-Stochastic Dislocation Evolution Models and Current Experimental Literature on Self-Organization in Metal Plasticity

Despite the number and variety of results presented in the previous section, along with those contained in the quoted articles and references listed therein, the problem of self-organization in metal plasticity is still open, mainly due to the development of new experimental techniques and numerical codes to capture and characterize complex strain localization zones and related spatio-temporal patterns in metals under stress. Thus, the subject remains an attractive and quite promising topic, amenable to the use of recent advances in nonlinear physics and statistical mechanics for interpreting mechanisms and behavior across the scale spectrum. This is briefly illustrated below by focusing on the example of gradient dislocation dynamics.

8.1. Deterministic Gradient Dislocation Evolution

Our first note concerns the 1D gradient dislocation dynamics equation.
ρ ˙ = D ρ x x g ρ ;    g ρ = A ρ 3 + B ρ 2 + C ρ .
A traveling wave solution of Equation (31), ρ = f x v t , is then determined by the equation:
f v f A f 3 + B f 2 + C f = 0 ,
where for convenience we set D = 1 .
Equation (32) can be analyzed through phase plane analysis:
f = h ,   h = v h + A f 3 + B f 2 + C f ,
whose equilibrium points are found from
h = 0 ,   v h + A f 3 + B f 2 + C f = 0 ,
i.e., the triplet: ( 0,0 ) ; ( B B 2 4 A C 2 A , 0 ) ; and B + B 2 4 A C 2 A , 0 with the corresponding Jacobian matrix given by
J f , h = 0 1 3 A f 2 + 2 B f + C v .
Assuming, for illustrative purposes, that A = 1 ,   B = 1.2 ,   C = 0.2   and D = 1 , Equation (31) can be written as
ρ ˙ = ρ x x + ρ ρ 0.2 1 ρ ,
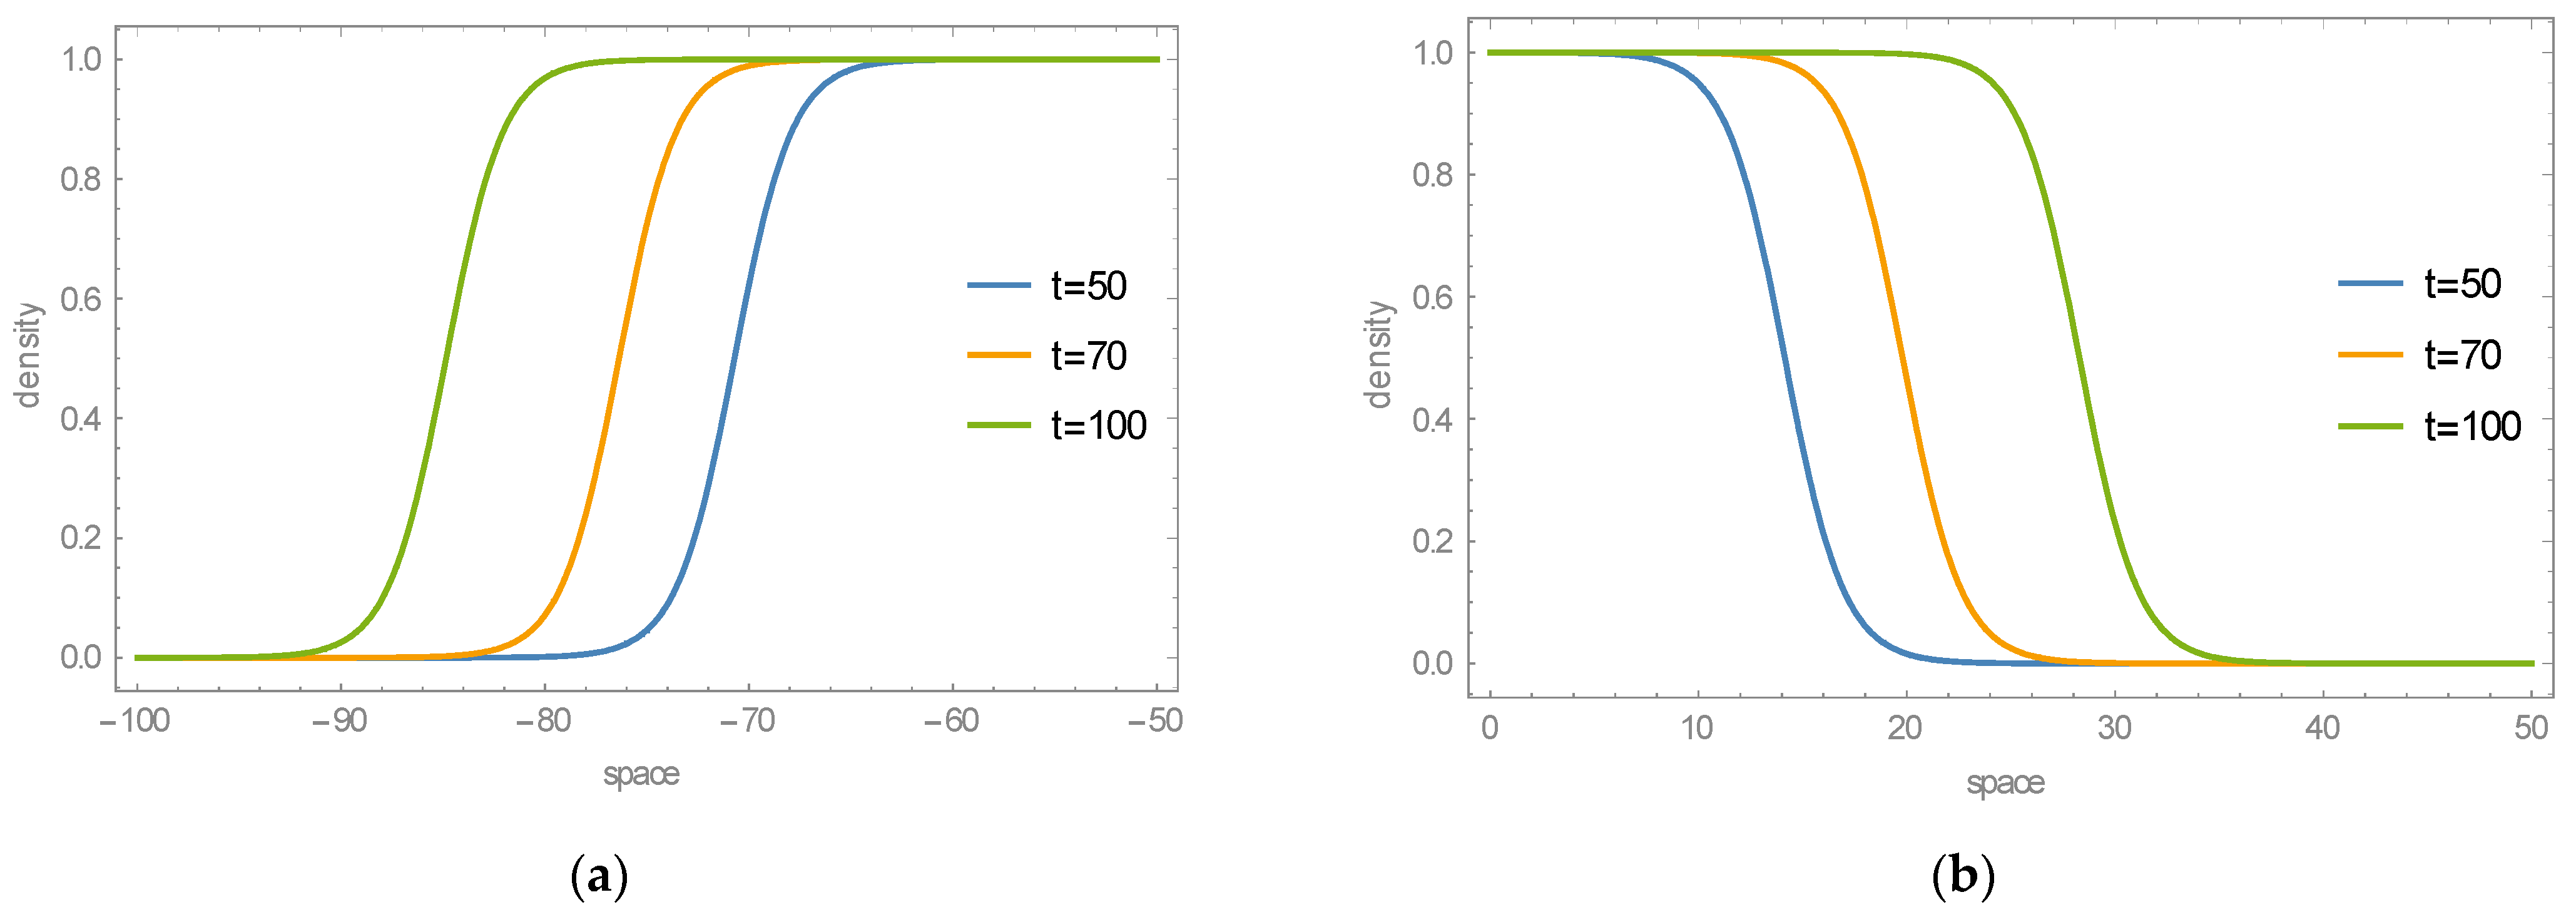
which is a Nagumo equation [41] having the following solution [42]:
ρ x , t = 1 1 1 + e x p k x v t + s   ,
with k = ± 1 / 2 ,   v = 0.4 k = 0.4 / 2 , s = { 40,0 } , for satisfying the boundary conditions ρ , t 1 ,   ρ + , t 0 . For different values of t , the dislocation density distribution is given in Figure 17 below.

8.2. Combined Gradient-Stochastic Dislocation Evolution

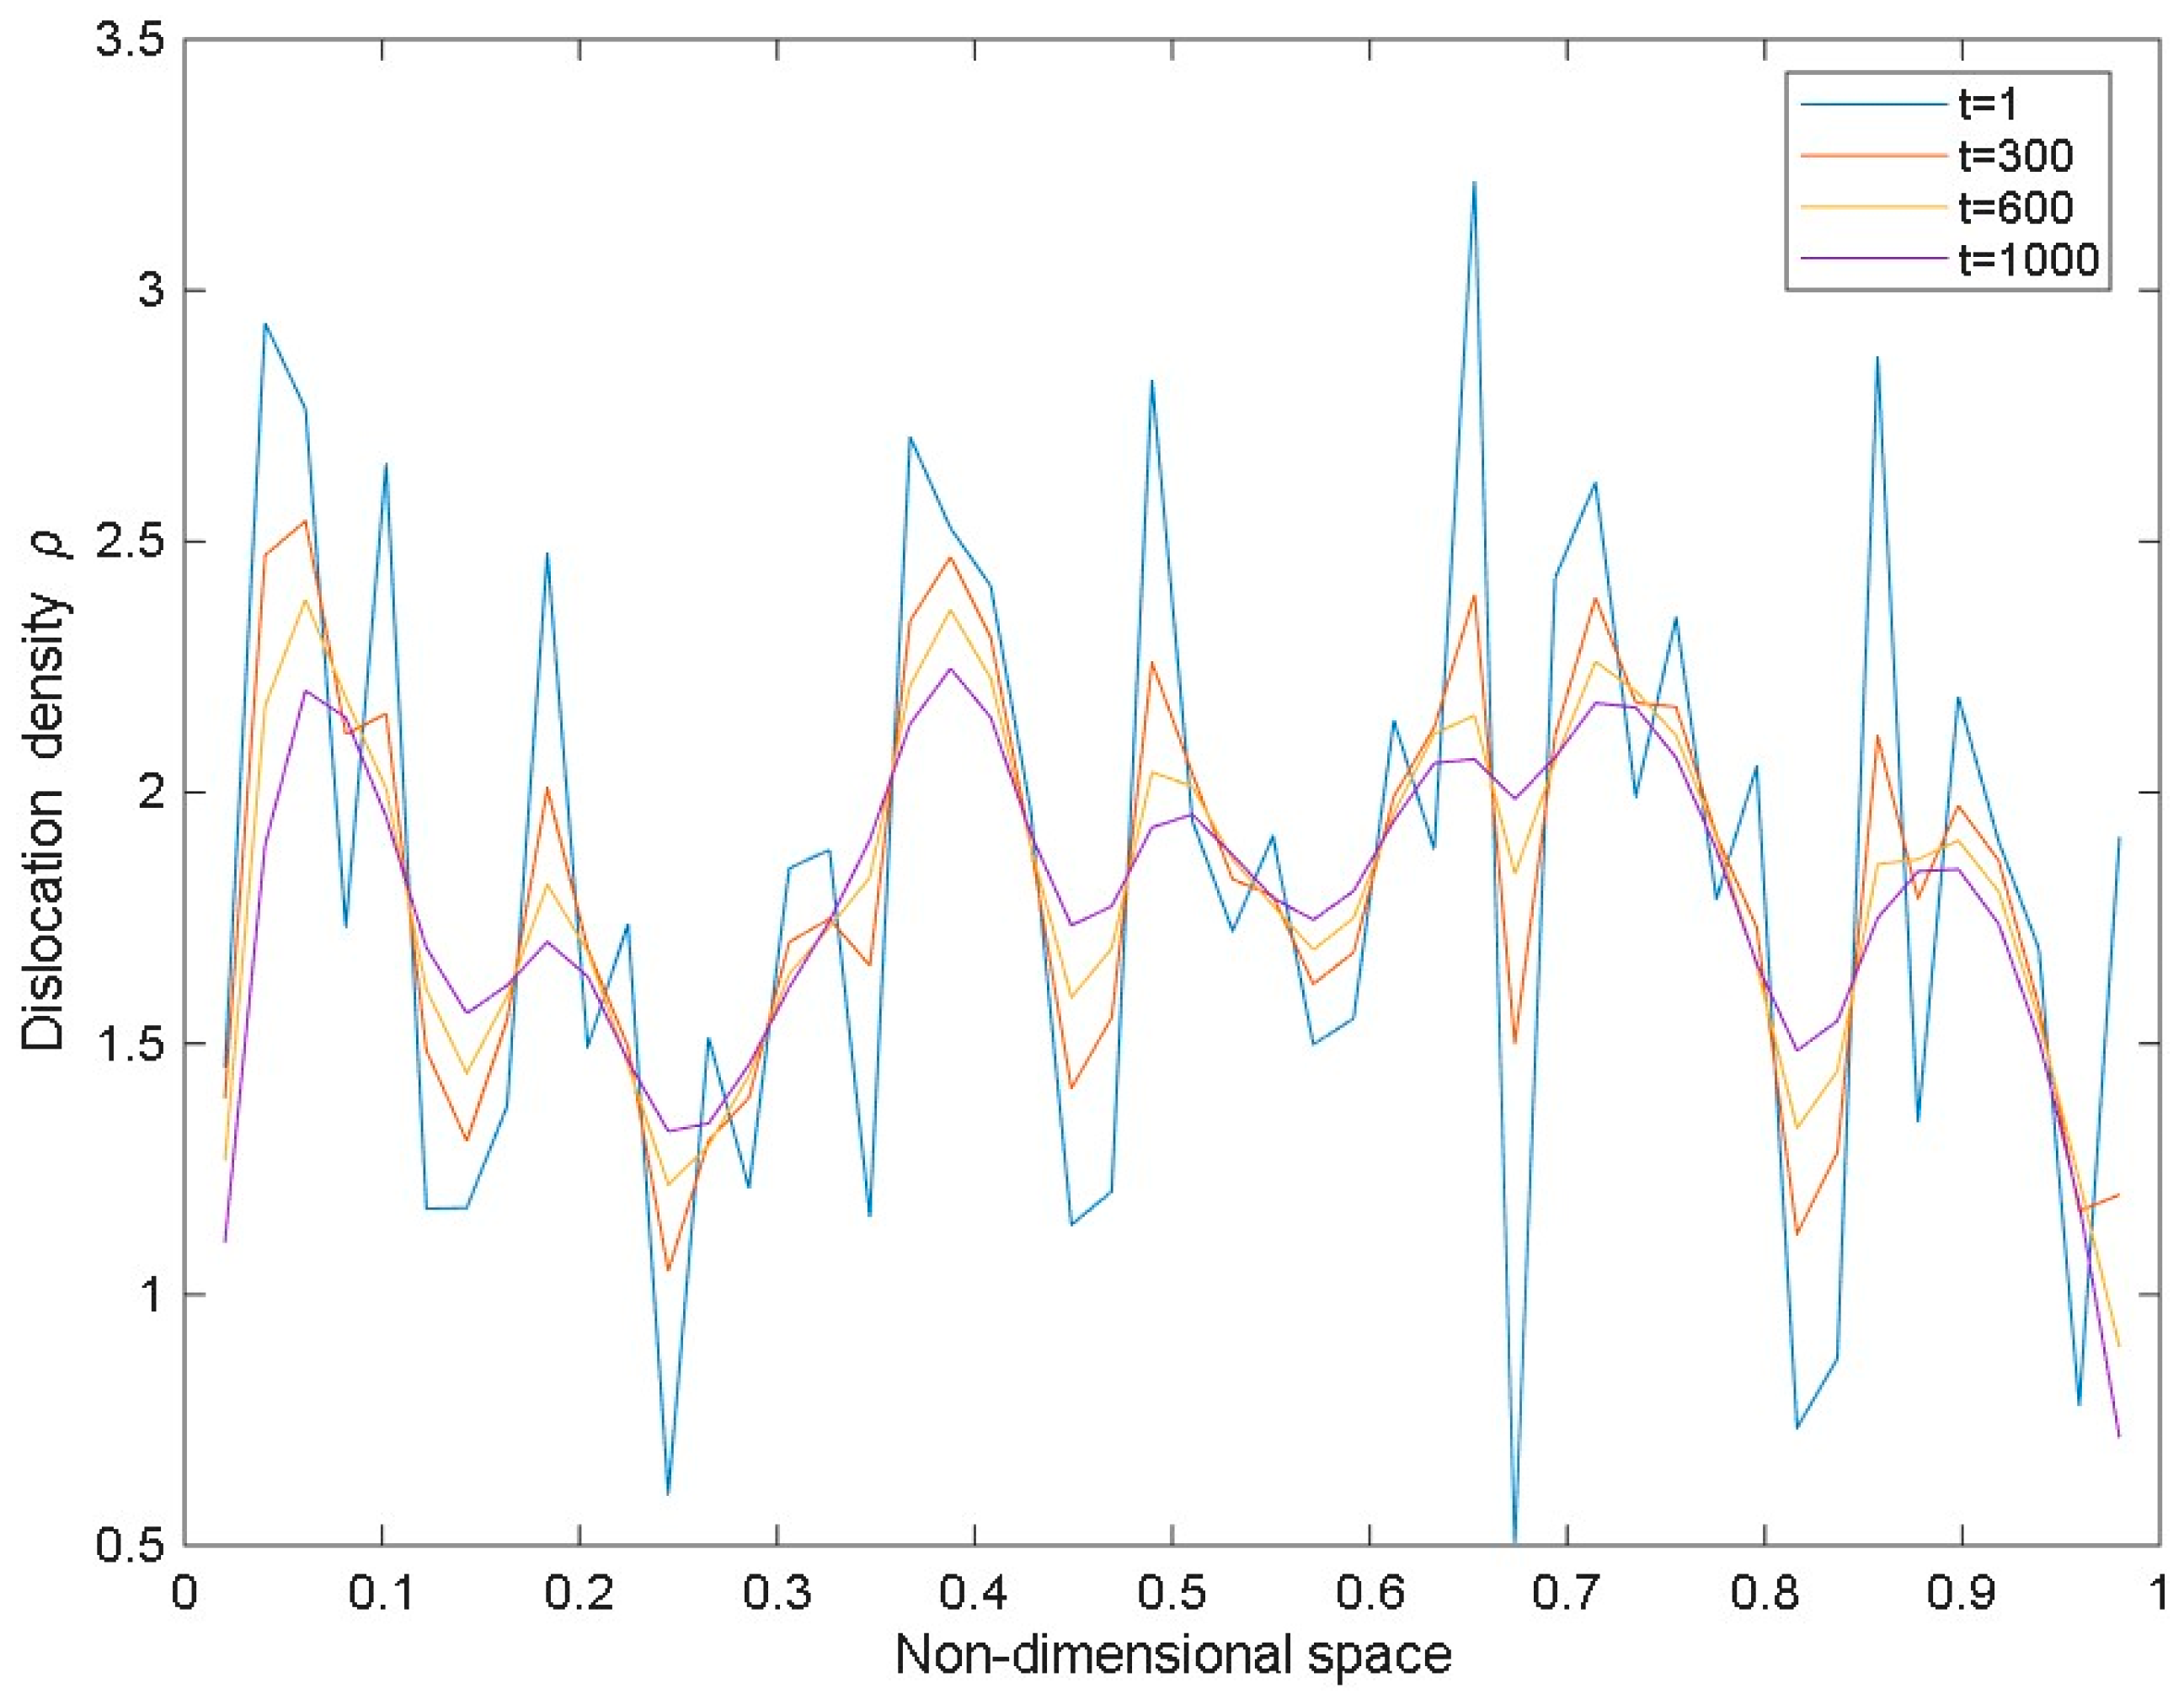
Randomness can enter the formulation in three ways: (A) by assuming a random initial dislocation density distribution in the 1D space; (B) by assuming a random g ρ function; or by solving stochastic differential equations (see Section 8.3), i.e., assuming that an external noise term n ρ , t   is added in the r.h.s., modeling any ambiguities, changing the local density of dislocations at each time step.
(A) Random initial dislocation density distribution: We assume that the initial dislocation density spatial distribution ρ i n i t x is random having the form ρ i n i t x = ρ ¯ + δ , with δ being a small random parameter following a Weibull distribution, the values of the shape κ and scale λ parameters of which are controlling its probability density function P D F δ = κ / λ δ / λ κ 1 e δ / λ κ   , mean δ ¯ = λ   Γ 1 + 1 / κ   and variance δ 2 = λ 2   Γ 1 + 2 / κ δ ¯ 2   .
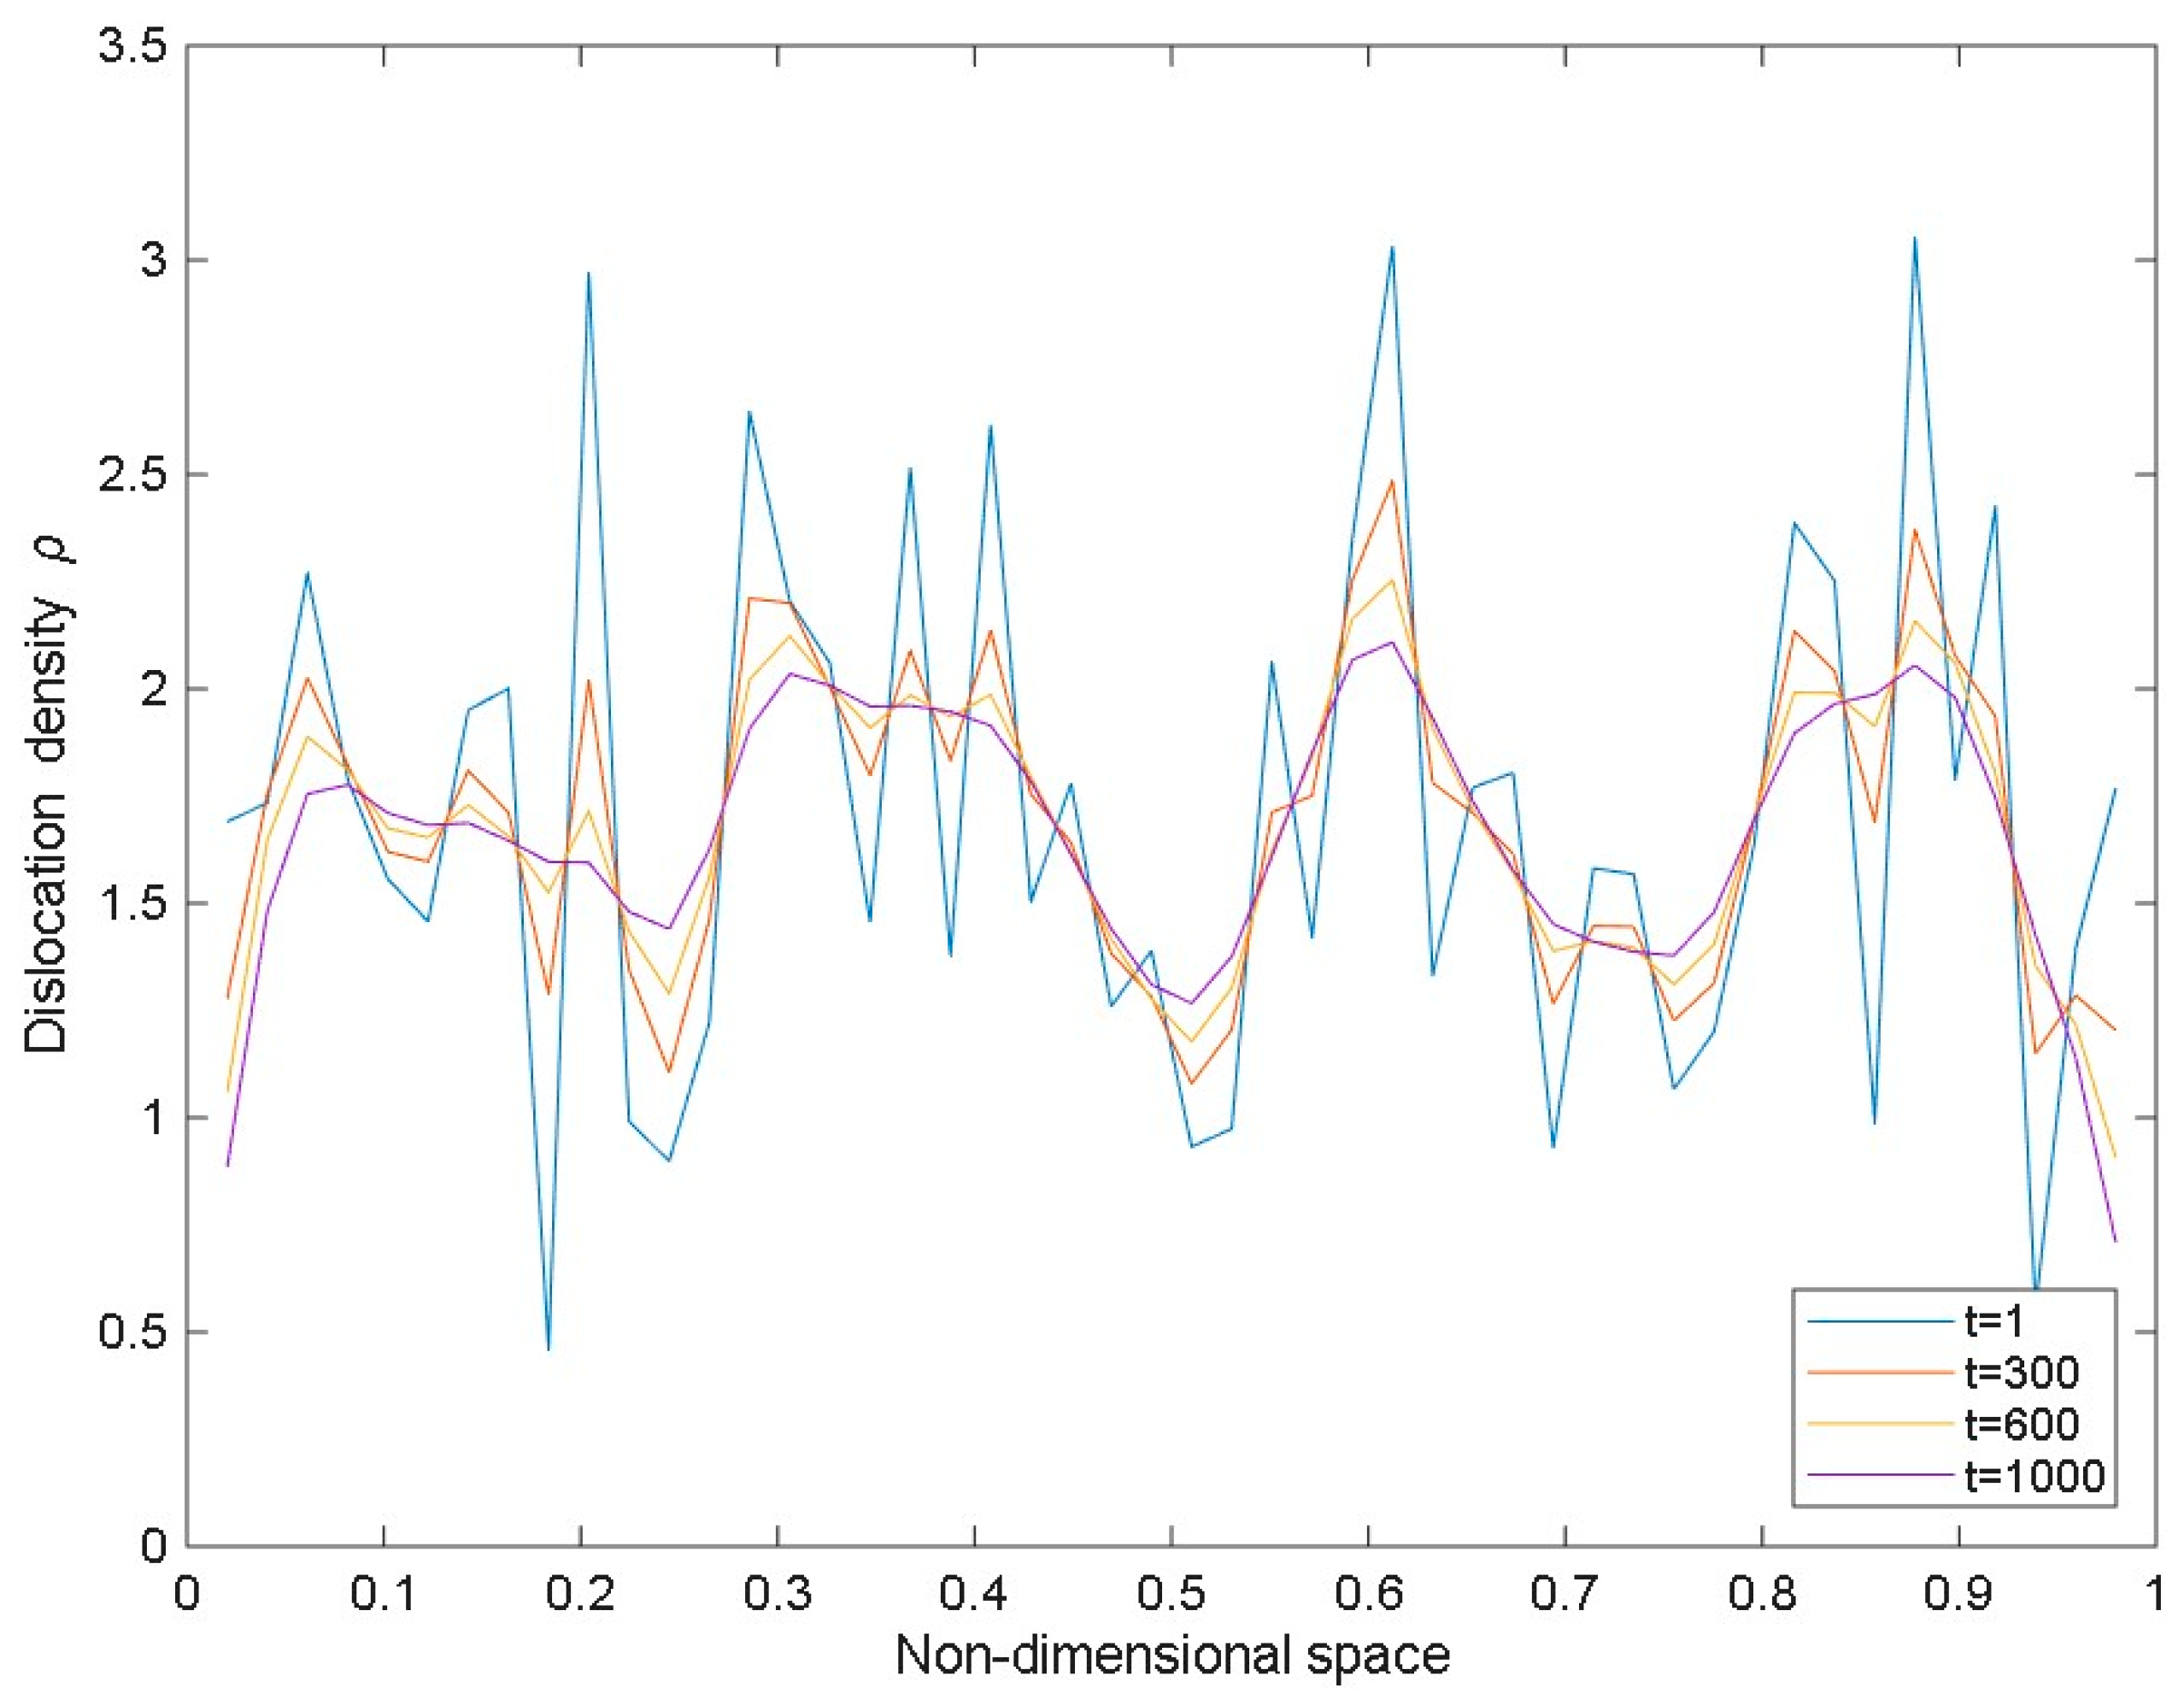
A realization of the numerical solution of Equation (31) was performed using a Weibull distribution with κ = 3 , λ = 2 , i.e., a distribution with a mean ρ ¯ = 1.786 and a variance δ = 0.4213 , and A = 1 ,   B = 1.2 ,   C = 0.2 . In Figure 18, it is shown that the dislocation density spatial distribution becomes less irregular with simulation time.
(B) Random g ρ function: In this case, the g ρ function is assumed to have the form g ρ = 1 + δ g ρ , with δ being a small random parameter following a Weibull distribution. A realization of the numerical solution of Equation (31) was performed using a Weibull distribution with κ = 3 , λ = 2 , i.e., a distribution with a mean ρ ¯ = 1.786 and a variance δ = 0.4213 , and A = 1 ,   B = 1.2 ,   C = 0.2 . In Figure 19, it is again shown that the dislocation density spatial distribution becomes less irregular with simulation time.

8.3. Stochastic Differential Equations

The model of Equation (32) has a saddle node bifurcation in two scenarios: (a) v = 0   &   C < 0 , (b) v = 0   &   C = B 2 / 4 A . For v 2 < 4 C , there is also a Hopf bifurcation. A key question that we are addressing in this study is to understand how the presence of the Laplacian term (diffusion) shifts these bifurcation points. To do this, we will need to compare f z vs. z   ( = x v t ) for diffusion constant D being equal to 0 ,   1 ,   D 1 ,   D 2 ,   D 3 , where D 1 ,   D 2 ,   D 3 are non-zero values. We need to enforce the two saddle-node bifurcation conditions as above and the Hopf bifurcation separately to understand whether a non-zero D shifts or even destroys these fixed points.
The first that we will study is an additive polynomial noise of the Ito type (e.g., [43]):
ρ ˙ = A ρ 3 + B ρ 2 + C ρ + D ρ x x + η ρ , t ,
and
η x , t η x , t = 2 D 0   δ x x δ t t .
The reason for this specific choice of the nonlinearity in the noise is to ascertain the possible presence of Hopf-type instabilities. To calculate the Fokker–Planck equation corresponding to this Langevin model, we follow the steps below:
Δ ρ Δ t = D   2 ρ + ψ ρ +   η x , t ,
where ψ ( ρ ) = A ρ 3 + B ρ 2 + C ρ .
This gives Δ ρ = D 2 ρ Δ t + ψ ρ Δ t + t t + Δ t d τ ( x , τ ) , leading to
< Δ ρ > = [ D   2 ρ Δ t + ψ ρ ] Δ t ,   i . e . , < Δ ρ > Δ t = D 2 ρ + ψ ρ .
To calculate the second moment, we proceed as follows:
< Δ ρ 2 >   =   < D   2 ρ Δ t + ψ ρ Δ t +   t t + Δ t η x , τ d τ > , or ,   < Δ ρ 2 >   = < t t + Δ t d τ 1   t t + Δ t d τ 2 < η x , τ 1 η x , τ 2 > = 2 D 0   Δ t ,
From the Kramer–Moyal expansion, where P ( ρ ,   x , t ) is the probability density function corresponding to the Langevin model in Equation (38), we obtain
P ( ρ , t ) t = ρ A 1 ρ P ρ , t + 2 ρ 2 A 2 ρ P ρ , t ,
where
A 1 ρ = L i m Δ t 0   < Δ ρ > Δ t   and   A 2 ρ = L i m Δ t 0   < Δ ρ 2 > Δ t .
Substituting Equations (40) and (41) in Equation (43), we get
P ( ρ , t ) t = ρ D 2 ρ + ψ ρ P ρ , t + D 0   2 P ρ 2 ,
or
P ( ρ , t ) t = D 2 δ x x ρ ψ ρ P ρ , t + D 0   2 P ρ 2 .
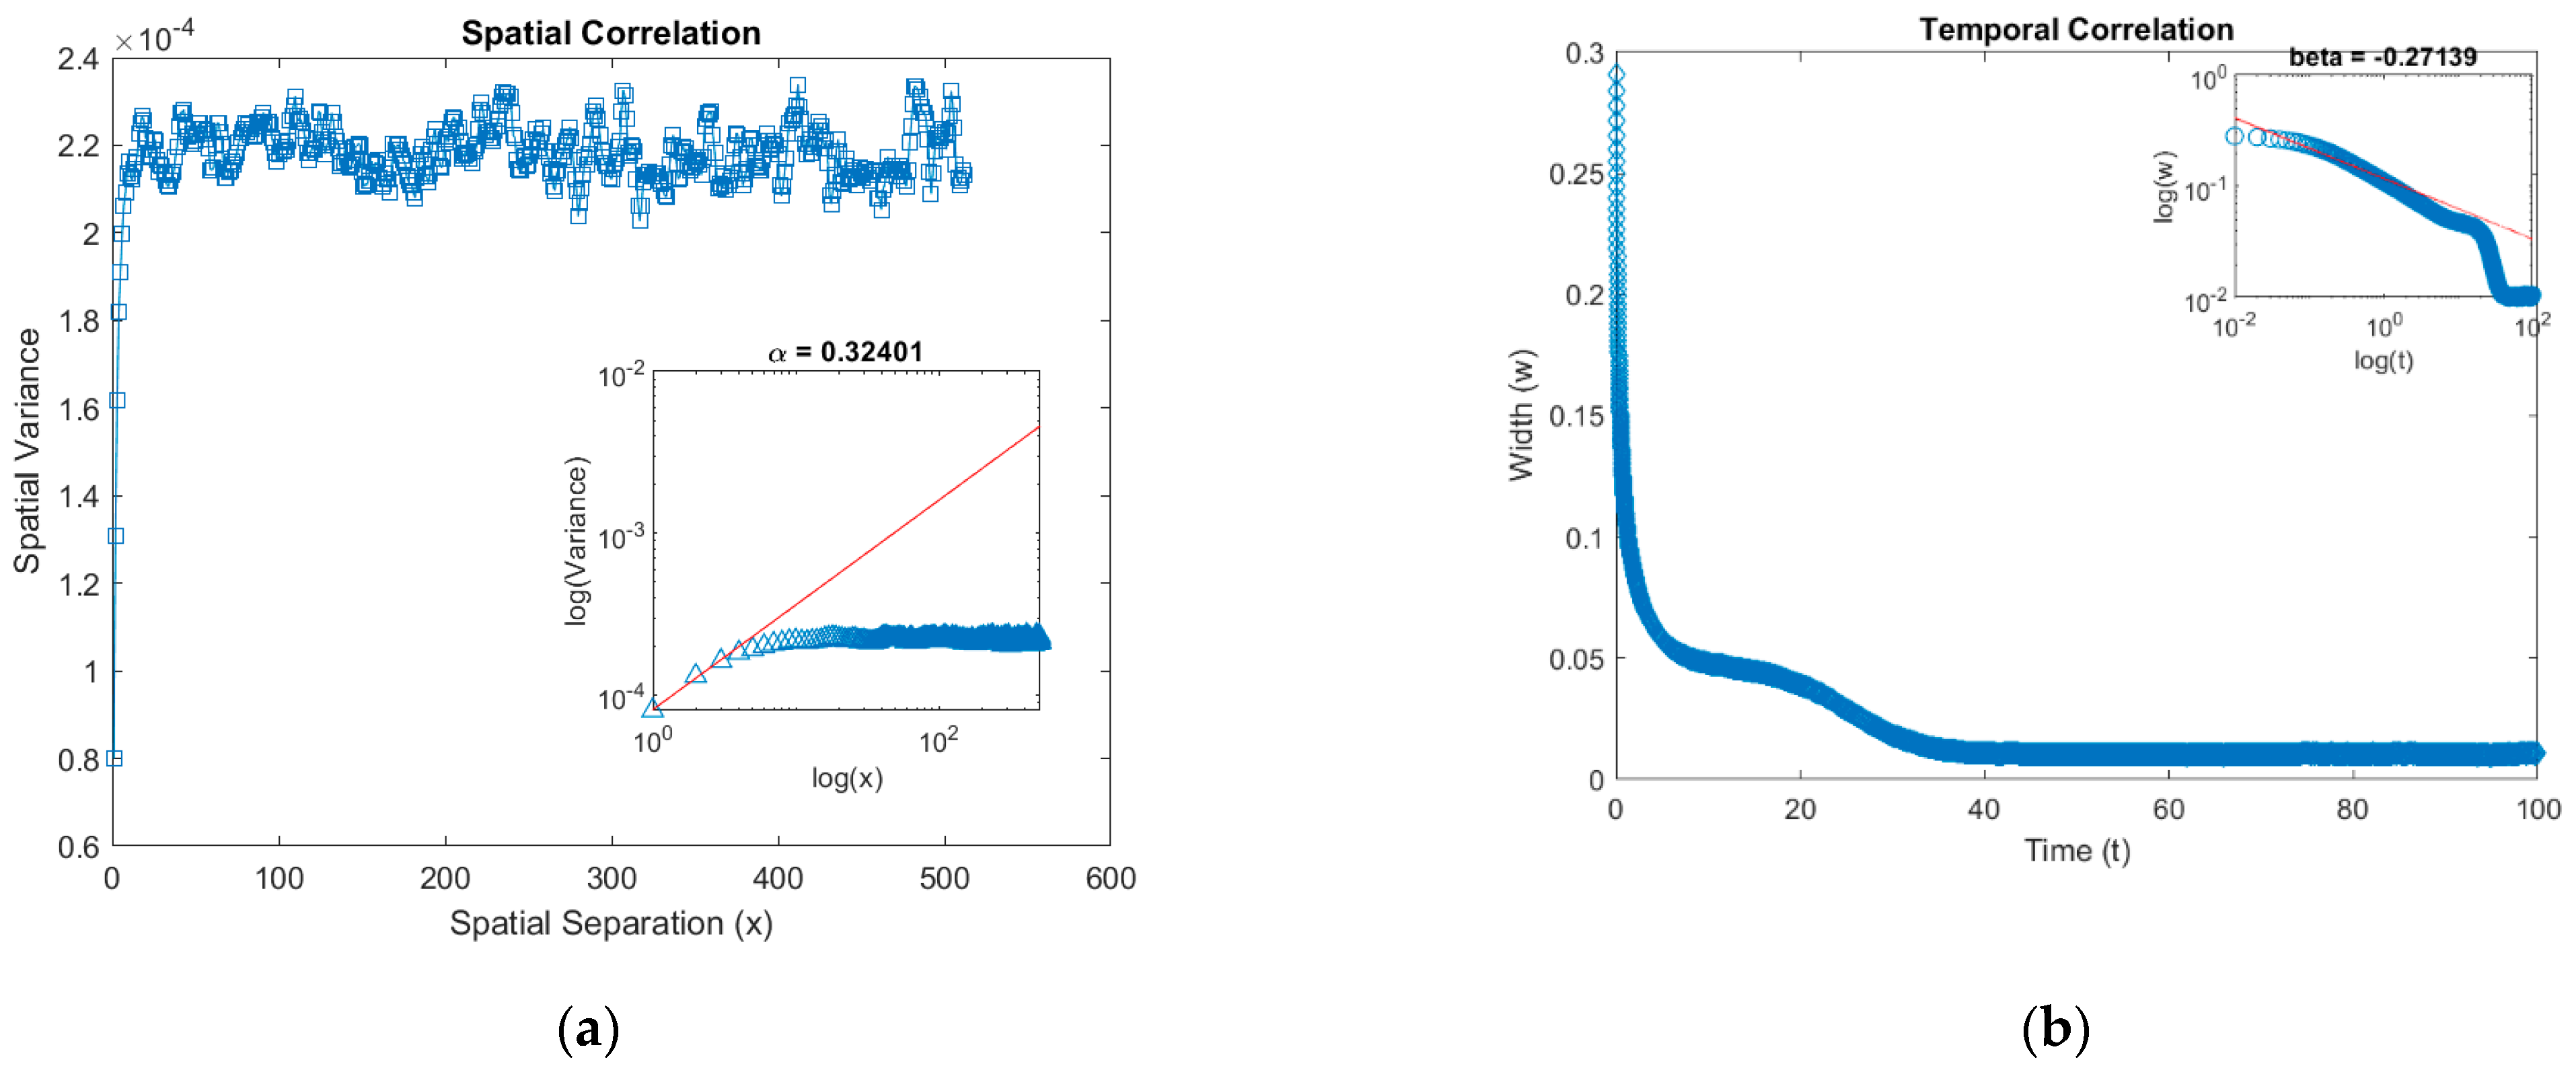
To numerically solve Equation (38), we must remember that since this is a stochastic equation, the quantities of interest are the spatial and temporal correlation functions and any hidden scaling thereof that may point to multifractality.
The spatial height-height correlation function is given by
C s r , t = <   ρ x + r , t ρ x , t 2 > r 2 α
for distances r smaller than the correlation length ξ t t 1 / z , where α is the roughness exponent and z is the dynamic exponent. On the other hand, the temporal correlation function is given by
C t τ = <   ρ x , t + τ ρ x , t 2 > τ 2 β ,
where β is the growth exponent.
Using, for illustrative purposes, A = 1 ,   B = 0.8 ,   C = 0.2 , the spatial and temporal correlation functions can be calculated and are shown in Figure 20 below, where a roughness exponent α 1 / 3   is found, confirming multifractality.
In conclusion, we note that self-organization in metals and alloys across scales is currently revealed and characterized by advanced mechanical testing, acoustical, and optical techniques with precision and detail not previously possible. As an example, we refer to 2 recent publications by Lebyodkin and co-workers [44,45]. In particular, as quoted in [44], “The influence of the surface pre-deformation on jerky flow caused by the Portevin-Le Chatelier (PLC) effect was investigated using flat tensile specimens of an Al-Mg alloy. Although jerky flow represents a macroscopic plastic instability, the underlying mechanisms stem from the self-organization of dislocations, which pertains to deformation processes at mesoscopic scales. To provide a comprehensive approach, the investigation was carried out by coupling tensile tests, digital image correlation, and acoustic emission techniques, each targeting a particular range of scales.” And as quoted in [45] “The concept of a smooth and homogeneous plastic flow of solids is nowadays constantly challenged by various observations of the self-organization of crystal defects on mesoscopic scales pertaining, e.g., to acoustic emission or the evolution of the local strain field. Such investigations would be of particular interest for High-Entropy Alloys (HEAs) characterized by extremely complex microstructures.”
Even though not directly relevant to the results presented in earlier sections, it is pointed out that cellular automata and self-similarity were dealt with, among others, by Beyhgelzimer [46] and Toth [47]. The same holds for Estrin and co-workers’ [48] effort to bring the idea of turbulent flow in fluids to highly deformed solids, i.e., by expanding on an old statement by several pioneers in the field that plasticity in metals may be viewed as the turbulence in fluids. In fact, a mathematical proposal within the ILG framework showing some analogies of the governing equations describing turbulent-like locally induced heterogeneity between highly deforming solids and rapidly moving fluids can be found in a recent article by Aifantis [17]. The proposed model equations are slightly more general and easily obtainable than the higher-order Navier–Stokes equations obtained in a more formal and elaborate way within a rigorous continuum mechanics framework by Fried and Gurtin [49].
Finally, we note that the aforementioned model equations for self-organization in plasticity may need to incorporate additional effects of micro/nano structure evolution related, for example, to temperature variations and stacking fault energy. In fact, temperature effects on the W-A model of PSBs were discussed by Walgraef and Aifantis [50]. As far as the influence of stacking fault energy is concerned, it is noted that such effects are not pronounced just in severe plastic deformation (e.g., [51,52]), but also in self-organization and self-similarity in other material classes, in particular granular media exhibiting “thermodynamic-like” transitions to a new universality class. [A temperature-like quantity may be defined here in terms of kinetics and disorder in granules.]
Further details of current and future value for understanding and controlling self-organization and pattern formation in traditional and novel materials can be found in references [53,54,55,56,57,58,59,60,61,62,63] and bibliography quoted therein.

Author Contributions

Conceptualization, E.C.A.; Methodology, A.K., K.S., A.C. and E.C.A.; Software, A.K., K.S. and A.C.; Validation, A.K., K.S., A.C. and E.C.A.; Formal analysis, E.C.A.; Data curation, A.K., K.S. and A.C.; Writing—original draft, E.C.A.; Writing—review & editing, A.K., K.S., A.C. and E.C.A.; Supervision, E.C.A.; Project administration, E.C.A.; Funding acquisition, E.C.A. All authors have read and agreed to the published version of the manuscript.

Funding

This research was co-funded by the Stavros Niarchos Foundation (SNF) and the Hellenic Foundation for Research and Innovation (H.F.R.I.) under the 5th Call of “Science and Society” Action, Always strive for excellence—Theodoros Papazoglou” (Project Number: 28085).

Data Availability Statement

The original contributions presented in this study are included in the article. Further inquiries can be directed to the corresponding author.

Acknowledgments

The article was finalized during the period 26 May–3 June 2025, when Katerina Aifantis defended in the highest Hellenic Court of Thessaloniki the arrangements of ECA’s Lab to invite for short periods non-Greek researchers of international stature to work in her ERC Starting Grant MINATRAN (Probing the Micro-Nano Transition: Theoretical and Experimental Foundations, Simulations and Applications, No. 211166, 2008–2013; ~1.13 million Euros). The Court’s decision was unanimous in favor of the Lab’s arrangements, dismissing potential difficulties raised by the Aristotle University Research Committee (ELKE) through its President Kyros Yakinthos and its legal representative, disallowing their participation in the hearing. The paper would not have been submitted in time by 15 June 2025, without the Court’s favorable ruling for the Lab decision—another case that the Law supports science to overcome the drawbacks of administration.

Conflicts of Interest

The authors declare no conflicts of interest.

References

  1. Aifantis, E.C. The physics of plastic deformation. Int. J. Plast. 1987, 3, 211–247. [Google Scholar] [CrossRef]
  2. Aifantis, E.C. On the role of gradients in the localization of deformation and fracture. Int. J. Eng. Sci. 1992, 30, 1279–1299. [Google Scholar] [CrossRef]
  3. Aifantis, E.C. Pattern formation in plasticity. Int. J. Eng. Sci. 1995, 33, 2161–2178. [Google Scholar] [CrossRef]
  4. Aifantis, E.C. Gradient deformation models and nano, micro, and macro scales. J. Eng. Mater. Technol. 1999, 121, 189–202. [Google Scholar] [CrossRef]
  5. Aifantis, E.C. Update on a class of gradient theories. Mech. Mater. 2003, 35, 259–280. [Google Scholar] [CrossRef]
  6. Avlonitis, M.; Ioannidou, T.; Frantziskonis, G.; Aifantis, E.C. Statistical aspects of gradient theory. J. Mech. Behav. Mater. 2001, 12, 77–84. [Google Scholar] [CrossRef]
  7. Aifantis, E.C. Deformation and failure of bulk nanograined and ultrafine-grained materials. Mater. Sci. Eng. A 2009, 503, 190–197. [Google Scholar] [CrossRef]
  8. Aifantis, E.C. Internal length gradient (ILG) material mechanics across scales and disciplines. In Advances in Applied Mechanics; ScienceDirect: Amsterdam, The Netherlands, 2016; Volume 49, pp. 1–110. [Google Scholar]
  9. Konstantinidis, A.A.; Aifantis, K.E.; De Hosson, J.T.M. Capturing the stochastic mechanical behavior of micro and nanopillars. Mater. Sci. Eng. A 2014, 597, 89–94. [Google Scholar] [CrossRef]
  10. Zhang, X.; Aifantis, K.E. Interpreting strain bursts and size effects in micropillars using gradient plasticity. Mater. Sci. Eng. A 2011, 528, 5036–5043. [Google Scholar] [CrossRef]
  11. Konstantinidis, A.A.; Zhang, X.; Aifantis, E.C. On the combined gradient-stochastic plasticity model: Application to Mo-micropillar compression. AIP Conf. Proc. 2015, 1646, 3–9. [Google Scholar]
  12. Dimiduk, D.M.; Uchic, M.D.; Parthasarathy, T.A. Size-affected single-slip behavior of pure nickel microcrystals. Acta Mater. 2005, 53, 4065–4077. [Google Scholar] [CrossRef]
  13. Tsallis, C. Possible generalization of Boltzmann-Gibbs statistics. J. Stat. Phys. 1988, 52, 479–487. [Google Scholar] [CrossRef]
  14. Zaiser, M.; Schwerdtfeger, J.; Schneider, A.S.; Frick, C.P.; Clark, B.G.; Gruber, P.A.; Arzt, E. Strain bursts in plastically deforming molybdenum micro- and nanopillars. Phil. Mag. 2008, 28, 3861–3874. [Google Scholar] [CrossRef]
  15. Rizzardi, Q.; Sparks, G.; Maass, R. Fast slip velocity in a high-entropy alloy. JOM 2018, 70, 1088–1093. [Google Scholar] [CrossRef]
  16. McClintock, F.A.; Argon, A.S. Mechanical Behavior of Materials; Addison-Wesley Publishing Company: Boston, MA, USA, 1966. [Google Scholar]
  17. Aifantis, E.C. Gradient Extension of Classical Material Models: From Nuclear & Condensed Matter Scales to Earth & Cosmological Scales. In Size-Dependent Continuum Mechanics Approaches; Springer Tracts in Mechanical Engineering; Ghavanloo, E., Fazelzadeh, S.A., Marotti de Sciarra, F., Eds.; Springer: Cham, Switzerland, 2021; pp. 417–452. [Google Scholar]
  18. Gurevich, A.V.; Pitaevskii, L.P. Averaged description of waves in the Korteweg-de Vries-Burgers equation. Sov. Phys. JETP 1987, 66, 490–495. [Google Scholar]
  19. Walgraef, D.; Aifantis, E.C. Dislocation patterning in fatigued metals as a result of dynamical instabilities. J. Appl. Phys. 1985, 58, 688–691. [Google Scholar] [CrossRef]
  20. Xu, J.; Zhang, G.P. Effects of grain size and initial immobile dislocation density on fatigue behavior of polycrystalline metals. Mater. Sci. Eng. A 2014, 590, 194–198. [Google Scholar] [CrossRef]
  21. Ord, A.; Hobbs, B. Patterns in our planet: Defining new concepts for the application of multi-scale non-equilibrium thermodynamics to Earth-system science. Philos. Trans. R. Soc. A 2010, 368, 3–8. [Google Scholar] [CrossRef] [PubMed]
  22. Kubin, L.P.; Lepinoux, J. The dynamic organization of dislocation structures. In Proceedings of the 8th International Conference on the Strength of Metals and Alloys, Tampere, Finland, 22–26 August 1988; Kettunen, P.O., Lepistö, T.K., Lehtonen, M.E., Eds.; Pergamon Press: Elmsford, NY, USA, 1988; Volume 1, pp. 35–59. [Google Scholar]
  23. Rhee, M.; Zbib, H.M.; Hirth, J.P.; Huang, H.; de la Rubia, T.D. Models for long/short range interactions in 3D dislocation simulation. Model. Simul. Mater. Sci. Eng. 1998, 6, 467–492. [Google Scholar] [CrossRef]
  24. Groma, I.; Csikor, F.F.; Zaiser, M. Spatial correlations and higher-order gradient terms in a continuum description of dislocation dynamics. Acta Mater. 2003, 51, 1271–1281. [Google Scholar] [CrossRef]
  25. Sandfeld, S.; Hochrainer, T.; Zaiser, M.; Gumbsch, P. Continuum modeling of dislocation plasticity: Theory, numerical implementation, and validation by discrete dislocation simulations. J. Mater. Res. 2011, 26, 623–632. [Google Scholar] [CrossRef]
  26. Glazov, M.; Llanes, L.M.; Laird, C. Self-organized dislocation structures (SODS) in fatigued metals. Phys. Status Solidi A 1995, 149, 297–321. [Google Scholar] [CrossRef]
  27. Spiliotis, K.G.; Russo, L.; Siettos, C.; Aifantis, E.C. Analytical and numerical bifurcation analysis of dislocation pattern formation of the Walgraef–Aifantis model. Int. J. Non-Linear Mech. 2018, 102, 41–52. [Google Scholar] [CrossRef]
  28. Kuznetsov, Y. Elements of Applied Bifurcation Theory; Springer: New York, NY, USA, 2000. [Google Scholar]
  29. Seydel, R. Practical Bifurcation and Stability Analysis; Springer: New York, NY, USA, 2010. [Google Scholar]
  30. Theodoropoulos, C.; Qian, Y.; Kevrekidis, I.G. “Coarse” stability and bifurcation analysis using time-steppers: A reaction-diffusion example. Proc. Natl. Acad. Sci. USA 2000, 97, 9840–9843. [Google Scholar] [CrossRef]
  31. Van Leemput, P.; Lust, K.W.; Kevrekidis, I.G. Coarse-grained numerical bifurcation analysis of lattice Boltzmann models. Phys. D 2005, 210, 58–76. [Google Scholar] [CrossRef][Green Version]
  32. Bhatnagar, P.L.; Gross, E.P.; Krook, M. A model for collision processes in gases. I. Small amplitude processes in charged and neutral one-component systems. Phys. Rev. 1954, 94, 511–525. [Google Scholar] [CrossRef]
  33. Gardiner, G.W. Handbook of Stochastic Methods for Physics, Chemistry, and the Natural Sciences; Springer: New York, NY, USA, 1983. [Google Scholar]
  34. Gulluoglu, A.N.; Srolovitz, D.J.; LeSar, R.; Lomdahl, P.S. Dislocation distributions in two dimensions. Scr. Metall. 1989, 23, 1347–1352. [Google Scholar] [CrossRef]
  35. LeSar, R. Introduction to Computational Materials Science: Fundamentals to Applications; Cambridge Univ. Press: Cambridge, UK, 2013. [Google Scholar]
  36. Coifman, R.; Kevrekidis, I.; Lafon, S.; Maggioni, M.; Nadler, B. Diffusion Maps, Reduction Coordinates, and Low Dimensional Representation of Stochastic Systems. Multiscale Model. Simul. 2008, 7, 842–864. [Google Scholar] [CrossRef]
  37. Tsallis, C. Introduction to Nonextensive Statistical Mechanics: Approaching A Complex World; Springer: Berlin, Germany, 2009. [Google Scholar]
  38. Iliopoulos, A.C.; Aifantis, E.C. Tsallis q-triplet, intermittent turbulence and Portevin–Le Chatelier effect. Phys. A 2018, 498, 17–32. [Google Scholar] [CrossRef]
  39. Morton, G.M. A computer Oriented Geodetic Data Base; and a New Technique in File Sequencing; Technical Report; IBM Ltd.: Ottawa, ON, Canada, 1966. [Google Scholar]
  40. Eddahbi, M.; Monge, M.A.; Muñoz, A.; Pareja, R. Serrated flow in powder metallurgy Al–5%Mg–1.2%Cr alloy processed by equal channel angular pressing. Mater. Charact. 2012, 73, 16–30. [Google Scholar] [CrossRef]
  41. Nagumo, J.; Arimoto, S.; Yoshizawa, S. An active pulse transmission line simulating nerve axon. Proc. IRE 1962, 50, 2061–2070. [Google Scholar] [CrossRef]
  42. Ahouri, R. Travelling Wave Solutions. Master’s Thesis, University of Manchester, Manchester, UK, 2016. [Google Scholar]
  43. Chattopadhyay, A.K.; Aifantis, E.C. Stochastically forced dislocation density distribution in plastic deformation. Phys. Rev. E 2016, 94, 022139. [Google Scholar] [CrossRef]
  44. Jaber, H.; Beausir, B.; Entemeyer, D.; Lebedkina, T.; Novelli, M.; Lebyodkin, M. Influence of surface pre-deformation on the Portevin-Le Chatelier effect and the related multiscale complexity of plastic flow in an Al-Mg alloy. Acta Mater. 2024, 279, 120330. [Google Scholar] [CrossRef]
  45. Brechtl, J.; Feng, R.; Liaw, P.K.; Beausir, B.; Jaber, H.; Lebedkina, T.; Lebyodkin, M. Mesoscopic-scale complexity in macroscopically-uniform plastic flow of an Al0.3CoCrFeNi high-entropy alloy. Acta Mater. 2023, 242, 118445. [Google Scholar] [CrossRef]
  46. Beygelzimer, Y.E.; Spuskanyuk, A.V. The thick yield surface: Idea and approach for investigating its structure. Philos. Mag. A 1999, 79, 2437–2459. [Google Scholar] [CrossRef]
  47. Beygelzimer, Y.; Kulagin, R.; Toth, L.S.; Ivanisenko, Y. The self-similarity theory of high pressure torsion. Beilstein J. Nanotechnol. 2016, 7, 1267–1277. [Google Scholar] [CrossRef]
  48. Beygelzimer, Y.; Filippov, A.; Estrin, Y. ‘Turbulent’ shear flow of solids under high-pressure torsion. Philos. Mag. 2023, 103, 1017–1028. [Google Scholar] [CrossRef]
  49. Fried, E.; Gurtin, M.E. A continuum mechanical theory for turbulence: A generalized Navier–Stokes-α equation with boundary conditions. Theor. Comput. Fluid Dyn. 2008, 22, 433–470. [Google Scholar] [CrossRef]
  50. Walgraef, D.; Aifantis, E.C. Dislocation inhomogeneity in cyclic deformation. In Micromechanics and Inhomogeneity—The Toshio Mura Anniversary Volume; Weng, G.J., Taya, M., Abe, H., Eds.; Springer: Berlin/Heidelberg, Germany, 1990; pp. 511–533. [Google Scholar]
  51. Beygelzimer, Y. Grain refinement versus voids accumulation during severe plastic deformations of polycrystals: Mathematical simulation. Mech. Mater. 2005, 37, 753–767. [Google Scholar] [CrossRef]
  52. An, X.H.; Lin, Q.Y.; Wu, S.D.; Zhang, Z.F.; Figueiredo, R.B.; Gao, N.; Langdon, T.G. The influence of stacking fault energy on the mechanical properties of nanostructured Cu and Cu–Al alloys processed by high-pressure torsion. Scr. Mater. 2011, 64, 954–957. [Google Scholar] [CrossRef]
  53. Olugbade, T.O.; Lu, J. Literature review on the mechanical properties of materials after surface mechanical attrition treatment (SMAT). Nano Mater. Sci. 2020, 2, 3–31. [Google Scholar] [CrossRef]
  54. Lebyodkin, M.A.; Lebedkina, T.A.; Brechtl, J.; Liaw, P.K. Serrated flow in alloy systems. In High-Entropy Materials: Theory, Experiments, and Applications; Brechtl, J., Liaw, P.K., Eds.; Springer International Publishing: Cham, Switzerland, 2021; pp. 523–644. [Google Scholar]
  55. Shibkov, A.A.; Zheltov, M.A.; Gasanov, M.F.; Zolotov, A.E.; Denisov, A.A.; Lebyodkin, M.A. Dynamics of deformation band formation investigated by high-speed techniques during creep in an AlMg alloy. Mater. Sci. Eng. A 2020, 772, 138777. [Google Scholar] [CrossRef]
  56. Hassanpour, H.; Jamaati, R.; Hosseinipour, S.J. Effect of gradient microstructure on the mechanical properties of aluminum alloy. Mater. Charact. 2021, 174, 111023. [Google Scholar] [CrossRef]
  57. Lebyodkin, M.; Bougherira, Y.; Lebedkina, T.; Entemeyer, D. Scaling in the local strain-rate field during jerky flow in an Al-3%Mg alloy. Metals 2020, 10, 134. [Google Scholar] [CrossRef]
  58. Brechtl, J.; Chen, S.; Lee, C.; Shi, Y.; Feng, R.; Xie, X.; Hamblin, D.; Coleman, A.M.; Straka, B.; Shortt, H.; et al. A review of the serrated-flow phenomenon and its role in the deformation behavior of high-entropy alloys. Metals 2020, 10, 1101. [Google Scholar] [CrossRef]
  59. Pan, Q.; Zhang, L.; Feng, R.; Lu, Q.; An, K.; Chuang, A.C.; Poplawsky, J.D.; Liaw, P.K.; Lu, L. Gradient cell–structured high-entropy alloy with exceptional strengthand ductility. Science 2021, 374, 984–989. [Google Scholar] [CrossRef]
  60. Kubin, L.P.; Fressengeas, C.; Ananthakrishna, G. Chapter 57 Collective behaviour of dislocations in plasticity. In Dislocations in Solids; Nabarro, F.R.N., Duesbery, M.S., Eds.; Elsevier: Amsterdam, The Netherlands, 2002; pp. 101–192. [Google Scholar]
  61. Weiss, J.; Richeton, T.; Louchet, F.; Chmelik, F.; Dobron, P.; Entemeyer, D.; Lebyodkin, M.; Lebedkina, T.; Fressengeas, C.; McDonald, R.J. Evidence for universal intermittent crystal plasticity from acoustic emission and high-resolution extensometry experiments. Phys. Rev. B 2007, 76, 224110. [Google Scholar] [CrossRef]
  62. Shibkov, A.A.; Lebyodkin, M.A.; Lebedkina, T.A.; Gasanov, M.F.; Zolotov, A.E.; Denisov, A.A. Millisecond dynamics of deformation bands during discontinuous creep in an AlMg polycrystal. Phys. Rev. E 2020, 102, 043003. [Google Scholar] [CrossRef] [PubMed]
  63. Shashkov, I.V.; Lebyodkin, M.A.; Lebedkina, T.A. Multiscale study of acoustic emission during smooth and jerky flow in an AlMg alloy. Acta Mater. 2020, 60, 6842–6850. [Google Scholar] [CrossRef]
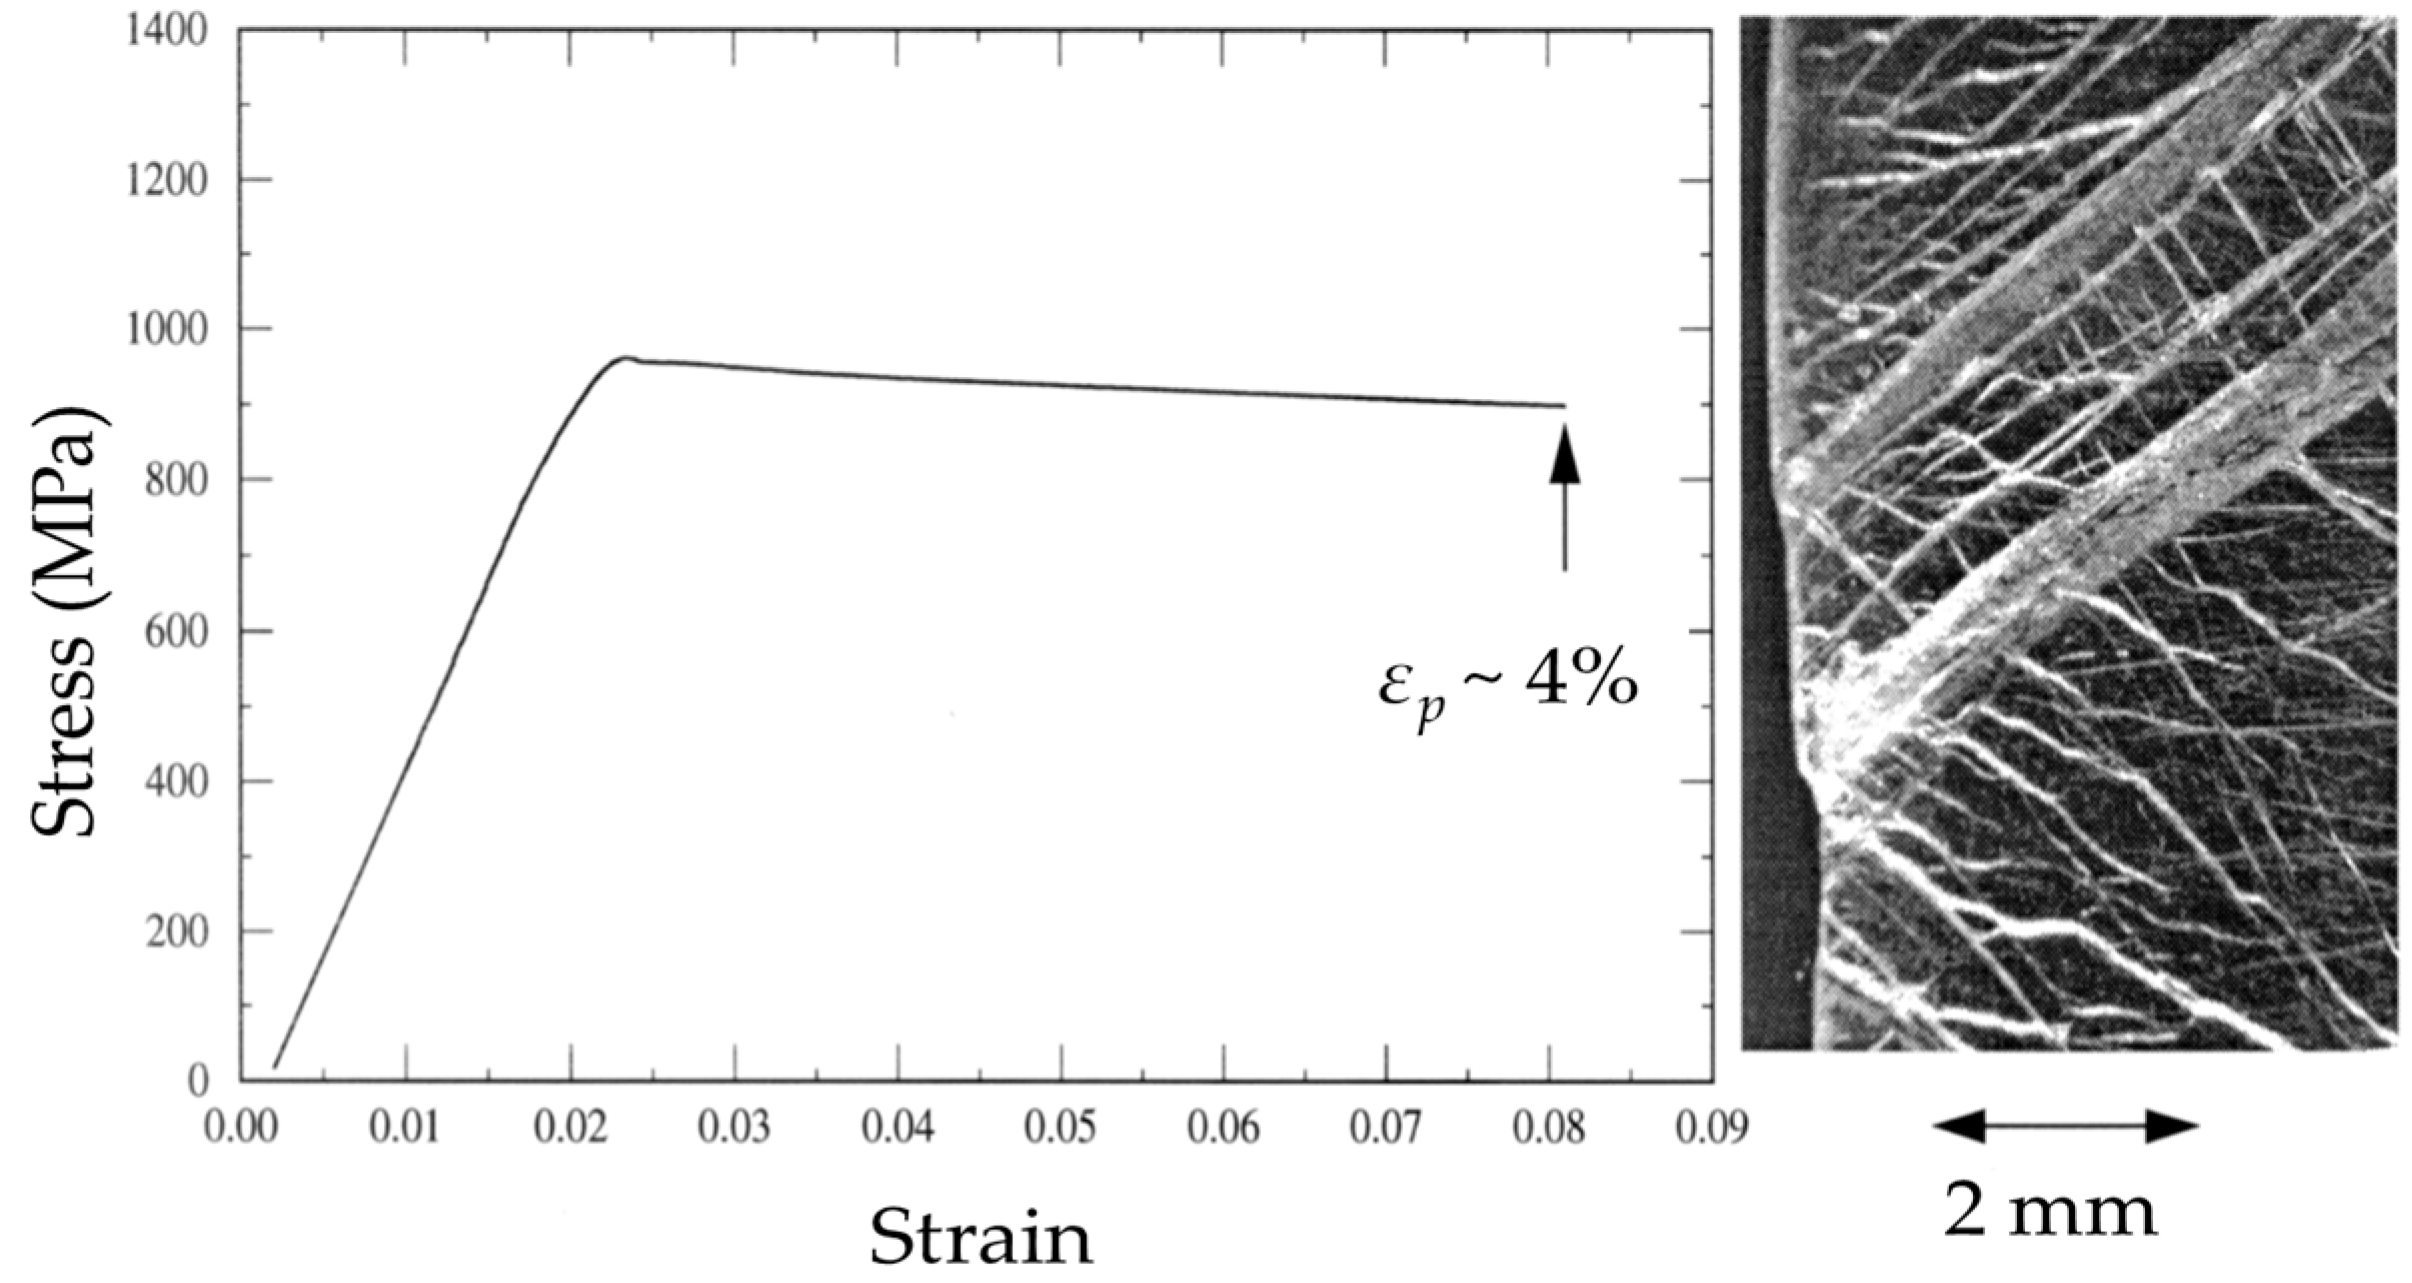
Figure 1. Optical micrograph of the shear-banded 300 nm grain size nanostructured Fe–10 at.% Cu specimen along with the corresponding macroscopic stress–strain curve (under compression). Reprinted with permission from [7]. Copyright 2025 Elsevier.
Metals 15 01006 g001
Figure 2. Cellular automaton simulation results: (ac) snapshots for the shear band pattern at different time steps; (d) nominal stress–strain graph. Reprinted with permission from [7]. Copyright 2025 Elsevier.
Metals 15 01006 g002
Figure 3. Comparison of cellular automata simulations based on Equation (5) (×marked lines) with experimental results [12] for metallic (Ni) micropillar compression specimens. Reprinted with permission from Ref. [9]. Copyright 2025 Elsevier.
Metals 15 01006 g003
Figure 4. Comparison between Mo micropillar compression experiments (Adapted from Ref. [14]) with cellular automata predictions based on Equations (5) and (6).
Metals 15 01006 g004
Figure 5. CCDF of strain bursts in Nb, Au, and Al0:3CoCrFeNi micropillar compression experiments (Adapted from Ref. [15]) fitted by q-exponential distributions.
Metals 15 01006 g005
Figure 6. (a) Lüders strain and strain rate profile; (b) Stress–strain diagram for Lüders band formation in steels with upper σ u and lower σ L yield points: (1) no inflection; (2) partial inflection; (3) complete inflection [see also [16] for (b)].
Metals 15 01006 g006
Figure 7. Portevin Le Chatelier (PLC) bands traveling through a tensile Al-Mg specimen resulting from a non-monotonic stress σ versus strain rate ε ˙ and yielding a step-like stress σ versus strain ε curve.
Metals 15 01006 g007
Figure 8. Dislocation patterns in Copper (Cu) single crystals showing matrix and PSB structures in slip (A) and cross-slip (B) planes – b denotes the Burgers vector. High dislocation density domains correspond to dark regions. Reprinted with permission from Ref. [19]. Copyright 2025 Elsevier.
Metals 15 01006 g008
Figure 9. (a) The β T C as a function of n . Red-filled circle marks the minimum β T n 0 as it results from the characteristic wavelength n 0 . The critical value β T C , which indicates dynamic transitions via the Turing point, and it is defined as the nearest to β T n 0 . (b) The β T C as L 0 . Reprinted with permission from Ref. [27]. Copyright 2025 Elsevier.
Metals 15 01006 g009
Figure 10. Numerical bifurcation analysis: (a) with respect to the shear stress β parameter, (b) with respect to the size of the domain L . Solid (blue) lines correspond to stable steady state branches of solutions, while dashed lines correspond to unstable ones. Filled red circles depict the max and minimum values of stable periodic solutions, while open circles depict the unstable ones. Both cases (a,b) show interesting nonlinear dynamics. Reprinted with permission from Ref. [27]. Copyright 2025 Elsevier.
Metals 15 01006 g010
Figure 11. Profiles of solutions for the immobile dislocations ρ i as the size L increases Reprinted with permission from Ref. [27]. Copyright 2025 Elsevier. The immobile dislocations have a heterogeneous structure, forming walls of high density ρ i . (a) For small specimen size L = 4 ; (bd) For L = 6 , depending on the initial conditions, the dislocations dynamics converge to different ptofiles.
Metals 15 01006 g011
Figure 12. Profiles of immobile and mobile densities resulting from different values of shear parameter β . (a) For small values of β , there is only the homogeneous solution. (b) Simulation for high values of parameter β . The system, after a transient period, converges to a nonhomogeneous solution. Color shows the magnitude of immobile dislocation density.
Metals 15 01006 g012
Figure 13. Diffusion map. The ν 1 (first non-trivial) eigenvector with respect to time.
Metals 15 01006 g013
Figure 14. The underlying dislocation model, resulting from Equation (29). (a) Densities for positive (green curve) and negative (blue curve) dislocations; (b) snapshot of dislocation populations—blue crosses stand for dislocations with positive Burgers vector direction ( s i = 1 ), while red ones for negative.
Metals 15 01006 g014
Figure 15. OM image of microstructure of Al-5Mg-1.2Cr in the homogenized condition, strained up to fracture at a strain rate 10−3 s−1 Reprinted with permission from Ref. [40]. Copyright 2025 Elsevier.
Metals 15 01006 g015
Figure 16. (a) SEM showing the structure of SBs in the homogenized alloy tensile tested at a strain rate of 10−4 s−1. Band fonts propagating along different directions; (b) SEM showing the structure of SBs in the ECAP processed alloy tensile tested at a strain rate of 10−4 s−1 and 300 °C Reprinted with permission from Ref. [40]. Copyright 2025 Elsevier.
Metals 15 01006 g016
Figure 17. Dislocation density wave front predicted from Equation (37) for various values of t, with (a) k = 1 / 2 ,   v = 0.4 / 2 , and (b) k = 1 / 2 ,   v = 0.4 / 2 .
Metals 15 01006 g017
Figure 18. Dislocation density distributions at various time steps with a random initial dislocation density distribution.
Metals 15 01006 g018
Figure 19. Dislocation density distributions at various time steps with a random g ρ function in Equation (31).
Metals 15 01006 g019
Figure 20. Spatial (a) and temporal (b) correlation functions using A = 1 ,   B = 0.8 ,   C = 0.2 in Equations (47) and (48).
Metals 15 01006 g020
Table 1. Summary of results concerning Tsallis statistics and fractal dimension (FD) of images of microstructures and multiple shear bands.
Images of Microstructures and Multiple Shear Bands [40]
q s t a t 1.1031.00341.54771.3151.393
FD2.56452.94092.26422.17582.2187
Disclaimer/Publisher’s Note: The statements, opinions and data contained in all publications are solely those of the individual author(s) and contributor(s) and not of MDPI and/or the editor(s). MDPI and/or the editor(s) disclaim responsibility for any injury to people or property resulting from any ideas, methods, instructions or products referred to in the content.