Article

Investigation on Strain-Forming Limits and Manufacturing Optimization of a Single Deep-Drawing Process Concerning 304 Stainless Steel’s Thin Sheet

1
College of Materials Science and Engineering, Chongqing University, Chongqing 400044, China
2
Ningbo Oulin Kitchenware Co., Ltd., Ningbo 315100, China
3
College of Materials Science and Engineering, Taiyuan University of Science and Technology, Taiyuan 030024, China
*
Author to whom correspondence should be addressed.
Metals 2025, 15(9), 1008; https://doi.org/10.3390/met15091008
Submission received: 27 May 2025 / Revised: 14 August 2025 / Accepted: 26 August 2025 / Published: 10 September 2025

Abstract

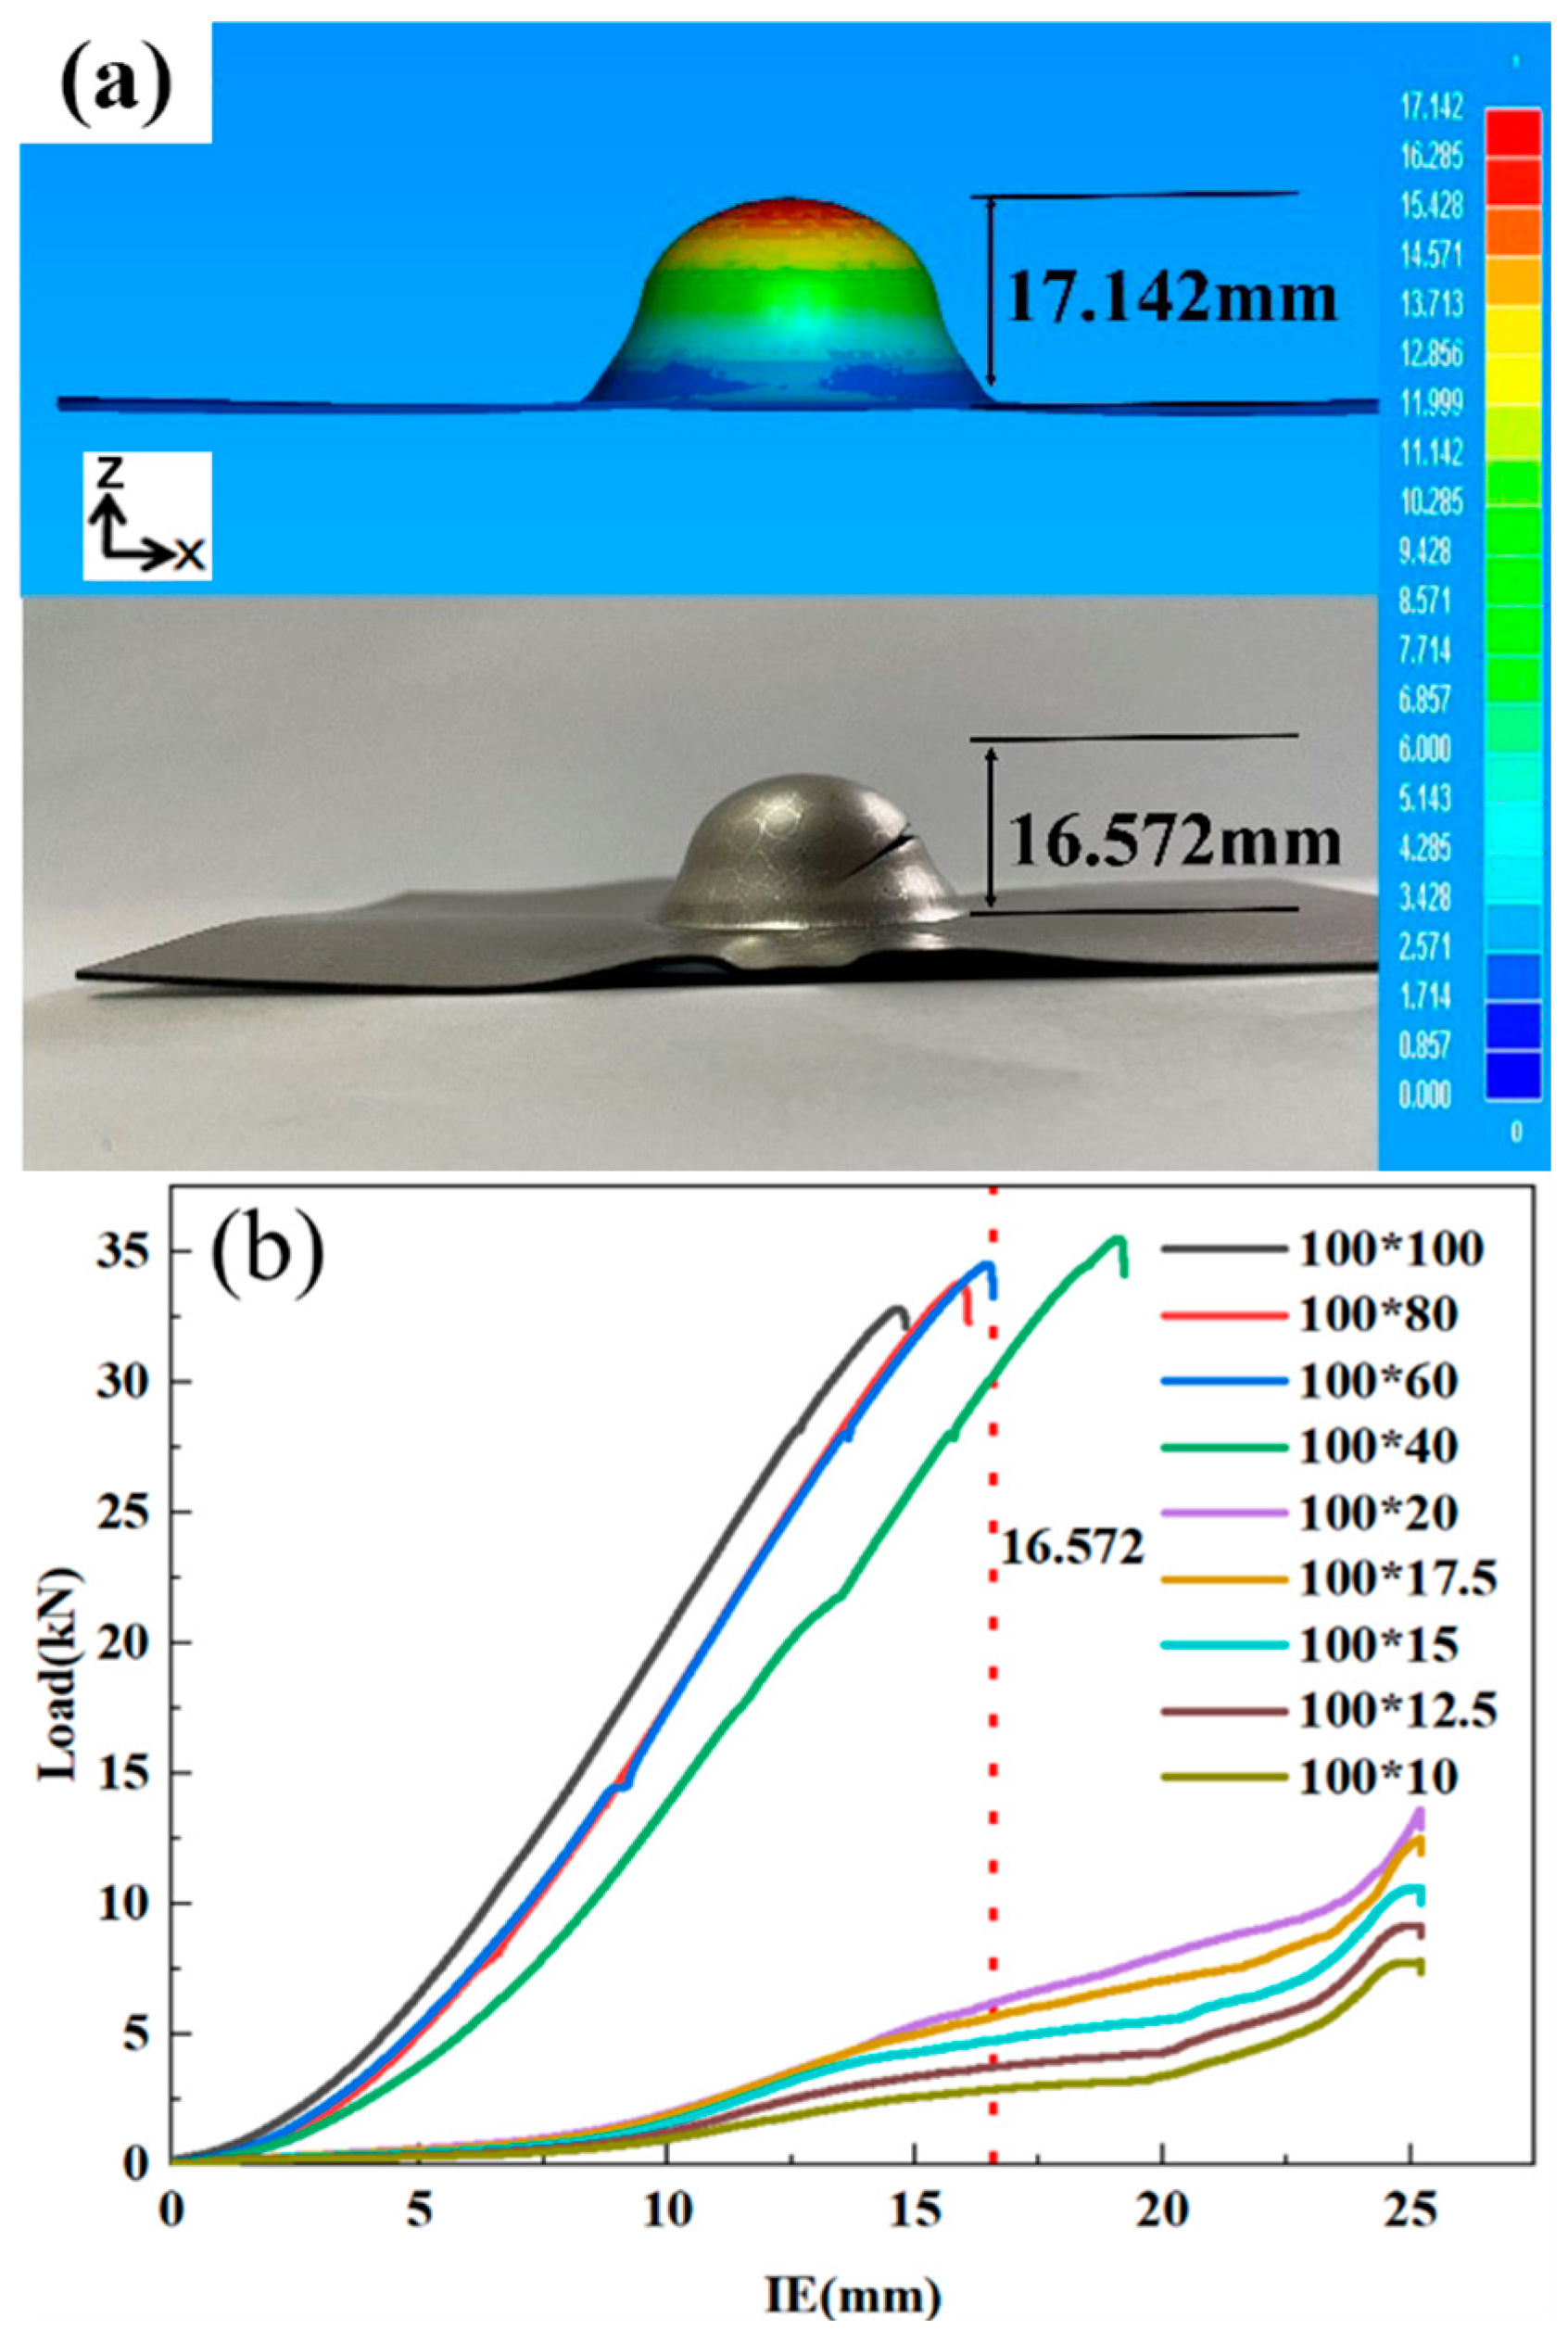
In order to solve the problems of wrinkling, cracking, and springback that occur during the single deep drawing forming process of household stainless steel sinks without annealing, the deep drawing process of thin SUS304 stainless steel was studied using a DYNAFORM numerical simulation and experimental analysis. The uniaxial tensile test results indicate that 304 stainless steel exhibits different levels of plasticity in different directions. The TD direction, which is perpendicular to the rolling direction, has the lowest elongation, which is 11.8% lower than that in the rolling direction. The maximum bulging depth of the thin specimens in the finite element simulation reached 17.142 mm, and the maximum bulging depth of the specimens with cracks in the experiment was 16.572 mm, indicating that the results of the finite element simulation were in good agreement with those of the experiment. Finally, through simulation and experimentation, the optimal process for forming stainless thin steel sinks was obtained when the fillet radius R was 5 mm, the stamping speed was 20 mm/s, the blank holder force was 3 MPa, and the friction coefficient was 0.120.

1. Introduction

Austenitic stainless steel [1] sink is the most common kitchen sink in the family and the most used in life; the main advantages are lightweight, high-temperature resistance, corrosion resistance, beautiful appearance, and diversified modeling, etc., which are well-known kitchens and bathroom brands and the majority of home users favor. The market price of stainless steel sinks varies significantly because of the difference in material and stamping process. With the continuous development of China’s national economy, the demand for stainless steel is increasing daily [2], and mainland China has become an essential international base for preparing and processing stainless steel. However, current research on sheet forming technology focuses on large-scale cover parts [3] and neglects the research on the metal forming of civilian utensils. Generally speaking, the production process of a large-depth sink is divided into two steps: the first step is to deep draw the sink to more than 90% of the final depth; the second step is to shape the first step. In the first step of the process, because the depth of the drawing limit is not enough, it is necessary to add an annealing process in the middle, and then deep draw again, which will consume a lot of time and money. Therefore, the primary solution is to optimize the process of deep drawing the sink to more than 90% of the final depth at one time, eliminate the annealing and re-deep drawing process, and improve economic efficiency [4]. However, the international academic community recognizes the problem of sheet metal forming as an engineering problem. Our main problem is avoiding wrinkling, cracking, and springback during the deep drawing process [5,6,7].
In the process of sheet metal forming, the forming performance is limited by local necking, and it is crucial to know the forming limit of the material. The principal strain (ε1) of the FLD (forming limit diagram) is mainly on the plane of the sheet with the minor strain (ε2), and the forming limit curve (FLC) is drawn to provide a graphical description of the failure of the sheet metal, which represents the maximum strain of the metal sheet without fracture [8,9,10,11]. The sheet metal will only break once it reaches this limit [12,13]. The FLC was determined by methods such as the Keeler test, Hecker test, Marciniak test, Nakazima test, etc.; among all the tests, the Marciniak test and the Nakazima test are the most widely used [14]. FLD was first proposed by Keeler and Backofen [15], who only tested the right half of the forming limit diagram, and was later expanded to the left by Goodwin [16]. Most studies discuss the empirical methods for determining FLC, but with computational techniques, numerical models predicting FLC based on ductile fracture criteria increasingly appear [17,18]. Other models, such as the diffuse necking of Swift [19], Hill’s local necking, and Marciniak and Kuczynski’s thickness defect model, were also adopted [20]. However, predicting FLC involves complex calculations, so its application in practice is limited. F. M. Neuhauser extended the Keeler–Brazier FLD to the third dimension, the superimposed bending dimension, using a combination of finite element analysis and experiments to evaluate the influence of bending on sheet metal forming limits. The results show that the formability of steel increases with the increase in superposed bending degree [21]. Z. S. Sedigheh predicted the forming limits of ideal oriented rate-dependent crystal materials under various linear and nonlinear strain paths, and studied the forming limit graphs based on stress. The results show that the strain path has a great influence on the forming limit. The forming limit stress curve is not completely path independent [22].
The plastic deformation state in the stamping forming process of the sheet metal is very complicated; the stress and strain distribution is uneven, there is a large degree of inhomogeneity and deformation [23], and there is complicated contact between the die and sheet metal. In the production of experience and intuitive design alone, there will inevitably appear to be a lot of trial and error and mold preparation, wasting time and money. Therefore, computer-aided engineering (CAE) can be used to conduct finite element analysis of sheet metal forming, which can effectively restore the deformation process of the specific process, obtain the simulation results of the deformation process in a short time, identify the problems early, shorten the number and cycle of mold adjustment test, and thus reduce the manufacturing cost [24]. ETA/DYNAFORM 7.1 software is a dedicated sheet metal forming simulation software with a straightforward interface, complete functions, easy operation, fast calculation speed, and high precision [25]. F. Q. Li carried out experimental research and numerical simulation on the thermal bending rebound of the Ti-6Al-4V plate and carried out finite element modeling in DYNAFORM software to analyze the interaction between deformation and temperature. The results show that the springback can be reduced to some extent by increasing the forming temperature, forming speed, and holding time. Forming temperature has the greatest influence on the springback limit, followed by forming speed and holding time. The effect of holding time is less [26]. L. F. Folle proposed a method to determine and evaluate the mean coefficient of friction (COF) of AA1100 aluminum alloy by DYNAFORM using the finite element method (FEM). The results show that too much friction leads to cracking, and too little friction leads to wrinkling [27]. At present, the deep drawing process of asymmetrical box-shaped parts has severe unevenness in deformation [28]. The wrinkling problem of thin-walled plates with small fillets and large depths in a single deep drawing is particularly prominent [29]. The forming quality is mainly affected by key factors such as stamping speed, blank holder force, and friction coefficient. Therefore, a great deal of research is still needed to clarify the intrinsic influence of each key process parameter on wrinkling and even cracking [28,29].
This paper takes the commonly used stainless steel sink as the research object, uses the uniaxial tensile test to analyze the mechanical properties of the sheet, uses the simulation of the cupping test and the experiment to analyze the forming limit of the sheet, and verifies the feasibility of the deep drawing forming of the stainless steel sink. DYNAFORM software was used to simulate the variable parameters of stainless steel sink molding. By analyzing the impact of stamping speed, blank holder force, and friction coefficient on molding, the most critical problem of sheet springback under cold deformation was systematically analyzed. This has particular reference and guiding significance for the structural design of the actual complex cold deformation stamping mold. It dramatically reduces the time of parameter adjustment and mold test in the stainless steel sink process and reduces the production cost.

2. Experimental Methods

2.1. Mechanical Properties Experiment

The 304 stainless steel is a common material in stainless steel, and it is widely used in manufacturing equipment and parts that require good comprehensive performance due to its good corrosion resistance and formability. The chemical composition of SUS304 austenitic stainless steel is shown in Table 1. The experimental material studied in this paper is 0.72 mm-thick cold-rolled SUS304 austenitic stainless steel.
The mechanical properties of cold-rolled SUS304 austenitic stainless steel sheet were studied using a uniaxial tensile test at room temperature, using a microcomputer-controlled electronic universal test machine [30]. Three directions were selected for uniaxial tension testing using an INSTRON 5582 tensile tester (Buckinghamshire, UK). These three directions are RD (rolling direction), R45 (45° to RD direction), and TD (90° to RD direction). To ensure data reproducibility, three specimens were selected for testing in each direction, with a tensile speed of 1 mm/min. The selection and size of the tensile specimen for the room temperature test are shown in Figure 1.
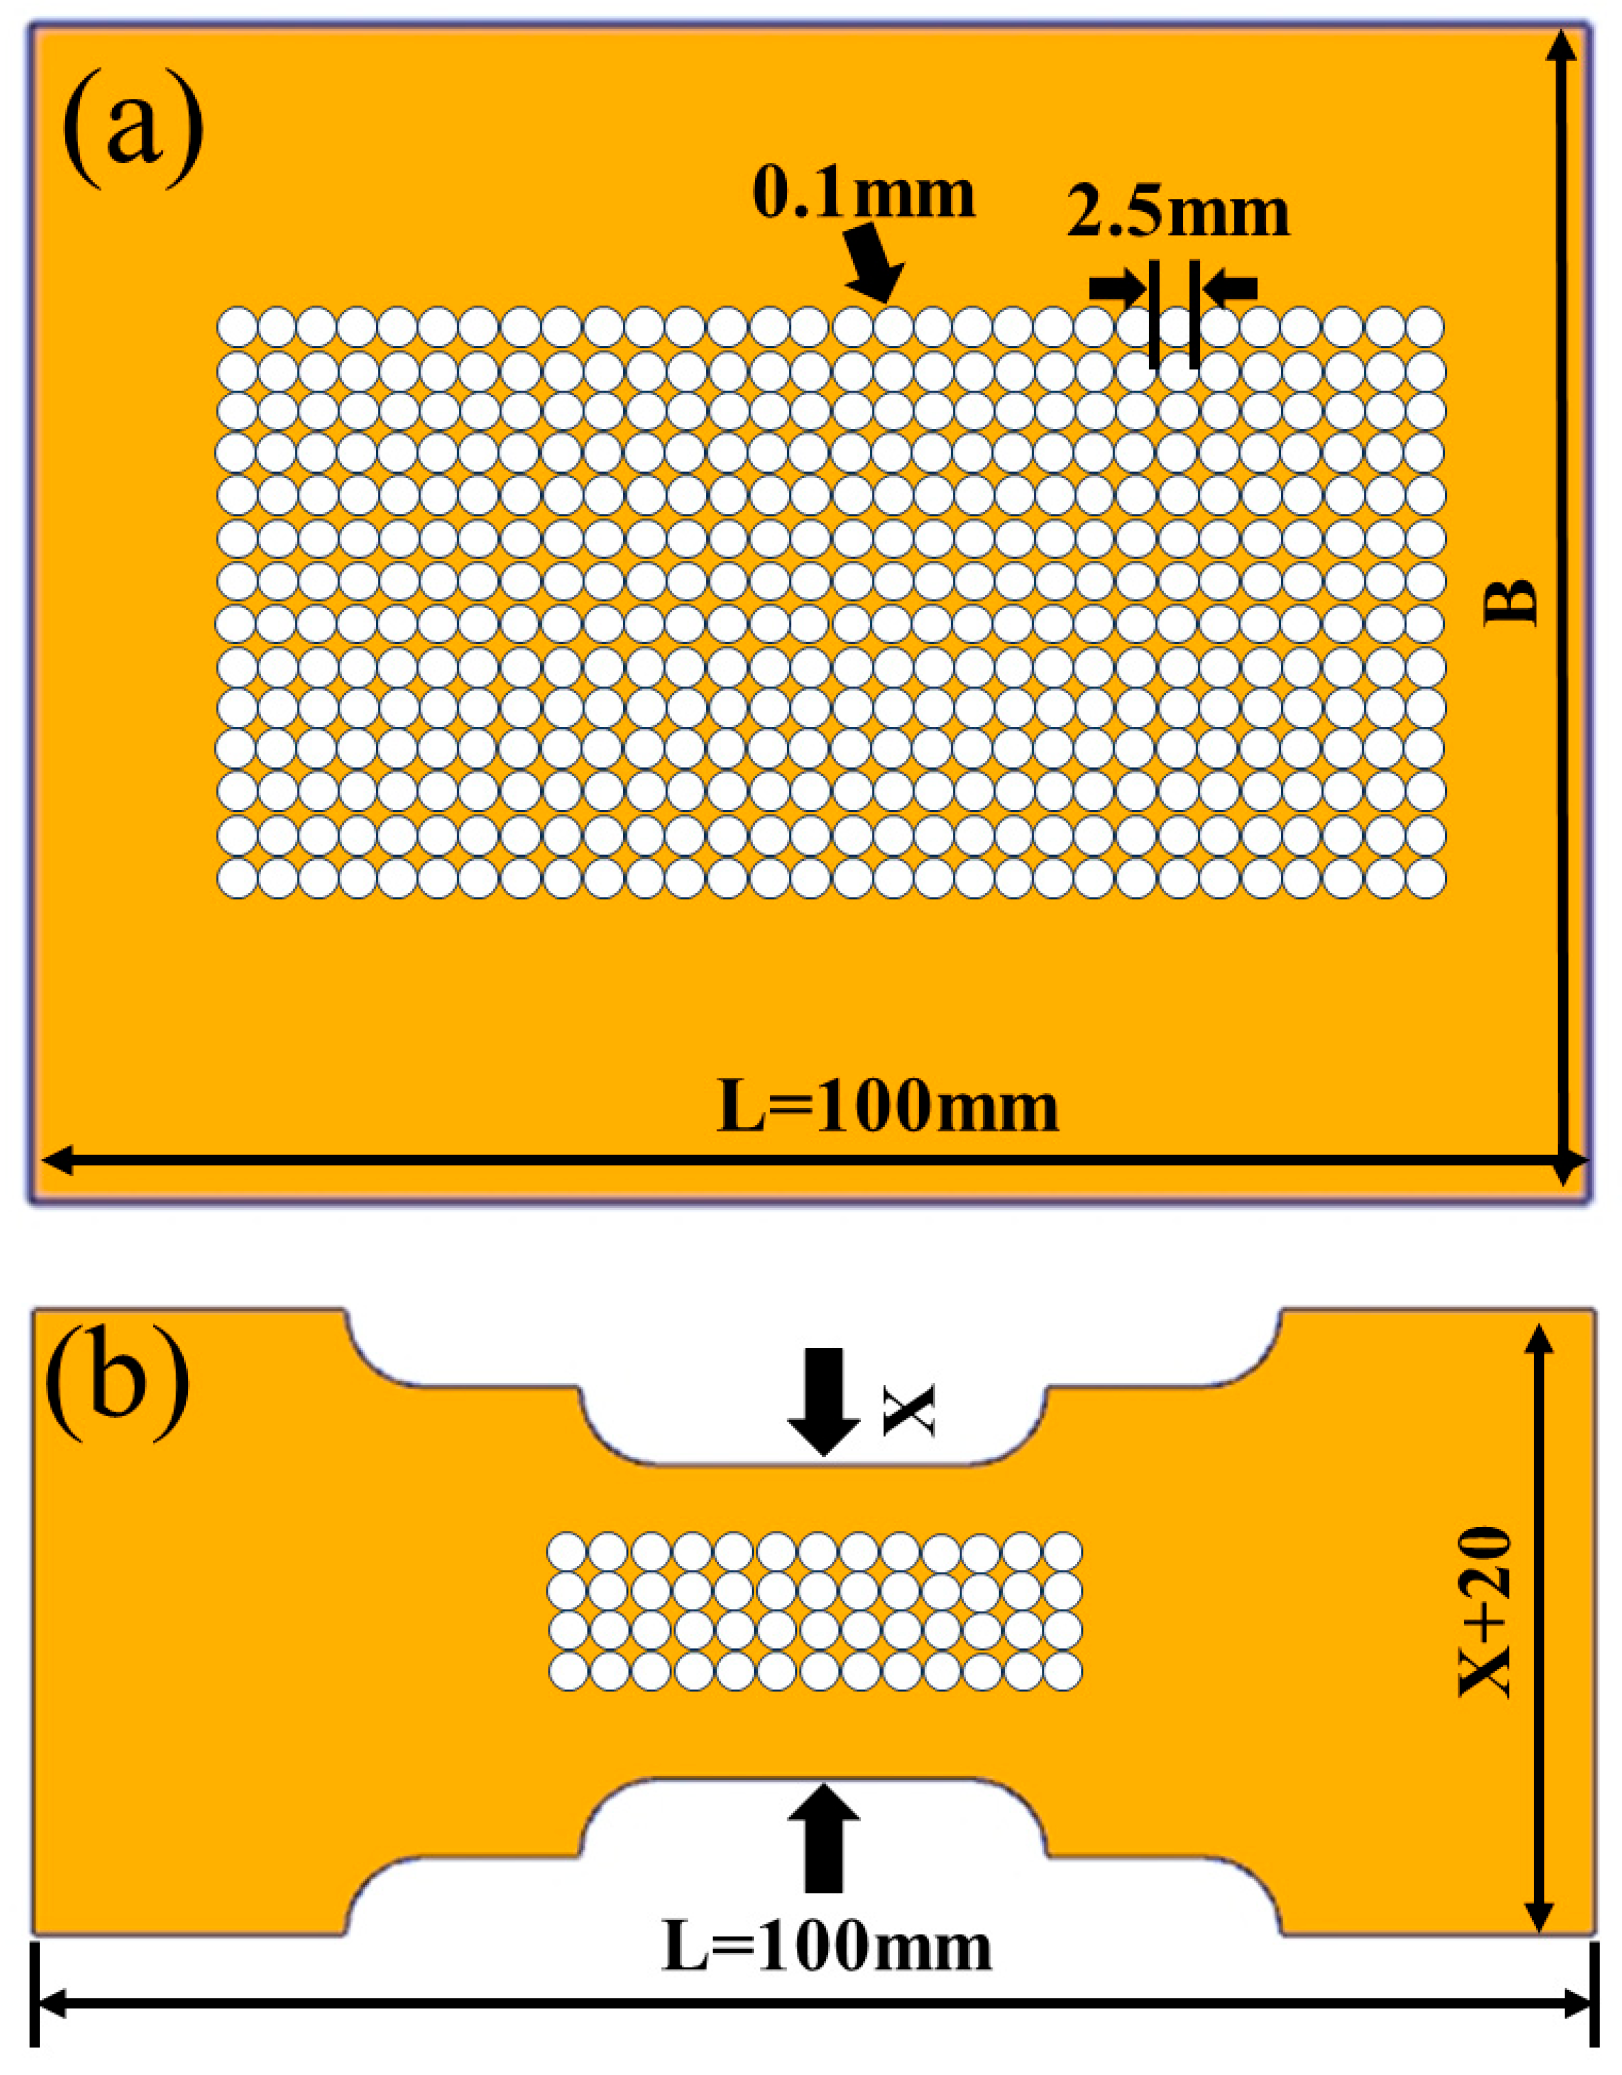
In order to obtain the forming limit of stainless steel sheets formed into stainless steel sinks under different stress states, two different specimen shapes are designed. One is a rectangular specimen, which is used to obtain the strain data of the ‘tension-tension area’; the other is the stepped specimen, which is used to obtain the strain data of the ‘tension-compression area’ As shown in Figure 2a, the rectangular specimen has the same length L (100 mm) and width B (40 mm, 60 mm, 80 mm, 100 mm) to achieve the change in the ratio of length to width. The purpose of designing the rectangular specimen is to prevent the position between the specimen and the die from being torn by the edge of the die. At the same time, the forming limit of the right half of the forming limit diagram can be obtained if the minor strain is greater than 0. As shown in Figure 2b, the length L of the stepped specimen is also unchanged, all 100 mm. In the width direction, the outside is wide and the inside is narrow. The middle width is the smallest, and the values of the middle X are 10 mm, 12.5 mm, 15 mm, 17.5 mm, and 20 mm, respectively. The primary purpose of the stepped specimen design is to prevent the specimen from being torn by the cutting edge of the die, and the forming limit of the left half of the forming limit diagram can be obtained if the minor strain is less than 0 [31].
Before the test, the prepared specimens were printed with mesh. The BLT-A160 machine (Xi’an Bright Laser Technologies Co., Ltd., Xi’an, China) is used to print SUS304 austenitic stainless steel surface laser mesh, which is used to measure the surface strain. When printing the mesh, the line width of the mesh should be as thin as possible to ensure clarity. A line width that is too wide will affect the measurement accuracy of strain after deformation. This paper’s linear width of 0.1 mm, diameter of 2.5 mm circular mesh, and printed mesh are clear and uniform, as shown in Figure 2. They will not affect the mechanical and formability of the material.
Before the test, the prepared specimens were printed with mesh. In this paper, the BLT-A160 machine is used to print SUS304 austenitic stainless steel surface laser mesh, which is used to measure the surface strain. When printing the mesh, the line width of the mesh should be as thin as possible to ensure clarity. A line width that is too wide will affect the measurement accuracy of strain after deformation. This paper’s linear width of 0.1 mm, diameter of 2.5 mm circular mesh, and printed mesh are clear and uniform. They will not affect the mechanical and formability of the material.
After completing the cupping test, the circular mesh is transformed into an elliptical mesh. Select 3~4 grid circles on both sides of the crack on the cupping test sample. The selected grid circles should be as close to the crack as possible and remain intact. It should be noted that we are aware of a more advanced full-field strain measurement technique-Digital Image Correlation (DIC). In this experiment, a high-precision film tape measure was used to measure the distances of the major and minor axes of the grids adjacent to the cracked grid, and the average value was taken. The long-axis strain and short-axis strain can be obtained by measuring the long diameter and short diameter of the deformed elliptical mesh and calculating the forming limit theoretically by Equation (1) [32,33] to draw the forming limit curve of SUS304 stainless steel based on the experiment.
e 1 = d 1 d 0 d 0 ,   e 2 = d 2 d 0 d 0
where d0 is the initial diameter of the circular mesh; d1 is the inner diameter of the long axis of the deformed elliptical mesh; d2 is the inner diameter of the short axis of the deformed elliptical mesh; e1 is the engineering strain of the elliptical long axis; and e2 is the engineering strain of the elliptical short axis.
Due to the significant limitation of engineering strain, it only conforms to minor deformation conditions. Once the deformation is too large, there will be distortion. Therefore, this paper needs to transform engineering strain into a logarithmic strain by Equation (2) [34].
ε 1 = ln 1 + e 1 = ln d 1 d 0 ,   ε 2 = ln 1 + e 2 = ln d 2 d 0
where ε1 is the true strain on the long axis of the ellipse, and ε2 is the true strain on the short axis of the ellipse.
Logarithmic strain reflects the cumulative process of strain during specimen deformation and is the true strain value of specimen deformation, so the logarithmic strain is also called the true strain.

2.2. Simulation of Forming Limit Diagram

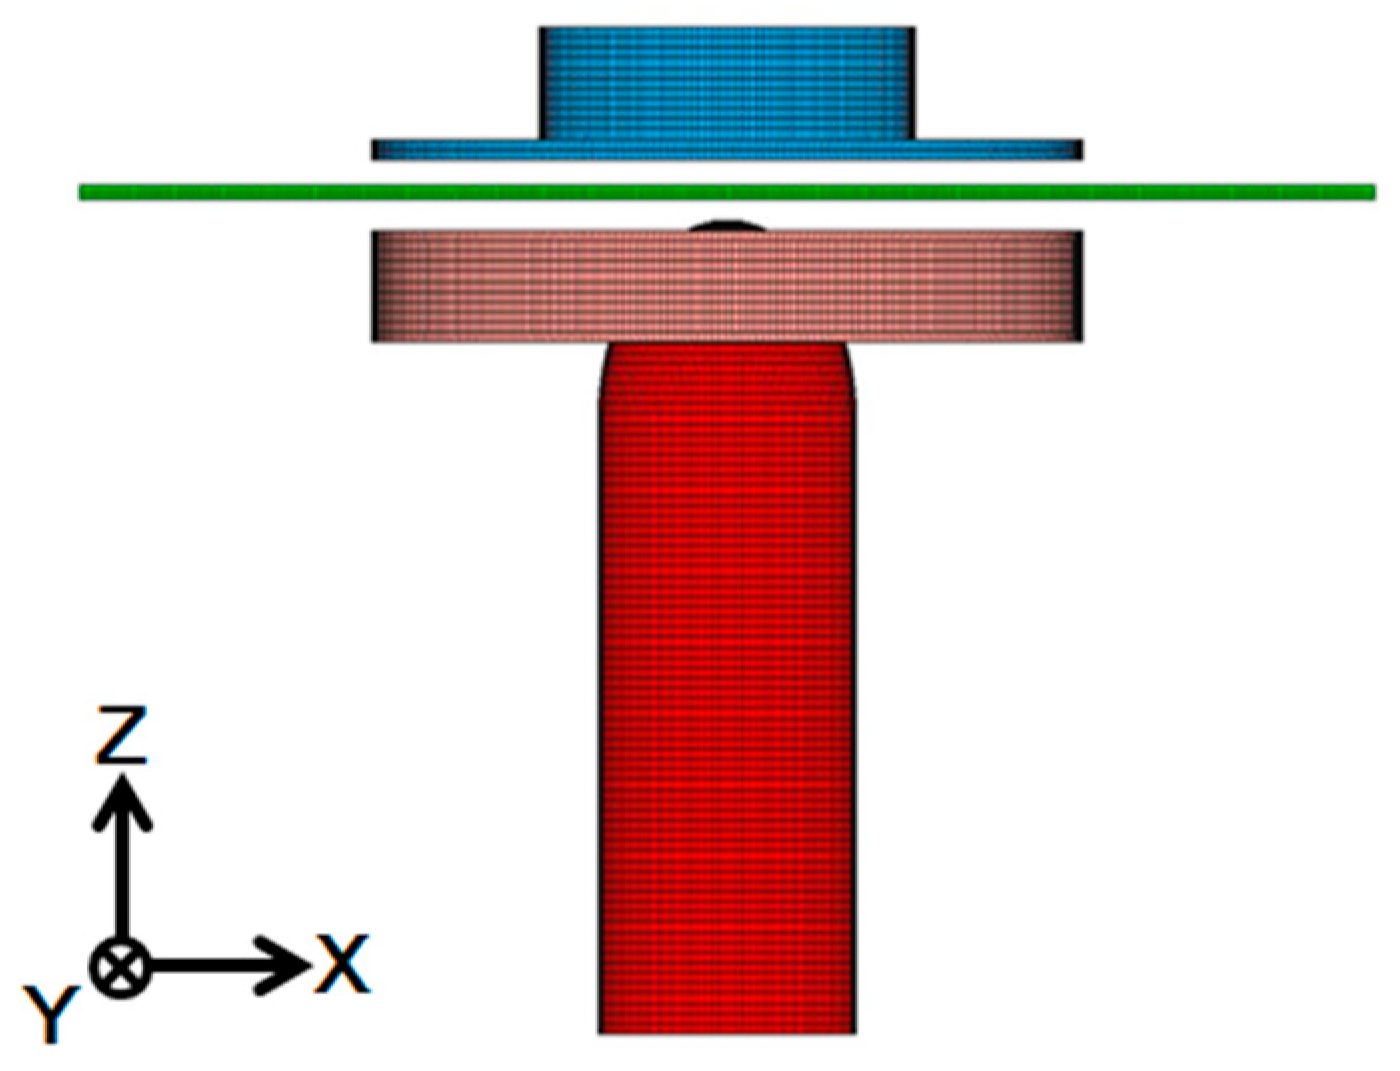
In order to predict the forming limit of the material, the finite element software eta/DYNAFORM was used in this paper to establish the simulation model of the cupping test, as shown in Figure 3 [35]. Although the model has symmetries that can be simplified, due to the small size of the model established in this paper and the current number of units that can support sufficient simulation accuracy, further simplification will have limited improvement in computational efficiency and may introduce additional errors. Therefore, symmetry simplification treatment was not adopted. The punch, die, and binder were all rigid bodies, so TOOL MESH was used for them, and PART MESH was used for the specimen. The size of the mesh should be 0.4 mm. In addition, it is necessary to consider the influence of the shape of the mesh on the accuracy of the simulation. In this paper, the quadrilateral mesh is selected to prevent distortion on the mesh surface and significantly reduce the calculation time. Mesh division involves the shape and topological type of the element, the type of the element, the selection of the mesh generator, the density of the mesh, the number of elements, and the geometry element. In the numerical solution of the finite element, the equivalent node force, stiffness matrix, and mass matrix of the element are generated by numerical integration, and the Gauss integral is used in the surface of the continuum element, shell, sheet, and beam element. The Simpson integral is used for the thickness direction. Taking the specimen of 100 × 100 × 0.72 mm as an example, the minimum unit size on the XY plane is 0.4 mm, the number of units in the Z-axis direction is 4; therefore, the total number of elements is 250,000. DYNAFORM software provides a variety of constitutive models of built-in materials. Since the plastic flow and hardening of materials are considered in this paper, the Barlat yield criterion in the elastic-plastic constitutive model is selected according to the mechanical properties and test data of materials. The constitutive model embedded in the DYNAFORM software, based on the anisotropy law as the Barlat89 yield criterion, is adopted. The Coulomb friction model is selected for the friction law, and the mathematical expression of the plastic anisotropy law is shown by Equation (3) [31]:
Φ = a K 1 + K 2 m + a K 1 K 2 m + c 2 K 2 m = 2 σ y m
When   σ y is the yield stress:
K 1 = σ x + h σ y 2 ,   K 2 = σ x h σ y 2 2 + p 2 τ x y 2
The anisotropic material constants a, c, and h are calculated from r0, r45, and r90
a = 2 2 r 00 1 + r 00 r 90 1 + r 90 ,   c = 2 a ,   h = r 00 1 + r 00 1 + r 90 r 90
The anisotropic parameter p is obtained through implicit calculation. According to the research by Barlat and Lian [31], the r-value at any angle can be calculated by the following formula:
r θ = 2 m σ y m Φ σ x + Φ σ y σ θ 1
The sheet material is defined as 304 stainless steel. Considering the characteristics of sheet forming and the material’s properties, we choose the No. 36 model of anisotropic material following the Barlat–Lian89 yield criterion, which is commonly used in forming anisotropic elastic-plastic sheet material under plane stress. Considering the influence of thickness anisotropy and anisotropy on the yield surface, this model is widely used in finite element simulation of sheet metal forming.
Since the uniaxial tensile test, plane strain, and biaxial tensile deformation states reflect the most essential three deformation states in the sheet metal forming process, a finite element simulation is carried out on the above nine specimens. The relevant process parameters used in the simulation of the cupping test with DYNAFORM software are determined based on the actual experience parameters from the factory and relevant literature, as detailed in Table 2. The material parameters and Barlat criterion parameters are obtained through formula calculations based on uniaxial tensile test data, as detailed in Table 3, among which the m value is a characteristic parameter related to the crystal structure [31], and r0, r45, and r90 are the anisotropy indices in the three directions [36]. The friction coefficient of 0.125 was assigned between the interfaces of tools and the blank surface [37].

2.3. Finite Element Simulation of Stainless Steel Sink

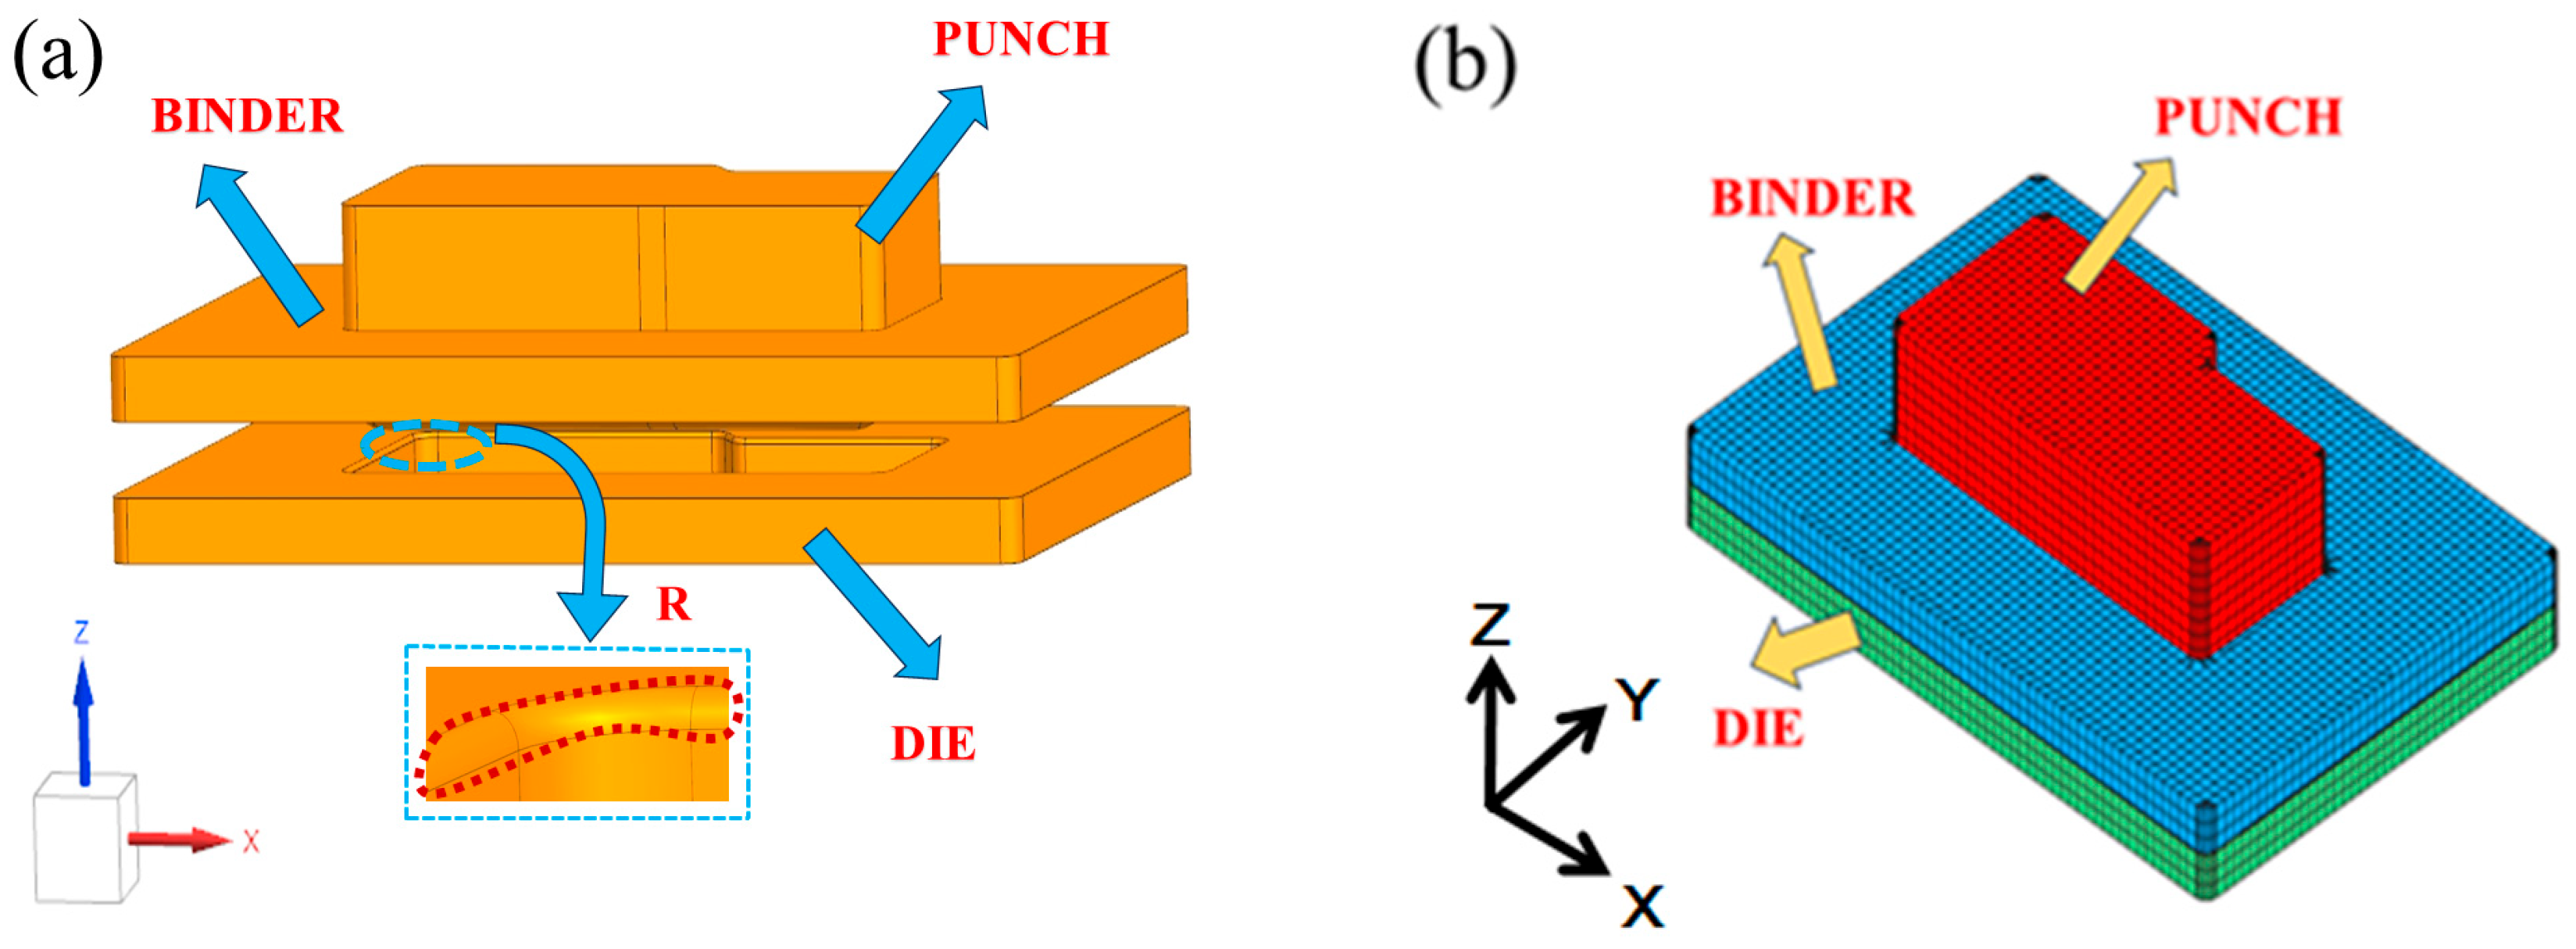
According to the part drawing of the stainless steel sink, UG software 12.0 is used to establish the mold forming of the stainless steel sink. The mold schematic diagram is shown in Figure 4a. The established mold is exported and saved in IGS format, as shown in Figure 4b. The influence of cracking, wrinkling, and springback on the formability of the sink was improved by changing the fillet R of the die in the mold, punch stamping speed, blank holder force, and friction coefficient between the molds. The mechanical properties parameters of the SUS304 stainless steel sheet obtained by uniaxial tensile test at room temperature were imported into the material library, and the anisotropy of the sheet was obtained according to the engineering stress–strain curve. The anisotropic material No. 36 was selected, and the material thickness was set to 0.72 mm. The finished product verifies the simulation.
Springback refers to the physical springback, which refers to the physical deformation of the object under the action of the force, and the physical change in the reduced or nearly reduced state generated when the pressure is released. Due to the cold working process, the required product does not need to undergo an annealing process, so the study and discussion of springback are necessary. By comparing the springback amount under different parameters, the optimal parameter is selected, that is, the parameter that guarantees the minimum springback amount without the tensile cracking phenomenon, which is used in the actual processing and production of stainless steel sinks. The main factors affecting the springback are yield strength, elastic modulus, strip thickness, hardening index, and the distribution of pass bending deformation. Springback is an essential factor affecting the finished precision of cold-formed profiles. Although the springback and forming limits are independent, they are interrelated in the actual sheet metal forming process. For example, during the forming process, if the material approaches or exceeds its forming limit, it may lead to an increase in the amount of resilience of the part, which affects the accuracy and quality of the product. On the contrary, by optimizing the process parameters and mold parameters, the rebound can be reduced to a certain extent, so that the part is closer to the target profile, but also to avoid the material beyond its forming limit and fracture, and other problems. Therefore, springback and forming limits interact with each other during sheet metal forming and need to be fully considered and controlled in the design and production process.
After the sheet metal forming simulation, the sink model after stamping is introduced, and the three-point springback analysis is carried out. Through the springback size of the side wall of the sink and the bottom of the sink, the parameters under the minimum springback are selected as the optimal parameters. This parameter is used as a guiding parameter for subsequent factory sink processing and the numerical feasibility.

3. Results and Discussion

3.1. Mechanical Properties Analysis

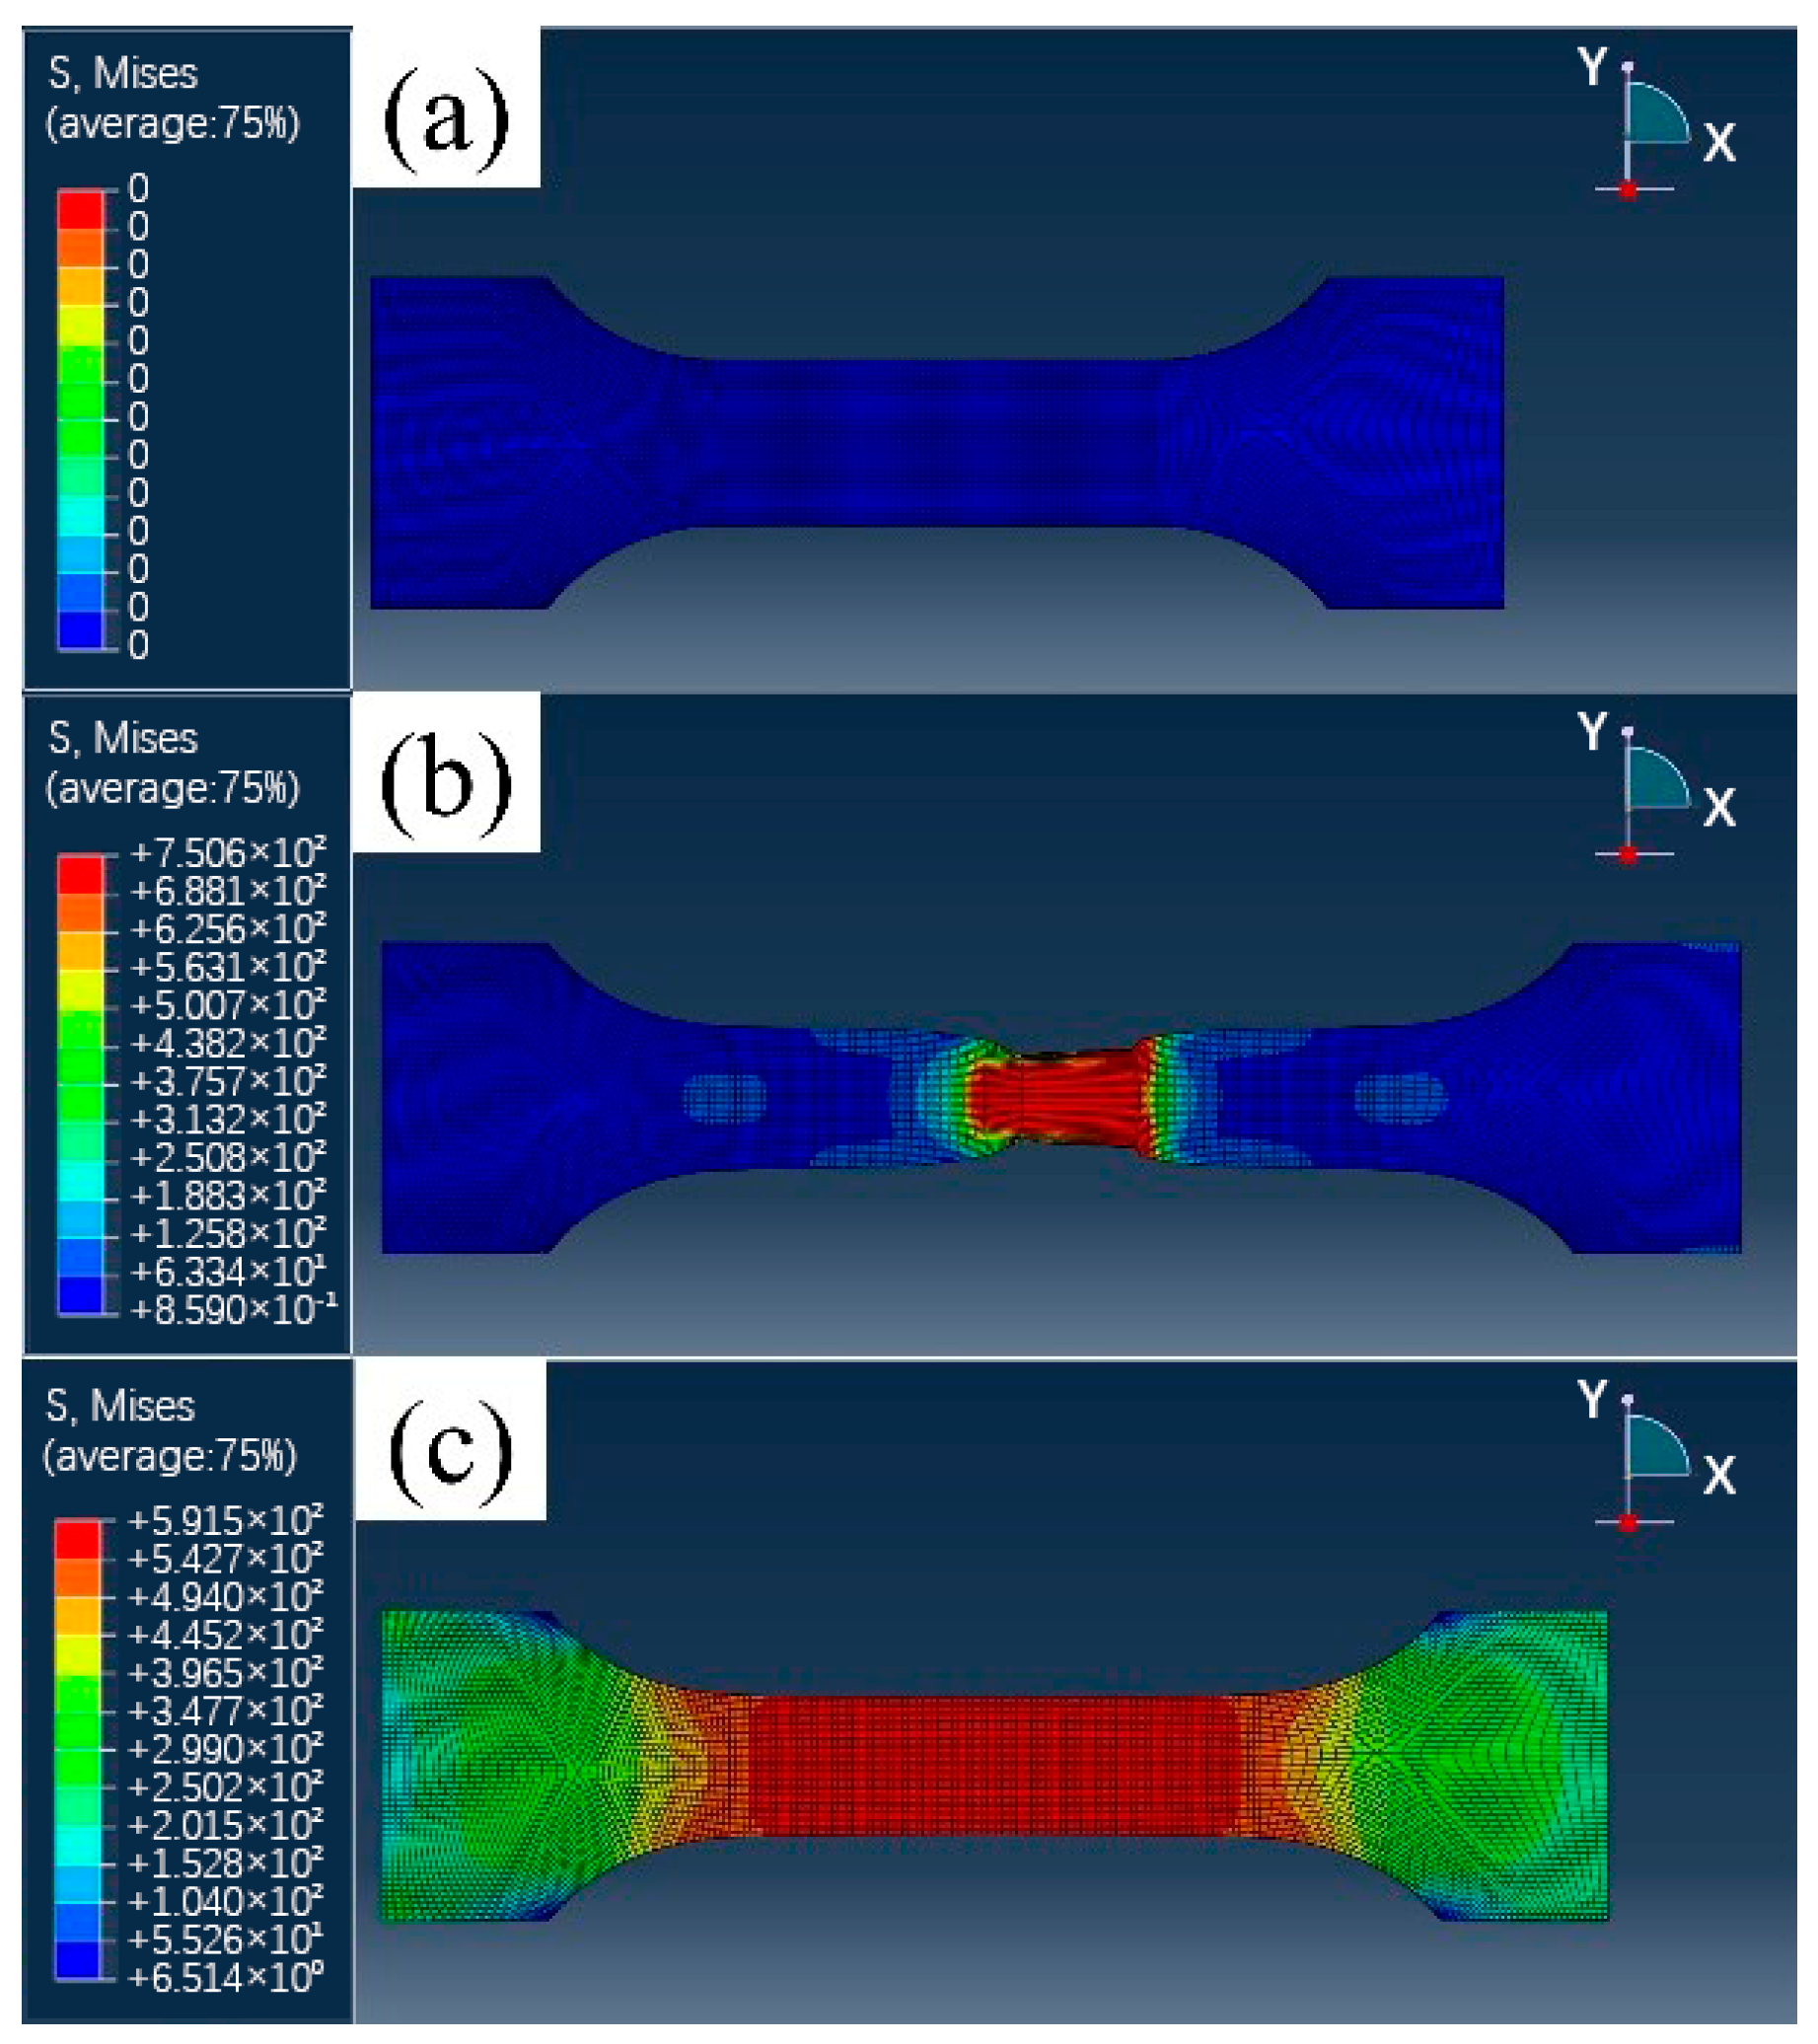
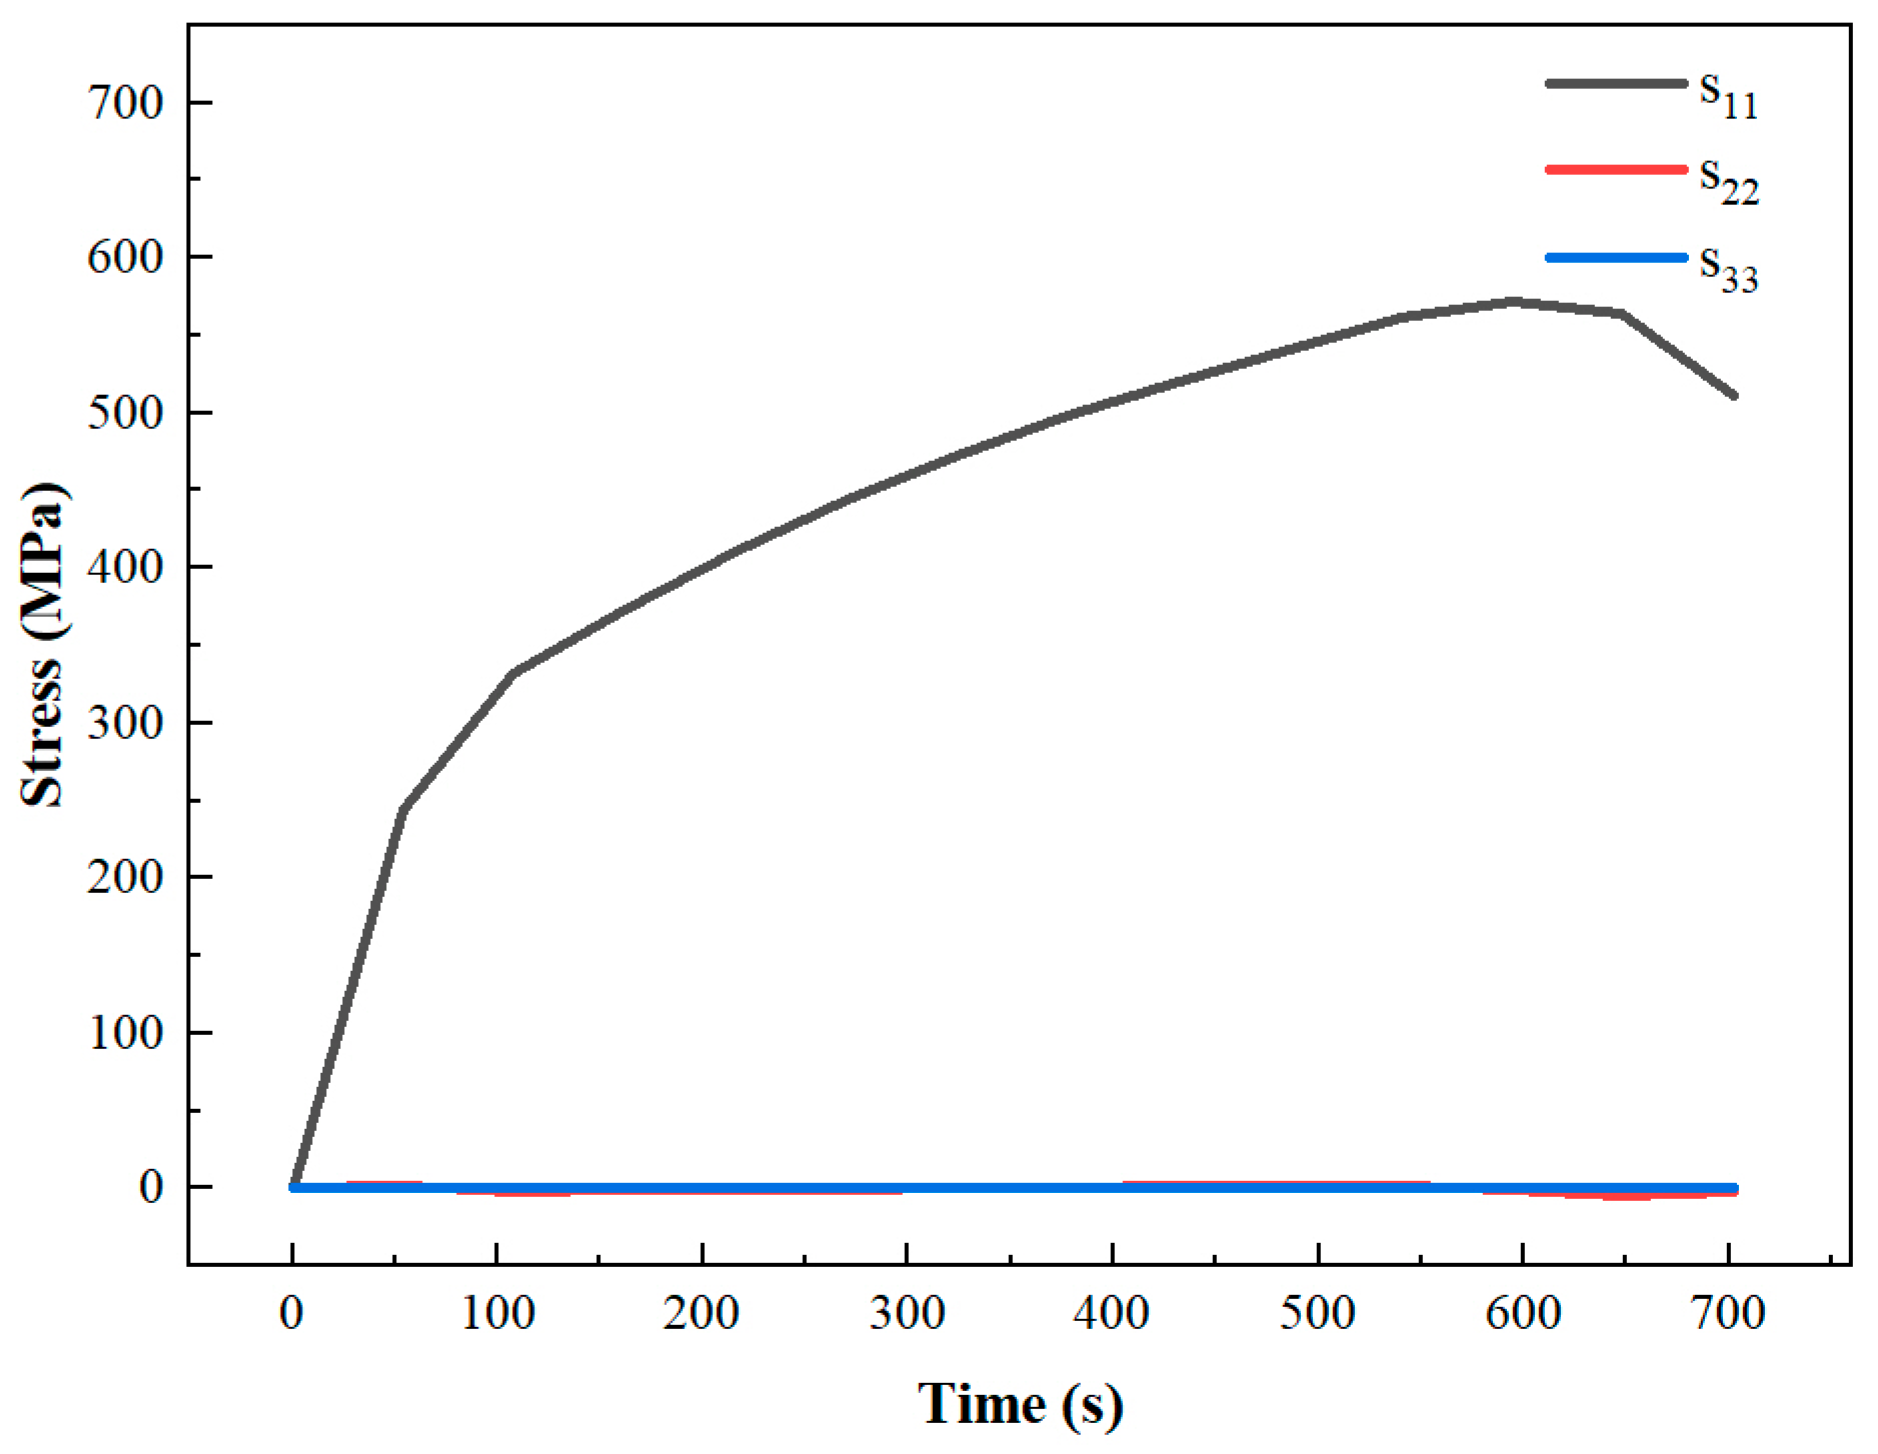
Since the specimen size in Figure 1 is not designed according to the GB/T size, the width-to-thickness ratio of the plate needs to be checked in order to obtain uniform deformation in the scale range. The ratio of width to thickness in the figure is 10/0.72 ≈ 13.9. In this case, numerical simulation is required to verify the tensile or uniaxial tension in the tensile direction. Figure 5a shows the establishment of the geometric model and grid division of the specimen under ABAQUS software 6.13. Material parameters are defined by measuring the basic performance data of SUS304 stainless steel (such as density) and the mechanical properties derived from uniaxial tensile tests (including elastic and plastic properties), with boundary conditions established and displacement and pressure parameters set accordingly. Figure 5b shows the large deformation of the mark distance after the completion of the simulation calculation, that is, the necking phenomenon. However, the range unit cannot be selected from this number of steps, which will cause the data to be distorted under the severe deformation of the grid. Through the analysis of the stress size and distribution in three directions under uniform deformation, it is verified that the designed specimen size is still unidirectional tensile. Figure 5c shows the uniform deformation process in the gauge length area during the stretching process. A unit was selected from the gauge length area, and the stress magnitudes in the X-axis, Y-axis, and Z-axis directions were analyzed. The time–stress curve shows that the stress in the direction of S11 is the greatest at 591.5 MPa, and the stress in the directions of S22 and S33 is very small and close to 0, as seen in Figure 6.
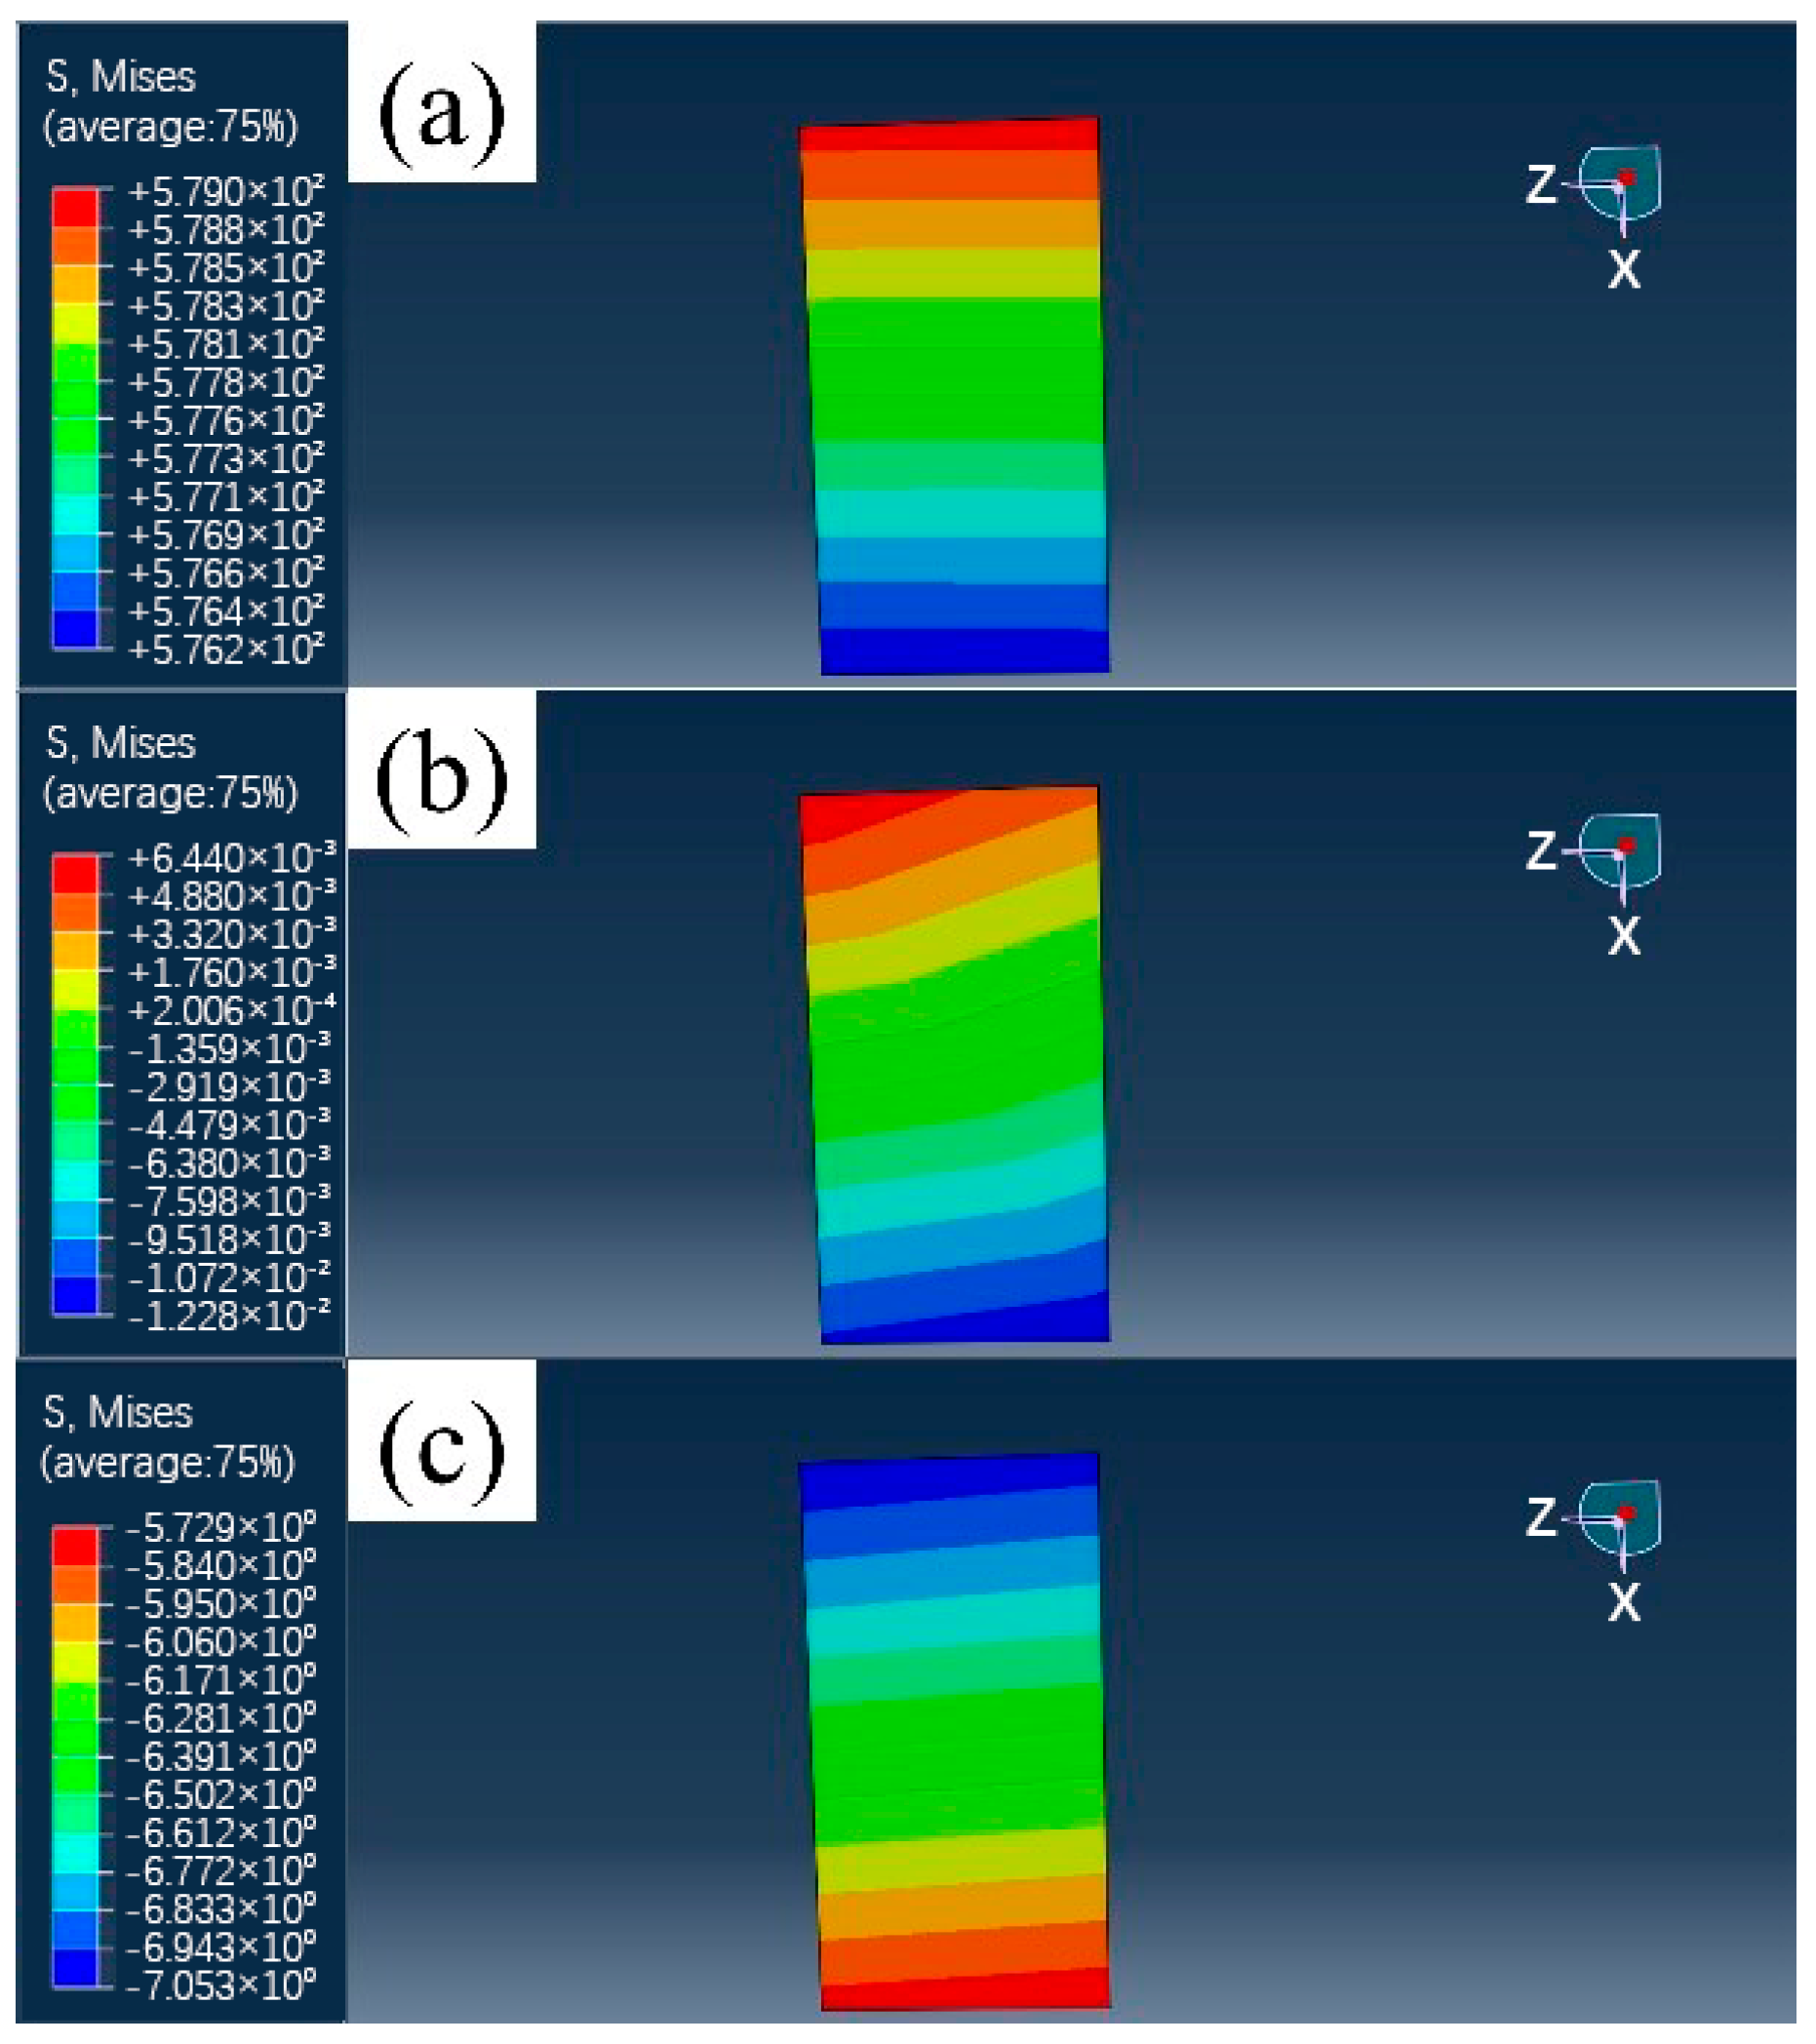
The magnitude and distribution of the principal stress are analyzed by selecting a unit in the standard distance zone at the uniform deformation time. Figure 7 shows the distribution cloud diagram of the principal stress in three directions, and Figure 7a–c is a contour cloud map of the principal stress σ1, σ2, and σ3, respectively. The size of σ1 ranges from 576.2 MPa to 579 MPa, that of σ2 ranges from −0.01228 MPa to 0.00644 MPa, and that of σ3 ranges from −7.053 MPa to −5.729 MPa. σ1 is much larger than σ2 and σ3, and σ2 and σ3 tend to be 0 MPa. Based on the stress sizes and stress distributions of S11, S22, S33, as well as σ1, σ2, and σ3, the feasibility of uniaxial tensile testing with the specimen sizes can be verified, providing a theoretical basis for the analysis of mechanical properties described below.
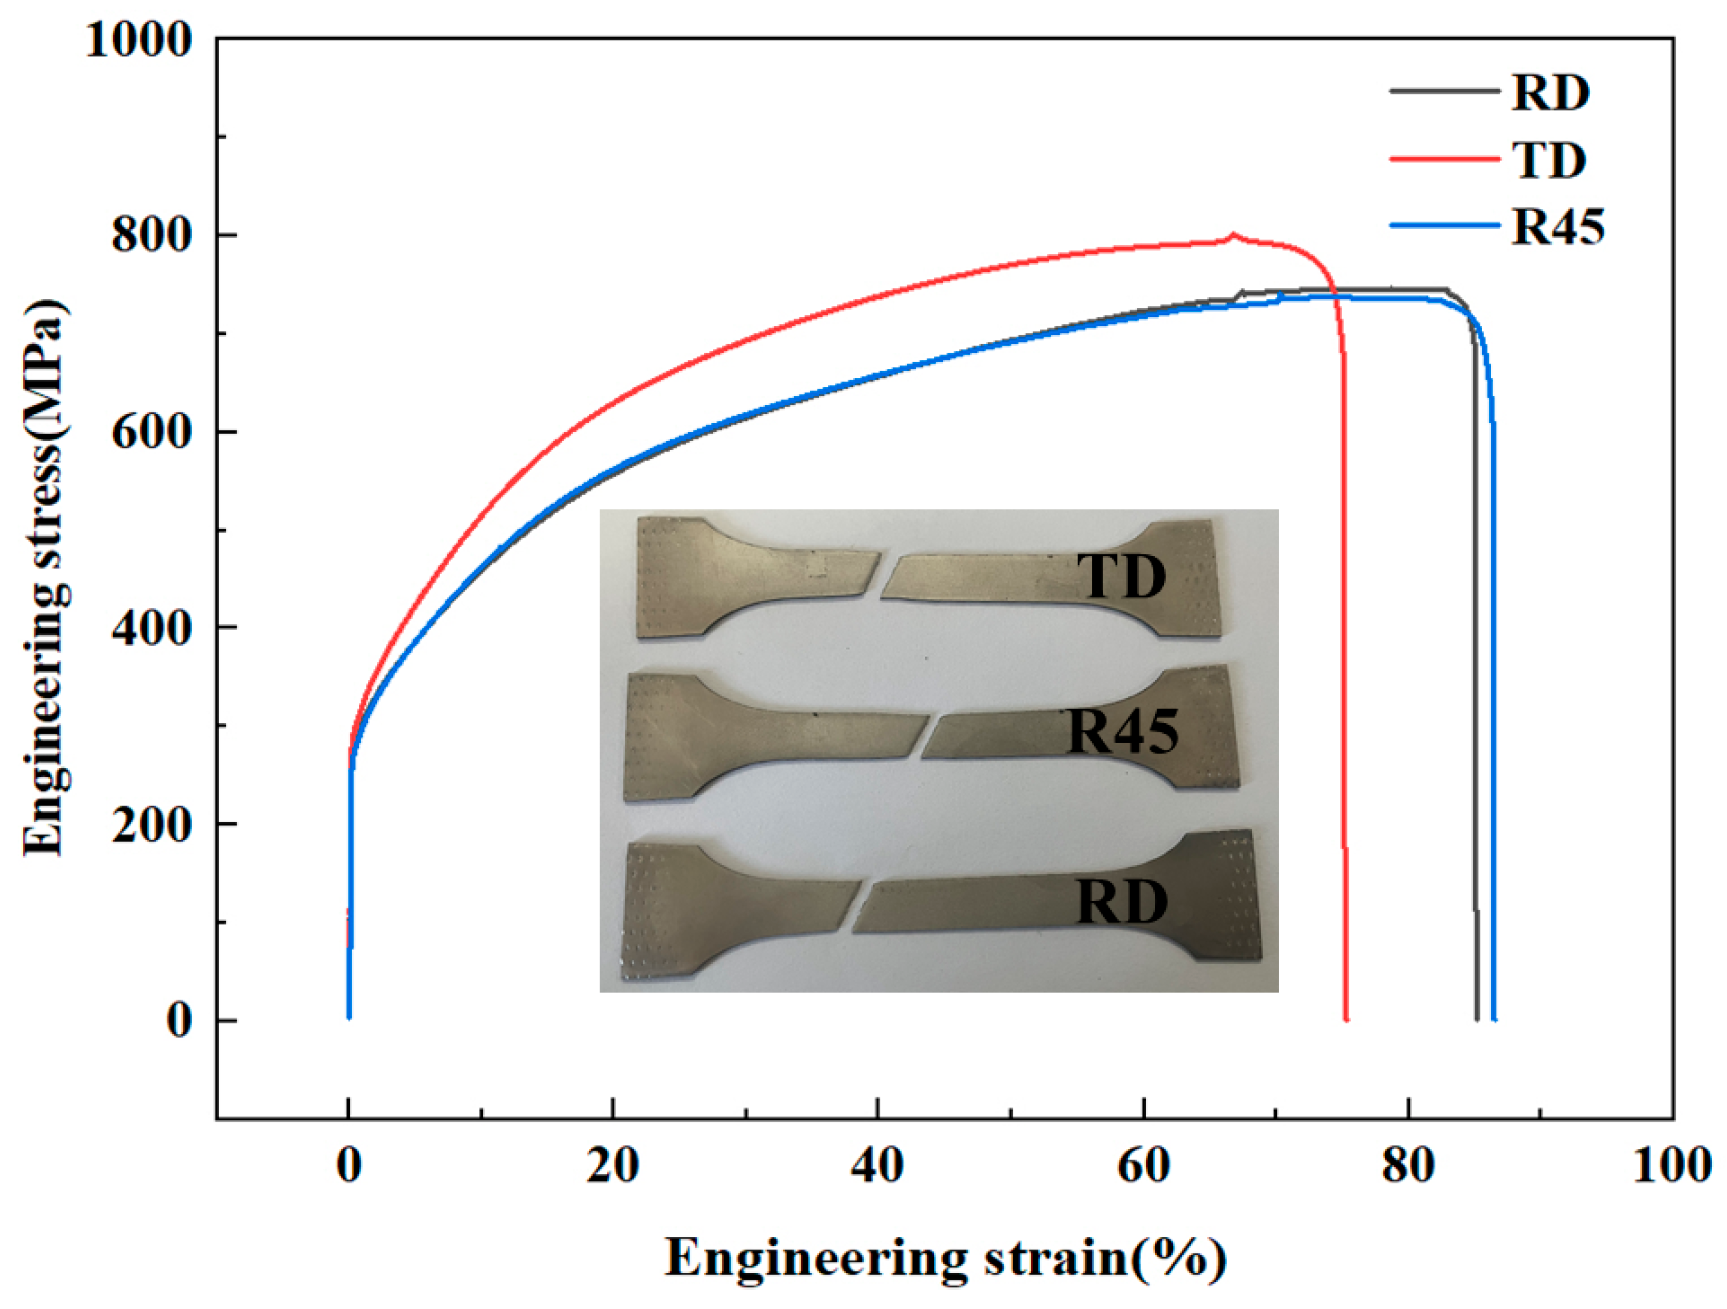
Figure 8 shows the engineering stress–strain curve of SUS304 austenitic stainless steel at room temperature. The mechanical properties of SUS304 stainless steel in different directions are significantly different, and the anisotropic properties are significant. It can also be seen that the SUS304 austenitic stainless steel in the cold-rolled state is composed of elastic deformation, plastic deformation, and the fracture stage. According to the tensile curve and tensile data, the main tensile properties of SUS304 austenitic stainless steel, namely yield strength, ultimate tensile strength, and fracture elongation, are summarized, and the results are shown in Table 4.
It can be seen from the mechanical properties in Table 4 that in the R45 direction, the minimum yield strength is 273.37 MPa and the minimum tensile strength is 740.84 MPa, but the maximum fracture elongation is 85.79%. In the TD direction, the maximum yield strength and tensile strength are 293.00 MPa and 800.93 MPa, respectively. The tensile strength is 8.1% higher than R45 direction, but the fracture elongation is 75.06%, the lowest of the three directions. The mechanical properties of the rolling direction are between the two, and the yield strength, tensile strength, and fracture elongation are 277.45 MPa, 746.20 MPa, and 85.04%, respectively. In addition, it can be found that the elastic modulus in different directions also has a significant difference; the elastic modulus in the TD direction is the largest, and the elastic modulus in the rolling direction is the smallest. The yield ratio in all three directions is approximately 0.37, indicating that the yield ratio of the same material in different directions is not different.
According to the experimental data obtained in Figure 8 and Table 4, high post-fracture elongation and high tensile strength in the RD direction, TD direction, and R45 direction can be concluded that martensitic phase transformation occurs in the tensile process through the following two references. Y. W. Xu conducted the longitudinal uniaxial tensile test on 304 stainless steel tubes, and the results showed that strain-induced martensitic transformation was formed under tensile action, which produced obvious phase transformation strengthening and work hardening effect, and increased elongation after breaking [38]. Y. Xu confirmed that the unloading process can effectively stimulate the nucleation and growth of deformation-induced martensitic transformation, thereby enhancing the plasticizing effect of the transformation and improving the ability to delay necking fracture [39].
In view of the microstructure evolution, we will verify and analyze the martensitic phase transition during the deep drawing process by scanning electron microscopy, X-ray diffraction, and electron backscatter diffraction in subsequent studies.

3.2. Simulation and Experiment Analysis of Forming Limit Diagram

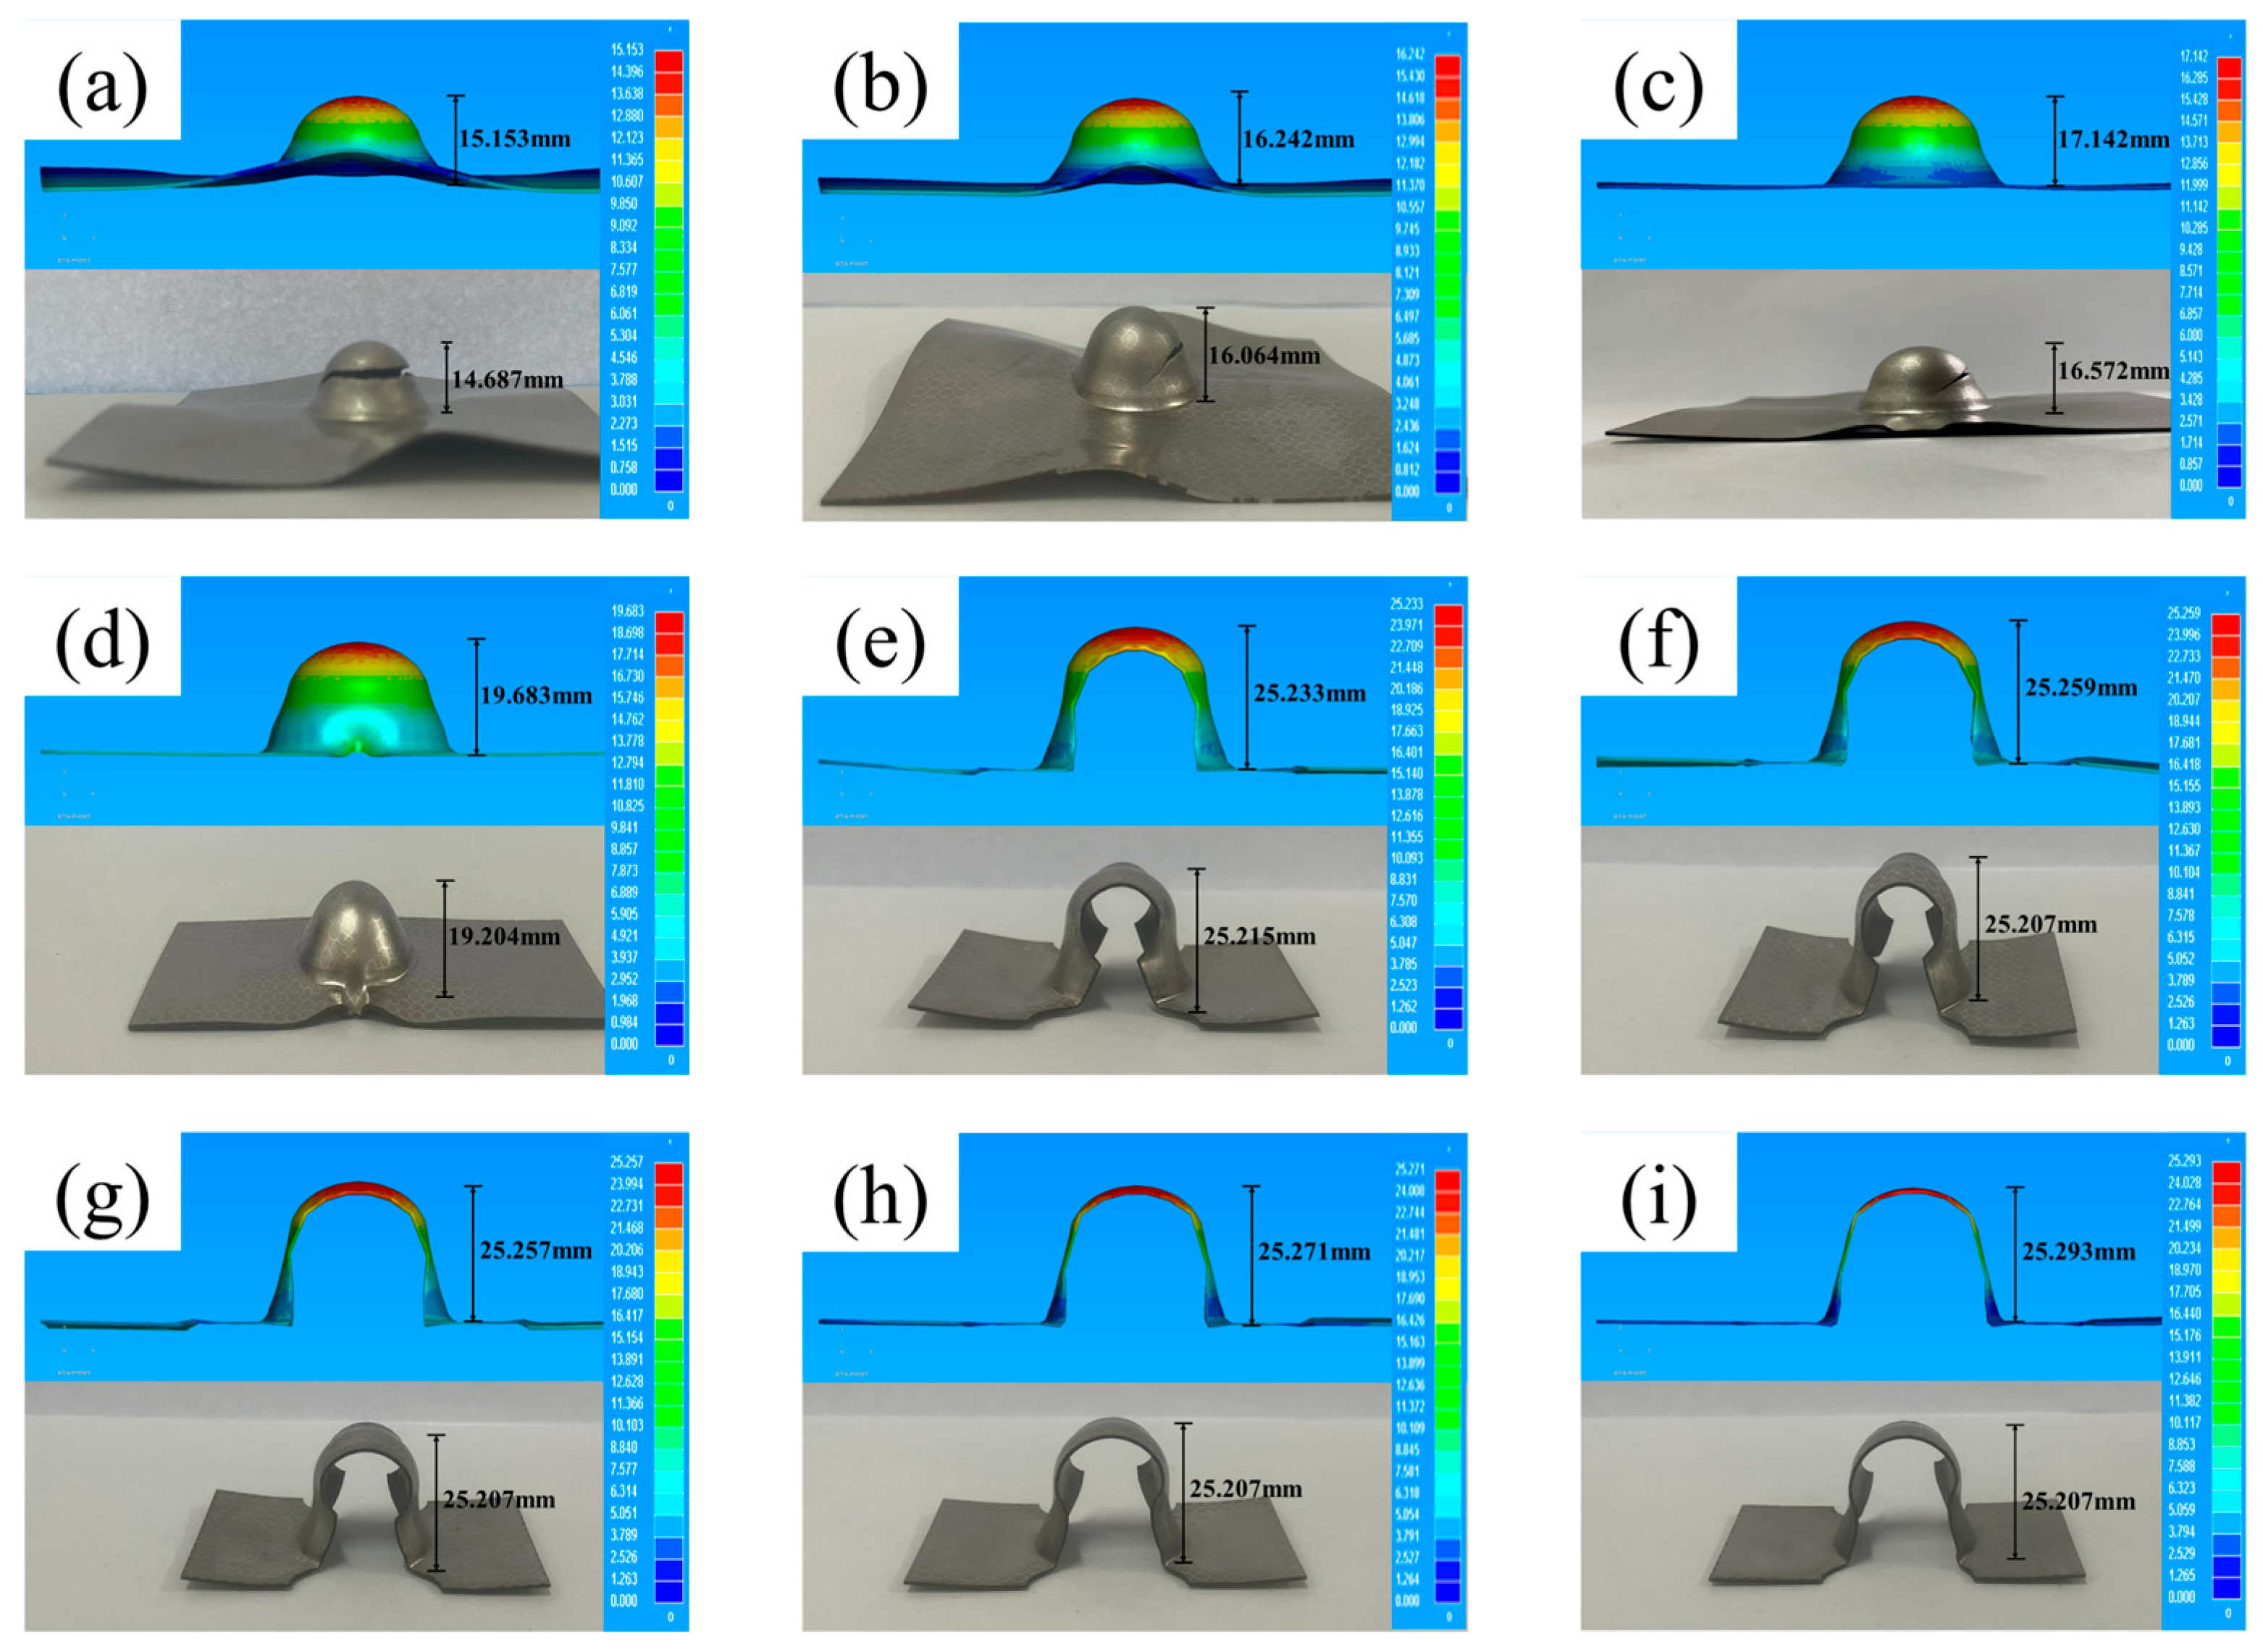
It can be seen from Figure 9 that the maximum bulging depth of sheet metal deformation in the numerical simulation of the cupping test and the maximum bulging depth under the test are Erickson values (IE values). It can also be seen that the experimental results are lower than the numerical simulation results in both the ‘tensile-tensile area’ and ‘tensile-compression area’. Taking the 100 mm × 60 mm× 0.72 mm specimen as an example, the experimental bulging depth is 16.572 mm, which is lower than the numerical simulation of 17.142 mm, as shown in Figure 10a. From the load-displacement curve of the test, the distortion point of each specimen and the maximum bulging depth can be found, as shown in Figure 10b. In addition, at the moment of fracture point, the height of the punch bulge is consistent with that of the test specimen, and the strain state of each point of the test specimen is consistent with that of the experimental specimen, indicating that the finite element simulation results are in good agreement with the experimental results.
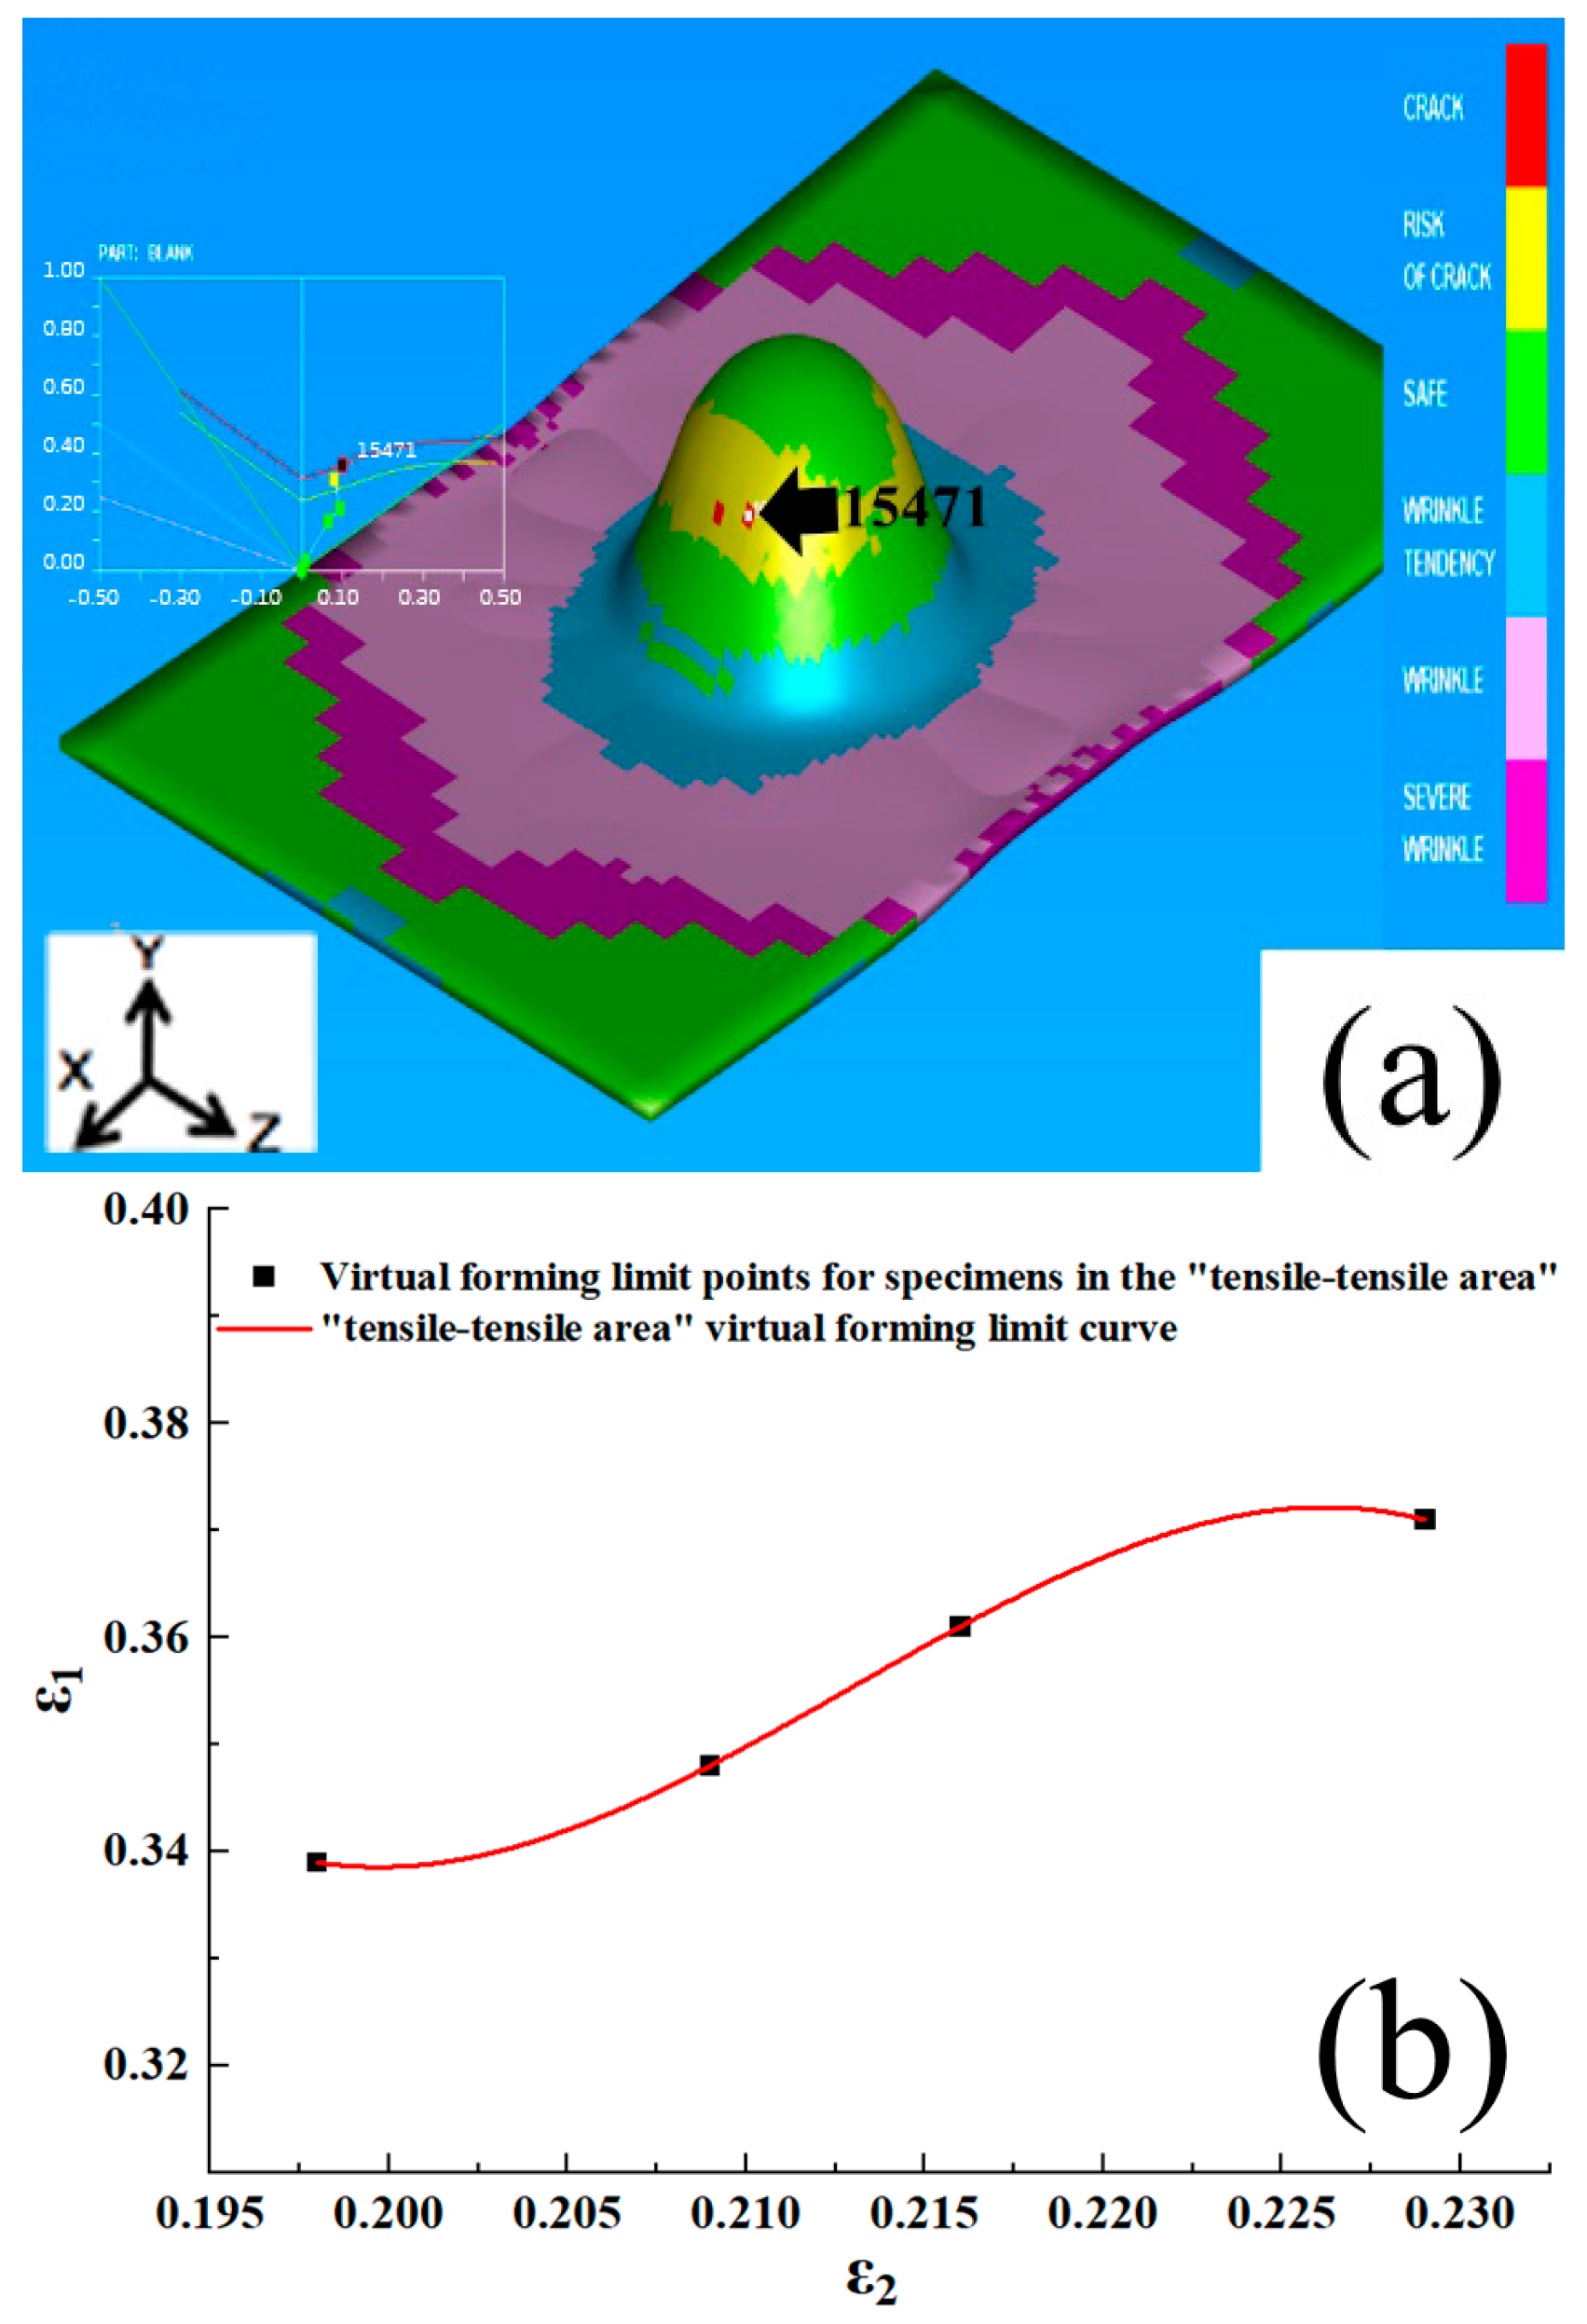
In the finite element simulation, the ‘strain path’ function in the post-processing is used to check the strain path of the mesh elements with the most significant principal strain during the entire deformation process, and this drift point is found. By this time, the first principal strain of the mesh elements increases sharply. In contrast, the second principal strain almost remains unchanged, and this turning point can be considered the moment when instability occurs. At this moment, the principal and minor strains of the element with the maximum principal strain can be considered the ultimate strain under this strain path. The ultimate strain of other strain paths can be obtained by repeating this process with sheets of other sizes, and then the forming limit curve can be obtained. Figure 11a shows the strain path mutation of a 100mm × 60mm × 0.72 mm specimen No. 15471 in the virtual FLD test, and Figure 11b shows the forming limit diagram of the right half under the strain path criterion.
However, the specimen width of the sheet needs to be explained is large, that is, in the case of close to the ‘tensile-tensile area’, the mutation of this strain path will be apparent. As the width of the specimen decreases, when the strain path is close to the plane strain area, this turning phenomenon of the strain path is not apparent. The transition of the strain path is not obvious, which means that this method is suitable for predicting the right half of the forming limit diagram but not for predicting the left half of the forming limit diagram.
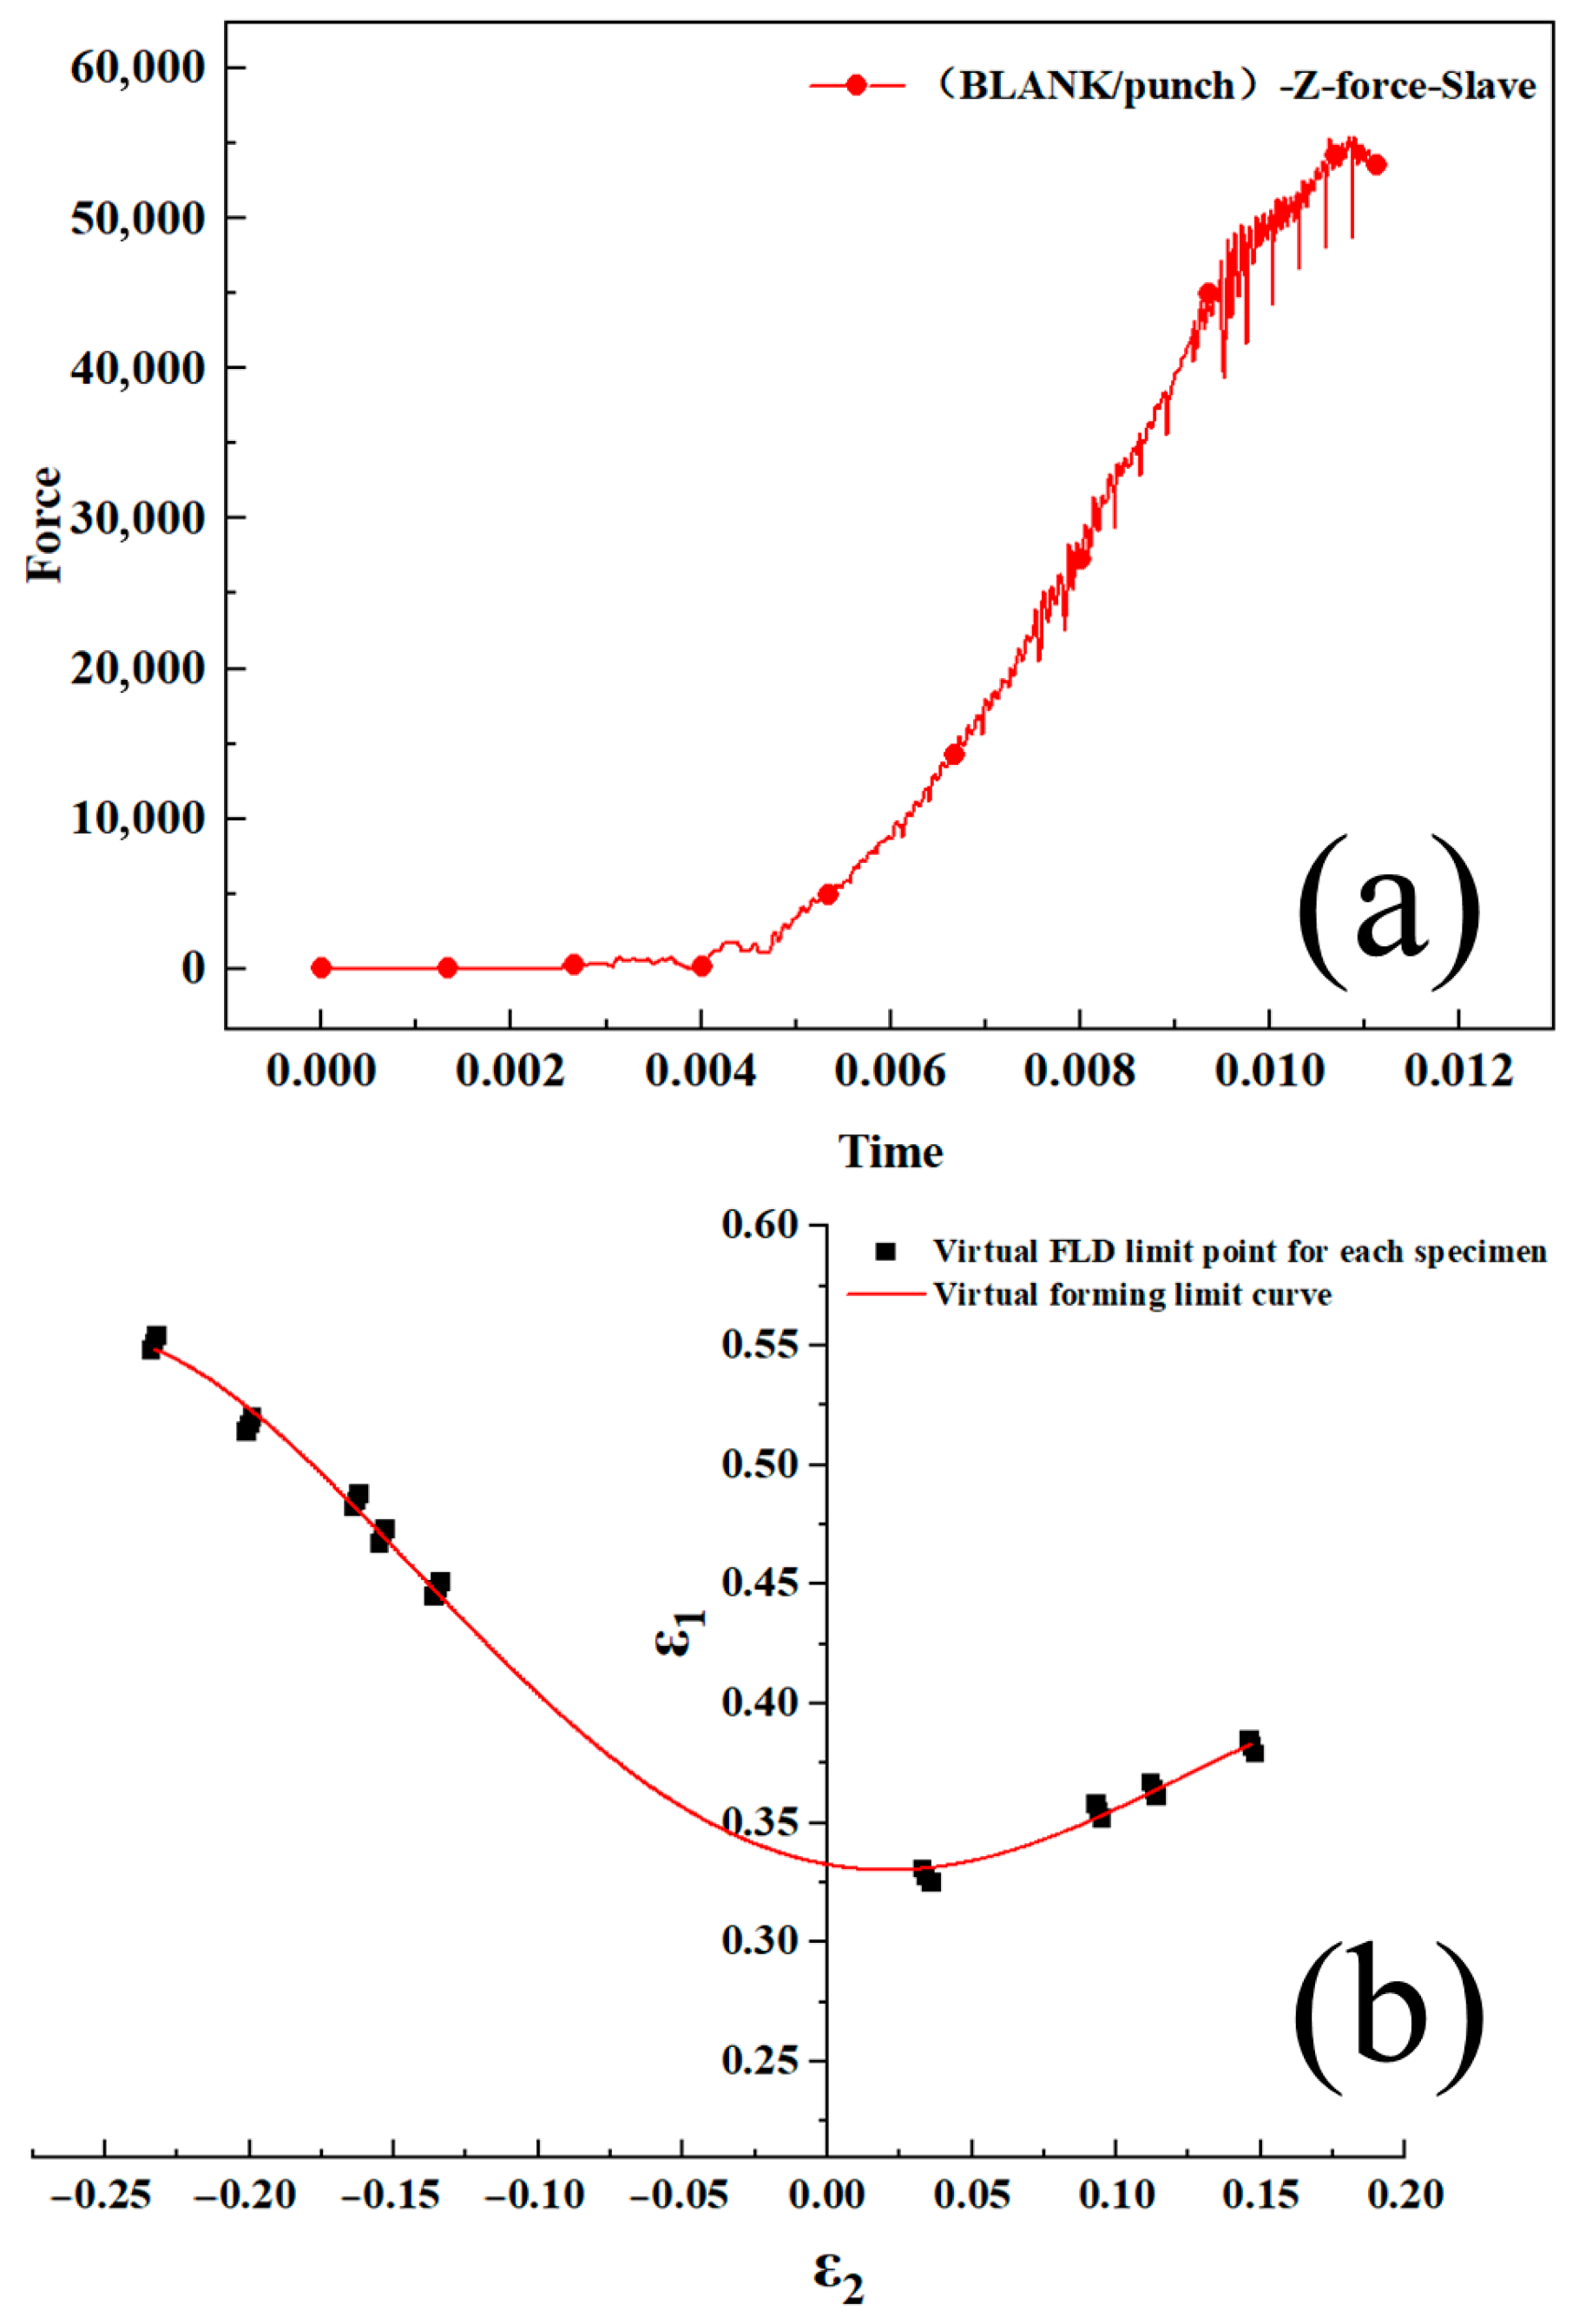
According to the above strain path criterion, only the right half of the forming limit diagram can be determined, and the punch maximum pressure criterion can obtain the whole forming limit diagram. At the beginning of the simulation experiment, with the rise of the punch, the contact force between the punch and the sheet continues to increase. However, when instability occurs, the contact force between the punch and the sheet begins to decrease, weakening the material properties. Therefore, the principal and minor strain of the sheet at the punch pressure can be used as the ultimate strain of necking. Figure 12a shows the relationship between the contact force between the punch and the sheet over time during the virtual forming limit experiment on the rectangular specimen of 100 mm × 60 mm× 0.72 mm in the finite element simulation, and Figure 12b shows the forming limit diagram under the punch maximum pressure criterion.
The duration is set to displacement control, and the simulation stops when the punch displacement is 18.00 mm. In the DYNAFORM software post-processing, the relationship curve between punch stroke and time step can be viewed, the time step of the contact force peak between punch and sheet can be determined, and the mesh elements with the maximum principal strain under this time step. Through the ‘reverse mapping’ function in the post-processing, the principal and minor strains of the mesh elements are checked and used as the ultimate strain of the specimen of this size. The ultimate strain under different strain paths can be obtained by repeating this process with specimens of other sizes, and a complete forming limit curve can be obtained.
For the two criteria introduced, the strain path mutation criterion cannot predict the whole forming limit curve. However, it can only predict part of the area ‘tensile-tensile area’, so the punch maximum pressure criterion is mainly studied. The operation process of the punch maximum pressure criterion is simple. It only needs to find the moment when the contact force between the punch and the sheet reaches the peak in the punch stroke, find the mesh elements with the maximum principal strain of the current frame, and take the principal strain of the unit in two directions as the ultimate strain. It can be seen from the FLD diagrams under the two criteria that the principal strain ε1 and the minor strain ε2 values in the bidirectional tension region ‘tensile-tensile area’ are consistent, and the coincidence degree is high.
Figure 13 shows the forming limit diagram of the finite element simulation of each specimen under DYNAFORM software. In the figure, the strain values of the specimen in the surface, ‘tensile-tensile area’ and ‘tensile-compression area’ are consistent with the FLD under the above two criteria, which verifies the correctness of the above criteria. The basis is provided for the stamping forming of the following stainless steel sink.
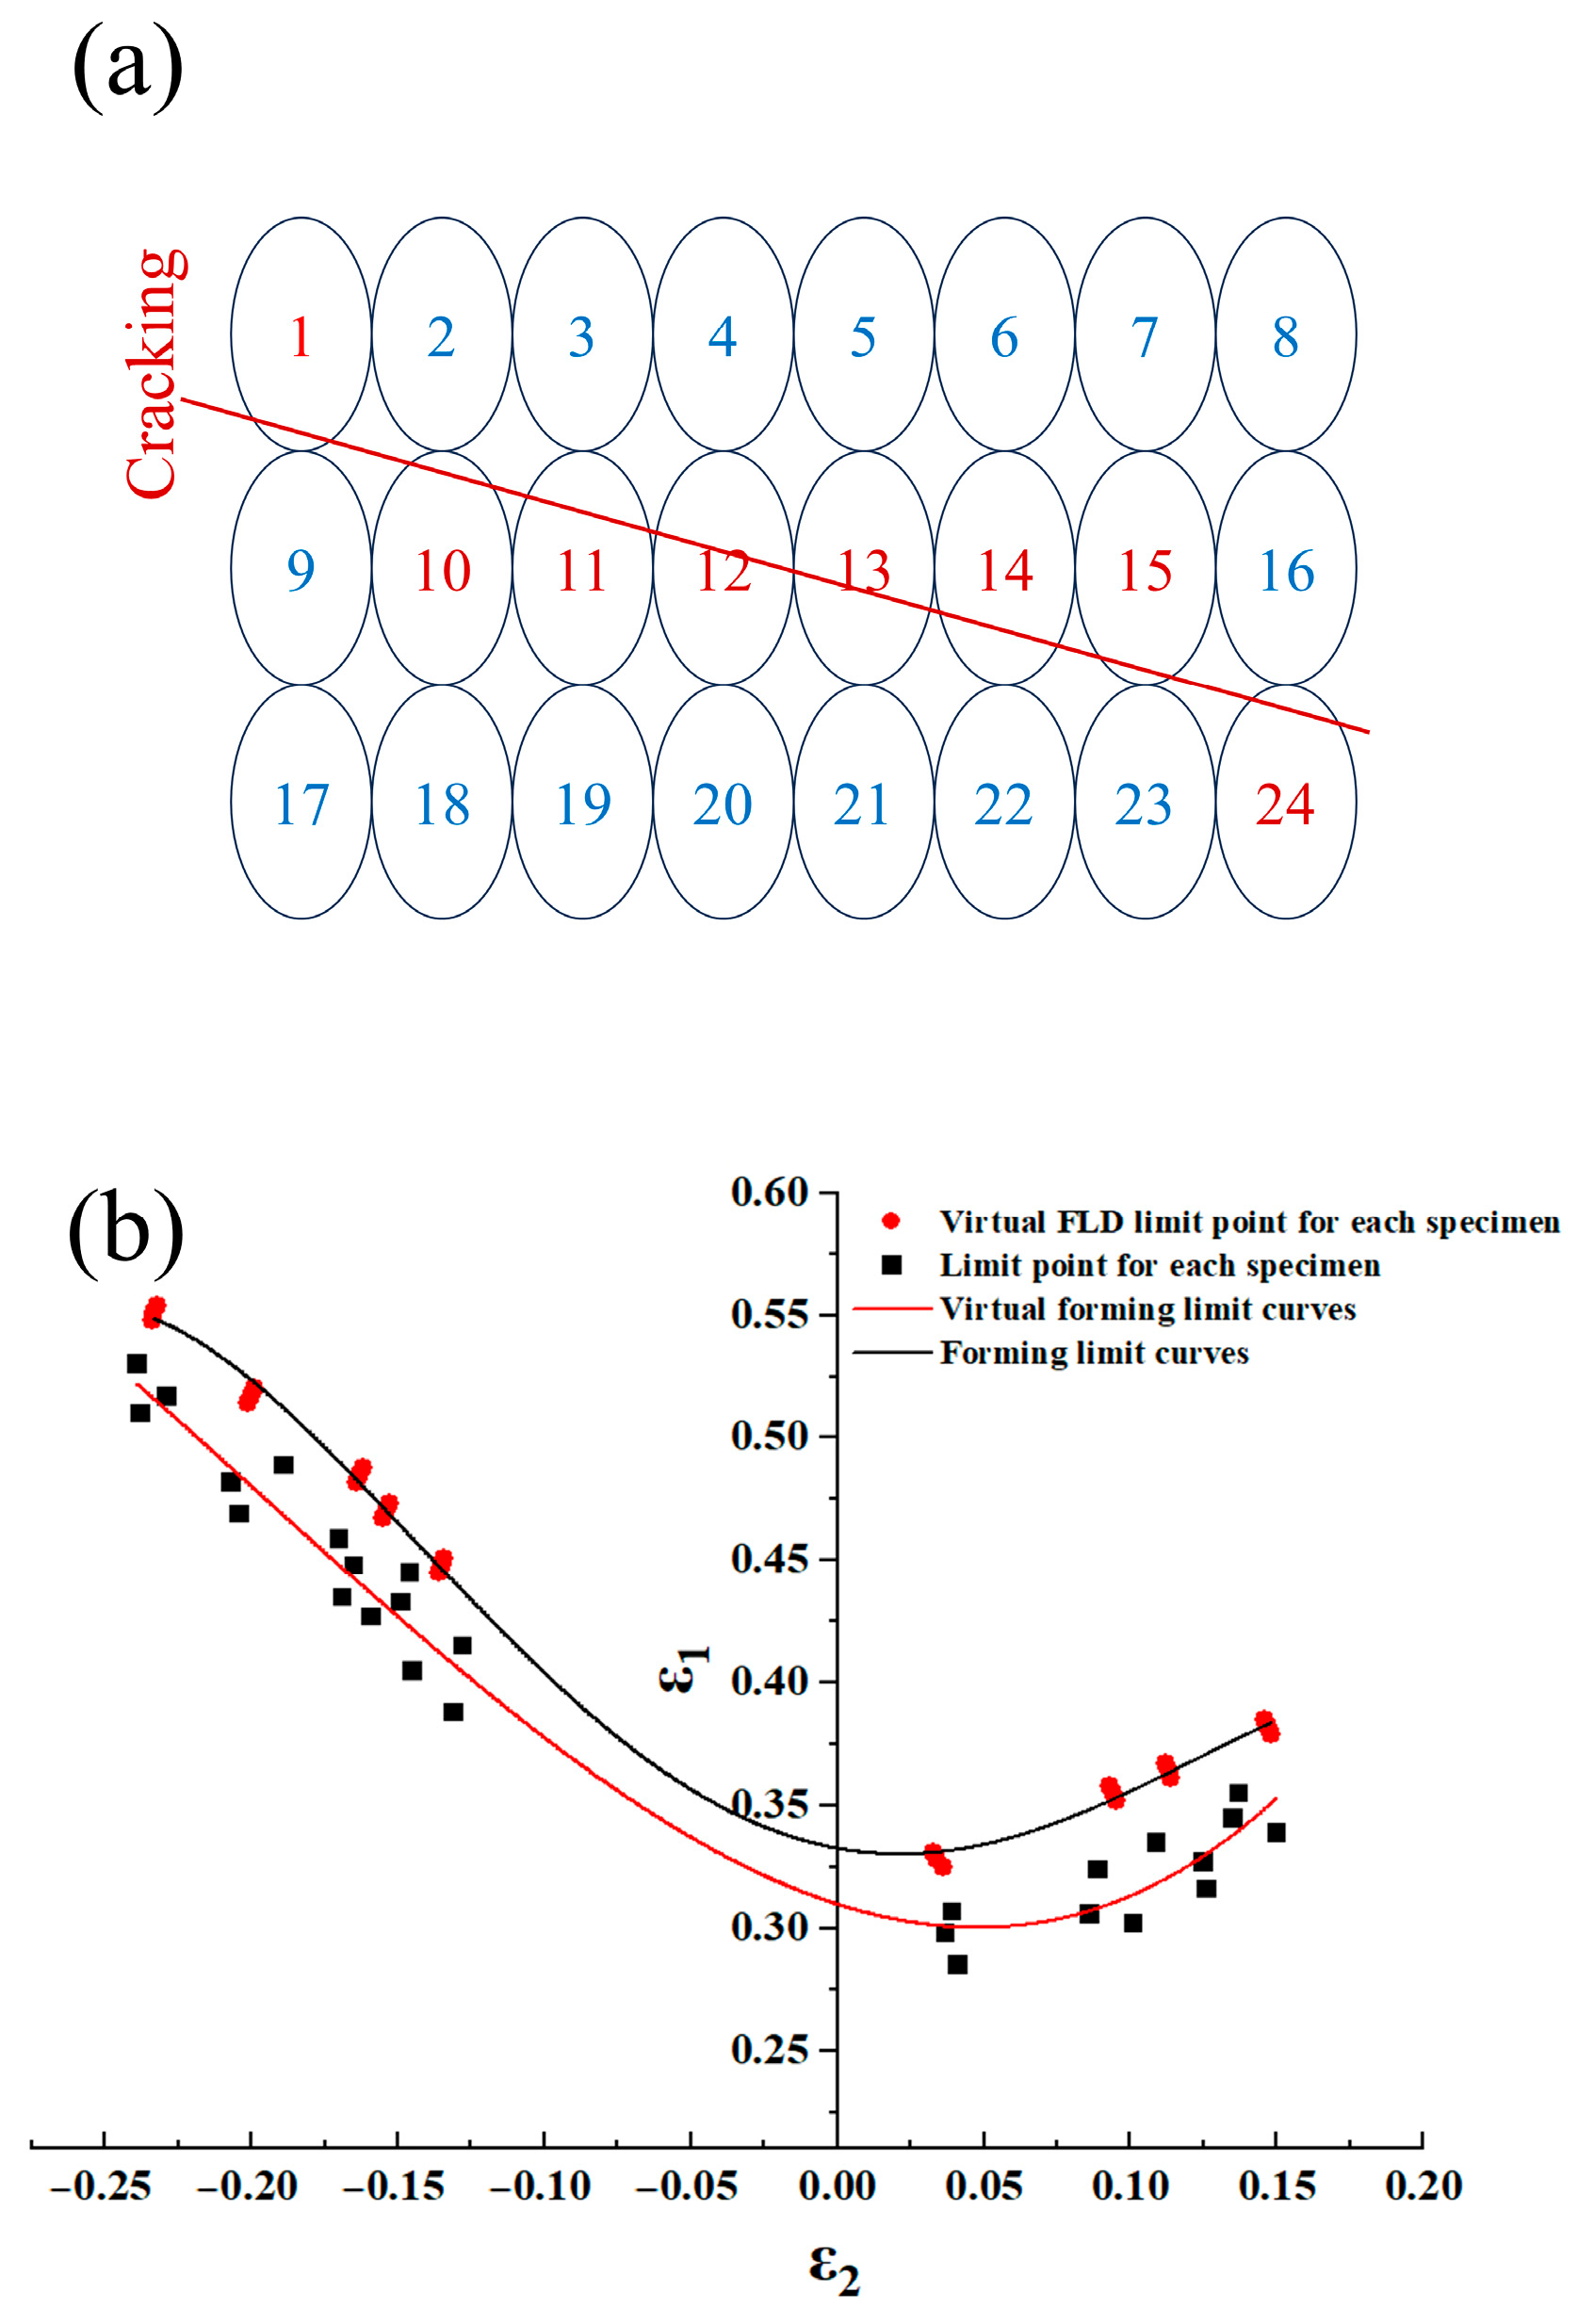
The strain value of the circular mesh generated by local necking after the experiment reflects the ultimate strain of sheet metal forming. However, in the actual stamping production, the local necking of the plate is not allowed to appear, and the mesh circle of the local necking part has been distorted. The measurement error will be generated here, so it is more practical to study the strain value of the mesh near the crack or local necking part. Figure 14a shows that Nos. 1, 9–15, and 24 are fracture mesh circles, while Nos. 2–8 and 16–23 are safety mesh circles. Therefore, the strain measurement is mainly measured in Nos. 2–8 and 16–23.
However, in the actual operation process, it can be seen from Figure 14b that the predicted FLD derived from this criterion is higher than the actual value in both the left and right halves. The reason is that when the punch pressure reaches the peak, the sheet is only close to the ultimate strain state and does not fully reach the ultimate strain state, but the instability occurs after the peak. The reason for this phenomenon is that the ultimate strain obtained in the physical forming limit experiment in this paper is also measured when the cupping test machine force sensor senses that the punch pressure is reduced by 0.5 kN, and the actual mesh strain obtained is measured after the punch pressure peak and has been reduced. Therefore, in terms of the time selection to judge the instability state, the peak time should not be selected in the virtual FLD experiment, but the time when the punch pressure drops significantly after the peak value, so that the ultimate strain of the obtained element will be closer to the instability state.
Experiment and simulation of the IE value can be observed in the ‘tensile-tensile area’ within the range of the IE value of about 16 mm, and in the ‘tensile-compression area’, the IE value has reached about 25 mm because the stainless steel sink molding is a tensile compression process so that it can provide a feasible basis for subsequent stainless steel sink 210 mm stamping molding. The forming limit curves obtained from the experiment and simulation can effectively deduce the trend of the forming limit curve of the stainless steel sink. They can also reflect that the unit in the stretching and compression area of the sheet during the stamping process is more than the unit in the ‘tensile-tensile area’, that is, in the ‘tensile-compression area’. The principal and minor strains received by the material are more significant than the principal and minor strains in the ‘tensile-tensile area’. The experimental parameters of the cupping test simulation are applied to the simulation of the stainless steel sink to find the optimal parameters for the stamping forming of the stainless steel sink in the following variable parameter simulation.

3.3. Finite Element Analysis of Stainless Steel Sink

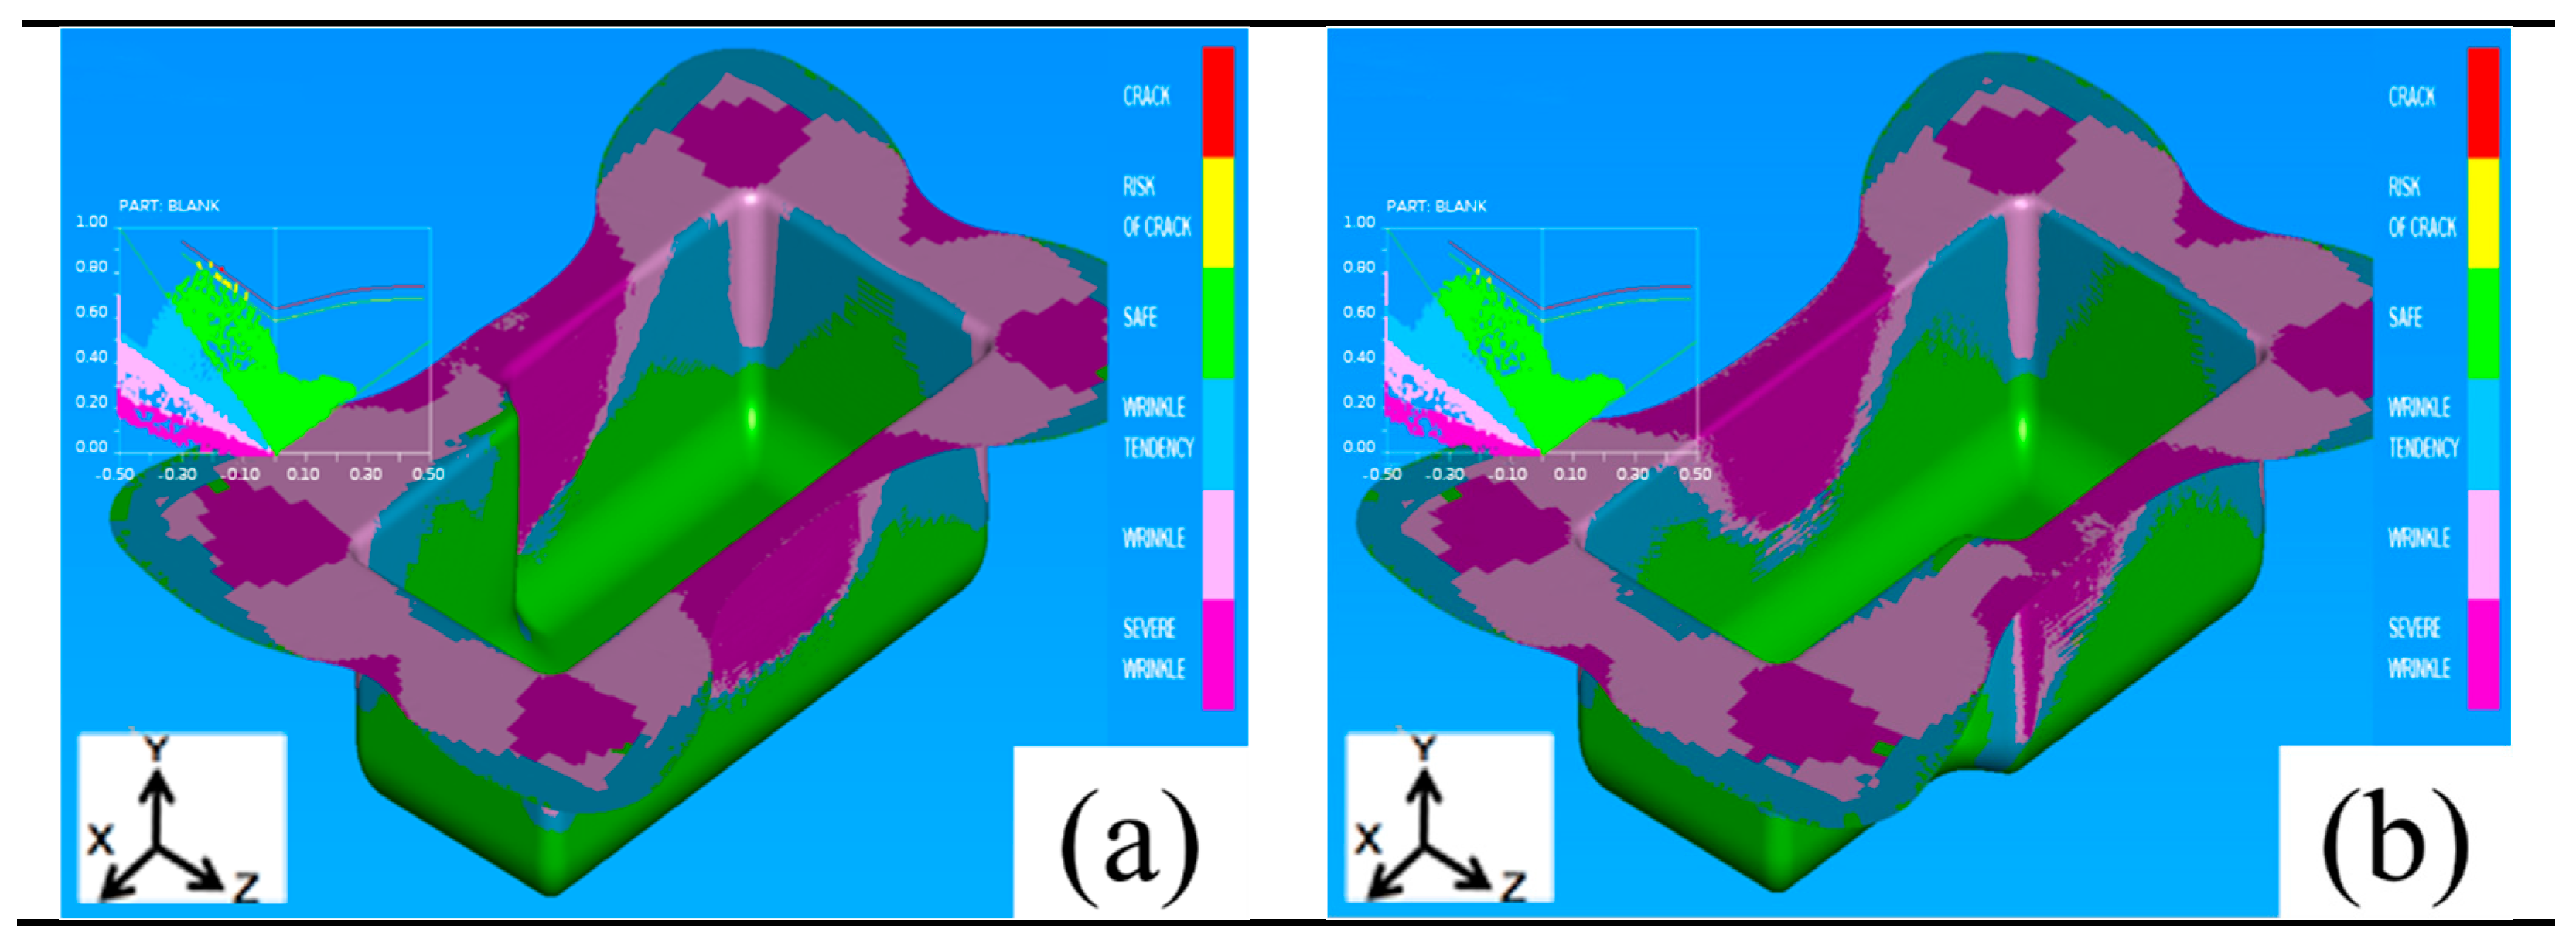
When the process parameters such as stamping speed, blank holder force, and friction coefficient are unchanged, by changing the fillet radius R of the die in the mold from the initial 10 mm to 5 mm, the quality of the forming has been dramatically improved. It can be seen from Figure 15a that when R is 10 mm, the stamping speed is 20 mm/s, and the blank holder force is 3 MPa, a single unit cracking situation appears at the corner of the large and minor grooves. Figure 15b shows the FLD diagram with R of 5 mm when the above process parameters remain unchanged, and it is evident that no cracking occurs when the fillet radius R is changed. It should be noted that the size of the specimen here is changed to 1250 mm× 850 mm× 0.72 mm because the different size of the specimen will lead to a different forming limit diagram, so the forming limit diagram is different from the above results obtained through the finite element simulation cupping test (Figure 13). Due to the excessive stamping depth, wrinkling is inevitable, appearing in the sink’s flange and the side wall part close to the flange. However, the severe wrinkling problem has disappeared. The drawing die R greatly influences the drawing, and the size must be appropriate to meet the production needs. It can be concluded that R, too large and too small, will impact the sink molding and mold life. Therefore, changing the process parameters with a fillet radius R of 5 mm can effectively find the optimal parameters.
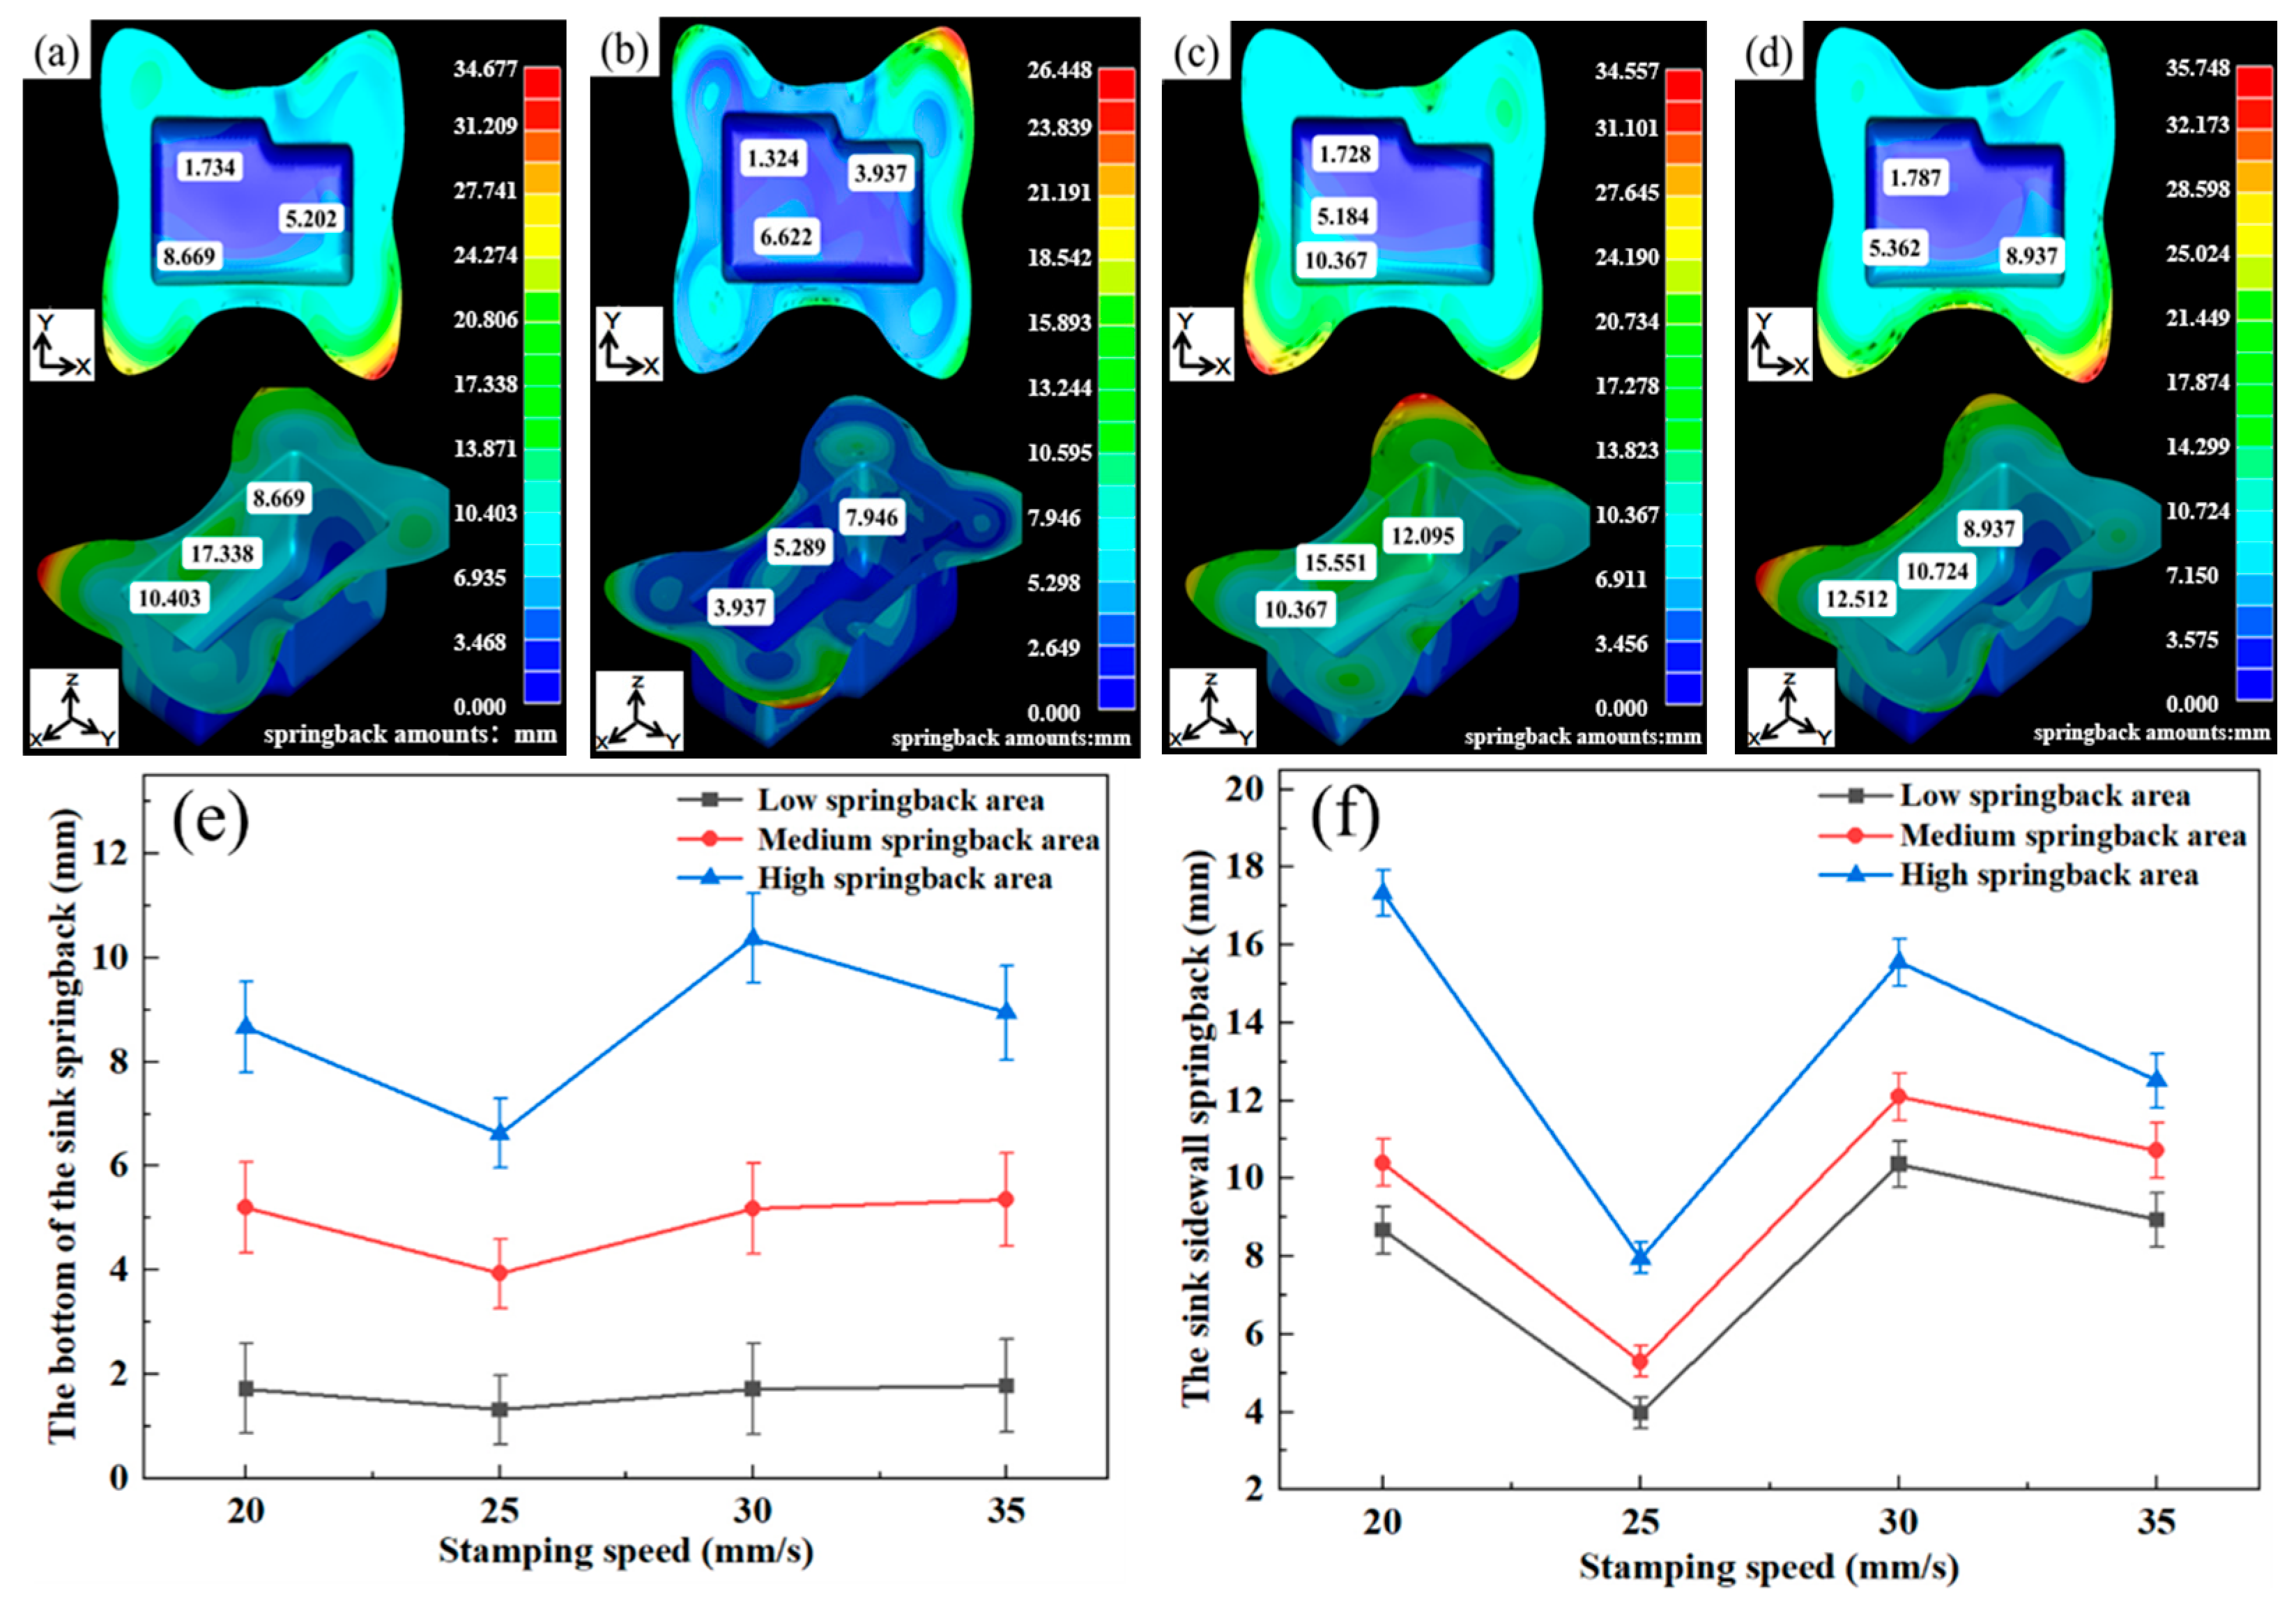
As shown in Figure 15 above, ε2 of most sheet metal elements during deep drawing are <0; that is, the strain of each element of sheet metal is in a compressed state. For the sheet metal drawing process, the moving speed of the slider in the press is the forming speed of the sheet metal, which can be understood as the strain rate of the sheet metal at the microscopic level. According to the plastic forming theory of metal materials, increasing strain rates will cause significant work hardening. However, the heat generated during the plastic deformation process will weaken the work-hardening phenomenon when the forming speed increases. Due to the large volume of the stainless steel sink, the influence of changing the stamping speed on the forming quality cannot be observed under macro observation, so the springback amount under different parameters is measured by three nodes for comparative analysis. The springback amount of the side wall and bottom of the stainless steel sink is divided into three parts: low springback area, medium springback area, and high springback area. Figure 16a–d are the contour cloud maps of the springback amount of the bottom and side walls of the sink under 20 mm/s, 25 mm/s, 30 mm/s, and 35 mm/s, respectively. The relationship between the stamping speed and the springback amount of the bottom and side walls is shown in Figure 16e,f. The simulation results of the influence of stamping speed on forming show that different stamping speeds greatly influence the bottom area and side wall area. Within a specific range of stamping speed (20 mm/s~35 mm/s), the changing trend of the springback of the bottom and side wall areas is the same. When the speed is 25 mm/s, the forming quality is the best, and the springback is the least.
The numerical simulation analysis of variable blank holder force in the stainless steel sink drawing process shows that cracks and wrinkles will be formed in some areas. When the binder holder force is too large, it quickly leads to the cracking problem of the sink. When the pressure is insufficient, it quickly leads to the wrinkling problem of the sink, so controlling the holder force can effectively control the forming process of the stainless steel sink. Under the constant friction coefficient of 0.125, different blank holder forces were set to observe the influence of blank holder forces on the formability of stainless steel sinks. Based on the above stamping speed of 25 mm/s, under a friction coefficient of 0.125, the blank holder force of the holder ring is changed. Through the simulation of the springback amount of the sink, the blank holder force is set to 3 MPa, 4.5 MPa, 6 MPa, and 10 MPa successively, as shown in Figure 17. The results show that a gradually pressurized blank holder force will lead to an increase in springback. The relationship graph between blank holder force and springback can reflect the trend of the increase in springback. In summary, it can be found that when the blank holder force is 3 MPa, the bottom springback of the stainless steel sink is the smallest.
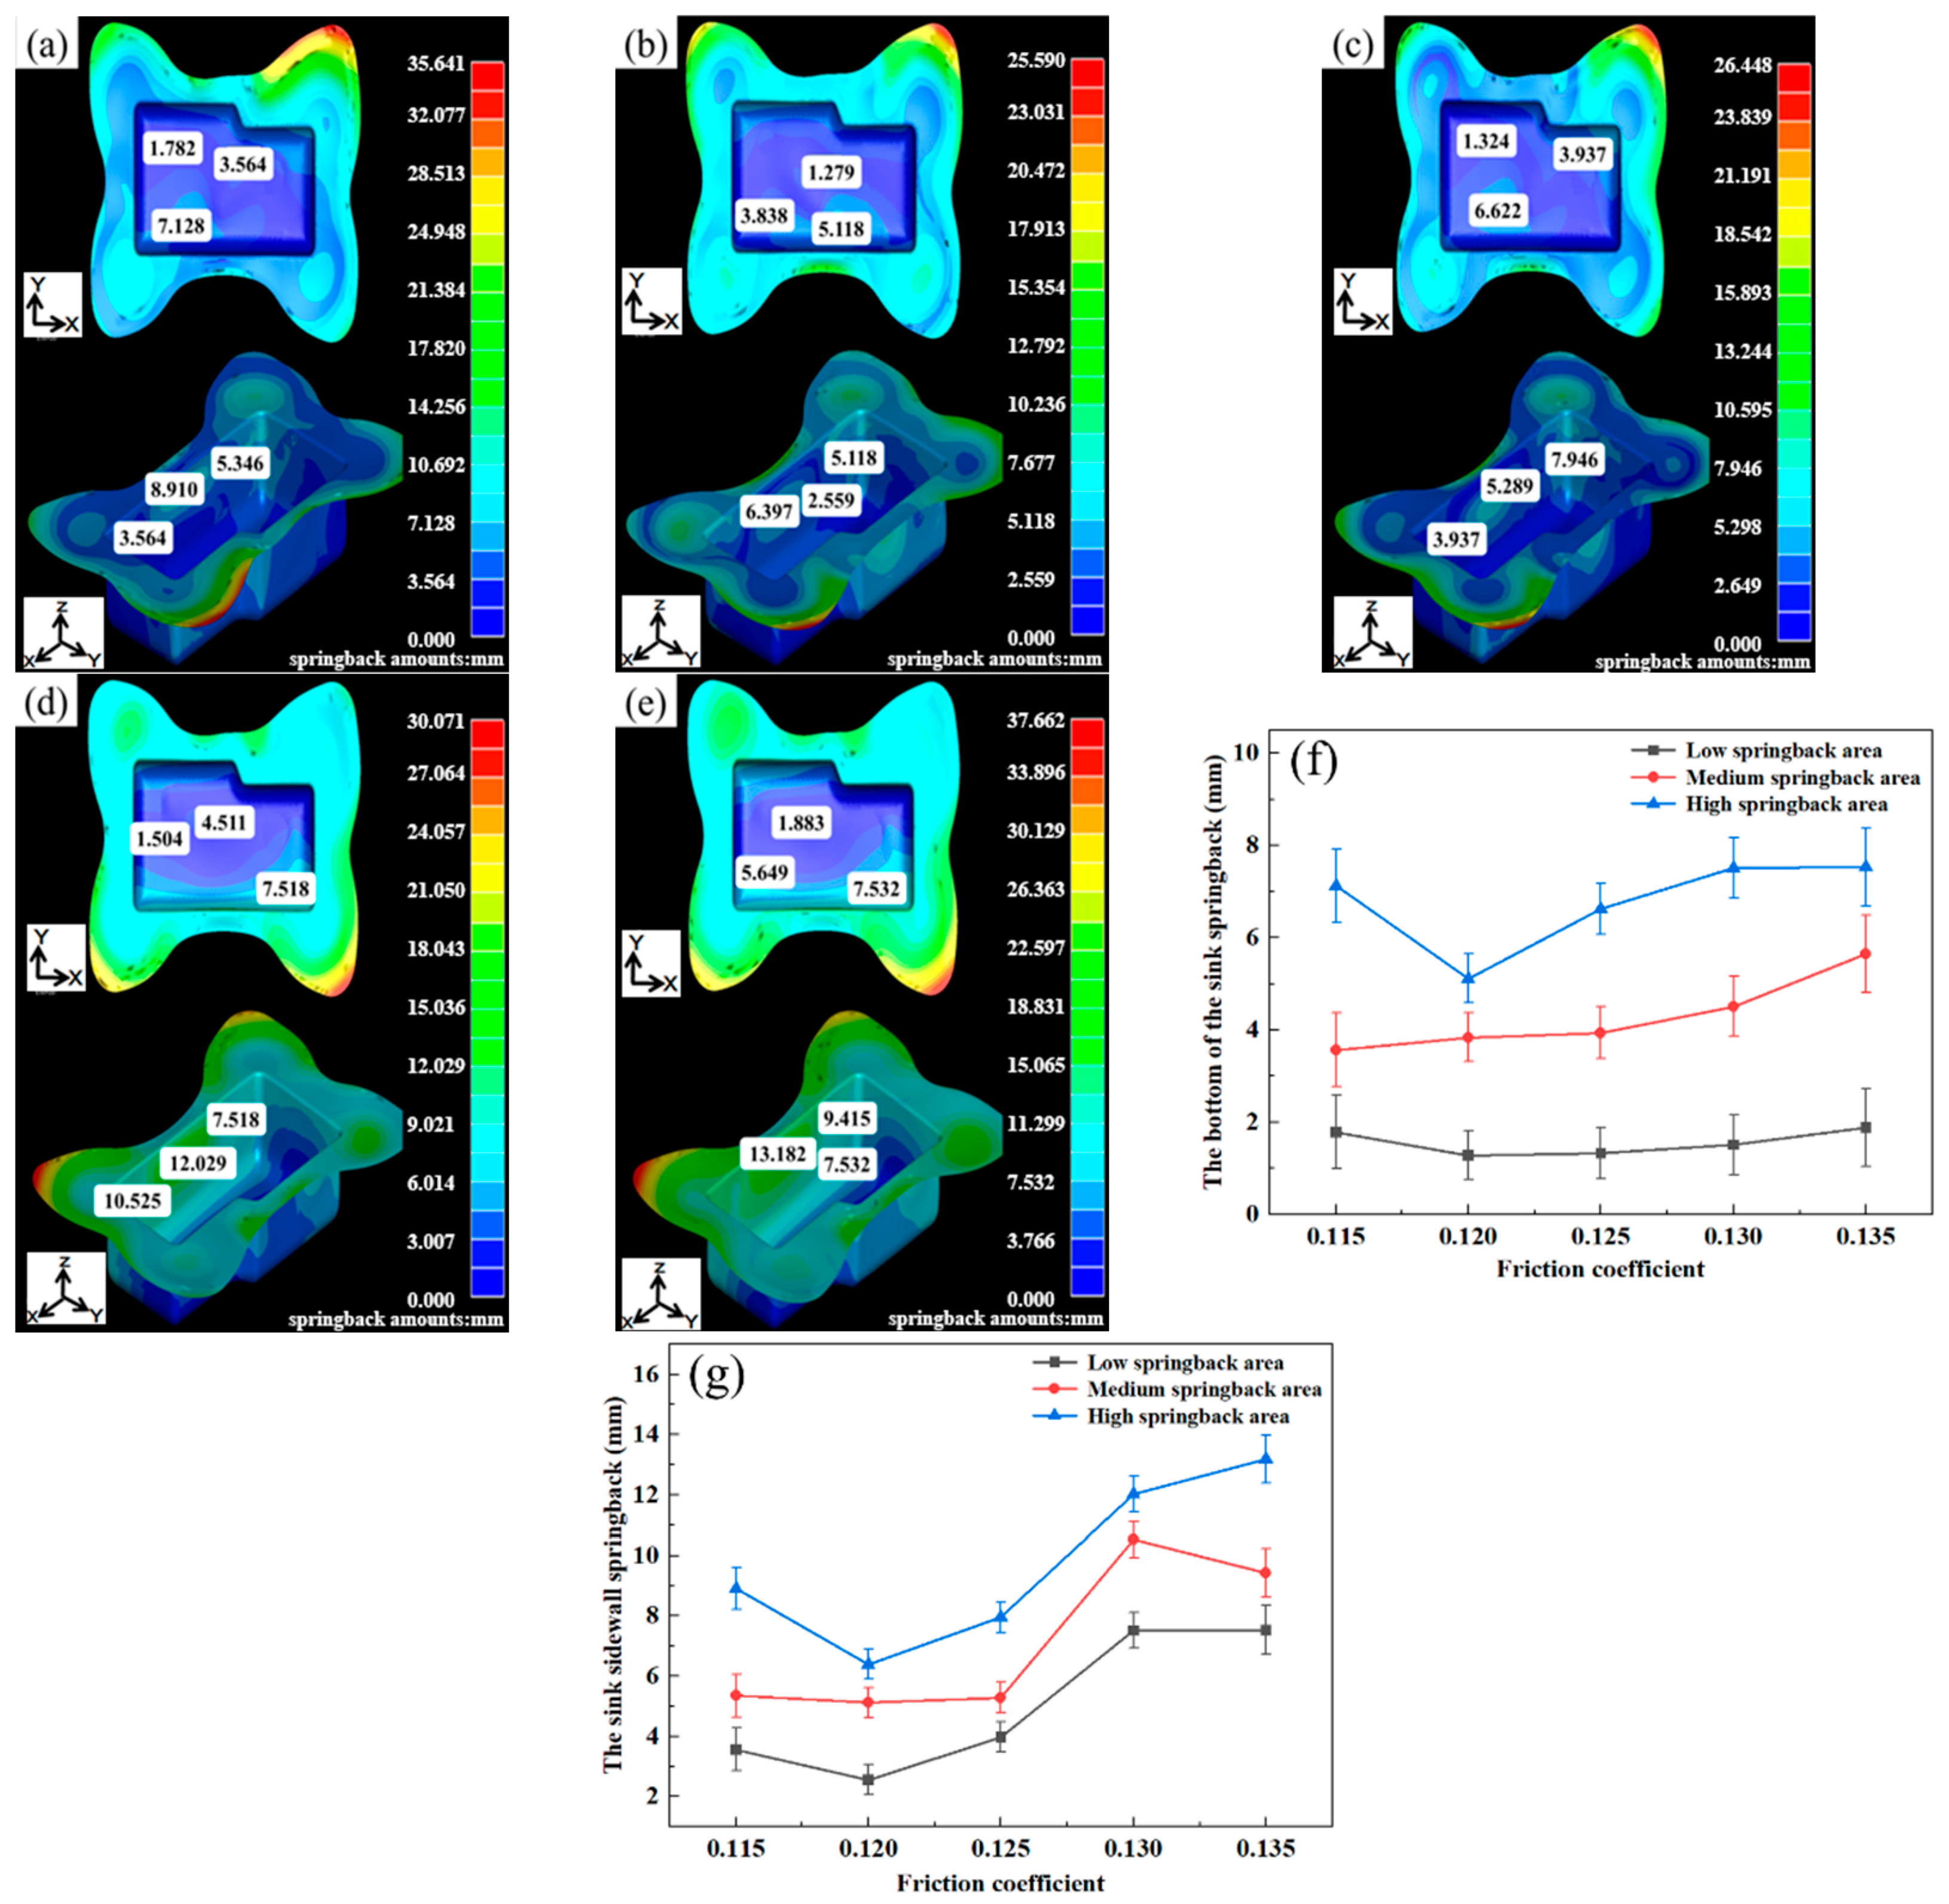
Based on the stamping speed of 25 mm/s and the blank holder force of 3 MPa, the friction coefficient between the mold and the sheet metal is changed. Figure 18 shows the contour cloud map of the springback amount of a stainless steel sink with a friction coefficient of 0.115, 0.120, 0.125, 0.130, and 0.135, respectively, and the relationship between the friction coefficient and the springback amount. Based on 0.125, the gradual increase in the friction coefficient will show a noticeable trend of increasing springback, while the gradual decrease in the friction coefficient will first decrease and then increase. Compared with the simulation data, it is concluded that the friction coefficient is 0.120, and the springback amount in each springback area is the smallest. The sink bottom’s minimum and maximum springback amounts are 1.279 mm and 5.118 mm, and the sink side wall’s minimum and maximum springback amounts are 2.559 mm and 6.379 mm.
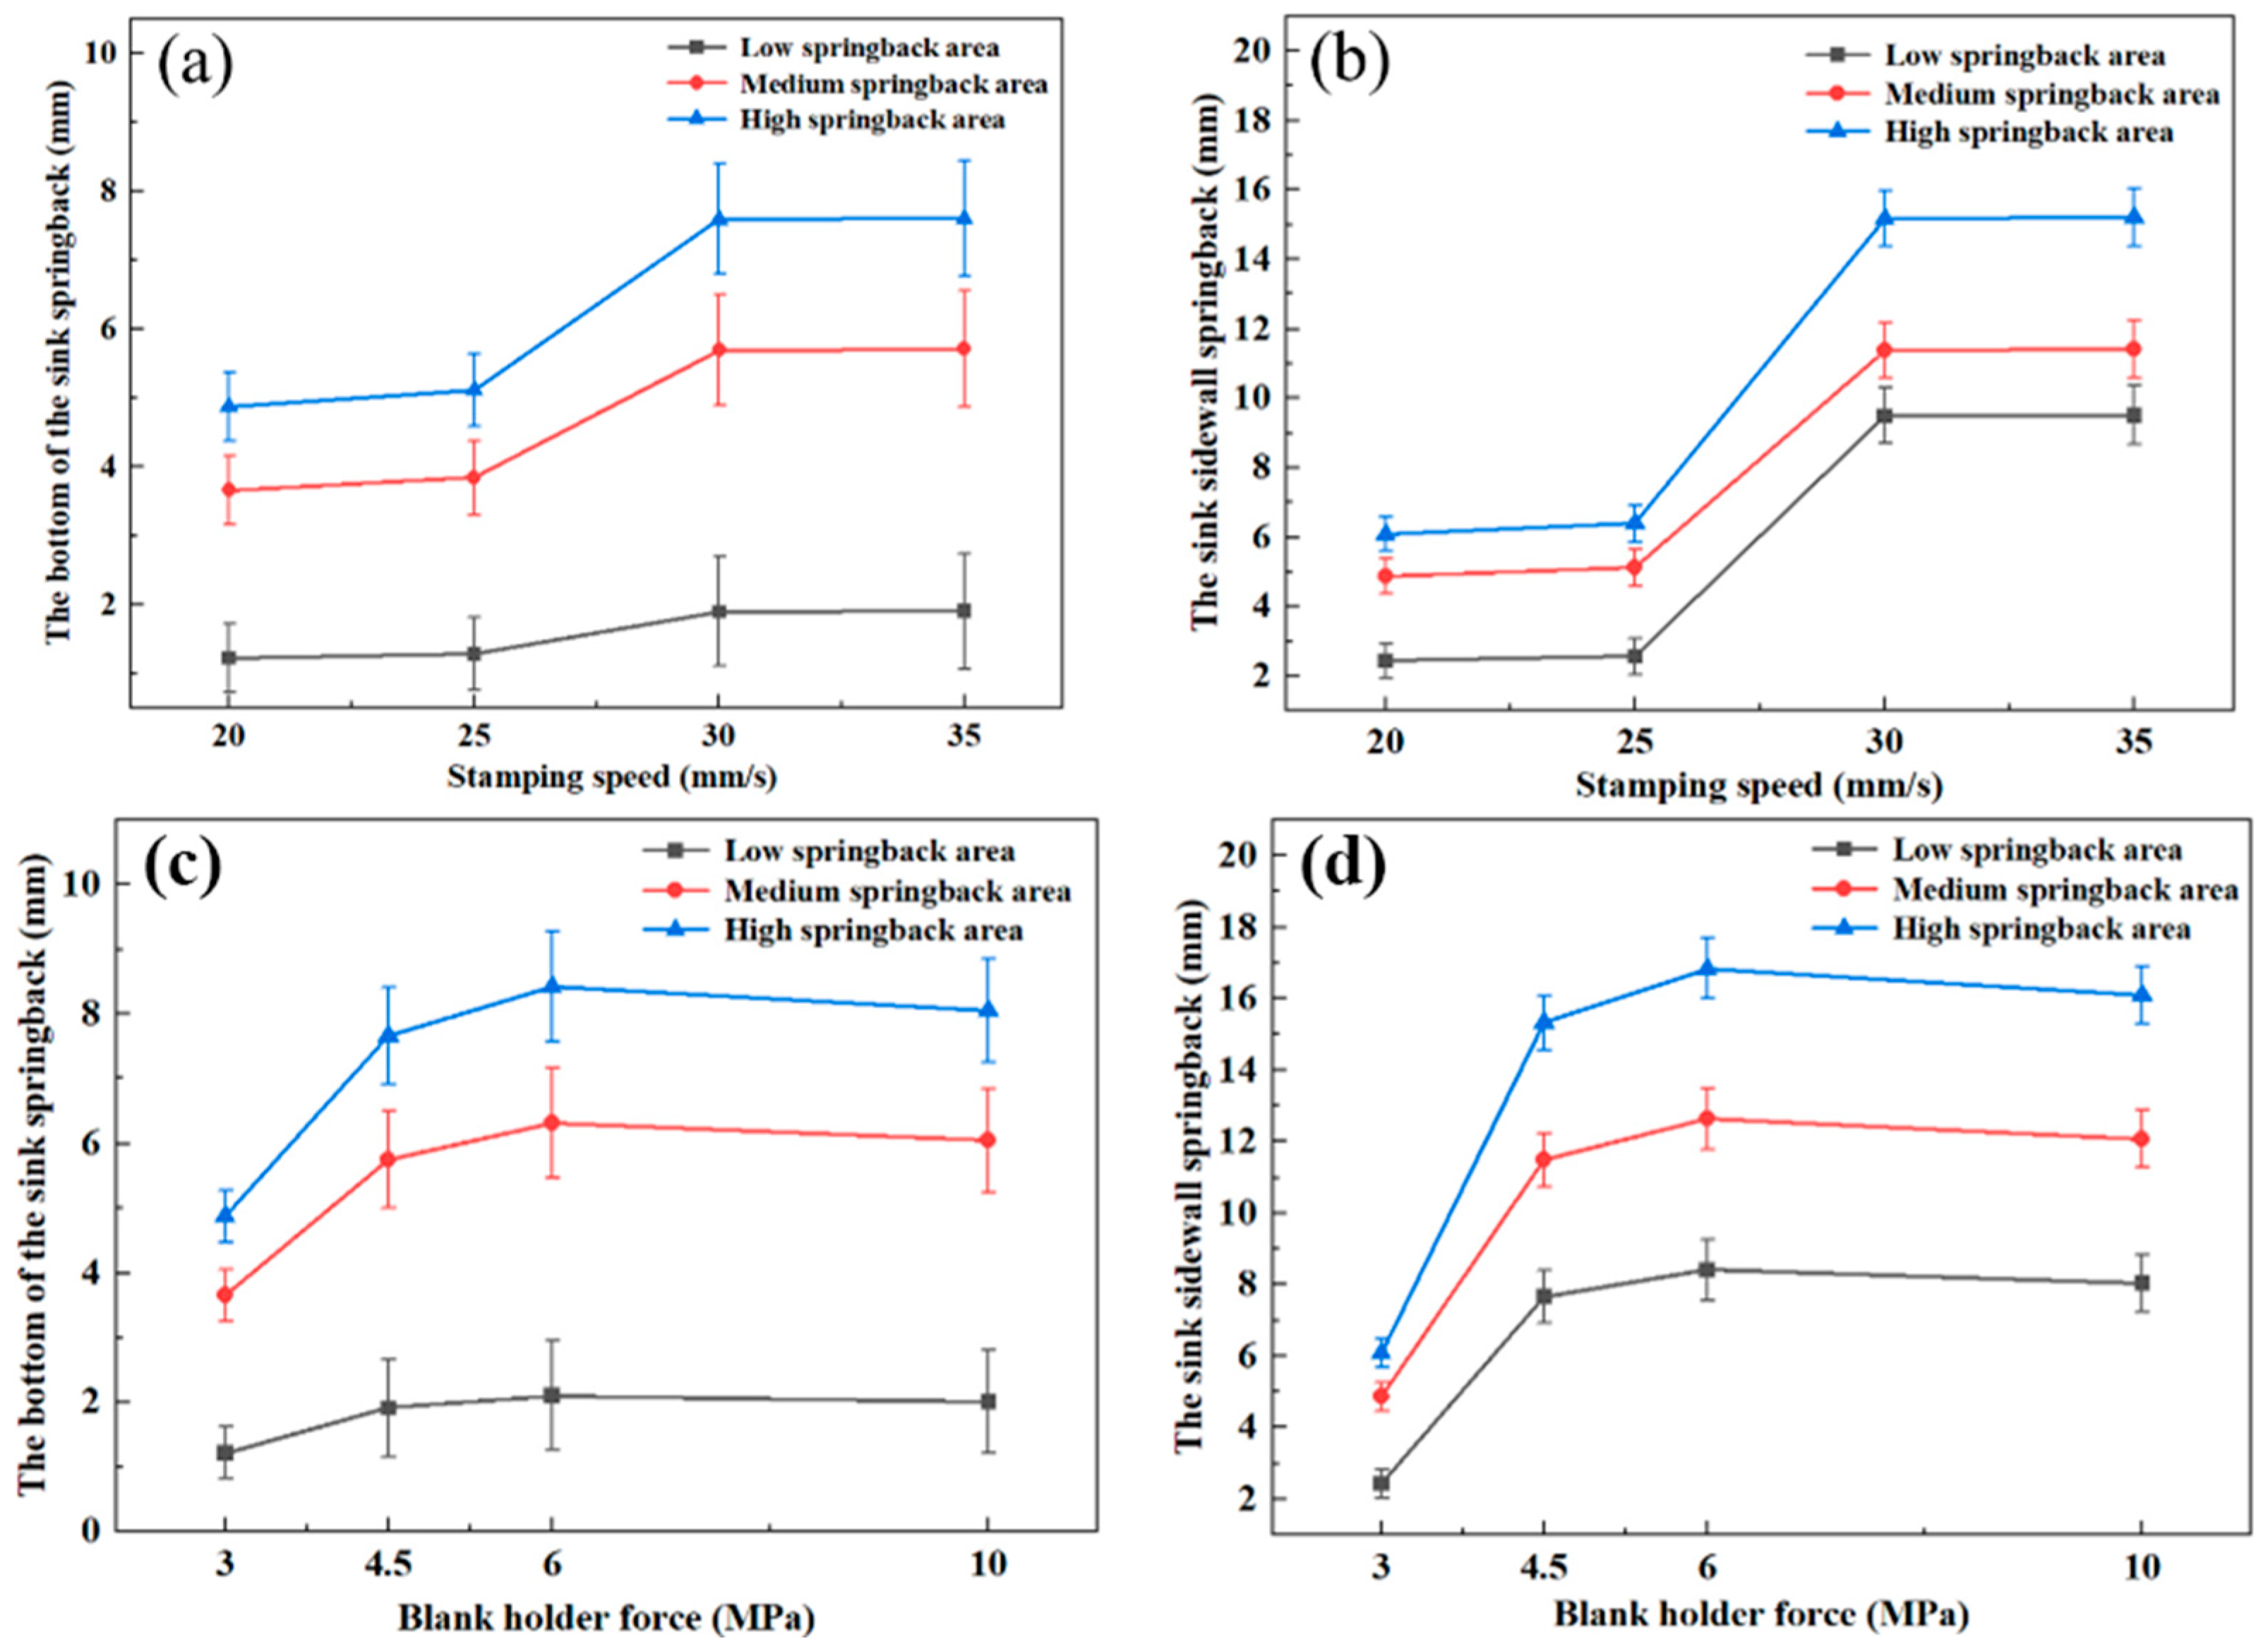
The following are the process parameters under the optimized friction coefficient of 0.120. The optimal parameters under simulation are obtained through the optimization simulation of different stamping speeds and different blank holder forces. Figure 19 shows the relationship graph of the stamping speed, blank holder force, and springback amount under the optimal parameters. The results show that when the stamping speed is 20 mm/s and the blank holding force is 3 MPa, the springback of each springback area is the smallest. The sink bottom’s minimum and maximum springback amounts are 1.218 mm and 4.872 mm, and the sink side wall’s minimum and maximum springback amounts are 2.436 mm and 6.090 mm.
Experimental parameters were simulated and optimized process parameters, as shown in Table 5. It showed that no obvious tensile cracking or bonding between the mold and the sheet metal in terms of forming quality. Due to the enormous strain of cold working, there would be internal tensile stress. The edges are uneven, the side walls of the sink are not straight, and there is springback, and the hard traces at the corners will still exist, as shown in Figure 20. However, the springback of the bottom and the wrinkling of the flange part will be significantly reduced. Therefore, by setting different die fillet sizes, stamping speed, blank holder force, friction coefficient, and other process parameters, the problems of wrinkling, cracking, and springback can be effectively controlled.

4. Conclusions

  • The mechanical properties of SUS304 stainless steel show obvious anisotropy in TD, R45, and RD directions. The TD direction has the greatest yield strength and tensile strength, while it has the lowest elongation, which is 11.8% lower than that in the rolling direction.
  • The cupping test under finite element simulation and experiment shows that under the simulation process parameters of stamping speed of 20 mm/s, blank holder force of 3 MPa, and friction coefficient of 0.120, the IE value of the specimen reaches 17.142 mm, which is slightly larger than that of 16.572 mm obtained by experiment. In terms of forming limits, the forming limit curve obtained by simulation is higher than that obtained by experiment.
  • The stamping speed, blank holder force, and friction coefficient have a significant impact on the springback amount. Based on the verification through numerical simulation and on-site experiments in enterprises, the optimum springback was obtained when the fillet radius R was 5 mm, the stamping speed was 20 mm/s, the blank holder force was 3 MPa, and the friction coefficient was 0.120.

Author Contributions

Conceptualization, Y.L. and J.X.; Investigation, Y.L. and B.L. All authors have read and agreed to the published version of the manuscript.

Funding

The authors gratefully acknowledge the financial support from the Central government guides local funds for science and technology development (YDZJSX20231A045) and the Shanxi Province key research and development project (202202150401016).

Data Availability Statement

The original contributions presented in this study are included in the article. Further inquiries can be directed to the corresponding author.

Conflicts of Interest

Authors Yajie Li and Jianguang Xu were employed by the company Ningbo Oulin Kitchenware Co., Ltd. The remaining author declares that the research was conducted in the absence of any commercial or financial relationships that could be construed as a potential conflict of interest.

References

  1. Alomari, A.S. Serrated yielding in austenitic stainless steels. Mater. High Temp. 2021, 38, 222–236. [Google Scholar] [CrossRef]
  2. Xie, Y.M.; Feng, K.; Du, M.Y.; Li, L. Robust optimization of stamping process based on Bayesian estimation. J. Manuf. Process. 2023, 101, 245–258. [Google Scholar] [CrossRef]
  3. Emmens, W.C.; Sebastiani, G.; Van Den Boogaard, A.H. The technology of Incremental Sheet Forming-A brief review of the history. J. Mater. Process. Technol. 2010, 210, 981–997. [Google Scholar] [CrossRef]
  4. Ieazadeh, A.R.; Shamloofard, M.; Assempour, A. Some improvements on the one-step inverse isogeometric analysis by proposing a multi-step inverse isogeometric methodology in sheet metal stamping processes. Appl. Math. Model. 2021, 91, 476–492. [Google Scholar] [CrossRef]
  5. Wang, Z.L.; Yuan, Y.J.; Zhang, S.Y.; Lin, Y.C.; Tan, J.R. A multi-state fusion informer integrating transfer learning for metal tube bending early wrinkling prediction. Appl. Soft. Comput. 2024, 151, 110991. [Google Scholar] [CrossRef]
  6. Wang, G.D.; Cao, J.Y.; Zhou, Y.R.; Tian, N. Effects of Mg content on microstructure, mechanical properties and fracture behavior of wrought Al-8Si-(<0.01–1.32)Mg alloy sheets in T6 temper. J. Alloys Compd. 2023, 960, 170818. [Google Scholar]
  7. Huang, H.; Yang, W.; Ming, W.Y.; Zhang, G.J.; Xu, Y.J.; Zhang, Z. Mechanism of springback behavior in ultra-thin glass molding process: A molecular dynamics study. J. Non. Cryst. Solids 2022, 596, 121841. [Google Scholar] [CrossRef]
  8. Kothunde, N.; Krishna, G.; Shenoy, S.K.; Gupta, A.K.; Singh, S.K. Experimental and theoretical investigation of forming limit diagram for Ti-6Al-4V alloy at warm condition. Int. J. Mater. 2017, 10, 255–266. [Google Scholar]
  9. Adamus, J.; Dyja, K.; Motyka, M. Experimental and Theoretical Determination of Forming Limit Curve. Arch. Metall. Mater. 2015, 60, 1881–1885. [Google Scholar] [CrossRef]
  10. Narayanasamy, R.; Narayanan, C.S. Experimental analysis and evaluation of forming limit diagram for interstitial free steels. Mater. Des. 2007, 28, 1490–1512. [Google Scholar] [CrossRef]
  11. Narayanasamy, R.; Narayanan, C.S. Forming, fracture and wrinkling limit diagram for if steel sheets of different thickness. Mater. Des. 2007, 29, 1467–1475. [Google Scholar]
  12. Kuroda, M.; Tvergaard, V. Forming limit diagrams for anisotropic metal sheets with different yield criteria. Int. J. Solids Struct. 2000, 37, 5037–5059. [Google Scholar] [CrossRef]
  13. Geiger, M.; Merklein, M. Determination of forming limit diagrams—A new analysis method for characterization of materials’ formability. CIRP Ann. Manuf. Technol. 2003, 52, 213–216. [Google Scholar] [CrossRef]
  14. Nakazima, K.; Kikuma, T.; Hasuka, K. Study on the formability of steel sheets. Yawata Tech. Rep. Sept. 1968, 264, 8414–8442. [Google Scholar]
  15. Keeler, S.P.; Backhofen, W.A. Plastic Instability and Fracture in Sheet Stretched over Rigid Punches. ASM Sci. J. 1963, 56, 25–48. [Google Scholar]
  16. Goodwin, G.M. Application of Strain Analysis to Sheet Metal Forming Problems in the Press Shop. SAE Trans. 1968, 77, 380–387. [Google Scholar]
  17. Wang, L.; Lee, T.C. The effect of yield criteria on the forming limit curve prediction and the deep drawing process simulation. Int. J. Mach. Tool. Manu. 2006, 46, 988–995. [Google Scholar] [CrossRef]
  18. Takuda, H.; Mori, K.; Hatta, N. The application of some criteria for ductile fracture to the prediction of the forming limit of sheet metals. J. Mater. Process. Technol. 1999, 95, 116–121. [Google Scholar] [CrossRef]
  19. Swift, H.W. Plastic instability under plane stress. J. Mech. Phys. Solids 1952, 1, 1–18. [Google Scholar] [CrossRef]
  20. Marciniak, Z.; Kuczynski, K. Limit strains in the processes of stretch-forming sheet metal. Int. J. Mech. 1967, 9, 609–620. [Google Scholar] [CrossRef]
  21. Neuhauser, F.M.; Terrazas, O.; Manopulo, N.; Pavel, H.; Chester, V.T. The bending dependency of forming limit diagrams. Int. J. Mater. Form. 2019, 12, 815–825. [Google Scholar] [CrossRef]
  22. Mohamadnejad, Z.S.; Basti, A.; Ansari, R. Prediction of forming limit diagram for different strain paths in crystalline FCC ideal-orientation material. Mech. Time-Depend. Mater. 2023, 27, 1123–1138. [Google Scholar] [CrossRef]
  23. Hattalli, V.L.; Srivatsa, S.R. Sheet Metal Forming Processes-Recent Technological Advances. Mater. Today Proc. 2018, 5, 2564–2574. [Google Scholar] [CrossRef]
  24. Zhang, D.H.; Bai, D.P.; Liu, J.B.; Gou, Z.; Guo, C. Formability behaviors of 2A12 thin-wall part based on DYNAFORM and stamping experiment. Compos. B Eng. 2013, 55, 591–598. [Google Scholar] [CrossRef]
  25. Hussaini, S.M.; Singh, S.K.; Gupta, A.K. Experimental and numerical investigation of formability for austenitic stainless steel 316 at elevated temperatures. J. Mater. Res. Technol. 2014, 3, 17–24. [Google Scholar] [CrossRef]
  26. Li, F.Q.; Jiang, J.S.; Wang, J.M.; Wang, J.G.; Chen, X.Y. Experimental study and numerical simulation on springback of Ti-6Al-4V alloy under hot U-bending. J. Mech. Sci. Technol. 2023, 37, 3691–3697. [Google Scholar] [CrossRef]
  27. Folle, L.F.; Schaeffer, L. Effect of surface roughness and lubrication on the friction coefficient in deep drawing processes of aluminum alloy aa1100 with fem analysis. Materia 2019, 24, e12446. [Google Scholar]
  28. Tiwari, P.R.; Rathore, A.; Bodkhe, M.G. Factors affecting the deep drawing process—A review. Mater. Today Proc. 2022, 56, 2902–2908. [Google Scholar] [CrossRef]
  29. Müller, M.; Uhlmann, L.; Herrig, T.; Bergs, T. Numerical analysis of the dependence of damage on friction during deep drawing of asymmetric geometries. Adv. Ind. Manuf. Eng. 2024, 8, 1–10. [Google Scholar] [CrossRef]
  30. Hou, Z.X.; Liu, Z.G.; Wan, M.; Wu, X.D.; Yang, B.; Lu, X. An Investigation on Anisotropy Behavior and Forming Limit of 5182-H111 Aluminum Alloy. J. Mater. Eng. Perform. 2020, 29, 3745–3756. [Google Scholar] [CrossRef]
  31. Hussaini, S.M.; Krishna, G.; Gupta, A.K.; Singh, S.K. Development of experimental and theoretical forming limit diagrams for warm forming of austenitic stainless steel 316. J. Manuf. Process. 2015, 18, 151–158. [Google Scholar] [CrossRef]
  32. Djavanroodi, F.; Derogar, A. Experimental and numerical evaluation of forming limit diagram for Ti6Al4V titanium and Al6061-T6 aluminum alloys sheets. Mater. Des. 2010, 31, 4866–4875. [Google Scholar] [CrossRef]
  33. Ahmadi, S.; Eivani, A.R.; Akbarzadeh, A. Experimental and analytical studies on the prediction of forming limit diagrams. Comp. Mater. Sci. 2009, 44, 1252–1257. [Google Scholar] [CrossRef]
  34. Stoughton, T.B.; Zhu, X.H. Review of theoretical models of the strain-based FLD and their relevance to the stress-based FLD. Int. J. Plast. 2004, 20, 1463–1486. [Google Scholar] [CrossRef]
  35. Ju, L.; Mao, T.T.; Li, H.B. An experimental and numerical study of forming limits of AA5182-O. Int. J. Adv. Manuf. Technol. 2015, 79, 221–228. [Google Scholar] [CrossRef]
  36. Barlat, F.; Lian, K. Plastic behavior and stretchability of sheet metals. Part I: A yield function for orthotropic sheets under plane stress conditions. Int. J. Plast. 1989, 5, 51–66. [Google Scholar] [CrossRef]
  37. Sudarsan, C.; Prasad, K.S.; Hazra, S.; Panda, S.K. Forming of serpentine micro-channels on SS304 and AA1050 ultra-thin metallic sheets using stamping technology. J. Manuf. Process. 2020, 56, 1099–1113. [Google Scholar] [CrossRef]
  38. Xu, Y.W.; Li, W.Z.; Tian, W.; Liang, J.G.; Zhang, G.Q.; Zhao, C.J. Microstructural evolution of external cold extrusion spinning 304 stainless steel with cumulative large deformation in multiple passes. Int. J. Adv. Manuf. Technol. 2022, 123, 1009–1024. [Google Scholar] [CrossRef]
  39. Xu, Y.; Zhang, S.H.; Cheng, M.; Song, H.W. Effect of Loading Modes on Mechanical Property and Strain Induced Martensite Transformation of Austenitic Stainless Steels. Acta Metall. Sin. 2013, 7, 775–782. [Google Scholar] [CrossRef]
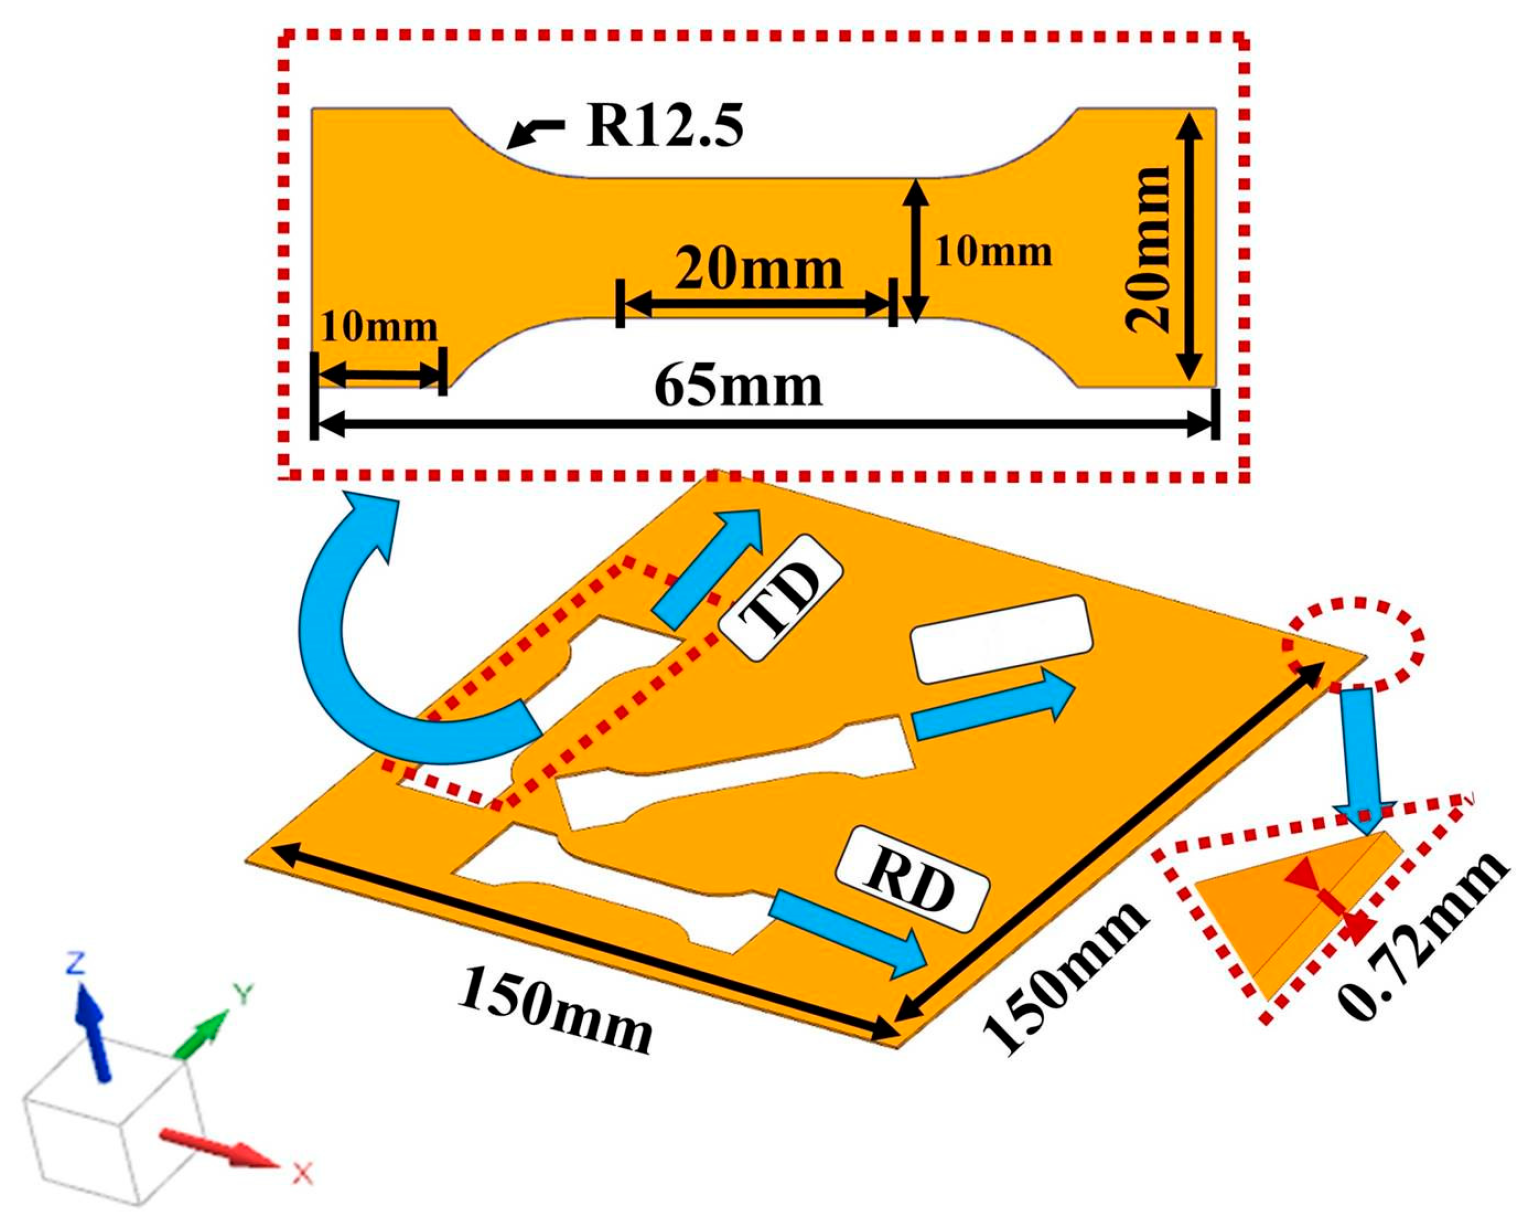
Figure 1. The shape and size of specimen for uniaxial tensile test.
Metals 15 01008 g001
Figure 2. The specimen shapes: (a) rectangular specimen; (b) stepped specimen.
Metals 15 01008 g002
Figure 3. The three-dimensional model of virtual FLD experiment.
Metals 15 01008 g003
Figure 4. Numerical simulation of stainless steel sink: (a) the schematic diagram of the three-dimensional mold; (b) the schematic diagram of the finite element CAE.
Metals 15 01008 g004
Figure 5. ABAQUS post-treatment: (a) initial tensile state; (b) a state of tensile necking; (c) tensile uniform deformation state.
Metals 15 01008 g005
Figure 6. Time–stress curve.
Metals 15 01008 g006
Figure 7. Cloud diagram of principal stress distribution in uniformly deformed mesh elements: (a) σ1; (b) σ2; (c) σ3.
Metals 15 01008 g007
Figure 8. The engineering stress–strain curves of SUS304 austenitic stainless steel.
Metals 15 01008 g008
Figure 9. The diagram of bulging depth of each specimen for simulation and experiment: (a) 100 × 100; (b) 100 × 80; (c) 100 × 60; (d) 100 × 40; (e) 100 × 20; (f) 100 × 17.5; (g) 100 × 15; (h) 100 × 12.5; (i) 100 × 10.
Metals 15 01008 g009
Figure 10. Cupping test: (a) the schematic diagram of bulging depth for simulation and experiment (100 × 60); (b) the load-displacement curves of cupping test.
Metals 15 01008 g010
Figure 11. Strain path criterion: (a) sudden change in strain path of unit 15471; (b) forming limit diagram under strain path criterion.
Metals 15 01008 g011
Figure 12. Punch maximum pressure criterion: (a) the relationship between the contact force of the punch and the sheet over time; (b) the forming limit diagram under the punch maximum pressure criterion.
Metals 15 01008 g012
Figure 13. Forming limit diagram of finite element simulation with DYNAFORM software: (a) 100 × 100; (b) 100 × 80; (c) 100 × 60; (d) 100 × 40; (e) 100 × 20; (f) 100 × 17.5; (g) 100 × 15; (h) 100 × 12.5; (i) 100 × 10.
Metals 15 01008 g013
Figure 14. Forming limit diagram: (a) the mesh circle diagram after experiment; (b) the simulation and experimental Forming Limit Curves.
Metals 15 01008 g014
Figure 15. The forming limit diagram of stainless steel sink under different fillet radius R of the die: (a) R 10 mm (b) R 5 mm.
Metals 15 01008 g015
Figure 16. The relationship between the stamping speed and the springback of the bottom and side walls of the sink: the contour cloud maps of different stamping speeds: (a) 20 mm/s, (b) 25 mm/s, (c) 30 mm/s, (d) 35 mm/s, and the line diagram (e) the bottom (f) sink sidewall.
Metals 15 01008 g016
Figure 17. The relationship between the blank holder force and the springback of the bottom and side walls of the sink: the contour cloud maps of different blank holder forces: (a) 3 MPa, (b) 4.5 MPa, (c) 6 MPa, (d) 410 MPa, and the line diagram (e) the bottom (f) sink sidewall.
Metals 15 01008 g017
Figure 18. The relationship between the friction coefficient and the springback of the bottom and side walls of the sink: the contour cloud maps of different friction coefficients: (a) 0.115, (b) 0.120, (c) 0.125, (d) 0.130, (e) 0.135, and the line diagram (f) the bottom (g) sink sidewall.
Metals 15 01008 g018
Figure 19. The relationship diagram of stamping speed, blank holder force, and sink springback amount under optimal parameters: stamping speed (a) the bottom of the sink (b) the side wall of the sink; blank holder force (c) the bottom of the sink (d) the side wall of the sink.
Metals 15 01008 g019
Figure 20. The finished product by sink process. (a) Springback (b) uneven (c) pull not straight (d) hard traces.
Metals 15 01008 g020
Table 1. The chemical compositions of the SUS304 stainless steel (wt.%).
CSiMnPSNiCr
0.03–0.08≤1≤2≤0.05≤0.038–1118–20
Table 2. The process parameters of simulated FLD experiment.
Stamping Speed (mm/s)Closing Speed of Holder Ring (mm/s)Blank Holder Force (Mpa)Friction
Coefficient
201030.125
Table 3. The material parameters and Barlat89 criteria parameters.
Tensile Strain Hardening Exponent (n)Plastic Strain Ratio (r)Poisson’s Ratio (v)mr0r45r90
0.2310.2880.711.080.73
Table 4. The tensile properties of SUS304 stainless steel.
SpecimenYield Strength
(Mpa)
Tensile Strength
(Mpa)
Elongation
(%)
Elastic Modulus
(Gpa)
Yield Ratio
RD277.45 ± 3.52746.20 ± 3.9085.04 ± 0.83154.08 ± 2.330.37 ± 0.02
R45273.37 ± 4.12740.84 ± 2.9885.79 ± 1.01181.70 ± 4.860.37 ± 0.01
TD293.00 ± 8.61800.93 ± 6.7275.06 ± 0.97218.90 ± 9.360.37 ± 0.01
Table 5. The finished product process parameters.
Die Fillet Radius RStamping SpeedBlank Holder ForceFriction
Coefficient
Stretching DepthDie
Clearance
5 mm20 mm/s3 MPa0.120210 mm1.1 t
Disclaimer/Publisher’s Note: The statements, opinions and data contained in all publications are solely those of the individual author(s) and contributor(s) and not of MDPI and/or the editor(s). MDPI and/or the editor(s) disclaim responsibility for any injury to people or property resulting from any ideas, methods, instructions or products referred to in the content.