Article

Effect of Mo on Microstructure and Mechanical Properties of Corrosion-Resistant Tank Steel

1
State Key Laboratory of Metastable Materials Science and Technology, Yanshan University, Qinhuangdao 066004, China
2
Nanjing lron & Steel United Co., Ltd., Nanjing 210035, China
*
Author to whom correspondence should be addressed.
Metals 2025, 15(8), 926; https://doi.org/10.3390/met15080926 (registering DOI)
Submission received: 28 July 2025 / Revised: 16 August 2025 / Accepted: 18 August 2025 / Published: 21 August 2025

Abstract

To enhance the safe service performance of corrosion-resistant tank steel, it is of significant importance to develop novel materials characterized by both high strength-toughness and a low yield ratio. In this study, four experimental steels with a gradient of Mo content (0, 0.15 wt%, 0.30 wt%, and 0.60 wt% Mo) were prepared via thermomechanical controlled processing. The influence of Mo on the microstructural evolution and mechanical properties of the base metal was systematically investigated. The results revealed that when the Mo content was ≤0.15 wt%, the primary constituents of the matrix microstructure were polygonal ferrite, acicular ferrite, and granular bainitic ferrite. As the Mo content increased to 0.30 wt% and beyond, lath bainitic ferrite (LBF) emerged within the microstructure, and the size of the hard martensite/austenite constituents exhibited a refinement trend with increasing Mo content. Elevated Mo content enhanced the strength of the base metal, while the impact toughness initially increased and subsequently decreased. The equivalent grain size defined by misorientation tolerance angles of 2–6° contributed most significantly to the yield strength, as evidenced by its higher Hall–Petch fitting coefficient. The improvement in impact toughness was primarily attributed to the refinement of M/A constituents, which reduced crack initiation susceptibility, and the high density of high-angle grain boundaries (HAGBs) provided by the acicular ferrite. Conversely, the degradation in toughness was directly correlated with the coarsening of HAGB size and the reduction in HAGB density induced by the formation of LBF.

1. Introduction

With the continuous development of energy strategic reserves and the chemical industry, large-scale corrosion-resistant storage tanks are increasingly employed in sectors such as petroleum, chemical processing, and liquefied natural gas (LNG) [1,2]. Due to their frequent exposure to harsh service environments involving corrosive media (e.g., sulfur and chlorine) combined with low temperatures and high pressures, the steels used for these tanks are required to possess not only excellent corrosion resistance but also high strength, high toughness, and good weldability to ensure structural safety and longevity. Thermomechanical controlled processing (TMCP) has become a key technology for developing high-performance, cost-effective, corrosion-resistant tank steels [3]. This is because TMCP enables precise control over rolling and cooling parameters to achieve microstructural refinement and performance optimization with limited alloy additions [4].
However, during service, storage tanks are subjected not only to static internal pressure but also to dynamic loads arising from temperature fluctuations, foundation settlement, wind loads, and even earthquakes, which can induce local plastic deformation [5,6]. This necessitates that the tank steel plates, besides possessing high strength and toughness, must also exhibit good plastic deformation and strain hardening capabilities. These properties are crucial to prevent brittle fracture under overload or localized stress concentration scenarios, thereby ensuring sufficient safety margins. The ratio of yield strength to tensile strength (yield ratio, YR) is a vital indicator for assessing a material’s uniform plastic deformation capacity and safety reserve [7,8]. A lower yield ratio generally signifies a larger plastic deformation capacity after yielding, corresponding to higher structural safety. Although TMCP can effectively refine grains to enhance strength and toughness, excessive grain refinement can intensify the pinning effect of grain boundaries on dislocation movement, restricting dislocation slip, which leads to reduced plasticity and an increased yield ratio [9,10]. Therefore, developing high-strength, high-toughness, corrosion-resistant tank steel via TMCP while maintaining a low yield ratio is critical for ensuring engineering safety.
Molybdenum (Mo), as an important alloying element, is often added to corrosion-resistant steels to improve their corrosion resistance (e.g., enhancing passive film stability and suppressing localized corrosion) and strength [11]. Research indicates that Mo significantly influences phase transformation behavior and microstructural morphology during TMCP. An appropriate amount of Mo effectively suppresses the formation of polygonal ferrite (PF) and promotes the generation of intermediate transformation products such as AF (AF) and bainitic ferrite (BF), which is conducive to microstructural refinement and strength improvement [12]. However, increasing Mo content is a “double-edged sword”. Urtsev et al. [13] found that higher Mo content significantly enhanced the hardenability of steel, making it easier to obtain high-strength bainitic microstructures under TMCP cooling conditions. However, this could simultaneously lead to decreased toughness and an increased yield ratio due to microstructural homogenization or the promotion of hard and brittle phase formation. Kostryzhev et al. [14,15] reported that excessive Mo delays the austenite-to-ferrite transformation, increasing the proportion and size of bainite in the final microstructure. While this enhances strength, it may sacrifice plasticity and toughness and elevate the yield ratio. Besides the alloy element itself, TMCP parameters, such as the cooling path, play a decisive role in the microstructural evolution and mechanical properties of Mo-containing steels. Fan et al. [16] optimized the strength-toughness balance by adjusting the cooling rate to control the proportions of acicular ferrite, bainitic ferrite, and polygonal ferrite in Mo-bearing steel but noted that the influence of cooling rate on yield ratio is complex and requires analysis in conjunction with microstructure type. Bayock et al. [17] investigated the effect of finish rolling temperature on the microstructure of Mo-microalloyed steel, discovering that lower finish rolling temperatures facilitated finer austenite grains and more dispersed precipitates, thereby increasing strength. Nevertheless, there remains a lack of systematic and in-depth research reports on how Mo content, within the framework of TMCP, synergistically affects the final multiphase microstructure, strength-toughness balance, and the crucial yield ratio characteristics of the base metal in corrosion-resistant tank steel.
Therefore, this study systematically prepared corrosion-resistant tank test steels with varying Mo contents using TMCP. Combining microstructural analysis techniques such as scanning electron microscopy (SEM), transmission electron microscopy (TEM), and electron backscatter diffraction (EBSD) with mechanical property testing methods including tensile testing and Charpy impact testing, the research deeply explored the influence of Mo content on the microstructural evolution of the tank steel base metal under TMCP control and its impact mechanism on mechanical properties. The aim is to elucidate the role of Mo in optimizing the strength-toughness balance and reducing the yield ratio of corrosion-resistant tank steel, providing theoretical foundations and process guidance for developing the next generation of TMCP-treated corrosion-resistant tank plates with superior corrosion resistance, high strength-toughness, low yield ratio, and enhanced safety and reliability.

2. Materials and Methods

Test steels with different Mo contents were smelted in an 80 kg small vacuum furnace, with one heat per composition, and cast into single ingots. Samples were taken from the mid-section of the ingots, and the chemical compositions of the test steels were analyzed, as shown in Table 1. On a pilot rolling mill, 18 mm thick finished test plates were prepared using a two-stage rolling and controlled cooling method. The specific process schematic is illustrated in Figure 1.
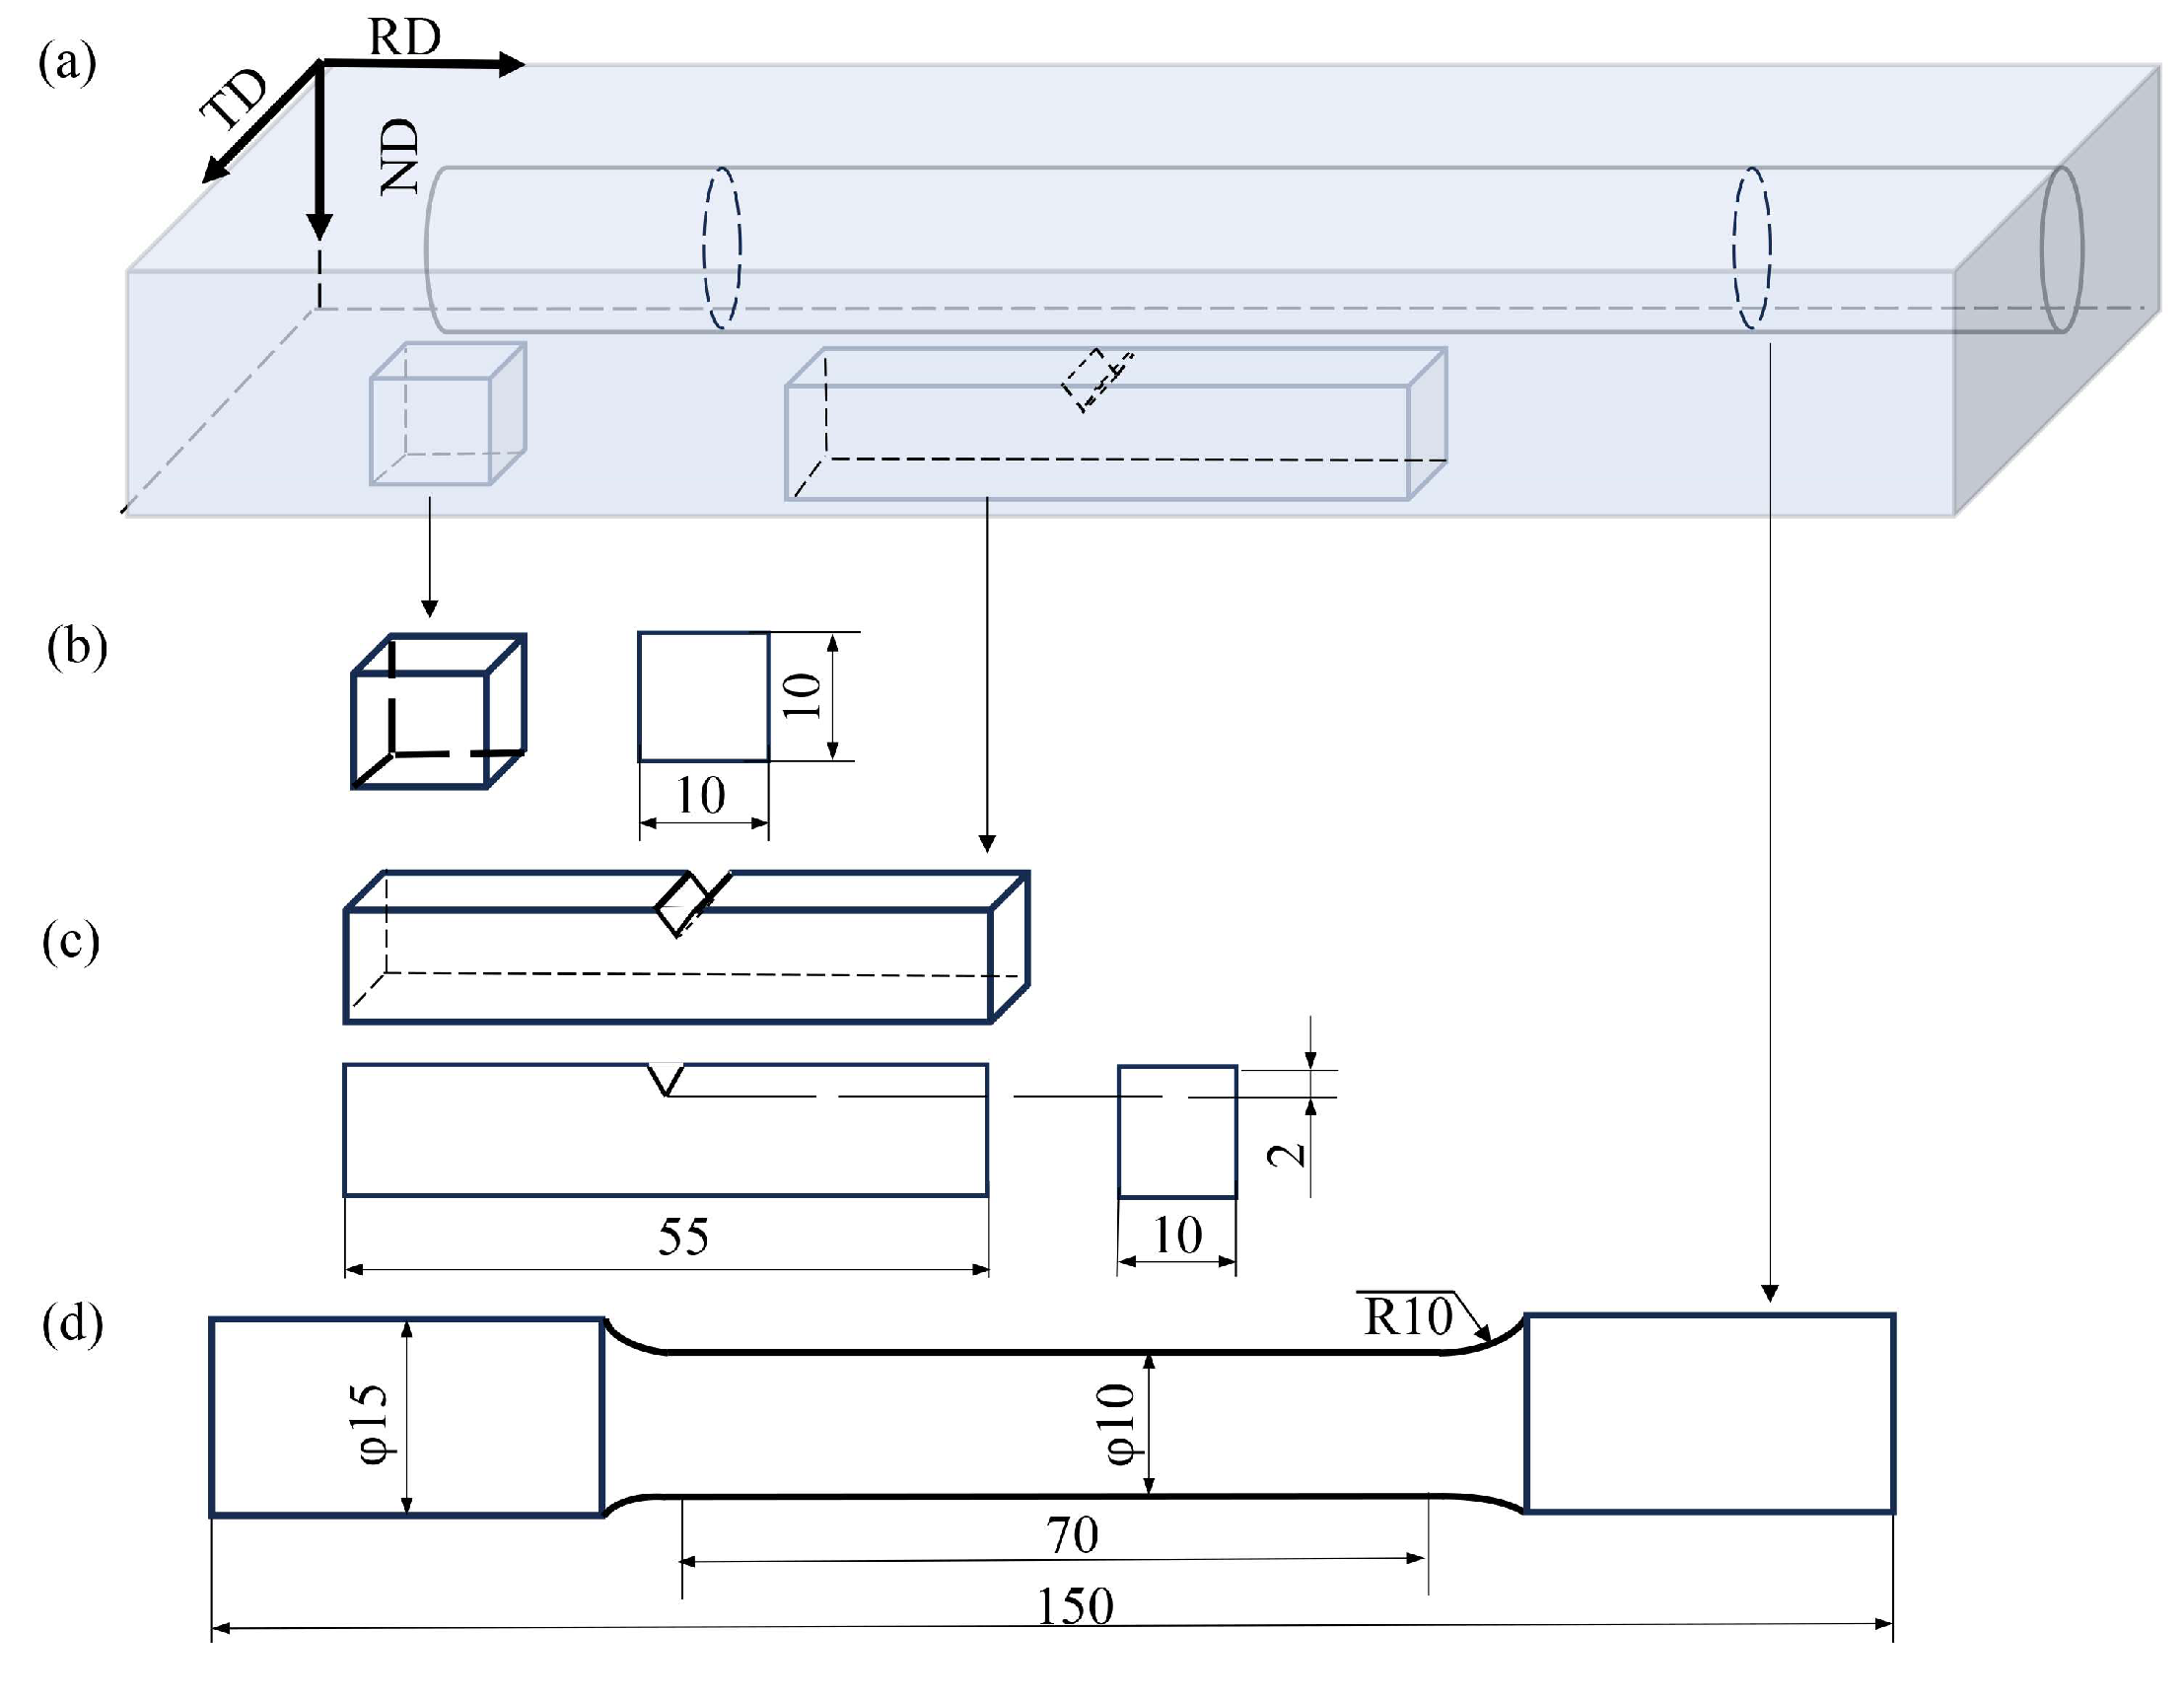
Samples for microstructural characterization were taken at 1/4 thickness of the steel plate (Figure 2a). Cubes of 10 × 10 × 10 mm3 were cut transversely using electrical discharge machining (EDM, TDK450C, Guang Zhou, China), as indicated in Figure 2b. After grinding with 200# to 2000# grit sandpaper and polishing, the samples were etched with a 4% nital solution and observed using an Axiover-200MTA optical microscope (OM, ZEISS, Oberkochen, Germany). Following repolishing, the martensite/austenite constituents (M/A) were revealed using LePera reagent. The Lepera reagent is prepared by mixing a 4% solution of malic acid alcohol with a 1% solution of excess sodium bisulfite in water in a 1:1 ratio, and the M/A constituents’ size and area fraction within a 1 mm2 region were statistically analyzed using Image- pro Plus 7 software. The fine structure and precipitates in the test steels with different Mo contents were also observed using a JEM-2010 high-resolution transmission electron microscope (TEM) (JEOL, Tokyo, Japan). Samples for fine structure observation were thin foils, prepared by grinding followed by thinning using a TenuPol-5 twin-jet electropolisher (Struers, Slaurersheim City, Denmark) with an electrolyte of 10% perchloric acid + 90% ethanol. The parameters used in the twin-jet test are voltage 25 V, current 55–65 mA, temperature 25 °C, and flow value 20. Samples for precipitate observation were replicas prepared using the carbon extraction replica method. Dislocation density in the different Mo-content test steels was determined using a Rigaku D/max-2500/PC diffractometer (Rigaku, Tokyo, Japan). equipped with a Cu-Kα radiation source. The test employed continuous scanning mode over a 2θ range of 30–100° at a scanning rate of 0.02°/s. Dislocation density calculation followed the Williamson–Hall method [18]. Crystallographic analysis was performed using a Hitachi SU-5000 scanning electron microscope (SEM) (Hitachi High-Tech, Tokyo, Japan) equipped with a TSL DigiView electron backscatter diffraction (EBSD) probe (EDAX, New York, NY, USA). Sample preparation involved grinding, polishing, and electrolytic polishing in a solution of 90% methanol and 10% perchloric acid; the specific parameters are voltage 18 V, current 1 A, and polishing time 30 s. When conducting electron backscatter diffraction characterization, the working voltage selected was 30 kV, the working distance was 18 mm, and the step size used during the test was 0.2 μm. Furthermore, to elucidate the strengthening and toughening mechanisms in the Mo test steels, the fracture surfaces of typical impact and tensile specimens, along with the underlying microstructures near the fracture paths, were characterized using SEM and EBSD.
Samples for impact and tensile testing were extracted from the test steels with different Mo contents using wire EDM. The impact specimens were all taken from the 1/4 section of the steel plate, while the tensile specimens were taken from the central area of the steel plate. The impact specimens measured 10 × 10 × 55 mm3, with the specific sampling method detailed in Figure 2c. Impact specimens were first held in a cooling bath at –20 °C for 10 min, and then the impact-absorbed energy was measured using a PSW750 (Zwick GmbH &amp, Oberkochen, Germany) instrumented impact tester. For tensile specimens, sampling followed Figure 2d, and room temperature tensile tests were conducted according to ASTM E8-09 standard specifications on an MTS testing machine (MTS, Eden Prairie, MN, USA) [19]. To minimize experimental error, impact and tensile property tests were performed three times for each Mo content.

3. Results

3.1. Microstructural Characterization

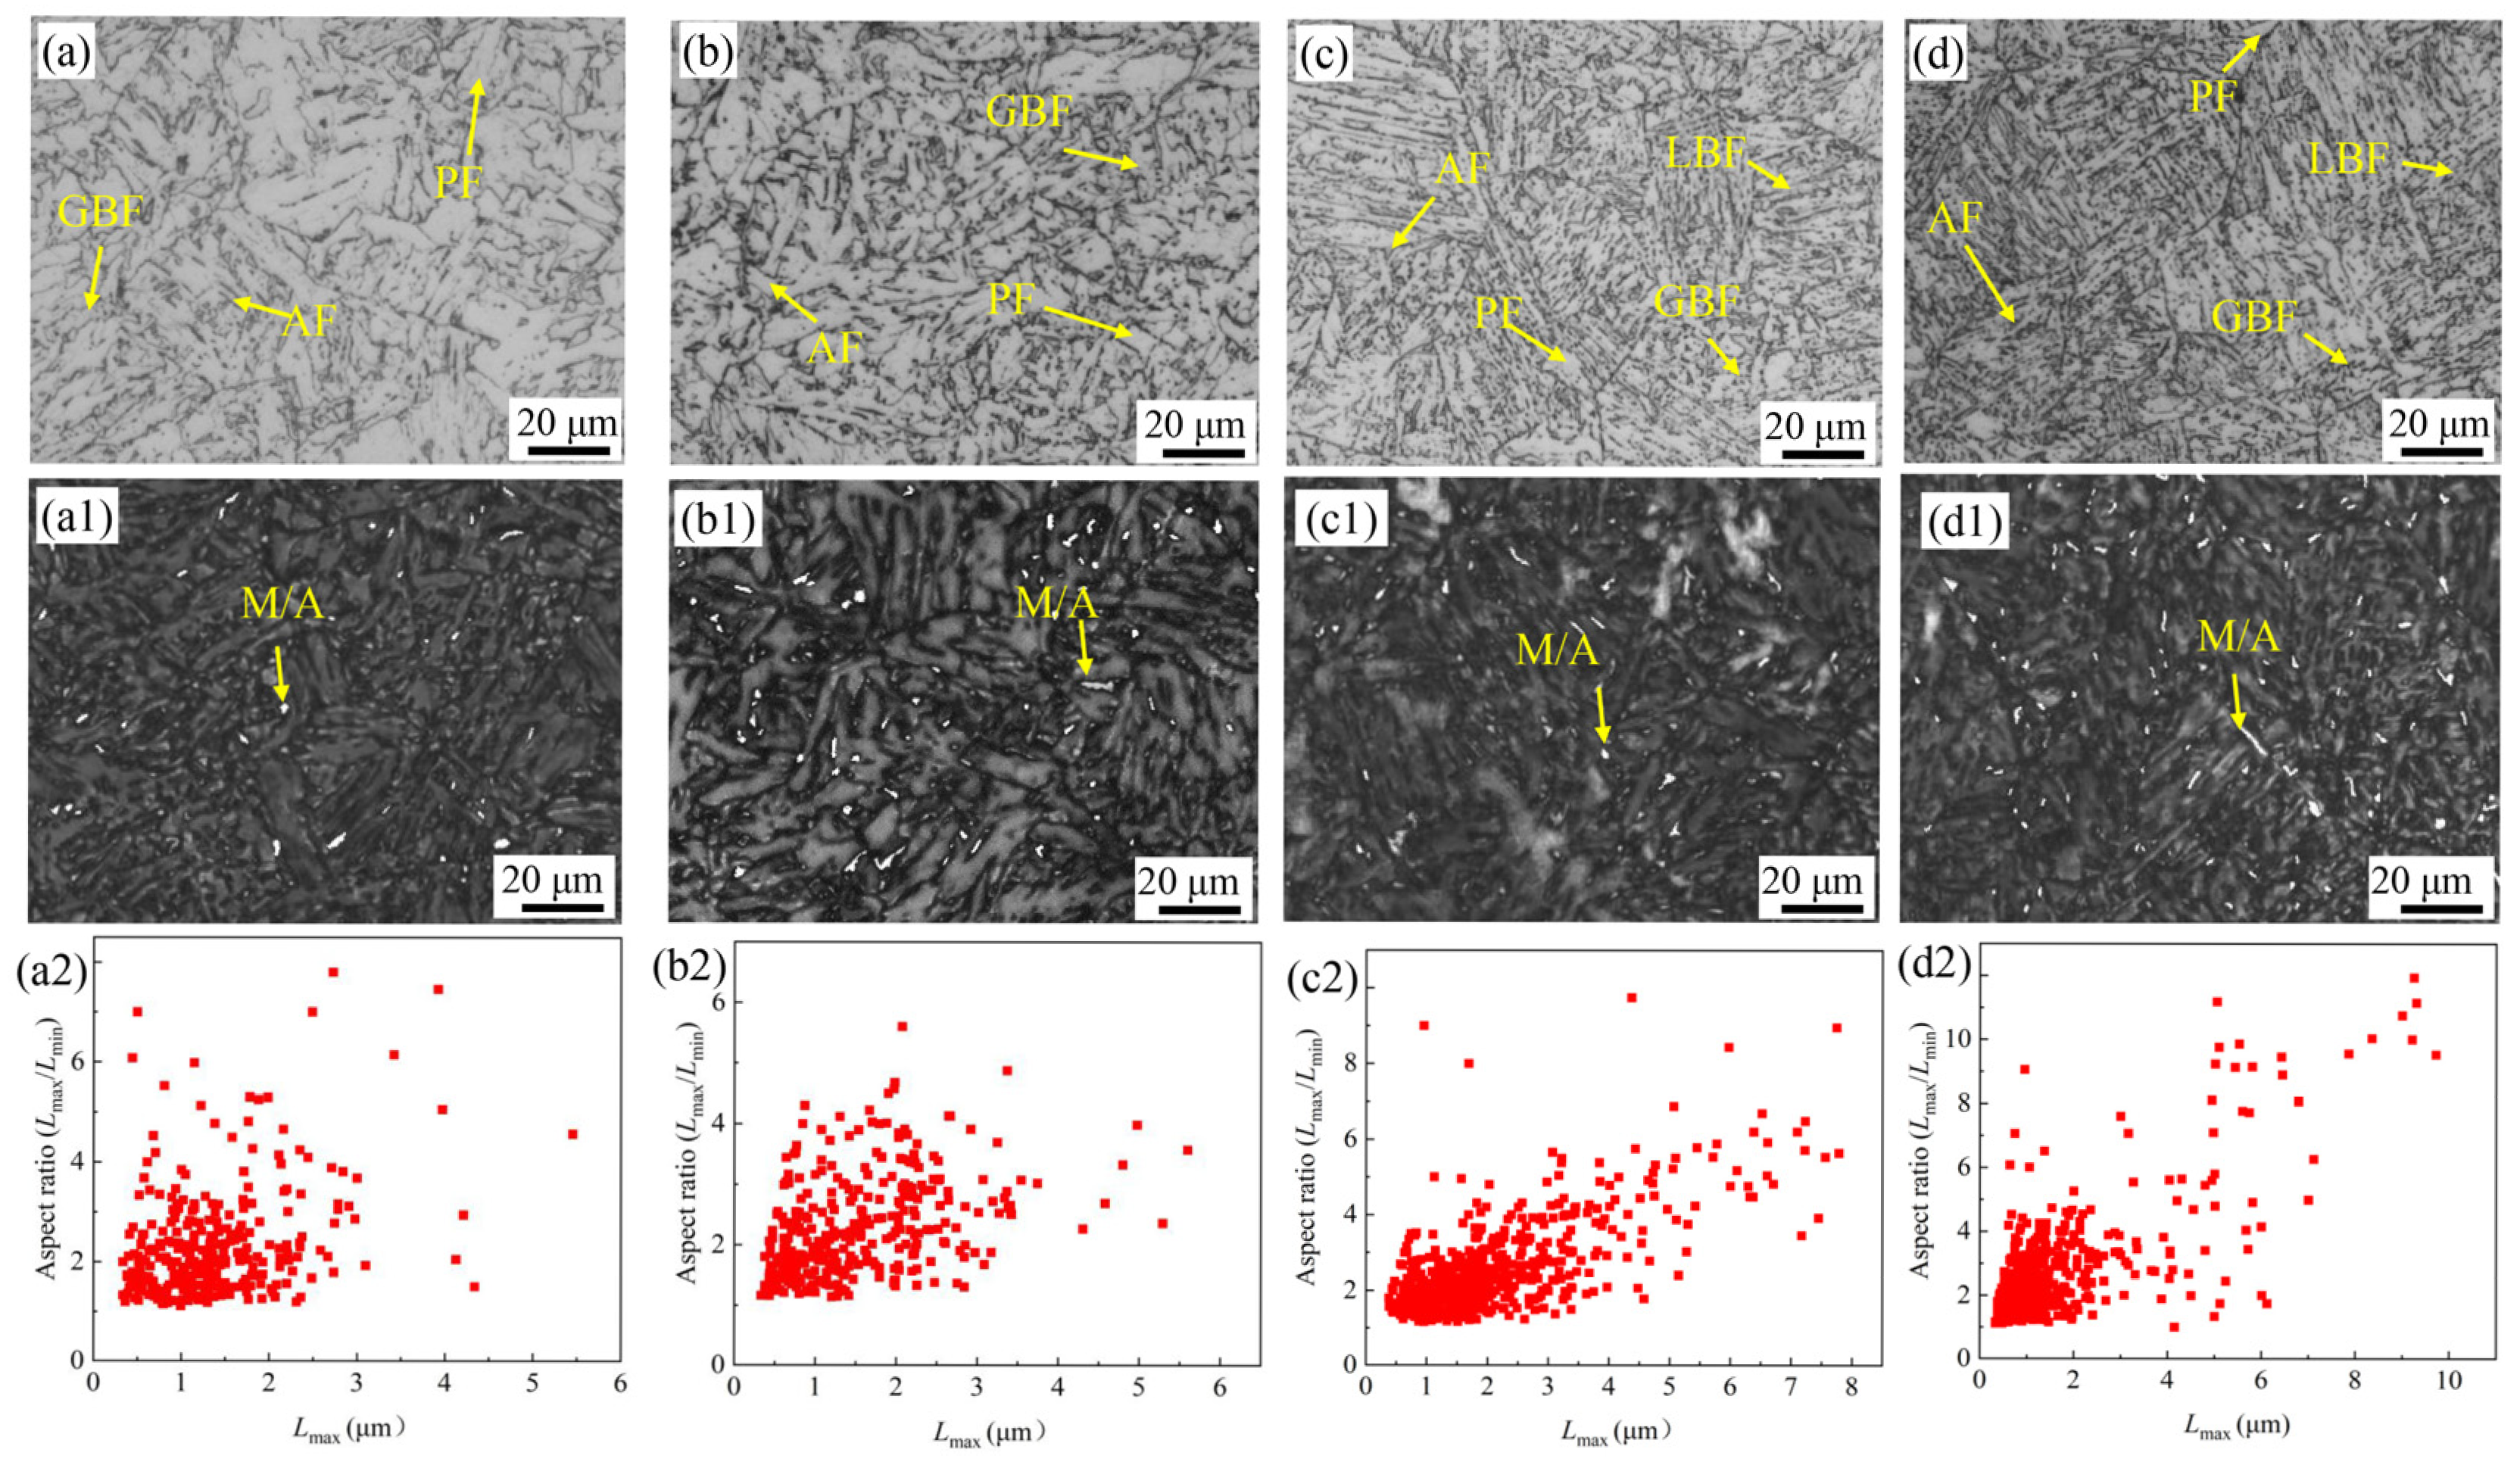
The OM observation results of the microstructures for the test steels with different Mo contents are shown in Figure 3a–d. For steels without Mo and with 0.15 wt% Mo, the microstructure of the base metal primarily consisted of acicular ferrite (AF), polygonal ferrite (PF), and granular bainitic ferrite (GBF). However, when the Mo content increased to 0.30 wt% and 0.60 wt%, lath bainitic ferrite (LBF) appeared in the microstructure. Increasing Mo content significantly lowered the phase transformation temperature, leading to noticeable microstructural refinement [20]. The hard M/A constituents within the microstructure are shown in Figure 3(a1–d1), appearing bright white after etching with LePera reagent. Statistical analysis of the size and aspect ratio of the M/A constituents (Figure 3(a2–d2)) revealed that with increasing Mo content, the average size of the M/A constituents decreased, their area fraction decreased, but their aspect ratio increased.
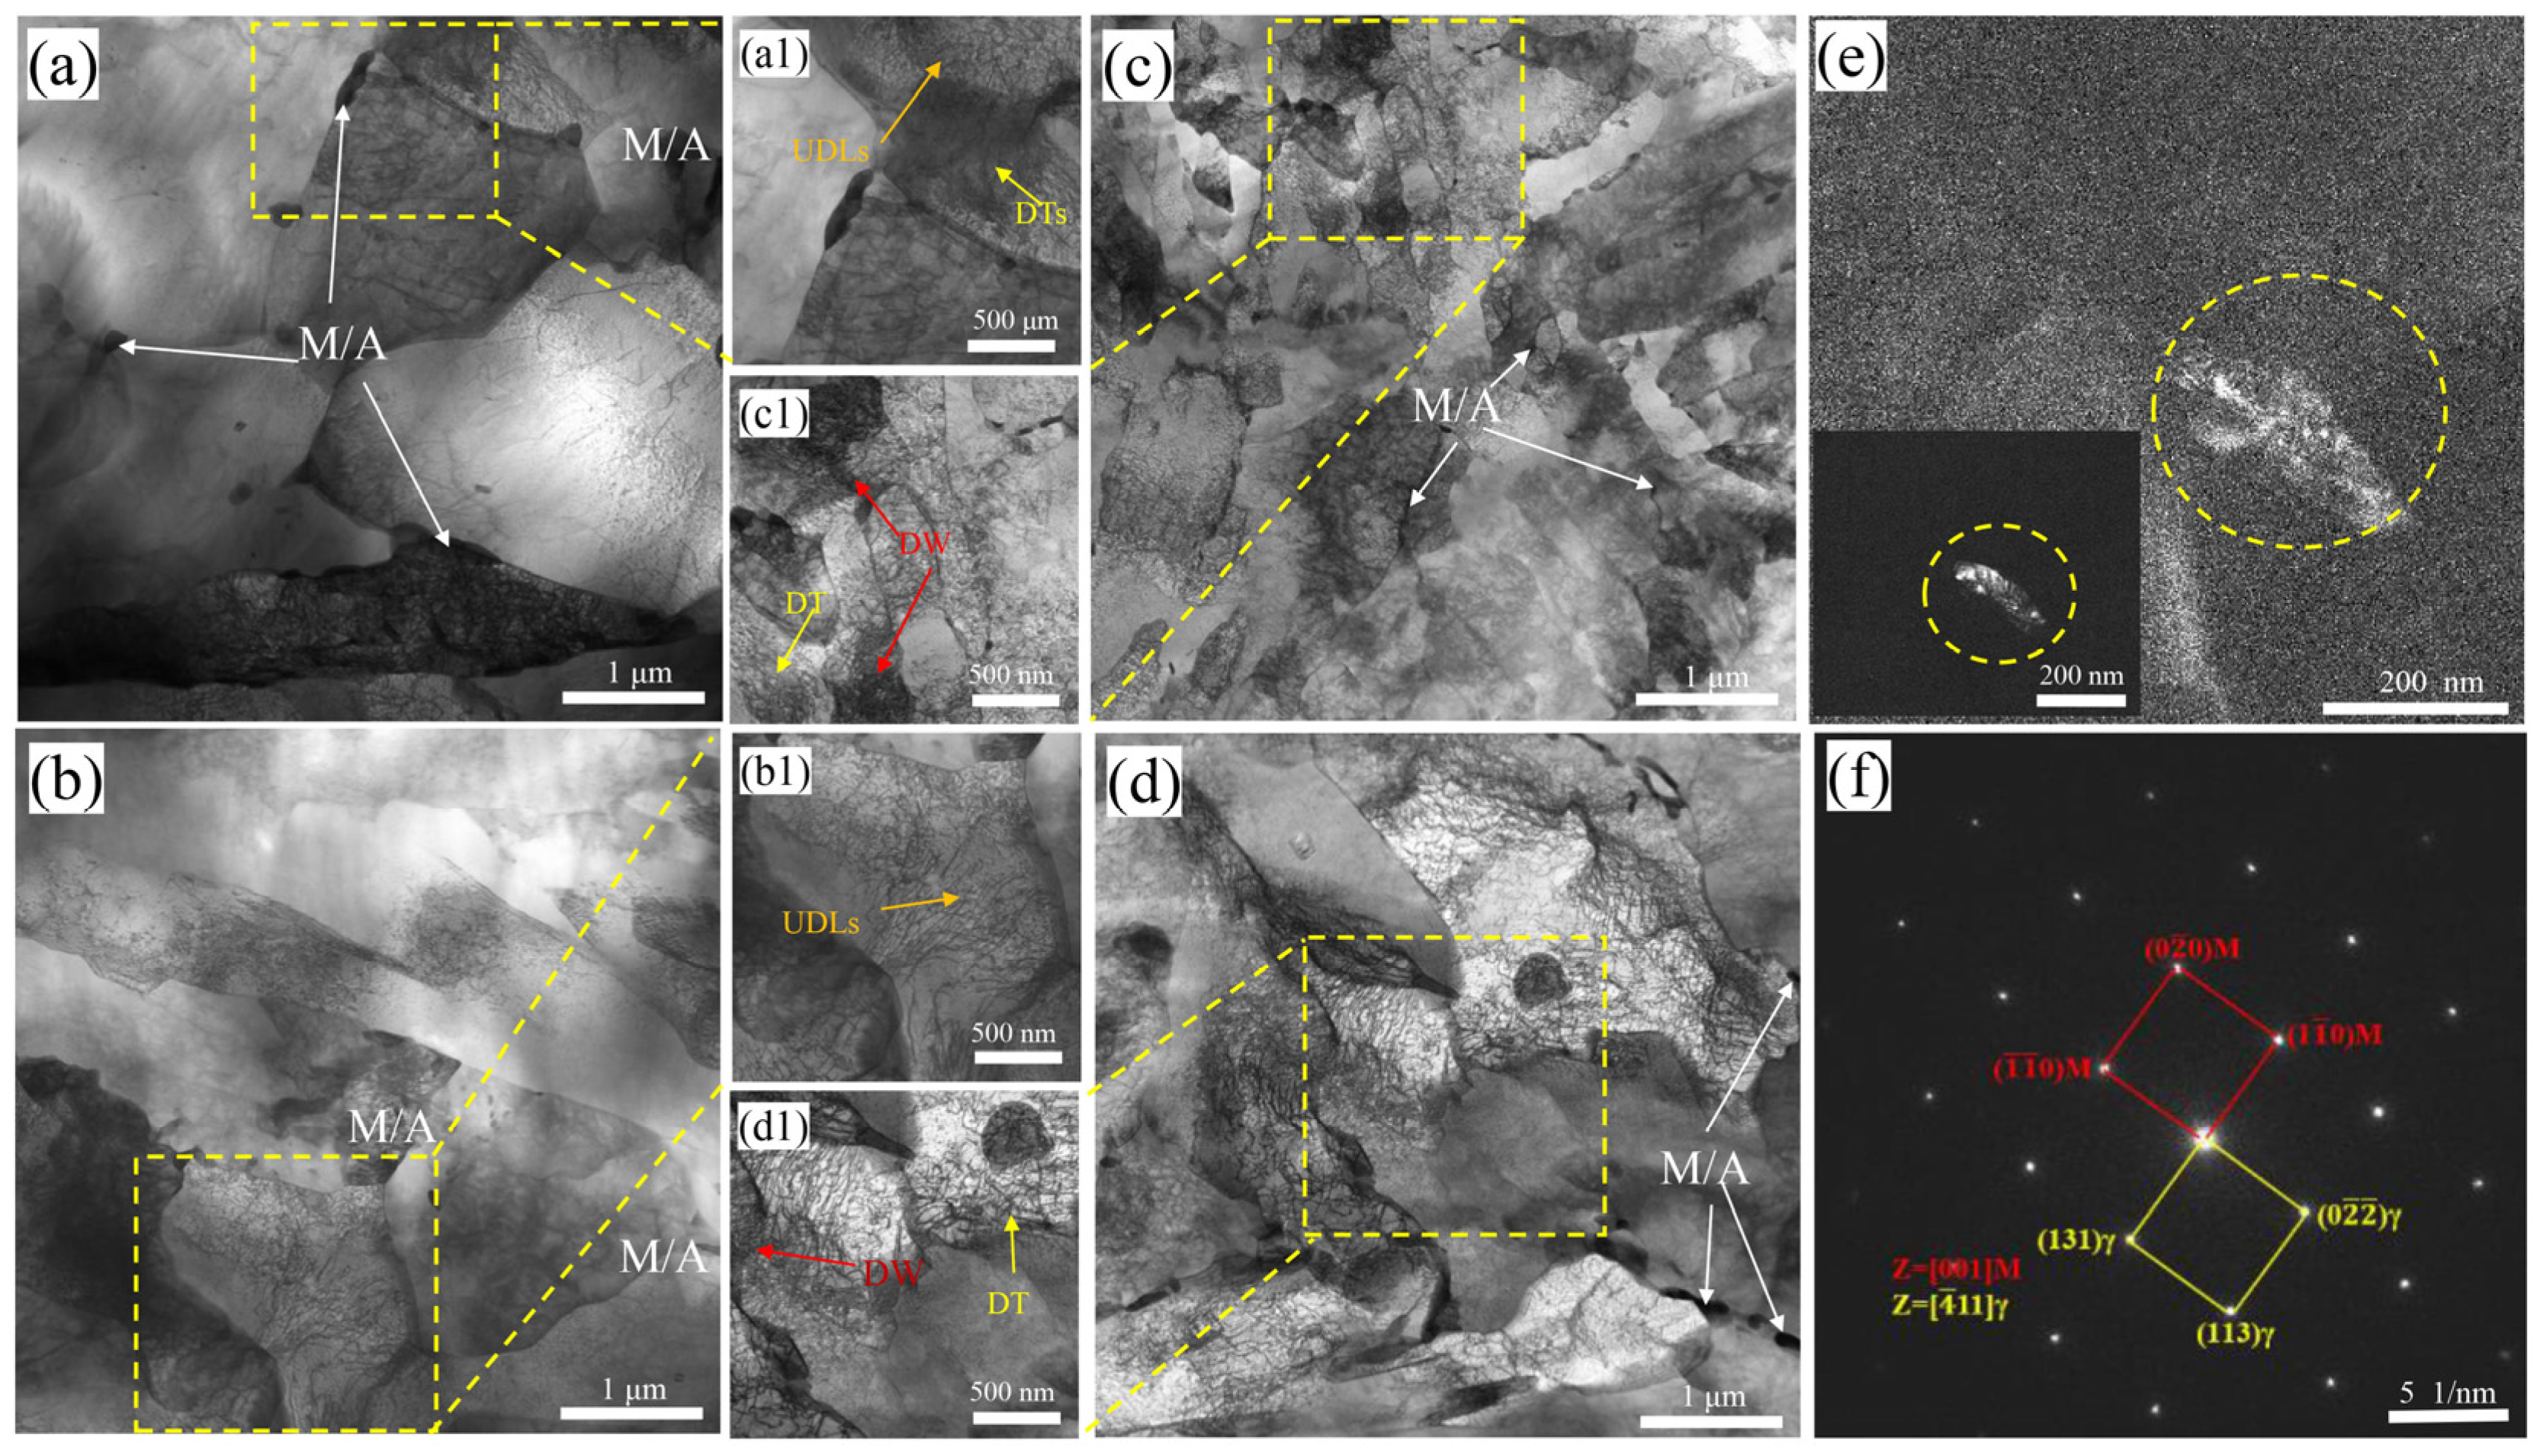
Transmission electron microscope observations of the fine internal structures within the microstructures of the test steels with different Mo contents are presented in Figure 4. The transmission electron microscope morphologies consistently show white ferrite and black island-like constituents. Through the observation of the light and dark fields of the black island-like structure and the selection of electron diffraction analysis, as shown in Figure 4e and Figure 4f, respectively, it was determined that it is the hard phase M/A component, which is also consistent with the reported results in the related literature [21,22]. Further microscopic morphology analysis indicates that as the Mo content increases, the morphology of the ferrite changes from polygonal to elongated, with a significant reduction in size. The size of the M/A constituents also shows a decreasing trend. Dislocation structures were observed within the ferrite laths. In the steels without Mo and with 0.15 wt% Mo, dislocations consisted mainly of uniform dislocation lines (UDLs) and a small number of dislocation tangles (DTs). With further increases in Mo content, the density of DTs increased significantly, and dislocation walls (DWs) were observed at the boundaries of lath ferrite.
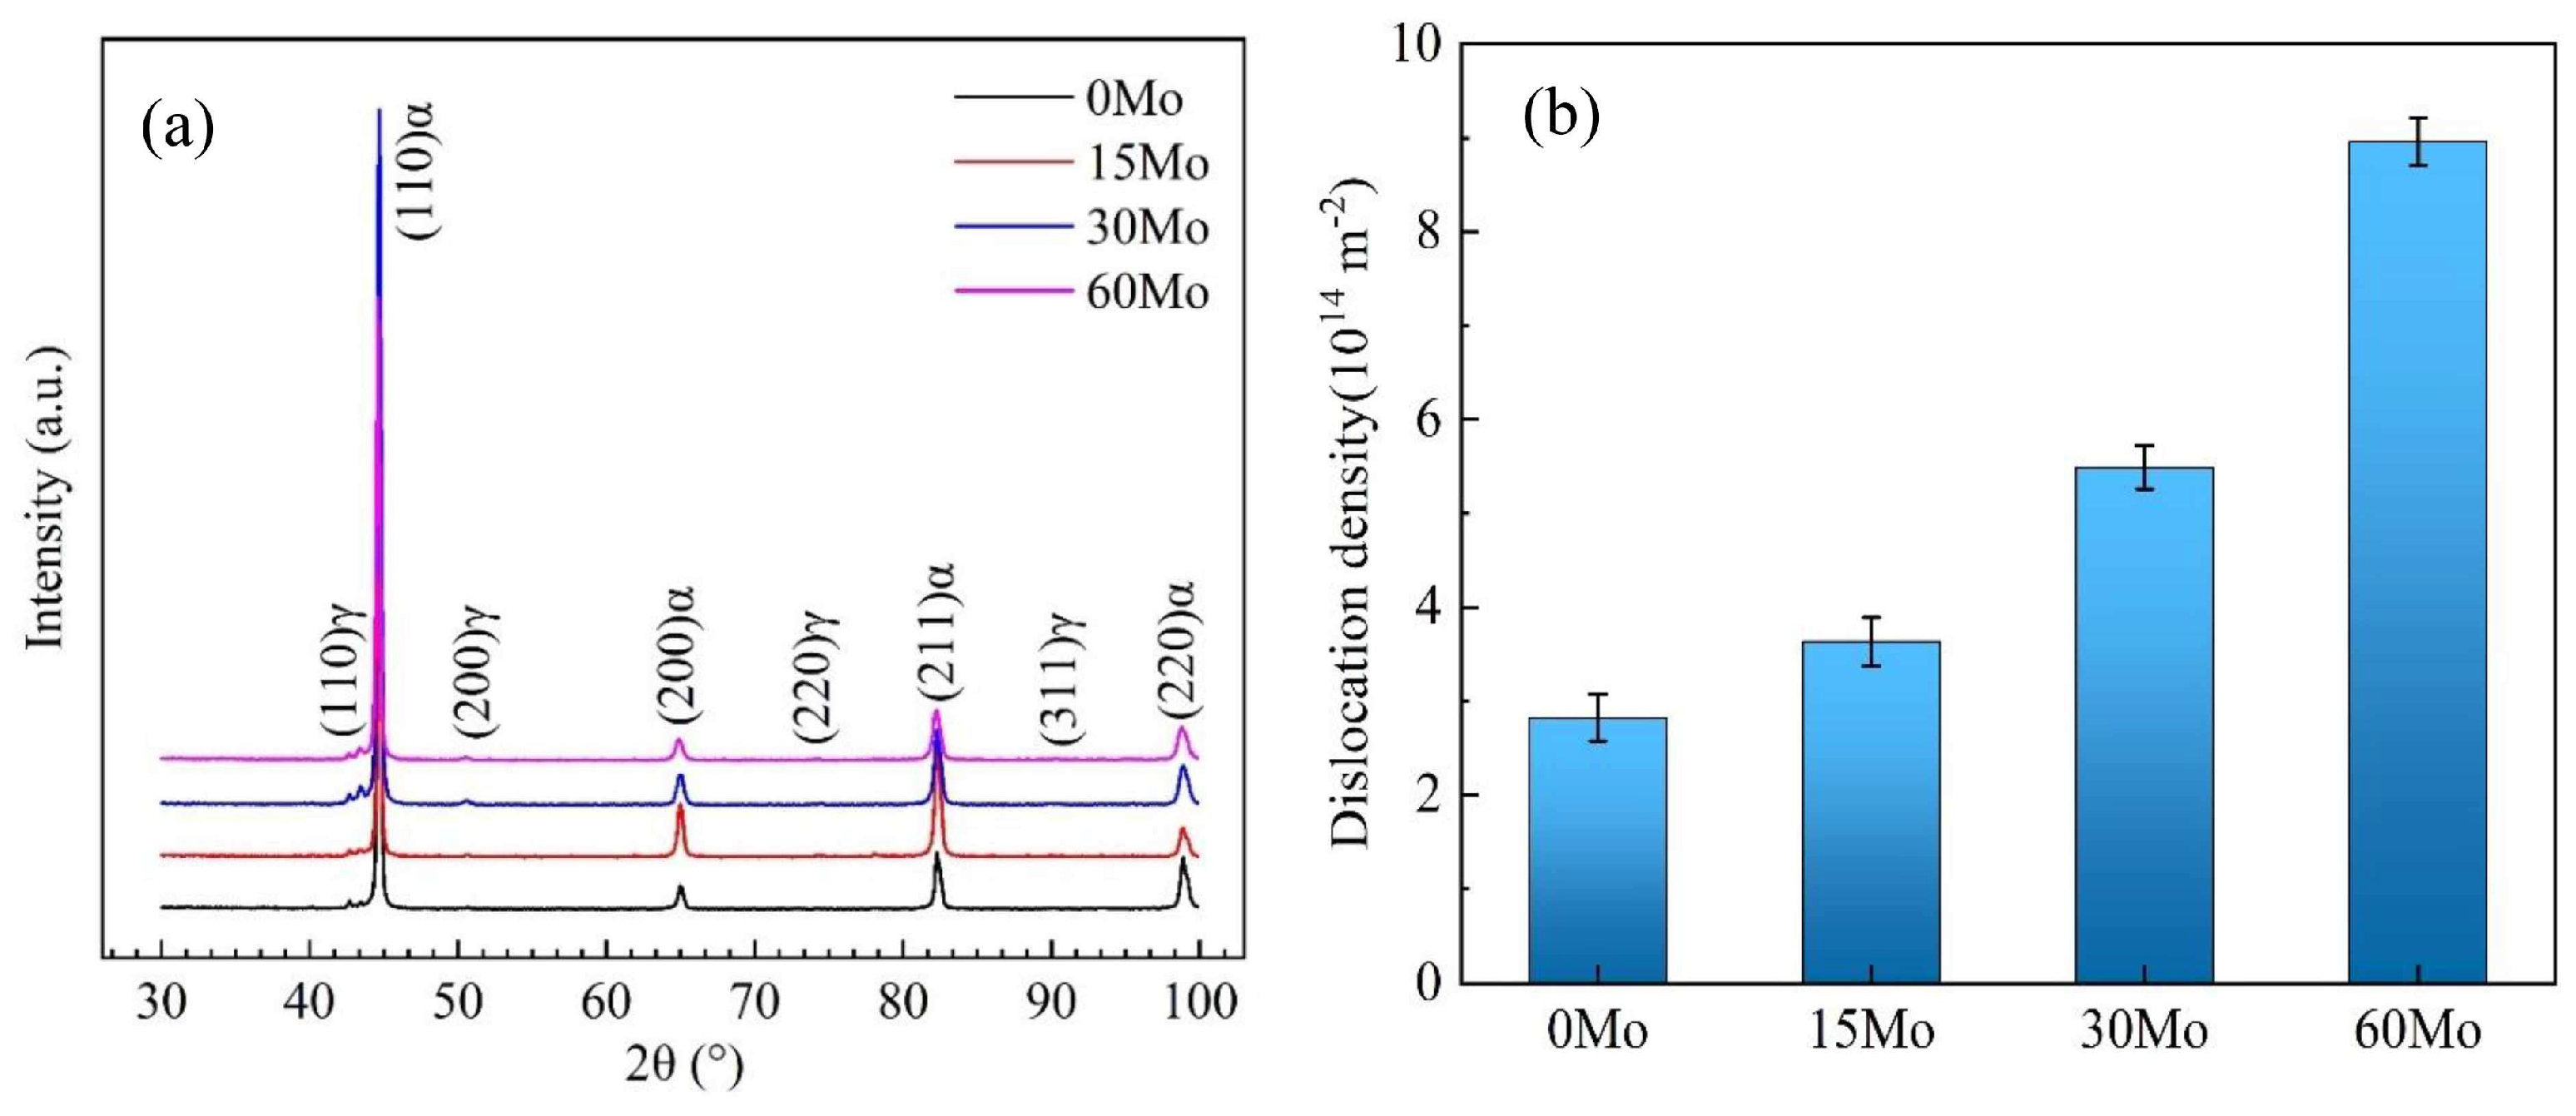
The dislocation density in the test steels with different Mo contents was further determined using XRD. The XRD diffraction patterns are shown in Figure 5a. The dislocation density in the base metal was evaluated, and its variation trend is plotted in Figure 5b. The results show that as the Mo content increased from 0 to 0.15 wt%, 0.30 wt%, and 0.60 wt%, the dislocation density increased from 2.82 × 10¹⁴/m−2 to 3.63 × 10¹⁴/m−2, 5.49 × 10¹⁴/m−2, and 8.96 × 10¹⁴/m−2, respectively.
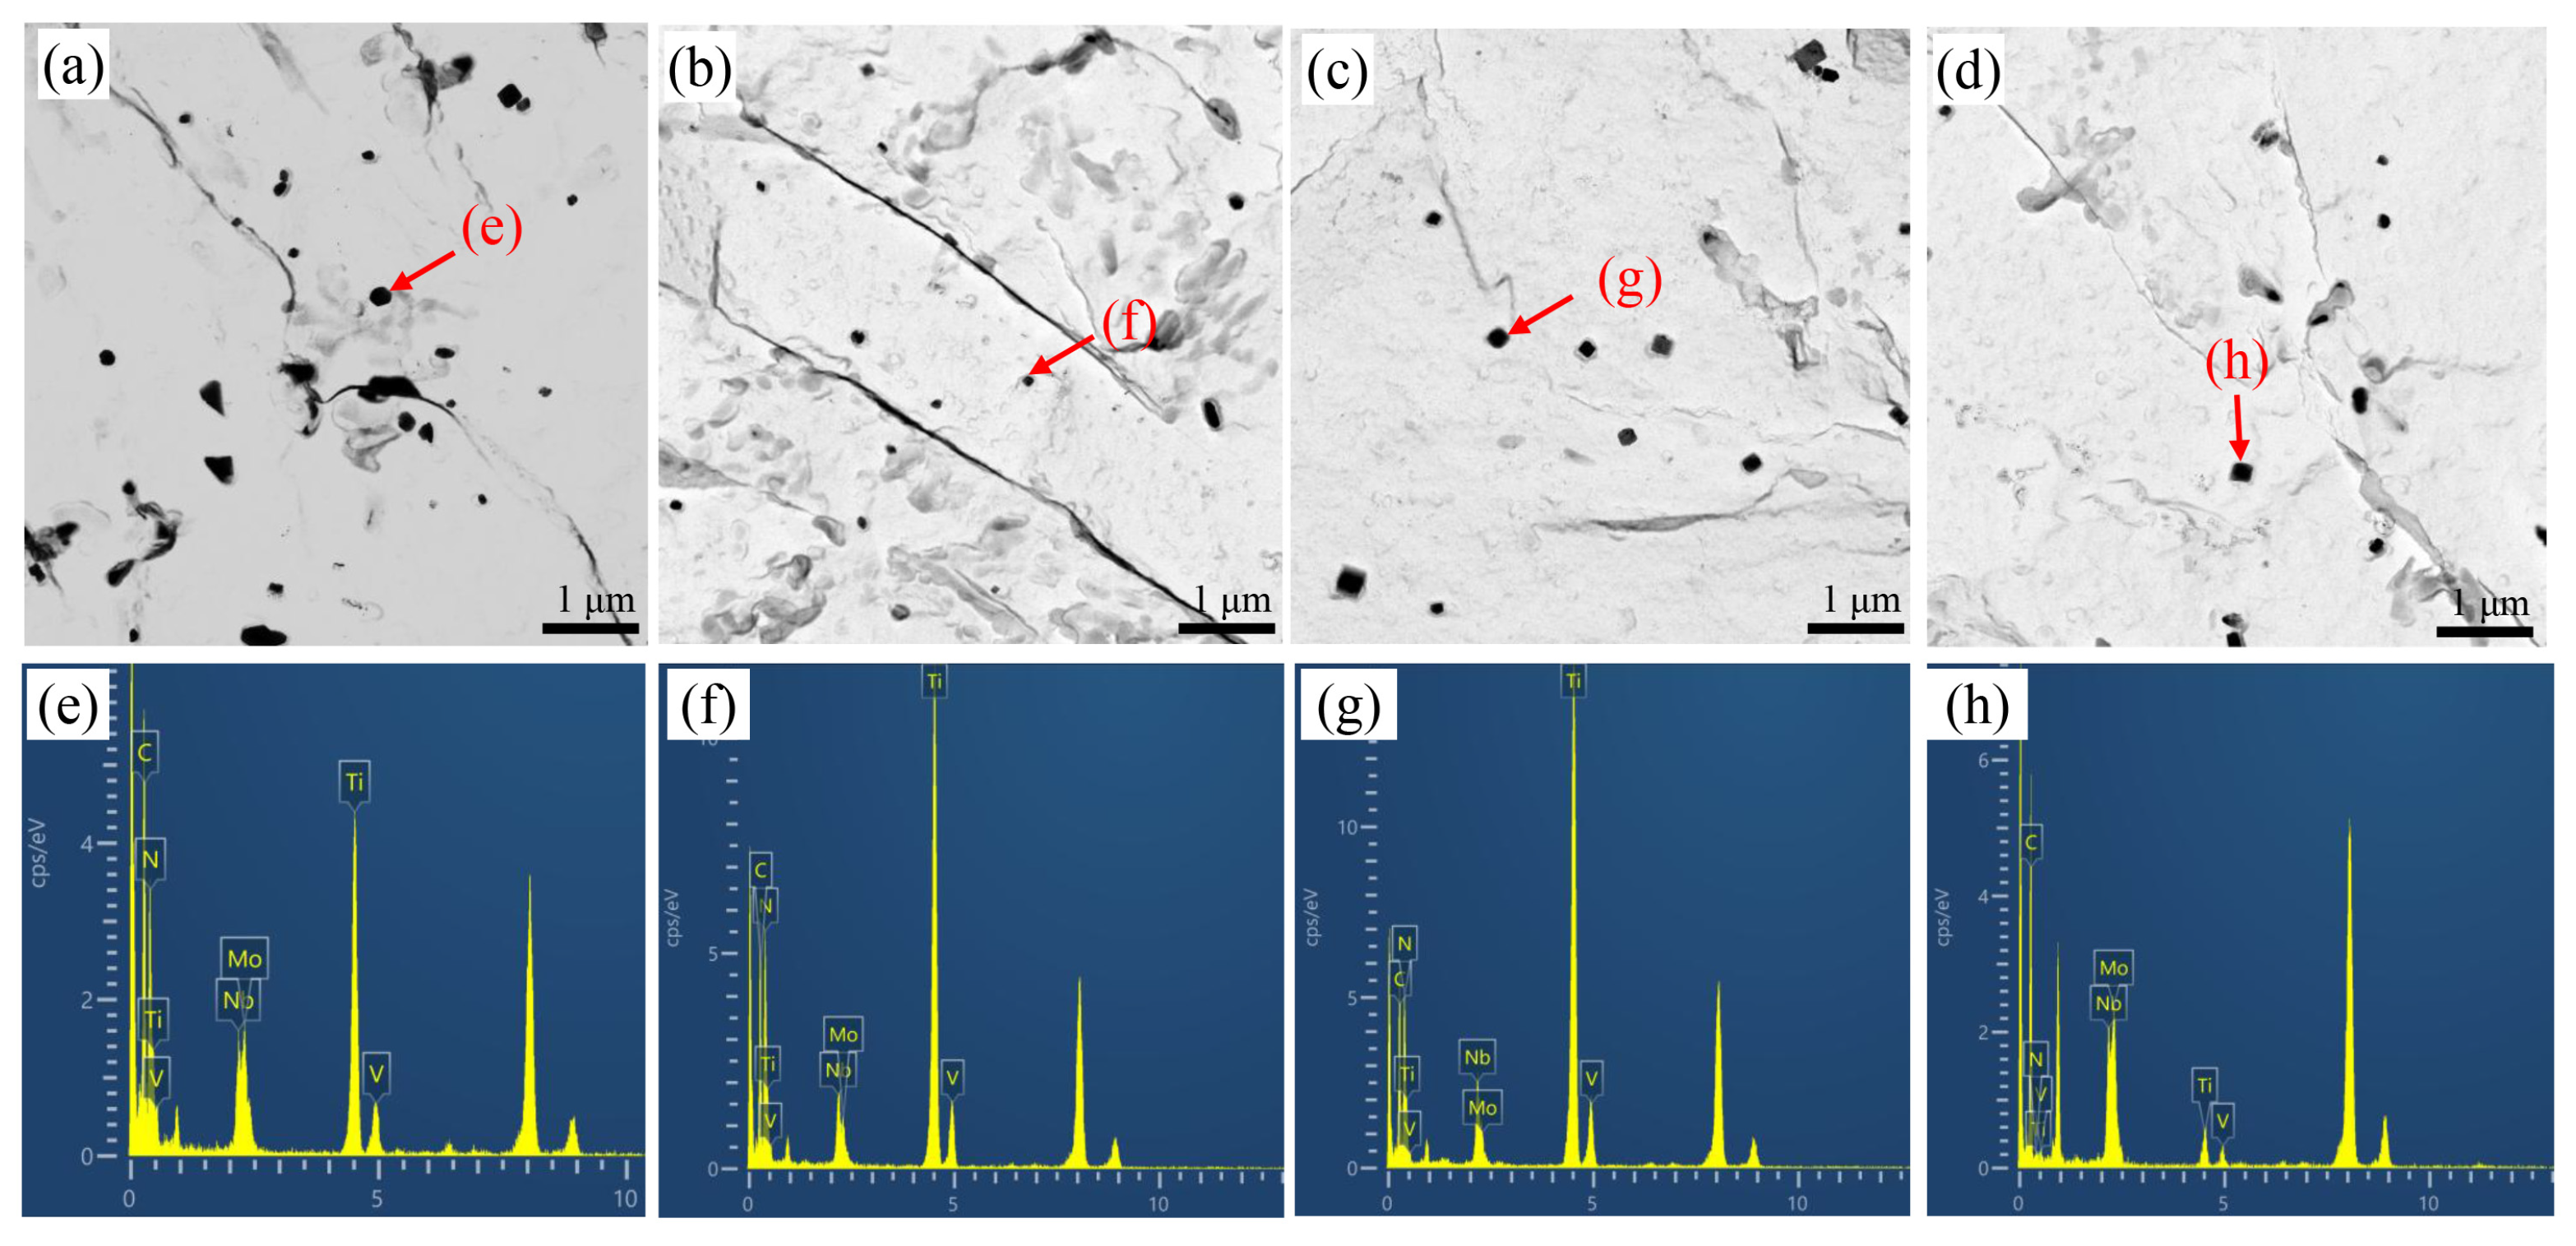
Precipitates within the base metal of the test steels were also characterized using a transmission electron microscope, as shown in Figure 6a–d. The precipitates in the different base metals were predominantly square-shaped. Variations in Mo content had little effect on the precipitates. Transmission energy spectrum analysis of the chemical composition of these square precipitates (Figure 6e–h) confirmed that they were all (Ti,V)(C,N) particles.
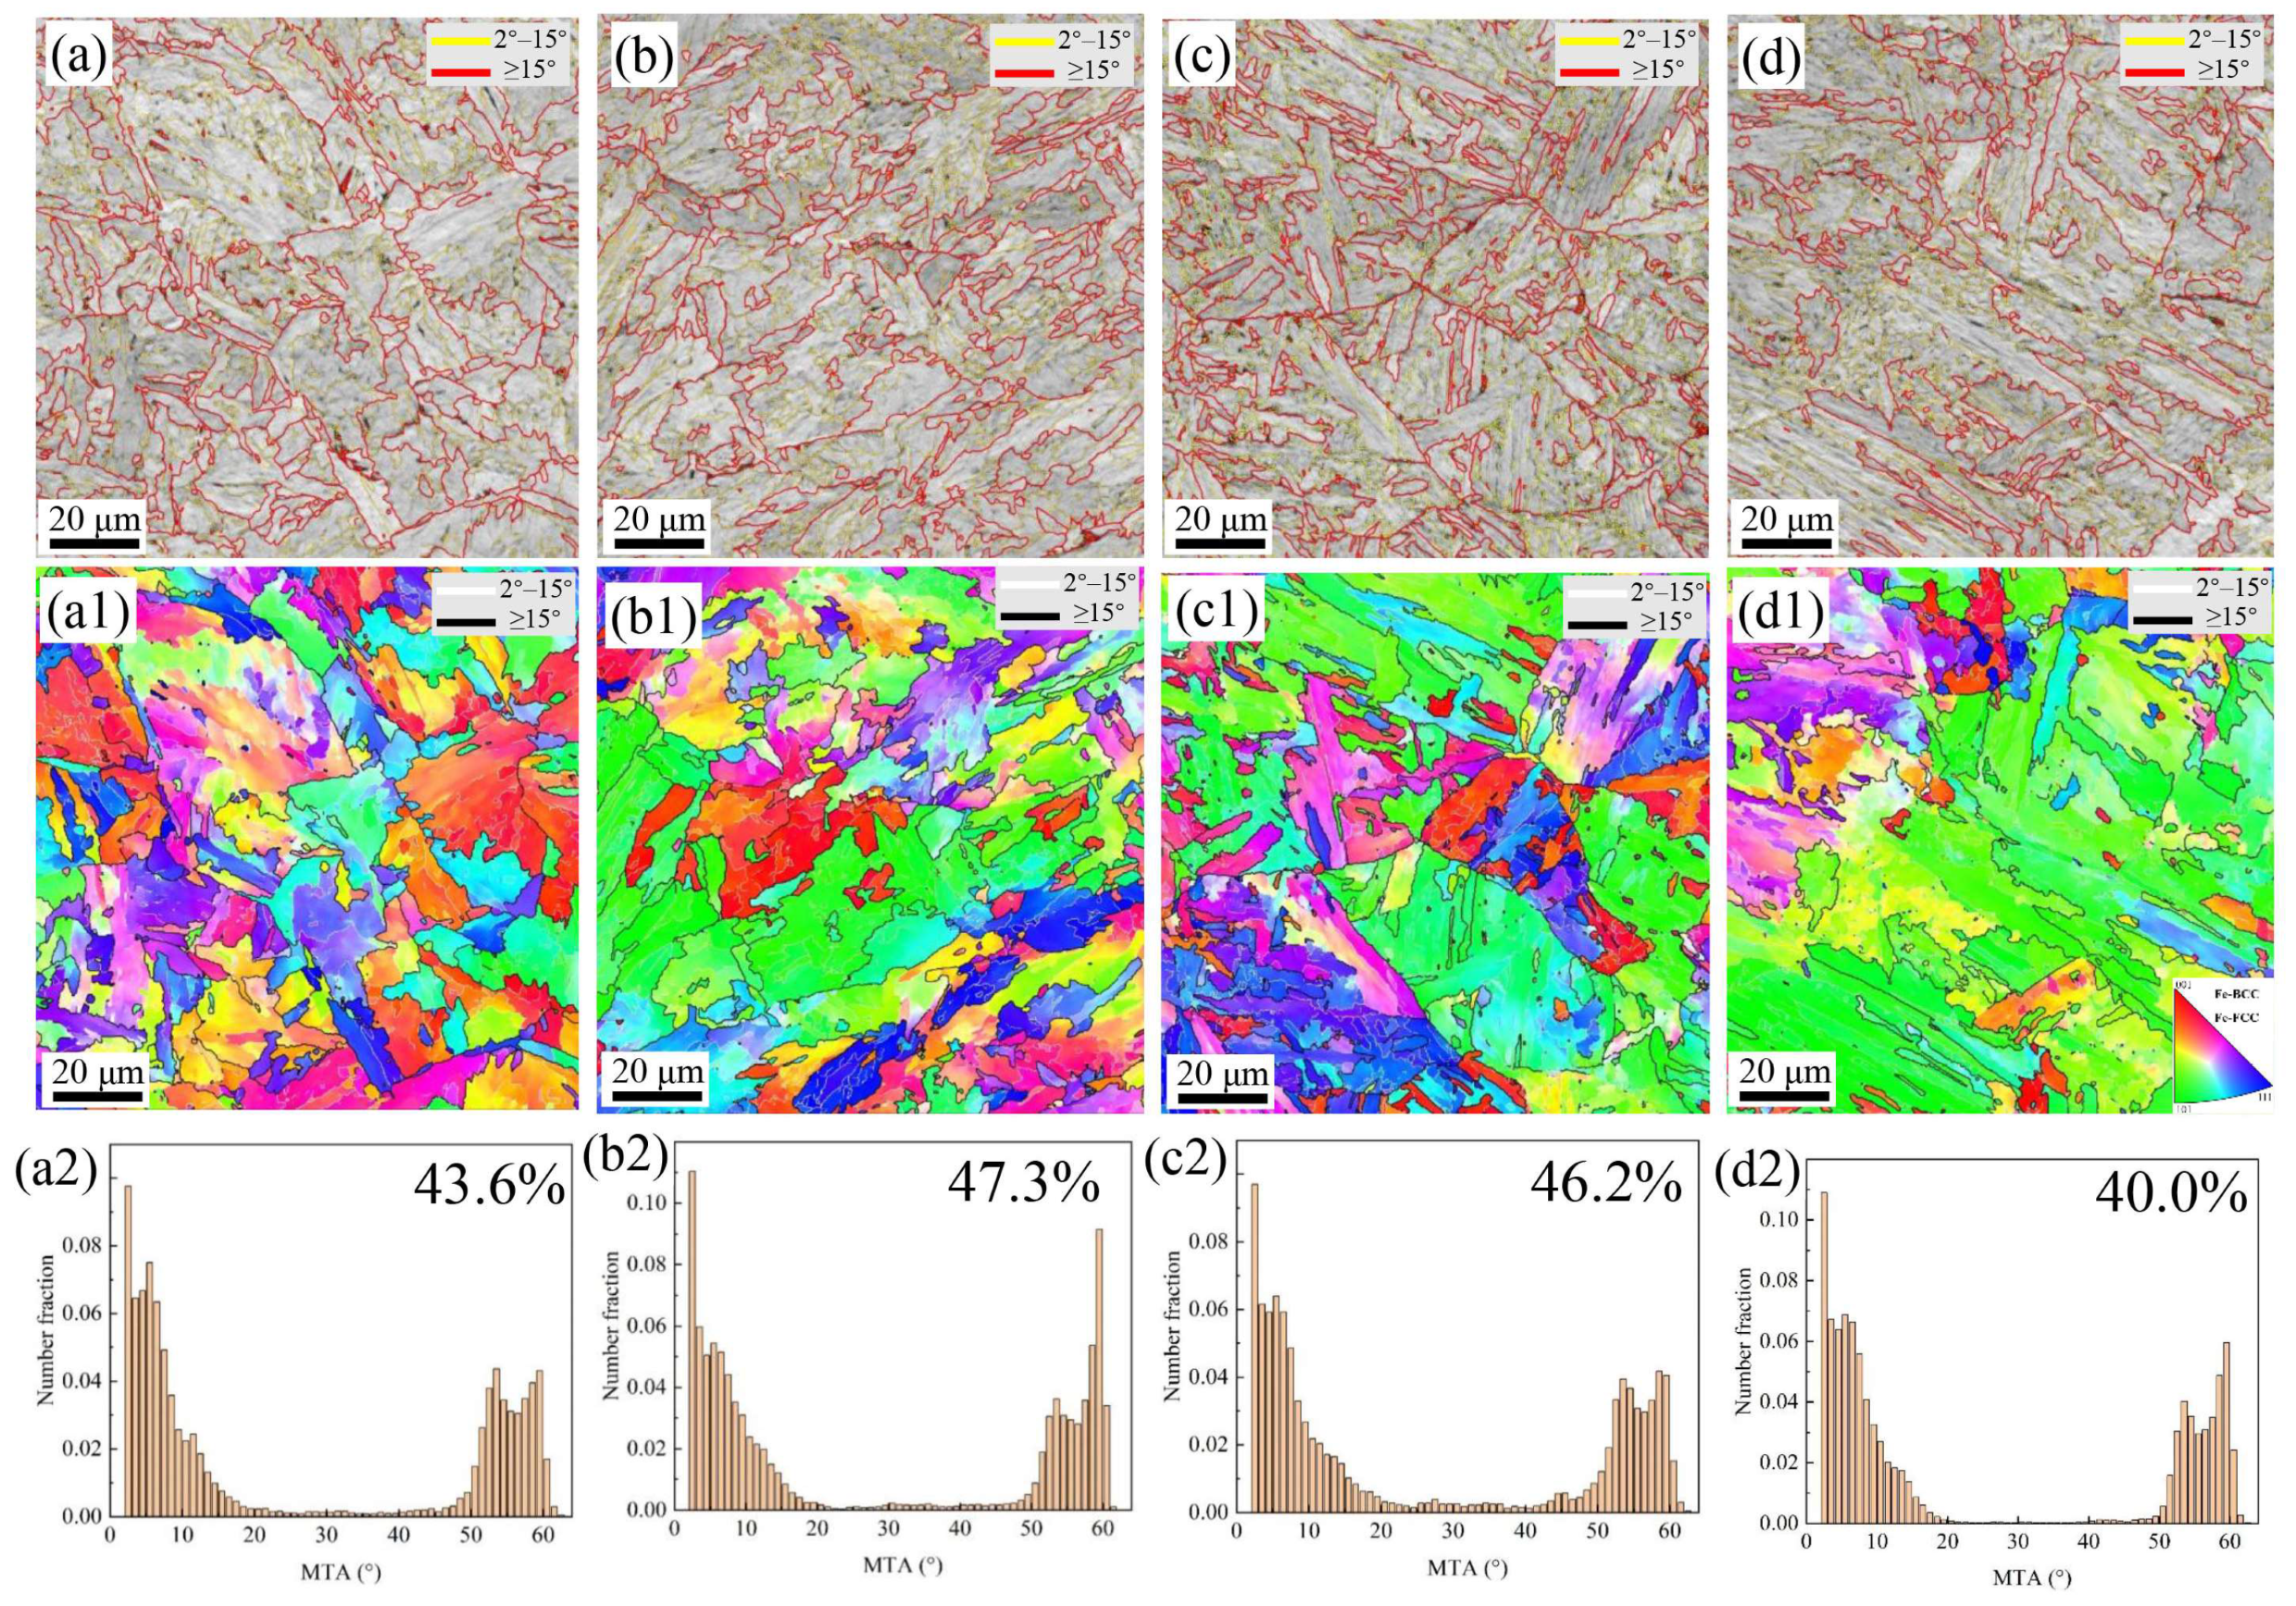
Additionally, the microstructure of the test steels with different Mo contents was analyzed crystallographically using electron backscatter diffraction. Grayscale maps and corresponding inverse pole figure (IPF) maps are shown in Figure 7a–d and Figure 7(a1–d1), respectively. In both the grayscale and IPF maps, boundaries with misorientation angles > 15° were defined as high-angle grain boundaries (HAGBs) and are represented by red/black lines, while boundaries with misorientation angles between 2 and 15° were defined as low-angle grain boundaries (LAGBs) and are represented by green/white lines [23]. Further statistical calculation using software yielded the mean equivalent grain diameter (MED) defined by misorientation tolerance angles (MTAs) ranging from 2° to 15°, as listed in Table 2. With increasing Mo content, the MED defined by MTAs of 2°, 4°, 6°, 8°, 10°, and 12° all refined. However, for the MED defined by a misorientation angle of 15°, it first decreased and then increased. The fractions of grain boundaries defined by different MTAs were also statistically analyzed for the different Mo-content test steels, as shown in Figure 7(a2–d2). The results indicate that as the Mo content in the base metal increased, the proportion of HAGBs first increased from 43.6% to 47.3% and then decreased to 46.2% and 40.0%.

3.2. Mechanical Properties

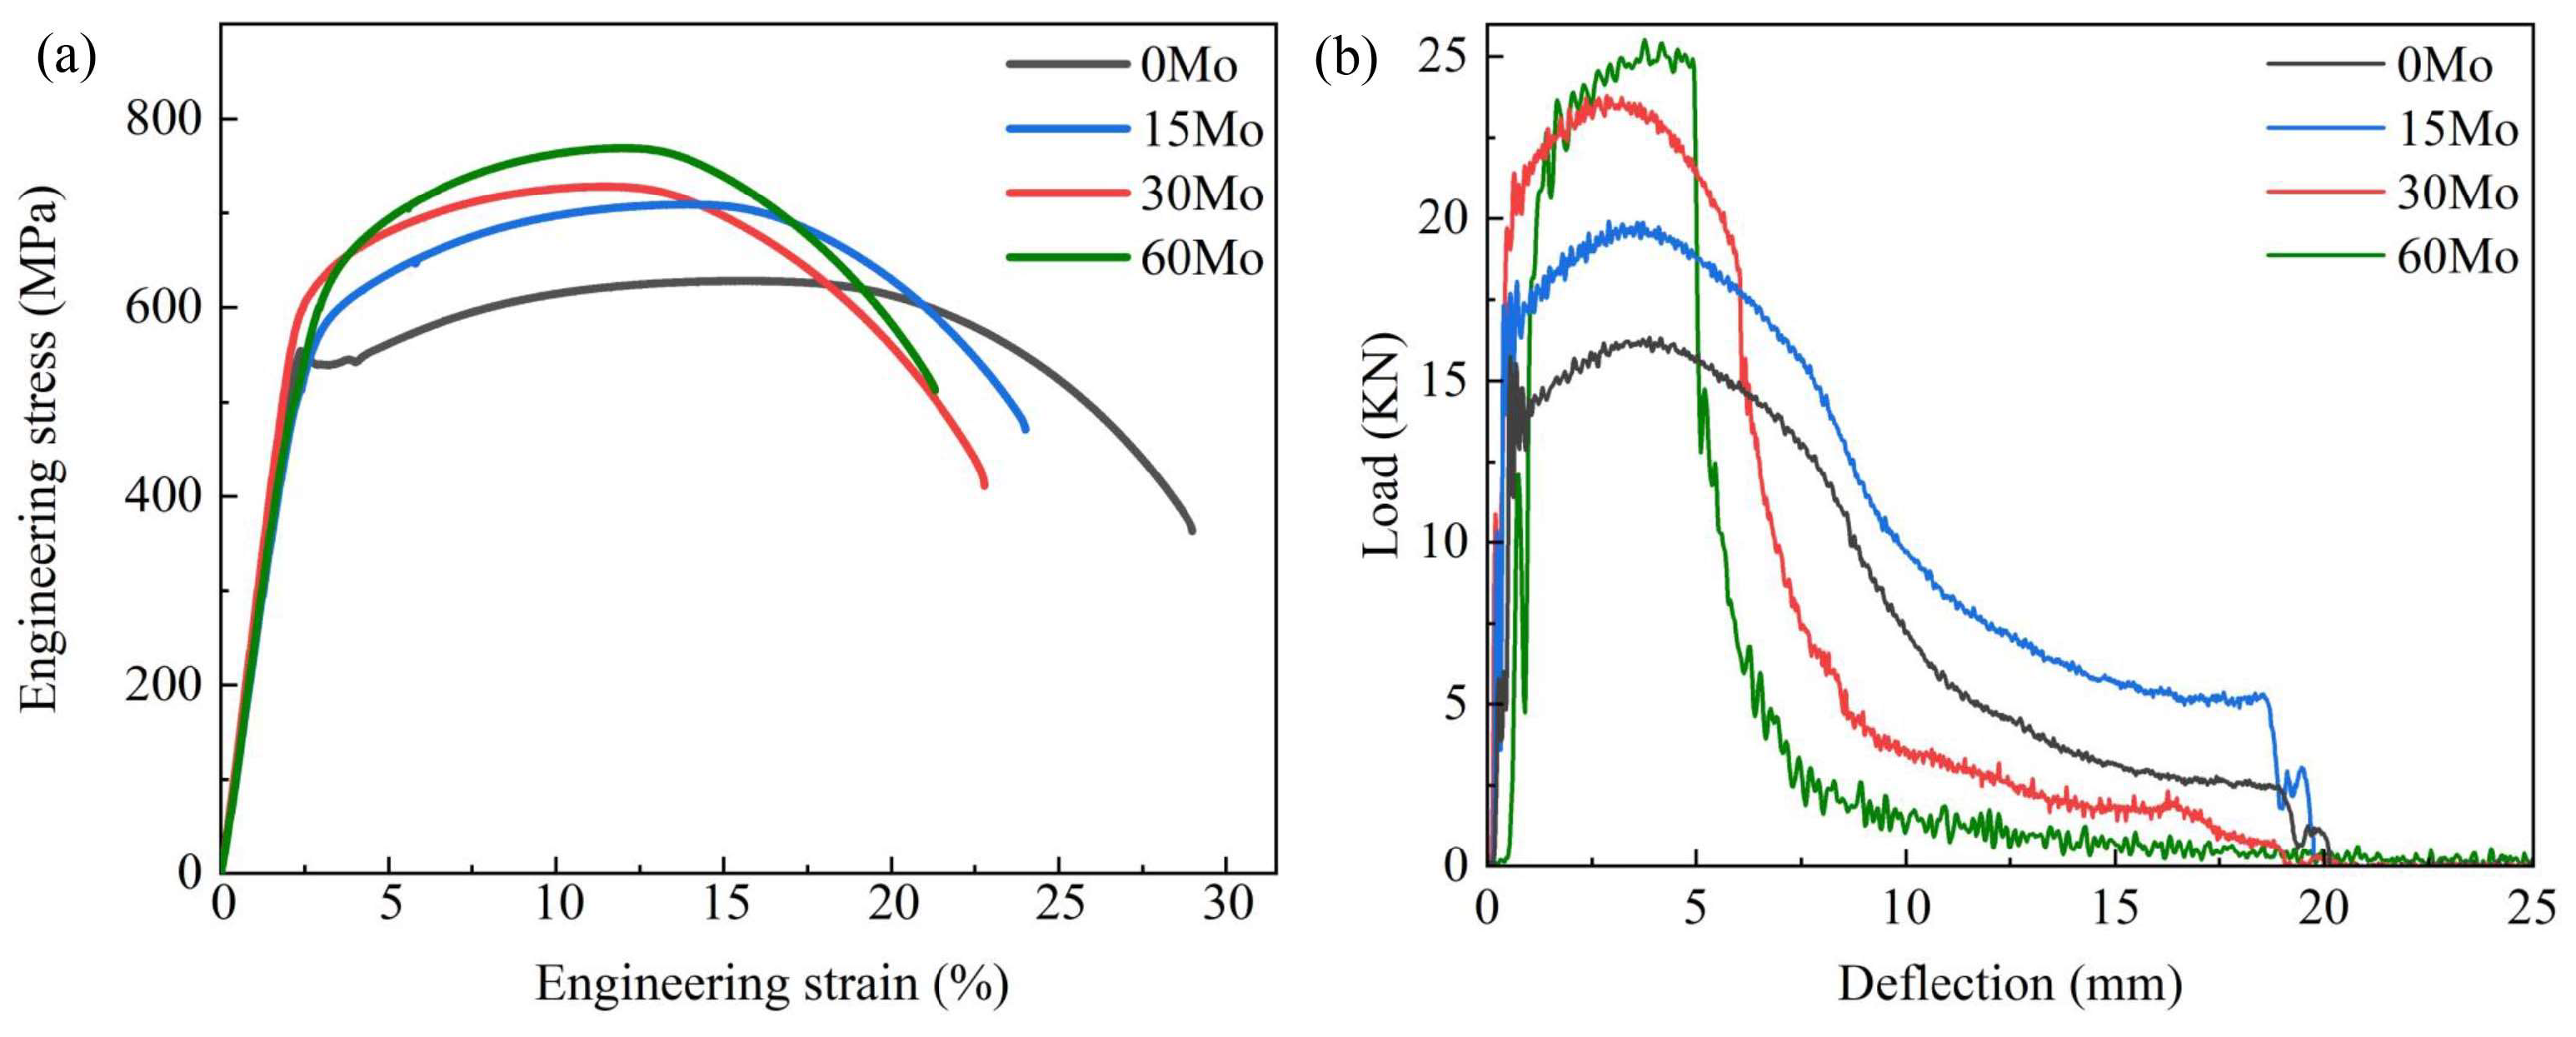
Typical stress–strain curves for strength and load-deflection curves for impact tests of the test steels with different Mo contents are shown in Figure 8a and Figure 8b, respectively. The specific variations in mechanical properties are statistically summarized in Table 3. With increasing Mo content, the yield strength (YS) of the base metal increased from 548 MPa to 628 MPa, the tensile strength (TS) increased from 635 MPa to 759 MPa, and the elongation decreased from 29.1% to 21.9%. The yield ratio (YR) first decreased from 0.86 to 0.81 and then increased to 0.82 and 0.83. Regarding impact properties, they exhibited an initial increase followed by a decrease. The results from the instrumented impact tests revealed different trends for crack initiation energy (Ei) and crack propagation energy (Ep). As the Mo content increased, the crack initiation energy increased monotonically, while the crack propagation energy first increased and then decreased. The steel with 0.15 wt% Mo exhibited the highest total impact energy (Et).

4. Discussion

4.1. Effect of Mo on Base Metal Strength

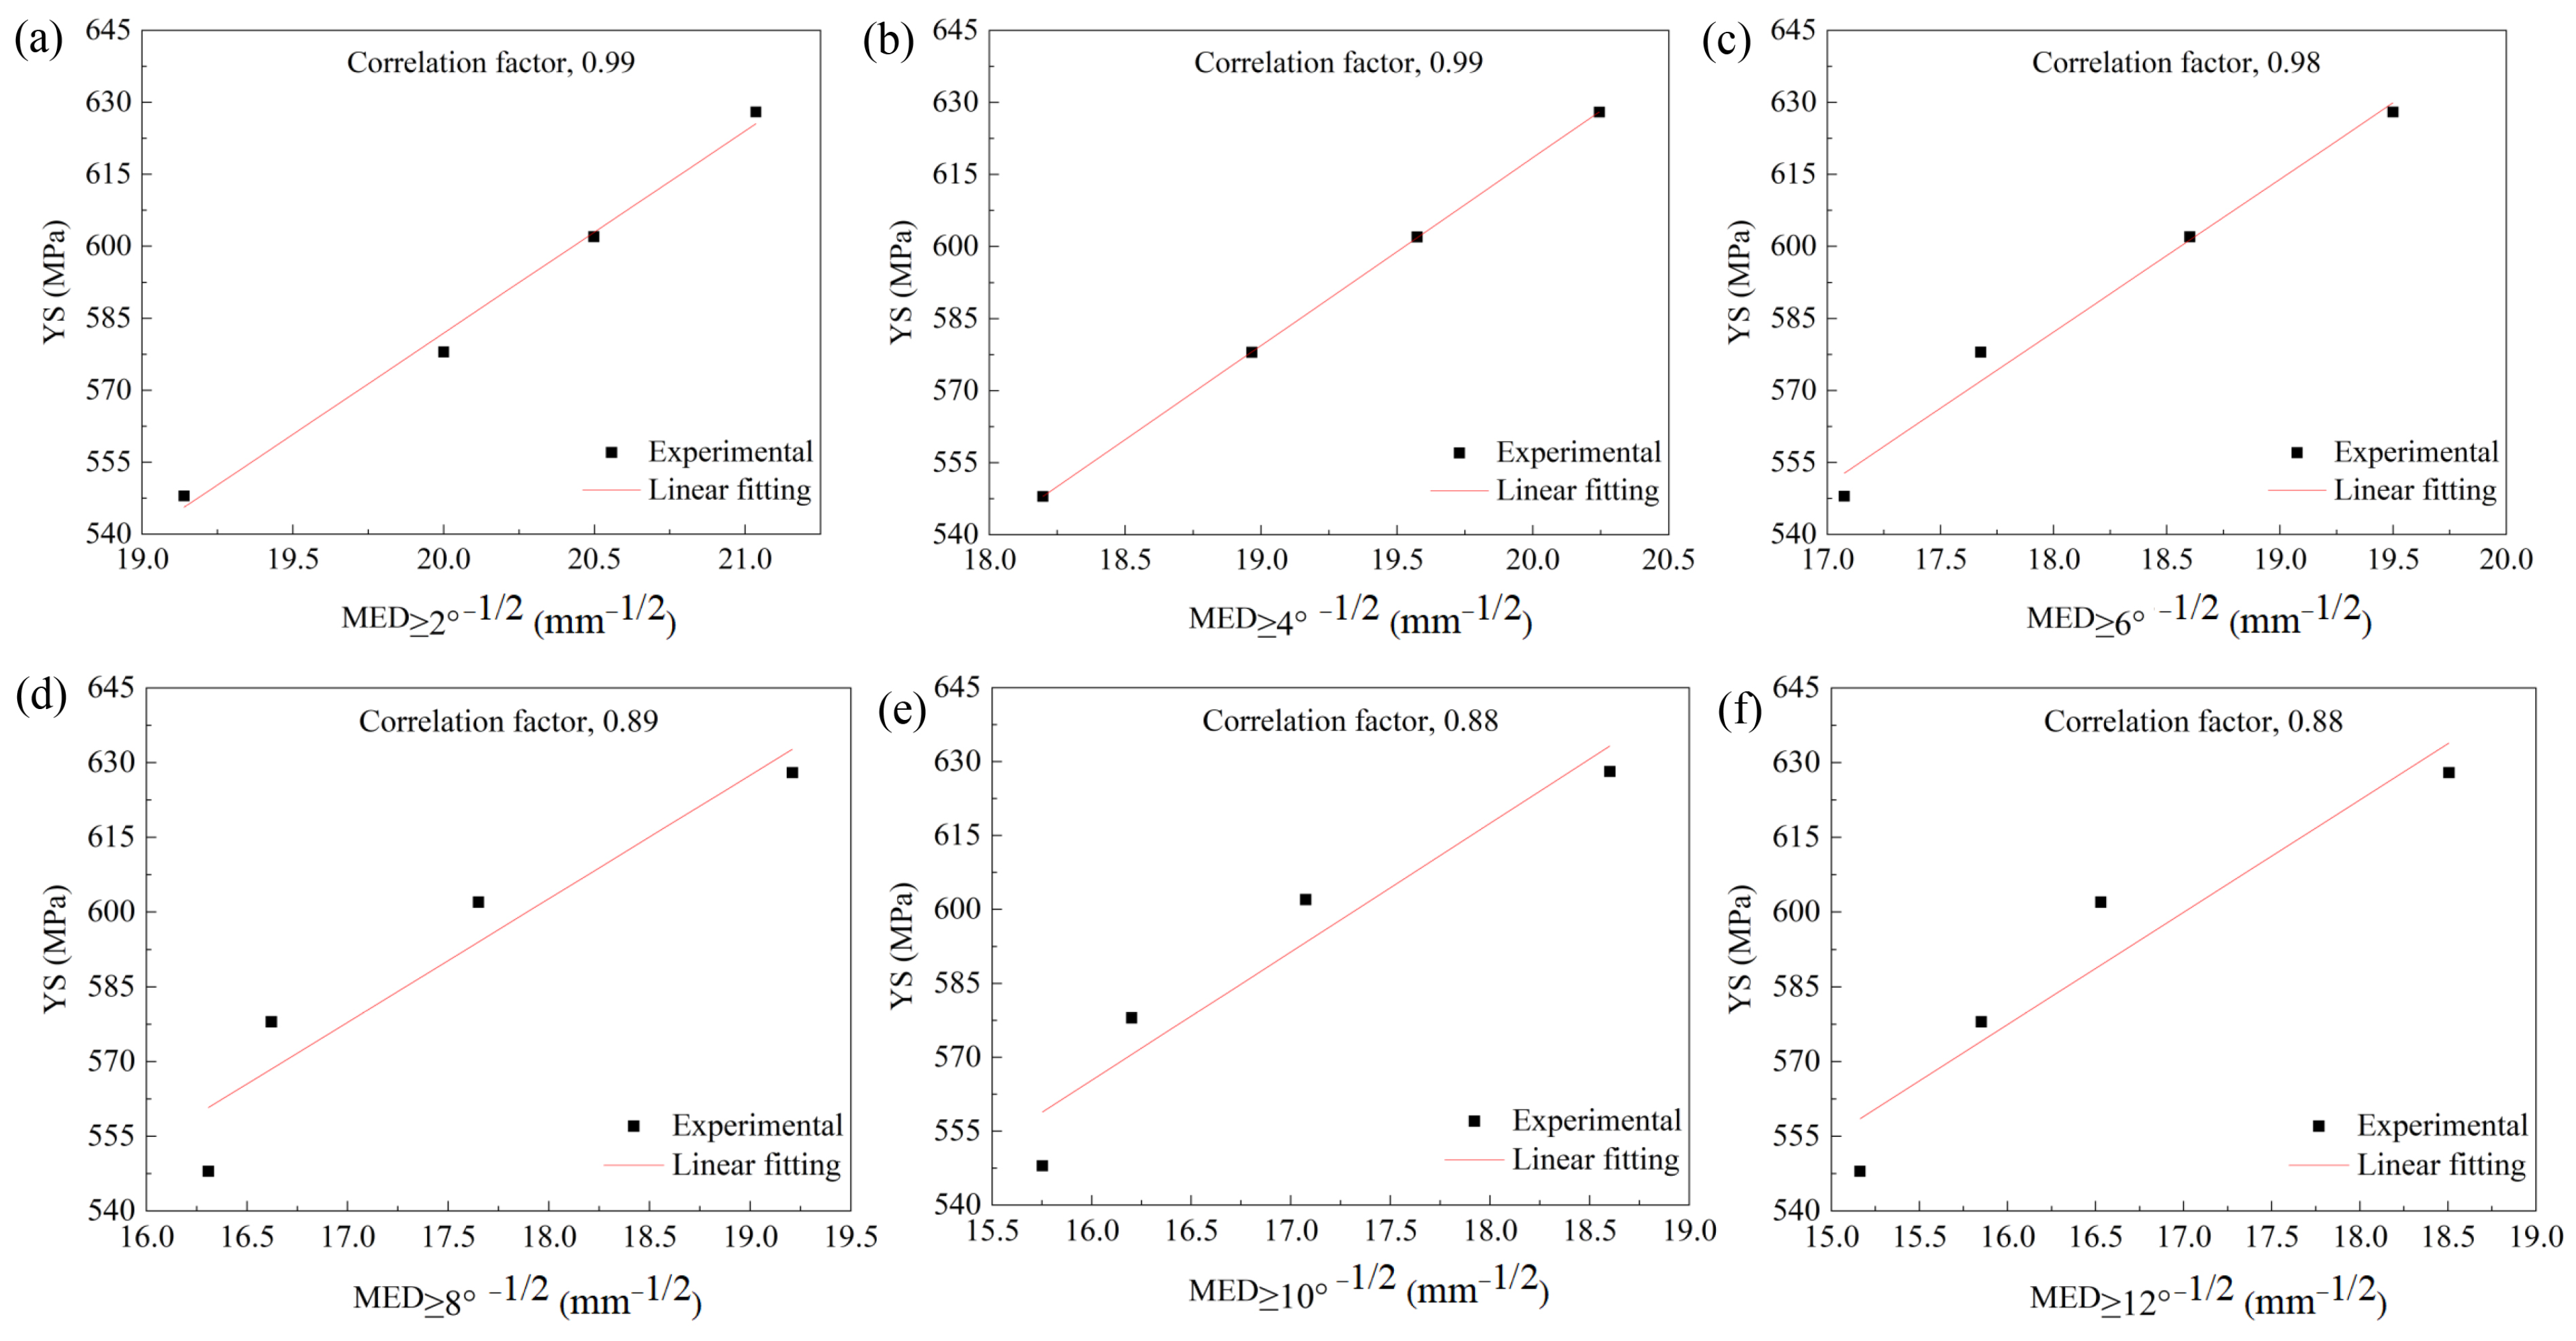
According to the research by Tian et al. [24,25], the relationship between YS and grain size in low-alloy steels can be described by the Hall–Petch equation, as shown in Equation (1). It is generally accepted that LAGBs with MTAs of 2–15° contribute to grain boundary strengthening, while HAGBs with MTAs > 15° act as barriers to crack propagation. Boundaries with MTAs below 2° primarily contribute to dislocation strengthening. The grain sizes defined by MTAs of 2°, 4°, 6°, 8°, 10°, and 12° were fitted against YS, and the results are presented in Figure 9. YS is inversely proportional to the grain size. With increasing Mo content, the grain sizes defined by MTAs of 2–12° refined, leading to an increase in YS. The grain sizes defined by MTAs of 2°, 4°, and 6° exhibited the best fit with YS, with correlation coefficients exceeding 0.98. The correlation coefficients for the fits between YS and grain sizes defined by MTAs of 8°, 10°, and 12° were below 0.90. Therefore, the grain size defined by MTAs of 2–6° is the most effective structural unit controlling YS, which is consistent with the findings of Hu et al. [26].
σ y = σ 0 +   k HP   d   1 / 2
where σy is the yield strength, σ0 is the other strengthening contributions, kHP is the Hall–Petch coefficient, and d is the grain size.
Additionally, from the strength test results in Figure 8a and Table 3, it is observed that as Mo content increases, both YS and tensile strength (TS) increase, while the YR first decreases and then increases. The primary reason for this result lies in the influence of the hard M/A constituents and the changes in the matrix microstructure. Compared to the matrix, M/A constituents are hard phases with significantly higher hardness than the ferrite matrix. Under tensile loading, they induce substantial local plastic deformation, thereby affecting strain hardening capacity [27,28]. As the Mo content increases from 0 to 0.15 wt%, the M/A constituents become more dispersed and refined. Simultaneously, the matrix microstructure contains some soft polygonal ferrite phase. This combination significantly enhances the strain hardening capacity, consequently lowering the YR. With a further increase in Mo to 0.30 wt% and 0.60 wt%, the M/A constituents are further refined. However, the proportion of the soft polygonal ferrite phase in the matrix microstructure markedly decreases, and low-temperature transformation products like lath bainitic ferrite appear. The hardness difference between the matrix and the M/A constituents diminishes, leading to a reduced strain hardening capacity and an increased YR [29].
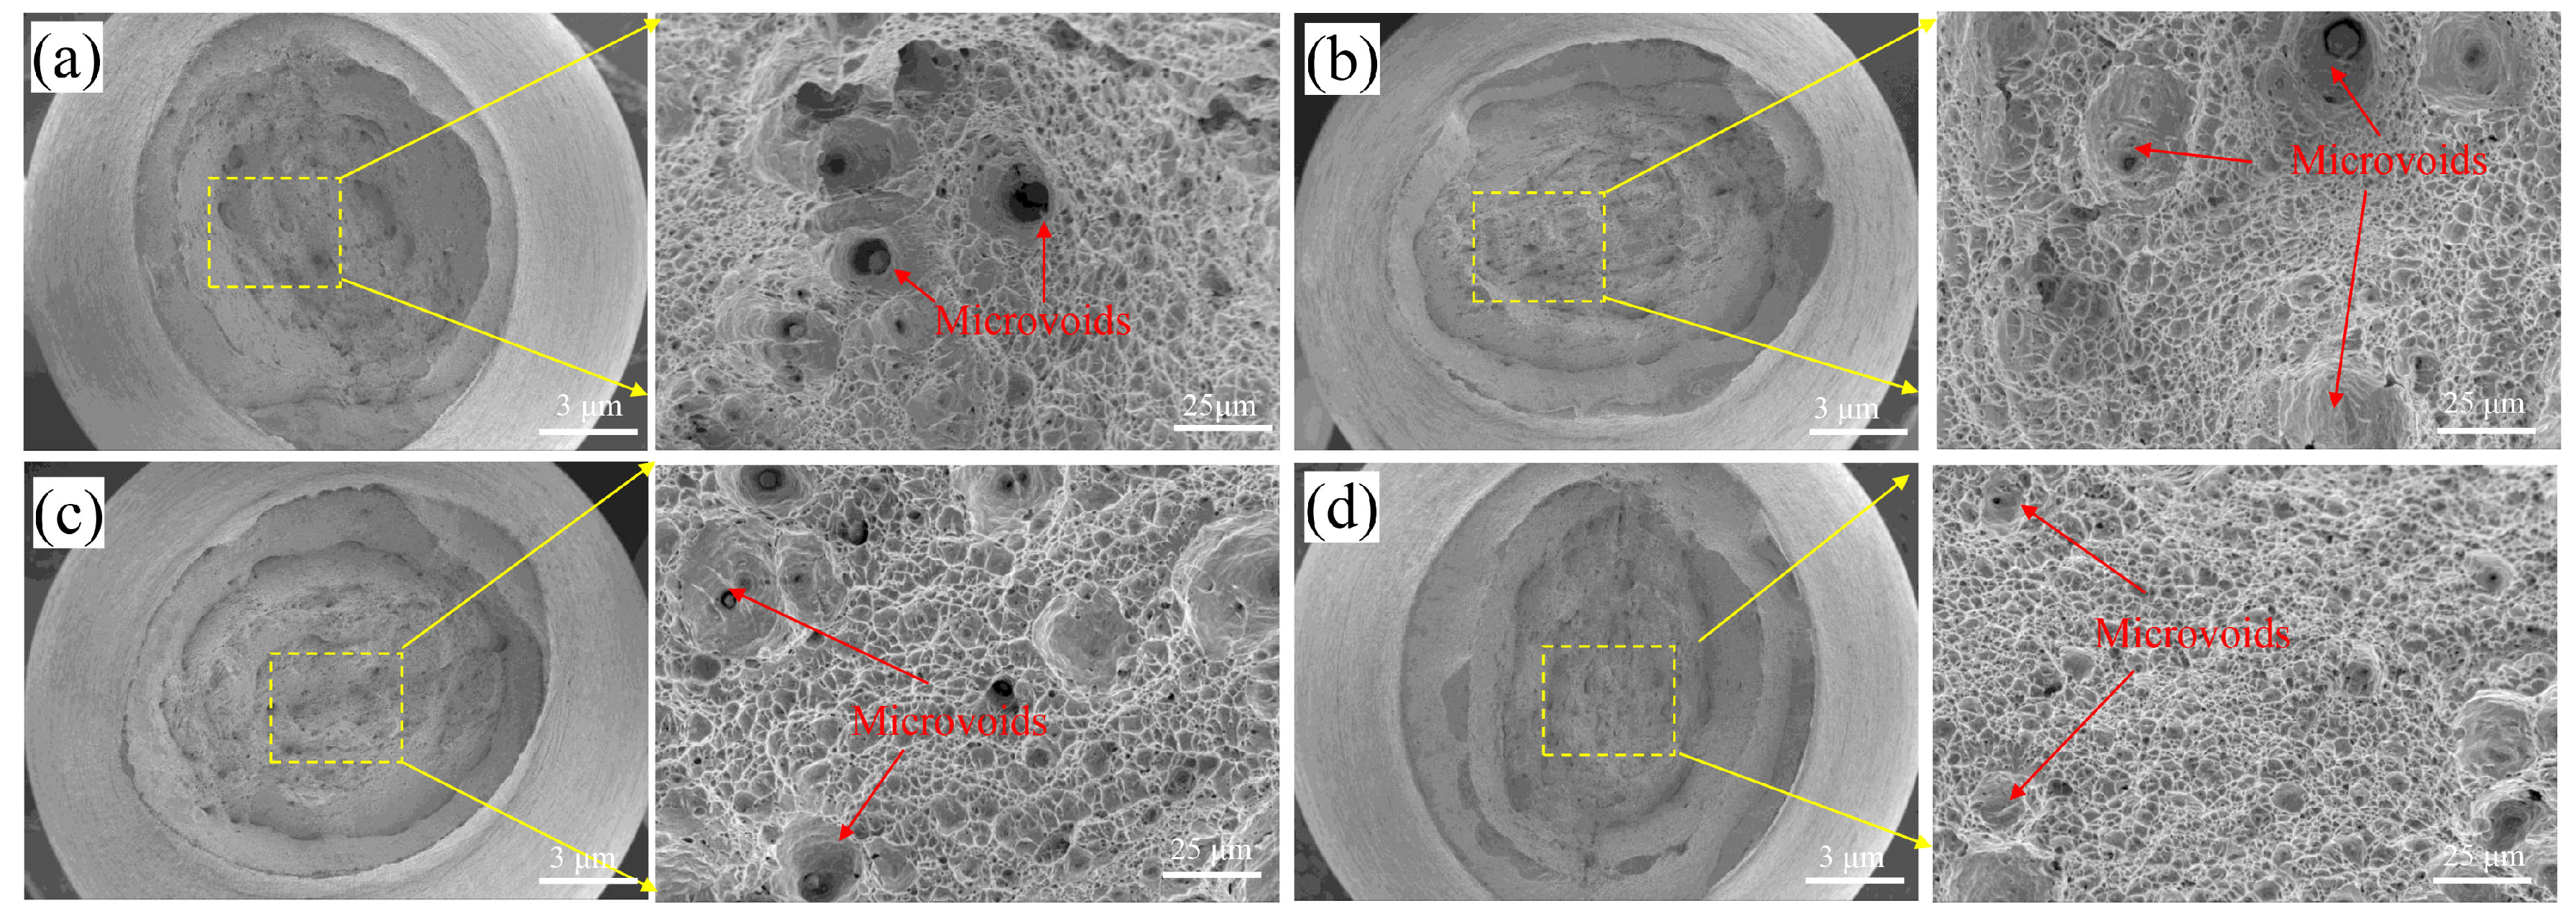
Furthermore, analysis of the tensile fracture surfaces (Figure 10) revealed the reason for the decrease in elongation with increasing Mo content. Research indicates that elongation is closely related to dislocation motion. Under tensile loading, the lower the resistance to dislocation motion, the higher the achievable elongation. In the steel without Mo, the microstructure had a high proportion of polygonal ferrite, which possesses fewer substructures, resulting in insufficient obstruction to dislocation movement and consequently high elongation. Its fracture surface showed a large fibrous zone with numerous deep microvoids. As the Mo content increased, the proportion of acicular ferrite, granular bainitic ferrite, and lath bainitic ferrite in the microstructure rose. This promoted an increase in substructures that effectively impede dislocation motion. The area of the fibrous zone decreased, the depth of the microvoids within it became shallower, and the elongation decreased.

4.2. Effect of Mo on Base Metal Toughness

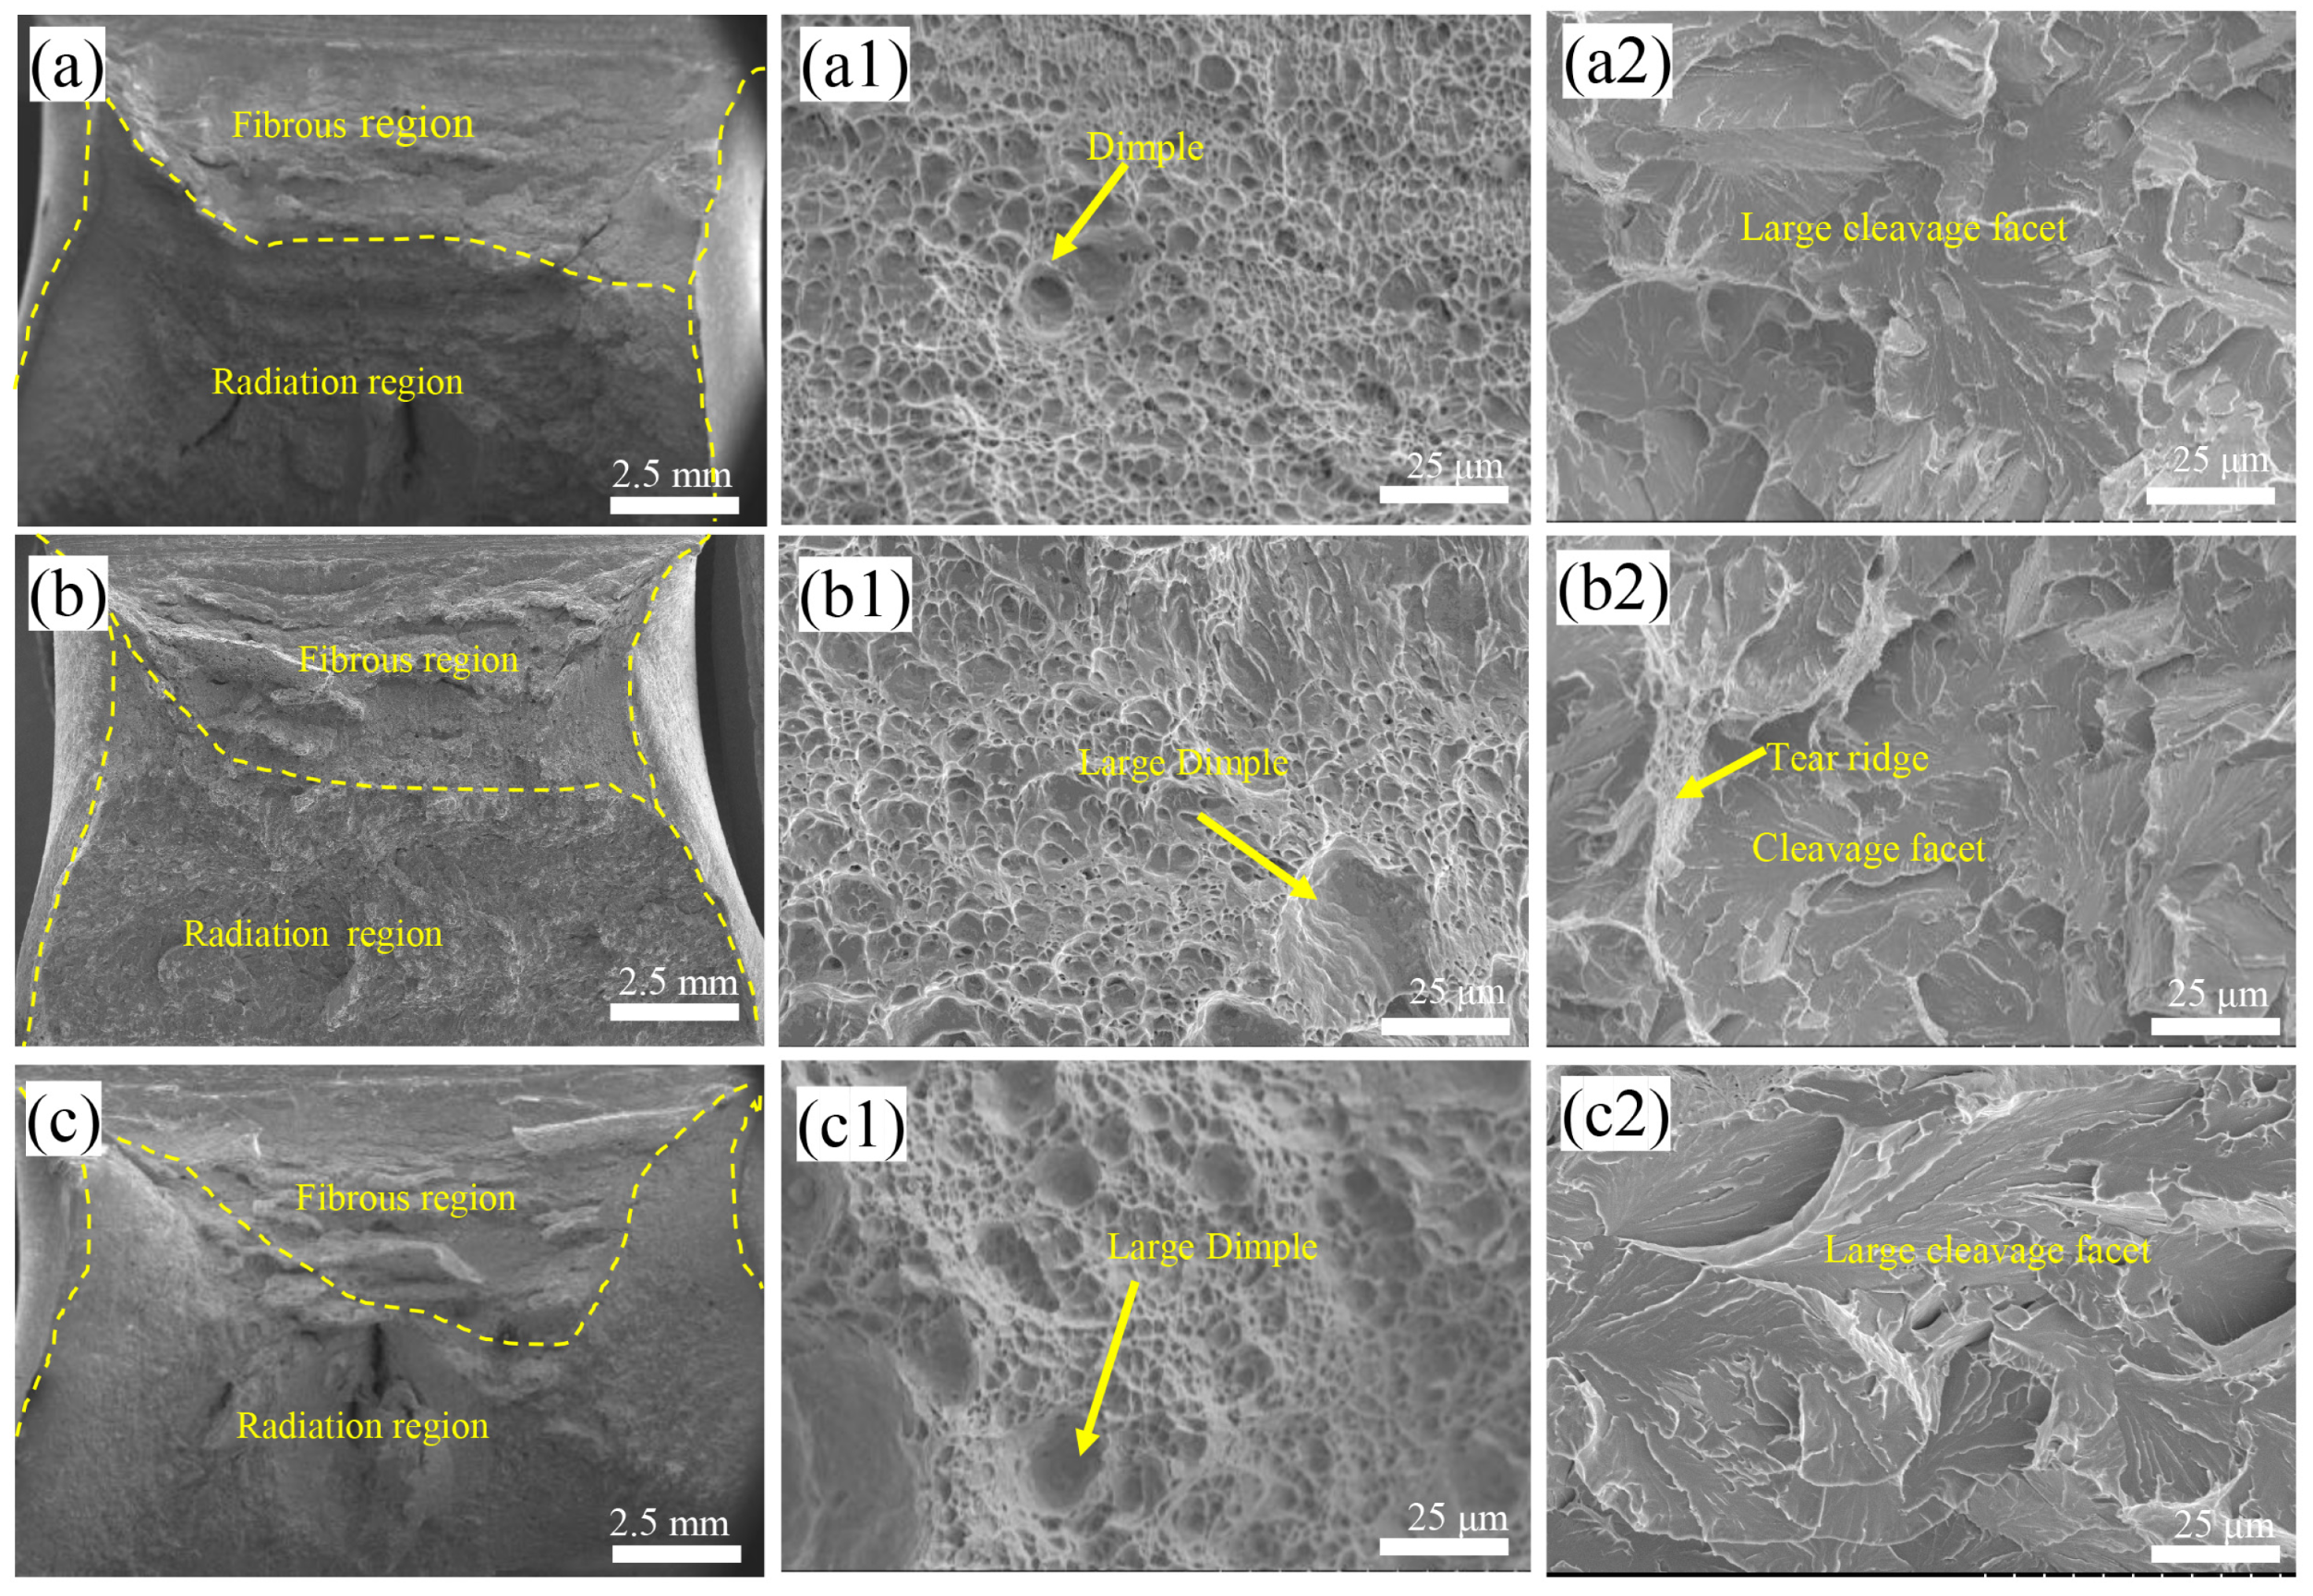
The impact property test results (Figure 8b and Table 3) show that as the Mo content in the steel increases, the Ei increases monotonically, while both the Ep and the Et first increase and then decrease. The steel with 0.15 wt% Mo achieved the optimal impact toughness. Observations of the impact fracture surfaces are shown in Figure 11. The impact fracture surfaces for all Mo contents consist of a fibrous zone, a radiation zone, and shear lips on both sides. The main morphology in the fibrous zone is dimples, while the radiation zone exhibits cleavage facets with river patterns. As the Mo content increases, the area of the main fracture fibrous zone first increases and then decreases, the dimples within it gradually deepen, and the size of the cleavage facets in the radiation zone first decreases and then increases. Therefore, the toughening mechanism of the base metal is elucidated from both crack initiation and crack propagation aspects.
In studies on the fracture behavior of low-alloy steels, the local embrittlement induced by hard phases is recognized as the dominant mechanism for crack initiation. When the material is subjected to impact loading, the disparity in plastic deformation compatibility between hard/brittle phases and the ferrite matrix leads to significantly non-uniform strain distribution. This heterogeneous deformation effect creates strain concentration zones at the interfaces of the hard/brittle phases. When the local accumulated strain exceeds a critical threshold, microcracks initiate at or around the hard phase [30,31].
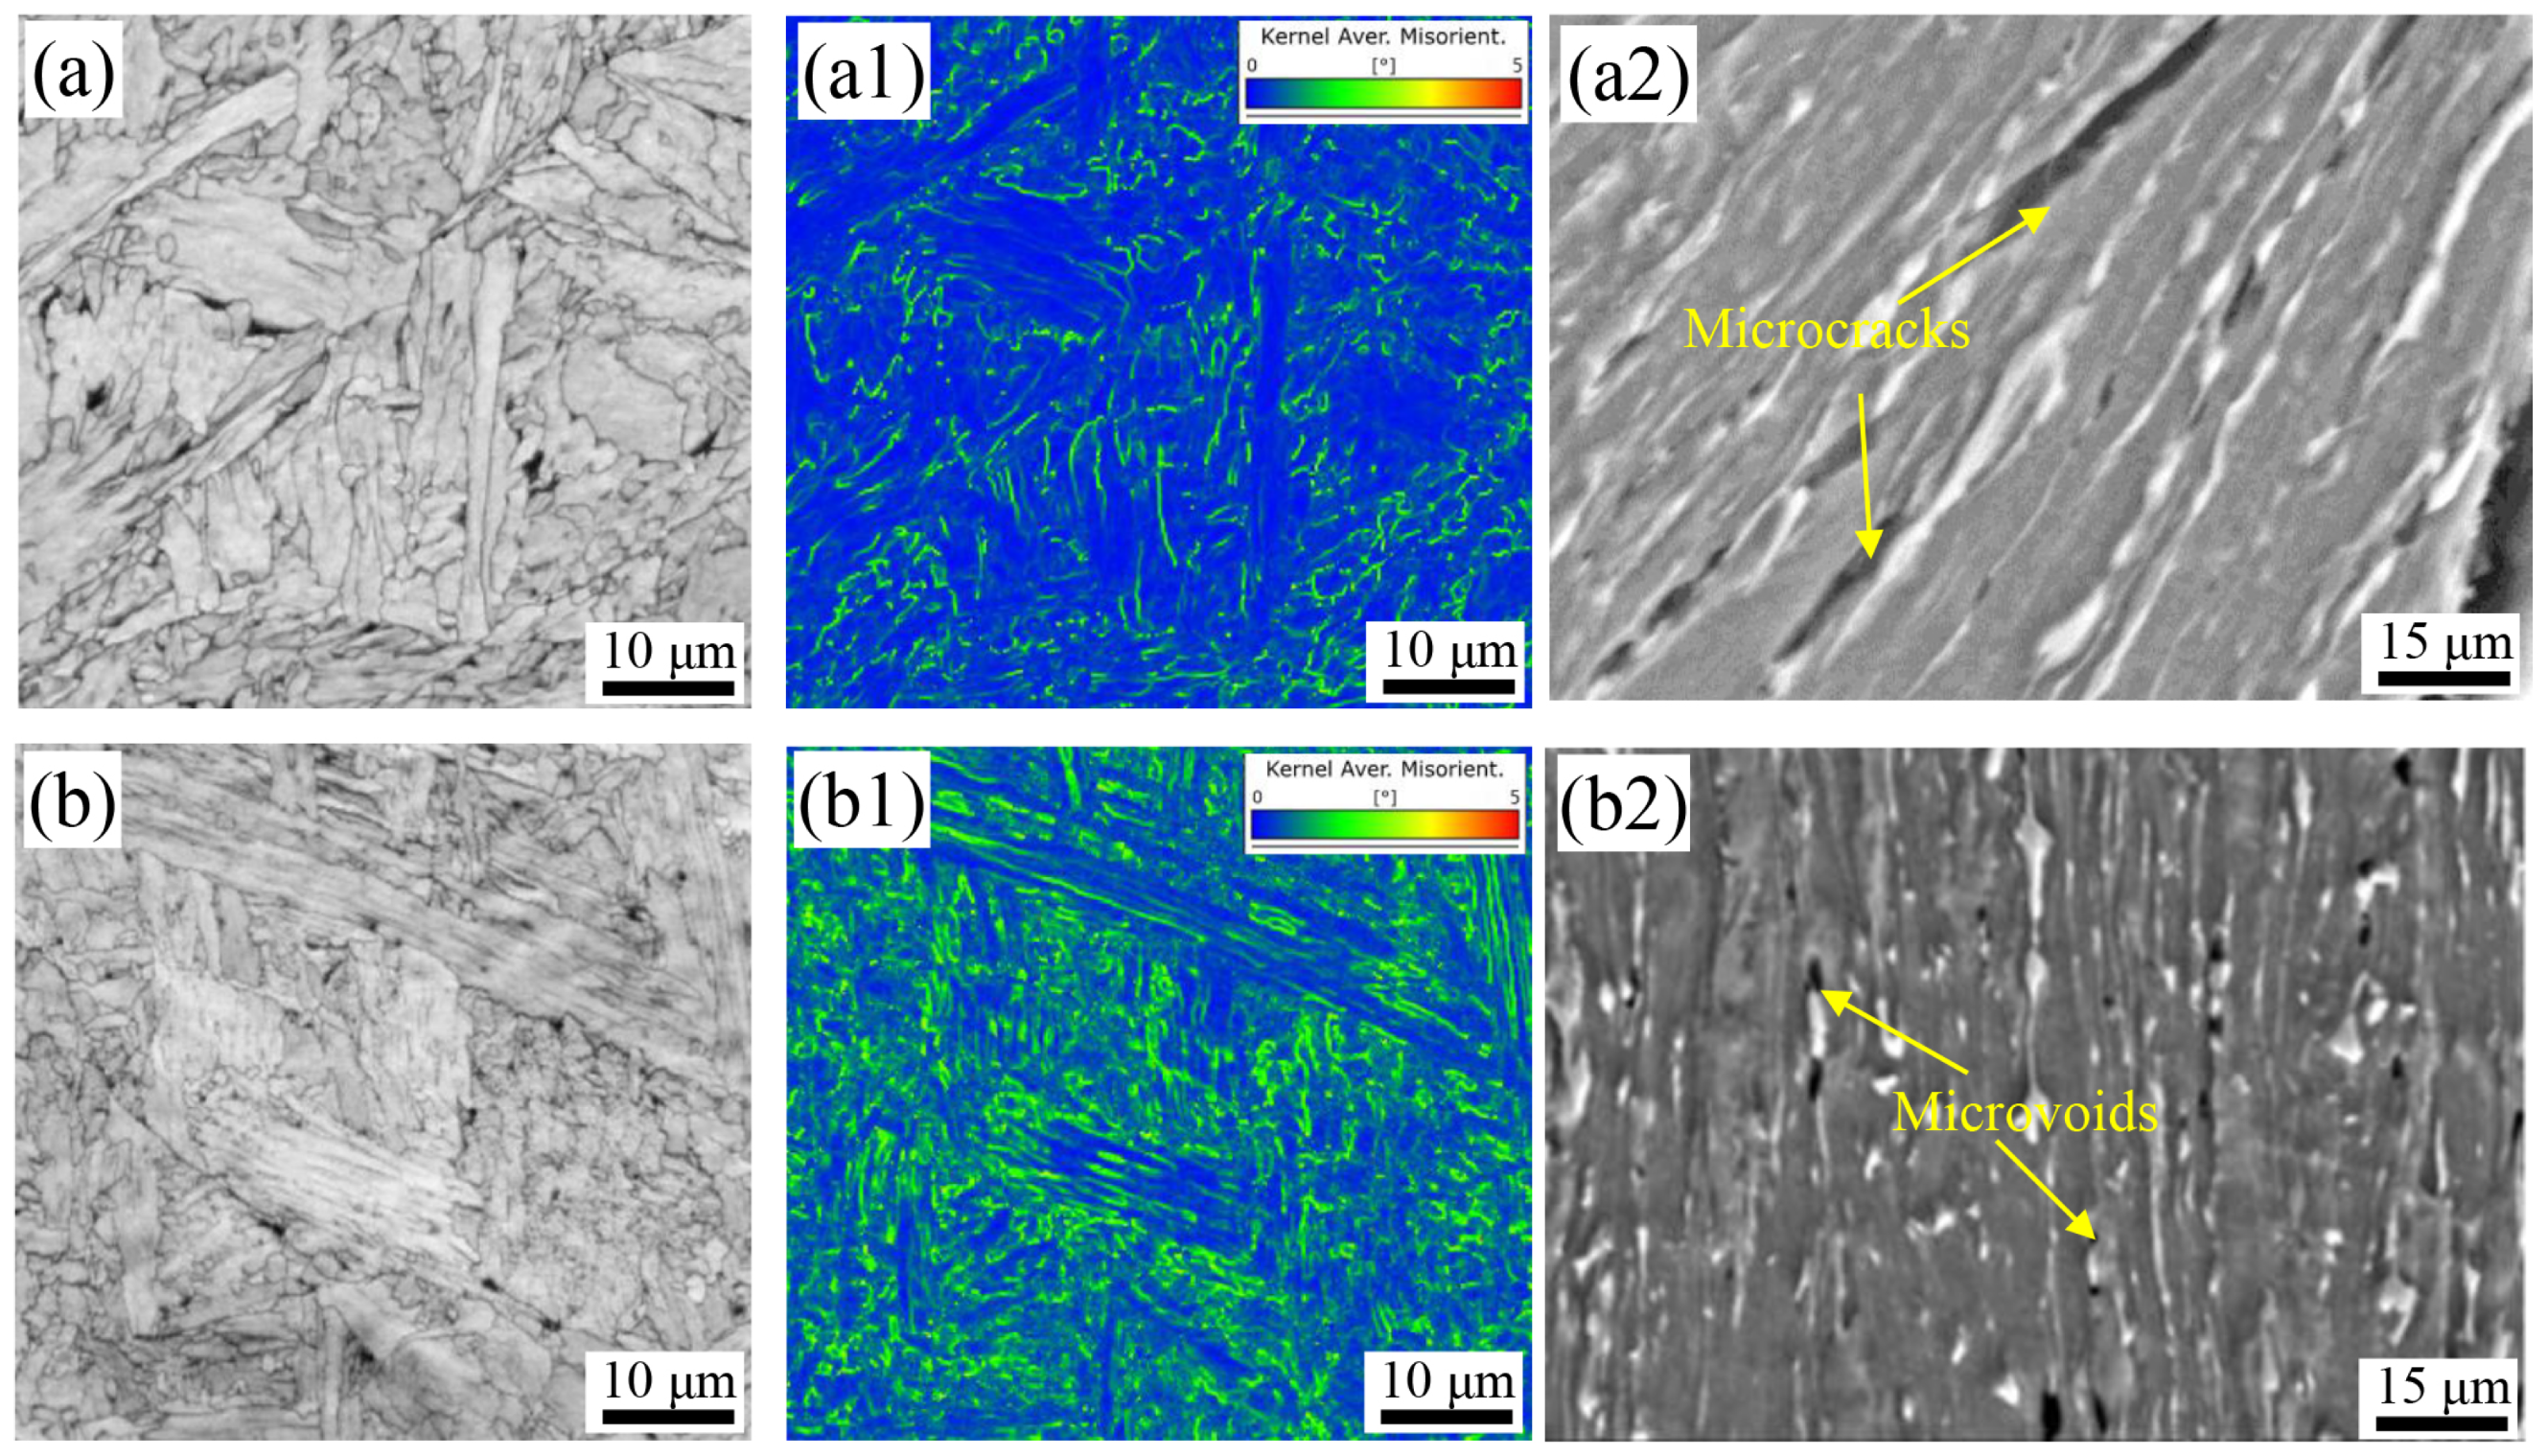
The local micro-strain level in low-alloy steels can be assessed using Kernel Average Misorientation (KAM) from electron backscatter diffraction [24,28]. The detection results in this study are shown in Figure 12a,b and Figure 12(a1,b1). The results indicate that micro-strain is mainly concentrated around the M/A constituents. As Mo content increases, the M/A constituents become more dispersed and refined, reducing the inhomogeneity of local micro-strain. Further observation of crack initiation behavior beneath the fibrous zone of the fracture surface (Figure 12(a2,b2)) reveals that with increasing Mo content, the crack initiation mode shifts from microcrack formation to microvoid formation. Therefore, increasing Mo content reduces the inhomogeneity between hard and soft phases in the microstructure, improves the capacity for coordinated plastic deformation, lowers crack initiation susceptibility, and consequently increases crack initiation energy.
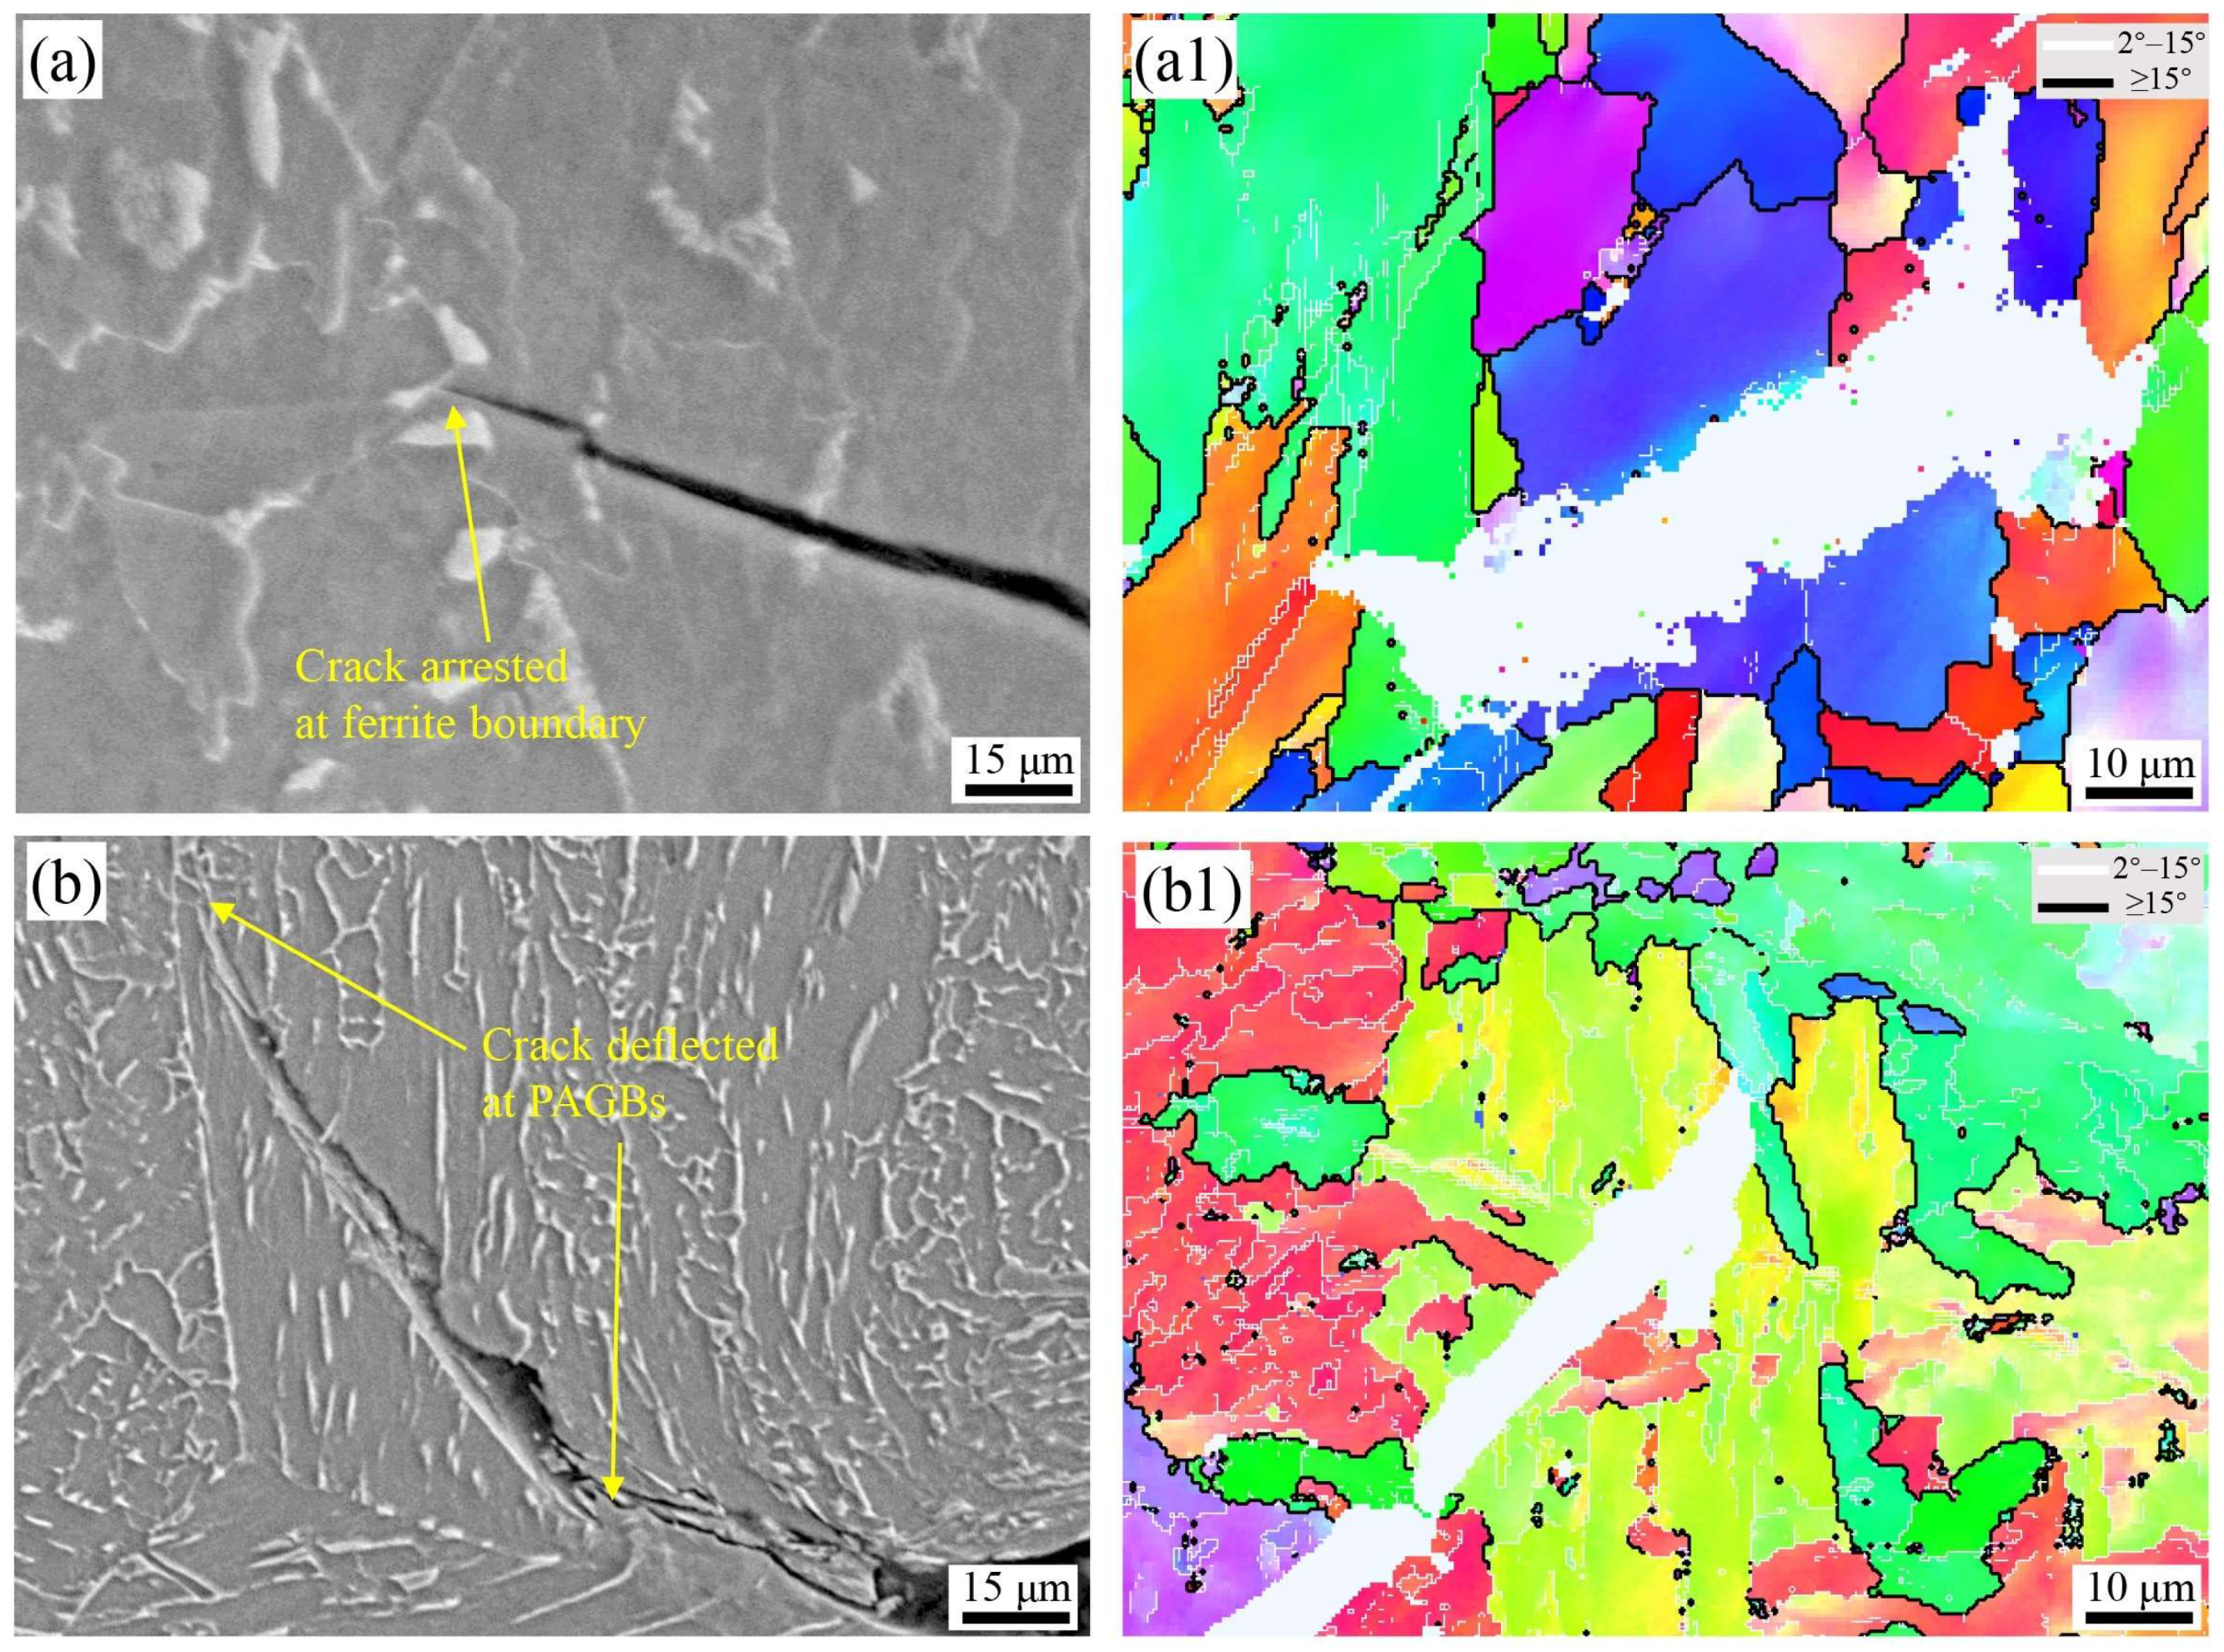
Under impact loading, whether a propagating crack deflects or arrests mainly depends on the grain boundaries it encounters and their corresponding misorientation angles [32]. Scanning electron microscope characterization (Figure 13a,b) shows that cracks stopped or deflected upon encountering ferrite boundaries and prior austenite grain boundaries (PAGBs). Further electron backscatter diffraction characterization (Figure 13a,b) confirms that HAGBs significantly hinder crack propagation. Therefore, the frequency with which a propagating crack encounters HAGBs determines the crack propagation energy. From the electron backscatter diffraction characterization in Figure 7 and Table 2, it is found that as Mo content increases, the proportion of HAGBs first increases from 43.6% to 47.3% then decreases to 46.2% and 40.0%. The MEDMTAs≥15° first decrease from 4.89 μm to 4.43 μm and then increase to 4.56 μm and 4.68 μm. Consequently, the density of HAGBs per unit area first increases and then decreases. During crack propagation, the steel with 0.15 wt% Mo possesses the highest HAGB density, resulting in the highest crack propagation energy. With a further increase in Mo content, the proportion of lath bainitic ferrite increases while acicular ferrite decreases, leading to a reduction in HAGB density and a corresponding decrease in propagation energy.
In summary, as Mo content increases, the crack initiation energy gradually increases. However, due to the initial increase and subsequent replacement of acicular ferrite by lath bainitic ferrite, the crack propagation energy first increases and then decreases. The combined effect of crack initiation and propagation results in the steel with 0.15 wt% Mo exhibiting the optimal low-temperature impact toughness.

5. Conclusions

In this study, test steels with different Mo contents were prepared using controlled rolling and controlled cooling processes. The influence of Mo content on the microstructure, impact, and tensile properties of the test steels was investigated, and the strengthening and toughening mechanisms of the base metal were preliminarily elucidated. The main conclusions are as follows:
(1)
Microstructural evolution: Steels with 0–0.15 wt% Mo exhibited polygonal ferrite, acicular ferrite, and granular bainitic ferrite. At ≥0.30 wt% Mo, the polygonal ferrite proportion decreased significantly with lath bainitic ferrite formation. Mo addition refined and dispersed hard M/A constituents.
(2)
Strengthening mechanism: Mo content increase enhanced yield/tensile strength. The 2–6° misorientation tolerance angles-defined grain size showed optimal Hall–Petch correlation with yield strength. The 0.15% Mo steel demonstrated the highest strain-hardening capacity and the lowest yield ratio.
(3)
Toughness mechanism: Elevated Mo reduced local micro-strain concentration and crack initiation susceptibility. Both ferrite lath boundaries and PAGBs acted as HAGBs, effectively retarding crack propagation. Crack propagation energy showed a non-monotonic trend (rise then fall) with Mo content. The 0.15% Mo steel achieved optimal low-temperature impact toughness through synergistic improvement in crack initiation resistance and propagation resistance.

Author Contributions

Conceptualization, Q.W.; data curation, J.H. and Y.Y.; formal analysis, J.H.; investigation, Y.Y.; methodology, Q.W. and J.H.; writing original draft preparation, J.H. and Q.W. All authors have read and agreed to the published version of the manuscript.

Funding

This study was supported by the National Natural Science Foundation of China (52127808) and the National Key Research and Development Program of China (Grant No. 2017YFB0304800 and Grant No. 2017YFB0304802 for the second subproject).

Data Availability Statement

The original contributions presented in this study are included in the article. Further inquiries can be directed to the corresponding author.

Conflicts of Interest

Author Jun Hong was employed by Nanjing lron & Steel United Co., Ltd. The remaining authors declare that the research was conducted in the absence of any commercial or financial relationships that could be construed as a potential conflict of interest.

References

  1. Baere, K.; Verstraelen, H.; Willemen, R.; Smet, J.; Tchuindjang, J.; Lecomte-Beckers, J.; Lenaerts, S.; Meskens, R.; Jung, H.; Potters, G. Assessment of Corrosion Resistance, Material Properties, and Weldability of Alloyed Steel for Ballast Tanks. J. Mar. Sci. Technol. 2017, 22, 176–199. [Google Scholar] [CrossRef]
  2. Wei, J.; Qi, Y.; Tian, Z.; Peng, Y. Corrosion Behavior of Welded Joints for Cargo Oil Tanks of Crude Oil Carrier. J. Iron Steel Res. Int. 2016, 23, 955–962. [Google Scholar] [CrossRef]
  3. Dalcin, R.; Machado, I.; Gonzalez, A.; Gonzalez, A.; Mazzaferro, J. Effects of Heat Input and Consumable on Simple Bending Strength of Welded Joints in TMCP Steel Tubular Profiles. Soldag. Insp. 2016, 21, 92–102. [Google Scholar] [CrossRef]
  4. Cai, W.; Wang, Y.; Li, G.; Stroetmann, R. Comparative Study on Strength of TMCP and QT High-Strength Steel Butt-Welded Joints. Constr. Steel Res. 2022, 197, 107447. [Google Scholar] [CrossRef]
  5. Liu, W.; Zhou, Q.; Li, L.; Wu, Z.; Cao, F.; Cao, Z. Effect of Alloy Element on Corrosion Behavior of the Huge Crude Oil Storage Tank Steel in Seawater. J. Alloys Compd. 2014, 598, 198–204. [Google Scholar] [CrossRef]
  6. He, Y.; Liu, J.; Huang, G.; Xu, H.; Liu, N.; Qi, J. Elemental Segregation, Microstructure, and Mechanical Properties of TMCP-treated High-Manganese Wear-resistant Ateel. J. Iron Steel Res. Int. 2025, 32, 783–798. [Google Scholar] [CrossRef]
  7. Suryawanshi, J.; Singh, G.; Msolli, S.; Jhon, M.; Ramamurty, U. Tension-compression Asymmetry and Shear Strength of Titanium Alloys. Acta Mater. 2021, 221, 117392. [Google Scholar] [CrossRef]
  8. Su, S.; Song, R.; Quan, S.; Wang, Y.; Cai, C. Microstructure-mechanical Properties Relationships and Strain Hardening Mechanism for Medium-Mn steel with Low Yield and Ultra-high Tensile Strength. Mater. Sci. Eng. 2023, A 874, 145085. [Google Scholar] [CrossRef]
  9. Mandal, G.; Ghosh, S.; Chakrabarti, D. Influence of TMCP Parameters on Structure and Properties of Low Carbon Cu Bearing Ultra-High Strength Steel. Phys. Met. Metall. 2020, 121, 269–275. [Google Scholar] [CrossRef]
  10. He, B.; Wang, M.; Liu, L.; Huang, M. High-Strength Medium Mn Quenching and Partitioning Steel with Low Yield Ratio. Mater. Sci. Technol. 2019, 35, 2109–2114. [Google Scholar] [CrossRef]
  11. Liu, D.; Yang, J.; Zhang, Y.; Xu, L. Effect of Mo Content on Nano-Scaled Particles, Prior Austenite Grains and Impact Toughness of CGHAZ in Offshore Engineering Steels. J. Iron Steel Res. Int. 2022, 29, 846–858. [Google Scholar] [CrossRef]
  12. Kumar, P.; Maity, K.; Dasgupta, A.; Gond, S.; Sarkar, B. Innovations in Thermo-mechanical Processing to Develop High Strength Steel Plates. Trans. Indian Inst. Met. 2022, 75, 2069–2076. [Google Scholar] [CrossRef]
  13. Urtsev, N.; Platov, S.; Shmakov, A.; Ryzhkov, M.; Lobanov, M. Thermophysical Properties of High-Strength Low-Alloyed Pipe Steel. Phys. Met. Metall. 2024, 125, 1284–1290. [Google Scholar] [CrossRef]
  14. Kostryzhev, A.; Singh, N.; Chen, L.; Killmore, C.; Pereloma, E. Comparative Effect of Mo and Cr on Microstructure and Mechanical Properties in NbV-Microalloyed Bainitic Steels. Metals 2018, 8, 134. [Google Scholar] [CrossRef]
  15. Jia, J.; Liu, Z.; Li, X.; Du, C.; Li, W. Comparative Study on The Stress Corrosion Cracking of A New Ni-advanced High Strength Steel Prepared by TMCP, Direct Quenching, and Quenching & Tempering. Mater. Sci. Eng. 2021, A 825, 141854. [Google Scholar]
  16. Fan, Y.; Wang, Q.; Liu, H.; Wang, T.; Wang, Q.; Zhang, F. Effect of Controlled Cooling on Microstructure and Tensile Properties of Low C Nb-Ti-Containing HSLA Steel for Construction. Metals 2017, 7, 23. [Google Scholar] [CrossRef]
  17. Bayock, F.; Kah, P.; Layus, P.; Karkhin, V. Numerical and Experimental Investigation of the Heat Input Effect on the Mechanical Properties and Microstructure of Dissimilar Weld Joints of 690-MPa QT and TMCP Steel. Metals 2019, 9, 355. [Google Scholar] [CrossRef]
  18. Li, Y.; Huang, M. A Method to Calculate the Dislocation Density of a TWIP Steel Based on Neutron Diffraction and Synchrotron X-Ray Diffraction. Acta Metall. Sin. 2020, 56, 487–493. [Google Scholar]
  19. Suryanarayana, C. Mechanical Alloying: A Critical Review. Mater. Res. Lett. 2022, 10, 619–647. [Google Scholar] [CrossRef]
  20. Xiao, X.; Peng, Y.; Ma, C.; Tian, Z. Effects of Alloy Element and Microstructure on Corrosion Resistant Property of Deposited Metals of Weathering Steel. J. Iron Steel Res. Int. 2016, 23, 171–177. [Google Scholar] [CrossRef]
  21. Cao, R.; Han, C.; Guo, X.; Jiang, Y.; Liao, F.; Yang, F.; Dou, G.; Yan, Y.; Chen, J. Effects of Boron on the Microstructure and Impact Toughness of Weathering Steel Weld Metals and Existing Form of Boron. Mater. Sci. Eng. 2022, A 833, 142560. [Google Scholar] [CrossRef]
  22. Hu, B.; Zhang, Y.; Wu, J.; Wang, Q.; Wang, Q. Mechanisms Underlying the Marked Enhancement of Toughness in the CGHAZ of N-Ti Weathering Steel Subjected to Large Heat Input Through the Trace Addition of Vanadium. Mater. Sci. Eng. 2025, A 925, 147910. [Google Scholar] [CrossRef]
  23. Lee, C.; Shin, H.; Park, K.; Chang, K. Impact Fracture Energy of Structural Steel Welds Constructed at Low Ambient Temperatures. Constr. Build. Mater. 2014, 50, 394–400. [Google Scholar] [CrossRef]
  24. Abreu, L.; Faria, G.; de Faria, R.; Matsubara, D.; Porcaro, R. Optimizing Rolling Strategies for API 5L X80 Steel Heavy Plates Produced by Thermomechanical Processing in a Reversible Single-Stand Mill. Metals 2024, 14, 746. [Google Scholar]
  25. Tian, J.; Wang, W.; Xu, G.; Wang, X.; Zhou, M.; Zurob, H. Microstructure and Properties of a Low Carbon Bainitic Steel Produced by Conventional and Inverted Two-Step Austempering Processes. Met. Mater. Int. 2023, 29, 1298–1310. [Google Scholar] [CrossRef]
  26. Hu, B.; Wang, Q.; Wang, Q. Effect of Heat Input on Microstructure and Tensile Properties in Simulated CGHAZ of a V-Ti-N Microalloyed Weathering Steel. Metals 2023, 13, 1607. [Google Scholar] [CrossRef]
  27. Chen, C.; Lv, B.; Feng, X.; Zhang, F.; Beladi, H. Strain Hardening and Nanocrystallization Behaviors in Hadfield Steel Subjected to Surface Severe Plastic Deformation. Mater. Sci. Eng. 2018, A 729, 178–184. [Google Scholar] [CrossRef]
  28. Kim, J.; Ko, S.; Hwang, B. Effect of Microstructure on Strain Aging and Hydrogen Embrittlement Behavior of Bake Hardening Steels. Korean J. Met. Mater. 2022, 60, 811–818. [Google Scholar] [CrossRef]
  29. Roccisano, A.; Nafisi, S.; Stalheim, D.; Ghomashchi, R. Effect of TMCP rolling schedules on the microstructure and performance of X70 steel. Mater. Charact. 2021, 178, 111207. [Google Scholar] [CrossRef]
  30. Bertolo, V.; Jiang, Q.; Sanchez, M.; Riemslag, T.; Walters, C.; Sietsma, J.; Popovich, V. Cleavage Fracture Micromechanisms in Simulated Heat Affected Zones of S690 High Strength Steels. Mater. Sci. Eng. 2023, A 868, 144762. [Google Scholar] [CrossRef]
  31. Jiang, J.; Bao, W.; Peng, Z.; Wang, Y.; Liu, J.; Dai, X. Experimental Investigation on Mechanical Behaviours of TMCP High Strength Steel. Constr. Build. Mater. 2019, 200, 664–680. [Google Scholar] [CrossRef]
  32. Liu, M.; Du, C.; Li, Y.; Li, X. A Novel Multiphase Stainless Steel with Ultra-Low Yield Ratio and High Ductility. Acta Metall. Sin (Engl. Lett.) 2024, 37, 1777–1784. [Google Scholar] [CrossRef]
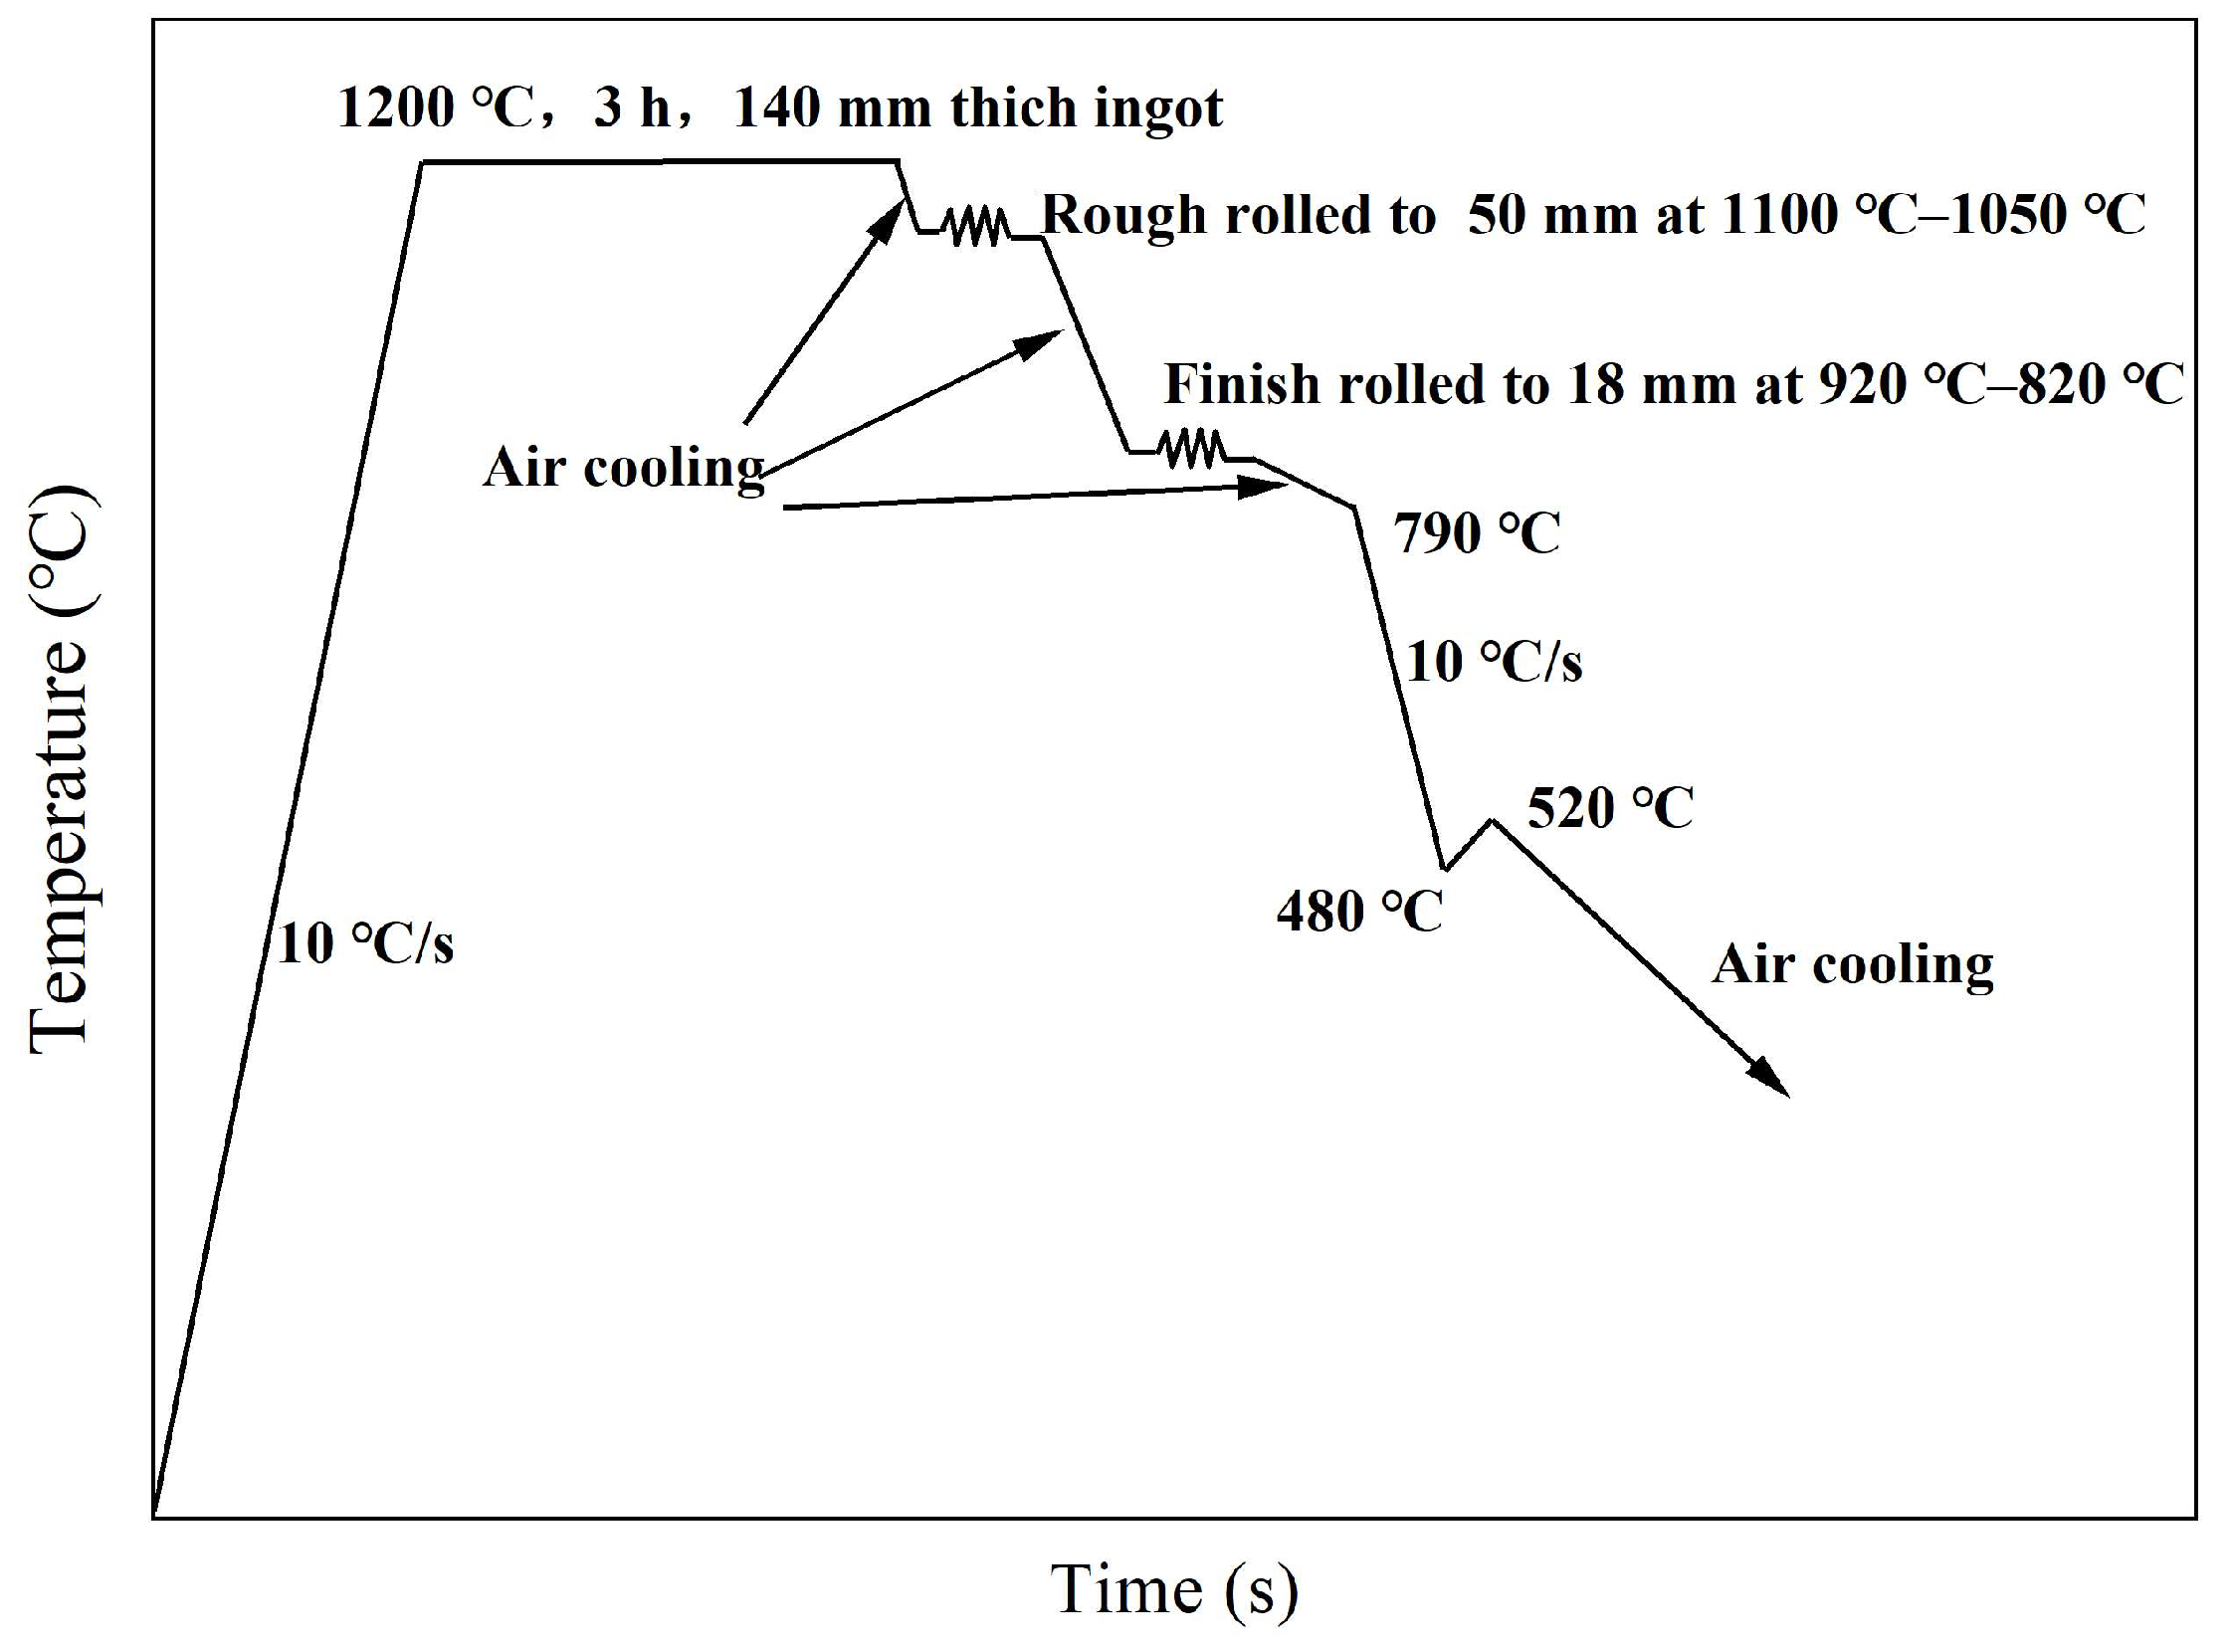
Figure 1. The TMCP process used during the preparation of the test steel.
Metals 15 00926 g001
Figure 2. (a) Schematic of specimen extraction from steel plate; (b) location for observing microscopic structures; (c) location for impact specimens; (d) location for tensile specimens (unit: mm).
Metals 15 00926 g002
Figure 3. OM micrographs of base metal microstructures (ad), M/A constituents (a1d1), and statistical analysis of M/A constituent size and aspect ratio (a2d2) for test steels with different Mo contents: (a,a1,a2) 0 Mo; (b,b1,b2) 15 Mo; (c,c1,c2) 30 Mo; (d,d1,d2) 60 Mo.
Metals 15 00926 g003
Figure 4. Transmission electron microscope bright-field images showing fine structure of base metal microstructures for test steels with different Mo contents: (a,a1) 0 Mo; (b,b1) 15 Mo; (c,c1) 30 Mo; (d,d1) 60 Mo; (e) the bright and dark field phases of the black island-like structure in the 15 Mo test steel; (f) the selected electron diffraction patterns.
Metals 15 00926 g004
Figure 5. XRD patterns (a) and variation in dislocation density (b) with Mo content for test steels with different Mo contents.
Metals 15 00926 g005
Figure 6. Transmission electron microscope images of precipitates (ad) and energy spectrum analysis of typical precipitates (eh) in test steels with different Mo contents: (a,e) 0 Mo; (b,f) 15 Mo; (c,g) 30 Mo; (d,h) 60 Mo.
Metals 15 00926 g006
Figure 7. Electron backscatter diffraction grayscale maps (ad), inverse pole figure maps (a1d1), and fraction of boundaries defined by different misorientation tolerance angles (a2d2) for test steels with different Mo contents: (a,a1,a2) 0 Mo; (b,b1,b2) 15 Mo; (c,c1,c2) 30 Mo; (d,d1,d2) 60 Mo.
Metals 15 00926 g007
Figure 8. Typical tensile stress–strain curves (a) and instrumented Charpy impact load-deflection curves (b) for test steels with different Mo contents.
Metals 15 00926 g008
Figure 9. Linear fitting relationship between yield strength and average grain size defined by different misorientation tolerance angles for test steels with different Mo contents. the MED−1/2 that defined by MTA of 2° (a); the MED−1/2 that defined by MTA of 4° (b); the MED−1/2 that defined by MTA of 6° (c), the MED−1/2 that defined by MTA of 8° (d), the MED−1/2 that defined by MTA of 10° (e), and the MED−1/2 that defined by MTA of 12° (f).
Metals 15 00926 g009
Figure 10. Macroscopic morphology of tensile fracture surfaces and microscopic morphology of the fibrous zone for test steels with different Mo contents: (a) 0 Mo; (b) 15 Mo; (c) 30 Mo; (d) 60 Mo.
Metals 15 00926 g010
Figure 11. Macroscopic morphology (ac) and scanning electron microscope micrographs of fibrous zone (a1c1) and radiation zone (a2c2) of impact fracture surfaces for test steels: (a,a1,a2) 0 Mo; (b,b1,b2) 15 Mo; (c,c1,c2) 60 Mo.
Metals 15 00926 g011
Figure 12. Electron backscatter diffraction grayscale maps (a,b), kernel average misorientation maps showing local strain distribution (a1,b1), and crack initiation behavior beneath the fibrous zone (a2,b2) for test steels: (a,a1,a2) 0 Mo; (b,b1,b2) 60 Mo.
Metals 15 00926 g012
Figure 13. Scanning electron microscope (a,b) and electron backscatter diffraction (a1,b1) characterization of secondary crack propagation behavior beneath the radiation zone of impact fracture surfaces: (a,a1) 0 Mo; (b,b1).60 Mo.
Metals 15 00926 g013
Table 1. Test steel chemical composition (wt%).
DesignationCSiMnPSNi + CuMoNb + V + TiMoAls
0 Mo0.0900.301.400.0090.0020.550.150.07000.02
15 Mo0.0880.291.420.0080.0030.550.140.0710.150.02
30 Mo0.0890.301.410.0070.0020.540.150.0700.300.02
60 Mo0.0880.291.420.0080.0020.550.140.0690.600.02
Table 2. MED of grains with boundaries at MTAs from 2° to 15°.
DesignationMEDMTA≥2°
/μm
MEDMTA≥4°
/μm
MEDMTA≥6°
/μm
MEDMTA≥8°
/μm
MEDMTA≥10°
/μm
MEDMTA≥12°
/μm
MEDMTA≥15°
/μm
0 Mo2.733.023.433.764.034.354.89
15 Mo2.502.783.203.623.813.984.43
30 Mo2.382.612.893.213.433.664.56
60 Mo2.262.442.632.712.892.924.68
Table 3. Quantitative statistical results of base metal mechanical properties.
Mechanical
Properties
Tensile PropertyInstrumented Impact TestAverage Energy Absorbed
AkV/J
YS
ReL/MPa
TS
Rm/MPa
YRElongation
A/%
EiEpEt
0 Mo548 ± 6635 ± 80.8629.1 ± 0.562105167165 ± 5
15 Mo578 ± 5710 ± 90.8125.3 ± 0.478143221223 ± 6
30 Mo602 ± 5731 ± 70.8223.2 ± 0.587114201204 ± 5
60 Mo628 ± 4759 ± 80.8321.9 ± 0.59591186185 ± 4
Disclaimer/Publisher’s Note: The statements, opinions and data contained in all publications are solely those of the individual author(s) and contributor(s) and not of MDPI and/or the editor(s). MDPI and/or the editor(s) disclaim responsibility for any injury to people or property resulting from any ideas, methods, instructions or products referred to in the content.