Article

Study on the Process Characteristics of Picosecond Laser Trepan Cutting Hole Manufacturing for Heat-Resistant Steel

1
Faculty of Mechanical and Materials Engineering, Huaiyin Institute of Technology, Huaian 223003, China
2
School of Mechanical Engineering, Jiangsu University, Zhenjiang 212013, China
*
Author to whom correspondence should be addressed.
Metals 2025, 15(8), 917; https://doi.org/10.3390/met15080917
Submission received: 24 June 2025 / Revised: 12 August 2025 / Accepted: 18 August 2025 / Published: 19 August 2025
(This article belongs to the Special Issue High-Energy Beam Machining of Metals)

Abstract

Picosecond laser drilling offers high precision and quality, and compared to femtosecond lasers, it also balances processing efficiency, making it widely used across various fields. However, existing drilling processes still face issues such as roundness and taper. Therefore, further research into the processing characteristics of picosecond laser technology is needed to improve processing quality. This paper uses ANSYS software to conduct numerical simulations of picosecond laser ring-cutting drilling, analyzing the temperature field of microholes under ring-cutting scanning paths as parameters change. Experimental studies were conducted using AISI 310S heat-resistant stainless steel as the base material. This material exhibits excellent high-temperature oxidation resistance and strength retention, making it suitable for laser thermal processing. Using a single-factor method, the study investigated the influence of equidistant concentric circular paths and inner-dense-outer-sparse concentric circular paths on microhole morphology characteristics. The results show that the laser energy distribution is different under different paths. The entrance aperture of the equidistant concentric circle path is larger than that of the inner dense and outer sparse concentric circle path, while the exit aperture is smaller than the latter. Moreover, the roundness is also better than that of the inner dense and outer sparse concentric circle path. The taper of the inner dense and outer sparse concentric circle path is better than that of the equidistant concentric circle path. This study can provide a reference for the optimization of different processing paths in the future.

1. Introduction

In modern industry, AISI 310S heat-resistant steel has excellent high-temperature resistance and can be used stably for long periods at high temperatures of 1150 °C. It can even withstand temperatures of 1200 °C for short periods. In addition, it has excellent mechanical properties and can maintain high strength and toughness even under high-temperature conditions. It also has good workability and weldability [1]. Traditional drilling methods, such as mechanical drilling and electrical discharge machining [1,2], face challenges like low processing efficiency, poor hole diameter accuracy, and unsatisfactory hole wall quality when applied to difficult-to-machine materials like heat-resistant steels. Laser technology, with its high energy density, precise positioning, and high efficiency, has been widely applied in important fields such as film hole processing and agricultural engineering [3,4,5]. Picosecond lasers, with their extremely short interaction time with materials, prevent heat from transferring quickly, which results in better quality microholes compared to long-pulse lasers [6], and are widely used in various fields. However, even with ultrafast laser technology, defects such as recast layers and tapering cannot be avoided when processing small-diameter microholes. This is due to the limitations imposed by the hole size and the laser beam [7]. Therefore, methods are needed to improve microhole machining quality. Researchers have investigated this issue. For example, Jing Jiang et al. studied the application of picosecond lasers in the microhole machining of metal materials, analyzing the characteristics of picosecond laser machining, including hole wall quality, circularity, taper, and offering optimization suggestions [8]. Xiaomao Sun et al. conducted experimental research on picosecond laser drilling of thermal barrier-coated In718 nickel-based superalloy, focusing on the impact of thermal effects and plasma shielding effects on machining quality, and proposed methods for reducing thermal damage and optimizing hole quality [9]. Tinglian Zhang et al. studied the effect of the re-solidified layer in laser drilled holes on the fatigue performance of nickel-based superalloys, proposing methods to optimize laser parameters to reduce the re-solidified layer and analyzing the long-term impact of these layers on material properties [10]. In addition to the above studies, common methods include energy field assistance for lasers, such as air assistance, magnetic field assistance [11,12], underwater drilling [13], water jet guidance, and direct current assistance [14,15]. These are effective methods to reduce recast layers and plasma shielding effects. Beyond energy field assistance, optimizing the scanning path has become a key focus in improving microhole quality. These include concentric circular scanning, linear, spiral, and multilayer scanning paths [16,17]. Xiaodong Liu et al. studied the trepan drilling process and mechanism of picosecond lasers, proposing that optimizing scanning paths in microhole machining can improve hole circularity and accuracy [18]. Although path optimization significantly improves microhole quality, it still cannot completely eliminate a certain degree of taper and roundness. Therefore, further research into the process characteristics of various scanning paths is needed to enhance microhole processing quality. This study selected equidistant concentric circles and inner-dense outer-sparse concentric circles as scanning paths for experimental research, analyzing the impact of changes in laser parameters on the entrance and exit diameters, roundness, and taper of microholes under different scanning paths. Additionally, the study investigated the influence of the density of scanning paths on microhole processing. First, numerical simulations of picosecond laser ring-cutting drilling were conducted using ANSYS Mechanical APDL 10.0. The temperature field changes during ring-cutting processing were analyzed. Subsequently, in the experimental section, equidistant concentric circles and inner-dense outer-sparse concentric circles were selected to further analyze the impact of changes in scanning paths on microhole processing parameters. Finally, the process characteristics of the two scanning paths during microhole processing were analyzed and studied to better understand the impact of changes in scanning paths on microholes during picosecond laser microhole processing. This provides a reference for subsequent research on gas film cooling holes in AISI 310S processing.

2. Materials and Experimental Setup

The laser used in this experiment has a wavelength of 532 nm, a pulse width of <15 ps, a frequency of 1 Hz–2000 Hz, a spot mode of TEM (M2 < 1.3), and a beam diameter of 1.5 ± 0.2 mm.
The material used in this study was AISI 310S (Suzhou Xinlucheng Metal Materials Co., Ltd., Suzhou, China), an austenitic heat-resistant stainless steel, with typical mechanical properties at room temperature including a tensile strength of ≥515 MPa, a yield strength of ≥205 MPa, an elongation after fracture of ≥40%, an elastic modulus of approximately 200 GPa, and a hardness not exceeding approximately 217 HB. This low-carbon grade exhibits low intergranular sensitization tendency after welding and thermal cycling, and maintains excellent high-temperature strength and oxidation resistance in oxidizing atmospheres. Its low thermal conductivity facilitates the localized concentration of laser energy at the hole opening, enabling a narrow heat-affected zone and precise hole diameter. The low-carbon chemical composition and the stable austenitic structure of AISI 310S help reduce the risk of sensitization and corrosion in the heat-affected zone. When used with inert or neutral auxiliary gases, it further reduces oxidation of the hole walls and improves surface integrity. Additionally, its excellent high-temperature strength helps maintain the stability of the hole edges under long or multiple pulse impacts. Therefore, Φ30 × 0.6 mm AISI 310S circular discs were selected as the experimental material. The specific chemical element composition [19] of AISI 310S is shown in Table 1.
The primary methods of energy transfer in laser drilling are thermal conduction, convection, and radiation. Among these three methods, thermal conduction is the primary means of heat transfer, while heat radiation and convection-induced heat dissipation are negligible. Therefore, the thermodynamic equations for laser drilling will be established based on thermal conduction [19].
T t = k ρ c p 2 T x 2 + 2 T y 2 + q v k
During the laser drilling process, the thermophysical properties of AISI 310S—particularly thermal conductivity, specific heat capacity, and latent heat of phase transition—significantly influence the temperature field. During phase transition, temperatures can rise from ambient temperature to several thousand degrees Celsius, and these properties change continuously with temperature. Due to the nonlinear nature of temperature field simulation, temperature-dependent thermophysical data are critical. To establish a simplified mathematical model describing the laser drilling process, the following assumptions are made: (1) The processed material is isotropic and homogeneous. (2) The laser emits a fundamental transverse mode, with energy distribution following a Gaussian distribution. (3) The material’s thermal-physical parameters do not vary with temperature. (4) The plasma’s effect on the laser is neglected, and the vapor generated during the drilling process is transparent to the laser. In this study, the melting point of AISI 310S is 1450 °C, the boiling point is 2730 °C, and the density is 7.90 × 10³ kg/m3. The thermal–physical parameters of AISI 310S are shown in Table 2.
In this experiment, two processing paths, equidistant concentric circles and inner-dense outer-loose concentric circles, were selected for the laser drilling of the material, as shown in Figure 1. The equidistant concentric circle uses concentric circles with the same spacing for scanning processing, while the inner-dense outer-loose concentric circle employs a scanning path where the internal regions are more densely spaced and the external regions are sparser. This study mainly investigates the characteristics of the two processing paths through laser processing parameters such as laser power, scanning times, and scanning speed. The experiment uses the single-factor method, designing a three-factor, four-level single-factor experiment. As shown in Table 3, the same set of data is used to conduct experimental research on both scanning paths, facilitating subsequent comparative studies.
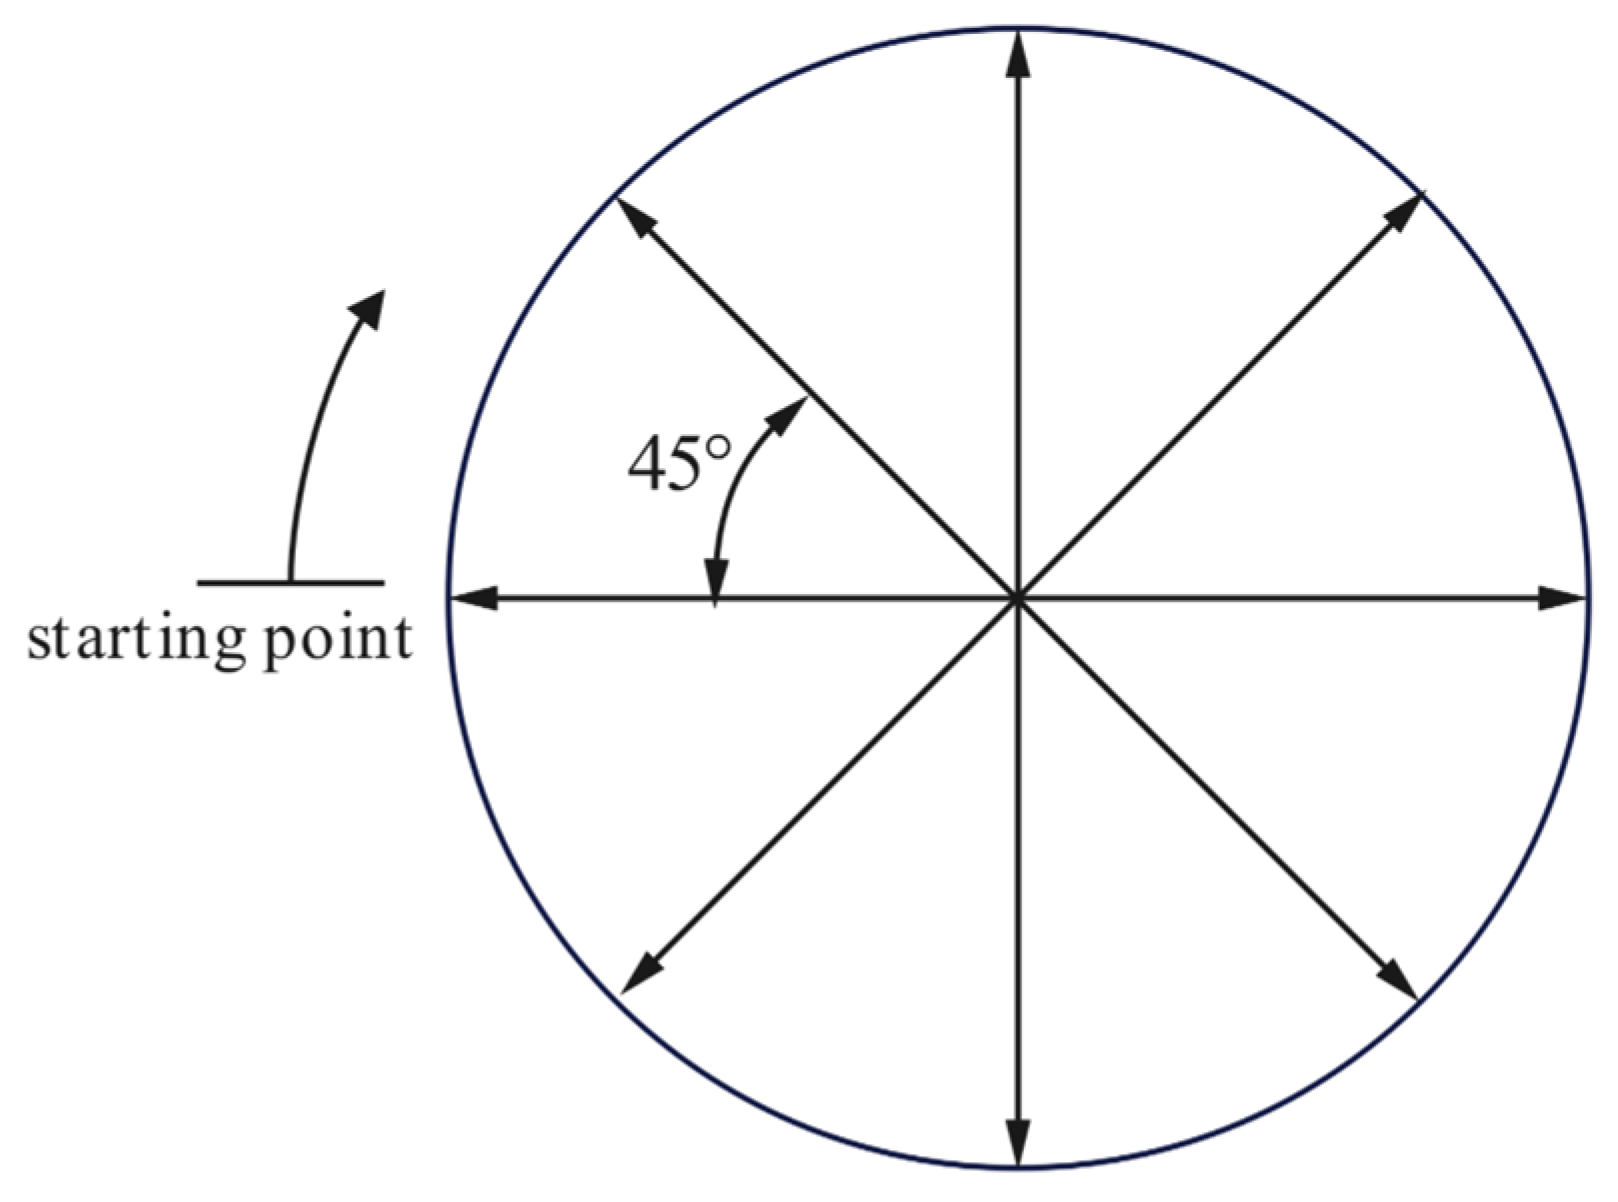
The hole diameter is measured by selecting the average diameter at four 45° intervals and taking the average value as the microhole diameter, as shown in Figure 2. The taper of the microhole is calculated using the measured inlet and outlet diameters, as follows [20]:
t a p e r ( θ ) = t a n 1 d e n t r y d e x i t 2 h
In the formula, θ represents the hole taper; d e n t r y is the inlet diameter; and d e x i t is the outlet diameter.
Circularity is measured by the marking difference in four directions, and the calculation formula is as follows [20]:
σ i = ( d i d 1 ) 2 + ( d i d 2 ) 2 + ( d i d 3 ) 2 + ( d i d 4 ) 2 / 2
σ o = ( d o d 5 ) 2 + ( d o d 6 ) 2 + ( d o d 7 ) 2 + ( d o d 8 ) 2 / 2
where σ i is the inlet circularity, σ o is the outlet circularity, d i is the inlet diameter, and d o is the outlet diameter. d 1 , d 2 , d 3 , and d 4 represent the measured diameters in four directions at the inlet, while d 5 , d 6 , d 7 , and d 8 represent the measured diameters in four directions at the outlet. The larger the difference between σ i and σ o , the worse the microhole circularity; conversely, the smaller the difference between σ i and σ o , the better the microhole circularity.

3. Numerical Simulation

3.1. Model Construction

Simulating laser drilling involves highly complex issues. Therefore, the model was simplified by considering only the temperature field along the optical axis and at the interaction interface. The problem was thus simplified to a two-dimensional model, As shown in Figure 3, significantly reducing computation time. The resulting two-dimensional finite element model has a length of 2 mm and a width of 0.5 mm. During the mesh generation process, a trade-off was made between computational accuracy and computational cost, ultimately opting for a square mesh. More than five nodes were placed within the laser spot diameter to ensure accuracy. A PLANE55 quadrilateral element with a size of 2 μm was used, totaling 10,251 nodes.

3.2. Laser Perforation Temperature Field Heat Source Model

(1)
Since the laser source used in the experimental part of this paper is characterized by a Gaussian distribution, a Gaussian heat source is used in the simulation, and the expression for the beam heat flux density is shown in Equation (4) [21]:
q = 2 A P π ω 0 2 exp ( 2 r 2 ω 0 2 ) = 2 A p u l s o n e d u r a π ω 0 2 exp ( 2 r 2 ω 0 2 )
where q is the heat flow density in the cross-section of the laser beam; A is the absorption rate of laser light by the material; P is the laser power; ω 0 is the spot radius; r is the distance from a point on the surface of the material to the centre of the spot in the horizontal direction; puls-one is the single pulse energy of the laser; and dura is the pulse width. The simulation uses the life and death cell method to kill the lattice whose temperature reaches a set threshold.
(2)
Initial condition: The initial temperature of the workpiece is the room temperature (25 °C), and it is spatially uniform throughout the workpiece. Boundary conditions: Laser drilling is extremely fast and acts on a very small spot, so the heat-affected zone is limited; therefore, the material can be regarded as an infinite medium. The side and bottom surfaces of the specimen are subjected to no thermal load (no heat flux) and are modeled as adiabatic boundaries in the ANSYS simulation. Hence [21],
T ( x , y , t ) x y = b   y = b = 0
T ( x , y , t ) y y = 0 = 0
where b is the half-size of the specimen in the y-direction. Since the laser heat source is modeled as a prescribed surface heat-flux boundary, the top surface is described by a second-type boundary condition [21]:
k T n = q x , y , t
where T n denotes the derivative of temperature taken along the outward surface normal, and q x , y , t is the heat-flux density function. When q x , y , t = 0 no heat-flux load acts on the boundary—the boundary is called adiabatic.
(3)
During the laser drilling process, phase change processes such as vaporization, melting, and solidification occur [22]. The latent heat of phase change has a significant impact on the temperature field analysis. Therefore, it is essential to consider the latent heat of phase change in the simulation process. In the ANSYS software, the latent heat of phase change is incorporated by using the thermal enthalpy material properties (ENTH).

3.3. Simulation Results

3.3.1. The Effect of Laser Power on Microhole Morphology

To study the effect of laser power on laser perforation, the impact of changing the proportion of laser power (with a total power of 30 W) on microhole machining was analyzed under the conditions of 25 scanning passes and a scanning speed of 20 mm/s.
From Figure 4, it can be seen that as the laser power increases, the range of the temperature field expands. The temperature is high at the entrance, but decreases at the exit. This may be because, when the laser enters the material, most of the energy is absorbed by the material at the entrance [23]. As the laser penetrates deeper into the material, the energy gradually attenuates.
From the microhole profile in Figure 5, it can be observed that as the laser frequency increases, both the exit and entrance diameters of the hole increase. The corresponding values for the entrance and exit diameters and the taper are shown in Table 4.
As shown in Table 4, both the entrance and exit diameters increase with the laser power [24]. The taper variation initially decreases, then increases, and decreases again, following an oscillatory pattern. This may result from the increased laser power, which causes more energy to be absorbed by the material, intensifying the heat conduction process. The heat conduction within the material expands the temperature rise near the entrance, causing more material to reach melting and vaporization temperatures, thereby increasing the entrance diameter [24]. With increasing laser power, the intensity of interaction between the laser and material strengthens, expanding the energy distribution at the exit and increasing the material removal area, thus enlarging the exit diameter. As the laser power increases, the energy distribution becomes more complex, with energy sometimes concentrating at the upper part of the hole, increasing the upper diameter and taper. In other cases, the laser energy may focus more on the hole’s bottom, increasing the bottom diameter and decreasing the taper, contributing to the oscillatory taper variation.

3.3.2. The Effect of Scanning Passes on Microhole Morphology

The study investigates the effect of scan count on laser drilling, analyzing its impact on microhole processing by varying the scan count under the conditions of a laser power of 80% and a scan speed of 20 mm/s.
From Figure 6, it can be observed that as the scan count increases from 20 to 50, the temperature at the inlet is initially higher, while the temperature near the outlet is lower. However, the temperature near the outlet gradually increases, and for 40 and 50 scans, the temperature field contour maps show little to no change. This suggests that after the scan count reaches a certain level, the laser energy absorbed by the material and the heat dissipated to the surrounding environment gradually reach a balanced state [25].
From Figure 7, it can be seen that as the scan count increases, both the inlet and outlet diameters gradually increase, with a more significant increase observed at the outlet. The corresponding values for the inlet and outlet diameters and taper are shown in Table 5.
Table 5 shows that both the inlet and outlet diameters increase as the scan count increases. The outlet diameter increases more significantly, leading to a decrease in taper. This is likely due to the heat generated during the laser scanning process, which raises the local temperature of the material. As the scan count increases, the heat-affected zone expands, heating more material above the melting point and facilitating its removal at both the inlet and outlet, thus enlarging the diameters. With increasing scan count, internal heat accumulation leads to a more uniform temperature distribution along the hole depth, making the melting and vaporization processes more consistent at different depths. This reduces the variation in material removal between the entrance and bottom of the hole caused by temperature differences, thus decreasing the taper [24].

3.3.3. Effect of Scanning Speed on Microhole Morphology

To study the effect of scanning speed on laser drilling, the impact on microhole processing is analyzed by varying the proportion of laser power (with a total power of 30 W), under the conditions of a laser power of 80% and 20 scan counts.
Based on Figure 8, as the scan speed decreases, the temperature field expands, and the temperature in the center of the hole becomes higher. However, the overall temperature in the heat zone initially decreases and then increases. This may be because the reduced scan speed allows more time for the heat to spread to the surrounding areas, resulting in a more uniform temperature distribution. In the laser scanning direction, the temperature difference between the front and rear points becomes smaller [26].
It can be observed from Figure 9 that the change in the entrance diameter is small, while the exit diameter increases noticeably. The corresponding entrance and exit diameters and taper simulation values are shown in Table 6.
As shown in Table 6, as the scanning speed decreases, both the entrance and exit apertures increase, and the overall taper decreases significantly. In picosecond laser processing, the single interaction time is determined by the pulse width; the scanning speed mainly increases the cumulative flux by changing the number of pulses per unit area. Higher overlap triggers threshold reduction, enabling the effective removal of deeper areas. After the channel is formed, multiple reflections from the wall and plasma facilitate the transmission of energy and pressure to the bottom of the hole; simultaneously, plasma pressure aids in the removal of molten material and vapor from the bottom, thereby accelerating the expansion of the exit and reducing taper. At high repetition rates, thermal accumulation occurs between pulses, reducing the enthalpy required for phase transition and improving melt flowability, further enhancing removal uniformity along the depth direction. Conversely, the denser plasma plume near the inlet and short-term re-deposition can shield subsequent pulses, inhibiting the further enlargement of the inlet. This results in greater outlet expansion and a significant reduction in taper when the scanning speed is reduced.

4. Experimental Research

4.1. Analysis of Experimental Results Under the Path of Equidistant Concentric Circles

4.1.1. The Effect of Laser Power on Microhole Geometry

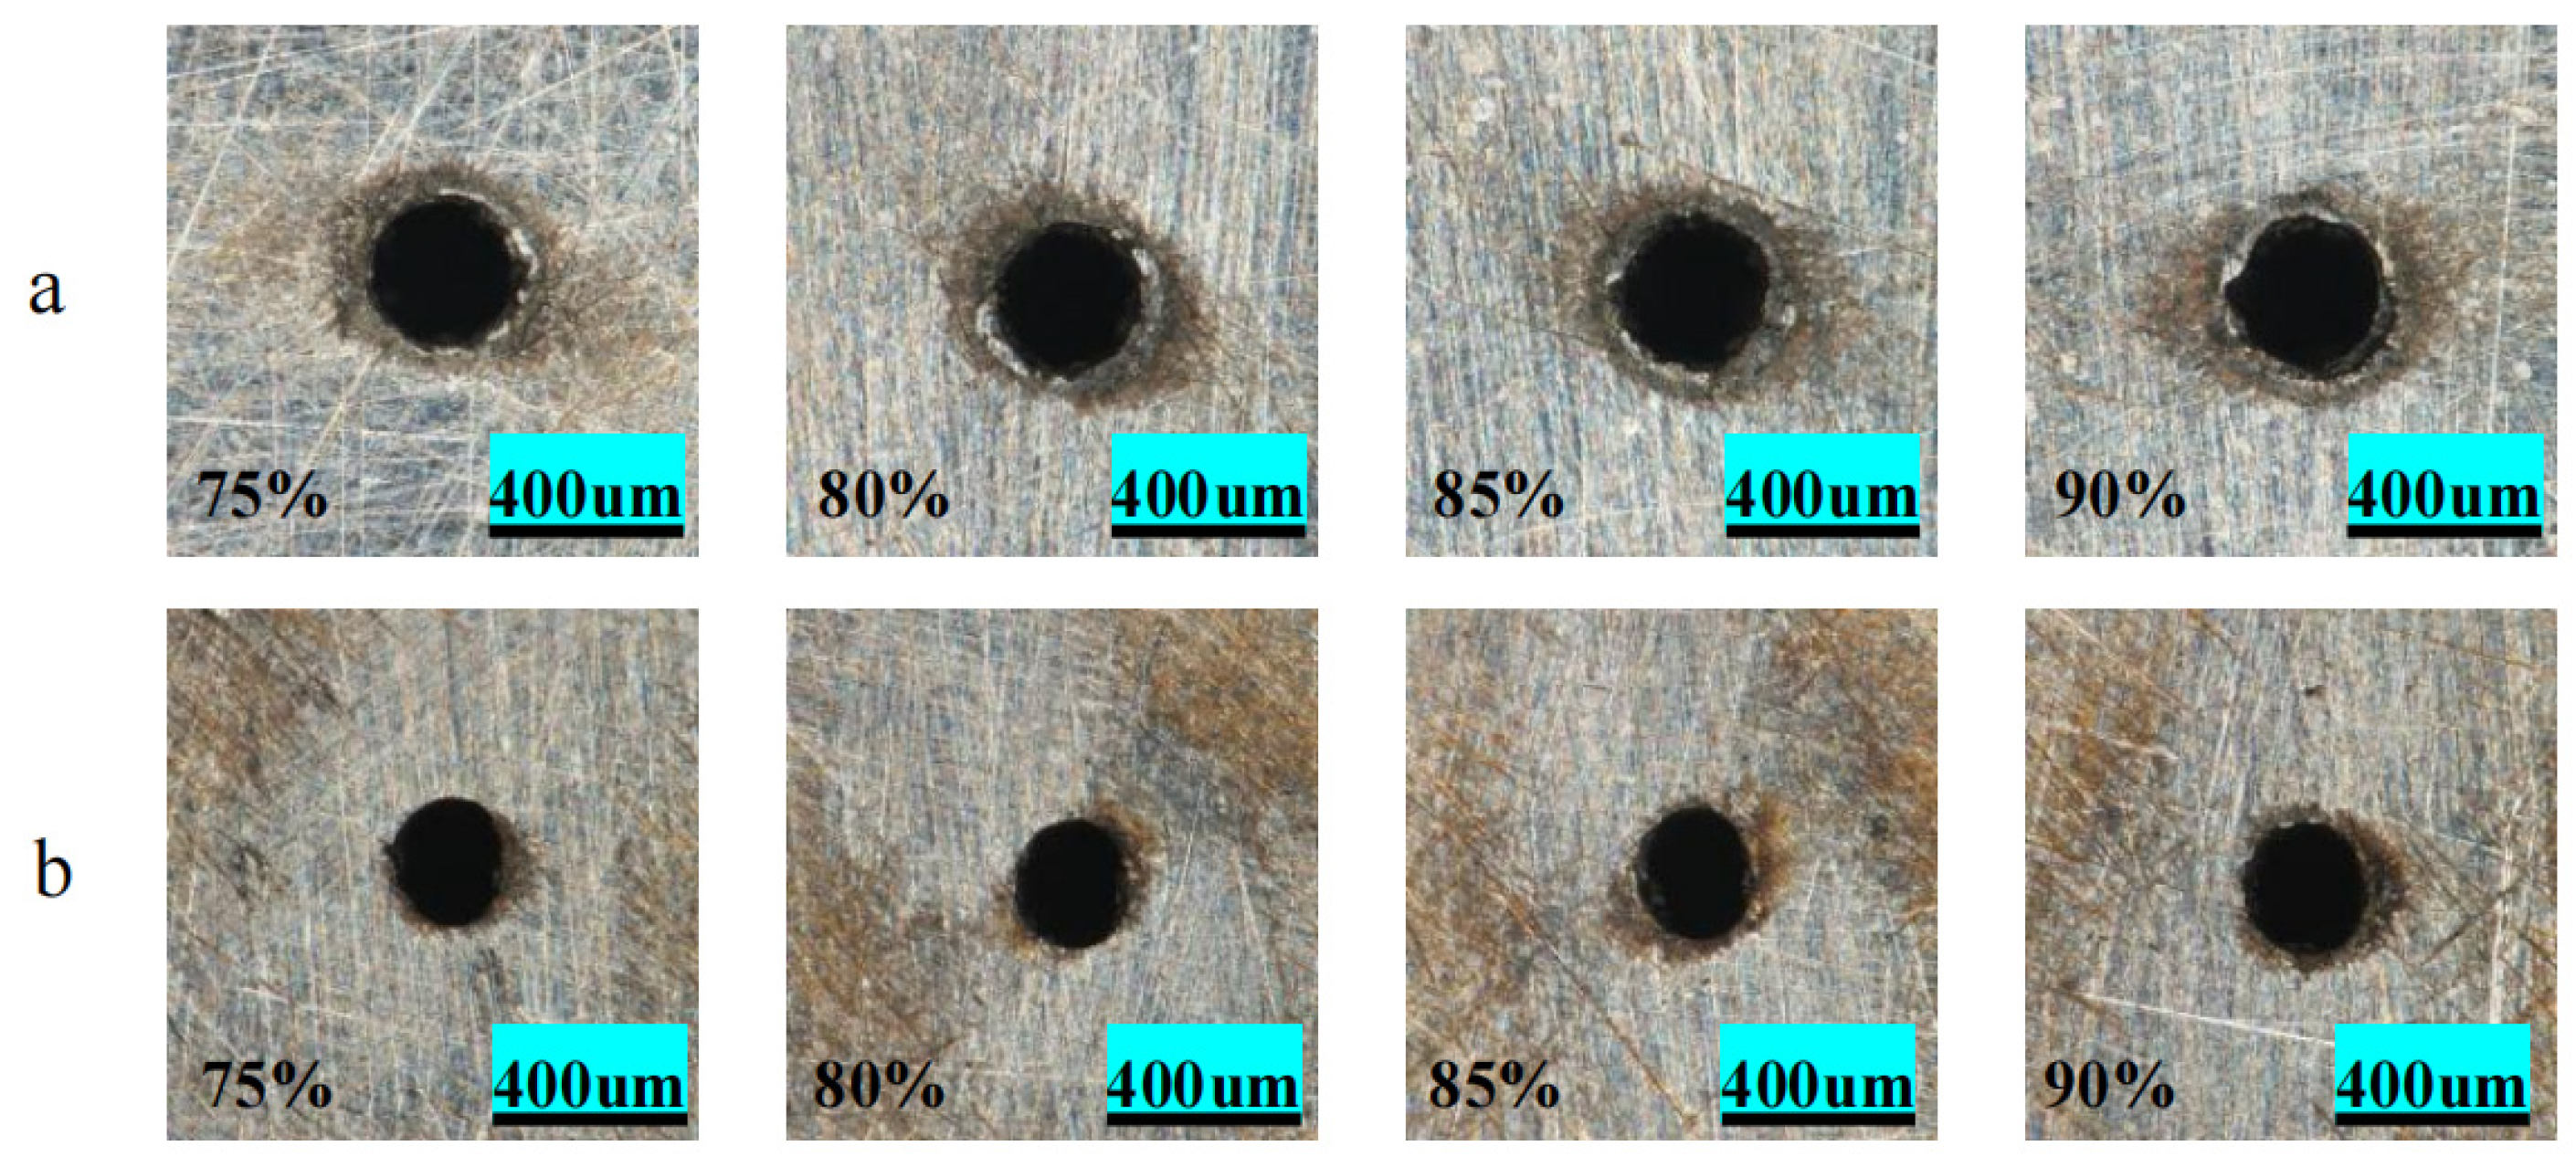
The experiment in this group was conducted with constant laser scan count and scan speed. The experimental parameters were set as follows: the scan count was 25, the scan speed was 20 mm/s, and the laser power varied at 75%, 80%, 85%, and 90%. Figure 10 shows the microhole morphology under different laser powers. As the pulse energy increased, the ablation at the hole entrance became more severe, and the amount of spatter around the hole exit also increased.
As shown in Figure 11a,b, with the increase in laser power, both the inlet and outlet diameters gradually increase. The inlet circularity first increases and then decreases, while the outlet circularity continues to improve. As the pulse energy increases, more laser energy is absorbed by the material, leading to more efficient material removal [27]. Additionally, with the use of concentric circle scanning paths, the material’s energy absorption becomes more uniform, and both the inlet and outlet diameters increase. At low power levels, the picosecond laser pulse acts on the material with relatively concentrated energy, which is distributed more evenly across the drilling area, resulting in better inlet circularity [28]. As the power increases, heat accumulates inside the hole, causing the molten material to increase, and excessive material removal results in a deterioration in the inlet circularity. On the other hand, at low power, there is insufficient energy to remove material, leading to poor circularity at the outlet. As the laser energy increases, more energy breaks through the plasma shielding [29], allowing the microhole bottom to absorb more energy, thereby improving the outlet circularity.
From Figure 11c, it can be seen that the taper initially increases, then decreases, and eventually increases again. This phenomenon is likely due to the fact that at low power, the laser energy can only remove material from a limited area on the surface, with more material being removed at the center of the spot compared to the edges, forming a larger taper. As the power increases, the laser energy becomes more evenly distributed on the surface of the material, allowing sufficient energy to be applied to the edges of the spot, thus increasing the entrance diameter [30]. Meanwhile, as the laser energy increases, it can penetrate deeper into the material, increasing the hole depth and enlarging the bottom diameter, which causes the taper to gradually decrease. However, excessive power leads to the excessive removal of the entrance material, causing the taper to increase again [31].

4.1.2. The Effect of Scan Count on Microhole Morphology

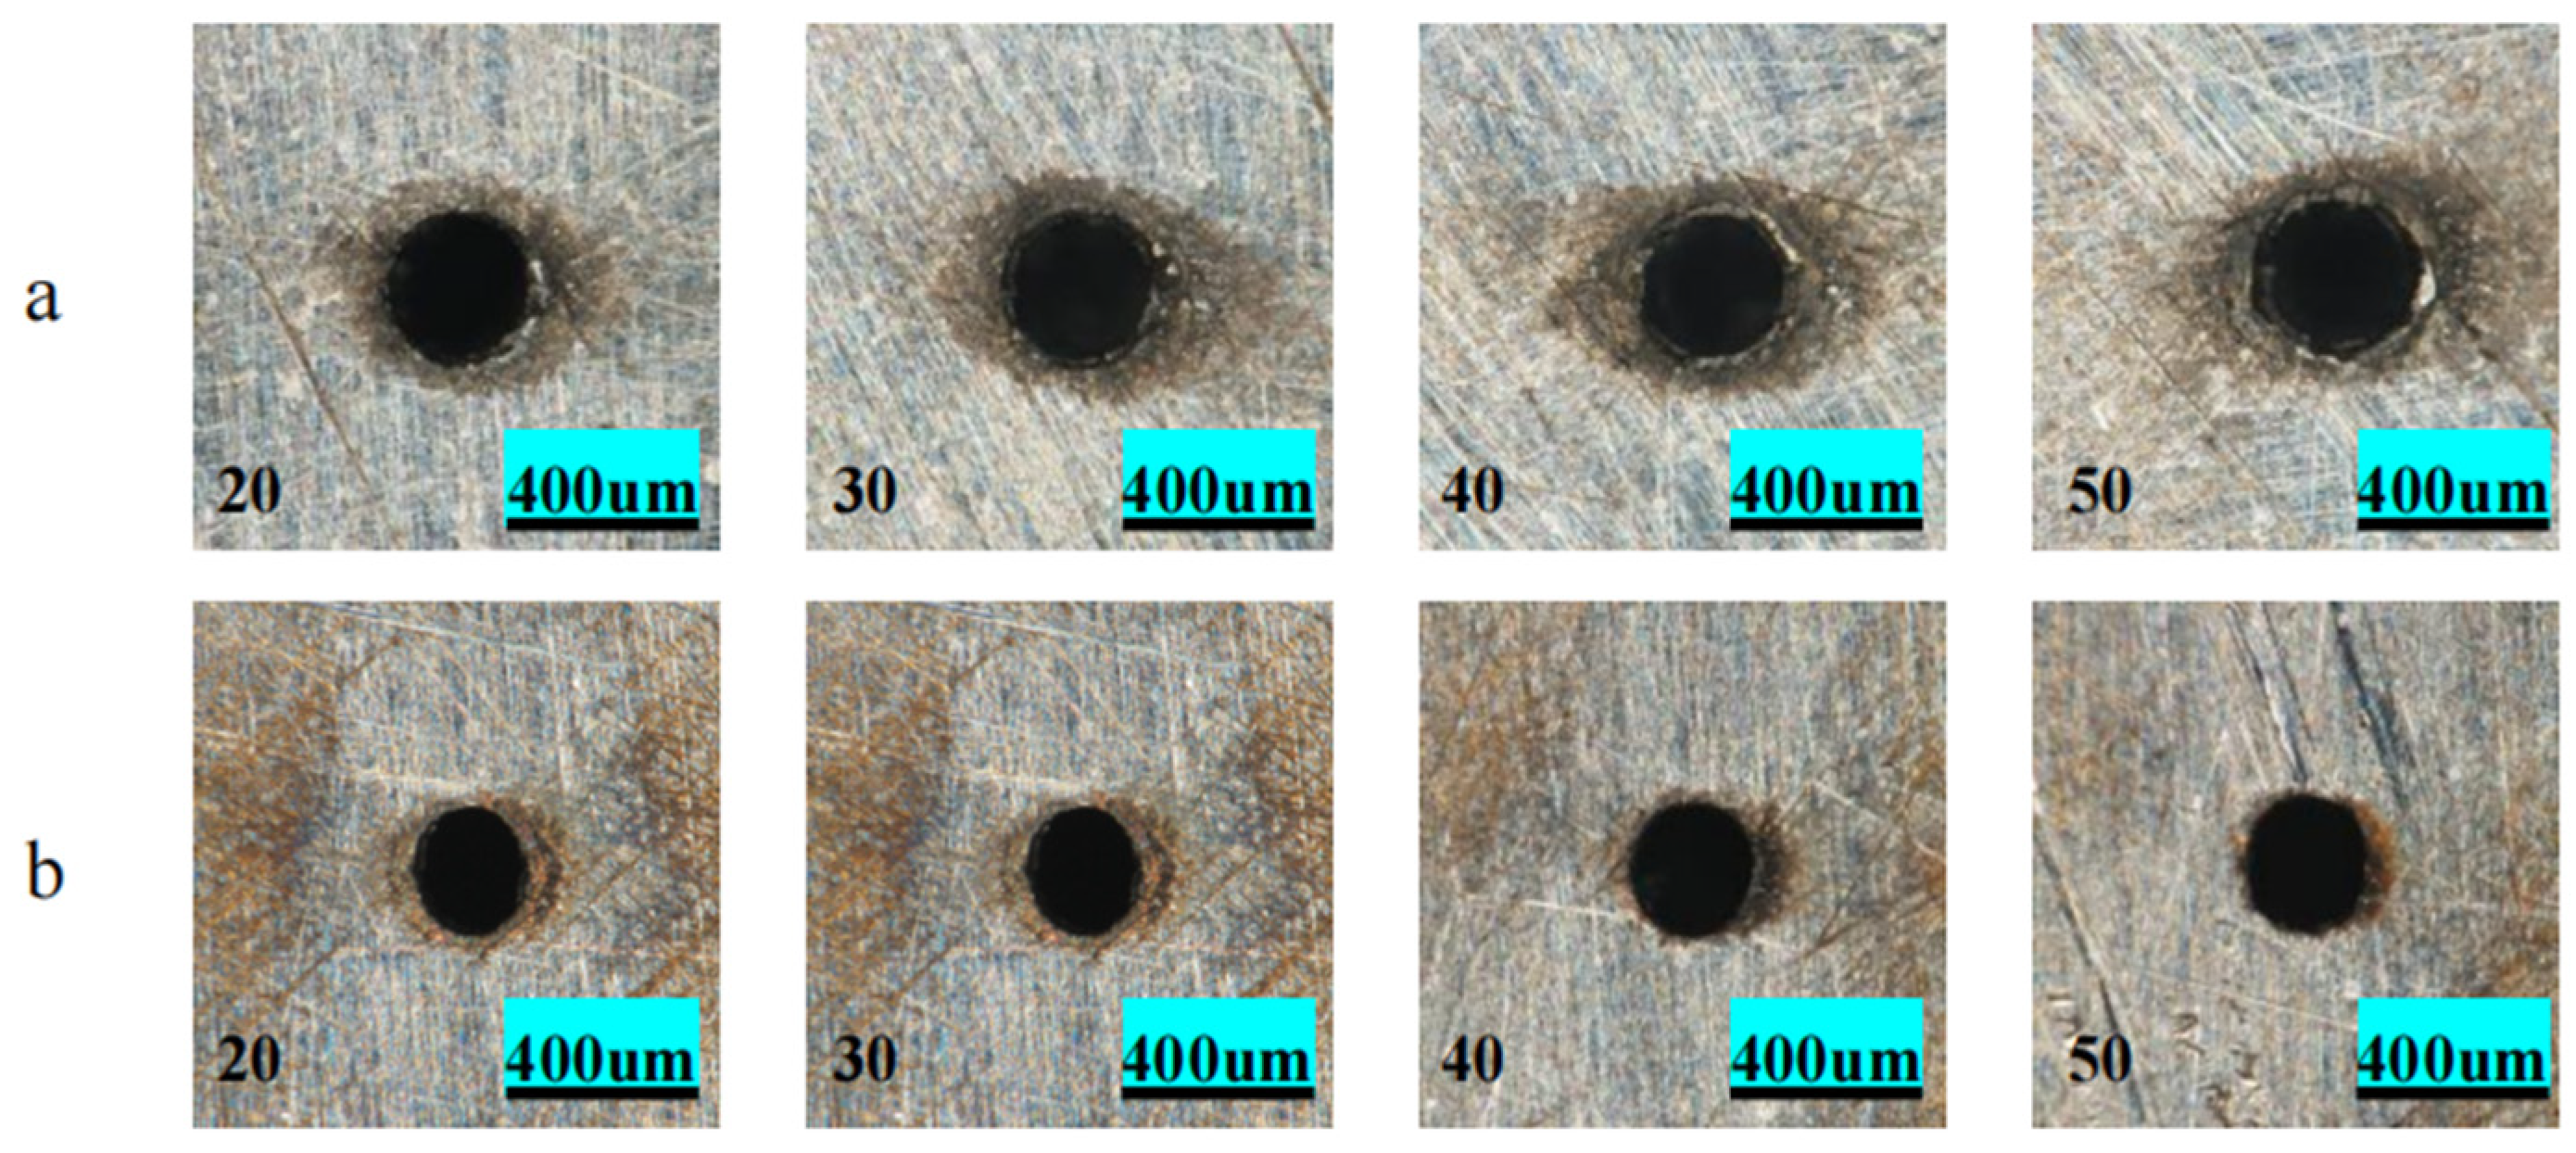
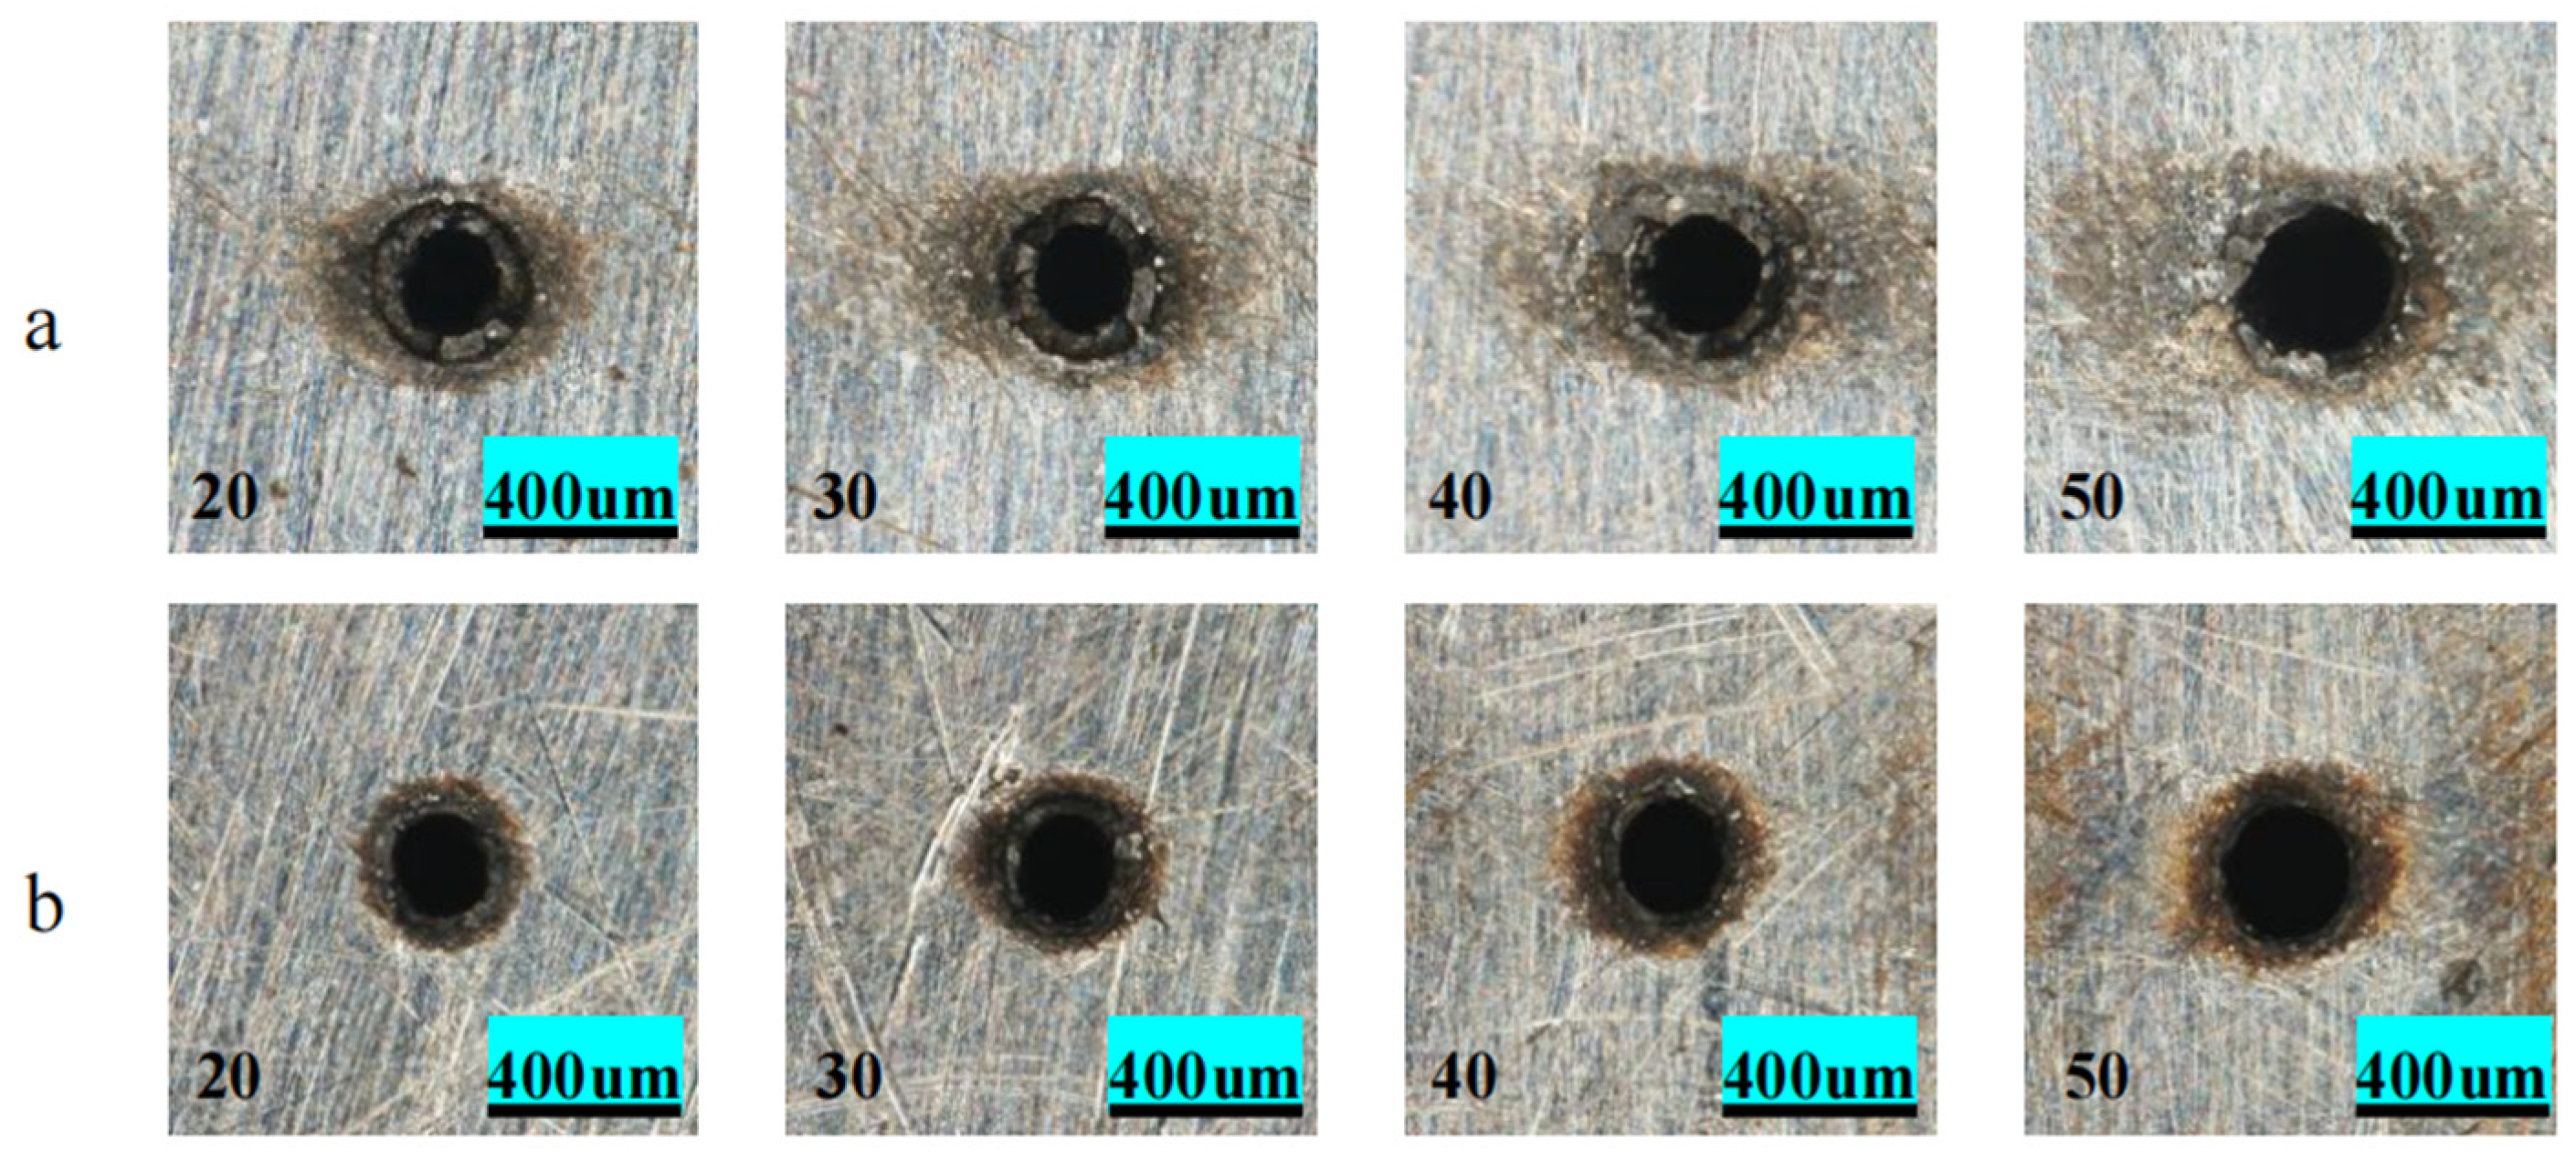
In this group of experiments, the laser power and scan speed parameters were fixed, and the scan count was set as a variable. The specific experimental parameters were set as follows: scan speed 20 mm/s, laser power 80%, and scan counts of 20, 30, 40, and 50. Figure 12 shows the microhole morphology obtained by changing the scan count.
As shown in Figure 13a,b, with the increase in the number of scans, both the inlet and outlet diameters show an upward trend. The inlet and outlet circularities both initially improve and then deteriorate. During processing with the equidistant concentric circle scanning path, the laser energy is more evenly distributed across the material. As the number of scans increases, more energy is absorbed by the material, leading to more thorough material removal. With more scans, more energy is applied to the outlet of the microhole, causing the inlet and outlet diameters to increase continuously. As the number of scans increases, the laser has more impact on the material at the inlet. Additionally, the equidistant concentric circle path distributes the laser energy more uniformly across the material. Multiple scans gradually remove irregularities from the material surface, resulting in more balanced energy distribution and more consistent material removal, which continuously improves circularity. However, when the number of scans becomes too high, the material at the inlet is repeatedly heated, causing excessive heat accumulation. This leads to the excessive melting and vaporization of the material, resulting in irregular deformation at the edges, which worsens the inlet circularity [32]. At the outlet, the increased energy breaking through the plasma shielding causes more noticeable changes in circularity [33].
From Figure 13c, it can be seen that the taper decreases as the scan count is between 20 and 40 and then increases after 45 scans. As the laser energy accumulates, the material absorbs more energy and is distributed more evenly. This reduces the difference in laser effects between the material entrance and exit, causing the difference in the entrance and exit diameters to gradually decrease, thus lowering the taper. When the scan count exceeds 40, the material is repeatedly affected by the laser, leading to excessive energy accumulation and over-ablation. The entrance diameter increases, but the exit diameter, due to energy attenuation and material blocking, shows limited increase, causing the difference between the entrance and exit diameters to grow again and the taper to increase.

4.1.3. The Effect of Scan Speed on Microhole Morphology

In this group of experiments, the microhole morphology was analyzed by changing the scan speed, while keeping the laser power and scan count constant. The specific experimental parameters were set as follows: 20 scan counts, laser power at 80%, and laser scan speeds of 30 mm/s, 20 mm/s, and 15 mm/s. Figure 14 shows the microhole morphology when the scan speed changes.
As shown in Figure 15a,b, the inlet diameter initially decreases slightly and then increases with changes in laser scanning speed, while the outlet diameter continues to decrease. The inlet circularity first decreases and then slowly increases, while the outlet circularity first increases and then slowly decreases. At lower scanning speeds, the laser interacts with the material for a longer time, providing sufficient energy to remove material, allowing more energy to reach the bottom of the micro-hole. However, excessive energy at the inlet leads to ablation transitions. As the scanning speed increases, the time the laser interacts with the material decreases, reducing the energy at the inlet area, and the thermal effects are effectively suppressed. However, the energy at the bottom of the micro-hole also gradually decreases. As the scanning speed continues to increase, the laser energy decreases, resulting in an inability to remove more material. Therefore, the inlet diameter initially improves and then stabilizes, while the outlet diameter worsens and then stabilizes.
From Figure 15c, it can be seen that as the scan speed increases, the microhole taper continuously increases. Laser drilling relies on high-energy pulses to vaporize and melt the material. At high scan speeds, the material absorbs less energy, and the laser struggles to penetrate deeply into the material to fully interact, resulting in an increase in the difference between the entrance and exit hole diameters, leading to a larger taper.

4.2. Experimental Results Analysis Under the Inner-Dense and Outer-Loose Concentric Circle Path

4.2.1. The Effect of Laser Power on Microhole Morphology

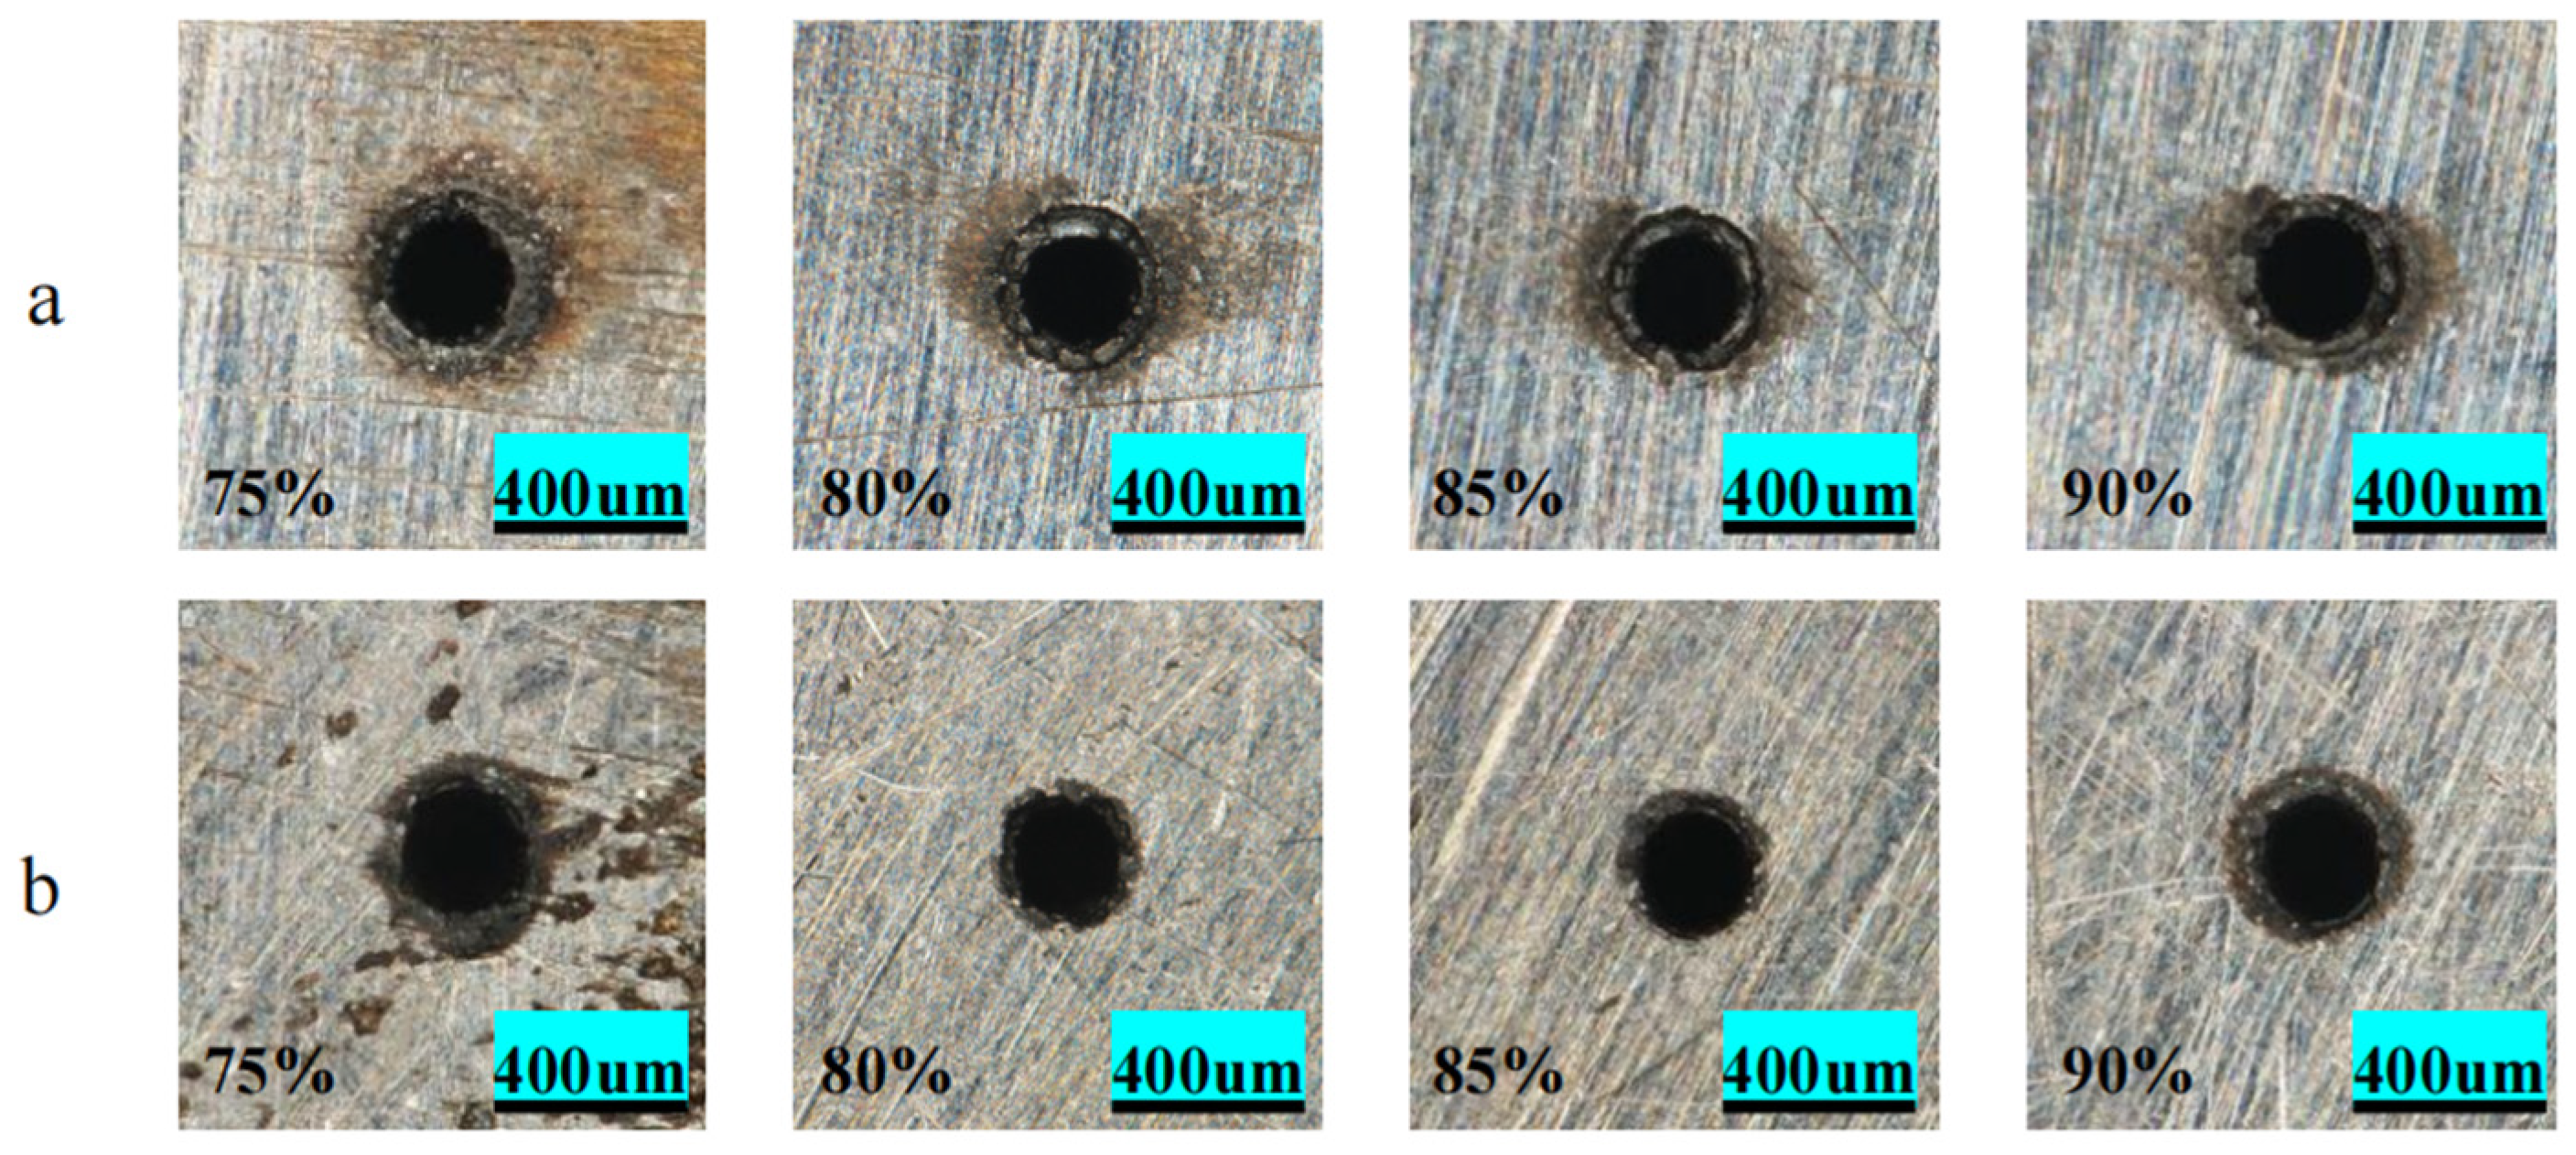
In this group of experiments, the laser scan count and scan speed were kept constant, while the laser power was adjusted to observe the changes in microhole morphology. The specific experimental parameters were set as follows: scan count of 25, scan speed of 20 mm/s, and laser power variations of 75%, 80%, 85%, and 90%. Figure 16 shows the microhole morphology under different laser power levels.
As shown in Figure 17a,b, with the increase in laser power, the inlet diameter first decreases and then increases, while the outlet diameter decreases between 75–80% and increases between 80–90%. The inlet circularity shows a trend of increasing and then decreasing, while the outlet circularity generally increases. As the pulse energy increases, a large amount of plasma is generated, which increases the shielding effect of the laser, preventing the material from being effectively removed, leading to a decrease in both the inlet and outlet diameters [34]. At low power levels, the laser cannot effectively penetrate the microhole, and the energy is too concentrated in the central region, causing excessive thermal effects, resulting in the deterioration of both inlet and outlet circularity [10]. As the energy increases, the laser can effectively penetrate the microhole, and the energy at the periphery is relatively sparse, preventing excessive ablation. Therefore, the inlet circularity improves. However, the sparse energy at the periphery also leads to insufficient energy in the depth direction of the microhole, causing the outlet circularity to deteriorate.
From Figure 17c, it can be observed that the microhole taper first increases and then decreases. As the laser power increases, the heat absorbed at the entrance of the hole also increases. At the exit, however, the aperture expands more slowly due to the shielding effect [34]. With the inner-dense and outer-loose scanning path, more energy is used to penetrate the microhole at the sparse outer path, resulting in insufficient energy at the edges. This increases the difference between the entrance and exit hole diameters. As the energy at the outer scanning path increases, more energy is applied to the hole bottom, reducing the difference in diameters. This results in the taper first increasing and then decreasing.

4.2.2. The Effect of Scan Count on Microhole Morphology

In this group of experiments, the laser power and scan speed were fixed, and the effect of varying the scan count on microhole morphology was studied. The laser power was kept constant at 80%, and the scan speed was set to 20 mm/s. The main variable adjusted was the laser scan count, with specific settings of 20, 30, 40, and 50 scans. Figure 18 shows the microhole morphology under different scan counts.
As shown in Figure 19a,b, with the increase in the number of scans, both the inlet and outlet diameters continuously increase. The inlet circularity generally shows an upward trend. The outlet circularity changes gradually between 20–40 scans and begins to decrease between 40–50 scans. This is because the inner-dense outer-loose scanning path is used, where the outer scanning circles are fewer, and the inner ones are denser. The energy is primarily concentrated near the focal point. More energy is used to penetrate the microhole. As a result, less energy is available to widen the microhole profile at the outlet, which causes the inlet diameter to always be larger than the outlet diameter. As the number of pulses increases, more energy is used for material removal, causing both the inlet and outlet diameters to continue to increase [35]. At lower scan numbers, the material receives more energy, and the energy in the central region is more concentrated. The heat cannot dissipate quickly, leading to incomplete melting of the microhole. As the number of scans increases, more energy is transferred to the bottom of the microhole, which results in more energy acting on the material at the outlet, improving the outlet circularity. However, excessive energy causes material accumulation at the inlet, which worsens the inlet circularity.
From Figure 19c, it can be seen that the microhole taper continuously increases with the scan count. In the inner-dense and outer-loose scanning path, fewer outer circles are used, and the energy used to expand the hole decreases accordingly. Additionally, due to the shielding effect of plasma inside the hole, less energy is transmitted to the bottom of the microhole [29]. This results in a growing difference between the entrance and exit diameters, which leads to an increase in taper.

4.2.3. The Effect of Scan Speed on Microhole Morphology

In this group of experiments, the effect of scan speed on microhole morphology was observed under the inner-dense and outer-loose scanning path of picosecond laser, while keeping the laser power and scan count constant. The specific experimental parameters were set as follows: laser power at 80%, scan count of 20, and laser scan speeds of 30 mm/s, 20 mm/s, and 15 mm/s. Figure 20 shows the microhole morphology under different scan speeds.
As shown in Figure 21a,b, both the inlet and outlet diameters decrease with the increase in scanning speed. The inlet circularity continuously decreases, while the outlet circularity increases. As the scanning speed increases, the time the laser interacts with the material becomes shorter, reducing the energy absorbed by the material. At the same time, plasma increases, which strengthens the shielding effect on the laser, causing the inlet and outlet diameters to decrease. Due to the use of the inner-dense outer-loose scanning path, fewer scanning circles are applied to the outer ring, resulting in less energy absorption at the microhole’s outer ring, which leads to incomplete material removal at the hole bottom and causes the inlet diameter to be larger than the outlet diameter [36]. As the scanning speed increases, the thermal accumulation effect decreases, the laser energy is distributed more evenly, and the hole wall melting becomes more uniform, thus improving the stability and circularity of the inlet diameter. However, the insufficient energy at the outer ring, uneven thermal accumulation, and the accumulation of splattered material led to the ineffective control of the outlet diameter, causing the circularity to gradually decrease.
As shown in Figure 21c, the microhole taper generally decreases [36]. When using the inner-dense and outer-loose scanning path, at lower scan speeds, the energy at the entrance perimeter is sufficient to remove material thoroughly. As the scan speed increases, the energy in the outer regions decreases, leading to a lower material removal rate, which causes the entrance diameter to shrink [30]. The exit diameter, however, is less affected by the decreasing outer energy due to the plasma shielding [29], and the effect on the perimeter is not as significant as at the entrance. This results in a decreasing difference between the entrance and exit diameters, and the taper decreases accordingly.

4.3. Analysis of the Characteristics of Two Scanning Paths

The equidistant concentric circle scanning path and the inner-dense and outer-loose scanning path, due to their different path densities, have distinct mechanisms of action on the microholes. A further analysis of the characteristics of these two processing paths is necessary.
From Figure 22, it can be observed that under the equidistant concentric circle scanning path, the microhole entrance and exit exhibit fewer spatters compared to the inner-dense and outer-loose path, and the hole entrance shows less ablation. In the equidistant concentric circle scanning path, the path spacing is uniform, and the energy is more evenly distributed across the processing area, which helps prevent excessive heat concentration, thereby reducing the production of molten material and decreasing the amount of spatter [37]. On the other hand, in the inner-dense and outer-loose scanning path, the inner circles are more concentrated, while the outer circles are sparser. This results in most of the energy being focused on the center of the microhole, leaving the outer regions with insufficient energy. The center region produces more molten material, which, under the influence of high-temperature, high-pressure metal vapors, is ejected and accumulates near the hole entrance. Once the microhole is penetrated, a large amount of molten material is ejected from the exit and accumulates there [38]. Due to the lower energy in the outer regions, material removal is ineffective, but the heat continues to accumulate, resulting in a larger thermal influence zone [39]. In contrast, in the equidistant concentric circle scanning path, with equal time intervals between each pass, the heat is more effectively diffused and released, leading to a smaller thermal influence zone.
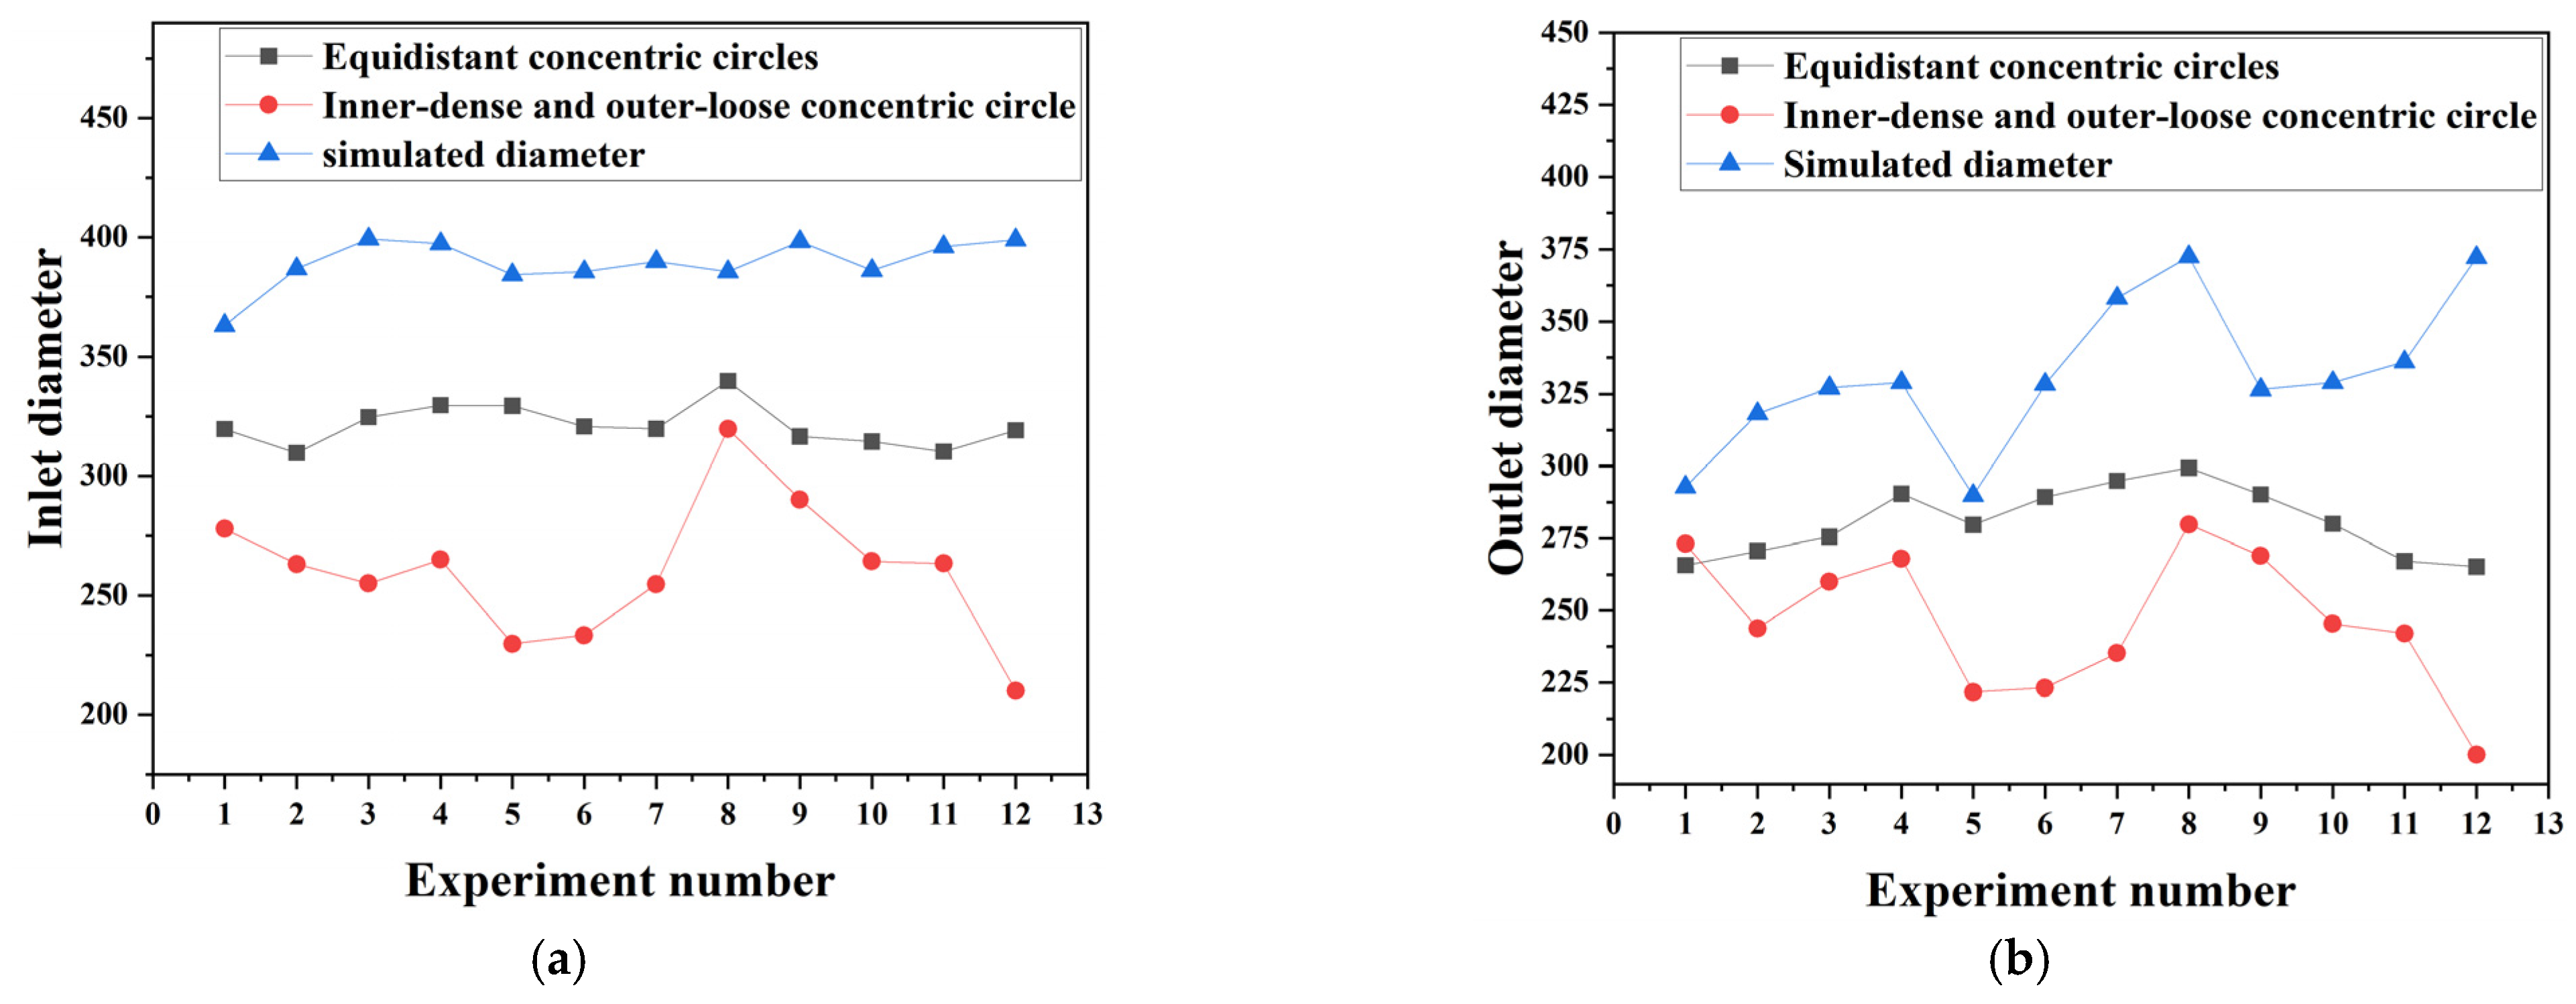
From Figure 23 and Figure 24a,b, it can be seen that both inlet and outlet diameters measured with the equidistant concentric circle scanning path are larger than those obtained with the inner-dense and outer-loose concentric circle scanning path, and the fluctuations are smaller. For both scanning paths, the measured diameters are significantly lower than the simulated values, which are overall larger and more stable. The outlet diameters are consistently smaller than the inlet diameters. The main reasons are as follows: in the equidistant concentric circle scanning path, laser energy is evenly distributed along the radial direction, and the outer region receives sufficient energy, allowing the full lateral expansion of the hole. The constant spacing and overlap between scanning tracks ensure stable effective energy density [30]. After breakthrough, multiple reflections inside the hole help maintain material removal at the bottom, so the outlet diameter remains larger than that in the inner-dense and outer-loose concentric circle scanning path. The broad energy distribution also disperses the plasma shielding load, while adequate energy in the outer region reduces the necking effect caused by resolidified debris. Distributed heat input lowers the risk of localized overheating and spatter, and it reduces the impact of focal shift as the hole deepens, resulting in more consistent sizes. In contrast, the inner-dense and outer-loose concentric circle scanning path concentrates energy in the center, which promotes vertical penetration and faster energy delivery to the hole bottom. However, sparse scanning tracks in the outer region lead to insufficient accumulated energy at the edges, limiting lateral growth. The inadequate removal of deep outer material results in smaller inlet and outlet diameters. Strong central irradiation is more likely to trigger intense plasma shielding and spatter redeposition. Limited outer energy further amplifies the reduction in diameter caused by resolidification. Excessive localized heat accumulation makes this scanning path more sensitive to process variations in power and positioning, leading to larger size fluctuations. The overall larger and smoother simulated diameters are mainly because the numerical model does not fully account for plasma shielding, the resolidification of molten material, and spatter, heat loss, and dynamic optical effects such as focal shift and plasma absorption, thus overestimating the effective removal and idealizing the hole formation process.
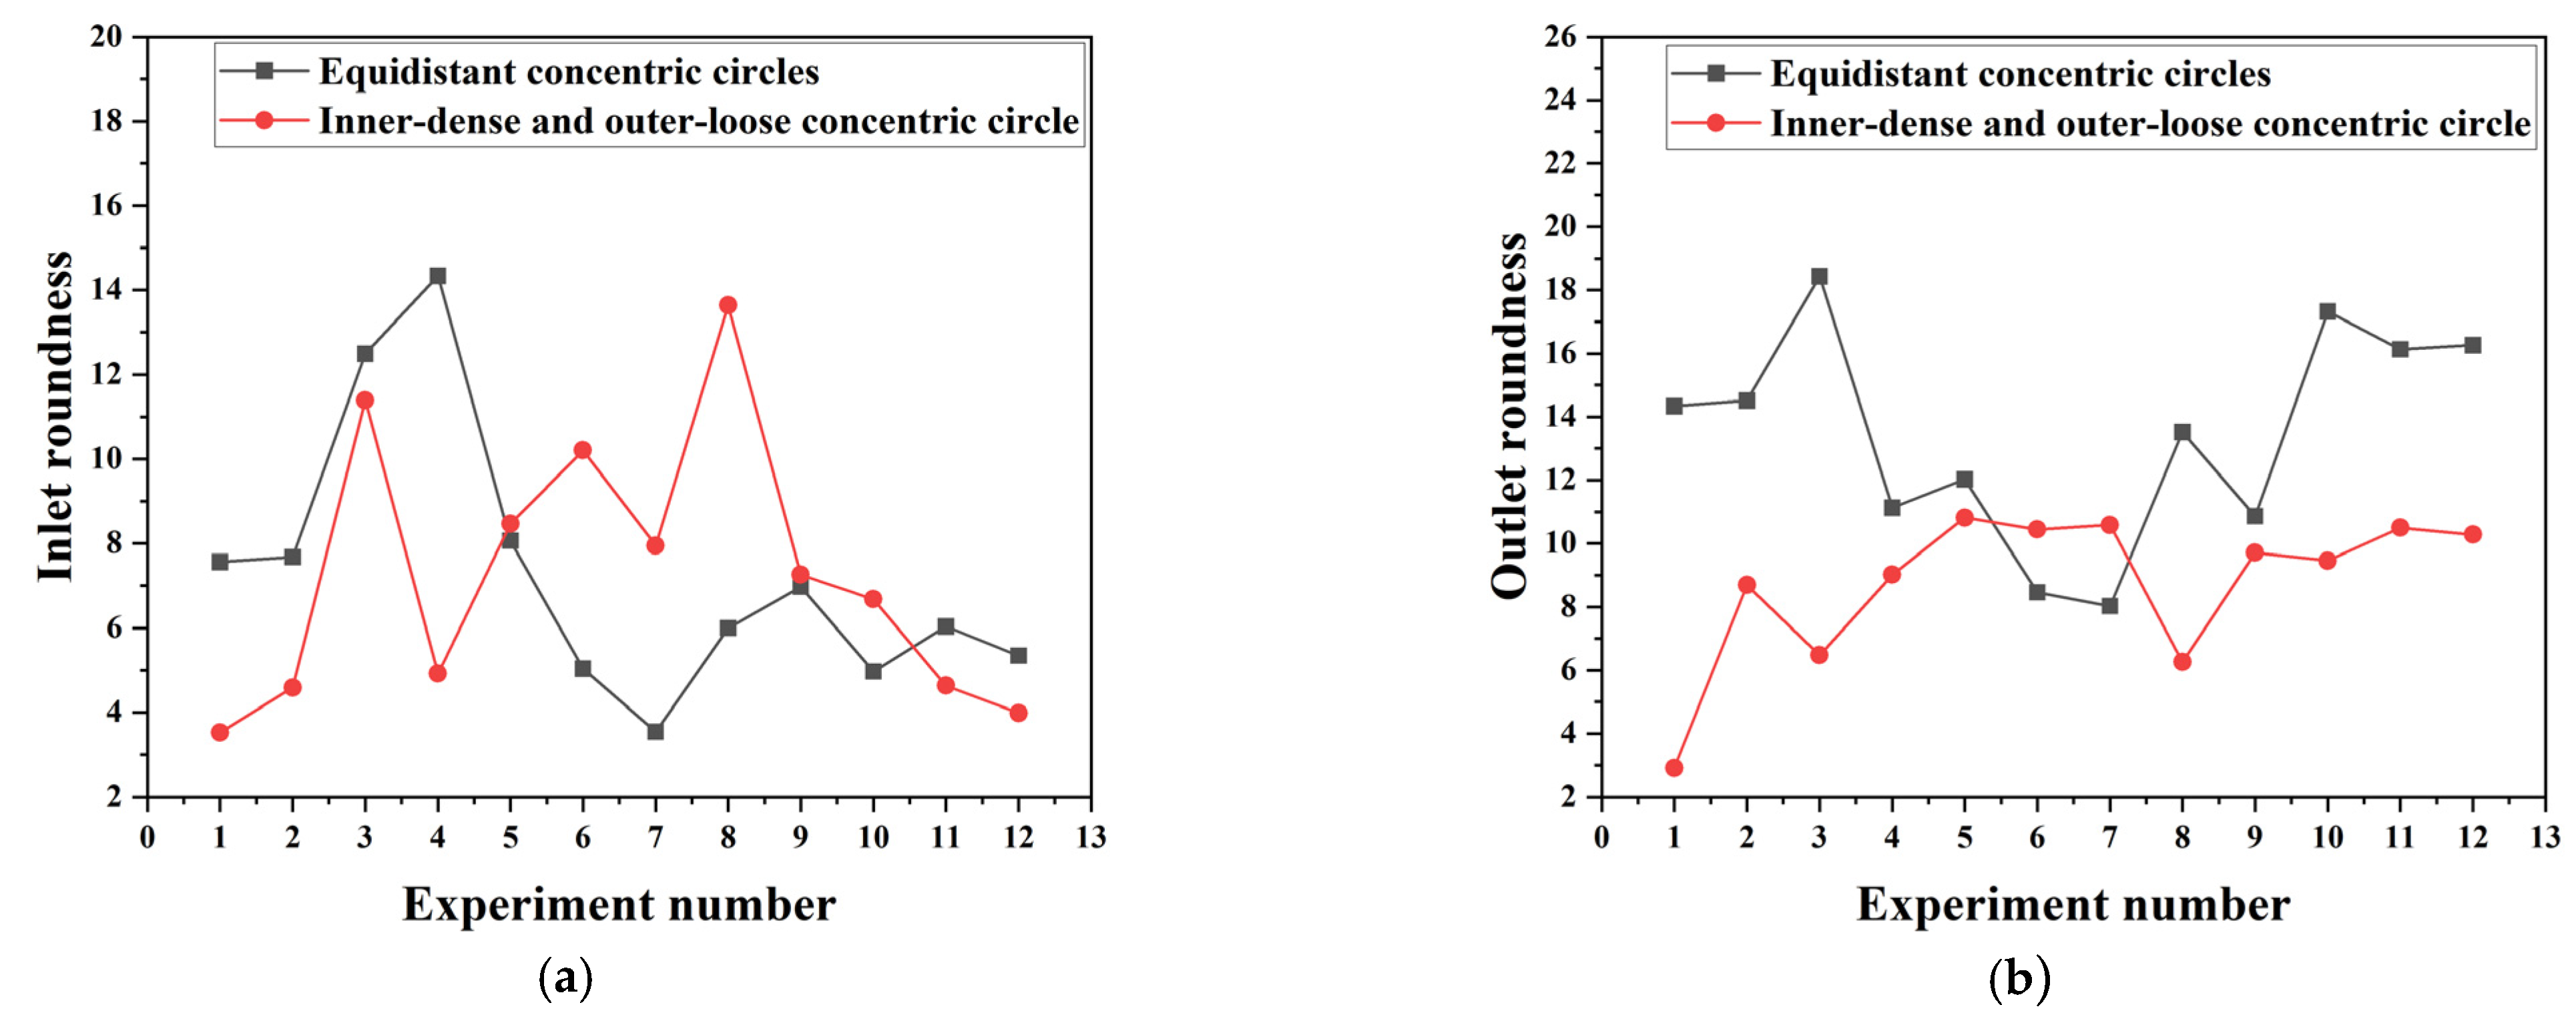
As can be seen from the Figure 25a,b, the two paths exhibit certain differences in terms of entrance roundness under different parameters: during the pulse energy stage, the inner-dense, outer-sparse path demonstrates better roundness at low energies, but excessive energy leads to overmelting at the center, resulting in loss of roundness, while the equidistant path performs slightly worse overall; during the scan count stage, the inner-dense, outer-sparse path shows a clear advantage at moderate counts, but roundness decreases with excessive counts, while the equidistant path exhibits greater fluctuations as the count increases. In terms of scanning speed, the inner-dense, outer-sparse path maintains a stable advantage at high speeds. Regarding exit roundness, the inner-dense, outer-sparse path significantly outperforms the equidistant path in all stages. As energy increases or speed accelerates, the exit roundness of the inner-dense, outer-sparse path remains at a low value with minimal fluctuations, while the equidistant path exhibits larger overall exit roundness and significant fluctuations, particularly severe roundness loss at high energy levels and multiple scan counts. These trends are primarily related to the energy distribution and transmission characteristics of the two scanning paths: the energy of the equidistant path is radially uniformly distributed, leading to overmelting at the periphery and the formation of burrs and irregular melt layers at the exit. Delayed penetration further exacerbates the plasma shielding effect, causing exit shape distortion. Additionally, repeated peripheral heating induces local thermal stress and collapse, further disrupting the circular contour. In contrast, the inner-dense, outer-sparse path concentrates energy at the center, enabling rapid penetration and providing a channel for plasma and molten material to exit. The periphery receives less heat, reducing the destructive effects of recrystallization on the hole opening shape. Additionally, subsequent scans after penetration can relatively uniformly refine the hole walls, resulting in a contour closer to an ideal circular shape under most conditions, especially at the exit location [39].
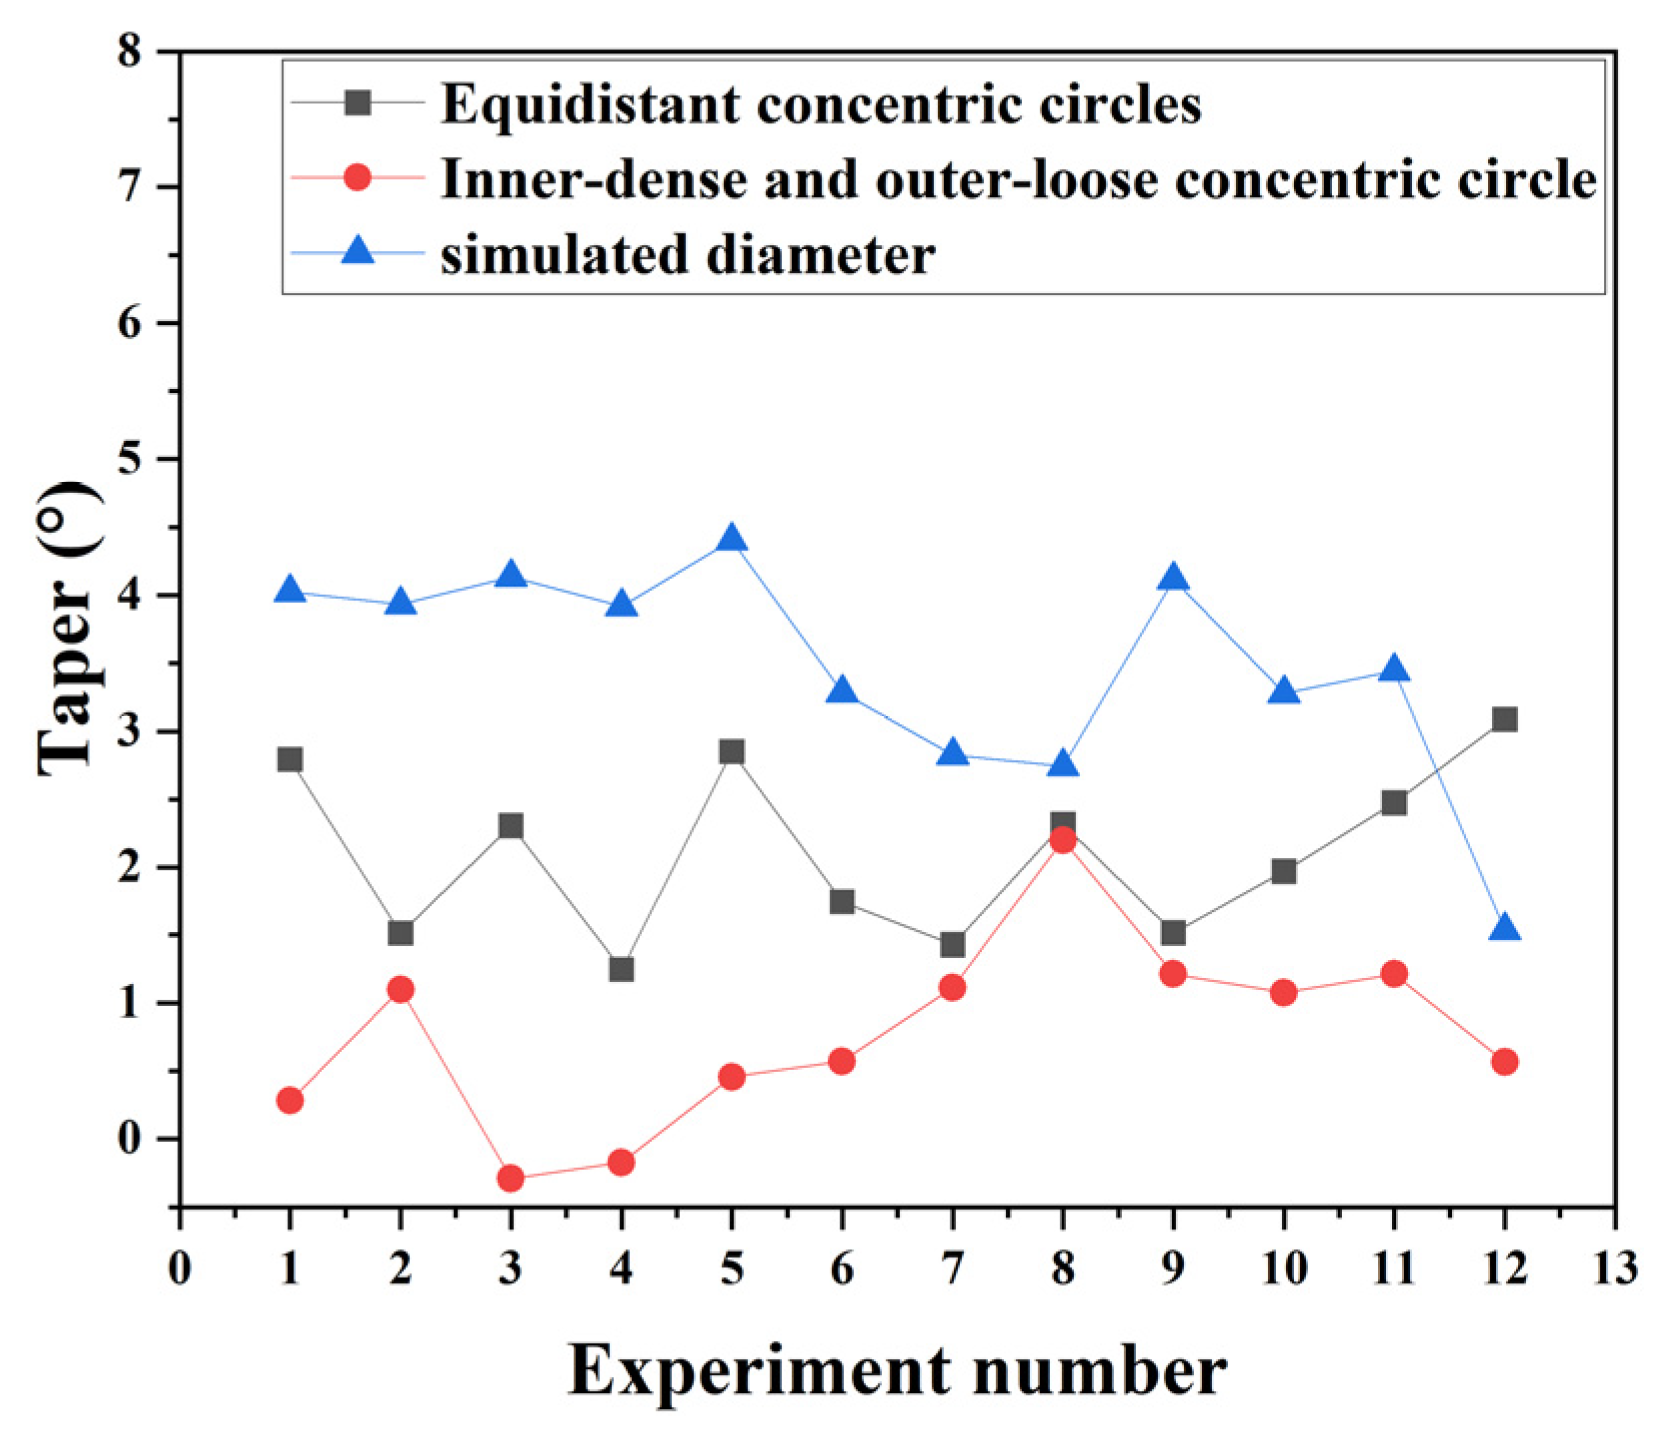
As can be seen from the Figure 26, the simulated taper is generally higher than the measured values and exhibits minimal fluctuations. The taper along the equidistant concentric circular path is generally greater than that along the inner-dense, outer-sparse path, with noticeable peaks observed in some experiments. The inner-dense, outer-sparse path maintains the lowest taper under most conditions, with stable variations, and only shows a slight increase when there are significant changes in scan frequency or speed. This may be due to differences in energy distribution characteristics. Equidistant paths uniformly distribute energy radially, enabling the simultaneous removal of peripheral and central materials; however, longitudinal energy concentration is insufficient, resulting in inadequate removal at the hole bottom, a smaller exit diameter, and consequently a larger taper. In contrast, inner-dense, outer-sparse paths concentrate more energy in the central region, enabling the rapid penetration and more efficient transmission of laser energy to the hole bottom, resulting in an exit diameter closer to the entrance diameter and significantly reducing the taper. Secondly, the plasma exhaust efficiency differs. In the inner-dense, outer-sparse path, once the central region is penetrated, plasma can escape promptly, reducing the absorption and scattering of subsequent laser beams, thereby enhancing material removal efficiency at the hole bottom. In contrast, the evenly spaced path penetrates more slowly, causing plasma to accumulate in the hole cavity for an extended period, creating a continuous shielding effect on hole bottom processing and further increasing taper [40]. Finally, the flow and recrystallization of molten material also play a significant role. In the inner-dense, outer-sparse path, due to early penetration and concentrated thermal input at the center, molten material is more easily expelled under the influence of high-pressure gas flow and gravity, reducing the thickness of the recrystallized layer formed at the bottom and exit of the hole. In contrast, the equidistant path, due to repeated heating of the periphery and obstructed melt flow pathways, is more prone to recrystallization at the exit, forming a “neck-in” effect, thereby further increasing the taper.

5. Conclusions

This study investigates the process characteristics of two trepan cutting paths, equidistant concentric circles and inner-dense outer-loose concentric circles, using a picosecond laser drilling system on 310S heat-resistant steel. The main conclusions are as follows:
(1)
Trepan cutting simulations were conducted using APDL. The results show that during the trepan scanning process, the temperature inside the hole does not concentrate excessively, and the heat-affected zone around the microhole is small, effectively controlling taper formation.
(2)
Under the equidistant concentric circle scanning path, energy distribution is more uniform, improving inlet diameter and circularity. However, the outlet diameter is smaller, and circularity is worse compared to the inlet, with a larger taper. If the primary concern is circularity and taper is less critical, the equidistant concentric circle path can be chosen.
(3)
Under the inner-dense outer-loose concentric circle scanning path, the energy is concentrated in the inner ring, which increases the outlet diameter. However, this concentration of energy reduces outlet circularity. The weaker energy in the outer ring reduces the inlet diameter but decreases the difference between inlet and outlet diameters, resulting in a better taper. If taper is a priority and depth is important, the inner-dense, outer-loose concentric circle path is recommended.
(4)
From the combined experimental and simulation results, it is evident that simulated inlet and outlet diameters are generally larger than the measured ones, with smaller fluctuations. Between the two scanning strategies, the equal-spacing concentric path produces larger inlet diameters and generally larger outlet diameters than the dense-inside sparse-outside path, but it also shows higher taper and outlet roundness, with poorer shape consistency. In contrast, the dense-inside, sparse-outside path yields smaller inlet diameters, yet its outlet diameters are closer to the inlet size, the taper is the lowest, and the outlet roundness is markedly better than that of the equal-spacing path, producing contours closer to an ideal circle under most conditions. Overall, the dense-inside, sparse-outside path excels in controlling taper and maintaining outlet shape accuracy, whereas the equal-spacing path performs better in inlet size and stability.

Author Contributions

Conceptualization, L.X. and C.W.; Methodology, L.W. and L.X.; Software, L.W. and L.X.; Validation, L.W., L.X., Y.R. and K.X.; Formal analysis, L.X. and K.X.; Investigation, L.W. and K.X.; Resources, C.W. and K.X.; Data curation, L.W.; Writing—original draft, L.X.; Writing—review and editing, L.W., C.W., Y.R. and K.X.; Visualization, L.W. and K.X.; Supervision, C.W.; Project administration, C.W.; Funding acquisition, C.W. and Y.R. All authors have read and agreed to the published version of the manuscript.

Funding

This research was supported by the National Natural Science Foundation of China (grant numbers 52375434 and 52205469), Major Research Projects of the Natural Science Research Foun-dation of Jiangsu Higher Education Institutions (grant number 23KJA460003), and the Postgraduate Research & Practice Innovation Program of Huaiyin Institute of Technology (no. HGYK202508).

Data Availability Statement

The original contributions presented in this study are included in the article. Further inquiries can be directed to the corresponding author.

Conflicts of Interest

The authors declare no conflict of interest.

References

  1. Zhang, K.; Yu, X.Y. Study on Laser Cladding Hard Alloy Composite Coatings and Wear Resistance of 310S Austenitic Stainless Steel. Cast. Technol. 2018, 39, 63–66. [Google Scholar]
  2. Song, J.B.; Yi, H.Y. Processing Technology for Film Cooling Holes in Turbine Blades of Aircraft Engines. Tool Technol. 2020, 12, 82–86. [Google Scholar]
  3. Gatzen, H.H.; Klocke, F.; Kamenzky, S.; Traisigkhachol, O. Electroplated Cu micro electrode for the application in micro sinking electro discharge machining (micro-SEDM). ECS Trans. 2009, 16, 255. [Google Scholar] [CrossRef]
  4. Chen, H.; Geng, D.C.; Chen, T.; Lu, D.L.; Chen, B. Second-derivative laser-induced fluorescence spectroscopy combined with chemometrics for authentication of the adulteration of camellia oil. CyTA-J. Food 2018, 16, 747–754. [Google Scholar] [CrossRef]
  5. Feng, J.S.; Zhang, R.; Dabbour, M.; Mintah, B.K.; Gao, X.L.; He, R.H.; Ma, H.L. Enhancing acid production of Acetobacter pasteurianus by laser and intense pulsed light mutagenesis and its molecular mechanism based on transcriptomic analysis. LWT-Food Sci. Technol. 2023, 182, 114803. [Google Scholar] [CrossRef]
  6. Lu, F.; Ruan, S.; Wang, Y.; Li, Y.; Ma, F.; Ma, H. Unveiling the underlying mechanism of combined He–Ne laser and UV mutagenesis in Bacillus subtilis CICC 21927: A transcriptomic analysis. Food Biosci. 2024, 61, 104694. [Google Scholar] [CrossRef]
  7. Zhang, X.Q.; Xing, S.L.; Liu, L.; Liu, L.; Li, L.; Tong, G.S. Femtosecond Laser Trepan Drilling on Thermal Barrier Coated High-Temperature Alloys. Chin. J. Lasers 2017, 44, 123–128. [Google Scholar]
  8. Li, J.; Zhang, W.; Zheng, H.; Gao, J.; Jiang, C. Reducing plasma shielding effect for improved nanosecond laser drilling of copper with applied direct current. Opt. Laser Technol. 2023, 163, 109372. [Google Scholar] [CrossRef]
  9. Jiang, J. Research on Picosecond Laser Micro-Hole Machining Technology for Metal Materials. Ph.D. Thesis, Beijing University of Technology, Beijing, China, 2014. [Google Scholar]
  10. Sun, X.; Dong, X.; Wang, K.; Wang, R.; Fan, Z.; Duan, W. Experimental Investigation on Thermal Effects in Picosecond Laser Drilling of Thermal Barrier Coated In718. Opt. Laser Technol. 2018, 113, 150–158. [Google Scholar] [CrossRef]
  11. Zhang, T.; Huang, Y.; Cai, M. Effects of Recast Layer on Fatigue Performance of Laser-Drilled Holes in Nickel-Based Superalloy. J. Am. Acad. Dermatol. 2023, 311, 117821. [Google Scholar] [CrossRef]
  12. Zhang, Z.; Wang, W.; Jiang, R.; Zhang, X.; Xiong, Y.; Mao, Z. Investigation on Geometric Precision and Surface Quality of Microholes Machined by Ultrafast Laser. Opt. Laser Technol. 2020, 121, 105834. [Google Scholar] [CrossRef]
  13. Wang, X.C.; Zheng, H.Y.; Chu, P.L.; Tan, J.L.; The, K.M.; Liu, T.; Ang, B.C.; Tay, G.H. Femtosecond Laser Drilling of Alumina Ceramic Substrates. Appl. Phys. A 2010, 101, 271–278. [Google Scholar] [CrossRef]
  14. Zhang, H.L. Research on Backside Water-Assisted Picosecond Laser Drilling Technology. Ph.D. Thesis, Nanjing Agricultural University, Nanjing, China, 2022. [Google Scholar]
  15. He, C.; Bühring, J.; Gillner, A. Helical Drilling of Three-Dimensional Conical Converging-Diverging Nozzle in Steel Using Ultrafast Laser Pulses. Procedia CIRP 2018, 74, 305–309. [Google Scholar] [CrossRef]
  16. Wang, R.; Dong, X.; Wang, K.; Sun, X.; Fan, Z.; Duan, W. Two-step approach to improving the quality of Laser Micro-Hole Drilling on Thermal Barrier Coated Nickel Base Alloys. Opt. Lasers Eng. 2019, 121, 406–415. [Google Scholar] [CrossRef]
  17. Gu, Z.; He, Y.; Yang, J.; Fu, Y.; Ji, J.; Zhang, Y.; Li, J.; Liu, G. Dual-Path Micro-Holes Process for 0Cr17Ni7Al Stainless Steel Thin Plate with Picosecond Laser. J. Manuf. Process. 2023, 101, 1224–1233. [Google Scholar] [CrossRef]
  18. Li, L.; Low, D.K.; Ghoreshi, M.; Crookall, J.R. Hole Taper Characterization and Control in Laser Percussion Drilling. CIRP Ann.-Manuf. Technol. 2002, 51, 153–156. [Google Scholar] [CrossRef]
  19. EN 10095:2018-12; Heat-resisting Steels and Nickel Alloys. European Committee for Standardization (CEN): Brussels, Belgium, 2018.
  20. Collins, J.; Gremaud, P. A Simple Model for Laser Drilling. Math. Comput. Simul. 2010, 81, 1541–1552. [Google Scholar] [CrossRef]
  21. Qian, X.Z.; Ren, N.F. Study on Laser Drilling Forming Quality of High-Temperature Alloys Based on Orthogonal Experiment. Appl. Laser 2018, 38, 448–453. [Google Scholar]
  22. Wang, Z.T. Experimental study on Nd:YAG laser precision circular cutting of nozzle orifices. Mod. Veh. Power 2005, 15–16, 50. [Google Scholar]
  23. Xue, Y. Numerical Simulation and Experimental Research on Temperature Field in Picosecond Laser Drilling of H59 Brass. Ph.D. Thesis, Jiangsu University, Zhenjiang, China, 2017. [Google Scholar]
  24. Xiao, Z.M. Experimental Study on Picosecond Laser Ring Cutting Process of CFRP. Ph.D. Thesis, Hunan University, Changsha, China, 2023. [Google Scholar]
  25. Li, C. Numerical Simulation and Process Study of Picosecond Laser Micro-Hole Machining for 2.5D C/SiC Composites Considering Shielding Effects. Ph.D. Thesis, Tianjin University of Technology, Tianjin, China, 2023. [Google Scholar]
  26. Liu, X.D. Research on the Process and Mechanism of Picosecond Laser Cutting for Hole Formation. Ph.D. Thesis, South-Central University for Nationalities, Wuhan, China, 2021. [Google Scholar]
  27. Zheng, Z.; Wu, C.; Liu, S.; Yang, X. Analysis of Energy Occupying Ratio of Coulomb Explosion and Thermal Effect in Picosecond Pulse Laser Processing. Opt. Commun. 2018, 424, 190–197. [Google Scholar] [CrossRef]
  28. Fan, X.; Dong, Z.H.; Zhang, Q.W.; Li, N.; Yang, S.L. Process Study and Quality Analysis of Picosecond Laser Gas-Membrane Hole Machining. Chin. Laser 2025, 52, 253–262. [Google Scholar]
  29. Wang, X.S.; Huang, Y.K.; Shen, B.; Xu, B.; Zhang, J. Research Progress of Short/Ultra-Short Pulse Laser-Induced Plasma Micro-Machining. Laser Optoelectron. Prog. 2020, 57, 111405. [Google Scholar] [CrossRef]
  30. Liu, Y.; Feng, A.; Jia, T.; Chen, H. Experimental Study on 515 nm Picosecond Laser Ring Cutting of Microholes. Appl. Laser 2019, 39, 285–290. [Google Scholar]
  31. AZW, C.L.; Wu, Y.; Du, R.B.; Bai, H.L.; Zou, G.S. Controlling of Diameter and Taper in Ultrafast Laser Helical Drilling. Zhongguo Jiguang/Chin. J. Lasers 2021, 48, 0802017. [Google Scholar]
  32. Zhang, H.; Di, J.; Zhou, M.; Yan, Y.; Wang, R. Investigation on Hole Quality During Picosecond Laser Helical Drilling of Stainless Steel 304. Appl. Phys. A-Mater. Sci. Process. 2015, 119, 745–752. [Google Scholar] [CrossRef]
  33. Wang, L.; Rong, Y.; Xu, L.; Wu, C.; Xia, K. Experimental Study and Defect Control in Picosecond Laser Trepanning Drilling of Superalloy. Metals 2025, 15, 893. [Google Scholar] [CrossRef]
  34. Li, P.X.; Xin, C.C.; Gao, J.; Zhang, T.; Xiao, K.; Dong, X.; Li, S.; Wang, T.; Su, N. Research Progress and Development of Picosecond Laser Processing. Laser Infrared 2018, 48, 1195–1203. [Google Scholar]
  35. Liu, X.; Chen, L.; Wang, X.; Xiong, Z. Study on Technology of Picosecond Laser Making Micro-Hole with Helical Drilling. Laser Optoelectron Prog. 2022, 59, 0714005. [Google Scholar]
  36. Liu, L.; Ruan, L.; Zhang, T.; Zhang, W. Experimental Study on Stainless Steel Micro-Hole Drilling with Picosecond Laser. Appl. Laser 2015, 35, 472–478. [Google Scholar]
  37. Shi, S.; Zhang, M.; Li, L. Analysis of Thermal Effects During Laser Ablation of Materials. Acta Opt. Sin. 2024, 44, 1932001. [Google Scholar]
  38. He, J.Y.; Xu, F.; Wu, X.J.; Duan, Z.Z.; Zhou, Y.X.; Yao, J.; Zuo, D.W. Numerical Simulation of Temperature Field in Picosecond Laser CVD Diamond Film Drilling. J. Mech. Manuf. Autom. 2010, 40, 106–110. [Google Scholar]
  39. Sun, S.; Liao, H.; Wu, X.; Zhang, B. Experimental Study on Micro Hole Processing by Picosecond Laser. Laser Technol. 2018, 42, 234–238. [Google Scholar]
  40. Chen, X.L.; Li, L. Molecular Dynamics Simulation of Femtosecond Laser Irradiation of Gold Foil Under Plasma Shielding Effect. J. At. Mol. Phys. 2022, 39, 75–82. [Google Scholar]
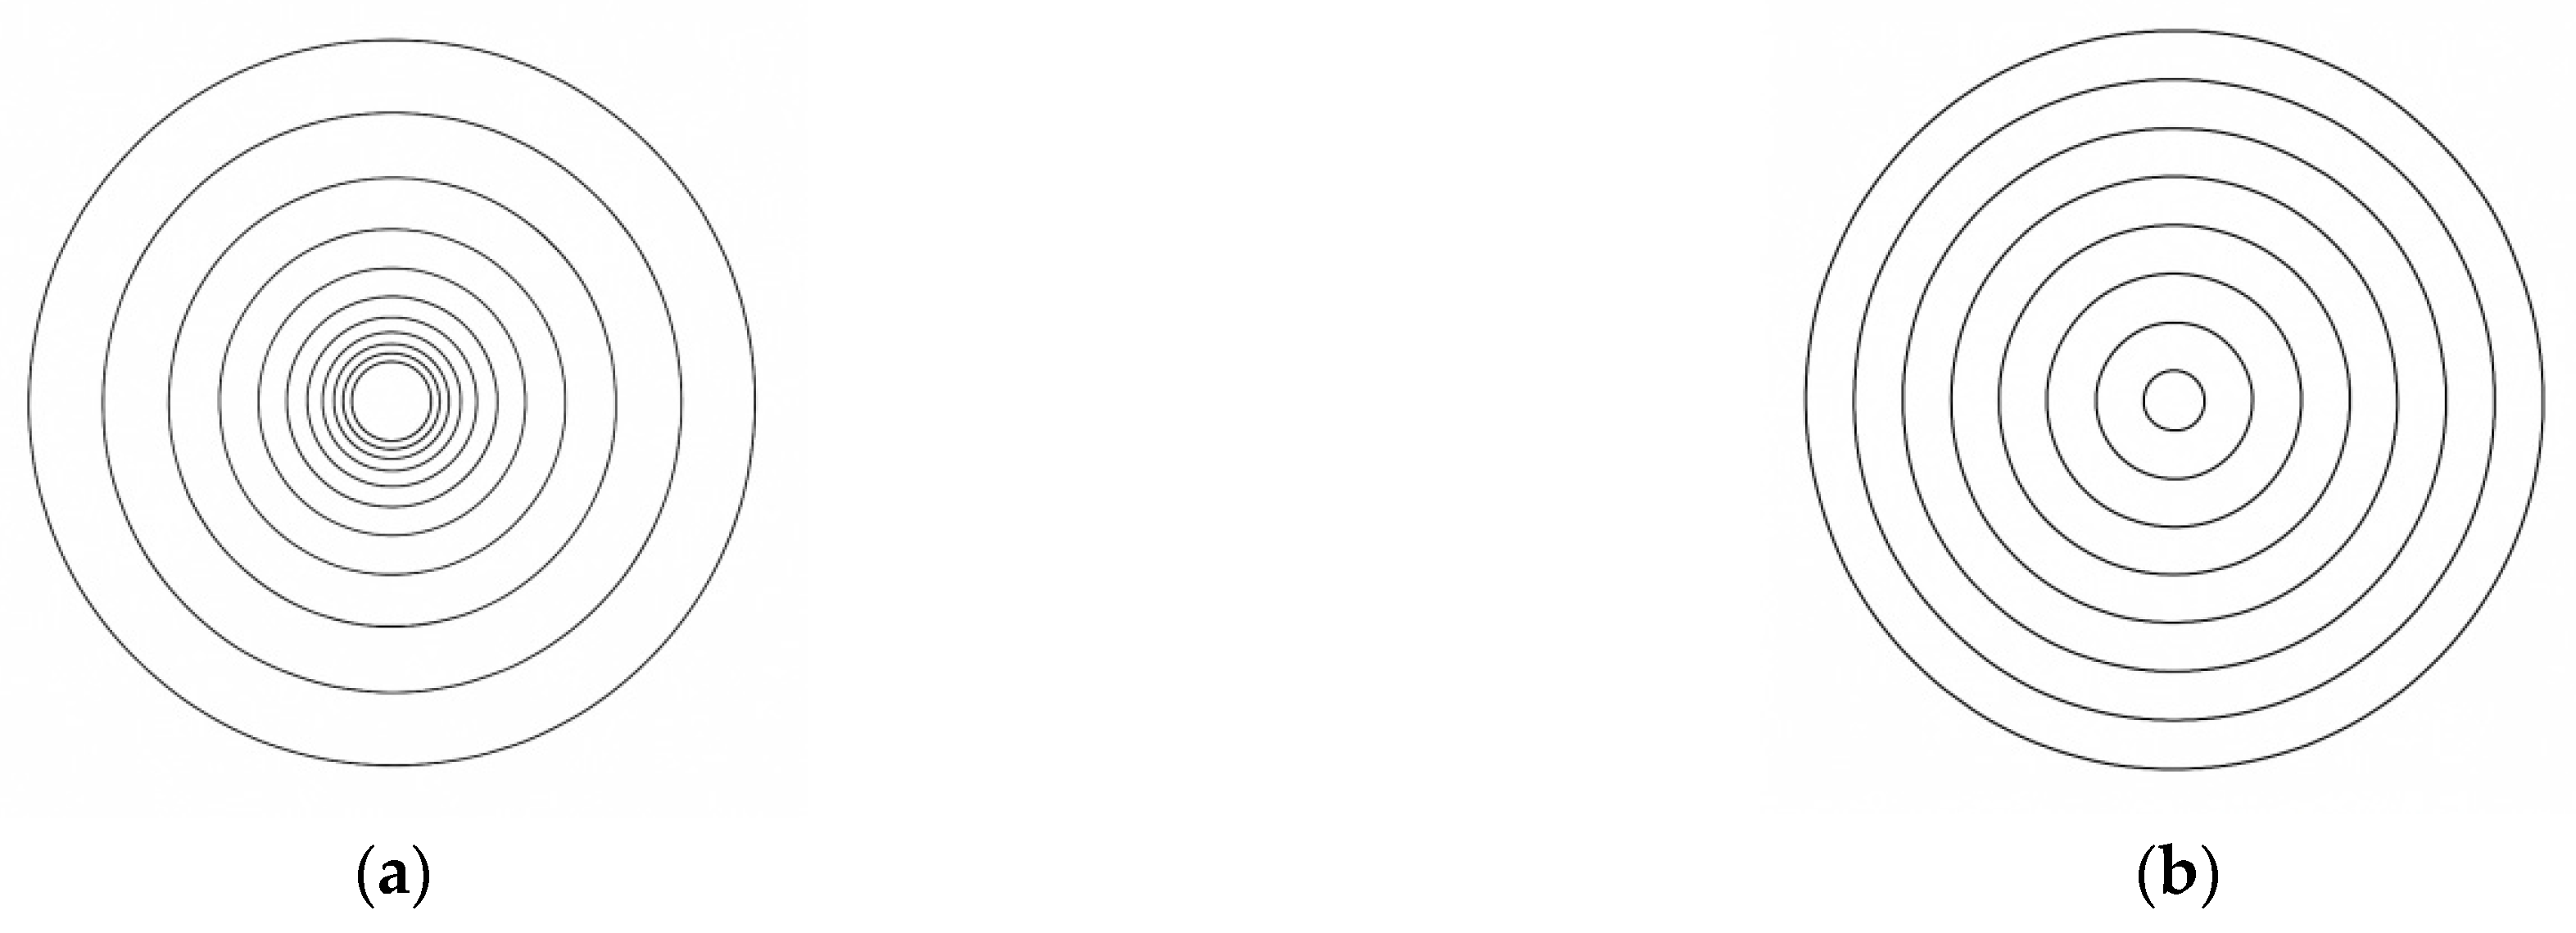
Figure 1. Scanning paths: (a) inner-dense outer-loose concentric circles; (b) equidistant concentric circles.
Metals 15 00917 g001
Figure 2. Schematic diagram of hole diameter measurement.
Metals 15 00917 g002
Figure 3. Mesh division of the laser perforation simulation model.
Metals 15 00917 g003
Figure 4. Temperature field contour maps under different laser powers: (a) 75%; (b) 80%; (c) 85%; (d) 90%.
Metals 15 00917 g004
Figure 5. Microhole profile under different laser powers: (a) 75%; (b) 80%; (c) 85%; (d) 90%.
Metals 15 00917 g005
Figure 6. Temperature field contour maps under different scan counts: (a) 20 scans; (b) 30 scans; (c) 40 scans; (d) 50 scans.
Metals 15 00917 g006
Figure 7. Microhole profile maps under different scan counts: (a) 20 scans; (b) 30 scans; (c) 40 scans; (d) 50 scans.
Metals 15 00917 g007
Figure 8. Temperature field contour maps under different scanning speeds: (a) 30 mm/s; (b) 25 mm/s; (c) 20 mm/s; (d) 15 mm/s.
Metals 15 00917 g008
Figure 9. Microhole profiles at different scan speeds. (a) 30 mm/s; (b) 25 mm/s; (c) 20 mm/s; (d) 15 mm/s.
Metals 15 00917 g009
Figure 10. Microhole morphology under different laser powers. (a) Hole entrance after polishing; (b) hole exit after polishing.
Metals 15 00917 g010
Figure 11. Trends of microhole changes with varying laser power levels: (a) hole entrance and exit diameter; (b) circularity; (c) taper.
Metals 15 00917 g011
Figure 12. Microhole morphology under different scan counts: (a) hole entrance after polishing; (b) hole exit after polishing.
Metals 15 00917 g012
Figure 13. Trends of microhole changes with varying scan counts: (a) hole entrance and exit diameter; (b) circularity; (c) taper.
Metals 15 00917 g013
Figure 14. Microhole morphology under different scan speeds. (a) Hole entrance after polishing; (b) hole exit after polishing.
Metals 15 00917 g014
Figure 15. Trend of microhole changes with varying scan speeds. (a) Hole entrance and exit diameter; (b) circularity; (c) taper.
Metals 15 00917 g015
Figure 16. Microhole morphology under different laser power levels. (a) Hole entrance after polishing; (b) hole exit after polishing.
Metals 15 00917 g016
Figure 17. Trend of microhole changes with varying laser power. (a) Hole entrance and exit diameter; (b) circularity; (c) taper.
Metals 15 00917 g017
Figure 18. Microhole morphology under different scan counts. (a) Hole entrance after polishing (b) Hole exit after polishing.
Metals 15 00917 g018
Figure 19. Trend of microhole morphology changes with varying scan counts. (a) Hole entrance and exit diameter; (b) circularity; (c) taper.
Metals 15 00917 g019
Figure 20. Microhole morphology under different scan speeds. (a) Hole entrance after polishing; (b) hole exit after polishing.
Metals 15 00917 g020
Figure 21. Trend of microhole morphology changes with varying scan speeds. (a) Hole entrance and exit diameter; (b) circularity; (c) taper.
Metals 15 00917 g021
Figure 22. Entrance and exit surface morphology of the two processing paths before polishing under the same laser power: (a) entrance morphology under the equidistant concentric circle scanning path; (b) exit morphology under the equidistant concentric circle scanning path; (c) entrance morphology under the inner-dense and outer-loose scanning path; (d) exit morphology under the inner-dense and outer-loose scanning path.
Metals 15 00917 g022
Figure 23. Entrance and exit surface morphology of the two processing paths after polishing under the same laser power: (a) entrance morphology under the equidistant concentric circle scanning path; (b) exit morphology under the equidistant concentric circle scanning path; (c) entrance morphology under the inner-dense and outer-loose scanning path; (d) exit morphology under the inner-dense and outer-loose scanning path.
Metals 15 00917 g023
Figure 24. Analysis of the mean aperture size in simulations and experiments: (a) inlet diameter; (b) outlet diameter.
Metals 15 00917 g024
Figure 25. Analysis of roundness mean values under two different paths: (a) inlet roundness; (b) outlet roundness.
Metals 15 00917 g025
Figure 26. Simulation and experimental analysis of taper mean values.
Metals 15 00917 g026
Table 1. The chemical composition of 310S heat-resistant steel is as follows.
ElementCSiMnCrPNiS
Content (%)≤0.08≤1.5≤224–26≤0.03519–22≤0.03
Table 2. AISI 310S thermal–physical properties.
Temperature
(°C)
ENTH
(1.0 × 10⁹·J·m−3)
Specific Heat
(1.0 × 10³·J·kg−1·°C−1)
Thermal Conductivity
(W·m−1·°C−1)
250.020.4812.7
5002.040.4812.7
10004.470.4812.7
15009.650.4812.7
200012.70.4812.7
Table 3. Single-factor experimental plan.
Experiment NumberPower (%)Number of ScansScanning Speed (mm/s)
1752025
2802025
3852025
4902025
5802025
6803025
7804025
8805025
9802030
10802025
11802020
12802015
Table 4. Entrance and exit diameters and taper under different laser powers.
Mesh Height (mm)Exit Diameter (µm)Entrance Diameter (µm)Laser Power (%)Taper (°)
0.5293 363 753.61
318 387 802.57
327 399 853.54
329 397 902.53
Table 5. Inlet and outlet diameters and taper under different scan counts.
Mesh Height (mm)Exit Diameter (µm)Entrance Diameter (µm)Scan CountTaper (°)
0.5290 384 204.40
328 386 303.28
358 390 402.83
373 386 502.74
Table 6. Entrance and exit diameters and taper at different scan speeds.
Mesh Height (mm)Exit Diameter (µm)Entrance Diameter (µm)Scan Speed (%)Taper (°)
0.5326 398 304.11
329 386 253.28
336 396 203.44
372 399 151.53
Disclaimer/Publisher’s Note: The statements, opinions and data contained in all publications are solely those of the individual author(s) and contributor(s) and not of MDPI and/or the editor(s). MDPI and/or the editor(s) disclaim responsibility for any injury to people or property resulting from any ideas, methods, instructions or products referred to in the content.