Article

CTOD Evaluation of High-Nitrogen Steels for Low-Temperature Welded Structures

1
Department of Energy Storage/Conversion Engineering of Graduate School, Jeonbuk National University, Jeonju 54896, Republic of Korea
2
Purpose Built Mobility Group, Korea Institute of Industrial Technology (KITECH), Gwangju 61012, Republic of Korea
3
Department of Naval Architecture and Ocean Engineering, Chosun University, Gwangju 61452, Republic of Korea
*
Author to whom correspondence should be addressed.
Metals 2025, 15(8), 916; https://doi.org/10.3390/met15080916
Submission received: 9 June 2025 / Revised: 12 August 2025 / Accepted: 15 August 2025 / Published: 19 August 2025
(This article belongs to the Special Issue Advances in Welding Processes of Metallic Materials)

Abstract

Welded structures, such as offshore platforms, require robust toughness in their heat-affected zones (HAZ) to withstand low-temperature environments. The coarse-grained HAZ (CGHAZ) adjacent to the fusion boundary often exhibits reduced toughness due to grain coarsening, particularly under high heat input welding conditions aimed at enhancing productivity. To address this, high-nitrogen steels containing TiN particles were developed to suppress austenite grain growth by leveraging the thermal stability of TiN precipitates. Three high-nitrogen steels with varying carbon contents (0.09%, 0.11%, and 0.15%) were fabricated and subjected to crack tip opening displacement (CTOD) testing at −20 °C and −40 °C to evaluate low-temperature HAZ toughness. Results indicate that high-nitrogen TiN steels exhibit superior CTOD values (1.38–2.73 mm) compared to conventional 490-MPa class steels, with no significant reduction in toughness despite increased carbon content. This is attributed to the presence of stable TiN particles, which restrict austenite grain growth during welding thermal cycles, and the formation of fine ferrite–pearlite microstructures in the HAZ. These findings highlight the efficacy of high-nitrogen TiN steels in enhancing low-temperature fracture resistance for welded structures.

Graphical Abstract

1. Introduction

The increasing concentration of populations in urban centers has heightened the demand for land efficiency, leading to a global rise in the construction of super high-rise buildings. Consequently, structural steels used in these buildings—as well as in large-scale offshore structures and ship hulls—are becoming progressively thicker, with ultra-thick steel plates reaching up to 100 mm. This trend toward increased thickness, especially in offshore applications, is accompanied by strict requirements for toughness and strength under low-temperature environments. Multi-layer welding processes for thick plates performed under preheating and interpass temperature maintenance conditions increase both the time and cost of welding, resulting in elevated construction expenses. To mitigate these costs, high heat input welding, which reduces the number of weld passes by utilizing high heat input, is employed to enhance welding productivity and efficiency. Welding, regardless of whether it involves low or high heat input, typically induces a thermal cycle that leads to the coarsening of prior austenite grain size (PAGS) in the heat-affected zone (HAZ), especially near the fusion line. This thermal cycle also results in the formation of various microstructures, including grain boundary ferrite, ferrite side plates, and bainite. The heat input level, however, significantly impacts the extent of this change; a higher heat input promotes a greater degree of PAGS coarsening and a wider HAZ area [1,2]. When welding heat input exceeds 50 kJ/cm, abnormal grain growth occurs during thermal cycles, severely degrading the toughness of the coarse-grained heat-affected zone (CGHAZ) [3,4,5,6,7,8]. These microstructural changes significantly reduce fracture resistance and increase the risk of brittle failure.
To mitigate this, microstructural refinement through the addition of stable precipitates, such as nitrides of Al, Nb, or V, has been explored to restrict austenite grain growth [9,10,11,12,13,14,15,16,17,18,19,20,21]. However, these precipitates (e.g., AlN, Nb(CN), V(CN)) often dissolve at high temperatures near the fusion boundary, thereby limiting their effectiveness [22,23,24]. In contrast, titanium nitride (TiN) particles exhibit superior thermal stability and low solubility, making them highly effective in suppressing austenite grain growth during welding [25,26]. Increasing nitrogen content in TiN-containing steels further reduces TiN solubility in the austenite matrix, thereby enhancing their ability to maintain fine grain structures in the CGHAZ [27,28,29].
Recently, as the significance of fracture mechanics-based evaluation of the HAZ in welded structures has increased, Crack Tip Opening Displacement (CTOD) testing, based on elastic–plastic fracture mechanics, has been widely applied to assess the fracture toughness of the HAZ in various structural steels. In general, steels exhibit a transition from ductile to brittle fracture behavior as the temperature decreases. Since offshore structures are often exposed to extremely low temperatures, they must possess sufficient toughness under such conditions. Therefore, in this study, CTOD testing was conducted to evaluate the low-temperature fracture toughness of the HAZ in high-nitrogen steel in accordance with the ASTM E1290 standard [30]. This study investigates the low-temperature fracture toughness of high-nitrogen TiN-containing steels with varying carbon contents (0.09%, 0.11%, and 0.15%) under different welding heat inputs (45 kJ/cm and 100 kJ/cm). CTOD tests were conducted at −20 °C and −40 °C to evaluate HAZ fracture toughness. Complementary transmission electron microscopy (TEM) analysis was conducted to clarify the relationship between microstructure and toughness.

2. Materials and Methods

2.1. Materials

High-nitrogen steels with a thickness of 40 mm and 490-MPa class strength were produced with carbon contents of 0.09% (Steel A), 0.15% (Steel B), and 0.11% (Steel C). Their chemical compositions and mechanical properties are presented in Table 1 and Table 2, respectively. The chemical compositions were analyzed using inductively coupled plasma optical emission spectroscopy (ICP-OES) and a carbon-sulfur analyzer (CS). The carbon equivalent (Ceq), which is commonly used to evaluate hardenability and crack susceptibility in the heat-affected zone (HAZ) during welding, was calculated based on the formula recommended by the International Institute of Welding (IIW). The mechanical properties listed in Table 2 were evaluated using a Universal Testing Machine (ZWICK Z600) (ZwickRoell, Ulm, Germany) following the ASTM E8 standard [31]. The Ti/N ratio ranges from 1.5 to 1.6. Charpy impact toughness of the base metal at −40 °C varies between 244 and 286 J, measured at the quarter-thickness position using specimens notched parallel to the rolling direction.

2.2. Welded Specimens

CTOD specimens were prepared using submerged arc welding (ESAB TAF 1250AC, North Bethesda, MD, USA) with heat inputs of 45 kJ/cm for Steels A and B, and 100 kJ/cm for Steel C. A K-bevel groove configuration was adopted to ensure a straight fusion line parallel to the machined notch of the CTOD specimens. The specimens were machined using milling and electrical discharge machining (EDM) to achieve precise geometry and notch placement. Welding with heat inputs of 45 kJ/cm and 100 kJ/cm required eight and four passes, respectively. The base metal was preheated to 80 °C prior to welding, and the interpass temperature was maintained within the range of 150–200 °C, with continuous monitoring using an infrared thermometer.
The welding conditions and parameters are detailed in Table 3, and the groove geometry is illustrated in Figure 1.

2.3. CTOD Testing

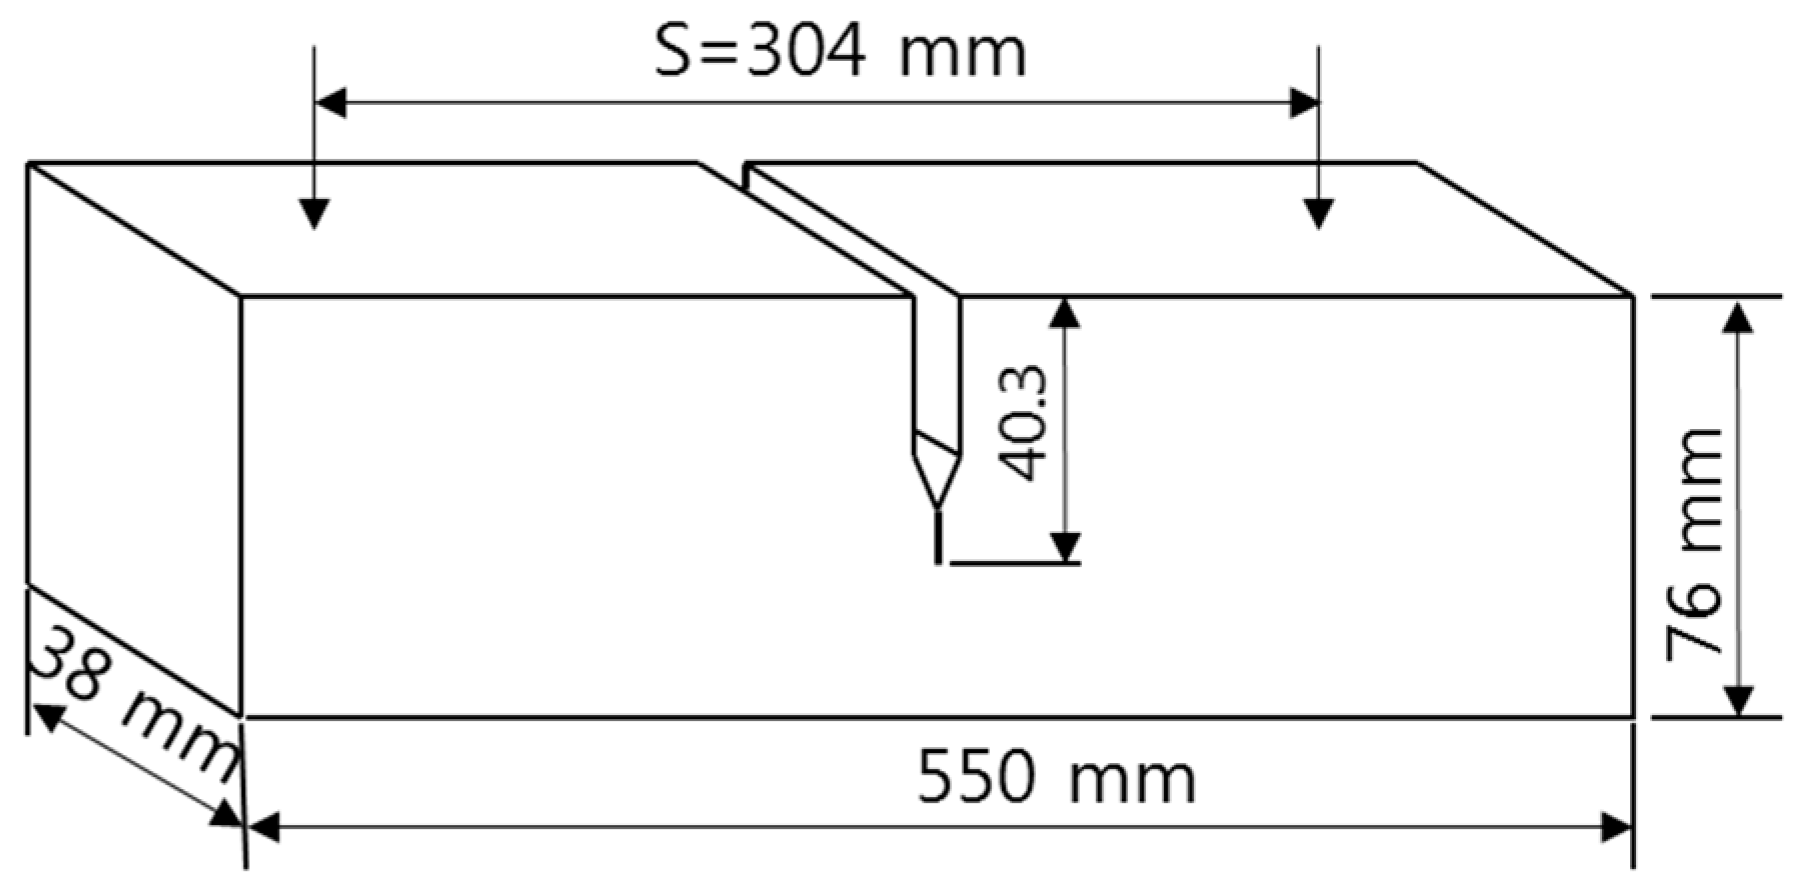
Nine CTOD specimens (three per steel type) with dimensions of 38 mm × 76 mm × 550 mm were machined from 40 mm thick welded plates [30]. The welded specimens were machined to a thickness of 38 mm from the 40 mm thick base metal, minimizing material removal to account for weld-induced distortions from multi-layer welding.
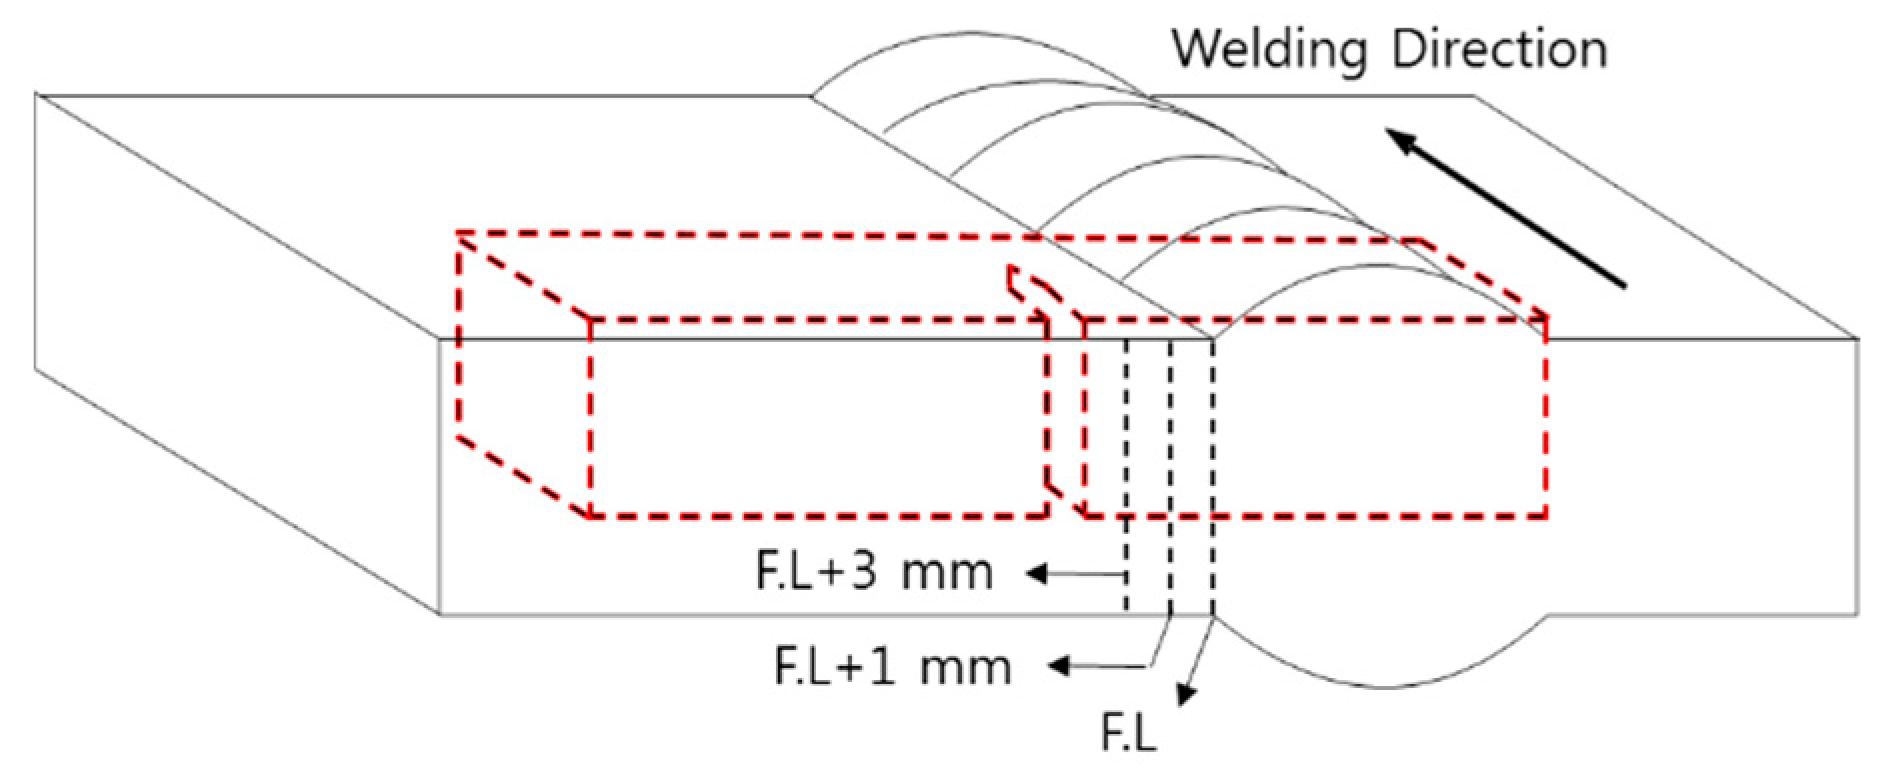
To evaluate the fracture toughness of the HAZ, T–L type notches were introduced at distances of 1 mm and 3 mm from the fusion line, as shown in Figure 2. In order to accurately position the notches within the target HAZ region, the fusion line was identified by metallographic etching after machining. This allowed precise placement of notches in the desired microstructural zones. Figure 3 illustrates the sampling orientation of the specimens. Through-thickness notches were machined perpendicular to the weld line direction. After machining the notches, fatigue pre-cracks were introduced and extended by approximately 2.3 mm to achieve a target crack ratio of a/W = 0.53. The total crack length, including the machined notch and the fatigue pre-crack, averaged 40.3 mm.
To mitigate the non-uniform growth of fatigue pre-cracks caused by weld residual stresses, a local compressive load was applied to promote uniform crack propagation through the specimen thickness, in accordance with CTOD test standards. The required compressive load was calculated based on the test specification, and mechanical compression was applied using a rectangular indenter (38 mm × 19 mm) specially fabricated for this purpose.
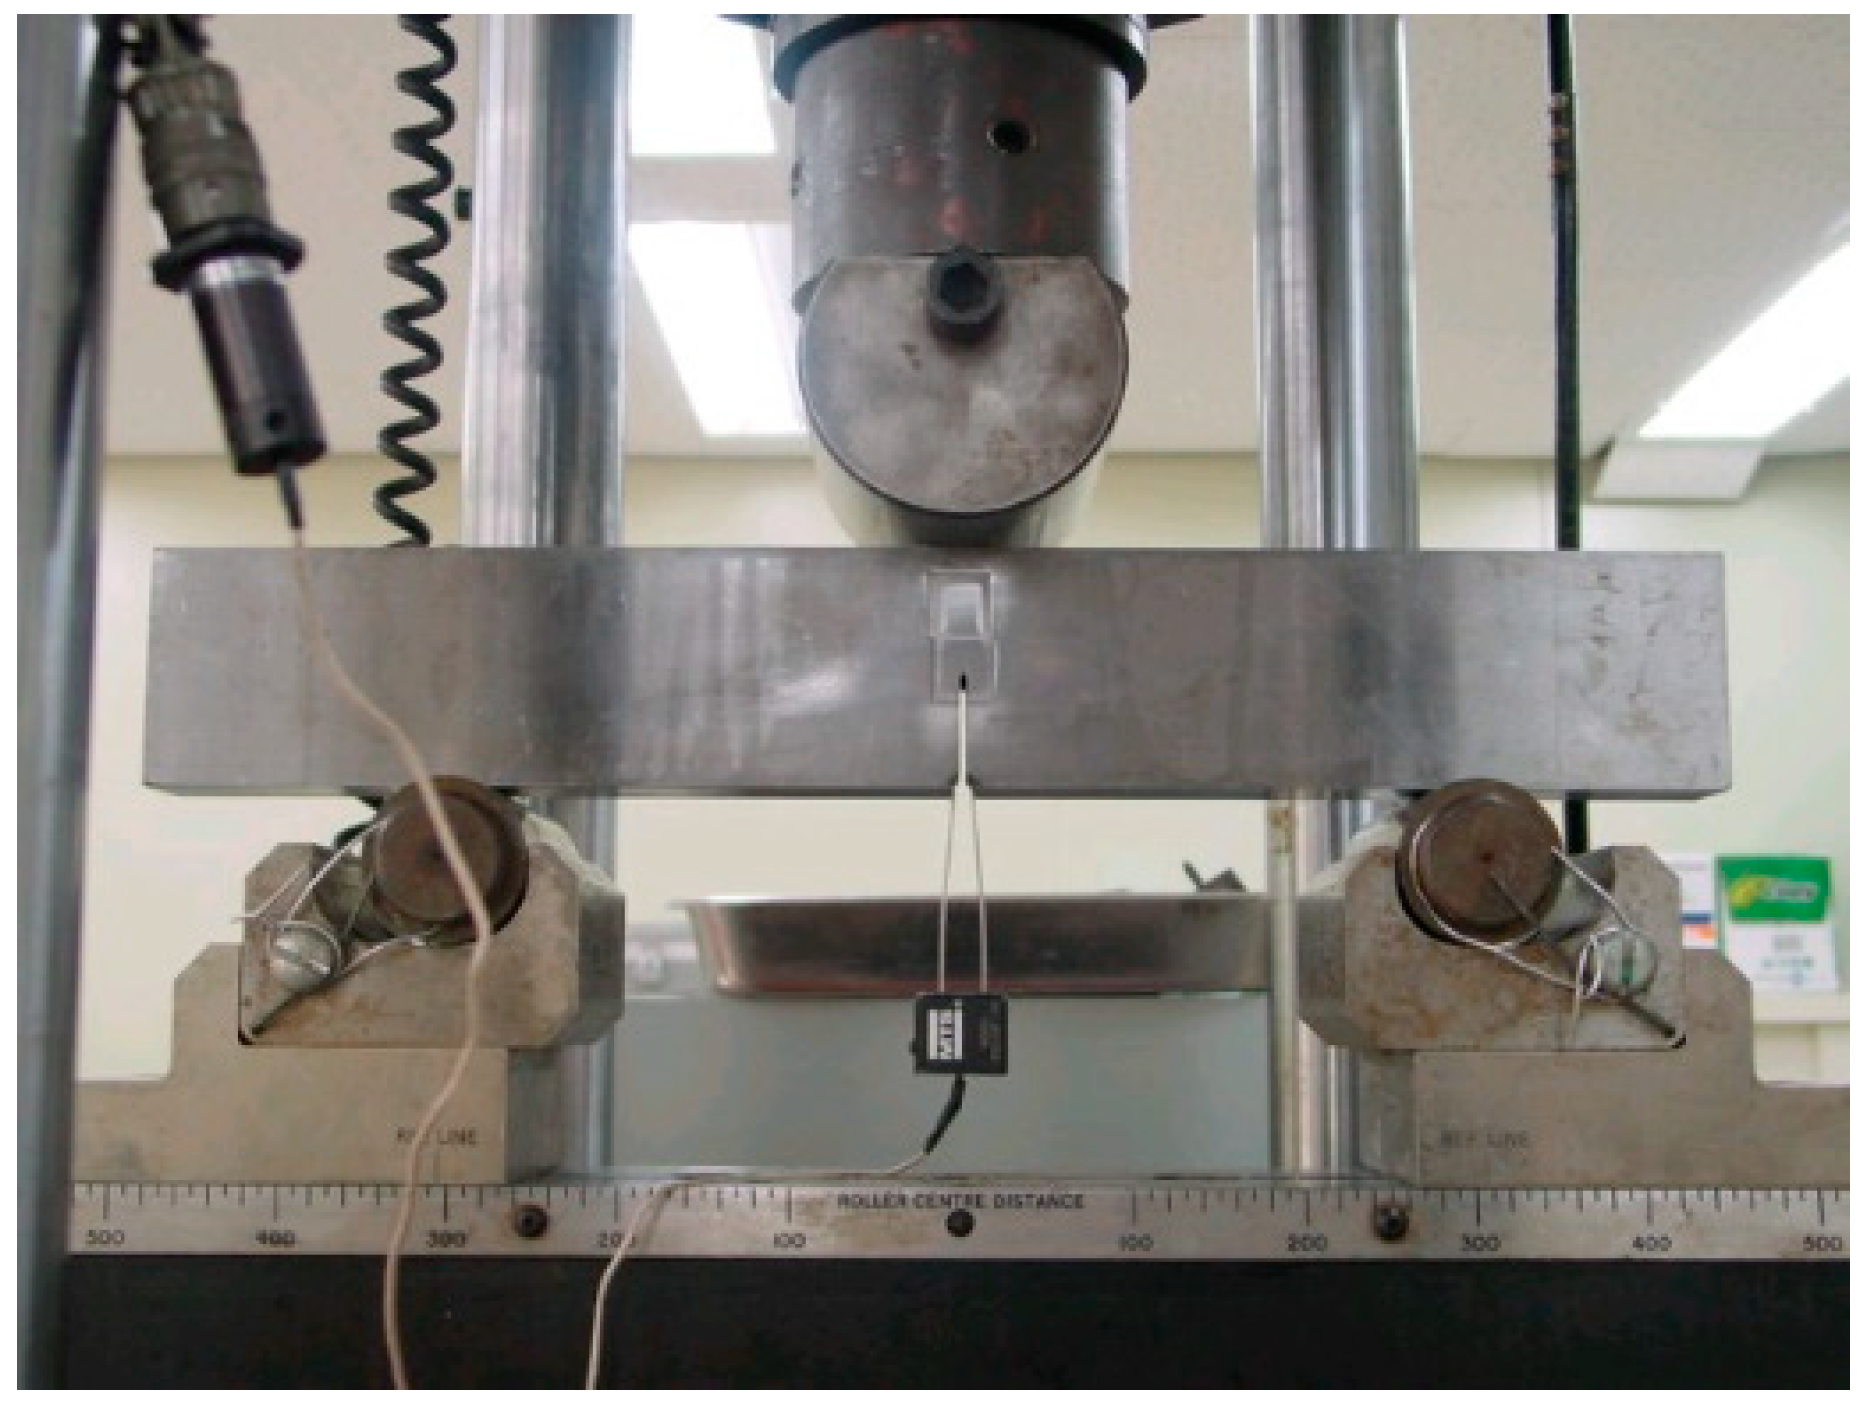
The upper and lower surfaces of the weld region were compressed by 0.5% of the specimen thickness using a 50-ton dynamic fatigue testing machine, thereby mechanically relieving the residual stresses induced by welding. Fatigue pre-cracks were then introduced, and the specimens were cooled in a liquid nitrogen chamber for over 40 min to reach test temperatures of −20 °C and −40 °C. A clip gauge was installed to measure CTOD, as shown in Figure 4. Standard CTOD specimens with fatigue pre-cracks were immersed in a rectangular chamber filled with 95% alcohol, and liquid nitrogen was introduced to lower the temperature to −20 °C and −40 °C. The specimens were maintained at the target temperature for approximately 40 min to ensure thermal equilibrium. Subsequently, a clip gauge was installed at the notch mouth to measure the CTOD, and the opening displacement was recorded and analyzed. After testing, the fracture surfaces were examined to evaluate the failure modes (ductile or brittle) at the fatigue crack front.

2.4. Microstructural and Fractographic Observations

The microstructures of the base metal and HAZ were examined using optical microscopy (OM) and scanning electron microscopy (SEM). Prior to CTOD testing, metallographic observations were conducted to investigate the microstructural changes in the high-nitrogen steel base metal and welded regions. Specimens were mechanically polished and etched with 4% nital at room temperature for the OM and SEM observations. To investigate the presence and types of precipitates, additional replica specimens were prepared for transmission electron microscopy (TEM) analysis. The replica technique involved a two-step etching process: first, specimens were etched with AA solution (a mixture of acetyl acetate, tetramethylammonium chloride, and methanol); then, precipitates were extracted using a solution of 20% perchloric acid and 80% acetic acid. The extracted films were subsequently analyzed using TEM.
To analyze the morphology and composition of precipitates within the microstructure, TEM was employed using a replica technique. For this purpose, non-magnetic specimens were prepared by etching mechanically mirror-polished surfaces in an ascorbic acid-based solution (890 mL methanol + 100 mL acetylacetone + 10 g tetramethylammonium chloride). After etching, a carbon film was deposited onto the specimen surface. The carbon replica, with precipitates adhered to the film, was then separated in the AA solution and transferred onto copper grids for TEM observation.

3. Results and Discussion

3.1. Low-Temperature CTOD and Microstructure

3.1.1. Heat Input of 45 kJ/cm

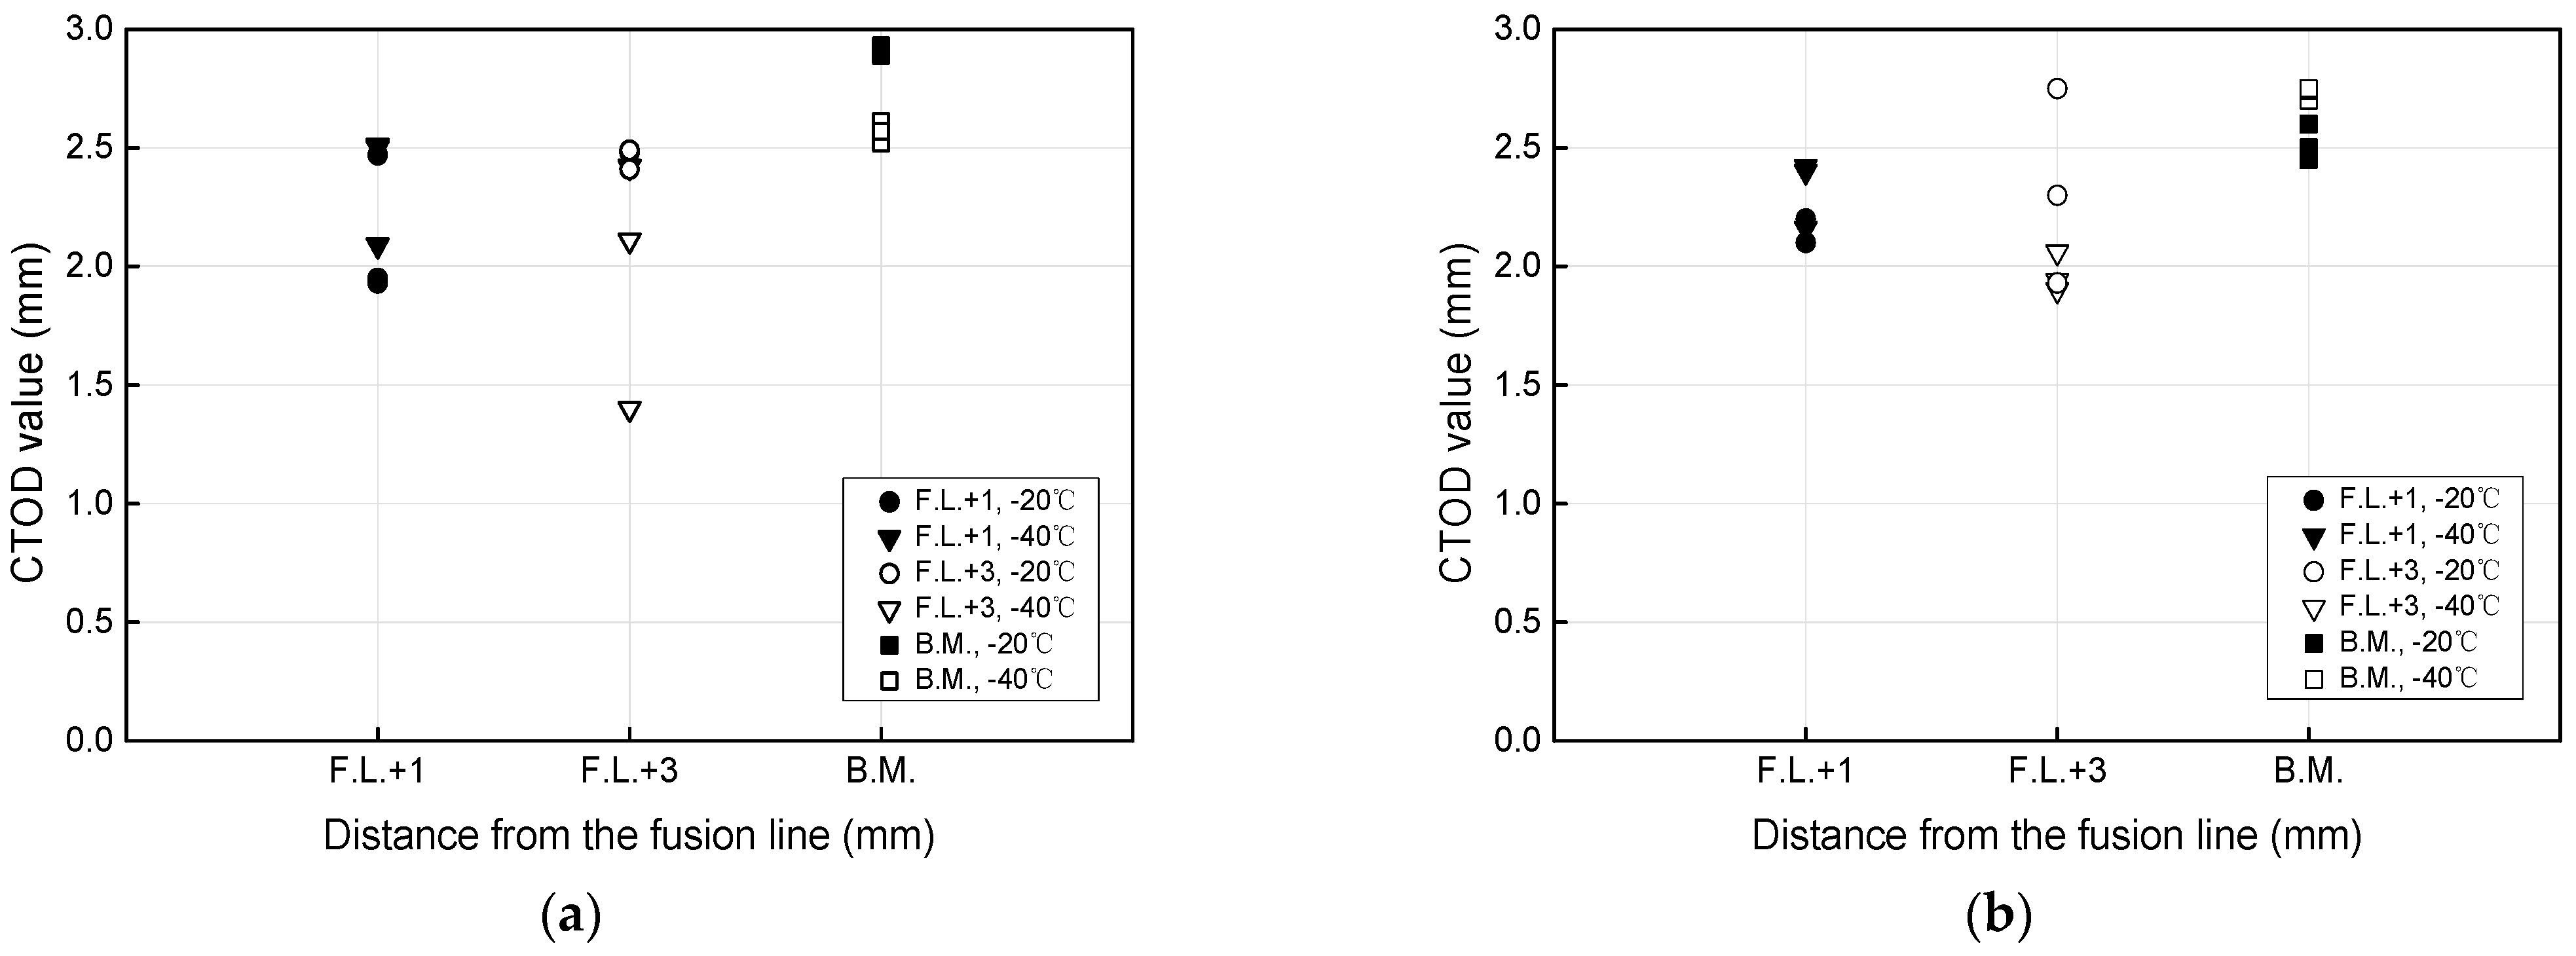
CTOD tests conducted at −20 °C and −40 °C for Steels A (0.09% C) and B (0.15% C), both welded with a heat input of 45 kJ/cm, yielded values ranging from 1.38 to 2.73 mm. These results are significantly higher than the typical value of approximately 1 mm reported for conventional 490 MPa-class structural steels [32,33].
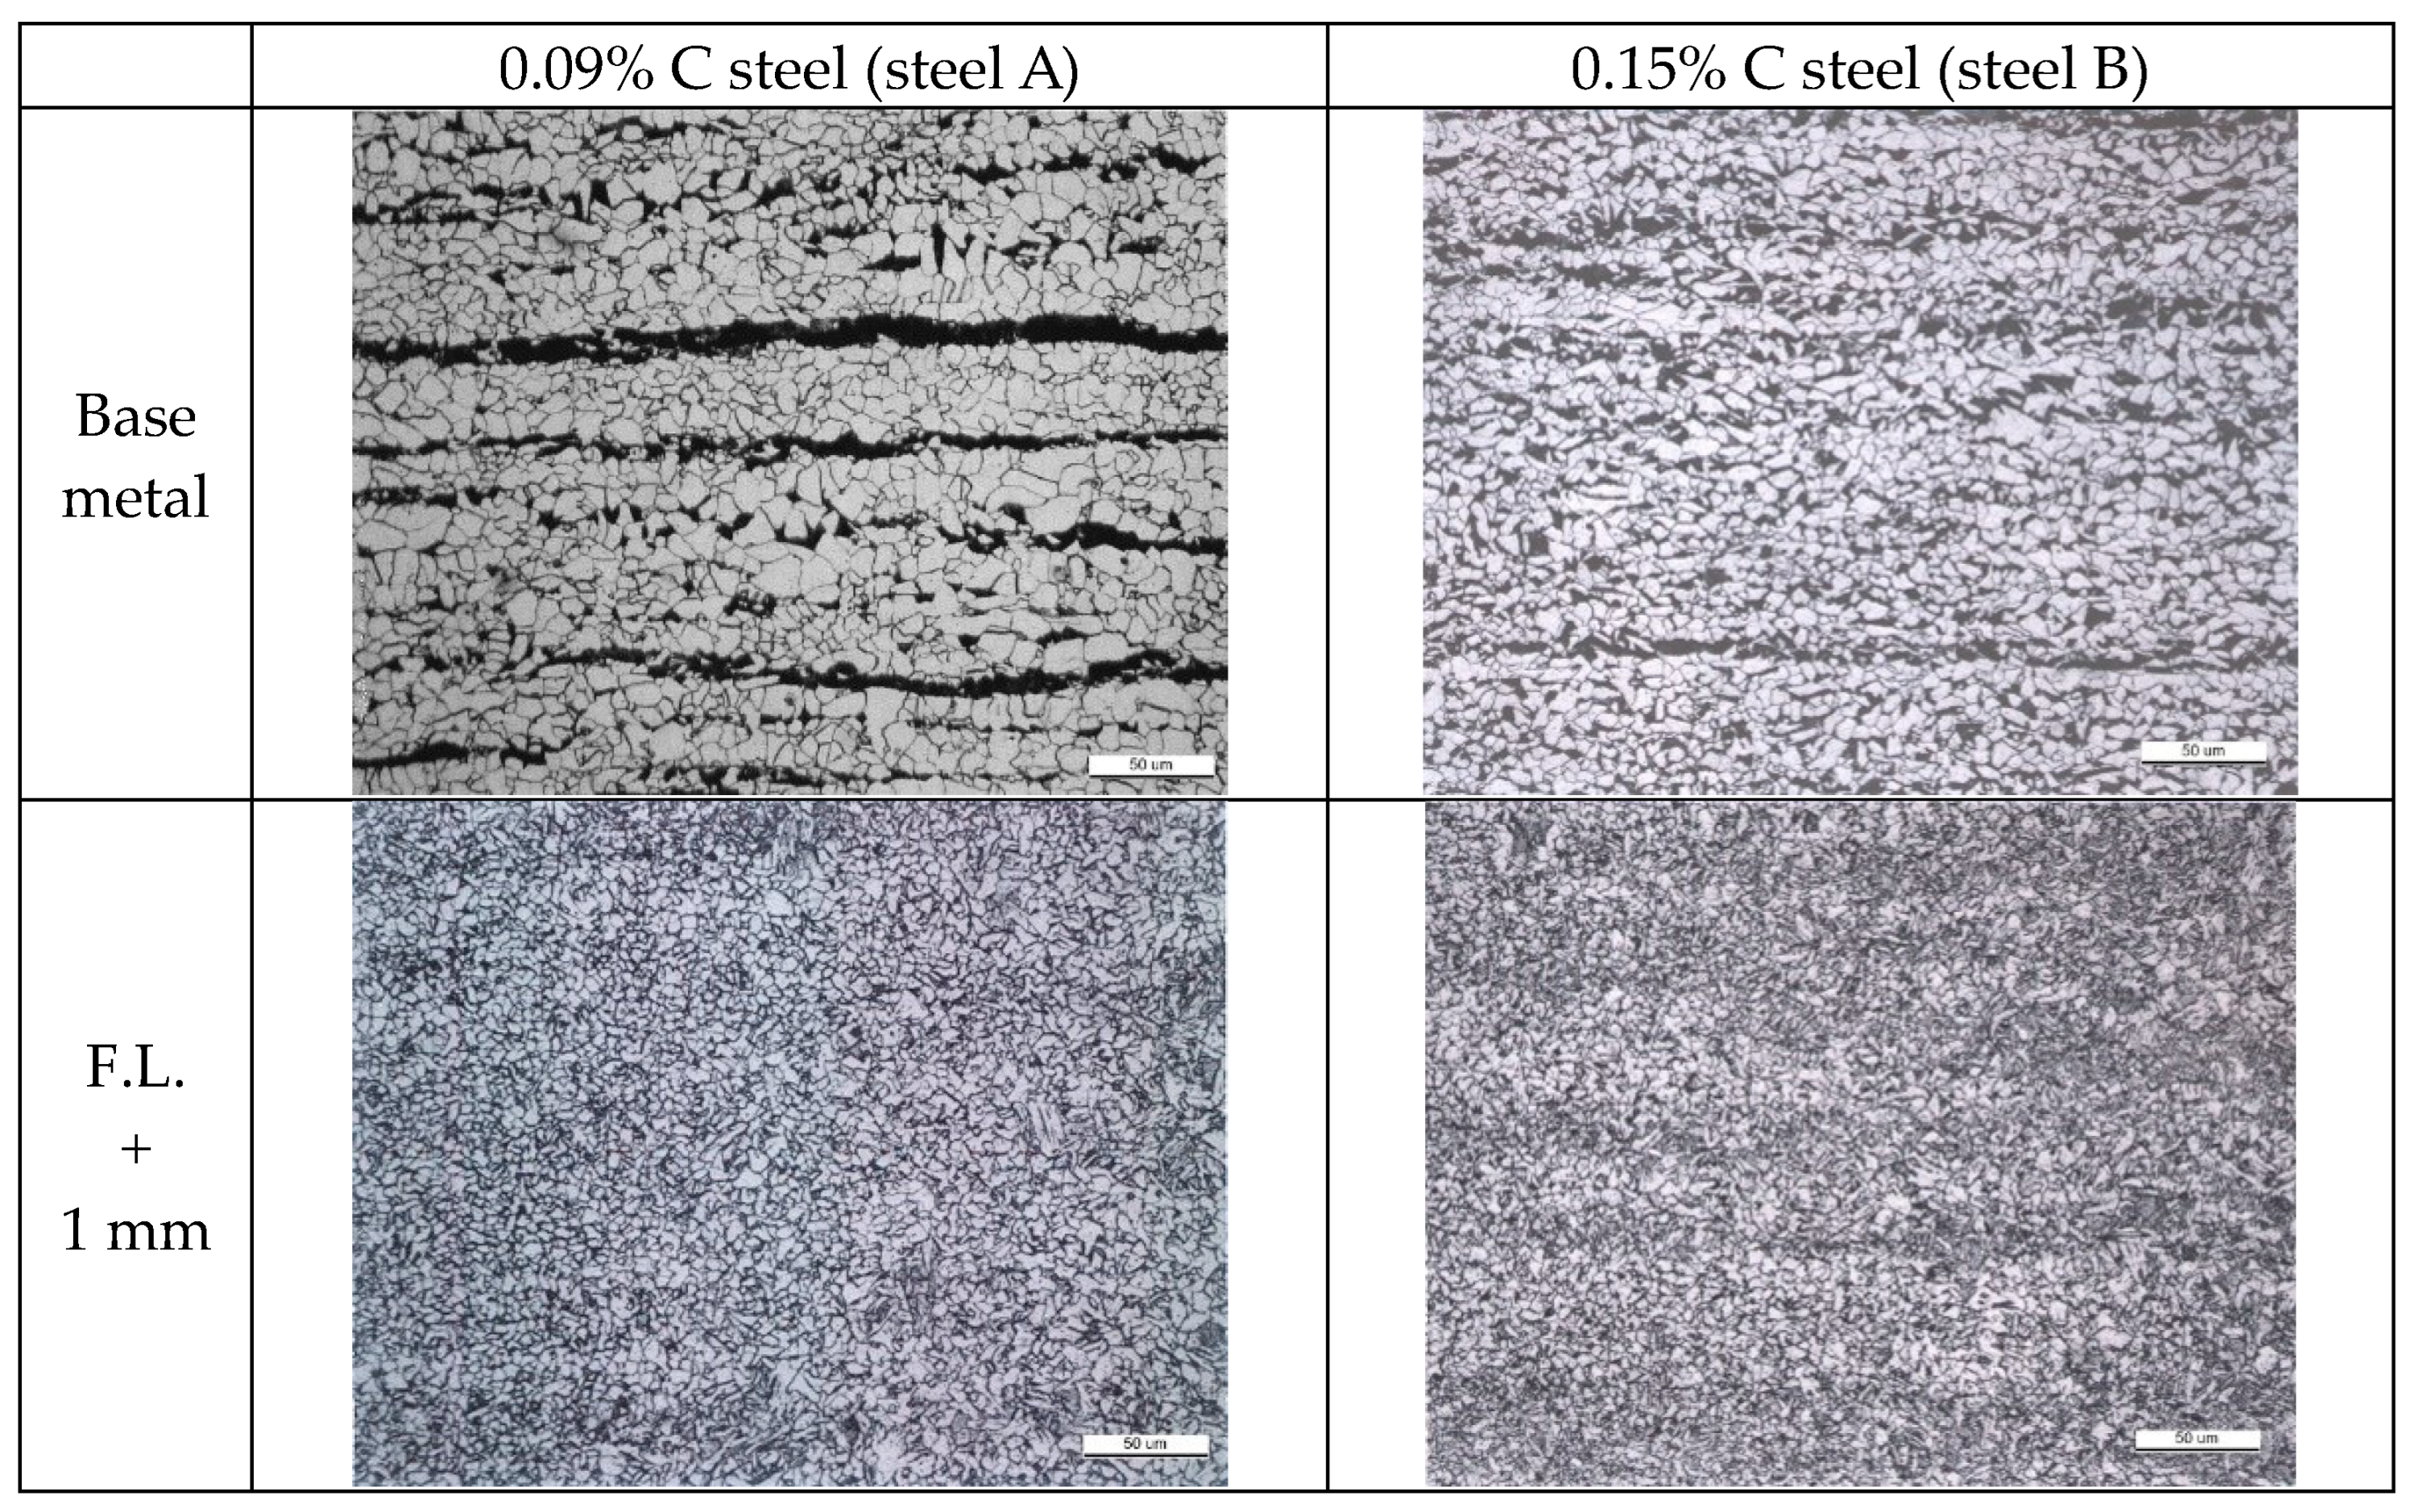
Unlike conventional carbon steels, where CTOD values tend to decrease with increasing carbon content, the high-nitrogen TiN steels tested in this study maintained stable CTOD performance regardless of carbon content and test temperature, as shown in Figure 5. Microstructural analysis revealed that Steel B, despite its higher carbon content, exhibited a finer grain structure in both the base metal and heat-affected zone (HAZ) compared to Steel A. Both an increase in carbon content and a finer grain size contribute to greater hardness and strength. However, these two factors can have opposing effects on toughness. In the case of Steel B, the significant grain refinement, a result of the fine precipitates, played a dominant role in enhancing toughness. This positive effect of grain refinement effectively mitigated the potential toughness degradation that would typically be expected from the increased hardness associated with its higher carbon content, leading to an overall improved toughness. The formation of complex TiCN particles, in addition to TiN precipitates in Steel B, is believed to have contributed to this enhanced refinement effect.
For Steel A, CTOD values were similar at 1 mm and 3 mm from the fusion line at both test temperatures. In contrast, Steel B exhibited higher CTOD values at 1 mm compared to 3 mm at −40 °C, despite the coarser microstructure typically expected closer to the fusion line.
Figure 6 shows optical micrographs of the HAZ microstructures observed at 1 mm and 3 mm from the fusion line. The grain size in the CGHAZ of Steel B was finer than that of Steel A. Unlike typical behavior in conventional carbon steels, abnormal grain coarsening in the CGHAZ was not observed. The overall HAZ microstructure primarily consisted of fine polygonal ferrite and pearlite. Although slight coarsening was observed near the fusion boundary, the overall grain size remained comparable to that of the base metal, likely due to the grain growth-inhibiting effect of thermally stable precipitates.
At 1 mm from the fusion line, both steels exhibited mixed microstructures containing fine and coarser polygonal ferrite. At 3 mm, the microstructure transitioned to fine polygonal ferrite and pearlite, closely resembling the base metal. The small differences in CTOD values between Steels A and B are attributed to the similarity in grain sizes within both the fine and coarse regions.
Micro-Vickers hardness measurements were conducted across the weld cross-section from the weld centerline to the base metal using a 500 g load and a dwell time of 12 s. Hardness profiles were measured at three thickness positions—1/4 t, 1/2 t, and 3/4 t—for each specimen. The average hardness values of the base metals for Steels A and B were 160 Hv and 170 Hv, respectively. No evidence of softening was observed in the HAZ for either steel.

3.1.2. Heat Input of 100 kJ/cm

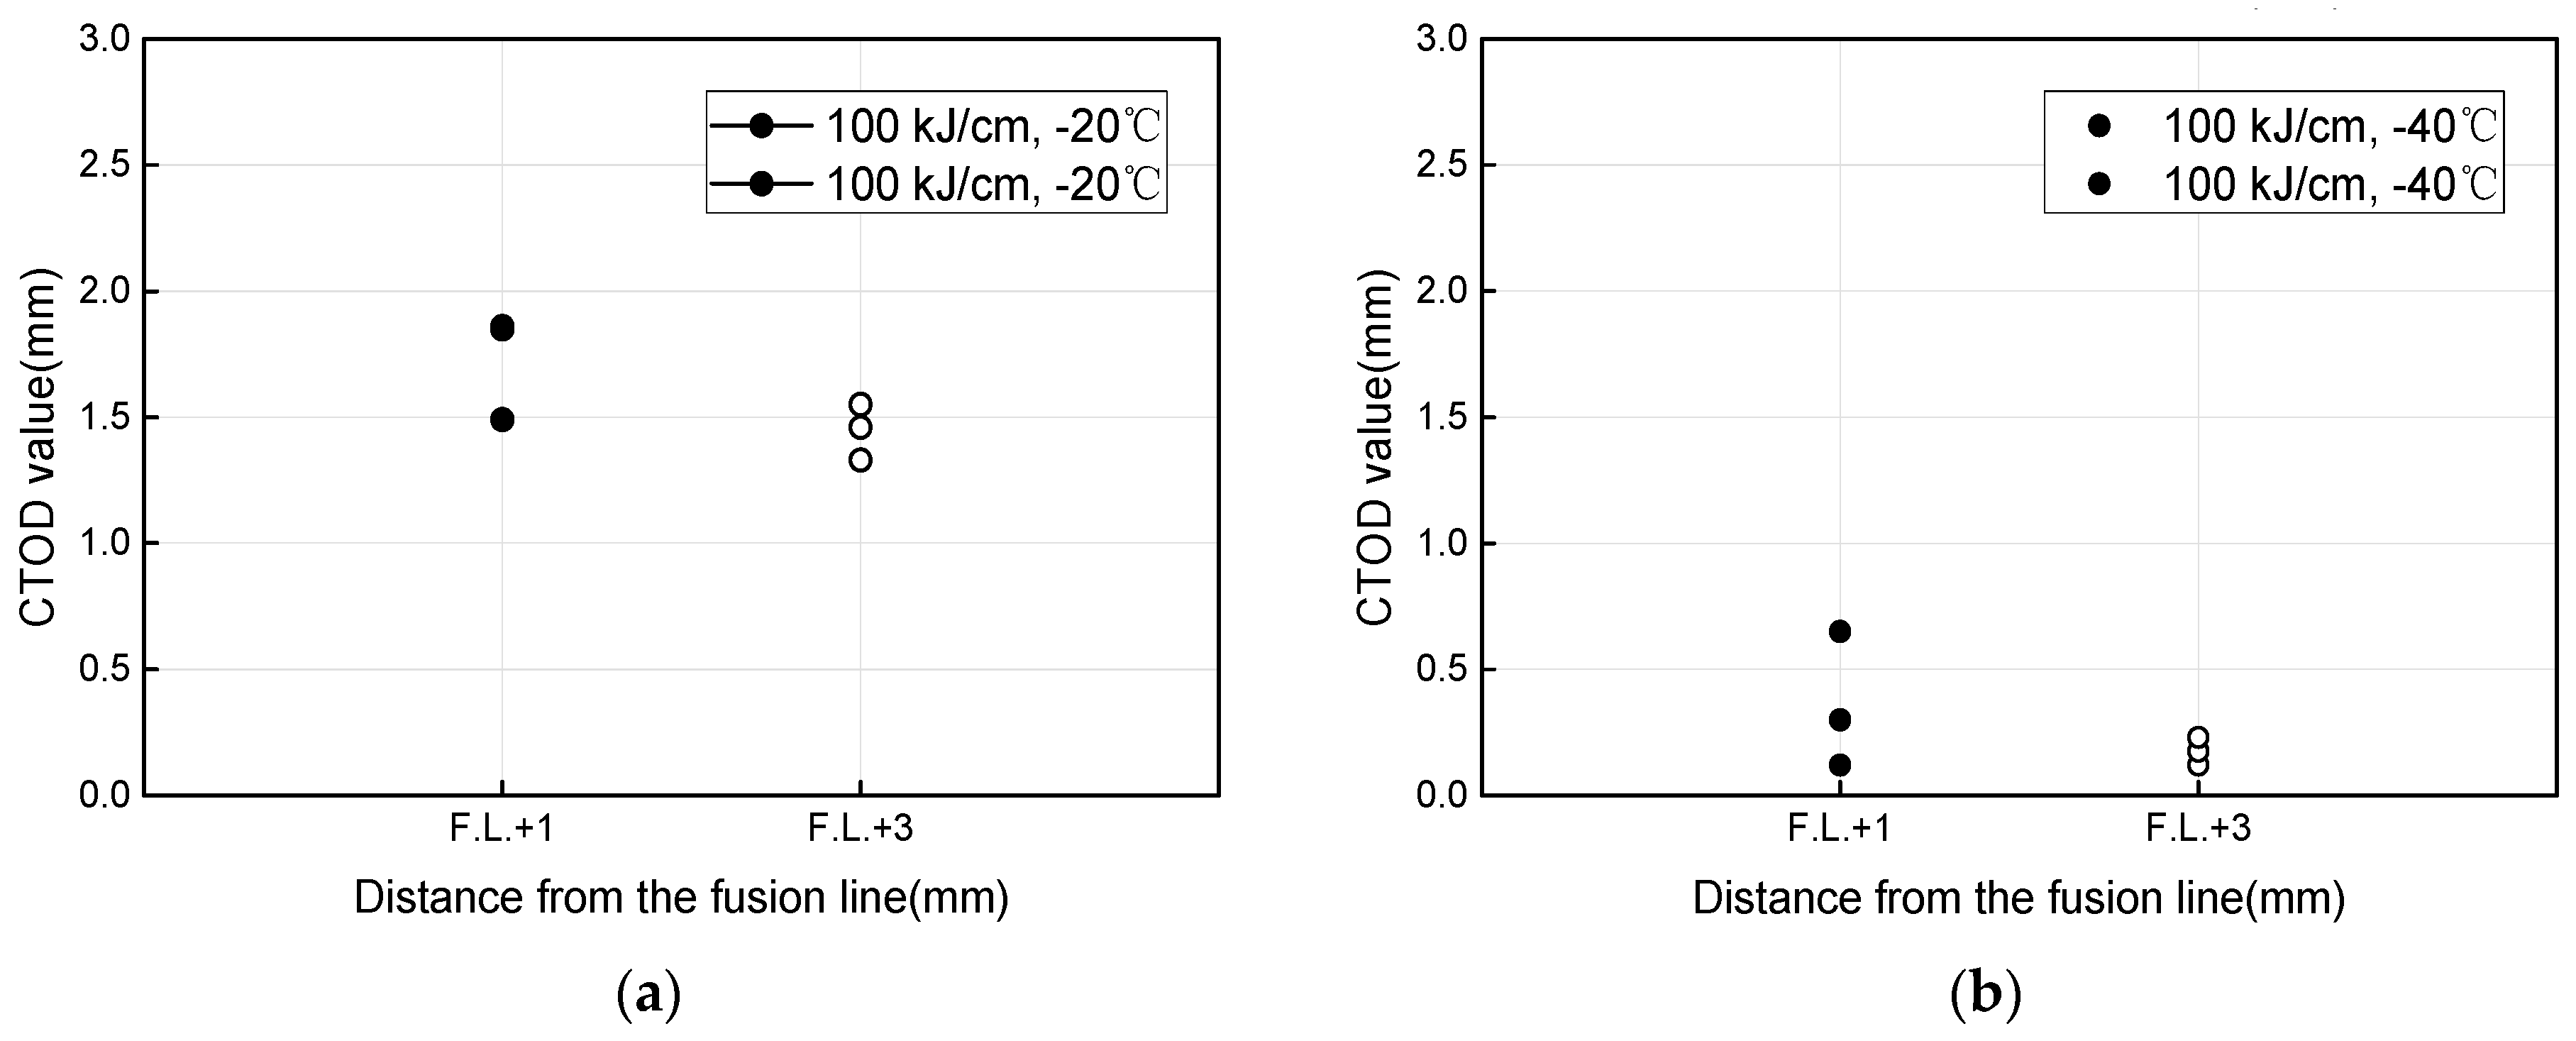
The CTOD test results for Steel C (0.11% C), welded with a heat input of 100 kJ/cm, are shown in Figure 7. The CTOD values were 1.5 mm at −20 °C and 0.3 mm at −40 °C, which are significantly lower than those of the specimens welded at 45 kJ/cm. This reduction in fracture toughness is due to partial dissolution of TiN particles during the high-heat-input welding process, which reduced their effectiveness in inhibiting austenite grain growth. As a result, coarser ferrite grains were formed in the heat-affected zone, leading to reduced low-temperature toughness.
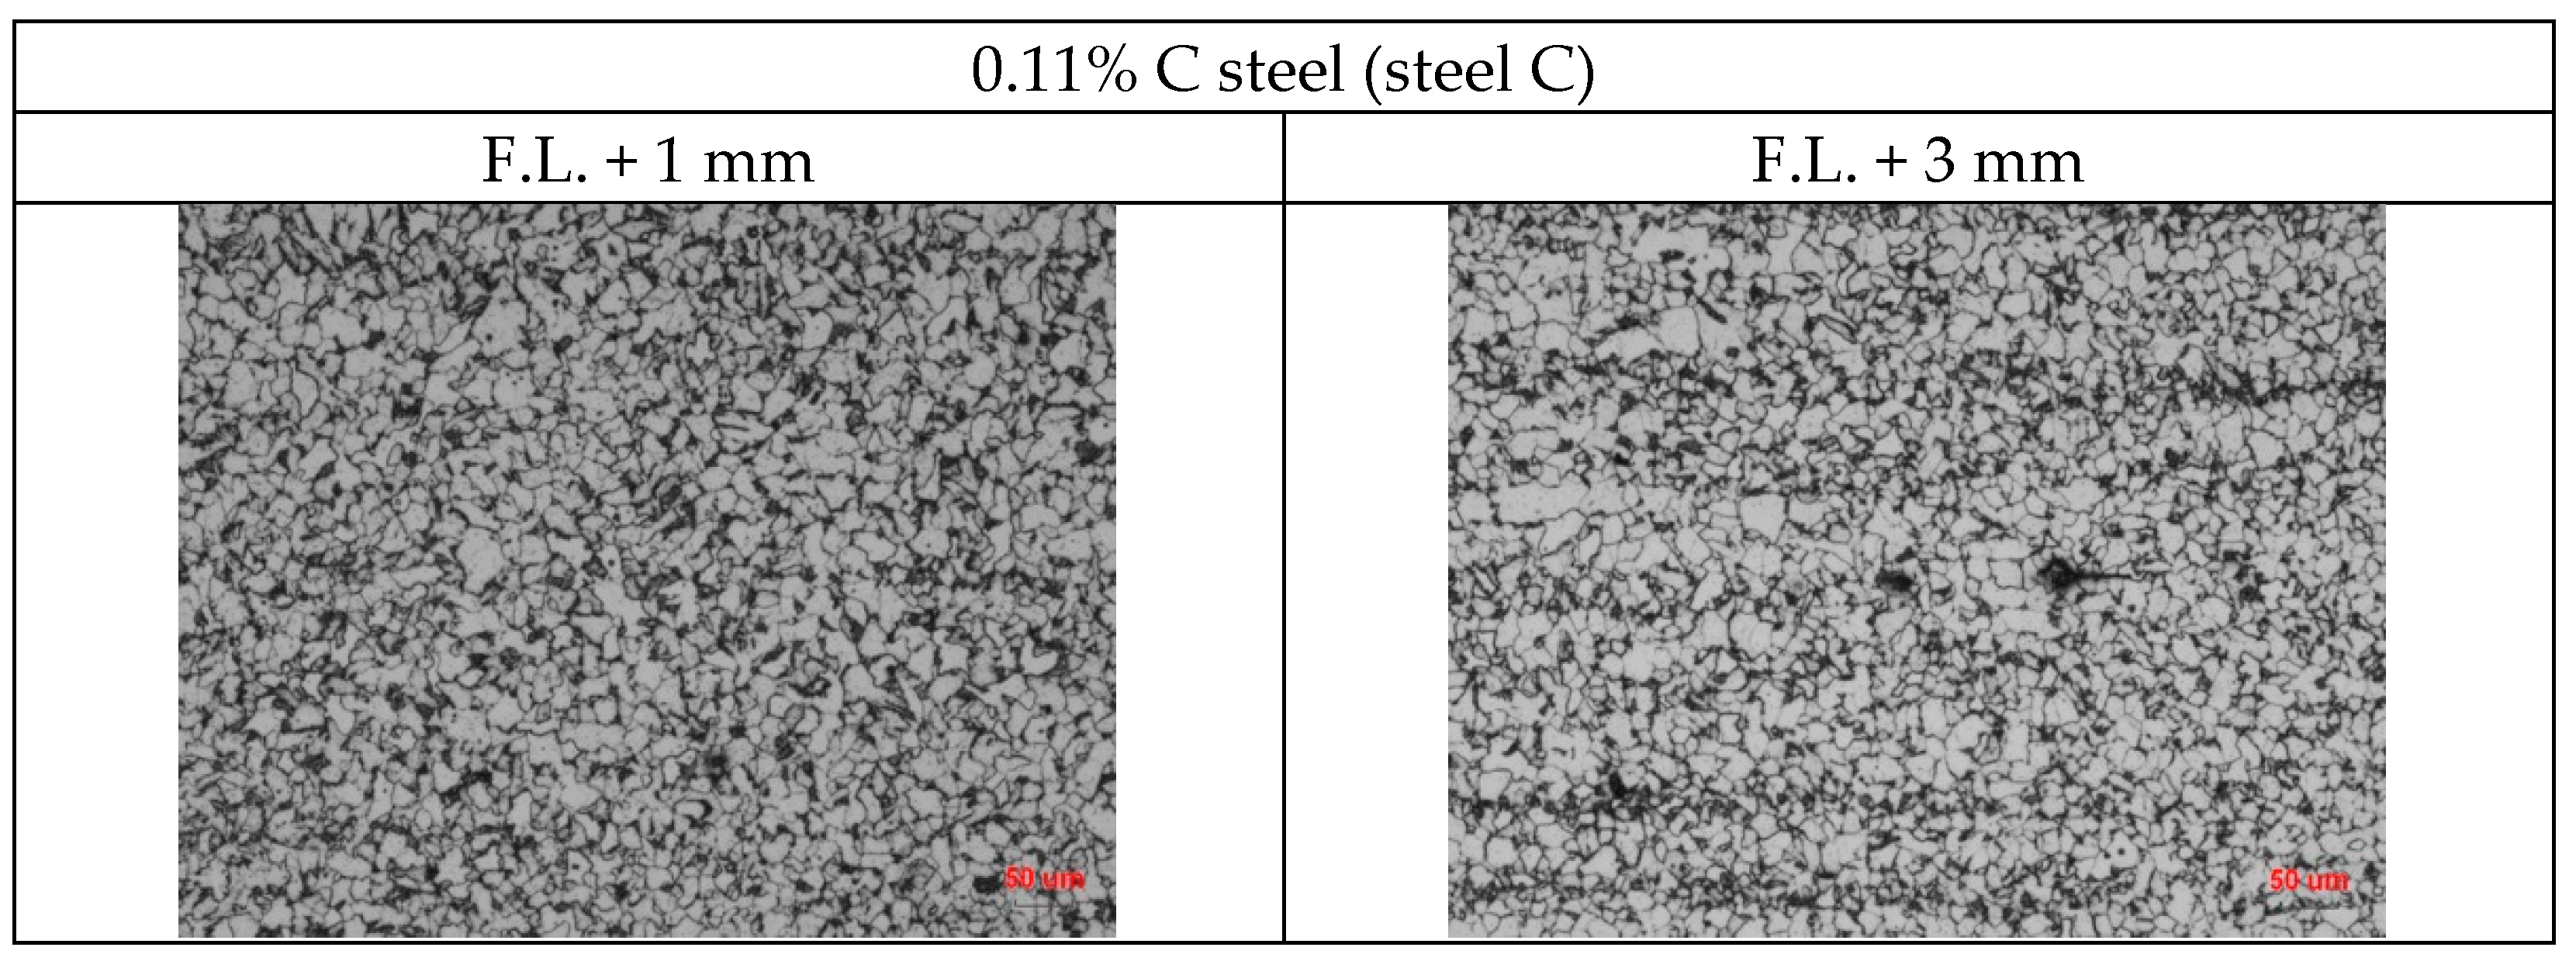
Figure 8 presents the microstructures of Steel C at 1 mm and 3 mm from the fusion line. No significant variation in microstructure was observed between the two locations, and the ferrite grains were larger than those in the 45 kJ/cm specimens. Although high heat input welding typically promotes substantial grain growth and a wider CGHAZ area, Steel C exhibited relatively fine grains and a narrower CGHAZ compared to conventional carbon steels welded under similar heat input conditions. This behavior is presumed to result from grain boundary pinning effects caused by fine precipitates present in the steel. To verify this mechanism, TEM analysis using the replica technique was conducted.

3.1.3. Fracture Observation

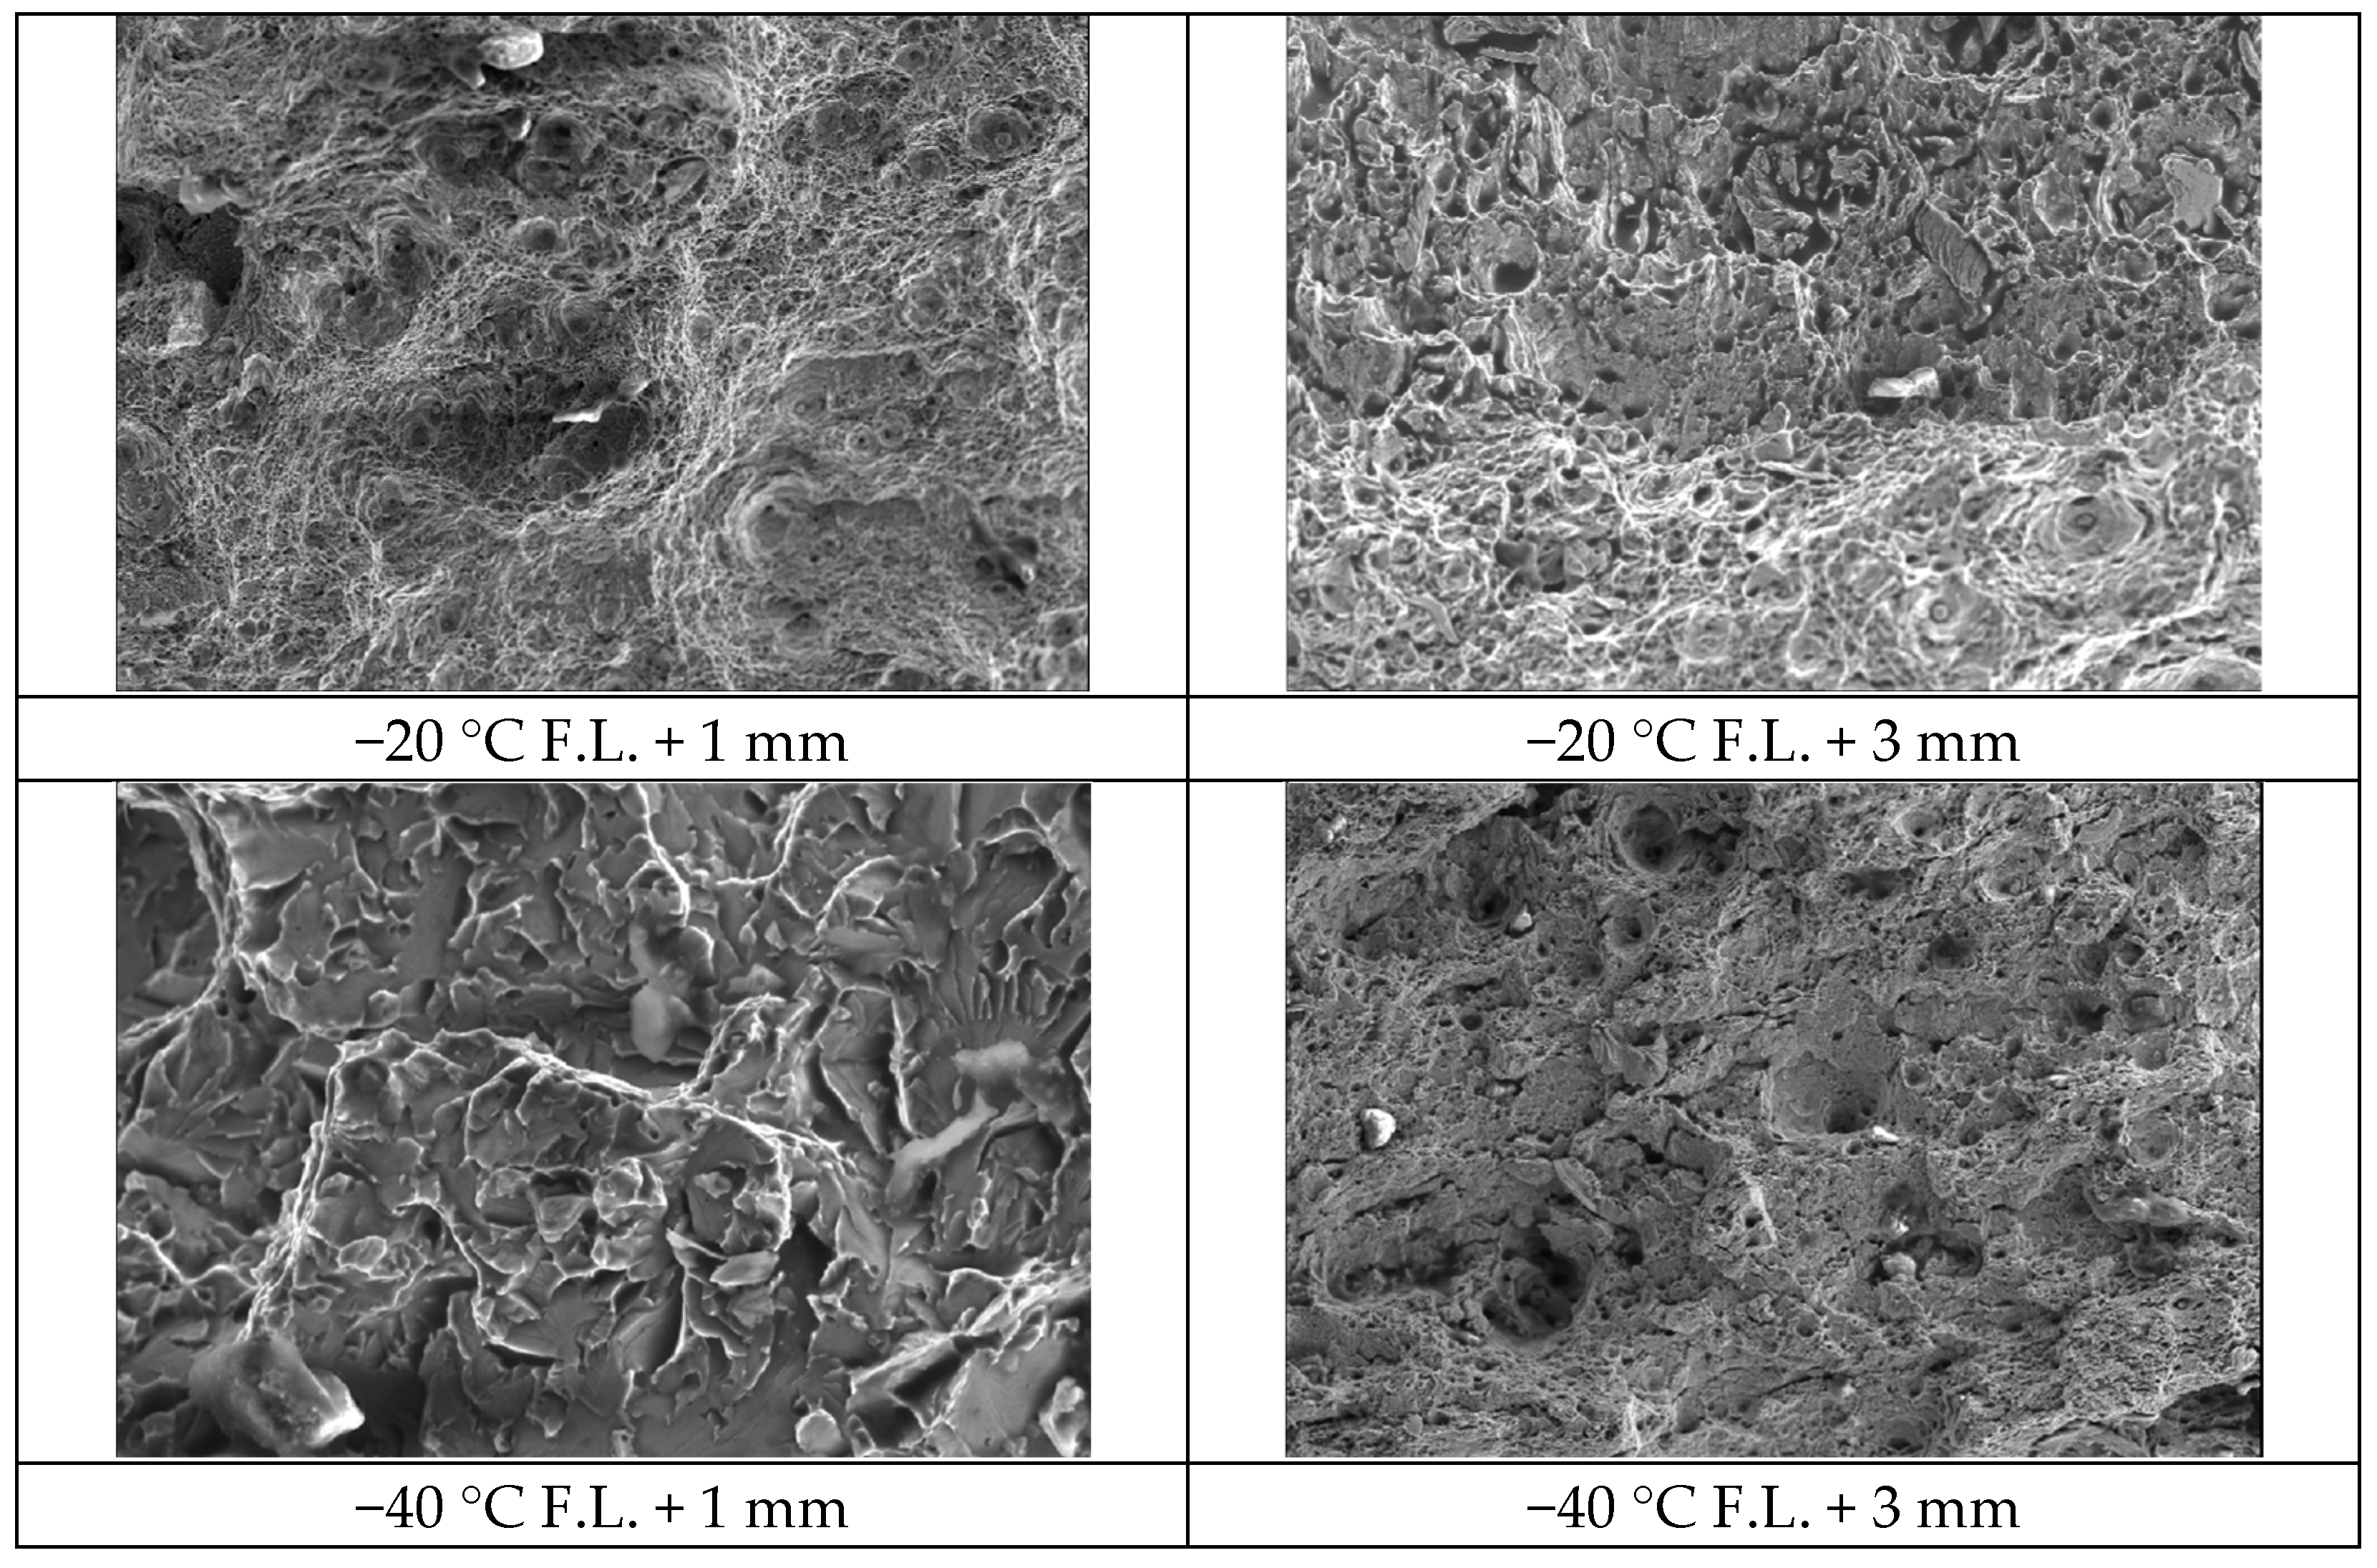
Figure 9 and Figure 10 show the SEM fractography of the stable fracture regions in Steels A and B after CTOD testing at −20 °C and −40 °C. Both steels exhibited a mixture of ductile and brittle fracture modes across most specimens, with no significant differences observed with respect to carbon content or distance from the fusion line.
At −20 °C, predominantly ductile fracture features were observed in both steels, while at −40 °C, a mixture of ductile tearing and cleavage fracture was more frequently seen. Overall, these results suggest that plastic deformation occurred near the notch tip at F.L. + 1 mm and that the fracture behavior was not strictly temperature-dependent. Instead, most specimens exhibited a mixed-mode fracture morphology regardless of test temperature or notch location.

3.1.4. TEM Analysis

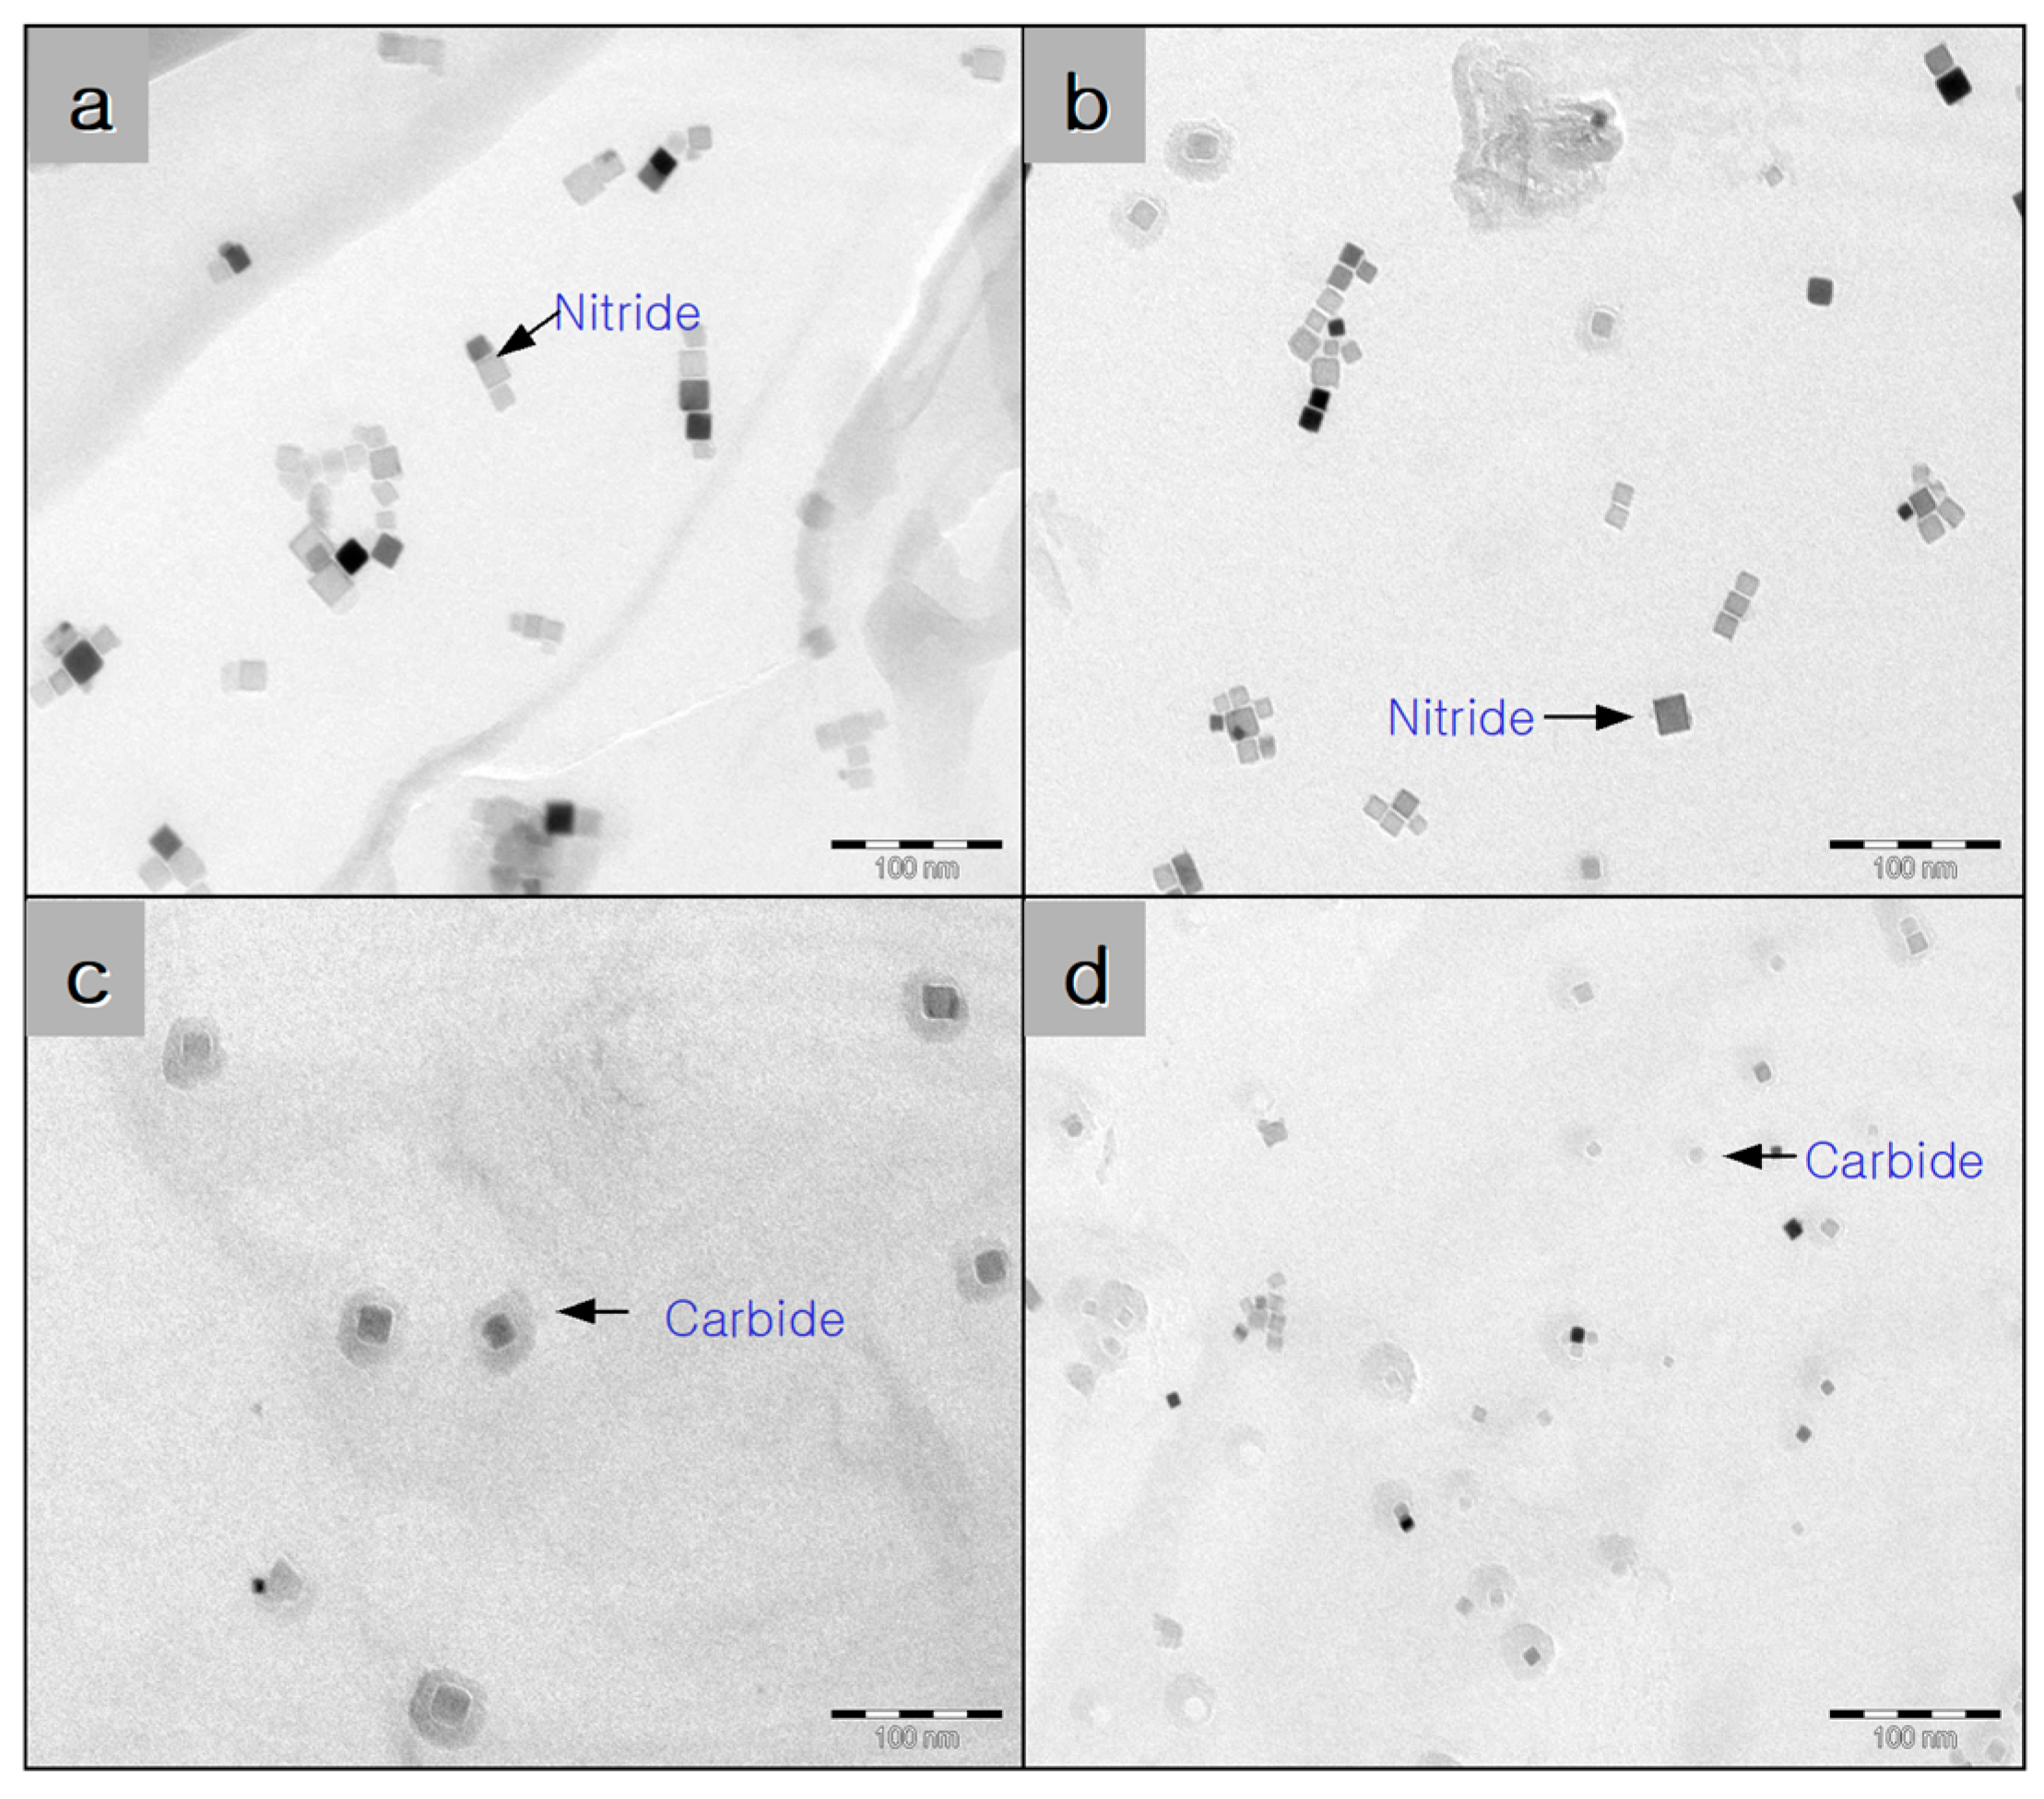
TEM (JEOL, ARM200) analysis of the HAZ conducted using the replica method revealed that finely dispersed precipitates were present in all specimens.
Selected area diffraction (SAD) patterns confirmed that the nanoscale precipitates, mostly smaller than 10–20 nm, were TiN. These fine TiN particles are believed to have played a significant role in pinning grain boundaries, thereby effectively inhibiting austenite grain growth even under high heat input welding conditions. This grain boundary pinning effect contributed to the maintenance of fine microstructures in the high-nitrogen steels.
However, notable differences in precipitate composition were observed between Steels A and B. As shown in Figure 11, Steel A (0.09% C) primarily contained TiN particles, which were effective in restricting grain growth. In contrast, Steel B (0.15% C) contained both TiN and additional carbide-based precipitates, such as TiC or complex TiCN particles. These additional carbides enhanced grain refinement and contributed to the superior balance of strength and toughness in Steel B. The presence of multiple types of stable precipitates in Steel B explains its stable CTOD values, despite its higher carbon content.

4. Conclusions

This study investigated the influence of carbon content and welding heat input on the fracture toughness of the HAZ in high-nitrogen TiN-containing steels. The key findings of this research lead to the following conclusions:
(1)
High-nitrogen TiN steels with carbon contents of 0.09% and 0.15% exhibited CTOD values ranging from 1.38 to 2.73 mm at −20 °C and −40 °C under a 45 kJ/cm heat input, demonstrating superior fracture toughness compared to conventional 490 MPa-class steels. This improvement is attributed to the uniform distribution of fine TiN precipitates, which effectively restricted austenite grain growth in the HAZ.
(2)
Specimens welded with a high heat input of 100 kJ/cm exhibited reduced CTOD values of 1.5 mm at −20 °C and 0.3 mm at −40 °C. This deterioration in toughness is attributed to the partial dissolution of TiN particles in the CGHAZ, which resulted in insufficient restriction of austenite grain growth.
(3)
Unlike conventional steels, high-nitrogen TiN steels did not show a reduction in CTOD values with increasing carbon content. This stability in toughness is attributed to the formation of TiCN particles in higher-carbon steels, which promoted microstructural refinement and mitigated the adverse effects of carbon.
(4)
Fracture surfaces of the HAZ after CTOD testing at −20 °C and −40 °C exhibited mixed ductile and brittle failure modes, with no significant variation observed across different carbon contents or distances from the fusion line.
These results highlight the potential of high-nitrogen TiN steels to improve the low-temperature toughness of welded offshore structures. However, further investigation is needed to mitigate TiN particle dissolution under high heat input conditions (>100 kJ/cm).

Author Contributions

Conceptualization and methodology, M.-S.O. and S.-M.J.; software, S.-M.J.; validation, M.-S.O. and S.-M.J.; formal analysis, M.-S.O.; investigation, Y.-G.K.; resources, Y.-G.K.; data curation, Y.-G.K.; writing—original draft preparation, S.-M.J. and Y.-G.K.; writing—review and editing, M.-S.O. and S.-M.J.; visualization, M.-S.O.; supervision, S.-M.J.; project administration, M.-S.O.; funding acquisition, S.-M.J. All authors have read and agreed to the published version of the manuscript.

Funding

This study was supported by a research fund from Chosun University (207179007-1).

Data Availability Statement

The original contributions presented in this study are included in the article. Further inquiries can be directed to the corresponding author.

Conflicts of Interest

The authors declare no conflicts of interest.

References

  1. Lan, L.; Kong, X.; Qiu, C.; Zhao, D. Influence of microstructural aspects on impact toughness of multi-pass submerged arc welded HSLA steel joints. Mater. Des. 2016, 90, 488–498. [Google Scholar] [CrossRef]
  2. Kitani, Y.; Ikeda, R.; Yasuda, K.; Oi, K.; Ichimiya, K. Improvement of HAZ Toughness for High Heat Input Welding by using Boron Diffusion from Weld Metal. Weld. World 2007, 51, 31–36. [Google Scholar] [CrossRef]
  3. Eom, H.W.; Won, J.Y.; Shin, S.Y. Effect of Cooling Rate on The Microstructure and Cryogenic Impact Toughness of HAZ in 9% Ni Steel. Korean J. Met. Mater. 2021, 59, 781–795. [Google Scholar] [CrossRef]
  4. Park, J.-S.; Hwang, J.-K.; Cho, J.Y.; Han, I.W.; Lee, M.J.; Kim, S.J. Effects of TiN and B on Grain Refinement of HAZ Microstructure and Improvement of Mechanical Properties of High-strength Structural Steel Under High Heat Input Welding. Korean J. Mater. Res. 2019, 29, 97–105. [Google Scholar] [CrossRef]
  5. Zhou, P.; Wang, B.; Wang, L.; Hu, Y.; Zhou, L. Effect of welding heat input on grain boundary evolution and toughness properties in CGHAZ of X90 pipeline steel. Mater. Sci. Eng. A 2018, 722, 112–121. [Google Scholar] [CrossRef]
  6. Ding, Q.; Wang, T.; Shi, Z.; Wang, Q.; Wang, Q.; Zhang, F. Effect of Welding Heat Input on the Microstructure and Toughness in Simulated CGHAZ of 800 MPa-Grade Steel for Hydropower Penstocks. Metals 2017, 7, 115. [Google Scholar] [CrossRef]
  7. Li, L.; Wang, Y.; Han, T.; Li, C. Embrittlement and toughening in CGHAZ of ASTM4130 steel. Science China Physics. Mech. Astron. 2011, 54, 1447–1454. [Google Scholar] [CrossRef]
  8. Qi, H.; Pang, Q.; Li, W.; Bian, S. Effect of high welding heat input on the microstructure and low-temperature toughness of heat affected zone in magnesium-treated EH36 steel. Sci. Rep. 2024, 14, 19459. [Google Scholar] [CrossRef]
  9. Li, Y.; Crowther, D.N.; Green, M.J.W.; Mitchell, P.S.; Baker, T.N. The Effect of Vanadium and Niobium on the Properties and Microstructure of the Intercritically Reheated Coarse Grained Heat Affected Zone in Low Carbon Microalloyed Steels. ISIJ Int. 2001, 41, 46–55. [Google Scholar] [CrossRef]
  10. Baker, T.N. Processes, microstructure and properties of vanadium microalloyed steels. Mater. Sci. Technol. 2009, 25, 1083–1107. [Google Scholar] [CrossRef]
  11. Kiviö, M.; Holappa, L.; Iung, T. Addition of Dispersoid Titanium Oxide Inclusions in Steel and Their Influence on Grain Refinement. Metall. Mater. Trans. B 2010, 41, 1194–1204. [Google Scholar] [CrossRef]
  12. Xie, K.Y.; Zheng, T.; Cairney, J.M.; Kaul, H.; Williams, J.G.; Barbaro, F.J.; Killmore, C.R.; Ringer, S.P. Strengthening from Nb-rich clusters in a Nb-microalloyed steel. Scr. Mater. 2012, 66, 710–713. [Google Scholar] [CrossRef]
  13. Hu, J.; Du, L.-X.; Wang, J.-J.; Gao, C.-R. Effect of welding heat input on microstructures and toughness in simulated CGHAZ of V–N high strength steel. Mater. Sci. Eng. A 2013, 577, 161–168. [Google Scholar] [CrossRef]
  14. Haslberger, P.; Ernst, W.; Schneider, C.; Holly, S.; Schnitzer, R. Influence of inhomogeneity on several length scales on the local mechanical properties in V-alloyed all-weld metal. Weld. World 2018, 62, 1153–1158. [Google Scholar] [CrossRef]
  15. Huang, Y.; Cheng, G.-G.; Li, S.-J.; Dai, W.-X.; Xie, Y. Effect of Ti(C, N) Particle on the Impact Toughness of B-Microalloyed Steel. Metals 2018, 8, 868. [Google Scholar] [CrossRef]
  16. Wang, X.; Wang, C.; Kang, J.; Yuan, G.; Misra, R.D.K.; Wang, G. Improved toughness of double-pass welding heat affected zone by fine Ti–Ca oxide inclusions for high-strength low-alloy steel. Mater. Sci. Eng. A 2020, 780, 139198. [Google Scholar] [CrossRef]
  17. Wang, J.; Li, C.; Wang, D.; Di, X. Effect of microalloying with Nb and/or V on the microstructure and mechanical properties of GPa grade deposited metals. Weld. World 2023, 67, 2107–2122. [Google Scholar] [CrossRef]
  18. Zhang, J.; Xin, W.; Ge, Z.; Luo, G.; Peng, J. Effect of high heat input welding on the microstructures, precipitates and mechanical properties in the simulated coarse grained heat affected zone of a low carbon Nb-V-Ti-N microalloyed steel. Mater. Charact. 2023, 199, 112849. [Google Scholar] [CrossRef]
  19. Hu, B.; Wang, Q.; Li, F.; Wang, Q.; Liu, R. Refinement mechanism of large heat-input welding CGHAZ microstructure by N addition and its effect on toughness of a V-Ti-N microalloying weathering steel. Mater. Sci. Eng. A 2024, 892, 146019. [Google Scholar] [CrossRef]
  20. Jiang, J.; Zhang, Z.; Guo, K.; Guan, Y.; Yuan, L.; Wang, Q. Effect of Nb Content on the Microstructure and Impact Toughness of High-Strength Pipeline Steel. Metals 2024, 14, 42. [Google Scholar] [CrossRef]
  21. Wang, Z.; Li, X.; Wang, X.; Shang, C.; Zhang, Y. Studies on the effect of Nb on microstructure refinement and impact toughness improvement in coarse-grained heat-affected zone of X80 pipeline steels. Mater. Today Commun. 2025, 42, 111605. [Google Scholar] [CrossRef]
  22. Kundu, A. Austenite Grain Boundary Pinning during Reheating by Mixed AlN and Nb(C,N) Particles. ISIJ Int. 2014, 54, 677–684. [Google Scholar] [CrossRef]
  23. Nabavi, B.; Goodarzi, M.; Khan, A.K. Investigation of secondary phases and tensile strength of nitrogen-containing Alloy 718 weldment. International Journal of Minerals. Metall. Mater. 2020, 27, 1259–1268. [Google Scholar] [CrossRef]
  24. Webel, J.; Mohrbacher, H.; Detemple, E.; Britz, D.; Mücklich, F. Quantitative analysis of mixed niobium-titanium carbonitride solubility in HSLA steels based on atom probe tomography and electrical resistivity measurements. J. Mater. Res. Technol. 2022, 18, 2048–2063. [Google Scholar] [CrossRef]
  25. Chapa, M.; Medina, S.F.; López, V.; Fernández, B. Influence of Al and Nb on Optimum Ti/N Ratio in Controlling Austenite Grain Growth at Reheating Temperatures. ISIJ Int. 2002, 42, 1288–1296. [Google Scholar] [CrossRef]
  26. Wan, X.; Zhou, B.; Nune, K.C.; Li, Y.; Wu, K.; Li, G. In-situ microscopy study of grain refinement in the simulated heat-affected zone of high-strength low-alloy steel by TiN particle. Sci. Technol. Weld. Join. 2017, 22, 343–352. [Google Scholar] [CrossRef]
  27. Zhu, Z.X.; Kuzmikova, L.; Marimuthu, M.; Li, H.J.; Barbaro, F. Role of Ti and N in line pipe steel welds. Sci. Technol. Weld. Join. 2013, 18, 1–10. [Google Scholar] [CrossRef]
  28. Zhu, Z.X.; Marimuthu, M.; Kuzmikova, L.; Li, H.; Barbaro, F.; Zheng, L.; Bai, M.Z.; Jones, C. Influence of Ti/N ratio on simulated CGHAZ microstructure and toughness in X70 steels. Sci. Technol. Weld. Join. 2013, 18, 45–51. [Google Scholar] [CrossRef]
  29. Gui, L.; Chen, D.; Liu, P.; Liu, T.; Long, M.; Duan, H.; Cao, J. Precipitation of Ti-C-N Particles in Austenite During Cooling Process of High-Ti Microalloyed Steel; Materials Science and Technology Conference and Exhibition: Columbus, OH, USA, 2017; pp. 900–907. [Google Scholar]
  30. ASTM E1290–08; Standard Test Method for Crack-Tip Opening Displacement (CTOD) Fracture Toughness Measurement. ASTM International: West Conshohocken, PA, USA, 2008.
  31. ASTM E8–16a; Standard Test Methods for Tension Testing of Metallic Materials. ASTM International: West Conshohocken, PA, USA, 2016.
  32. Ichimiya, K.; Hase, K.; Endo, S.; Yuga, M.; Hirata, K.; Matsunaga, N.; Suzuki, S. Steel Plates with Excellent HAZ Toughness for Offshore Structure. In Proceedings of the International Conference on Offshore Mechanics and Arctic Engineering, Nantes, France, 25–30 June 2013. [Google Scholar]
  33. Komizo, Y.-I.; Fukada, Y. CTOD properties and M-A constituent in the HAZ of C-Mn microalloyed steel. Q. J. Jpn. Weld. Soc. 1988, 6, 41–46. [Google Scholar] [CrossRef]
Figure 1. Welding groove and sectional dimensions.
Metals 15 00916 g001
Figure 2. Specimen configurations for CTOD testing.
Metals 15 00916 g002
Figure 3. Locations of notches in CTOD specimens.
Metals 15 00916 g003
Figure 4. CTOD measurement setup.
Metals 15 00916 g004
Figure 5. Relationship between CTOD values and distance from the fusion line for (a) 0.09% C and (b) 0.15% C steels.
Metals 15 00916 g005
Figure 6. Microstructures at different distances from the fusion line for 0.09% C and 0.15% C steels.
Metals 15 00916 g006aMetals 15 00916 g006b
Figure 7. CTOD values for Steel C (0.11% C) at different distances from the fusion line under test temperatures of (a) −20 °C and (b) −40 °C.
Metals 15 00916 g007
Figure 8. Microstructures at different distances from the fusion line for 0.11% C steel.
Metals 15 00916 g008
Figure 9. Fractography of 0.09% C steel specimens at different temperatures and distances from the fusion line (×200).
Metals 15 00916 g009
Figure 10. Fractography of 0.15% C steel specimens at different temperatures and distances from the fusion line (×200).
Metals 15 00916 g010
Figure 11. TEM images of base metal and HAZ for steels welded at 45 kJ/cm: (a) 0.09% C, base metal; (b) 0.09% C, HAZ; (c) 0.15% C, base metal; (d) 0.15% C, HAZ.
Metals 15 00916 g011
Table 1. Chemical compositions of steels used in the experiment (wt.%).
SteelCSiMnPSTot-
Al
Sol-
Al
TiB
(ppm)
N
(ppm)
Ti/NCeq 1
A0.090.121.480.0080.0030.0500.0470.019101301.50.34
B0.150.121.490.0090.0030.0600.0570.017101101.60.40
C0.110.491.500.0080.0030.0600.0570.017101101.50.38
1 Ceq (%) = C + Mn/6 + (Cr + Mo + V)/5 + (Ni + Cu)/15 [IIW].
Table 2. Mechanical properties of steels used in the experiment.
SteelThickness
(mm)
YP
(MPa)
TS
(MPa)
YR
(%)
El.
(%)
vE−40 °C
(J)
A403514607634286
B403835187439235
C404055227827244
Table 3. Applied welding conditions.
SteelsHeat InputNo. of
Passes
Groove
Angle
Current
(A)
Voltage
(V)
Welding Speed
(cm/min)
A, B45 kJ/cm860° K-groove6503631
C100 kJ/cm445° K-groove9003619
Disclaimer/Publisher’s Note: The statements, opinions and data contained in all publications are solely those of the individual author(s) and contributor(s) and not of MDPI and/or the editor(s). MDPI and/or the editor(s) disclaim responsibility for any injury to people or property resulting from any ideas, methods, instructions or products referred to in the content.