Abstract
The impact of final surface preparation immediately prior to hydrogen content measurements in aluminum alloy samples was investigated using thermal desorption analysis (TDA). Samples ground in water showed an apparent hydrogen signal. Glow-discharge optical emission spectroscopy (GDOES) confirmed that the analyzed hydrogen originated from the subsurface layer. X-ray photoelectron spectroscopy (XPS) revealed the presence of a thin aluminum oxide/hydroxide layer on the surface. Formation of these compounds indicates that hydrogen was introduced into the material by the reaction of oxide-free aluminum with water molecules during the grinding, followed by its entrapment at near-surface interstitial lattice sites. Chemical pickling in concentrated nitric acid and combined grinding, chemical pickling, and electrochemical polishing approaches are proposed as proper surface-preparation techniques for samples without and with adherent corrosion products, respectively.
1. Introduction
Hydrogen embrittlement (HE) can degrade mechanical properties of aluminum alloys when exposed to aqueous environments, water vapor, or hydrogen gases [1]. Despite the ongoing debate on the exact mechanism of HE [1,2,3,4,5], there is an agreement that the extent of degradation correlates with the hydrogen concentration in materials. Total and diffusible hydrogen contents are measured using mostly thermal desorption analysis (TDA) or spectroscopy (TDS) [3,6,7,8]. A sample is heated to induce hydrogen release to carrier gas, which is subsequently analyzed using a thermal conductivity detector or mass spectrometer of the instrument. These techniques provide information about the amount of hydrogen and energy of trap sites [9]. To ensure accurate results, TDA/TDS devices must be calibrated, measurements taken immediately after hydrogen charging, and surfaces cleaned to remove contaminants and corrosion products. They usually contain hydrogen atoms which would be falsely interpreted as being present in the material structure. The surface preparation procedure must be carried out in such a way that it does not introduce any additional atomic hydrogen into the sample. The impact of surface preparation on the evaluation of hydrogen content in steel has been previously investigated. Silva et al. [10] reported that grinding can introduce a significant amount of hydrogen into steel. During TDS analysis, a 74% increase was observed in Peak 2, located between 600 and 700 K, which is associated with hydrogen at the interface with non-metallic inclusions. Additionally, grinding resulted in a 142% increase in total hydrogen content. Additionally, Arroyo et al. [11] noted that cleaning samples in hydrochloric acid should be avoided, as it can cause a noticeable increase in hydrogen uptake.
However, a review of the literature reveals a lack of information regarding appropriate surface preparation methods performed immediately prior to TDA for hydrogen content measurements in aluminum alloys. This gap is critical, as some studies suggest that grinding aluminum alloys can also increase their hydrogen content [12,13], potentially leading to significant scatter in reported hydrogen values. This study aims to raise an awareness of the importance of surface preparation for the proper hydrogen content quantification in aluminum alloys. Besides TDA, glow-discharge optical emission spectroscopy (GDOES) and X-ray photoelectron spectroscopy (XPS) were employed to obtain supporting data on surface modifications induced by the investigated preparation methods.
2. Materials and Methods
Al-2Cu cast cylindrical samples with a diameter of 20 mm and thickness of 5 mm were annealed at 500 °C for 3 h, quenched in water, and aged at 200 °C for 50 h. The tested surface preparation procedures are listed in Table 1. Method 1 involved only degreasing and drying steps to obtain information about the hydrogen content of the as-received sample. These steps, which were also applied in all other preparation procedures, consisted of spraying the samples with acetone followed by drying with pressurized air for 10 s. Method 2 involved manual grinding of the base and top surfaces for 1 min each with P400 SiC grit paper in laboratory air at relative humidity of 50 ± 5% and a temperature of 23 ± 1 °C. Manual grinding is typically preferred over automatic grinding, due to sample fixation issues and time constraints before hydrogen content measurements. Furthermore, to investigate the effect of grinding media on hydrogen content and to minimize excessive heating associated with dry grinding, method 2 was repeated using conventional lubricants, specifically water (method 3), ethanol (method 4), and acetone (method 5). Method 6 implemented chemical pickling for 5 min in concentrated nitric acid (65 wt.%), using an ultrasonic bath. This procedure is commonly used for removing corrosion products from Al alloys [14,15,16]. As a comprehensive preparation method, method 7 combined the procedures described for methods 3 and 6, with the addition of an electrochemical polishing step. Electrochemical polishing was carried out by applying a current of 160 mA·cm−2 for a total duration of 2 min in a solution containing 45 wt.% nitric acid, 39 wt.% methanol, and 16 wt.% demineralized water. A platinum electrode was used as the cathode during this process. Due to the toxicity and volatility of methanol and the corrosive nature of nitric acid, all polishing procedures were performed in a well-ventilated fume hood, using appropriate personal protective equipment. Proper waste-disposal protocols were strictly followed. Both chemical and electrochemical pickling were performed in 200 mL solution to provide a volume-to-metal surface ratio of 20 mL·cm−2. Using each surface preparation technique, three samples were prepared.

Table 1.
Description of surface preparation methods.
The hydrogen content was evaluated by a Bruker G8 GALILEO TDA analyzer (Billerica, MA, USA) with detection limit of 120 ppb, calculated based on calibration points and weight of the samples. Spectra were obtained by heating a specimen from 30 °C to 600 °C at a constant heating rate of 300 °C·h−1 followed by isothermal heating at 600 °C until full degassing. Additionally, the desorption energy Ed of trap sites was calculated by heating from 30 °C to 600 °C at three different heating rates of 100, 200, and 300 °C·h−1. Subsequently, the desorption energy was estimated in accordance with the Kissinger method, based on the shift of the peak temperature at different heating rates, using Equation (1) [17]:
where φ is the heating rate, Tm is the temperature of the desorption peak and R is the gas constant.
Hydrogen distribution in the surface layer was determined by depth profiling, using a Horiba Jobin Yvon GD Profiler II GDOES instrument (Palaiseau, France) on samples treated with methods 1, 3 and 7. Additionally, the surface state of samples prepared by method 3 was analyzed by X-ray photoelectron spectroscope EscalabTM 250Xi from Thermo ScientificTM (Waltham, MA, USA). The analysis was conducted under ultra-high vacuum conditions (10−9 mbar) with a mono-chromated Al Kα X-ray source (hv = 1486.6 eV) and X-ray spot size 900 µm. High-resolution spectra were measured with a step of 0.1 eV at pass energy of 20 eV. Binding energies were corrected to the reference C 1s peak at 285.0 eV. Thermo ScientificTM Avantage software (v 6.5.1) was used for data treatment.
3. Results
3.1. Microstructure
A scanning electron microscopy (SEM) image of Al-2Cu after heat treatment is presented in Figure 1. The microstructure was composed of needle-shaped Al2Cu phases in the aluminum matrix [18,19].
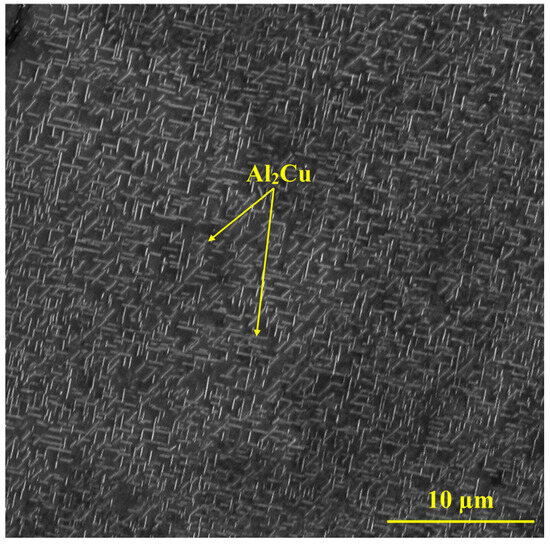
Figure 1.
SEM image of heat-treated Al-2Cu alloy.
3.2. TDA
TDA spectra of differently treated samples are plotted in Figure 2a. The samples subjected only to degreasing (method 1), along with the samples ground in air (method 2), ethanol (method 4), and acetone (method 5), showed no detectable hydrogen. Likewise, the samples treated by immersion in concentrated HNO3 (method 6) contained no measurable hydrogen. However, the samples ground in water showed a clear hydrogen signal, with the hydrogen evolution initiating at approximately 100 °C. The hydrogen content was 1250 ± 400 wppb, see Figure 2b. A significant scatter in the hydrogen content values of the wet-ground samples was observed, which can be attributed to the uncontrolled pressure applied during manual grinding.
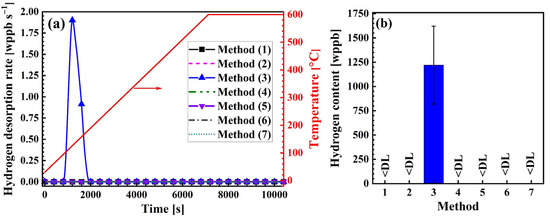
Figure 2.
Impact of surface preparation on hydrogen desorption behavior and uptake. (a) TDA spectra in samples treated using different surface preparation methods described in Table 1, and (b) hydrogen content measured for samples (<DL: below detection limit of 120 wppb).
It is important to note that method 6 is applicable only to samples free from adherent corrosion products or surface damage such as pits. Samples with these defects require grinding before TDA. To simulate this condition, samples subjected to wet grinding were evaluated after a combined electrochemical polishing and chemical pickling process (method 7). The electrochemical polishing step was included to rapidly dissolve the surface layer to achieve a smooth surface. The samples treated by this combined approach showed hydrogen levels below the detection limit.
Trap sites are characterized by their desorption energies and temperatures at which they release hydrogen [3,20,21]. Figure 3a illustrates hydrogen desorption spectra of wet-ground samples (method 3) at three heating rates. By reducing the heating rate, desorption peaks shifted to lower temperatures. In accordance with Equation (1), the desorption energy for the trap site was 37.2 ± 2.5 kJ·mol−1 (Figure 3b). This value is in good agreement with values reported for interstitial lattice sites and Al2Cu fine particles, but it is lower than the desorption energies associated with dislocations, Al2Cu coarse particles, and vacancies in Al-Cu alloys [22,23]. However, since the observed peak appears around 200 °C, which is consistent with the reported desorption temperature for lattice sites and significantly lower than the approximately 300 °C associated with Al2Cu fine particles, the contribution from Al2Cu fine particles can be excluded. Therefore, the released hydrogen is attributed to lattice sites [22,23].
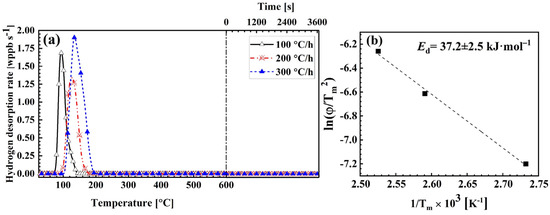
Figure 3.
Effect of heating rate on hydrogen desorption behavior. (a) TDA spectra of wet-ground samples measured at different heating rates, and (b) relationship between and , corresponding to thermal desorption spectra in (a).
3.3. GDOES
The absence of detectable hydrogen after the removal of a 10 µm thick layer, calculated based on mass loss, from the wet-ground samples (method 3), using a combination of electrochemical polishing and chemical pickling suggests that the hydrogen originated from the subsurface region at the micrometer scale. To verify this, GDOES was used to measure hydrogen profiles of samples prepared by degreasing with acetone (method 1), grinding in water (method 3), and grinding in water followed by chemical and electrochemical treatments (method 7), see Figure 4. As shown, signals for the unground sample and the sample subjected to combined electrochemical polishing and chemical pickling after grinding are similar, and decreased significantly faster compared to that of the sample treated with a single-step water grinding. This suggests the presence of a hydrogen-containing surface layer on the wet-ground sample, estimated to be less than 3 µm thick, based on the final crater depth. The post-grinding treatment of method 7 effectively removed this layer.
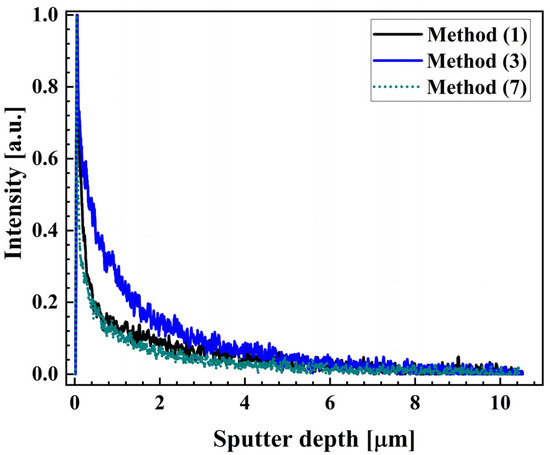
Figure 4.
Hydrogen signals measured using GDOES.
3.4. XPS
The composition of the subsurface layer on the wet-ground sample was analyzed by XPS. Based on the aluminum and oxygen spectra shown in Figure 5a,b, Al2O3 and Al(OH)3 compounds were present on the surface.
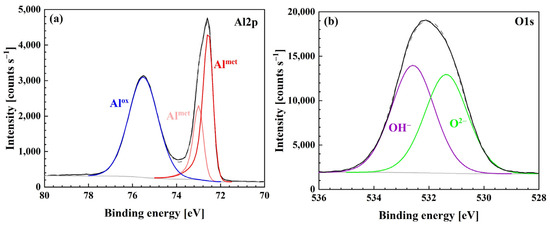
Figure 5.
High-resolution XPS spectra of (a) Al 2p and (b) O1s for samples prepared by wet grinding (method 3).
Intensities of oxide and hydroxide peaks were almost identical.
Table 2 gives the chemical composition and thickness of the surface layer. Based on this data, the surface abundances of both compounds were calculated. Al(OH)3 accounted for 33 at.% of the surface layer, while Al2O3 was twice as abundant.
Table 2.
Chemical composition and thickness of the surface layer, measured by XPS.
Thickness of the oxide/hydroxide layer d was calculated using Equation (2) [24]:
where λo and λm are inelastic mean free paths of the appropriate photoelectrons in the oxide and metal, respectively; θ is the electron take-off angle; No and Nm are the atomic densities of metal atoms in the oxide and metal; and Io and Im are the peak areas of the oxide and metal photoelectron peaks. The thickness of the oxide/hydroxide layer was approximately 2 nm.
4. Discussion
The introduction of hydrogen into pure aluminum through abrasion in water has previously been reported by Hayashi [12]. The author proposed that hydrogen originated from water molecules through a novel tribo-chemical phenomenon, which requires further investigation. Horikawa et al. [13] successfully charged peak-aged Al–Mg–Si-based alloys containing different levels of iron with hydrogen, through friction in water, achieved by grinding the surface. In their experimental setup, two aluminum plates were attached to a triangular prism-shaped stirrer and rotated over emery paper, using a magnetic stirrer, while the cell was filled with demineralized water. They proposed that hydrogen was introduced into the sample via a chemical reaction between oxide-free aluminum and water, as described by the following reaction:
In line with these studies, the current results show that water molecules in the grinding environment play a major role in introducing hydrogen into the material. In the surface layer of the wet-ground sample, a mixture of Al2O3 and Al(OH)3 was present. Aluminum oxide/hydroxide layer is typically present on the surface of aluminum. Under normal conditions, this layer forms rapidly, remains stable, and can act as a barrier to hydrogen entry [1]. However, during grinding, this protective layer is continuously formed and removed. To form these compounds, the following reactions are supposed to occur at the oxide-free aluminum surface in water used as lubricant, in addition to the previously mentioned reaction [25,26,27,28]:
In reaction (5), atomic hydrogen can be produced with a stoichiometric ratio of 3:1 with aluminum oxidized to Al(OH)3. Subsequently, in the absence of the oxide film, the produced atomic hydrogen can diffuse into the sample [29], and it can become entrapped near the surface at trap sites such as lattice interstices, vacancies, dislocations, precipitates, high-angle grain boundaries, precipitates, solute atoms, second-phase particles, and micropores [7,21,30]. This mechanism is schematically illustrated in Figure 6, where oxide removal during wet grinding exposes bare aluminum, enabling hydrogen entry into the subsurface region.
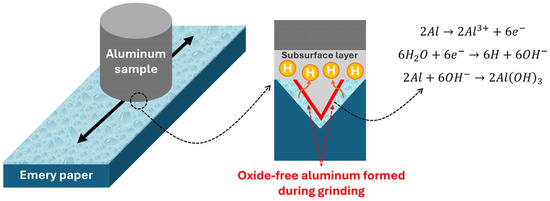
Figure 6.
Hydrogen entry into aluminum during wet grinding, due to oxide disruption.
The TDA results suggest that hydrogen introduced during grinding in water entered lattice interstices. Considering tetrahedral interstitial sites as the preferred location for hydrogen in aluminum [31], and the fact that each FCC aluminum unit cell with a lattice constant of 4.05 Å [32] contains eight tetrahedral sites, the 3 µm thick subsurface layer of the sample is theoretically capable of accommodating up to 390 µg hydrogen. The hydrogen concentration given in Figure 2b is equal to 6 µg. Thus, all analyzed hydrogen can be located in the surface layer, supporting the assumption. The observation that it was released at about 100 °C lower temperature in our study compared to the previous ones [22,23] can be attributed to the location of hydrogen from wet grinding in a thin subsurface layer, rather than in the material bulk. It has also been reported that grinding can generate a deformed near-surface layer with a nanocrystalline structure and local microstructural heterogeneities [33,34,35], which may also influence the hydrogen release temperature.
The false hydrogen quantification after wet grinding may lead to misinterpretations of hydrogen entry, transport and release processes and the HE behavior of aluminum alloys. Although no detectable hydrogen was measured in this study after grinding in air, there is still a possibility of hydrogen formation, due to the interaction between oxide-free aluminum and air humidity. This was observed in aluminum alloys exposed to high humidity during slow strain rate testing (SSRT), which led to repeated damage of the oxide film, reaction of aluminum with moisture, and introduction of hydrogen into the sample [36]. Likewise, water molecules absorbed from air can cause similar reactions even in non-aqueous lubricants [12]. Additionally, based on observations reported by Hayashi [12], Horikawa et al. [13], and an ongoing study in our laboratory on three different types of aluminum alloys, it can be concluded that a similar artifact is expected to affect the evaluation of hydrogen content in all aluminum alloys subjected to grinding prior to TDA analysis. Thus, if grinding is required to achieve a surface free of corrosion products, it is recommended to be accompanied by electrochemical polishing and chemical pickling in nitric acid. It is a strong oxidant, inducing the immediate formation of aluminum oxide on the surface [37,38], which efficiently protects it from further reaction with water molecules.
5. Conclusions
In this study, various surface preparation approaches prior to the measurement of the hydrogen content in Al-2Cu aluminum alloy were investigated. The results allow us to draw the following conclusions:
- Substantial errors in the hydrogen content quantification in aluminum alloys using the TDA technique can be introduced by grinding in water.
- Chemical pickling in concentrated nitric acid is a safe and simple surface preparation method for samples without adherent corrosion products.
- For proper preparation of corroded surfaces with adherent corrosion products, successive steps of grinding, electrochemical polishing, and chemical pickling are recommended.
Author Contributions
Conceptualization, M.H., N.M. and T.P.; methodology, M.H. and T.P.; validation, T.K.A.; formal analysis, M.H., N.M., T.K.A. and S.Z.; investigation, M.H., S.Z. and D.R.; resources, T.P.; data curation, M.H.; writing—original draft, M.H., N.M. and S.Z.; writing—review and editing, T.K.A., D.R. and T.P.; visualization, M.H. and N.M.; supervision, T.P.; project administration, T.P.; funding acquisition, T.P. All authors have read and agreed to the published version of the manuscript.
Funding
This work has been supported by the Czech Science Foundation under Grant No. 23-06169S.
Data Availability Statement
The data presented in this study are available on request from the corresponding author. The data are not publicly available due to privacy restrictions.
Conflicts of Interest
The authors declare no conflicts of interest.
Abbreviations
The following abbreviations are used in this manuscript:
| HE | Hydrogen embrittlement |
| TDA | Thermal desorption analysis |
| GDOES | Glow-discharge optical emission spectroscopy |
| XPS | X-ray photoelectron spectroscopy |
| SEM | Scanning electron microscopy |
| SSRT | Slow strain rate testing |
References
- Scully, J.; Young Jr, G.; Smith, S. Hydrogen embrittlement of aluminum and aluminum-based alloys. In Gaseous Hydrogen Embrittlement of Materials in Energy Technologies; Elsevier: Amsterdam, The Netherlands, 2012; pp. 707–768. [Google Scholar]
- Moshtaghi, M.; Safyari, M.; Kuramoto, S.; Hojo, T. Unraveling the effect of dislocations and deformation-induced boundaries on environmental hydrogen embrittlement behavior of a cold-rolled Al–Zn–Mg–Cu alloy. Int. J. Hydrogen Energy 2021, 46, 8285–8299. [Google Scholar] [CrossRef]
- Safyari, M.; Moshtaghi, M.; Hojo, T.; Akiyama, E. Mechanisms of hydrogen embrittlement in high-strength aluminum alloys containing coherent or incoherent dispersoids. Corros. Sci. 2022, 194, 109895. [Google Scholar] [CrossRef]
- Georgiou, E.; Celis, J.-P.; Panagopoulos, C. The effect of cold rolling on the hydrogen susceptibility of 5083 aluminum alloy. Metals 2017, 7, 451. [Google Scholar] [CrossRef]
- Yang, X.; Zhang, X.; Chen, J.; Wang, Z.; Li, X.; Zhang, X.; Gao, L. Study of Hydrogen-Induced Plastic Damage Response of 7085-T7651 High-Strength Aluminum Alloy. Metals 2022, 13, 40. [Google Scholar] [CrossRef]
- Safyari, M.; Reiter, J.; Moshtaghi, M. Interaction of aluminum alloys with pressurized hydrogen affecting permeability: H-induced lattice expansion versus H-induced defects. Mater. Lett. 2023, 346, 134501. [Google Scholar] [CrossRef]
- Bhuiyan, M.S.; Toda, H.; Peng, Z.; Hang, S.; Horikawa, K.; Uesugi, K.; Takeuchi, A.; Sakaguchi, N.; Watanabe, Y. Combined microtomography, thermal desorption spectroscopy, X-ray diffraction study of hydrogen trapping behavior in 7XXX aluminum alloys. Mater. Sci. Eng. A 2016, 655, 221–228. [Google Scholar] [CrossRef]
- Chen, Y.; Zhao, S.; Ma, H.; Wang, H.; Hua, L.; Fu, S. Analysis of hydrogen embrittlement on aluminum alloys for vehicle-mounted hydrogen storage tanks: A review. Metals 2021, 11, 1303. [Google Scholar] [CrossRef]
- Choo, W.; Lee, J.Y. Thermal analysis of trapped hydrogen in pure iron. Metall. Trans. A 1982, 13, 135–140. [Google Scholar] [CrossRef]
- Silva, M.I.; Sorger, G.; Malitckii, E.; Vilaça, P. Hydrogen-as-a-probe applied to investigate the influence of extraction and preparation methods on TDS spectra of 13CrMo4-5 samples. J. Mater. Sci. 2024, 59, 20735–20764. [Google Scholar] [CrossRef]
- Arroyo, B.; Andrea, L.; Álvarez, J.A.; Cicero, S.; Lacalle, R. Analysis of samples cleaning methods prior to hydrogen content determination in steel. Metals 2020, 10, 723. [Google Scholar] [CrossRef]
- Hayashi, S.-i.H.S.-i. Hydrogen introduction by abrasion in aluminum. Jpn. J. Appl. Phys. 1996, 35, 6191. [Google Scholar] [CrossRef]
- Horikawa, K.; Matsubara, T.; Kobayashi, H. Hydrogen charging of Al–Mg–Si-based alloys by friction in water and its effect on tensile properties. Mater. Sci. Eng. A 2019, 764, 138199. [Google Scholar] [CrossRef]
- Kamoutsi, H.; Haidemenopoulos, G.; Bontozoglou, V.; Petroyiannis, P.; Pantelakis, S.G. Effect of prior deformation and heat treatment on the corrosion-induced hydrogen trapping in aluminium alloy 2024. Corros. Sci. 2014, 80, 139–142. [Google Scholar] [CrossRef]
- Kamoutsi, H.; Haidemenopoulos, G.; Mavros, H.; Karantonidis, C.; Floratos, P.; Alhosani, Z.; Cho, P.; Anjum, D.; Ravaux, F.; Polychronopoulou, K. Effect of precipitate coherency on the corrosion-induced hydrogen trapping in 2024 aluminum alloy. Int. J. Hydrogen Energy 2021, 46, 34487–34497. [Google Scholar] [CrossRef]
- Haidemenopoulos, G.; Hassiotis, N.; Papapolymerou, G.; Bontozoglou, V. Hydrogen absorption into aluminum alloy 2024-T3 during exfoliation and alternate immersion testing. Corrosion 1998, 54, 73–78. [Google Scholar] [CrossRef]
- Kissinger, H.E. Reaction kinetics in differential thermal analysis. Anal. Chem. 1957, 29, 1702–1706. [Google Scholar] [CrossRef]
- Jiang, L.; Li, J.; Liu, G.; Wang, R.; Chen, B.; Zhang, J.; Sun, J.; Yang, M.; Yang, G.; Yang, J. Length-scale dependent microalloying effects on precipitation behaviors and mechanical properties of Al–Cu alloys with minor Sc addition. Mater. Sci. Eng. A 2015, 637, 139–154. [Google Scholar] [CrossRef]
- Liu, G.; Zhang, G.; Ding, X.; Sun, J.; Chen, K. Modeling the strengthening response to aging process of heat-treatable aluminum alloys containing plate/disc-or rod/needle-shaped precipitates. Mater. Sci. Eng. A 2003, 344, 113–124. [Google Scholar] [CrossRef]
- Košová Altnerová, T.; Rudomilova, D.; Novák, P.; Prošek, T. The Role of Precipitates in Hydrogen Embrittlement of Precipitation-Hardenable Aluminum Alloys. Metals 2024, 14, 1287. [Google Scholar] [CrossRef]
- Young Jr, G.; Scully, J. The diffusion and trapping of hydrogen in high purity aluminum. Acta Mater. 1998, 46, 6337–6349. [Google Scholar] [CrossRef]
- Chao, P.; Karnesky, R.A. Hydrogen isotope trapping in Al–Cu binary alloys. Mater. Sci. Eng. A 2016, 658, 422–428. [Google Scholar] [CrossRef]
- Safyari, M.; Moshtaghi, M.; Kuramoto, S. Environmental hydrogen embrittlement associated with decohesion and void formation at soluble coarse particles in a cold-rolled Al–Cu based alloy. Mater. Sci. Eng. A 2021, 799, 139850. [Google Scholar] [CrossRef]
- Strohmeier, B.R. An ESCA method for determining the oxide thickness on aluminum alloys. Surf. Interface Anal. 1990, 15, 51–56. [Google Scholar] [CrossRef]
- Godart, P.; Fischman, J.; Seto, K.; Hart, D. Hydrogen production from aluminum-water reactions subject to varied pressures and temperatures. Int. J. Hydrogen Energy 2019, 44, 11448–11458. [Google Scholar] [CrossRef]
- Shmelev, V.; Nikolaev, V.; Lee, J.H.; Yim, C. Hydrogen production by reaction of aluminum with water. Int. J. Hydrogen Energy 2016, 41, 16664–16673. [Google Scholar] [CrossRef]
- Ilyukhina, A.; Kravchenko, O.; Bulychev, B. Studies on microstructure of activated aluminum and its hydrogen generation properties in aluminum/water reaction. J. Alloys Compd. 2017, 690, 321–329. [Google Scholar] [CrossRef]
- Kumar, D.; Muthukumar, K. An overview on activation of aluminium-water reaction for enhanced hydrogen production. J. Alloys Compd. 2020, 835, 155189. [Google Scholar] [CrossRef]
- Kuramoto, S.; Okahana, J.; Kanno, M. Hydrogen assisted intergranular crack propagation during environmental embrittlement in an Al-Zn-Mg-Cu Alloy. Mater. Trans. 2001, 42, 2140–2143. [Google Scholar] [CrossRef]
- Safyari, M.; Moshtaghi, M.; Kuramoto, S. On the role of traps in the microstructural control of environmental hydrogen embrittlement of a 7xxx series aluminum alloy. J. Alloys Compd. 2021, 855, 157300. [Google Scholar] [CrossRef]
- Zeng, C.; Hu, J.; Ouyang, C. Hydrogen solution in tetrahedral or octahedral interstitial sites in Al. J. Alloys Compd. 2011, 509, 9214–9217. [Google Scholar] [CrossRef]
- Gu, H.; Wang, J.; Li, Z. Molecular dynamics simulation of tensile behavior on ceramic particles reinforced aluminum matrix nanocomposites. Int. J. Mater. Sci. Appl. 2016, 5, 151–159. [Google Scholar] [CrossRef]
- Liu, Y.; Zhou, X.; Thompson, G.; Hashimoto, T.; Scamans, G.; Afseth, A. Precipitation in an AA6111 aluminium alloy and cosmetic corrosion. Acta Mater. 2007, 55, 353–360. [Google Scholar] [CrossRef]
- Wang, S.-S.; Huber, D.; Poplawsky, J.D.; Colijn, H.; Frankel, G. The subsurface structure of abraded Al–Zn–Mg–Cu alloy. Materialia 2021, 16, 101065. [Google Scholar] [CrossRef]
- Alias, J.; Alang, N. Formation of Surface Deformed Layer of AZ31 Magnesium Alloy Subjected to Conventional Mechanical Grinding. J. Mater. Eng. Perform. 2024, 34, 6905–6915. [Google Scholar] [CrossRef]
- Safyari, M.; Hojo, T.; Moshtaghi, M. Effect of environmental relative humidity on hydrogen-induced mechanical degradation in an Al–Zn–Mg–Cu alloy. Vacuum 2021, 192, 110489. [Google Scholar] [CrossRef]
- Iwata, T.; Matsumoto, T.; Terakawa, S.; Kobayashi, H. Fabrication of Al 2 O 3/Al structure by nitric acid oxidation at room temperature. Cent. Eur. J. Phys. 2010, 8, 1015–1020. [Google Scholar]
- Peter, M. Valence and core photoemission of the films formed electrochemically on aluminium in nitric acid. J. Chem. Soc. Faraday Trans. 1993, 89, 263–266. [Google Scholar] [CrossRef]
Disclaimer/Publisher’s Note: The statements, opinions and data contained in all publications are solely those of the individual author(s) and contributor(s) and not of MDPI and/or the editor(s). MDPI and/or the editor(s) disclaim responsibility for any injury to people or property resulting from any ideas, methods, instructions or products referred to in the content. |
© 2025 by the authors. Licensee MDPI, Basel, Switzerland. This article is an open access article distributed under the terms and conditions of the Creative Commons Attribution (CC BY) license (https://creativecommons.org/licenses/by/4.0/).