Article

Study of Microstructure, Mechanical, and Corrosion Properties of K-TIG Welded Joints of 2205/316L Dissimilar Stainless Steel

1
School of Mechanical and Automotive Engineering, Guangxi University of Science and Technology, Liuzhou 545006, China
2
School of Mechanical Engineering, Jiamusi University, Jiamusi 154007, China
*
Author to whom correspondence should be addressed.
Metals 2025, 15(8), 910; https://doi.org/10.3390/met15080910
Submission received: 12 July 2025 / Revised: 7 August 2025 / Accepted: 14 August 2025 / Published: 16 August 2025

Abstract

Stainless steel welding plays a critical role in industrial manufacturing due to its superior corrosion resistance and structural reliability. The keyhole tungsten inert gas (K-TIG) welding, renowned for its high efficiency, high precision, and cost-effectiveness, demonstrates particular advantages in medium-to-thick plate joining. In order to synergistically leverage the properties of 2205 duplex stainless steel (DSS) and 316L austenitic stainless steel (ASS), we have implemented K-TIG welding with a single variable under control: a constant current and voltage travelling speeds spanning 280–360 mm/min. Defect-free dissimilar joints were consistently achieved within the 280–320 mm/min speed window. The effects of welding speed on microstructural characteristics, mechanical properties, and corrosion behavior of the weld seams were systematically investigated. The percentage of austenite in the weld zone decreases from 84.7% to 59.9% as the welding speed increases. At a welding speed of 280 mm/min, the microstructural features in the regions near the weld seam and fusion zone were investigated. All obtained joints exhibited excellent tensile properties, with their tensile strengths surpassing those of the 316L base metal. The optimal impact toughness of 142 J was achieved at a welding speed of 320 mm/min. The obtained joints exceeded the hardness of TIG joints by 19%. Notably, the grain refinement in the weld zone not only enhanced the hardness of the welded joint but also improved its corrosion resistance. This study provides valuable process references in dissimilar stainless steel K-TIG welding applications.

1. Introduction

Stainless steels have been extensively utilized in industrial applications due to their remarkable strength and corrosion resistance. Among various types, austenitic stainless steels represent the most widely employed category, characterized by a predominant austenitic phase and high alloying element content. These steels demonstrate excellent ductility, toughness, corrosion resistance, and weldability [1], accounting for the majority of global stainless steel production. However, their susceptibility to localized corrosion in aggressive environments such as marine atmospheres remains a critical limitation [2]. In contrast, duplex stainless steels exhibit superior mechanical properties and enhanced localized corrosion resistance through their unique ferrite–austenite dual-phase microstructure [3]. This balanced phase composition combines the advantages of both austenitic and ferritic stainless steels, including high thermal conductivity, low thermal expansion, and exceptional mechanical performance [4]. Nevertheless, DSS face challenges such as σ-phase precipitation at elevated temperatures, which induces embrittlement and restricts high-temperature applications. Furthermore, the complex thermomechanical processing required for DSS plate production significantly increases manufacturing costs compared to ASS.
The distinct mechanical properties and application scopes of ASS and DSS necessitate dissimilar welding technologies to achieve optimal material combinations for performance enhancement and cost efficiency. Dissimilar metal welded joints (DMWJs) have consequently gained prominence in nuclear energy, petrochemical industries, and civil engineering [5,6,7]. In some fields, parts made from dissimilar metal welded joints can even replace other parts made from more expensive alloys [8]. Welding technology makes it possible to produce dissimilar joints of ASS and DSS and to take advantage of their different properties to increase cost-effectiveness and range of application. Gas tungsten arc welding (GTAW) with optimized pulsed current parameters effectively controls δ-ferrite content in 2507/321 joints, achieving balanced strength–corrosion resistance [9]. Microstructural engineering through filler metal selection proves effective in enhancing dissimilar joint performance. As shown in GTAW joints between 2205 and 316L [10], a reasonable selection of welding process and filler material can obtain good joint performance. A study using fiber laser welding to join 2205 and 304 obtained joints with excellent mechanical properties, in addition to studying the relationship between welding parameters and weld width [11]. Laser welding has also been used to join 904L and 317L [12], and studies have shown that controlling heat input can inhibit the formation of harmful phases, the use of reasonable process parameters can achieve simultaneous improvement in mechanical properties, and the tensile strength, hardness, and flexural resistance of the product after heat treatment (PWHT) are reduced, while the toughness is increased. Friction stir welding (FSW) has also been used to join dissimilar stainless steels, and a study was conducted to obtain 2507/317L joints using friction stir welding [13]. The yield strength (YS) and ultimate tensile strength (UTS) of the welded joints were 493 and 692 MPa, respectively, and the elongation (EL) was 32 percent at a speed of 400 rpm. The tensile strength was higher than that of 317L ASS but lower than that of 2507 SDSS. The grain refinement in the stirring zone significantly improved the corrosion resistance of the welded joints.
Conventional welding techniques for medium-thickness plates typically require multiple passes and substantial filler material consumption, resulting in reduced productivity and elevated costs. This problem is particularly noticeable in TIG welding [14,15,16]; welding 8 mm 2205/316L plate requires edge preparation and a lot of filler material [10]. K-TIG welding addresses these limitations through its deep-penetration capability, enabling single-pass full penetration in medium-thickness materials without filler metals or groove preparation [17,18,19,20]. Although K-TIG has been successfully applied to homogeneous materials such as 304 ASS [21], 2205 DSS [18], TC4 titanium alloy [19], and high-strength steel [22]. At present, there are relatively few studies on K-TIG in dissimilar stainless steel welding. There are no research reports on the effect of welding speed variation on the microstructure of K-TIG-welded 2205/316L joints and their mechanical and corrosion properties.
The novelty of this paper is the use of the K-TIG welding technique for 8 mm thick dissimilar stainless steel plates to obtain a fully penetrated dissimilar weld in a single pass without edge preparation or filler welding materials. The effects of different welding speeds on the microstructure, mechanical properties, and corrosion performance of K-TIG-welded SAF2205/aisi316L dissimilar joints were investigated in order to provide further process references for K-TIG dissimilar medium-thickness stainless steel welding research.

2. Materials and Methods

2.1. Materials

This study utilized 8 mm-thick 316L austenitic stainless steel and 2205 duplex stainless steel as base materials (BMs). Table 1 summarizes the chemical composition of the BMs.

2.2. Welding Procedure

The K-TIG welding system was implemented through an integrated configuration incorporating an HTIG-P10 power supply (Foreweld, Guangzhou, China), precision fixturing modules, a JZ-5200 closed-loop thermal management unit (Jizhi, Guangzhou, China), and an argon shielding gas delivery system. Operational parameters were configured with DC electrode negative (DCEN) polarity, employing a 6.4 mm-diameter thoriated tungsten electrode (60° included angle tip geometry). Ultra-high-purity argon shielding gas (99.0%) was regulated at a constant flow rate of 12 L/min throughout the process. Square-edge butt joints with controlled root gaps < 0.5 mm were established through precision clamping, eliminating requirements for groove preparation or filler metal utilization. Pre-weld surface conditioning involved ultrasonic acetone degreasing to achieve contaminant-free interfaces devoid of oil residues and particulate matter. A schematic representation of the experimental setup is provided in Figure 1.
Post-weld joint integrity was validated through visual inspection. Heat input (Q) was calculated using the following standardized formulation:
Q = η × U × I ν
where the arc efficiency coefficient ( η ) was maintained at 0.9, with the following corresponding process variables: arc voltage ( U ), welding current (I), and welding speed ( ν ).
The welding parameters were selected with reference to the available literature [23] and preliminary experiments. A reasonable process window was determined. The specific welding parameters are quantified in Table 2.

2.3. Microstructural Characterization

Following welding completion, weld zone specimens with dimensions 30 mm × 8 mm × 10 mm were precision-sectioned using electrical discharge machining (EDM). Sequential surface preparation involved mechanical grinding with progressively refined silicon carbide papers (up to 2000 grit), succeeded by final polishing with 2.5 μm diamond suspension. Metallographic etching was subsequently performed using an aqueous etchant composed of 5 g FeCl3, 50 mL HCl, and 100 mL H2O. Microstructural characterization employed a Zeiss optical microscope (OM) (Oberkochen, Germany) integrated with digital imaging software for quantitative analysis of weld bead geometry, macrostructural features, and joint cross-sectional dimensions. Complementary crystallographic evaluation utilized Zeiss electron backscatter diffraction (EBSD) on specially prepared 10 mm × 8 mm × 3 mm mechanically polished specimens. In addition, WM was analyzed by XRD using a Rigaku X-ray diffractometer (Tokyo, Japan).

2.4. Mechanical Test

Transverse tensile testing was conducted at ambient temperature (25 °C) using a computer-controlled universal testing machine. A constant crosshead displacement rate of 2 mm/min was applied to ensure quasi-static loading conditions, in compliance with the ASM International Manual of Mechanical Testing and Evaluation. Triplicate tests were performed for each specimen group to validate experimental reproducibility. Charpy V-notch impact testing was implemented on weld joint specimens under identical ambient conditions. Three independent trials per group were executed using a pendulum-type impact tester, with absorbed energy values averaged across replicates. The tensile specimens were prepared in compliance with ASTM E8 [24] whereas the impact specimens were prepared in accordance with ASTM A-370 [25]. Post-test fracture surfaces were systematically examined via Zeiss scanning electron microscopy (SEM) to characterize failure mechanisms. Tensile and impact specimen dimensions are shown in Figure 2. Metallographic characterization included Vickers microhardness profiling across dissimilar metal weld cross-sections. A diamond pyramid indenter was employed under a 0.5 kgf applied load with a 10 s dwell time. Hardness measurements were recorded at 0.5 mm spatial intervals along predefined traverse paths.

2.5. Electrochemical Characterization

The corrosion performance of the welded specimens was evaluated by the kinetic potential polarization method in 3.5 wt% NaCl solution at 25 ± 1 °C. Specimens were ground with SiC sandpaper (up to 2000 grit), degreased with acetone, rinsed with distilled water, and dried with dry air, followed by inlaying the specimens with epoxy resin and silicone rubber; electrochemical experiments were carried out on the weld area tissues only. Electrochemical testing with the CHI602E series electrochemical workstation by Shanghai Chenhua Instrument Co. (Shanghai, China). A platinum sheet electrode was used as the counter electrode, and a saturated calomel electrode as the reference electrode. The specimen was used as the working electrode. Testing of the corrosion behavior of the welded joints was performed under different welding conditions. The potential interval of the test was from −1.0 V to 1.5 V, including the cathodic polarization zone and anodic polarization zone, etc. The scanning rate was taken as 0.005 V/s, and the sampling interval was 0.0001 V. Corrosion resistance metrics, including corrosion potential and corrosion current density, were extracted through Tafel extrapolation of polarization curves.

3. Results and Discussion

3.1. Macroscopic Morphology of Welded Joints

The macroscopic morphology of the front and back sides of the weld is shown in Figure 3. At a welding speed of 360 mm/min, the phenomenon of unfused regions appeared as shown in the red box in Figure 3e.
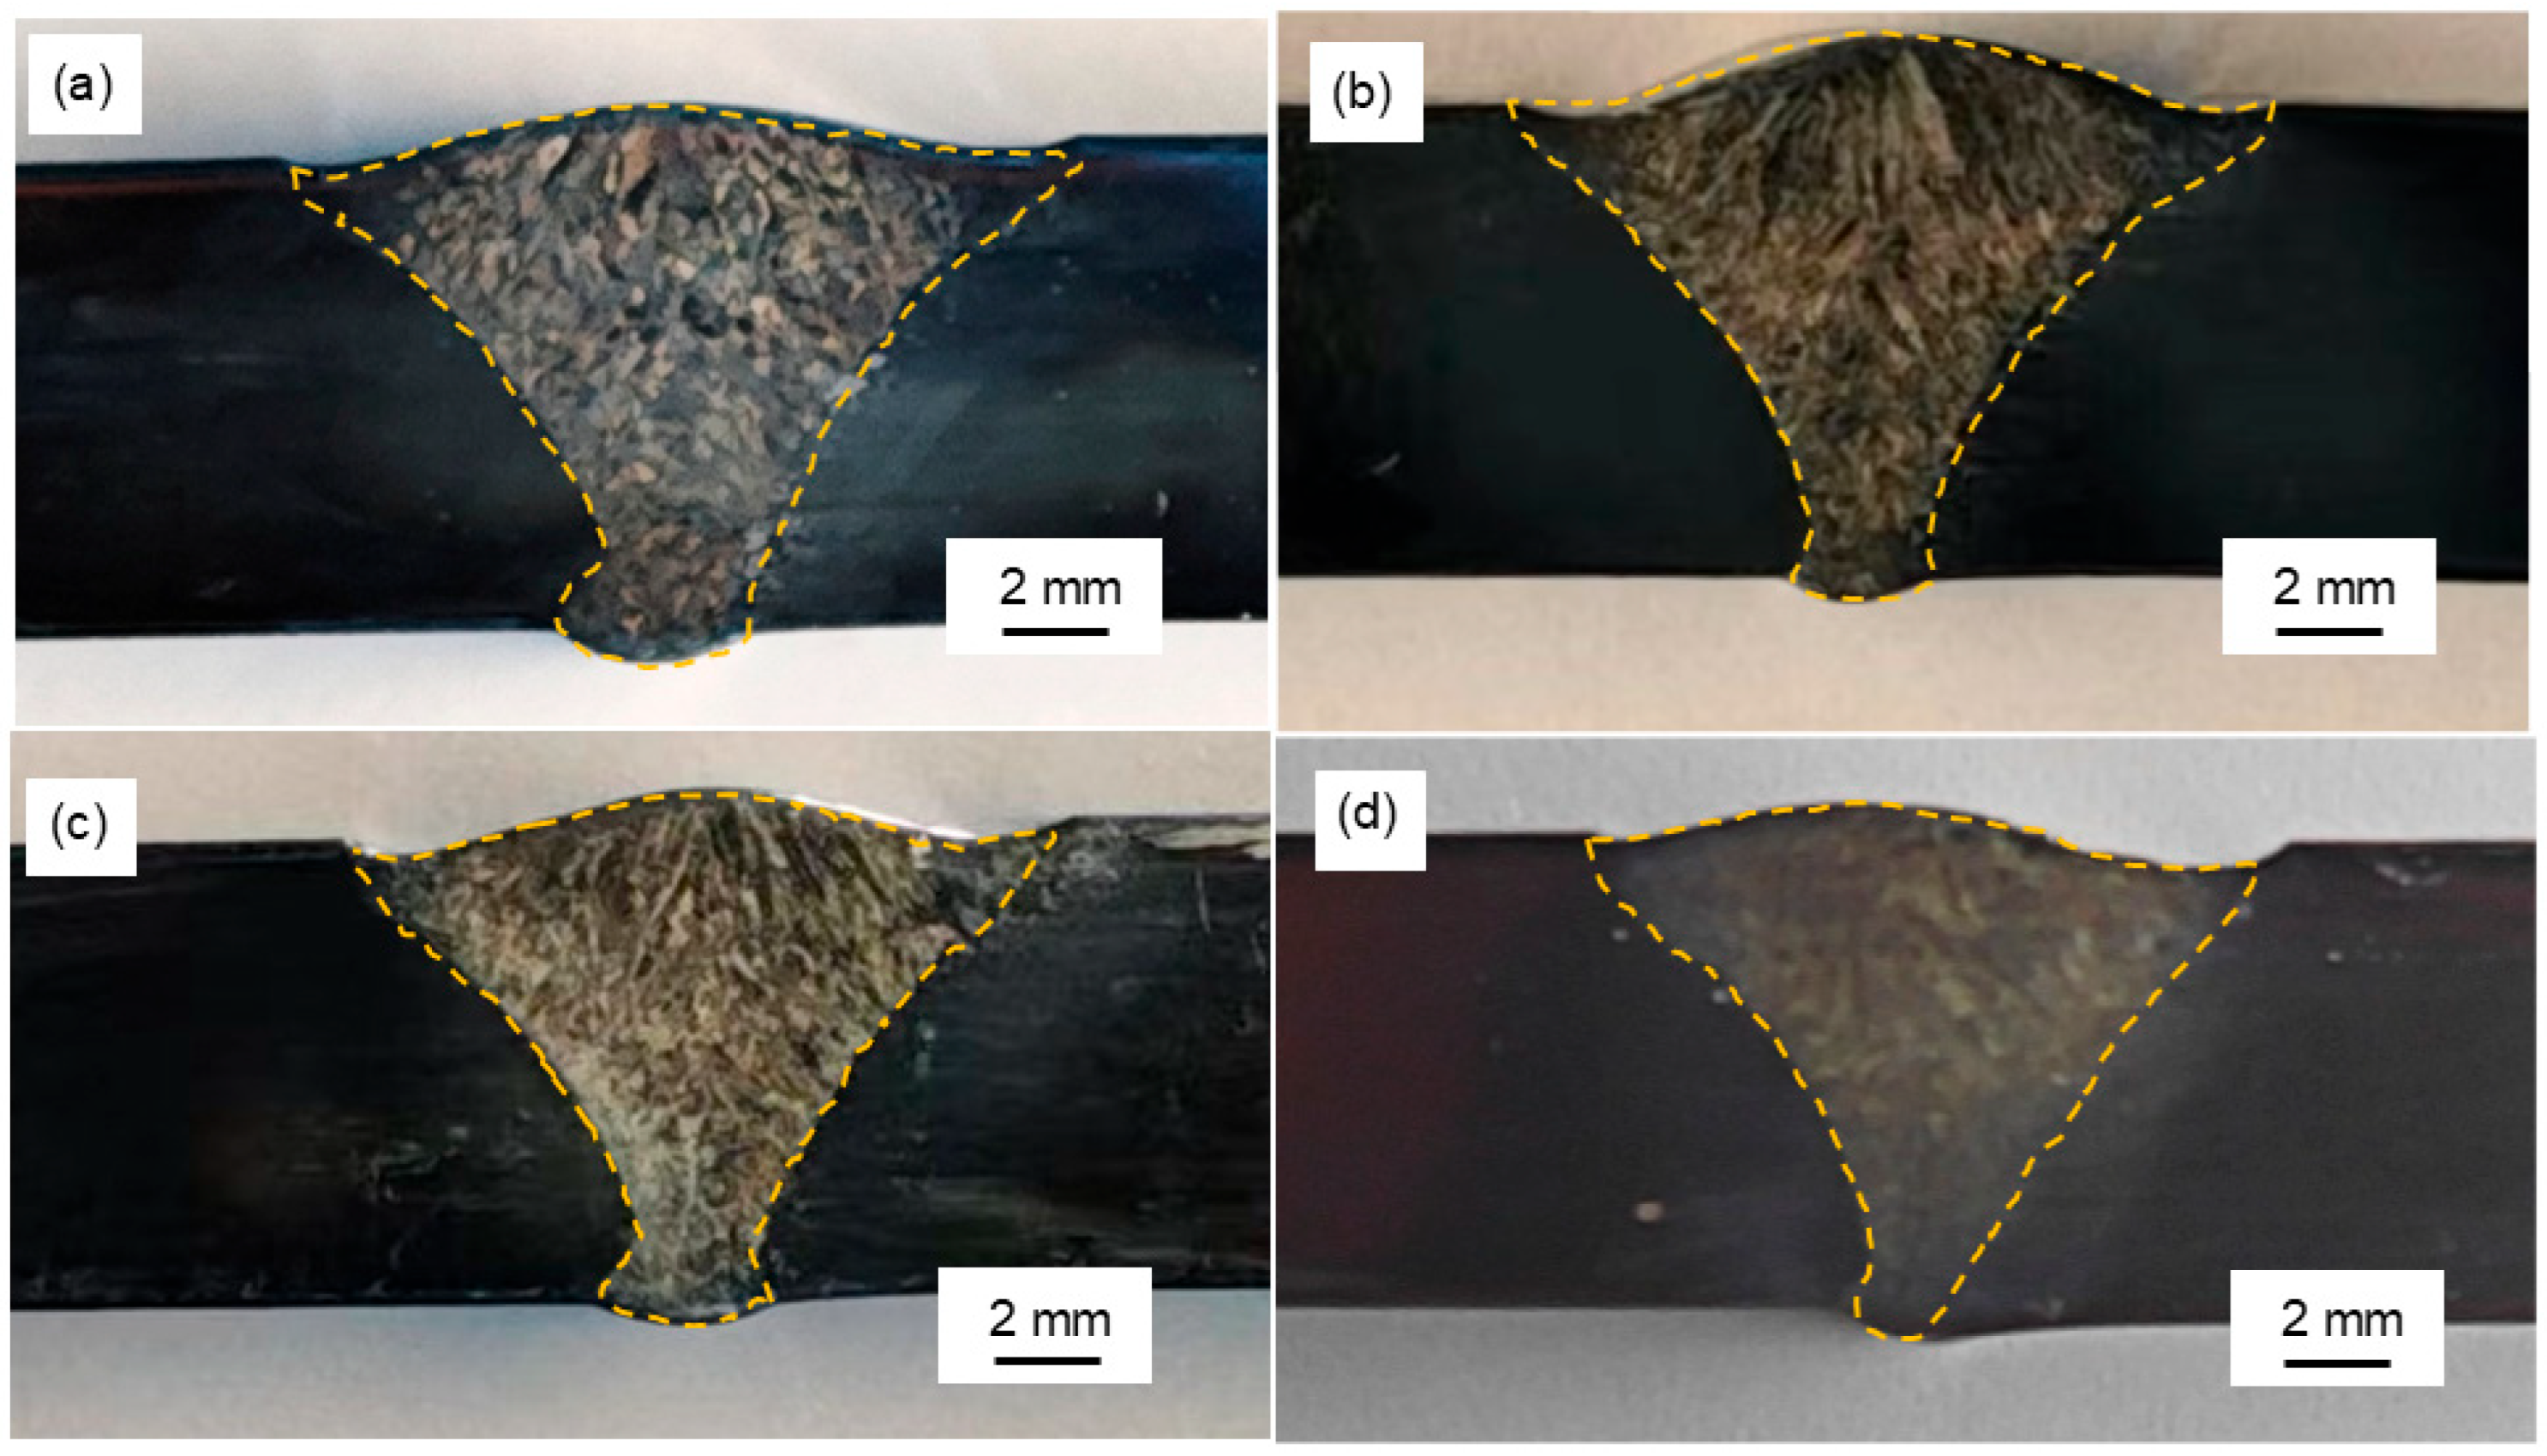
The image of the weld joint’s cross-section is shown in Figure 4. Asymmetric fusion line geometry was observed between 316L and 2205 base metals, characterized by distinct curvature variations. The shape of the weld metal (WM) region is always towards the 316L stainless steel side of the distortion. The 316L stainless steel side of the weld fusion line radius of curvature is smaller, and there is a more obvious inflection point. The 2205 stainless steel side of the weld fusion line has almost no inflection points. This is due to the flow of molten metal to one side of the base metal during welding. This phenomenon can be analysed in terms of differences in the thermophysical properties of the materials: 2205 has a higher melting point than 316L and a greater thermal conductivity than 316L, so, when the arc melts the weld metal, the metal with a lower melting and boiling point melts more, and the metal with a greater thermal conductivity can transfer more heat to the base metal outside the molten pool. Therefore, in the absence of an offset in the relative position of the arc to either side, the two together result in a large amount of metal melting on the 316L side and a small amount of metal melting on the 2205 side. In addition, the greater coefficient of linear expansion of 316L caused the molten 316L to squeeze towards the 2205 side, creating this phenomenon.

3.2. Microstructure of Joints

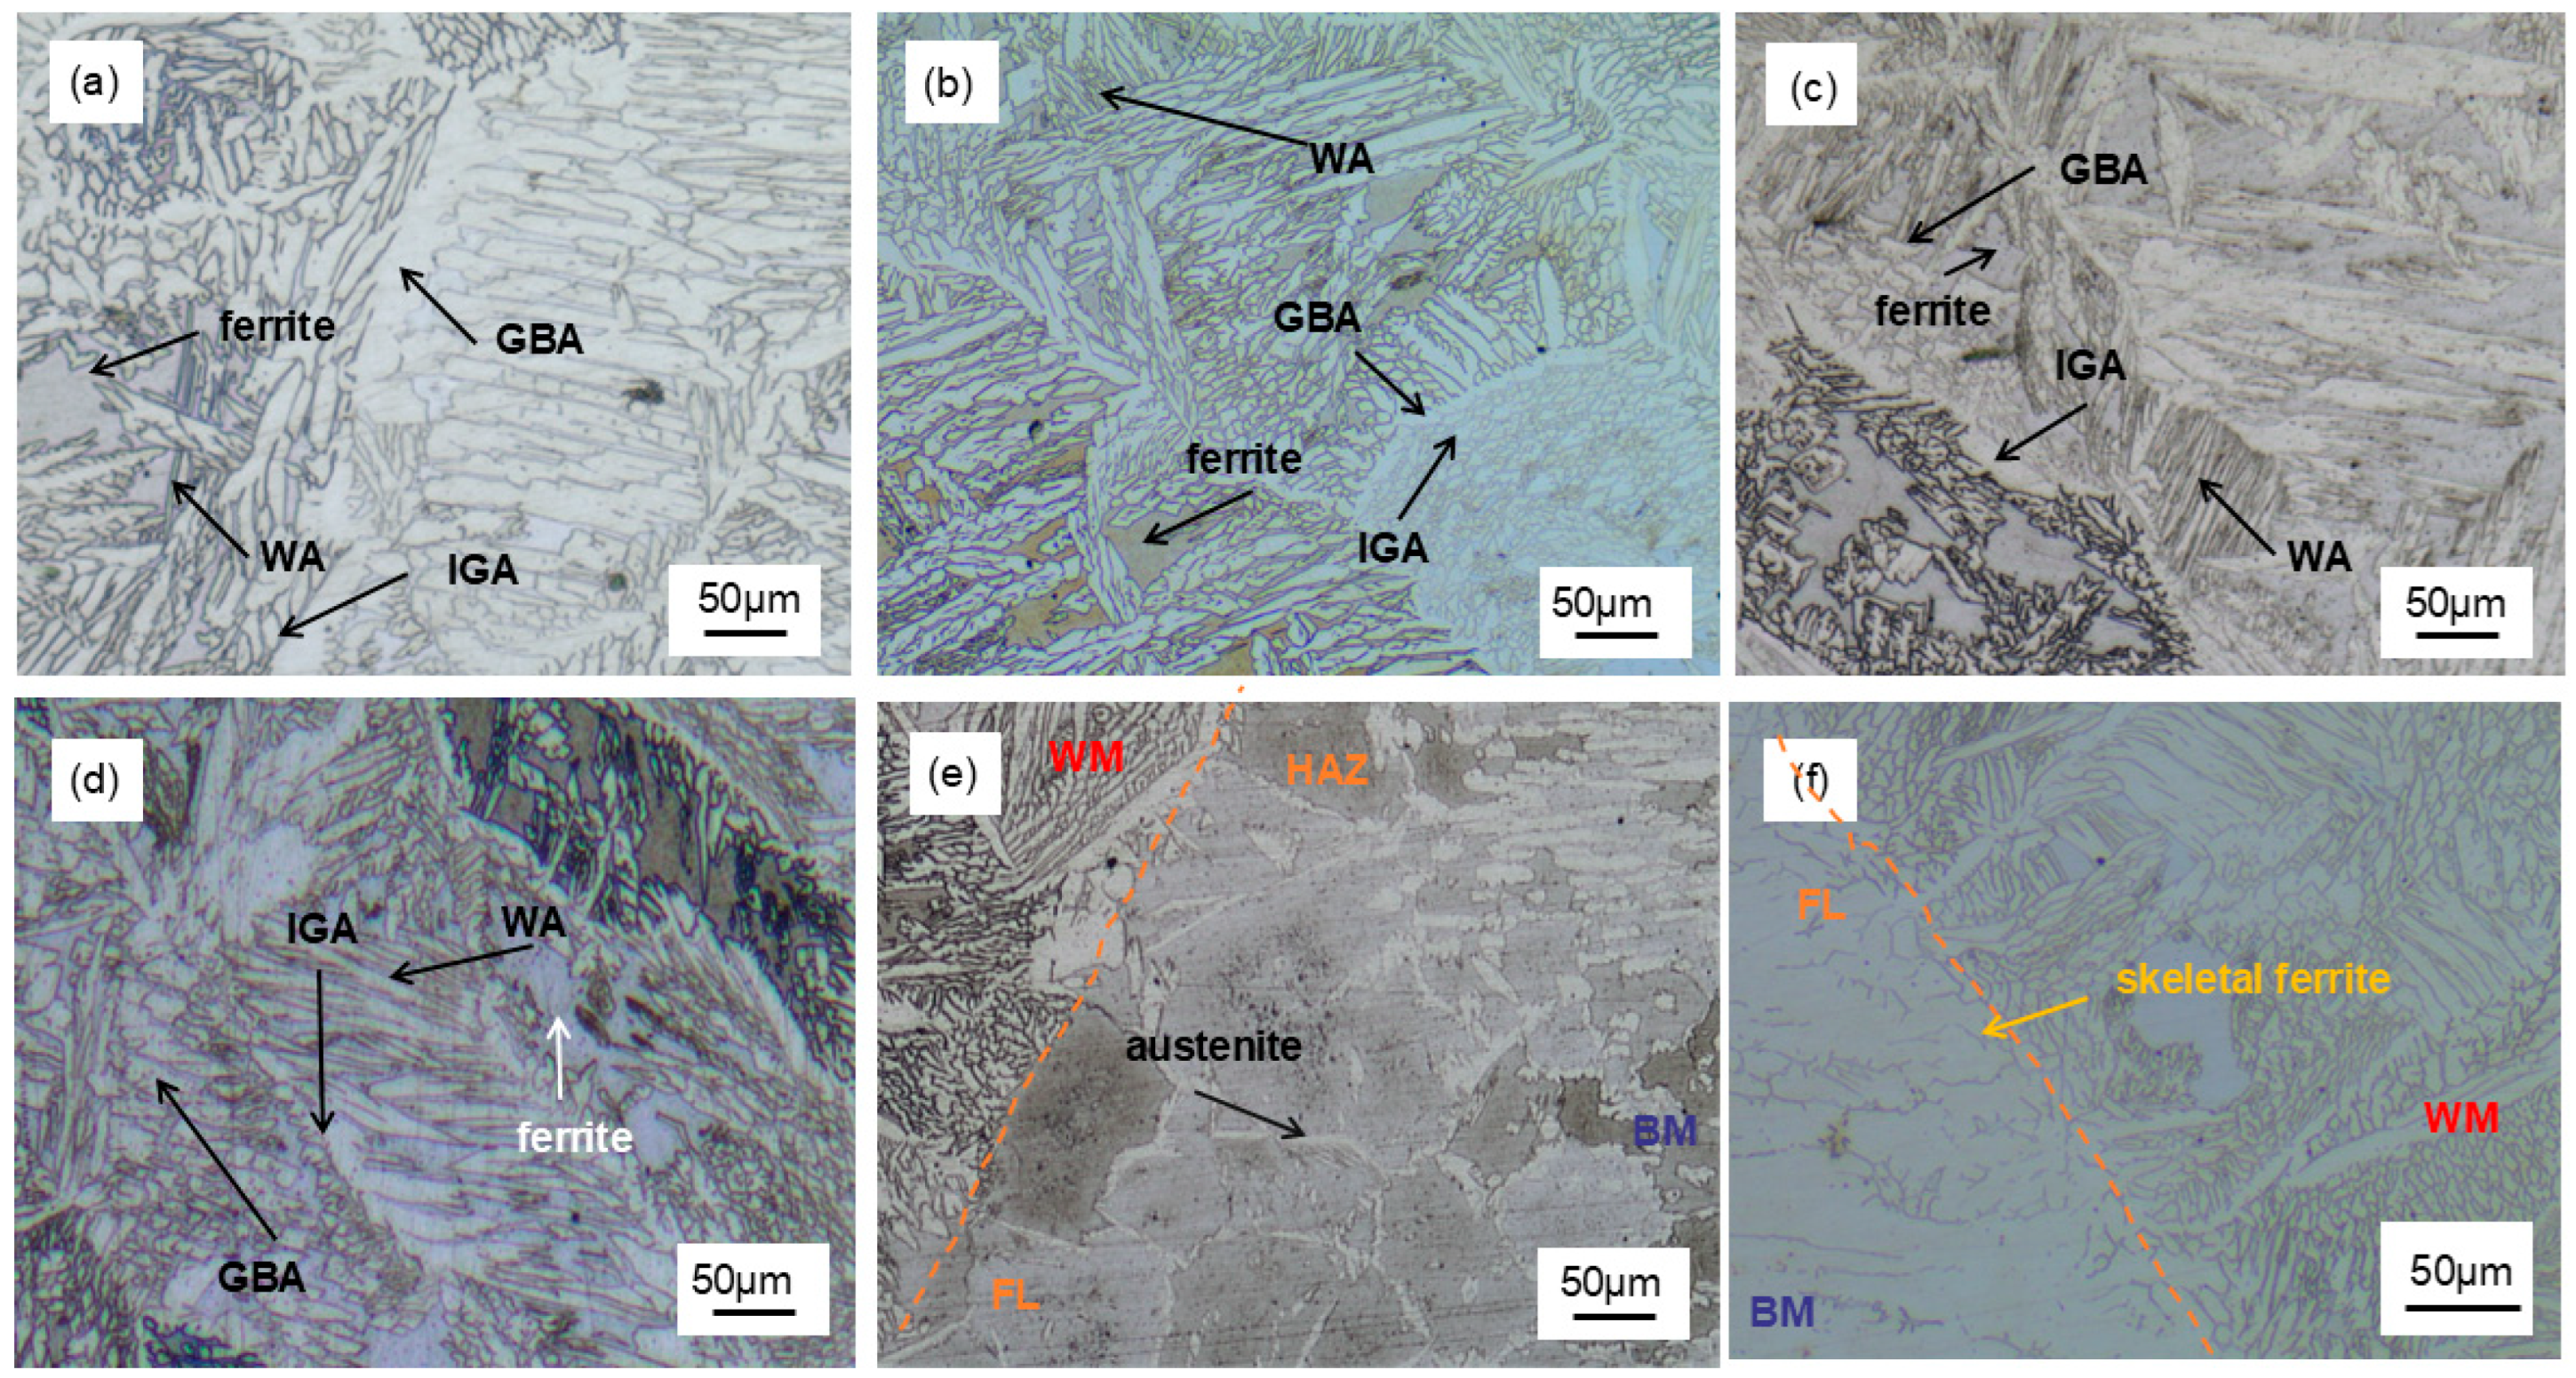
Figure 5 shows the optical microstructure of specimens 1#, 2#, 3#, and 4#; the weld metal region with the δ-ferrite and austenite phases can be distinctly observed. Observation of the microstructure reveals the effect of increased welding speed on the weld metal. The weld metal predominantly comprises massive ferrite and austenitic morphologies, including Widmanstätten austenite (WA), grain boundary austenite (GBA), and intragranular austenite (IGA). A large amount of coarser austenite was visible in the WM of 1#, and, as the welding speed increased, more ferrite appeared in subsequent specimens with finer austenite grains, which was caused by the fact that the weld metal did not have enough time to allow the austenite grains to grow during cooling.
The fusion region is shown in Figure 5e,f. The fusion line on the 2205 side is very obvious, and the heat affected zone (HAZ) consists of a large amount of coarse ferrite as well as a small amount of austenite dendrites and compositions, which grow inwards perpendicular to the fusion line to form dendritic grains, which are orientated in the same way as the austenite grains in the adjacent WM. A distinct fusion line is observed on the 316L side, and the HAZ contains a large amount of austenite as well as a small amount of skeletal ferrite. This is due to the liquid phase precipitation of ferrite during solidification, followed by the solidification of austenite from ferrite crystal checking. As the temperature continues to decrease, the austenite between the dendrites grows and compresses the ferrite into a ‘skeleton’ shape, solidifying in the F-A mode.
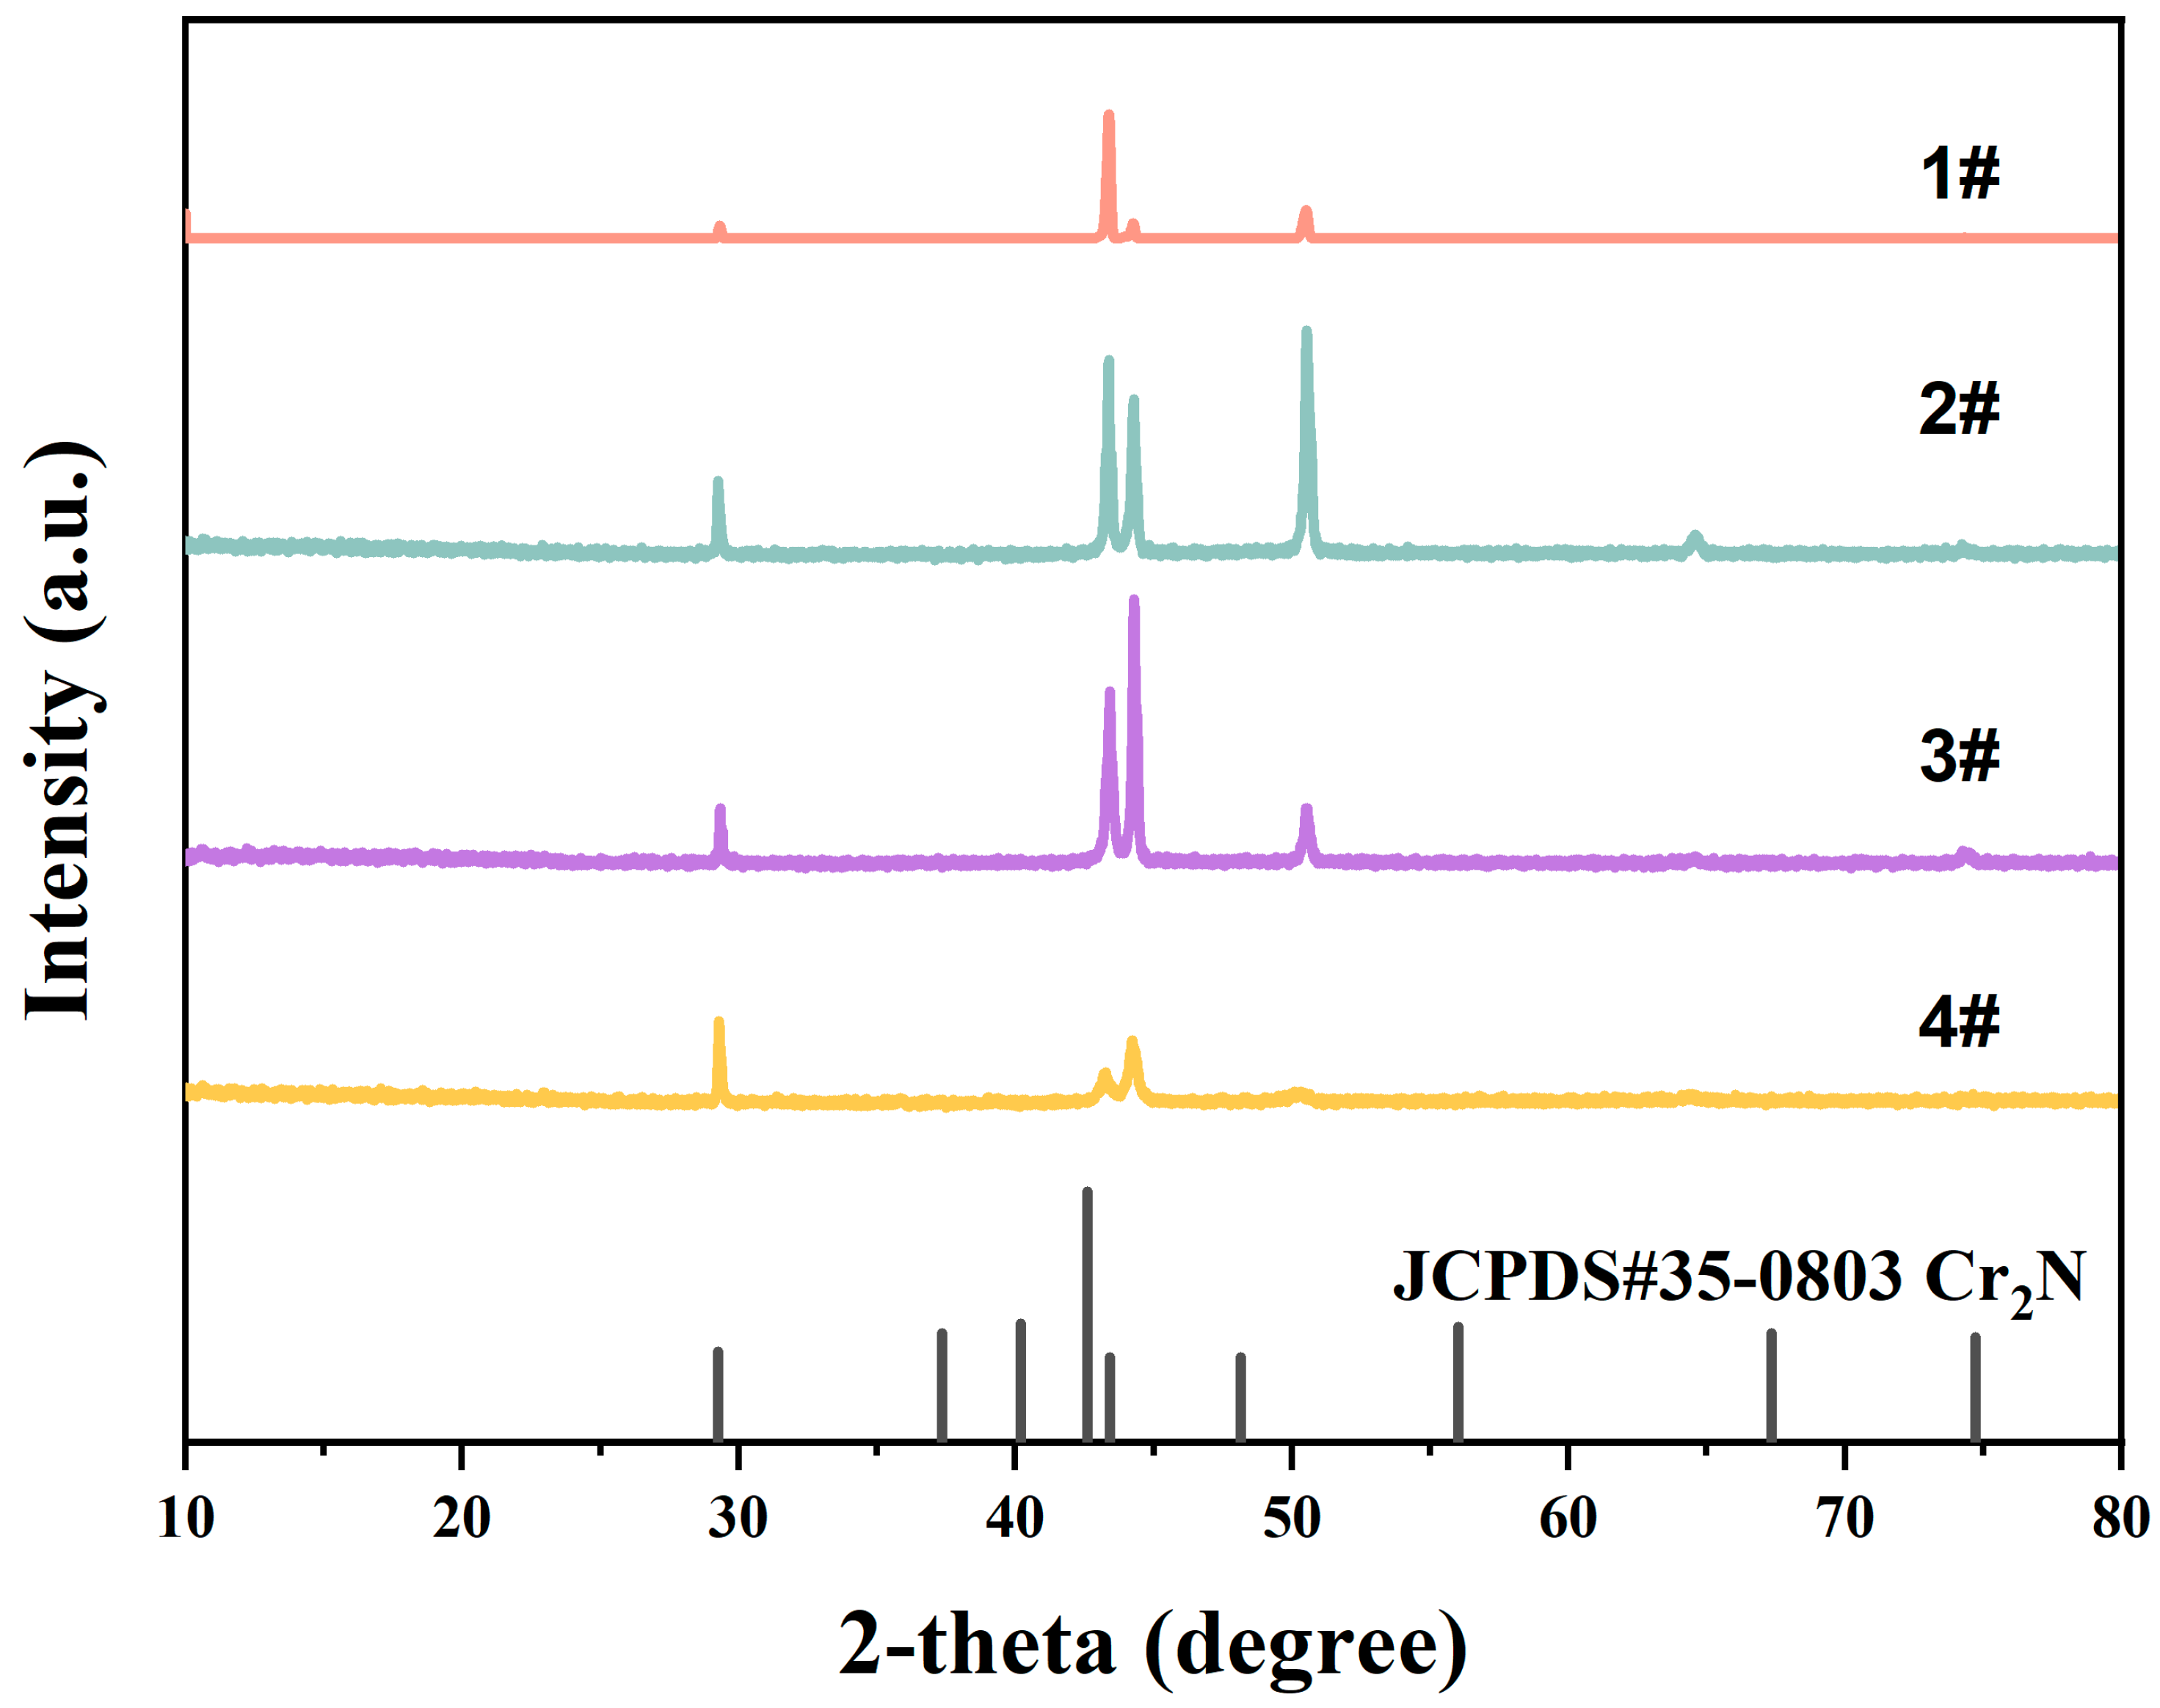
Figure 6 shows the XRD spectra comparison of the weld metal, from which it can be concluded that Cr2N exists in WM. The existence of Cr2N is because austenite nucleation and growth occur in the Ni/N/Mo-enriched regions at the ferrite boundaries during cooling of the melt pool. In the Cr-enriched region, no austenite is formed, and, as the melt pool cools, the austenite dendrites grow, leaving Cr-rich ferrite between the austenite dendrites [26].
Electron backscatter diffraction (EBSD) analysis was conducted to evaluate the microstructural evolution of the welded joints. The phase diagram and inverse pore figure (IPF) diagram of the base metal are shown in Figure 7. The base metal of 2205 duplex stainless steel exhibits elongated grains resulting from prior rolling processes, with a near-equilibrium phase distribution of austenite and ferrite (approximately 50% each). The austenite phases are uniformly dispersed as island-like structures within the ferrite matrix. In contrast, the 316L base metal consists predominantly of austenitic grains containing annealing twins, with minimal ferrite content.
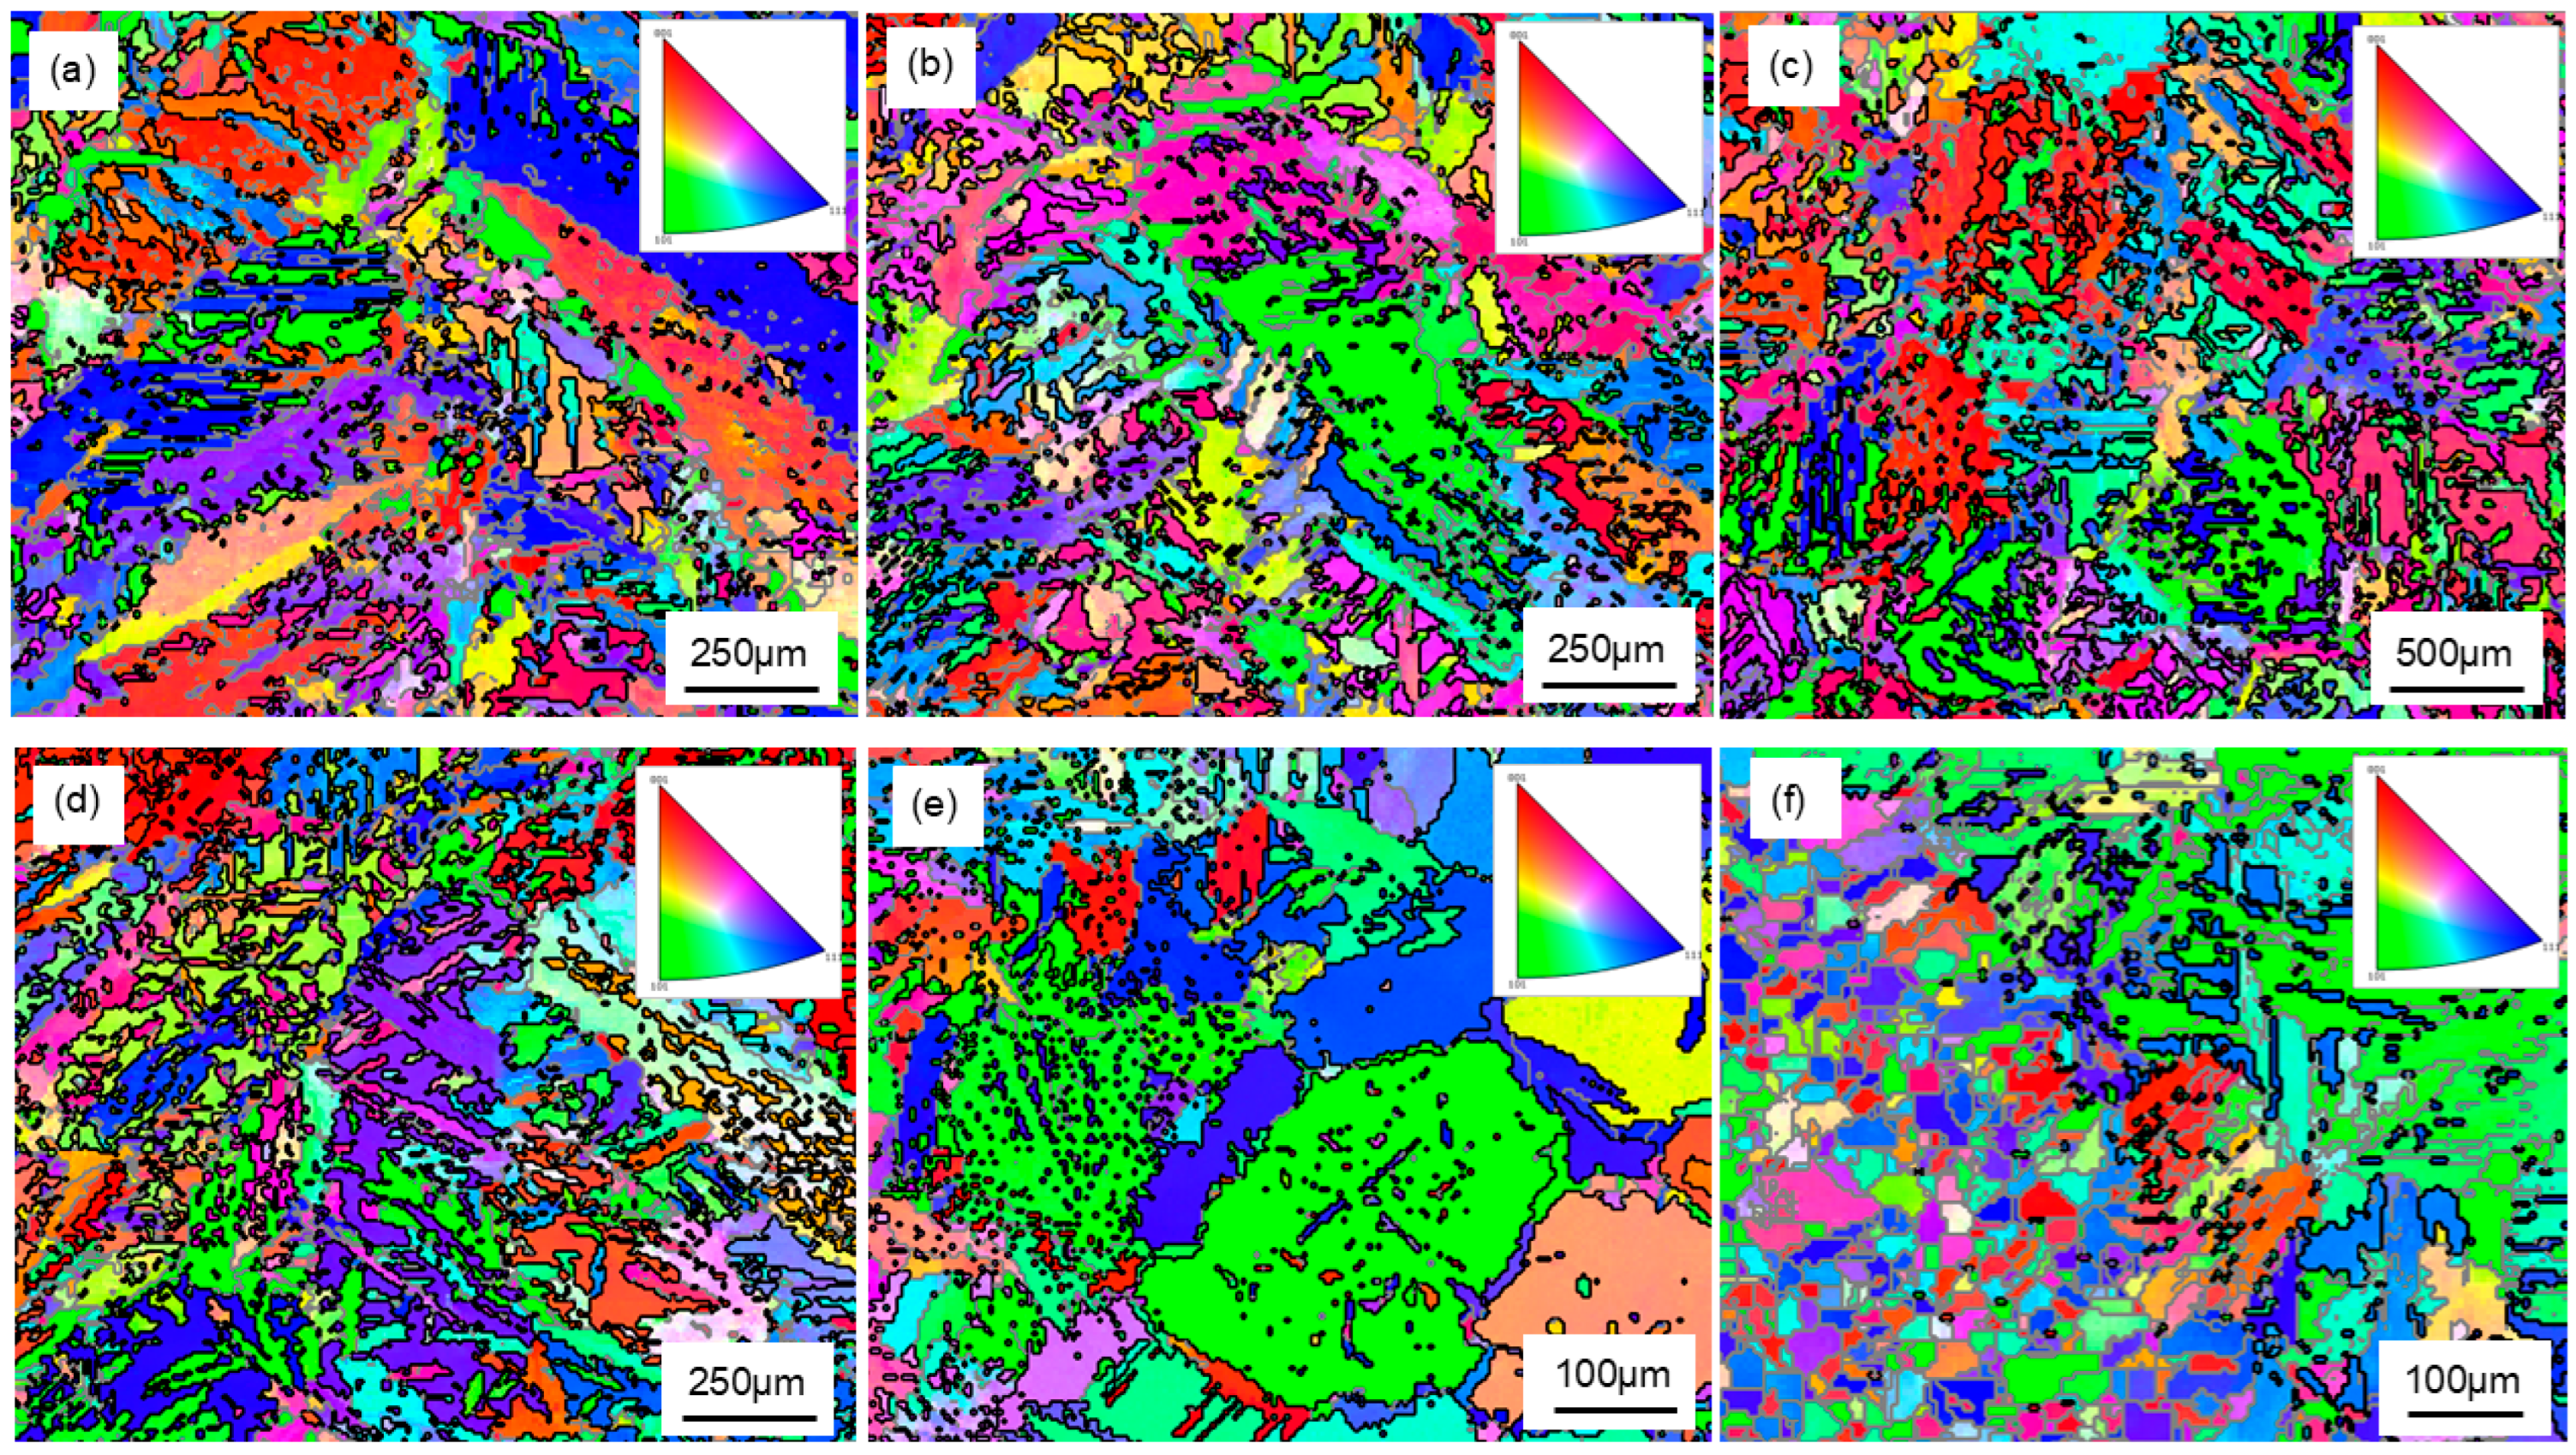
Figure 8a–d shows the IPF of weldments WZ from 1# to 4#. It can be seen from the figure that the grain orientation of WM is randomly distributed. There was a significant difference in WZ at different welding speeds. As the welding speed increases, the equivalent heat input decreases, leading to a finer dendritic structure in the WZ with a faster welding speed, whereas a larger relative heat input leads to coarser dendritic grains in the WZ of specimen 1#. Figure 8e,f shows the IPF of the fusion zone on both sides. In the heat-affected zone (HAZ) on the 2205 side, the observation revealed the growth of fine austenite dendrites within the massive ferrite matrix, while, on the 316L side HAZ, finer austenite grains are found along with a small amount of ferrite interspersed therein, which is in agreement with the previous study.
Table 3 shows the phase fractions of austenite and the average grain size in WZ. In terms of grain size, the change in cooling rate induces a change in grain size, which decreases with an increasing cooling rate in the experimental range. The percentage of austenite decreases as the welding speed increases. This phenomenon is particularly noticeable between 1#~3#, and is caused by faster cooling of the weld due to higher welding speeds. The molten metal does not have enough time to undergo the F→A transformation, and, therefore, a higher percentage of ferrite content is observed. At low welding speeds, the cooling is even slower, preserving enough time for the austenite to grow, leading to the formation of austenite grains with larger dimensions, in line with the conclusions of the previous study.
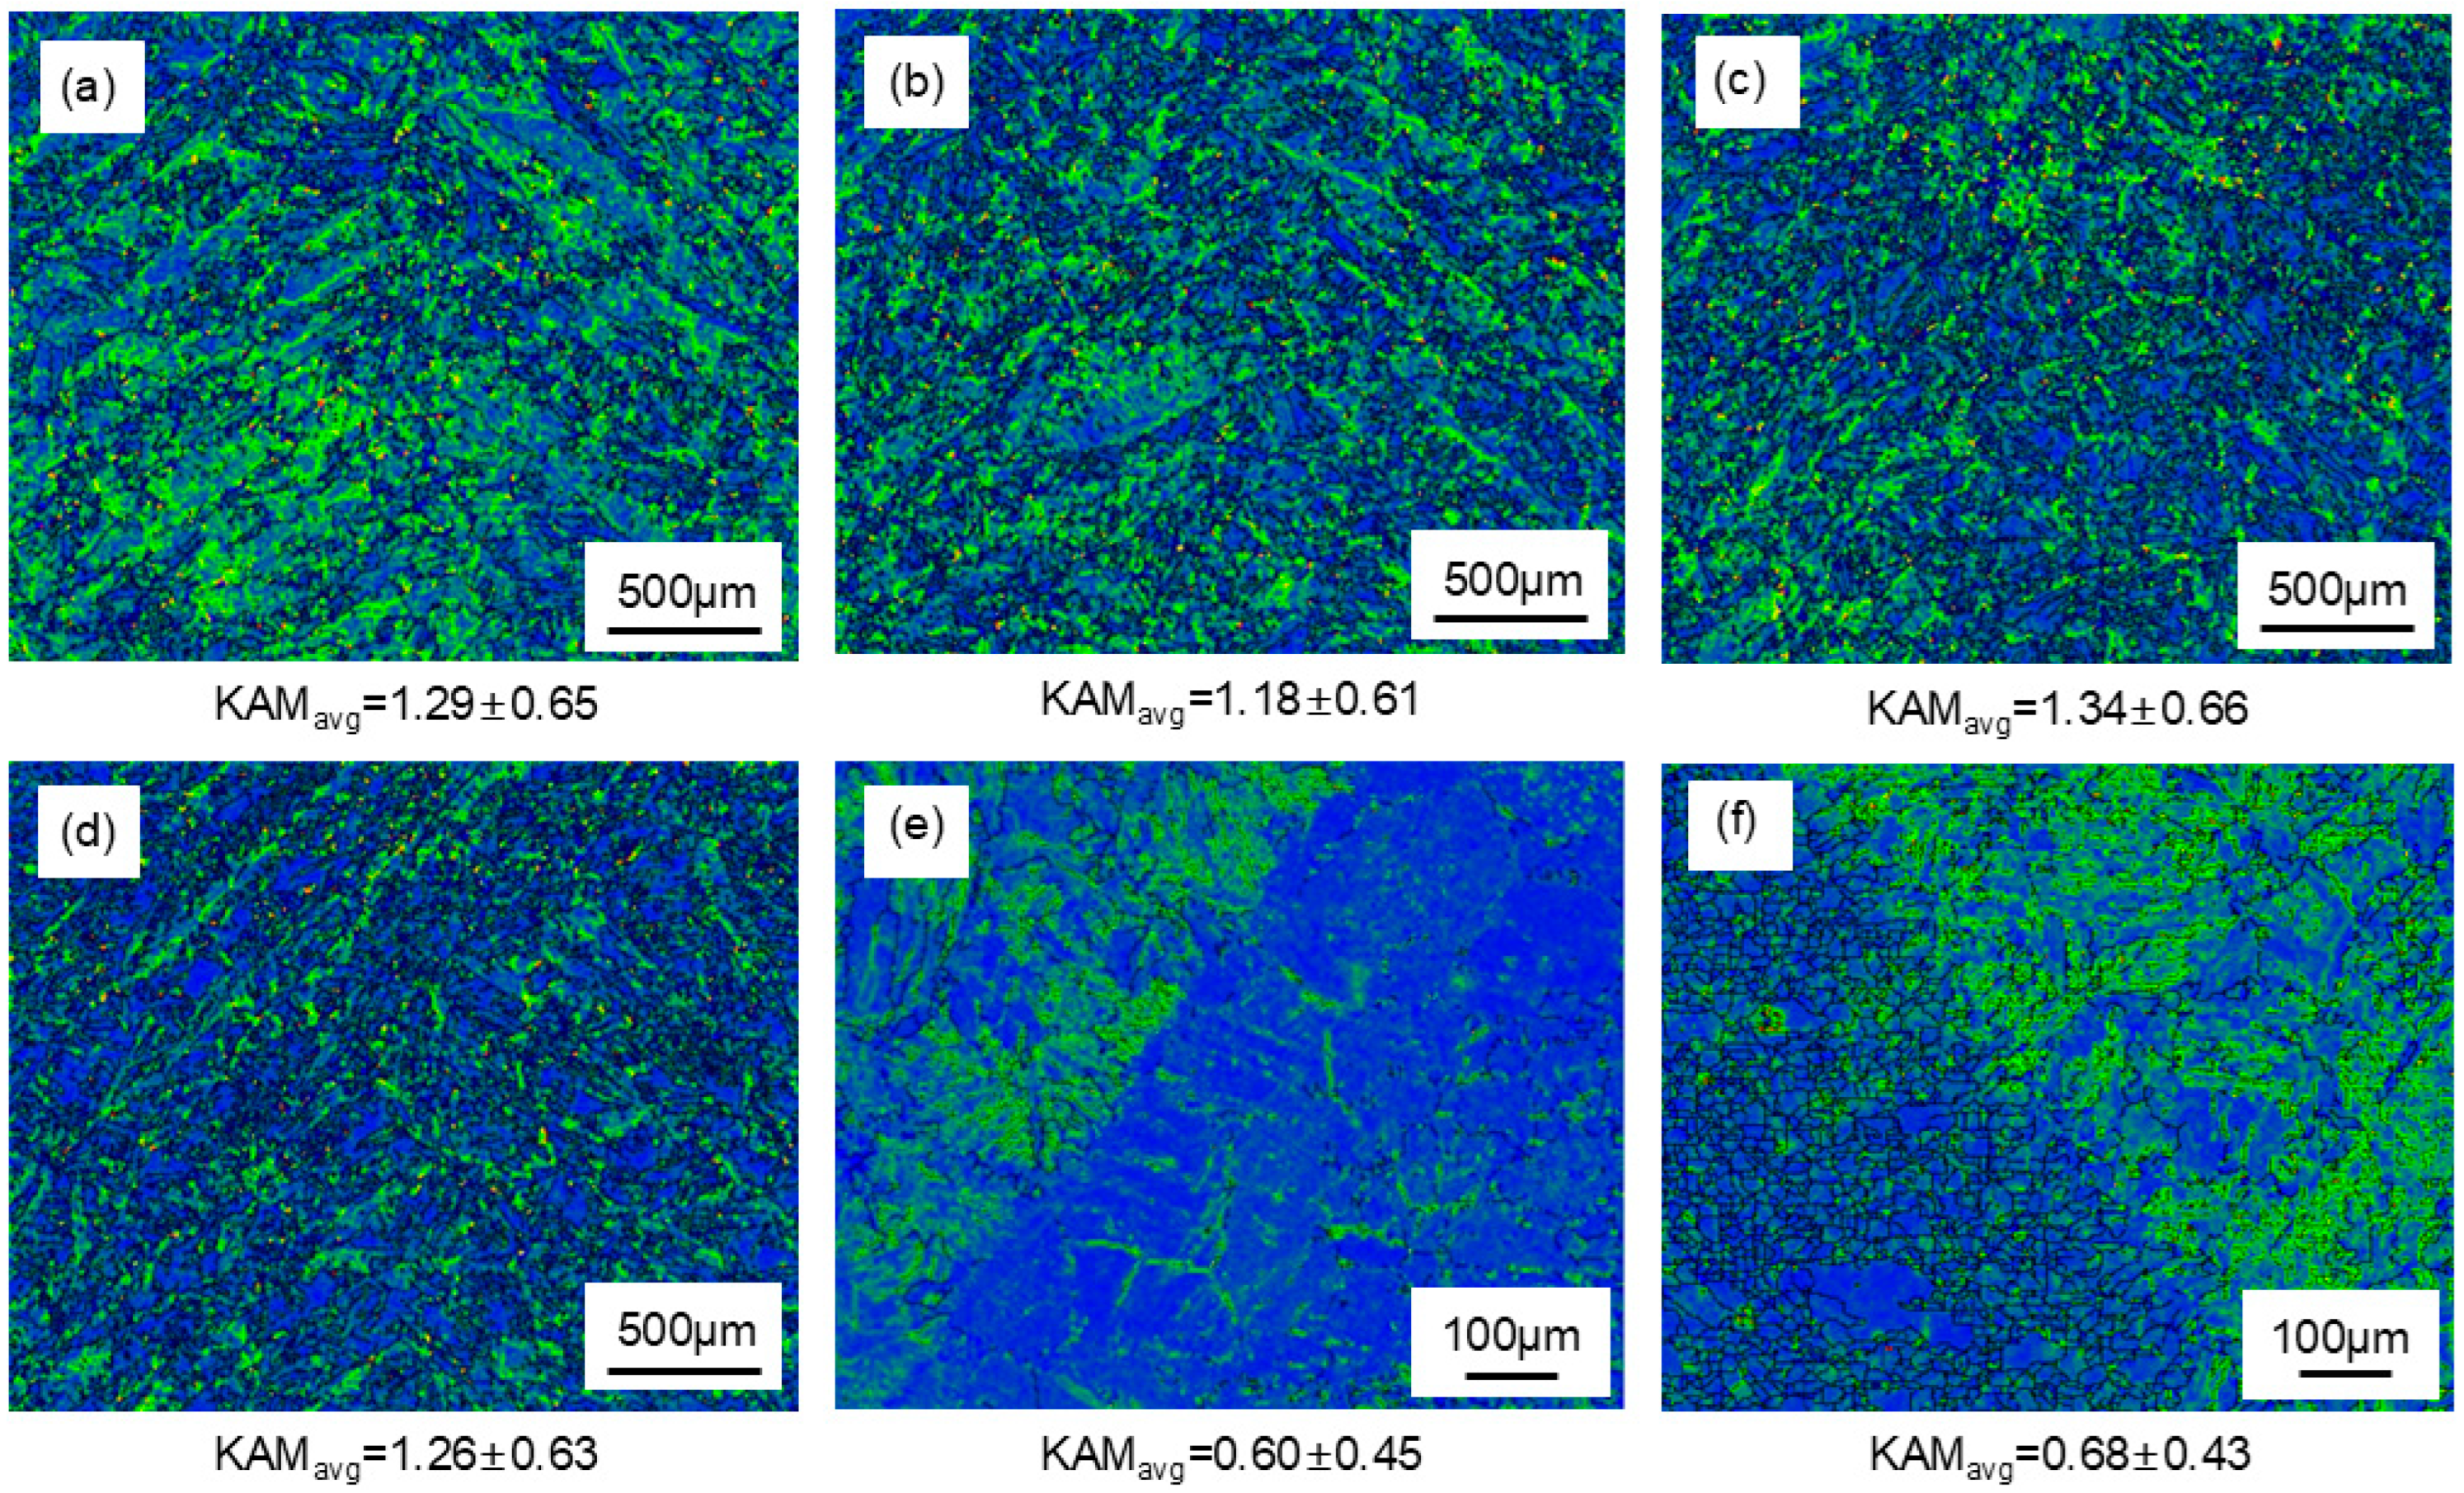
The formation of dislocations in materials originates from localized lattice orientation variations [20,27]. KAM represents the distribution of local strains and the degree of dislocation concentration in a material. Some researchers have pointed out that KAM parameters are associated with plastic deformation [28]. This correlation arises because plastic deformation induces dislocation generation and accumulation, so a higher value of KAM indicates a more difficult local deformation [29].
Figure 9 compares the spatial distribution and mean KAM values across WM regions and fusion boundaries. In the graph, it can be seen that specimen 3# has the highest value of KAM. This maximum KAM value indicates superior dislocation density and associated deformation resistance in WM of specimen 3#. Therefore, WM deformation of specimen 3# may be more difficult to occur. The KAM value in the area near the fusion line on the 316L side reaches 0.68, which is lower than that in the weld area, due to the fact that the ferrite content in the HAZ on the 316L side is only 2.16%; it is usually thought that austenite is not as dislocated as ferrite, resulting in its low KAM value. In the area near the fusion line on the 2205 side, although the proportion of ferrite is relatively high and there is a high degree of dislocation near the growth of fine austenite in ferrite, the large grain size leads to fewer grain boundaries, resulting in a low KAM value in the fusion zone.
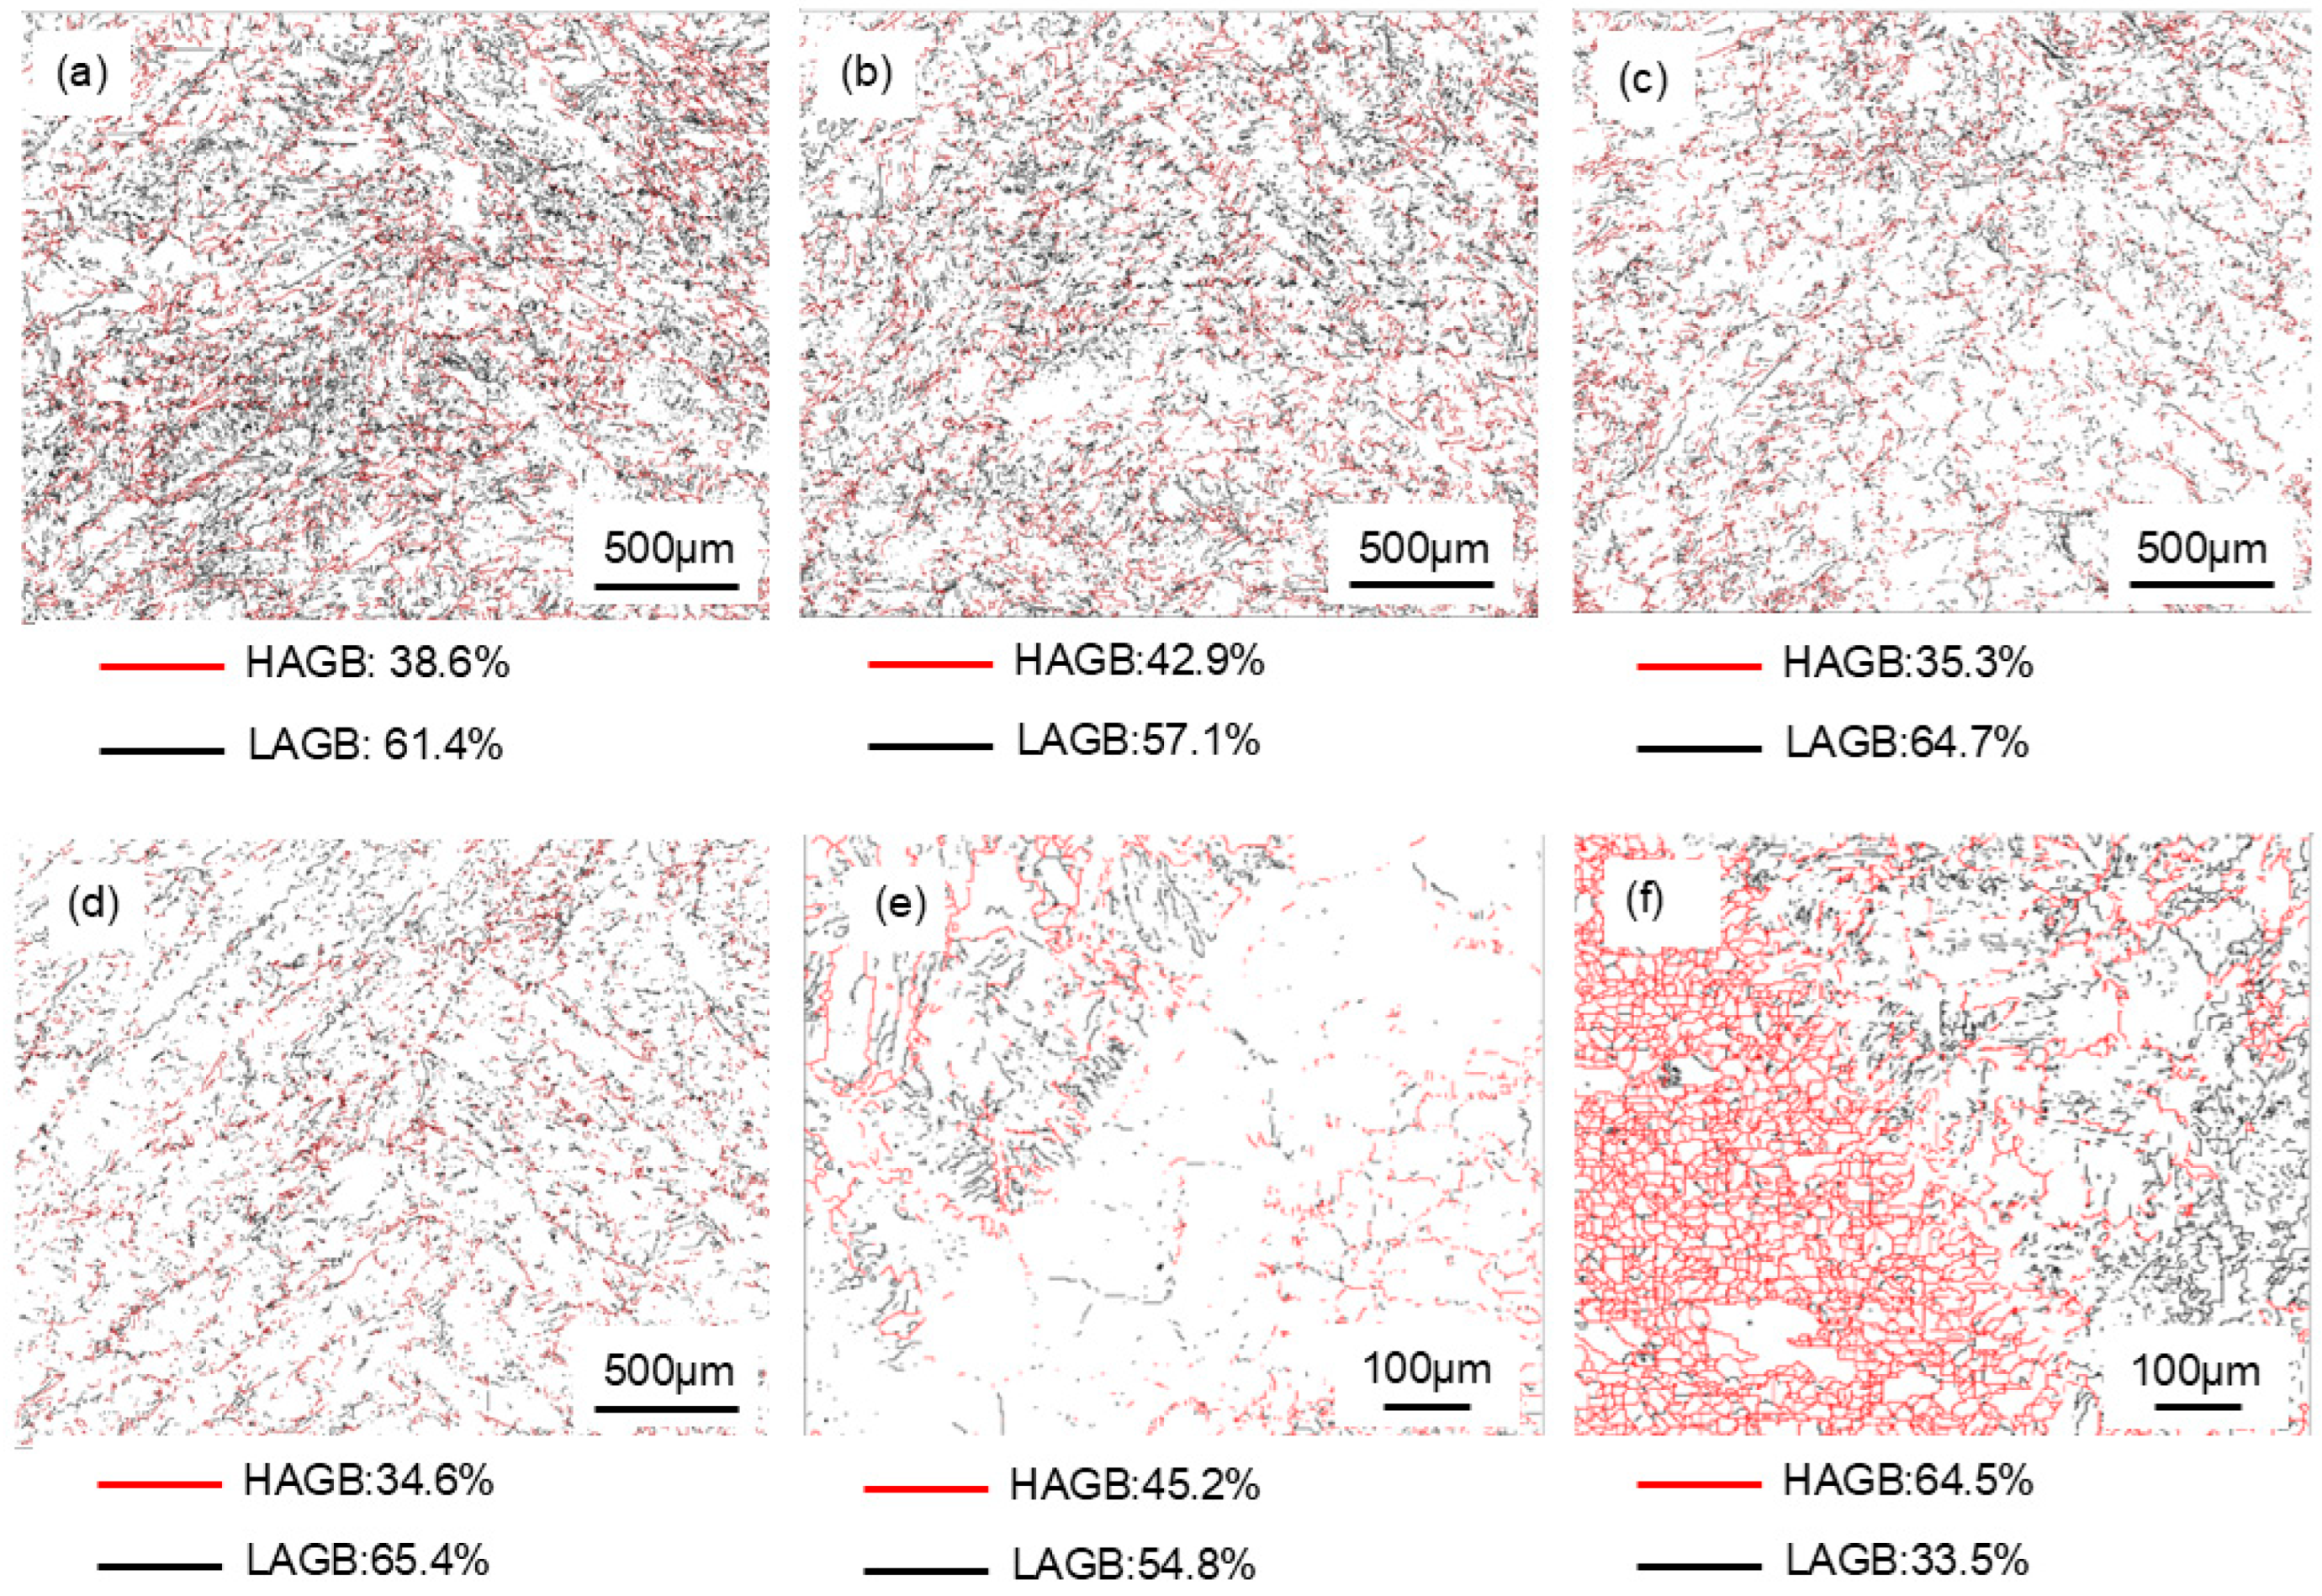
Grain boundaries are classified as high-angle boundaries (HAGBs, >15° misorientation) and low-angle boundaries (LAGBs, 2°–15°) based on crystallographic misorientation criteria [30]. In Figure 10, HAGBs are delineated in red and LAGBs in black. The distribution of these boundaries critically governs material performance, where HAGBs enhance toughness, strength, and corrosion resistance by impeding brittle crack propagation, and LAGBs are predominantly present in WM tissues. It can be observed that the content of HAGBs is slightly higher in specimen 2# compared to other specimens. It is worth noting that, in the fusion boundary on the 316L side, the content of HAGBs was significantly higher than that of WM. This is because HAGBs mainly exist in austenite. On the 2205 side of the fusion boundary, although the ferrite content was higher, due to the excessive volume of the primary ferrite in the HAZ, the total amount of grain boundaries was not high, resulting in a higher proportion of HAGB than WM.
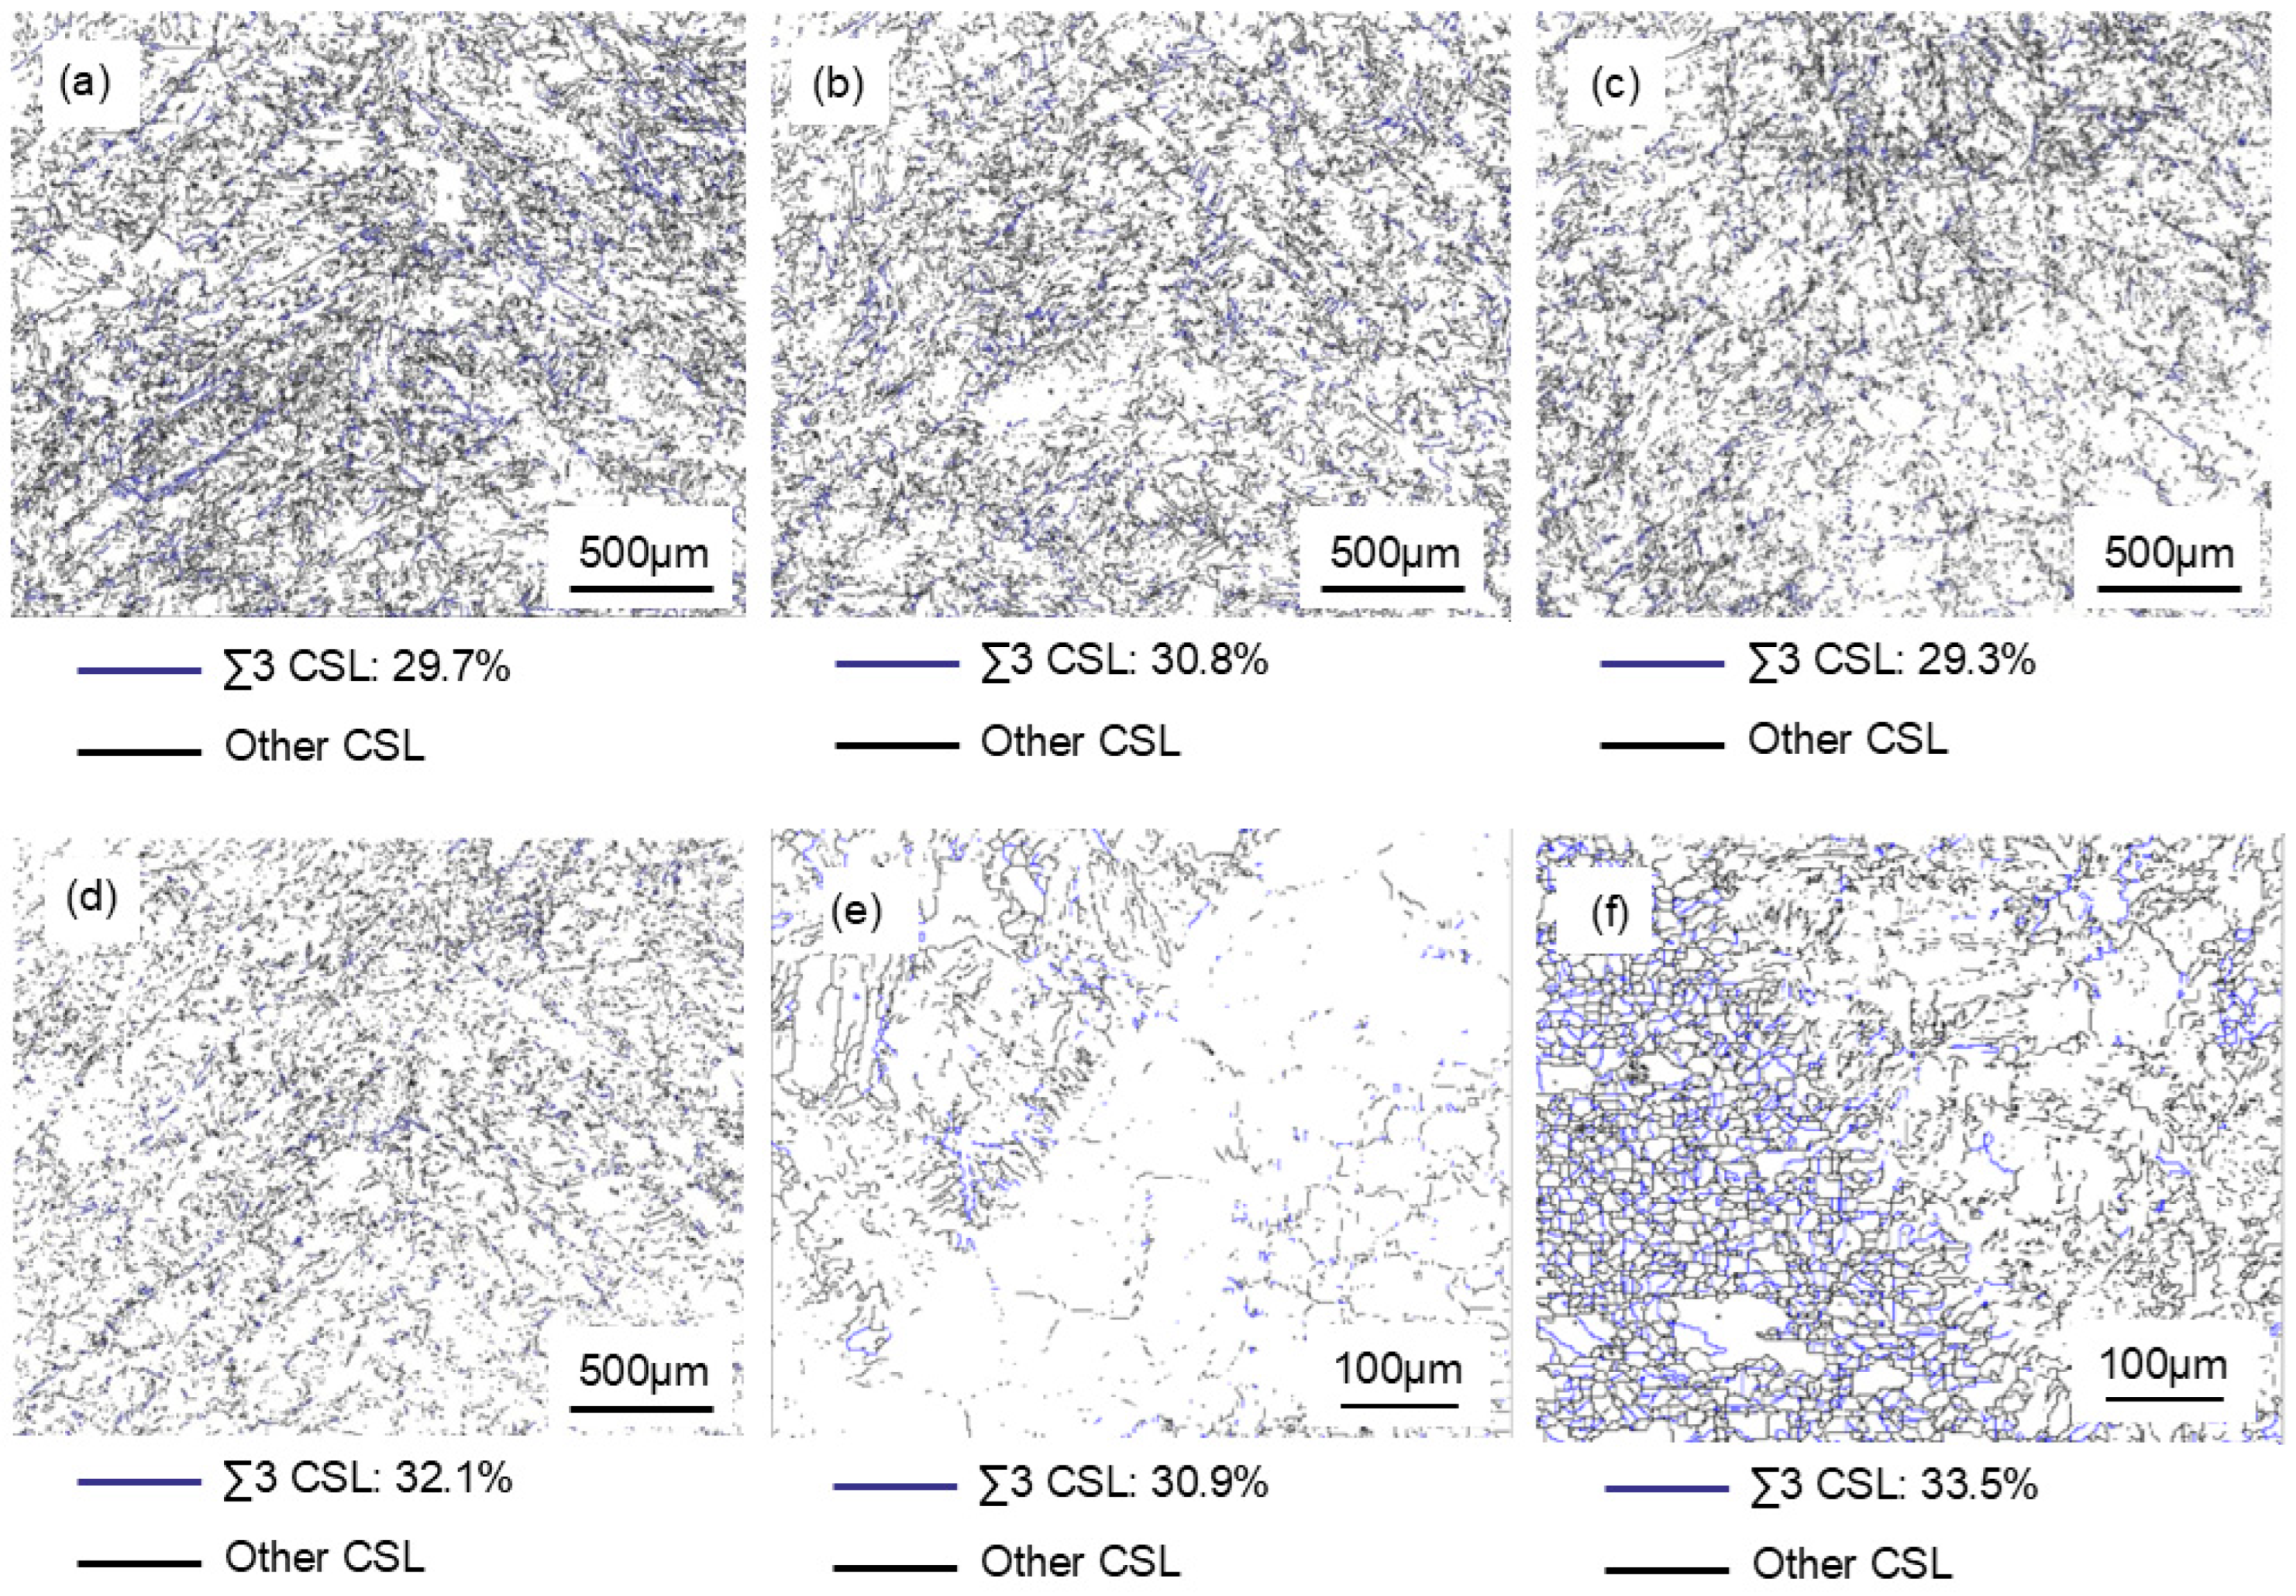
Coincidence site lattice (CSL) grain boundaries, characterized by reduced interfacial energy and limited impurity segregation, represent a specialized class of crystallographic interfaces. Enhanced Σ3 CSL density directly correlates with improved resistance to intergranular corrosion and elevated impact toughness, as these boundaries minimize overall interfacial energy during grain growth processes [31]. Figure 11 shows that the overall proportion of Σ3 CSL exhibits little variation. Specimen 4# demonstrates the highest proportion among all specimens. This finding suggests that the WM of specimen 4# might possess favorable mechanical properties. The relatively high percentage of Σ3 CSL in the vicinity of the 316L fusion line can be attributed to the fact that a small amount of Σ3 CSL exists in ferrite, while a significant amount is present in austenite. Furthermore, although there is a higher proportion of ferrite in the 2205 fusion zone, the larger ferrite grains in the HAZ result in a lower total number of grain boundaries. This leads to the percentage of Σ3 CSL in the 2205 fusion line remaining at a level comparable to that of WM.

3.3. Mechanical Properties

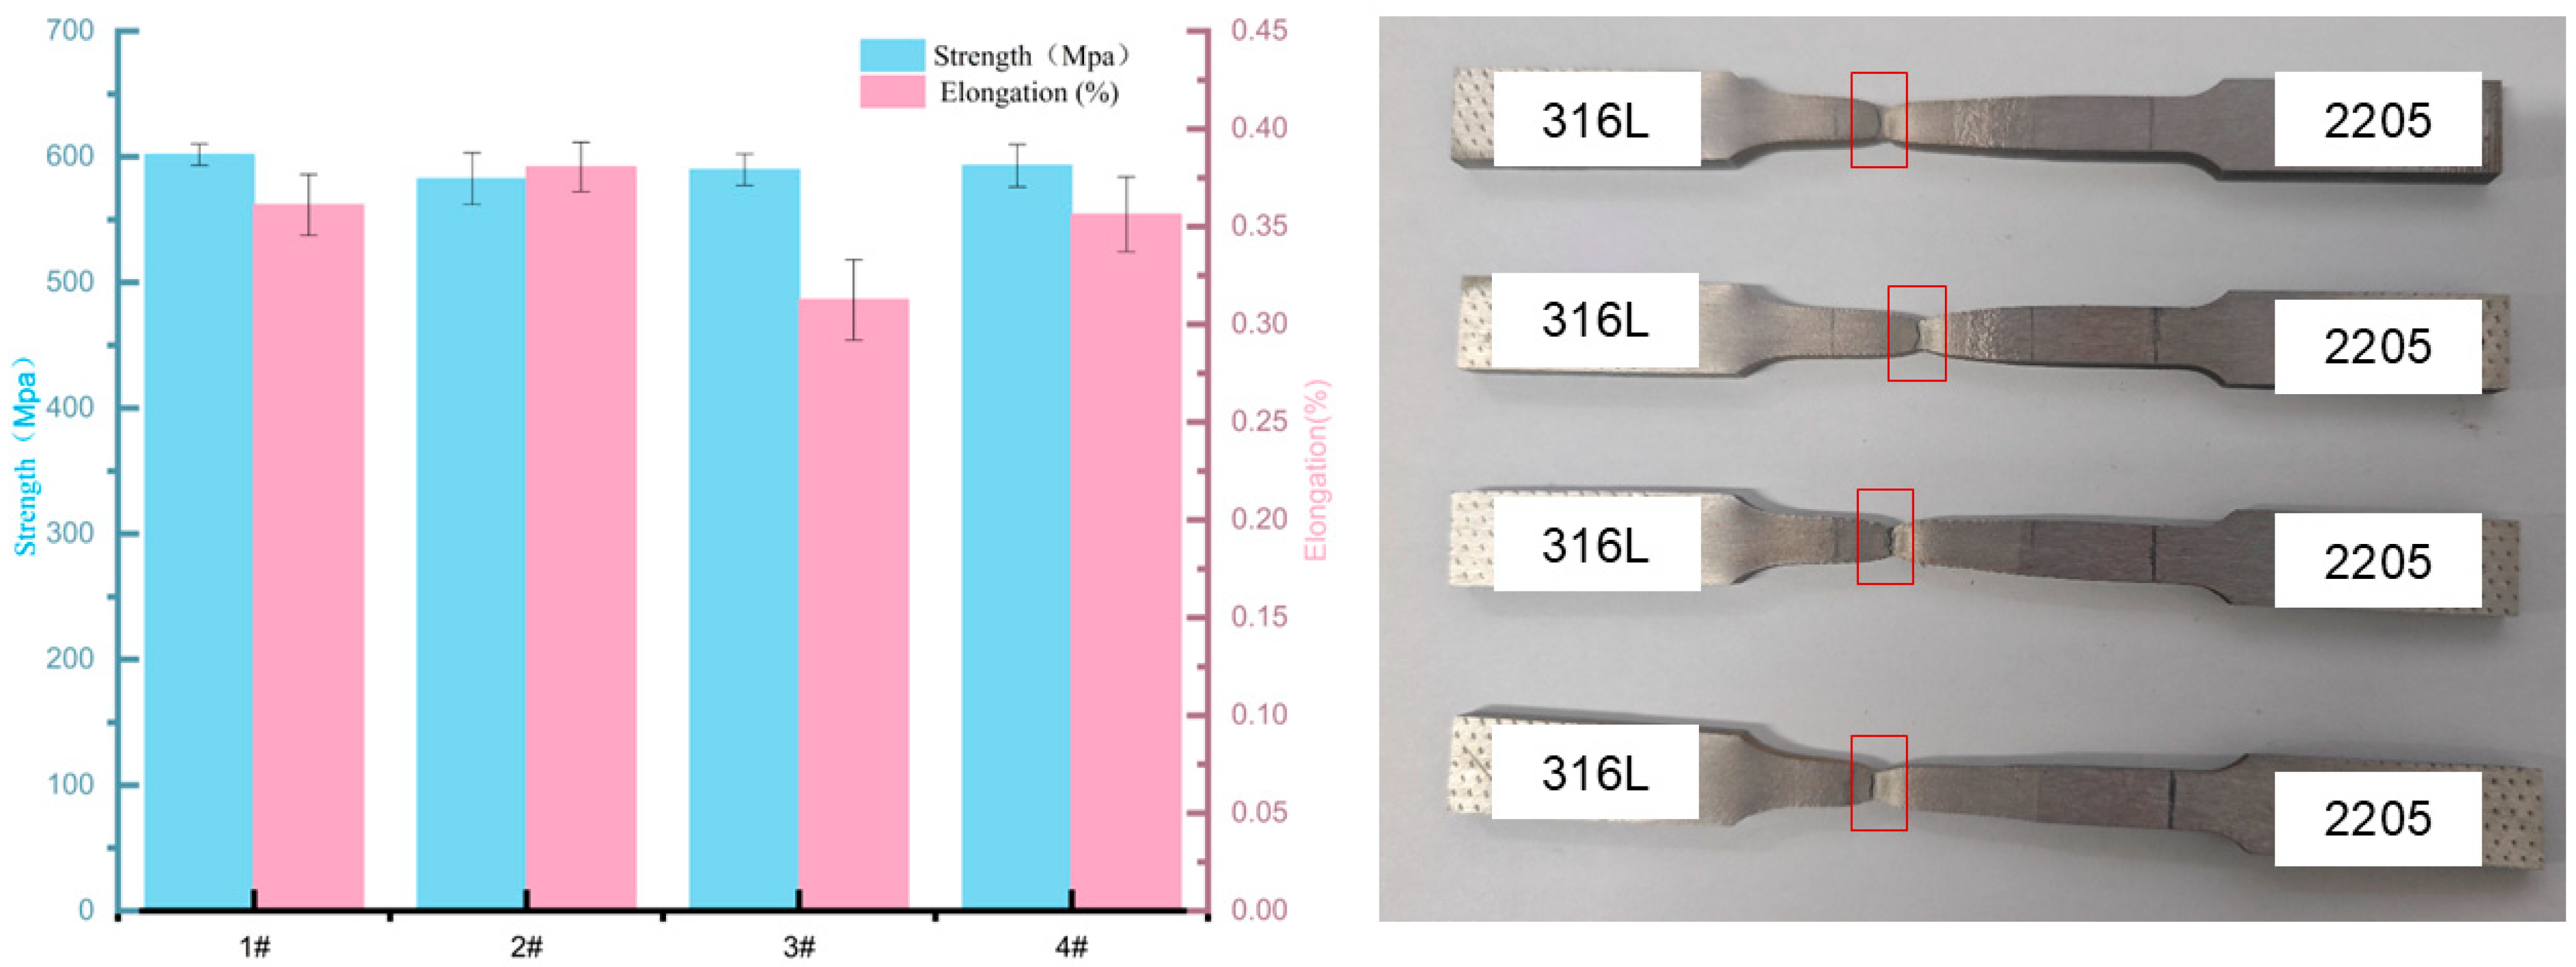
The results of the specimen tensile tests are shown in Figure 12. The tensile tests showed that all the specimens fractured at the 316L base metal, and the tensile strength was similar to that of 316L, indicating that the tensile properties of the weld region and heat-affected zone of the four groups of specimens were better than those of the 316L base metal. This is due to the austenite morphology in WM as fine equiaxed crystals, which produces a grain strengthening effect and increases the strength and plasticity of the metal. The 2205 side of the fusion line in the area around the fusion line has a high ferrite content to ensure tensile strength. The 316L side of the fusion line is close to the high HAGB region, and, at the same time, the presence of uniform fine-skeleton ferrite in the grains produces a tensile synergistic deformation effect, which in turn increases the strength of the region. These reasons together result in tensile fracture locations on the weakest 316L base metal side. This phenomenon is also seen in TIG joints [30], indicating that both have similar properties. From a strength point of view, the K-TIG welding process is suitable for this different joint.
The microhardness distribution of a specimen is mainly controlled by three interdependent factors: austenite/ferrite ratio, alloying element distribution, and grain boundary properties. Since ferrite is harder relative to austenite, an excessively high austenite volume fraction reduces the overall hardness of duplex stainless steel. Alloying elements enhance mechanical properties through solid solution strengthening, and their content has a critical effect on the overall weld metal hardness. Accompanying factors such as elevated austenite content, alloying element depletion, and reduced HAGB density together lead to a reduction in WM hardness. In addition to this, Cr2N precipitation hinders dislocation movement through precipitation–dislocation interactions, while oxide inclusions induce localized hardness increase through microstructural discontinuities.
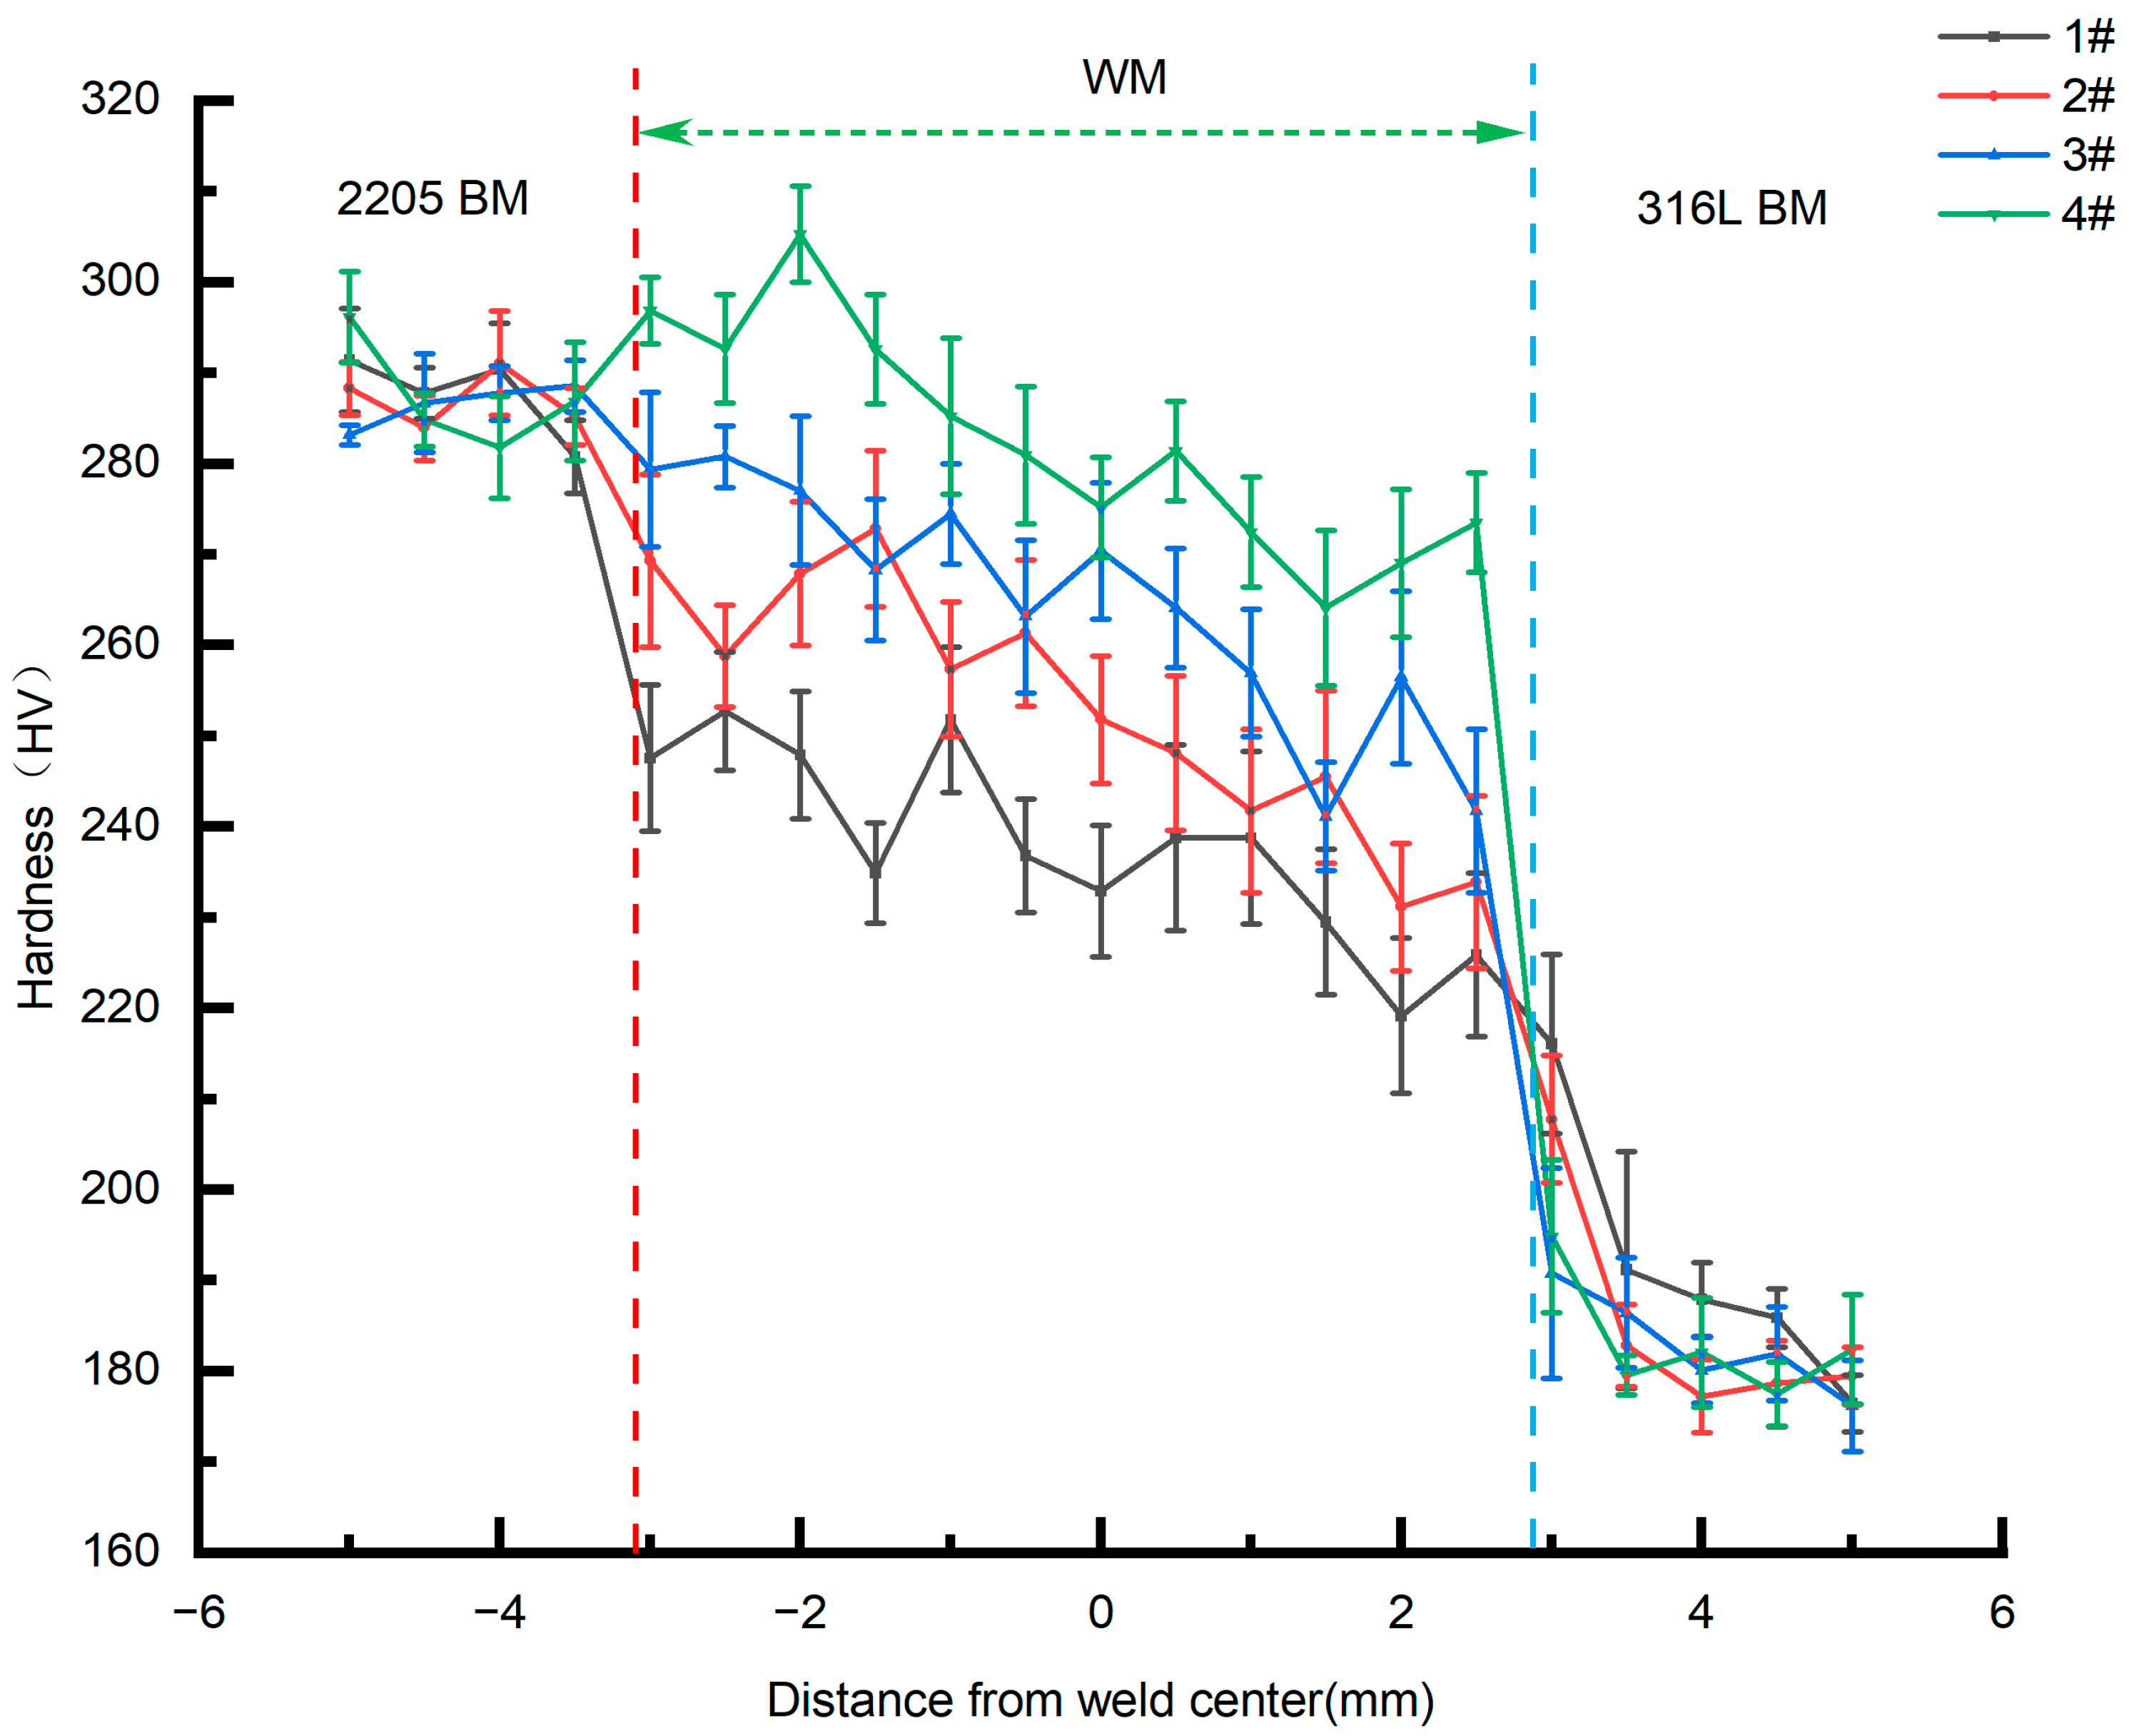
Figure 13 illustrates the microhardness distribution across dissimilar weld joints, revealing WM hardness values intermediate between the 2205 and 316L base metals. Specimen 4# exhibits superior WM hardness compared to other specimens, attributable to refined ferritic grain structures resulting from reduced heat input and subsequent phase fraction alterations. The hardness of the K-TIG welded joint exceeds that of the TIG welded joint and the A-TIG welded joint [32]. Specifically, the average hardness increases by about 19%.
Conversely, specimen 1# demonstrates diminished WM hardness due to coarser austenitic grains and reduced ferrite content. Comparative analysis establishes an inverse proportionality between hardness and grain size across varying welding speeds, with grain refinement emerging as the predominant hardening mechanism despite concurrent influences from grain boundary misorientation and KAM values. This inverse grain size–hardness correlation aligns with Hall–Petch relationship fundamentals [33,34]. The hardness of the HAZ was not detected in the hardness test, which was caused by the extremely narrow width of the HAZ on both sides.
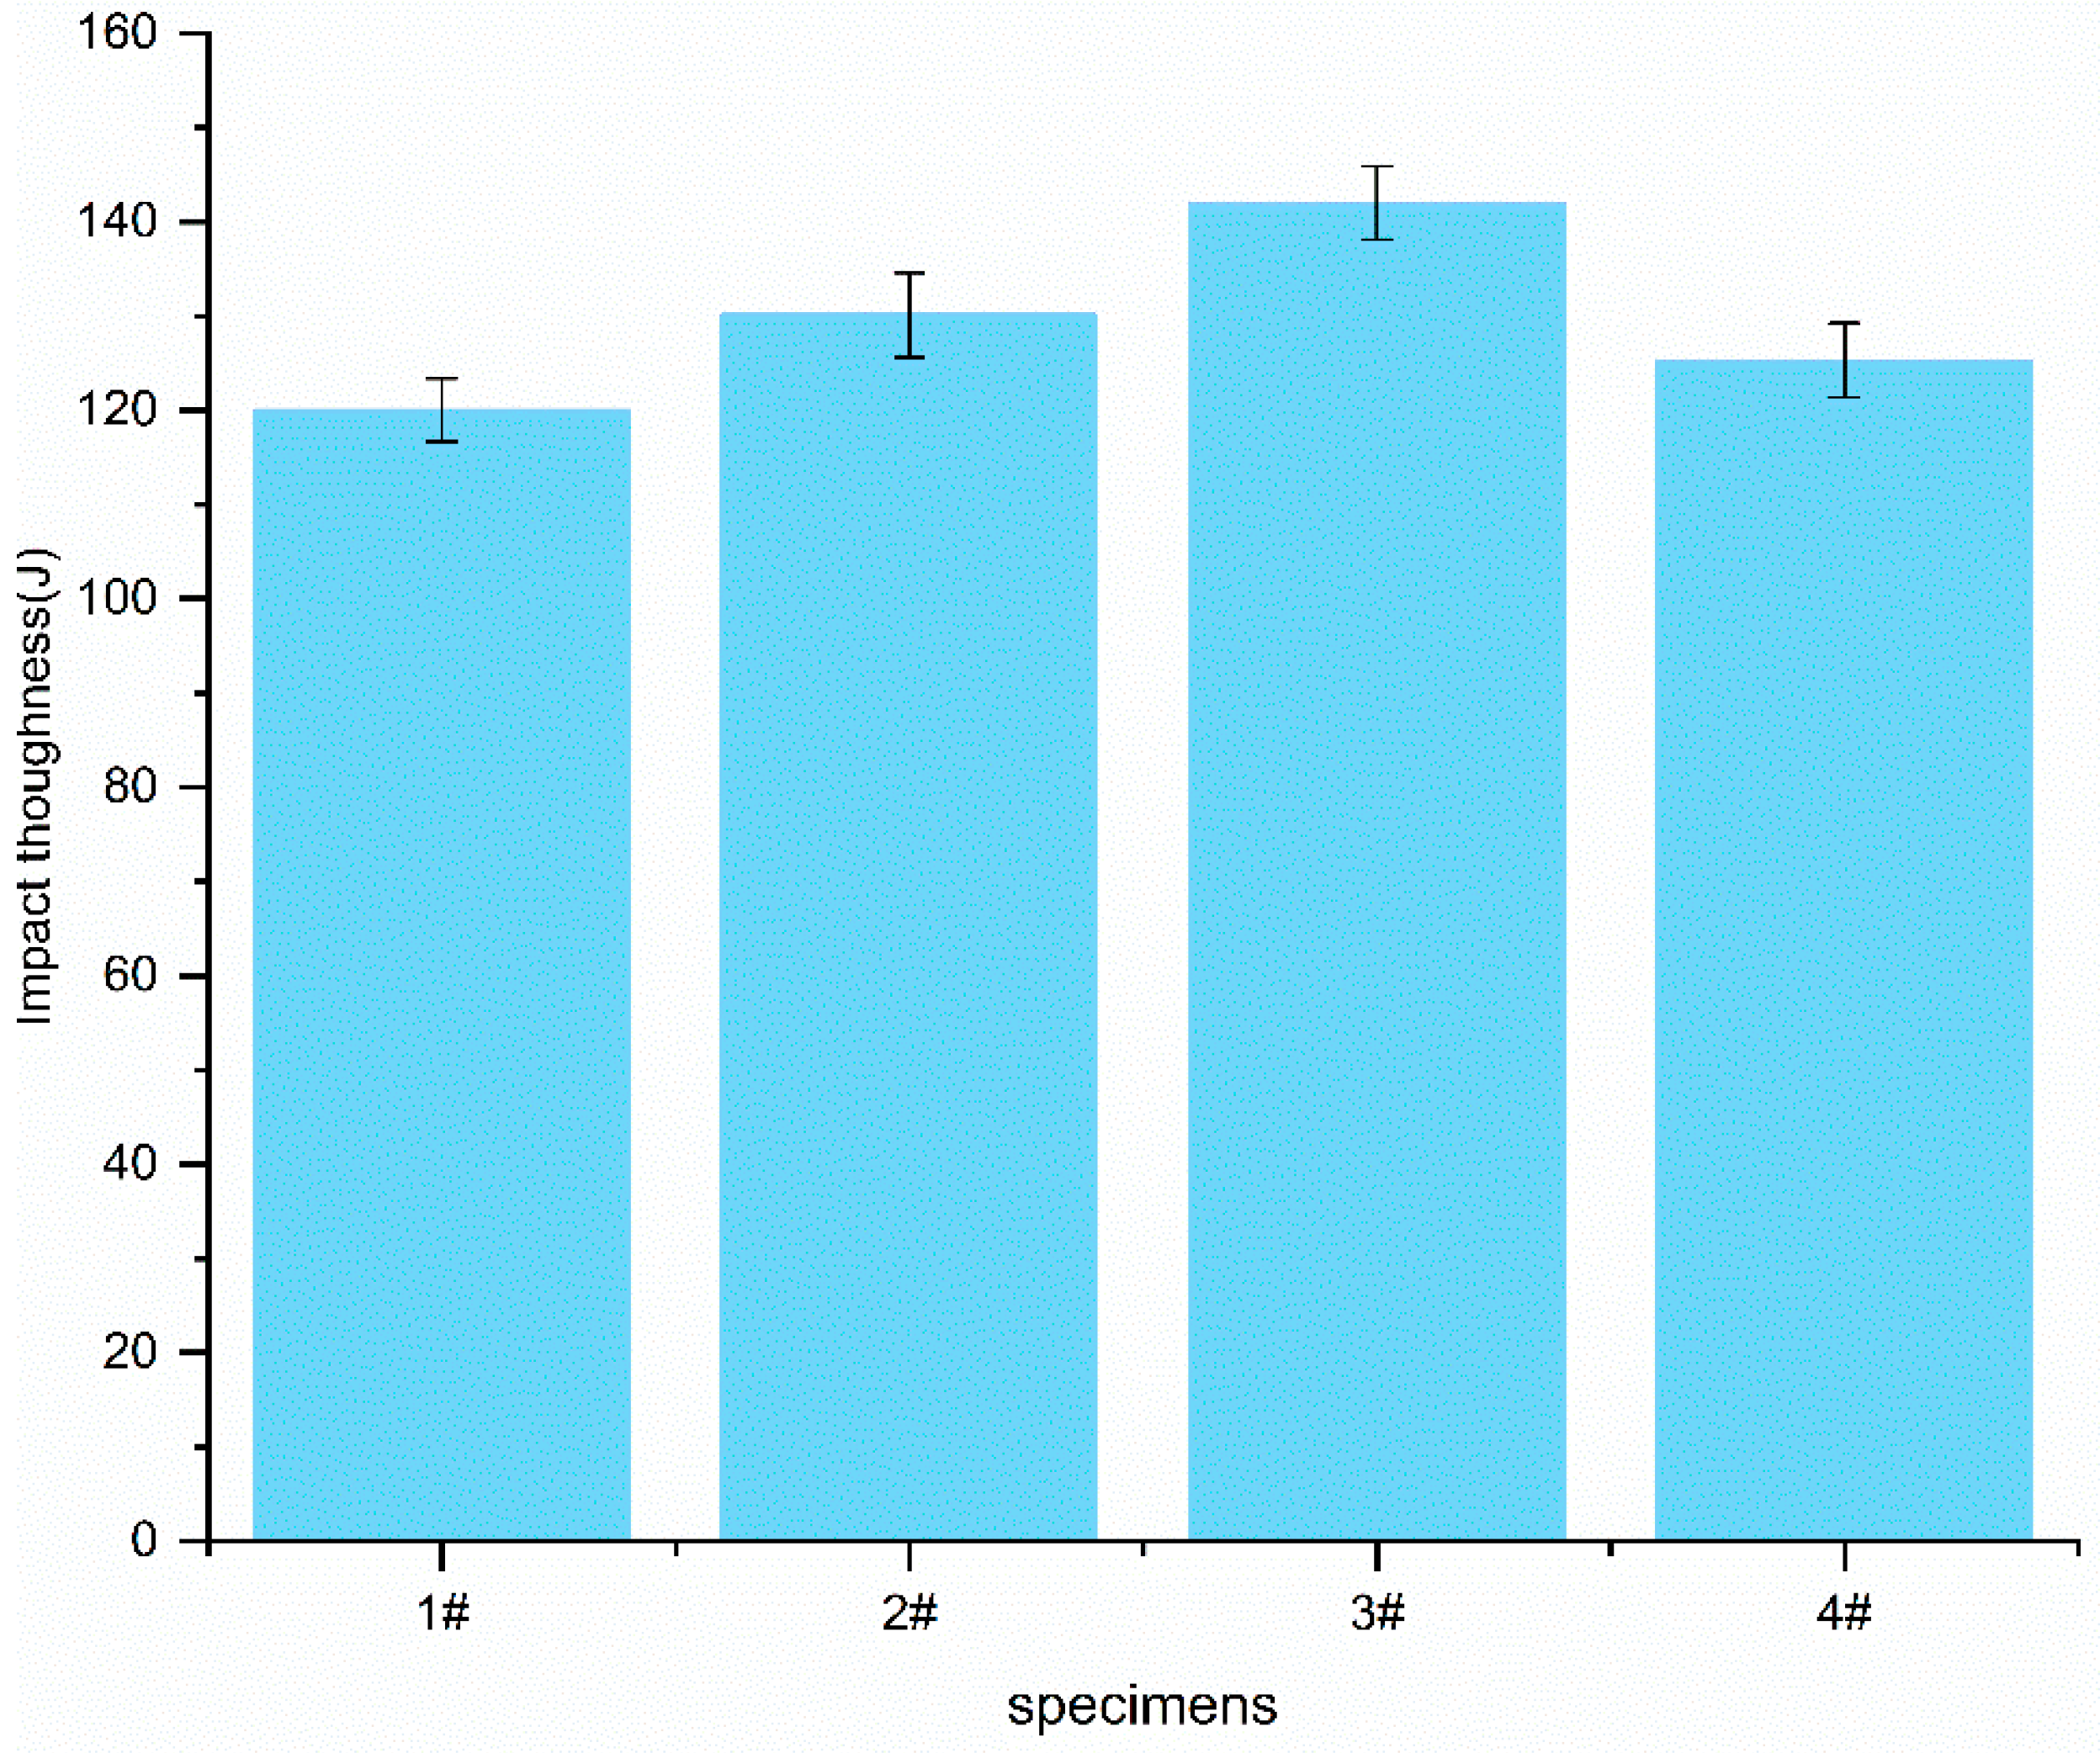
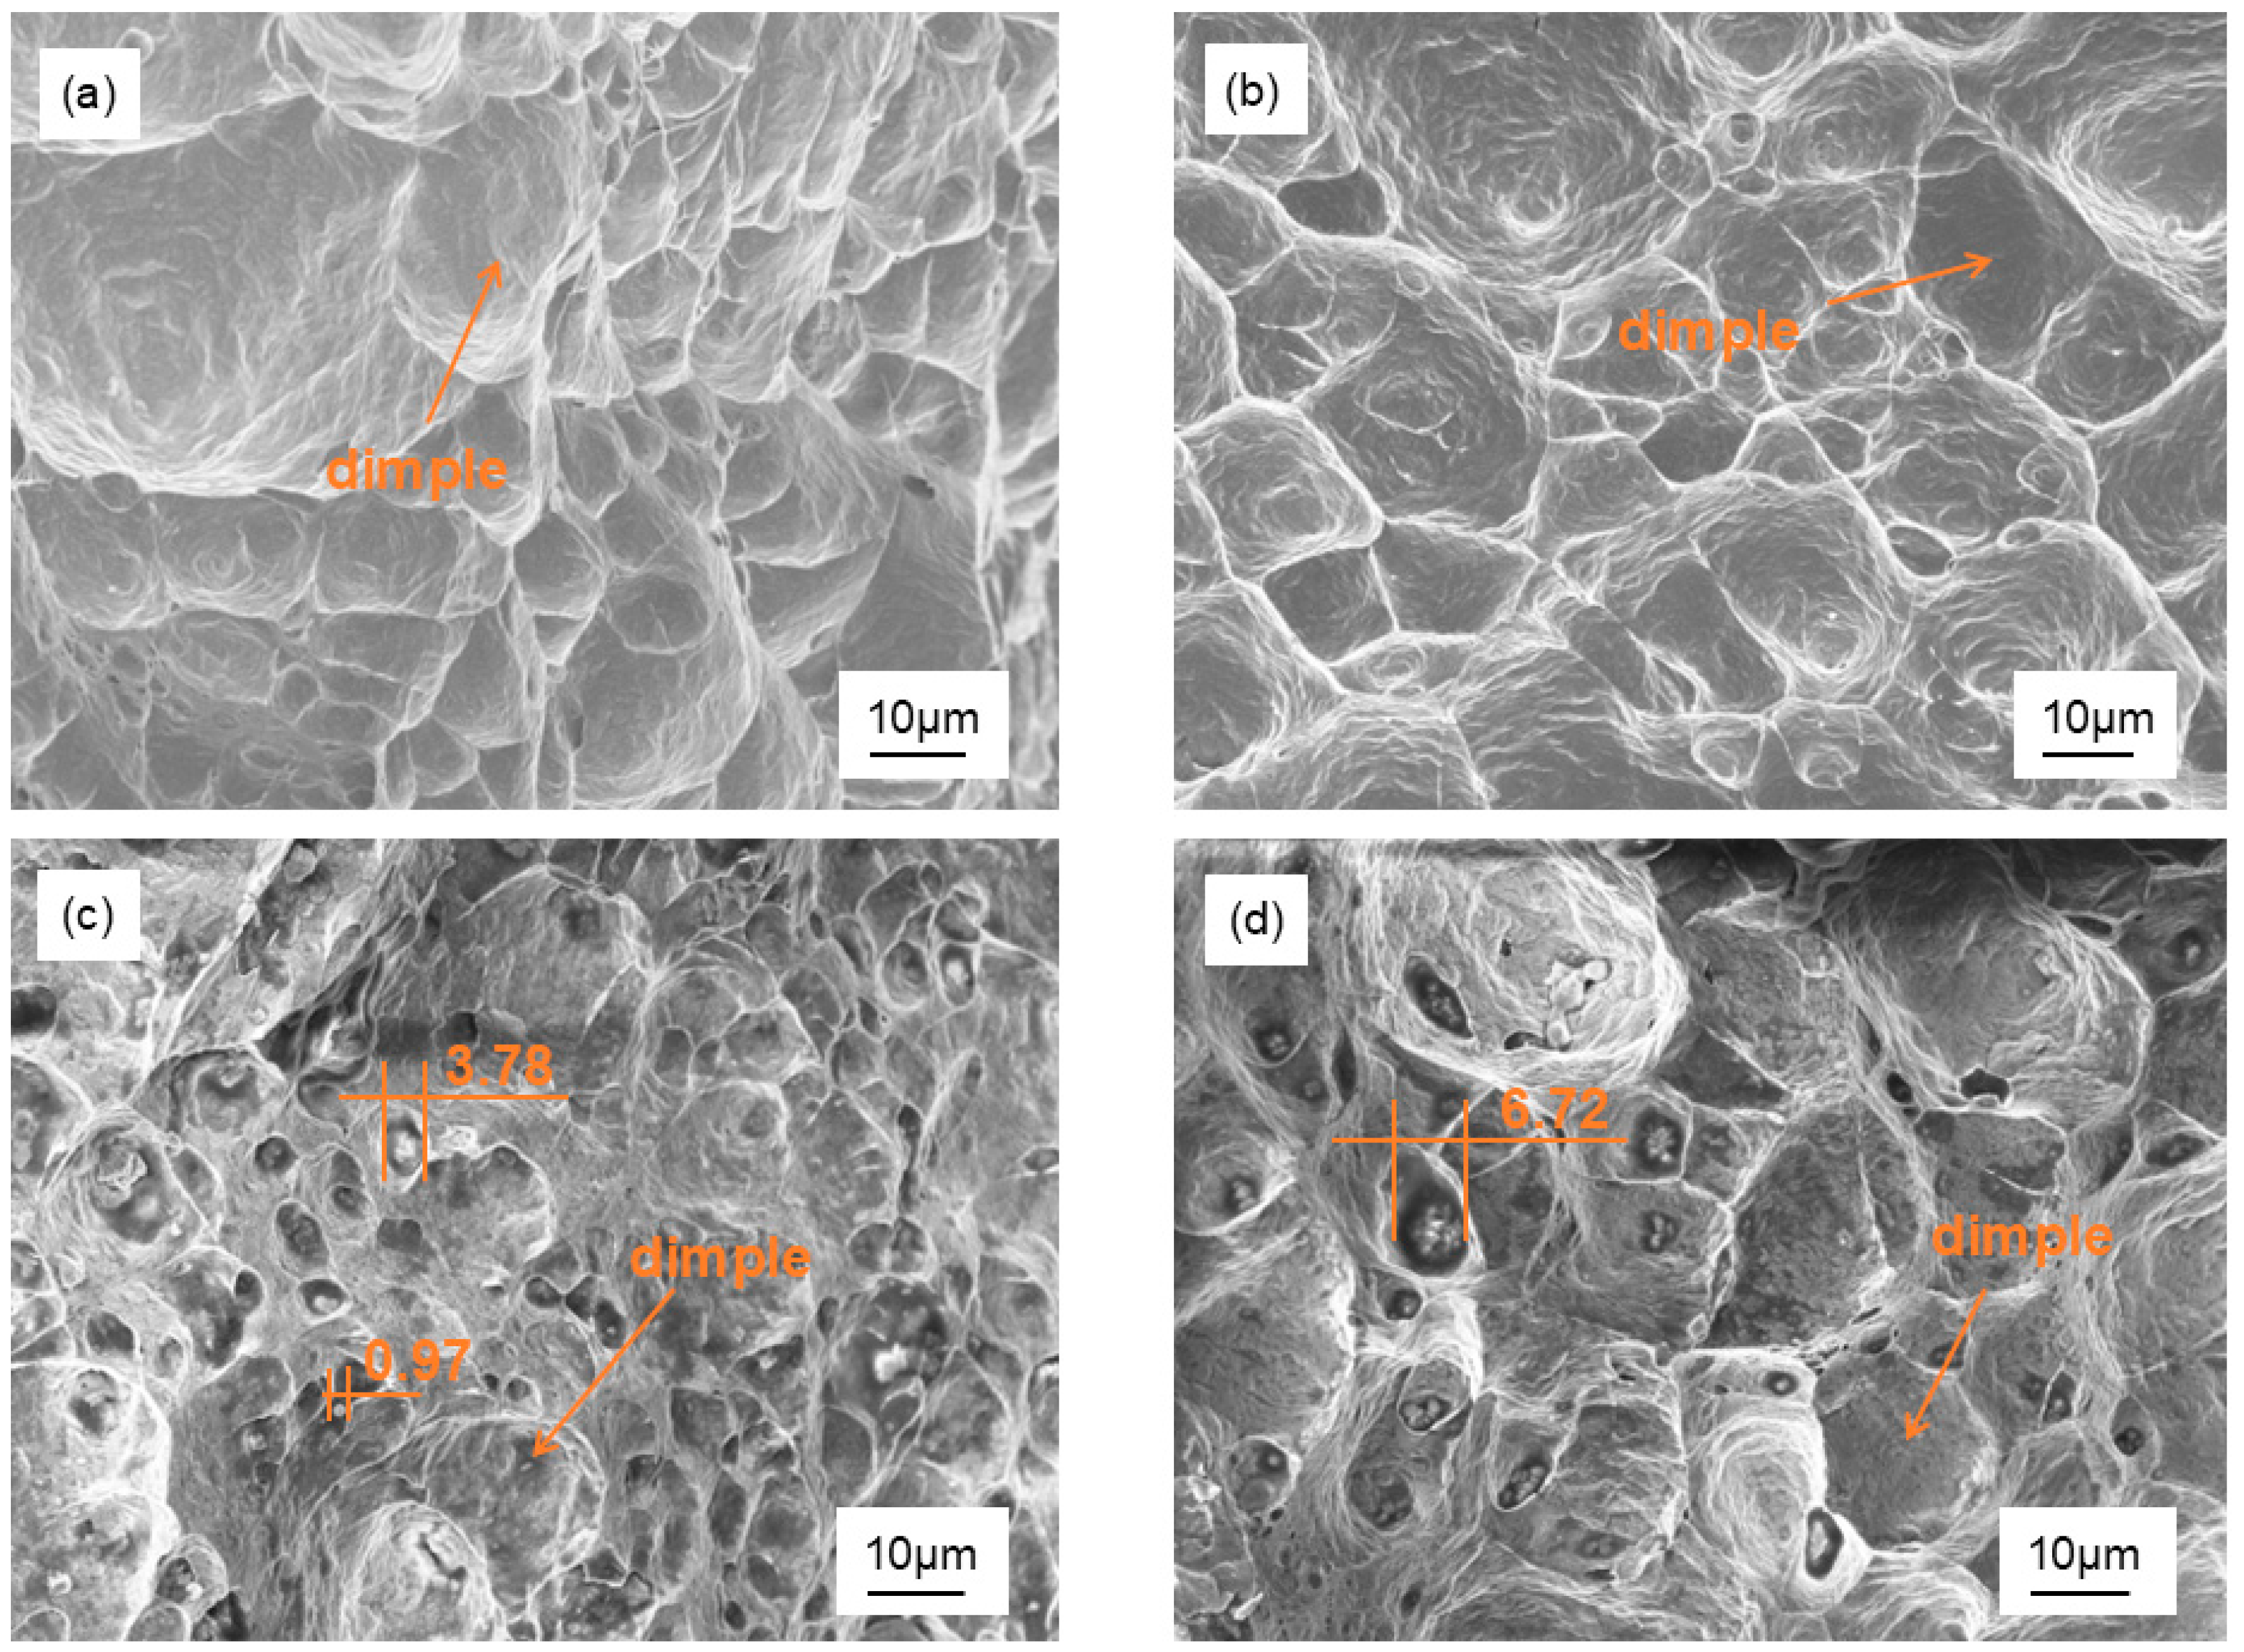
Figure 14 and Figure 15, respectively, present the results of the Charpy impact test and the corresponding SEM images of the impact fracture surfaces. They demonstrate the correlation between the welding heat input parameters and the fracture behavior. Thermal input variations significantly influence impact toughness via microstructural modifications, particularly through ferrite–austenite phase fraction modulation [35]. Grain size also affects the hardness of the specimen, and grain refinement improves its impact toughness. The HAGB percentage and KAM value of the specimen will also have an effect on the toughness of the specimen. Other things being equal, the higher the HAGB density, the higher the toughness of the material, and specimens with higher KAM values will have higher toughness. Elements contained in stainless steel, such as Mn, Si, Al, Cr, etc., may produce some complex oxides during the welding process. The presence of oxide inclusions also affects the impact toughness of welded joints [36,37]. The size of the oxidized inclusions has different effects on the material properties. It has been demonstrated that inclusions with sizes less than 1 μm are favorable for diffusion strengthening and non-homogeneous phase nucleation promotion, thus improving toughness [31]. However, when the size of oxidized inclusions exceeds 1 μm, it causes a decrease in the toughness of the alloy as the size of oxidized inclusions increases [37,38]. Observation of the SEM image of the fracture reveals that deeper and denser tough nests appear in the specimen as the welding speed rises. In specimens 1# and 2#, there are almost no oxidized inclusions, but there are dense inclusions in the ligamentous fossa of 3# and 4#, and inclusions with sizes larger than 1 μm and smaller than 1 μm can be observed in 3#. In specimen 4#, on the other hand, the inclusions are particularly obvious and have a larger size of 6.72 μm.
It can be deduced from the analysis that the fracture morphological characteristics of the specimens are consistent with the trend of impact energy changes, and the main reason for such impact toughness changes in WM is that, compared with specimens 1# and 2#, the WM zone of specimen 3# has undergone fine-grain strengthening. Thus, the best impact toughness was obtained, whereas a large number of large-sized oxidized inclusions were found in 4#, which provided a pathway for crack propagation, leading to a decrease in impact toughness. Compared with the impact performance of TIG-welded joints of the same material [32], the performance of the K-TIG joint is similar to it.

3.4. Electrochemical Corrosion Experiment

In corrosion experiments, WM and HAZ have consistently been the weakest parts of the joint [39]. However, the HAZ zone has a limited size, making it difficult to study directly [40]. Therefore, this study has placed emphasis on the WM for corrosion investigation.
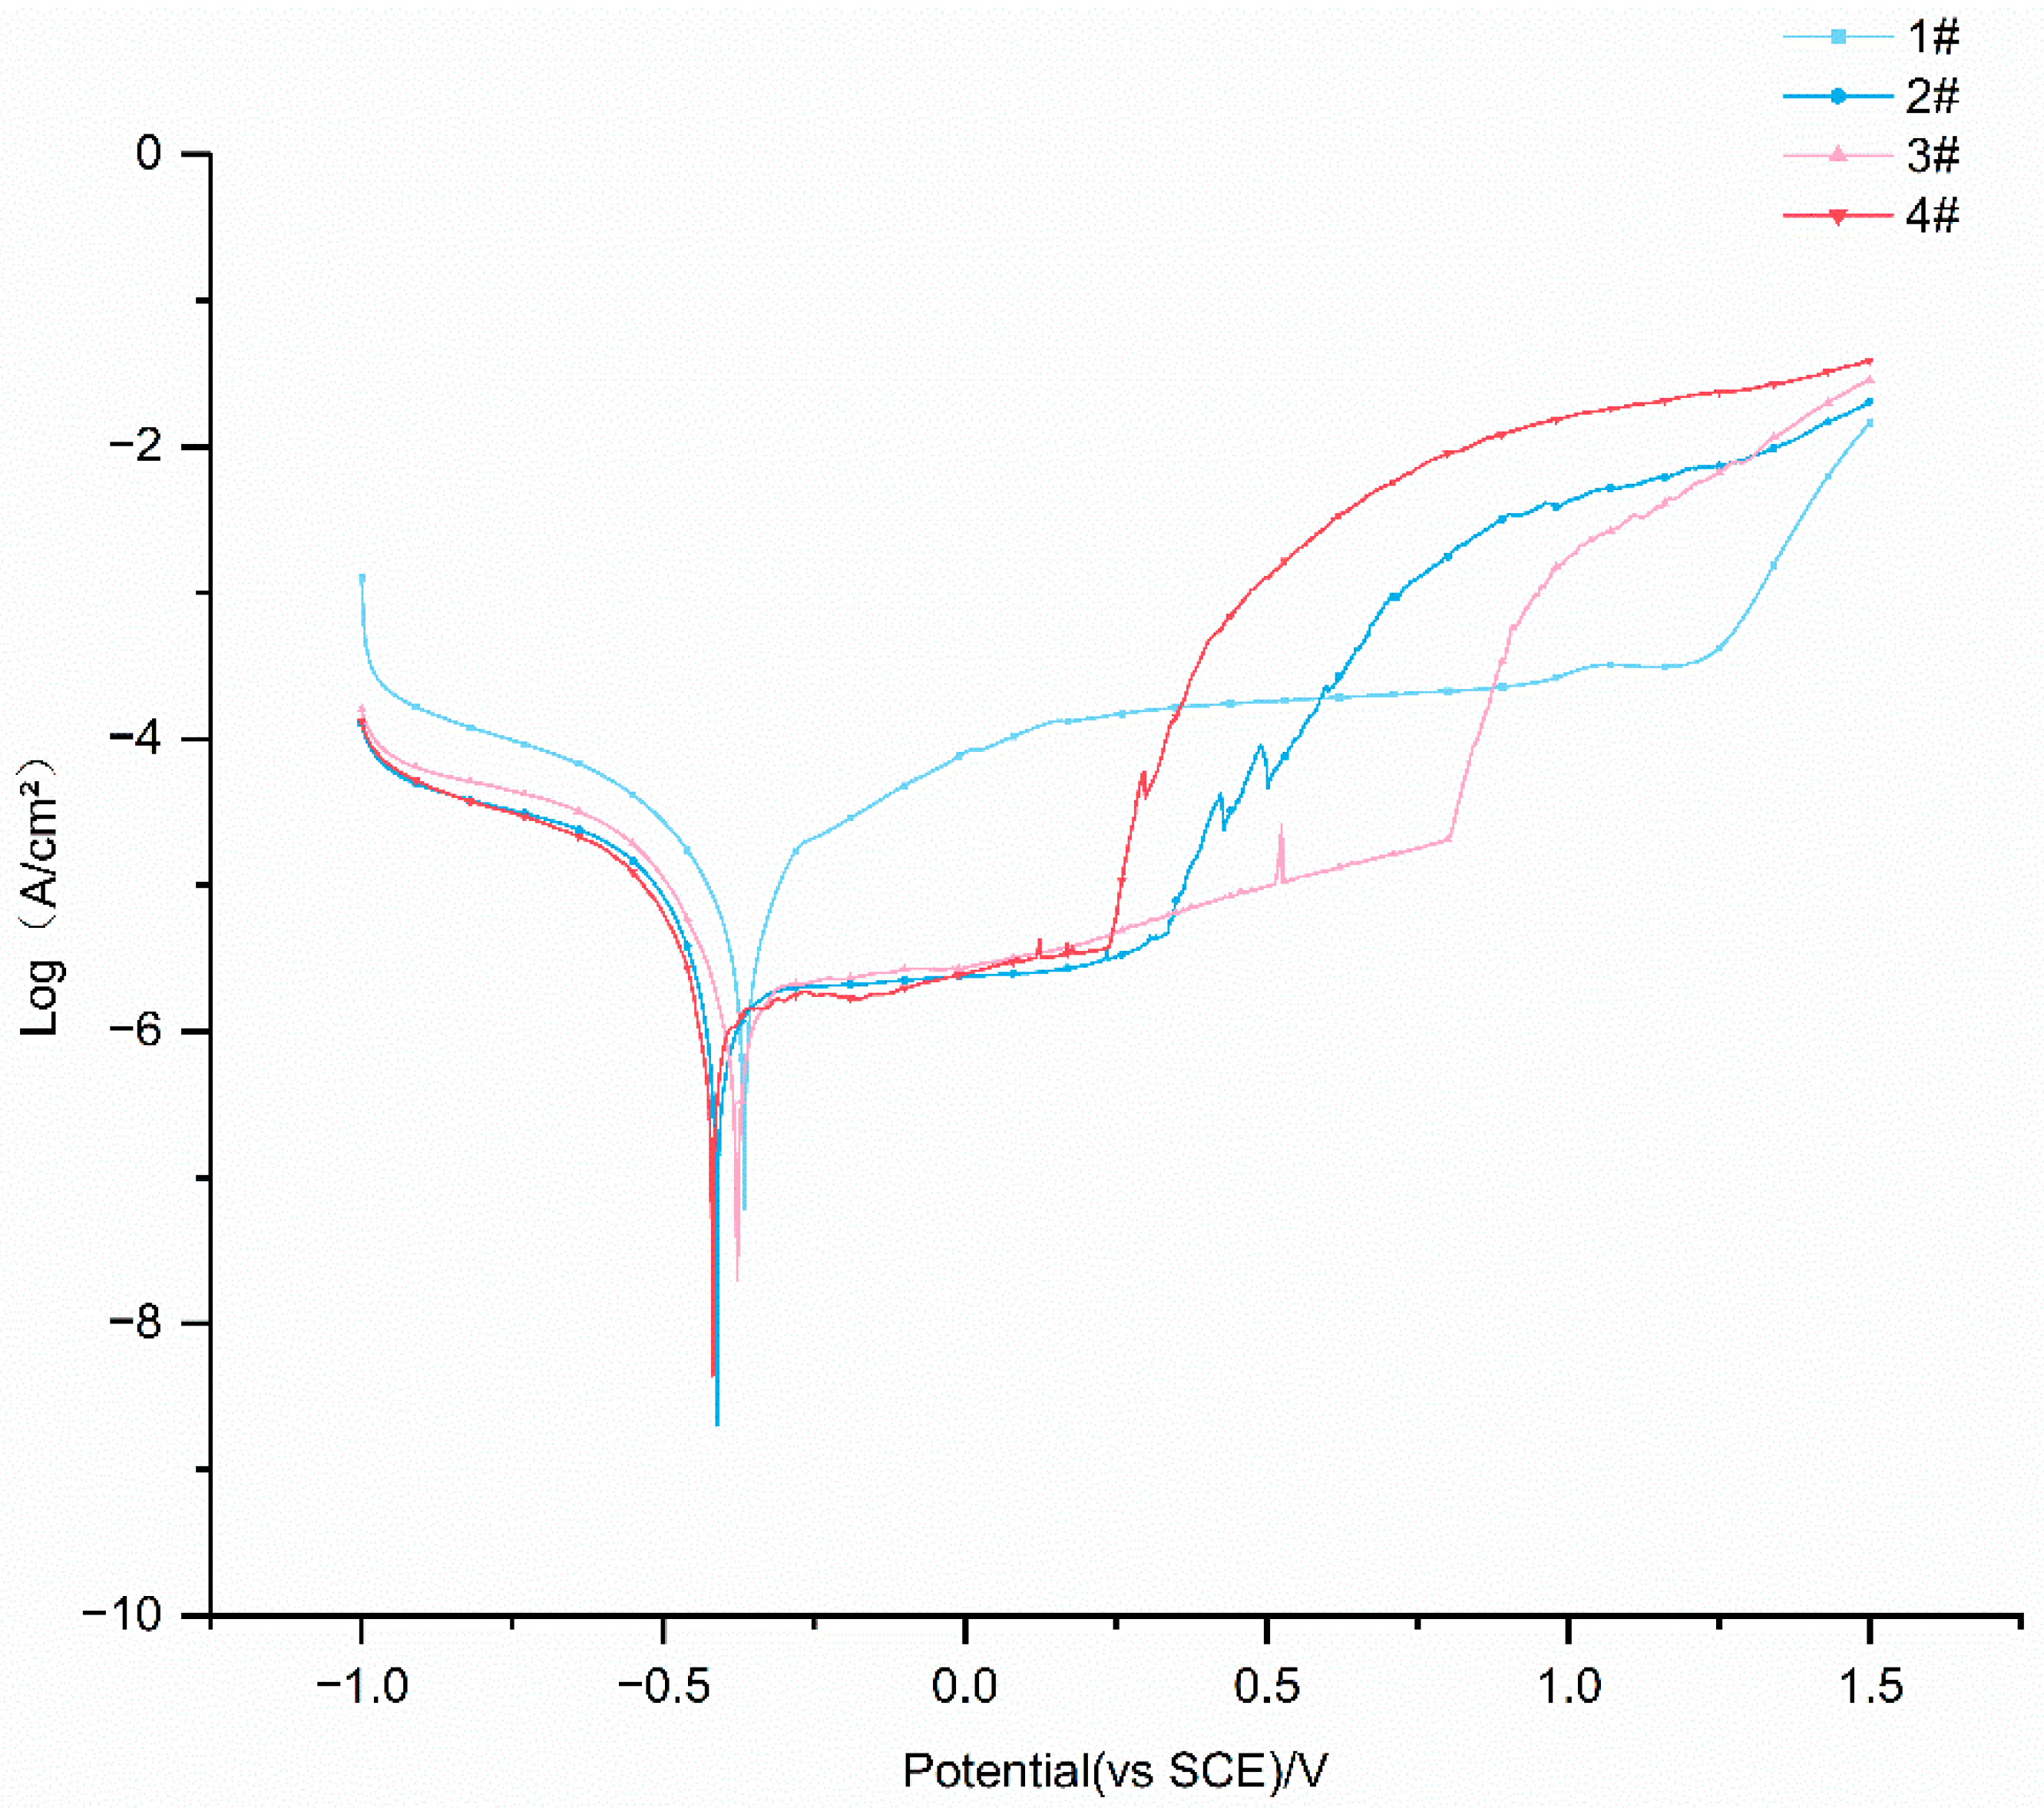
Potentiodynamic polarization testing was conducted on WM fabricated at varying welding speeds in a 3.5% NaCl solution, with the resultant polarization curves presented in Figure 16. The corrosion potential (Ecoor) and corrosion current density (Icoor) values, critical parameters for evaluating electrochemical corrosion behavior, are systematically cataloged in Table 4. Specimen 1# exhibited the highest Ecoor value (−0.366 V vs. SCE) but paradoxically demonstrated the highest Icoor (5.34 × 10⁻⁶ A/cm2), indicating inferior corrosion resistance. Specimens 2#, 3#, and 4# showed progressively lower Icoor values of 1.19 × 10⁻⁶ A/cm2, 1.69 × 10⁻⁶ A/cm2, and 1.24 × 10⁻⁶ A/cm2, respectively, with specimen 2# exhibiting optimal corrosion performance.
The enhanced corrosion resistance observed in refined-grain weld metals originates from multiscale microstructural interactions. The refinement of the WM surface grains allows for the formation of a denser passivation film, resulting in better corrosion resistance. At the same time, grain refinement provides conditions for the diffusion of elements such as Cr and Ni, which promotes the formation of a dense passivation film and enhances stability and uniformity [41]. In addition to this, it has been shown that grain refinement can also reduce the tendency of intergranular corrosion in WM [42]. Grain refinement can also effectively enhance the corrosion resistance of WM in chloride ion environments by reducing the grain boundary density of welded joints to retard the corrosion expansion rate [43,44]. The poor corrosion resistance of specimen 1# is directly attributed to its coarse-grained microstructure, which reduces the stability of the passivation film. Although specimens 3# and 4# exhibit finer grain structures compared to specimen 2#, specimen 2# still demonstrates excellent corrosion resistance due to its significantly higher HAGB content. This crystallographic feature reduces the defect density in the passivation film, thereby optimizing the resistance to chloride ion corrosion.

4. Conclusions

The dissimilar K-TIG welding of 2205 DSS and 316L ASS was systematically investigated under varying welding velocities. This study elucidates the critical influence of welding speed on joint macro/microstructural evolution, mechanical performance, and electrochemical corrosion behavior, with principal findings summarized as follows:
  • K-TIG welding process demonstrated superior efficiency compared to conventional arc welding techniques, achieving defect-free full-penetration joints in 8 mm thick 2205/316L dissimilar combinations without filler metal at travel velocities of 280–320 mm/min. However, a lack of fusion was present at the root side when the welding speed reached 360 mm/min.
  • The austenite and ferrite content of WM varied within reasonable limits. WM formed ferrite and different forms of austenite, such as GBA, IGA, and WA. The austenite grain size decreased with increasing weld speed, and the ferrite percentage increased with increasing weld speed.
  • The tensile properties of K-TIG fittings are similar to those of TIG fittings and are better than the 316L base material, but the hardness of K-TIG joints is higher than that of TIG joints.
  • WM exhibits excellent room temperature impact toughness, which is not weaker than that of TIG joints. Due to the strengthening effect of grain refinement, the impact toughness of K-TIG joints increases with decreasing grain size and reaches a maximum value by specimen 3#. However, when the welding speed reaches 340 mm/min, the toughness decreases due to the increase in the size of oxidized inclusions.
  • The overall difference in WM corrosion performance is not significant, with specimen 1# exhibiting the worst corrosion performance due to its coarse grain structure, in contrast to specimen 2#, which achieves the best pitting resistance through combined grain refinement and favorable Σ3CSL boundary density, synergistically enhancing passivation film stability.

Author Contributions

Conceptualization, S.C., B.Z., and H.L.; methodology, S.C. and H.L.; software, X.L. and H.L.; validation, X.L., H.L., and G.M.; formal analysis, X.L.; investigation, H.L.; resources, S.C.; data curation, G.M.; writing—original draft preparation, H.L.; writing—review and editing, H.L.; visualization, H.L.; supervision, S.C.; project administration, B.Z.; funding acquisition, S.C. All authors have read and agreed to the published version of the manuscript.

Funding

This study was financially supported by the National Natural Science Foundation of China (22402038), and this work was also supported by the Guangxi Bagui Young Scholars Project.

Data Availability Statement

The original contributions presented in this study are included in the article. Further inquiries can be directed to the corresponding author.

Conflicts of Interest

The authors declare no conflict of interest.

References

  1. Sabzi, M.; Mousavi Anijdan, S.H.; Eivani, A.R.; Park, N.; Jafarian, H.R. The Effect of Pulse Current Changes in PCGTAW on Microstructural Evolution, Drastic Improvement in Mechanical Properties, and Fracture Mode of Dissimilar Welded Joint of AISI 316L-AISI 310S Stainless Steels. Mater. Sci. Eng. A 2021, 823, 141700. [Google Scholar] [CrossRef]
  2. Verma, J.; Taiwade, R.V. Dissimilar Welding Behavior of 22% Cr Series Stainless Steel with 316L and Its Corrosion Resistance in Modified Aggressive Environment. J. Manuf. Processes 2016, 24, 1–10. [Google Scholar] [CrossRef]
  3. Fei, Z.; Pan, Z.; Cuiuri, D.; Li, H.; Wu, B.; Ding, D.; Su, L.; Gazder, A.A. Investigation into the Viability of K-TIG for Joining Armour Grade Quenched and Tempered Steel. J. Manuf. Processes 2018, 32, 482–493. [Google Scholar] [CrossRef]
  4. Zhang, Z.; Zhang, H.; Hu, J.; Qi, X.; Bian, Y.; Shen, A.; Xu, P.; Zhao, Y. Microstructure Evolution and Mechanical Properties of Briefly Heat-Treated SAF 2507 Super Duplex Stainless Steel Welds. Constr. Build. Mater. 2018, 168, 338–345. [Google Scholar] [CrossRef]
  5. Rogalski, G.; Świerczyńska, A.; Landowski, M.; Fydrych, D. Mechanical and Microstructural Characterization of TIG Welded Dissimilar Joints between 304L Austenitic Stainless Steel and Incoloy 800HT Nickel Alloy. Metals 2020, 10, 559. [Google Scholar] [CrossRef]
  6. Tomków, J.; Fydrych, D.; Rogalski, G. Dissimilar Underwater Wet Welding of HSLA Steels. Int. J. Adv. Manuf. Technol. 2020, 109, 717–725. [Google Scholar] [CrossRef]
  7. Theodoro, M.C.; Pereira, V.F.; Mei, P.R.; Ramirez, A.J. Dissimilar Friction Stir Welding Between UNS S31603 Austenitic Stainless Steel and UNS S32750 Superduplex Stainless Steel. Metall. Mater. Trans. B 2015, 46, 1440–1447. [Google Scholar] [CrossRef]
  8. Jayakumar, T.; Mathew, M.D.; Laha, K. High Temperature Materials for Nuclear Fast Fission and Fusion Reactors and Advanced Fossil Power Plants. Procedia Eng. 2013, 55, 259–270. [Google Scholar] [CrossRef]
  9. Abdollahi, A.; Shamanian, M.; Golozar, M.A. Comparison of Pulsed and Continuous Current Gas Tungsten Arc Welding in Dissimilar Welding between UNS S32750 and AISI 321 in Optimized Condition. Int. J. Adv. Manuf. Technol. 2018, 97, 687–696. [Google Scholar] [CrossRef]
  10. Moteshakker, A.; Danaee, I. Microstructure and Corrosion Resistance of Dissimilar Weld-Joints between Duplex Stainless Steel 2205 and Austenitic Stainless Steel 316L. J. Mater. Sci. Technol. 2016, 32, 282–290. [Google Scholar] [CrossRef]
  11. Ridha Mohammed, G.; Ishak, M.; Ahmad, S.; Abdulhadi, H. Fiber Laser Welding of Dissimilar 2205/304 Stainless Steel Plates. Metals 2017, 7, 546. [Google Scholar] [CrossRef]
  12. Köse, C. Heat Treatment and Heat Input Effects on the Dissimilar Laser Beam Welded AISI 904L Super Austenitic Stainless Steel to AISI 317L Austenitic Stainless Steel: Surface, Texture, Microstructure and Mechanical Properties. Vacuum 2022, 205, 111440. [Google Scholar] [CrossRef]
  13. Song, Q.; Wang, H.; Wang, W.; Han, Z.; Qian, Y.; Wan, J.; Song, M.; Hu, Y.; Zhao, H. Optimization of Mechanical and Surface Properties of Friction Stir Welded Dissimilar Joint of 2507 SDSS and 317L ASS by Controlling Process Parameters. J. Mater. Res. Technol. 2024, 29, 416–426. [Google Scholar] [CrossRef]
  14. Güzey, B.N.; İrsel, G. Investigation of Mechanical and Microstructural Properties in Joining Dissimilar P355GH and Stainless 316L Steels by TIG Welding Process. Int. J. Press. Vessel. Pip. 2023, 205, 104965. [Google Scholar] [CrossRef]
  15. Yelamasetti, B.; Karuna, B.N.R.; Vishnu Vardhan, T.; Dasore, A.; Saxena, K.K.; Faroque, F.A.; Revathi, V.; Abduvalieva, D. Mechanical and Micro-Structural Studies of Pulsed and Constant Current TIG Weldments of Super Duplex Stainless Steels and Austenitic Stainless Steels. High. Temp. Mater. Processes 2024, 43, 20240003. [Google Scholar] [CrossRef]
  16. Mohan Kumar, S.; Siva Shanmugam, N. Effect of Heat Input and Weld Chemistry on Mechanical and Microstructural Aspects of Double Side Welded Austenitic Stainless Steel 321 Grade Using Tungsten Inert Gas Arc Welding Process. Mater. Werkst. 2020, 51, 349–367. [Google Scholar] [CrossRef]
  17. Han, L.; Han, T.; Wang, B.; Chen, G.; Sun, J.; Wang, Y. Effects of Keyhole Tungsten Inert Gas Welding Parameters on 2205 Duplex Stainless Steel Welded Joints. J. Mater. Eng. Perform. 2022, 31, 1358–1372. [Google Scholar] [CrossRef]
  18. Han, L.; Han, T.; Chen, G.; Wang, B.; Sun, J.; Wang, Y. Influence of Heat Input on Microstructure, Hardness and Pitting Corrosion of Weld Metal in Duplex Stainless Steel Welded by Keyhole-TIG. Mater. Charact. 2021, 175, 111052. [Google Scholar] [CrossRef]
  19. Cui, S.; Shi, Y.; Zhang, C. Microstructure and Mechanical Properties of TC4 Titanium Alloy K-TIG Welded Joints. Trans. Nonferrous Met. Soc. China 2021, 31, 416–425. [Google Scholar] [CrossRef]
  20. Li, X.; Gong, B.; Deng, C.; Li, Y. Effect of Pre-Strain on Microstructure and Hydrogen Embrittlement of K-TIG Welded Austenitic Stainless Steel. Corros. Sci. 2019, 149, 1–17. [Google Scholar] [CrossRef]
  21. Cui, S.; Liu, Z.; Fang, Y.; Luo, Z.; Manladan, S.M.; Yi, S. Keyhole Process in K-TIG Welding on 4mm Thick 304 Stainless Steel. J. Mater. Process. Technol. 2017, 243, 217–228. [Google Scholar] [CrossRef]
  22. Fei, Z.; Pan, Z.; Cuiuri, D.; Li, H.; Wu, B.; Su, L. Improving the Weld Microstructure and Material Properties of K-TIG Welded Armour Steel Joint Using Filler Material. Int. J. Adv. Manuf. Technol. 2019, 100, 1931–1944. [Google Scholar] [CrossRef]
  23. Fei, Z.; Pan, Z.; Cuiuri, D.; Li, H.; Van Duin, S.; Yu, Z. Microstructural Characterization and Mechanical Properties of K-TIG Welded SAF2205/AISI316L Dissimilar Joint. J. Manuf. Processes 2019, 45, 340–355. [Google Scholar] [CrossRef]
  24. ASTM E8/E8M-16a; Standard Test Methods for Tension Testing of Metallic Materials. ASTM International: West Conshohocken, PA, USA, 2016. [CrossRef]
  25. ASTM A370-17; Standard Test Methods and Definitions for Mechanical Testing of Steel Products. ASTM International: West Conshohocken, PA, USA, 2017. [CrossRef]
  26. Yurtisik, K.; Tirkes, S.; Dykhno, I.; Gur, C.H.; Gurbuz, R. Characterization of Duplex Stainless Steel Weld Metals Obtained by Hybrid Plasma-Gas Metal Arc Welding. Soldag. Insp. 2013, 18, 207–216. [Google Scholar] [CrossRef]
  27. Hsiao, Z.-W.; Chen, D.; Kuo, J.-C.; Lin, D.-Y. Effect of Prior Deformation on Microstructural Development and Laves Phase Precipitation in High-chromium Stainless Steel. J. Microsc. 2017, 266, 35–47. [Google Scholar] [CrossRef] [PubMed]
  28. Githinji, D.N.; Northover, S.M.; Bouchard, P.J.; Rist, M.A. An EBSD Study of the Deformation of Service-Aged 316 Austenitic Steel. Metall. Mater. Trans. A 2013, 44, 4150–4167. [Google Scholar] [CrossRef]
  29. Zhang, W.; Wang, X.; Hu, Y.; Wang, S. Quantitative Studies of Machining-Induced Microstructure Alteration and Plastic Deformation in AISI 316 Stainless Steel Using EBSD. J. Mater. Eng. Perform. 2018, 27, 434–446. [Google Scholar] [CrossRef]
  30. Liu, X.; Sun, Y.; Li, W.; He, J.; Pei, M.; Zhang, K. Effect of Welding Current on the Organization and Properties of Welded Joints of Q690D High-Strength Steel. Mater. Today Commun. 2024, 40, 110219. [Google Scholar] [CrossRef]
  31. Wang, Q.; Gu, G.; Jia, C.; Li, K.; Wu, C. Investigation of Microstructure Evolution, Mechanical and Corrosion Properties of SAF 2507 Super Duplex Stainless Steel Joints by Keyhole Plasma Arc Welding. J. Mater. Res. Technol. 2023, 22, 355–374. [Google Scholar] [CrossRef]
  32. Touileb, K.; Hedhibi, A.C.; Djoudjou, R.; Ouis, A.; Bensalama, A.; Ibrahim, A.; Abdo, H.S.; Ahmed, M.M.Z. Mechanical, Microstructure, and Corrosion Characterization of Dissimilar Austenitic 316L and Duplex 2205 Stainless-Steel ATIG Welded Joints. Materials 2022, 15, 2470. [Google Scholar] [CrossRef]
  33. Li, G.; Lu, X.; Zhu, X.; Huang, J.; Liu, L.; Wu, Y. The Interface Microstructure, Mechanical Properties and Corrosion Resistance of Dissimilar Joints during Multipass Laser Welding for Nuclear Power Plants. Opt. Laser Technol. 2018, 101, 479–490. [Google Scholar] [CrossRef]
  34. Takeda, K.; Nakada, N.; Tsuchiyama, T.; Takaki, S. Effect of Interstitial Elements on Hall–Petch Coefficient of Ferritic Iron. ISIJ Int. 2008, 48, 1122–1125. [Google Scholar] [CrossRef]
  35. Ahmad, G.N.; Raza, M.S.; Singh, N.K.; Muvvala, G. Investigating the Effect of Process Parameters on Weld Pool Thermal History and Mechanical Properties of Laser Welded Inconel 625 and Duplex Stainless Steel 2205 Dissimilar Welds. Optik 2021, 248, 168134. [Google Scholar] [CrossRef]
  36. Tavares, S.S.M.; Pardal, J.M.; Almeida, B.B.; Mendes, M.T.; Freire, J.L.F.; Vidal, A.C. Failure of Superduplex Stainless Steel Flange Due to Inadequate Microstructure and Fabrication Process. Eng. Fail. Anal. 2018, 84, 1–10. [Google Scholar] [CrossRef]
  37. Zheng, J.; Hu, X.; Pan, C.; Fu, S.; Lin, P.; Chou, K. Effects of Inclusions on the Resistance to Pitting Corrosion of S32205 Duplex Stainless Steel. Mater. Corros. 2018, 69, 572–579. [Google Scholar] [CrossRef]
  38. Sarma, D.S.; Karasev, A.V.; Jönsson, P.G. On the Role of Non-Metallic Inclusions in the Nucleation of Acicular Ferrite in Steels. ISIJ Int. 2009, 49, 1063–1074. [Google Scholar] [CrossRef]
  39. Li, W.; Zhang, J.; Xin, P.; Wen, Z.; Jing, H.; Zhao, L.; Xu, L.; Han, Y. Corrosion Behavior of the Heat Affected Zone in a 316 L Pipeline Weld. Mater. Test. 2021, 63, 617–622. [Google Scholar] [CrossRef]
  40. Shi, Y.; Li, W.; Tian, L.; Sun, Y.; Zhang, J.; Jing, H.; Zhao, L.; Xu, L.; Han, Y. Effect of Ferrite and Grain Boundary Characteristics on Corrosion Properties of Thermal Simulated 316 L Heat Affected Zone. Corros. Sci. 2023, 222, 111384. [Google Scholar] [CrossRef]
  41. Lv, J. Effect of Grain Size on Mechanical Property and Corrosion Resistance of the Ni-Based Alloy 690. J. Mater. Sci. Technol. 2018, 34, 1685–1691. [Google Scholar] [CrossRef]
  42. Ma, C.Y.; Zhou, L.; Zhang, R.X.; Li, D.G.; Shu, F.Y.; Song, X.G.; Zhao, Y.Q. Enhancement in Mechanical Properties and Corrosion Resistance of 2507 Duplex Stainless Steel via Friction Stir Processing. J. Mater. Res. Technol. 2020, 9, 8296–8305. [Google Scholar] [CrossRef]
  43. Hug, E.; Keller, C. Passivation Properties of Ultrafine Grain 316L Stainless Steels Manufactured by Ball Milling and Spark Plasma Sintering. Mater. Chem. Phys. 2023, 309, 128398. [Google Scholar] [CrossRef]
  44. Ralston, K.D.; Birbilis, N.; Davies, C.H.J. Revealing the Relationship between Grain Size and Corrosion Rate of Metals. Scr. Mater. 2010, 63, 1201–1204. [Google Scholar] [CrossRef]
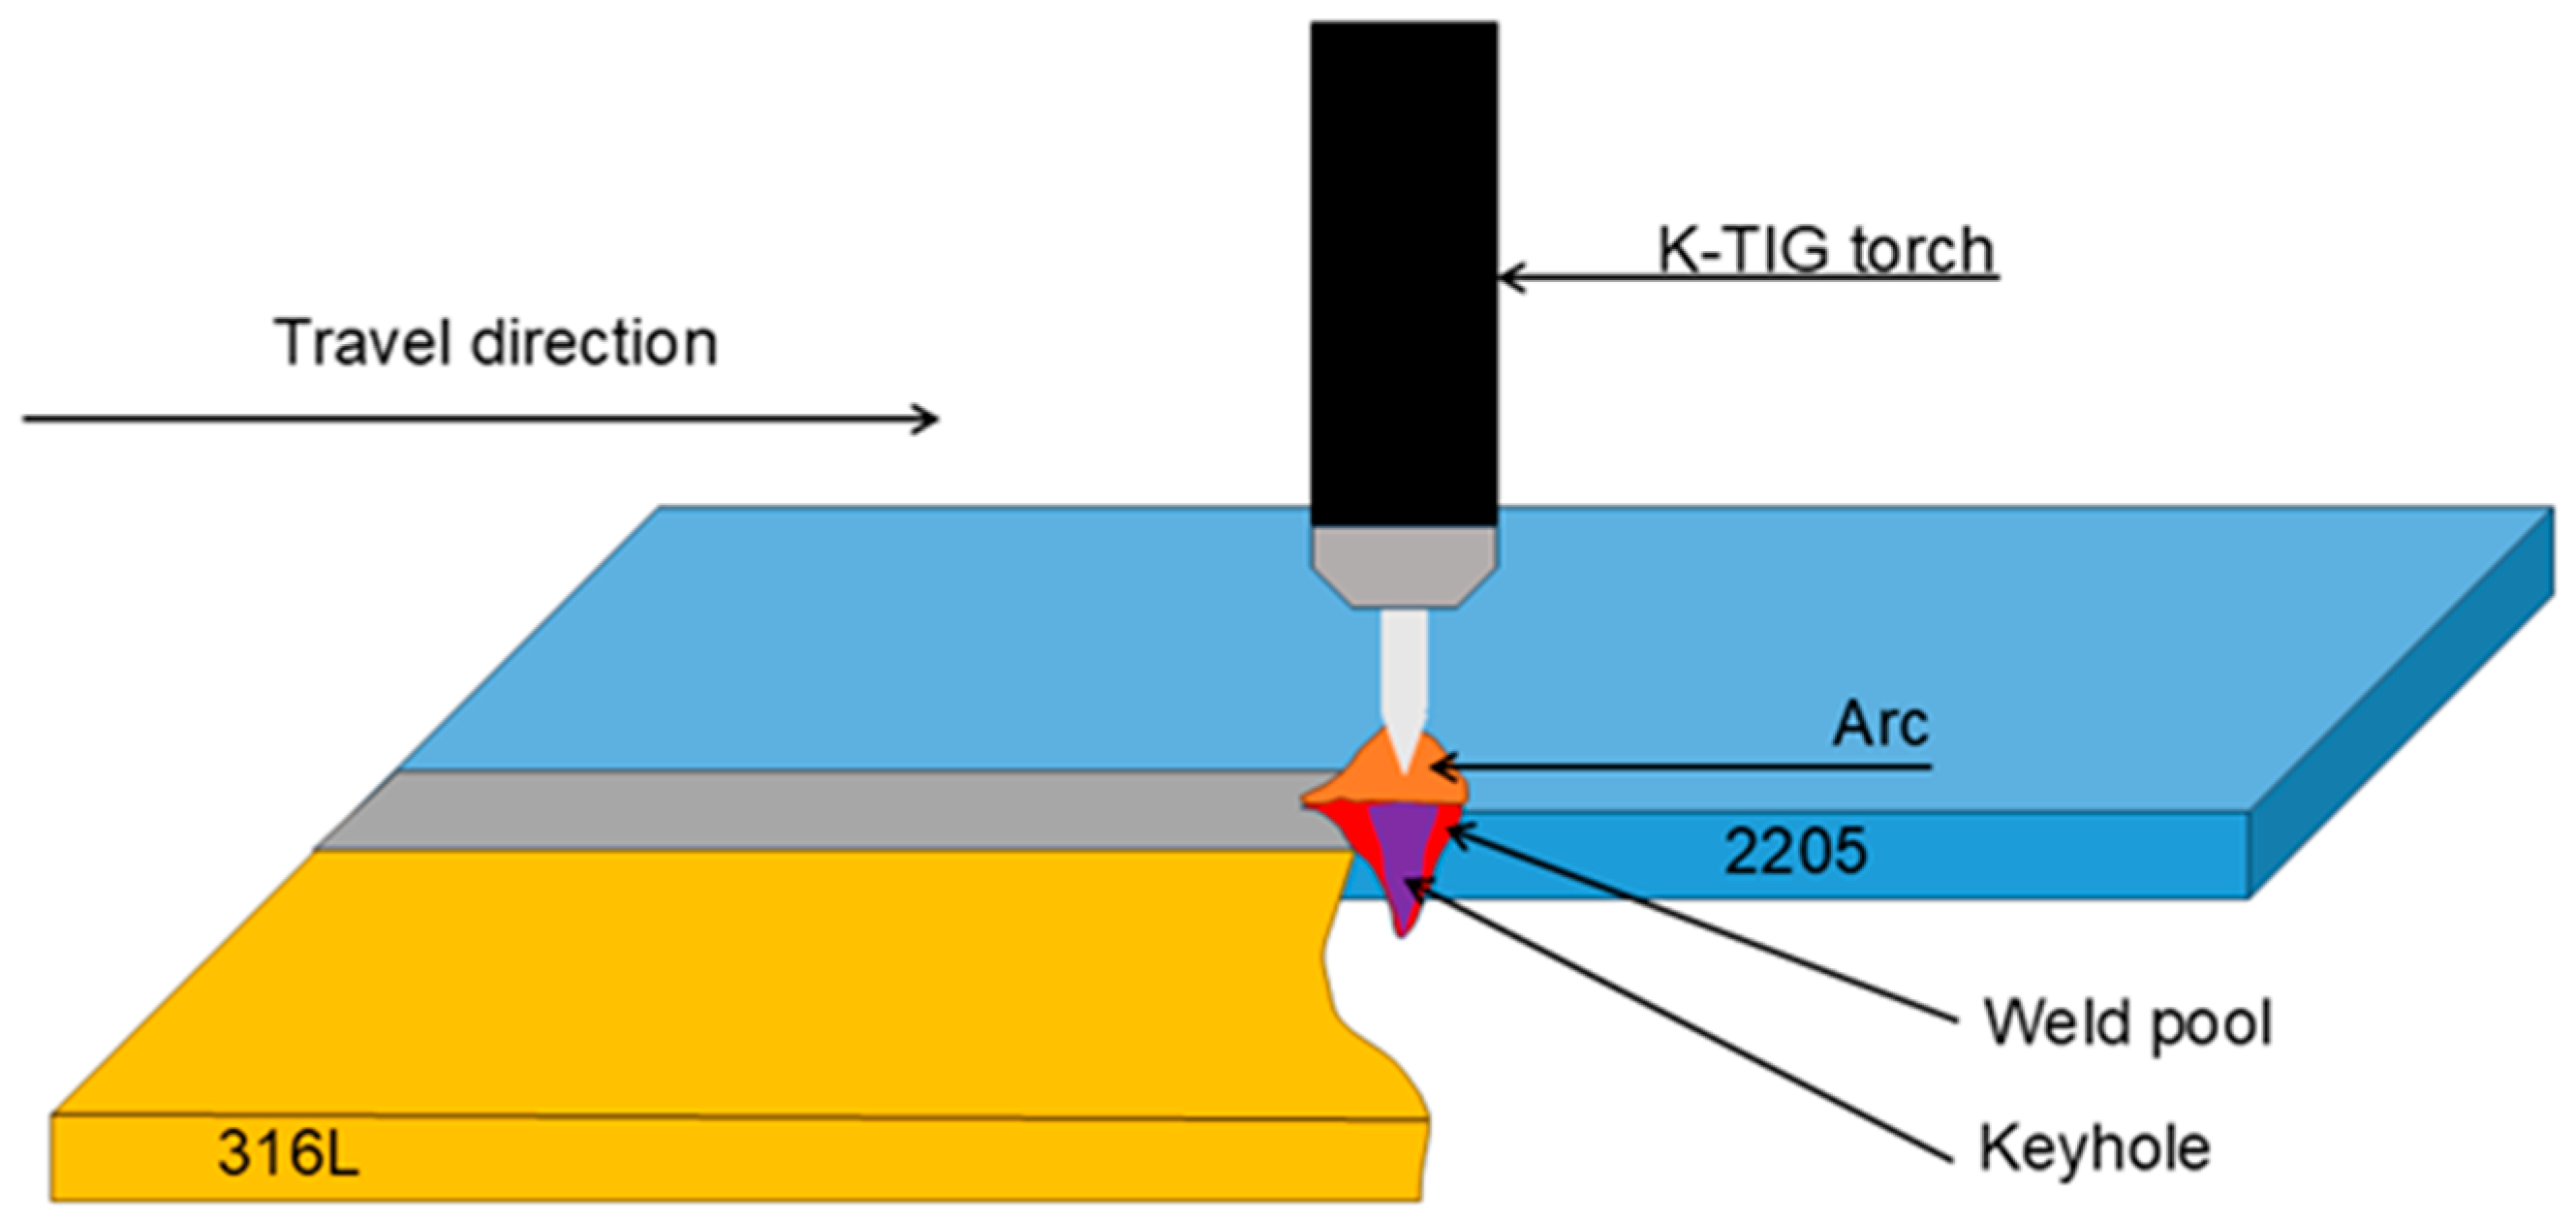
Figure 1. Schematic of keyhole TIG welding process.
Metals 15 00910 g001
Figure 2. Dimensions of tensile and dimensions of impact specimens; all dimensions in mm.
Metals 15 00910 g002
Figure 3. Macroscopic images of weld front and back: (a) 280 mm/min, (b) 300 mm/min, (c) 320 mm/min, (d) 340 mm/min, (e) 360 mm/min. The red dotted boxes mark the unfused regions.
Metals 15 00910 g003
Figure 4. Macrograph of dissimilar joint: (a) 1#, (b) 2#, (c) 3#, (d) 4#. The cone-shaped area circled by the yellow dotted line is WM.
Metals 15 00910 g004
Figure 5. Microstructure of WMs: (a) 1#, (b) 2#, (c) 3#, (d) 4#. Microstructure across the fusion boundary of 1# (e) near the 2205 side and (f) near the 316 L side. Ferrite, IGA, WA, and GBA have been labeled in the graphs.
Metals 15 00910 g005
Figure 6. XRD patterns of specimens from 1# to 4# WM and comparison with Cr2N powder diffraction file.
Metals 15 00910 g006
Figure 7. IPF-map of (a) 2205 and (b) 316L; phase map of (c) 2205 and (d) 316L. In the IPF diagram, red represents austenitic organization and blue represents ferritic organization.
Metals 15 00910 g007
Figure 8. IPF-map of WMs: (a) 1#, (b) 2#, (c) 3#, (d) 4#; IPF-map across fusion boundary of 1# (e) near the 2205 side and (f) near the 316L side. The grey boundaries represent the boundaries of different grains, and the black boundaries represent the boundaries of different phases.
Metals 15 00910 g008
Figure 9. KAM-map of WMs: (a) 1#, (b) 2#, (c) 3#, (d) 4#; KAM-map across fusion boundary of 1# (e) near the 2205 side and (f) near the 316L side. The color represents the degree of dislocation concentration, with blue being the lightest.
Metals 15 00910 g009
Figure 10. GBs-map of WMs: (a) 1#, (b) 2#, (c) 3#, (d) 4#; GBs map across fusion boundary of 1# (e) near the 2205 side and (f) near the 316L side. The red border represents the HAGBs, and the black border represents the LAGBs.
Metals 15 00910 g010
Figure 11. Σ3CSL-map of WMs: (a) 1#, (b) 2#, (c) 3#, (d) 4#; Σ3CSL map across fusion boundary of 1# (e) near the 2205 side and (f) near the 316L side. The blue border represents Σ3 CSL, and the black border represents other CSLs.
Metals 15 00910 g011
Figure 12. Comparison of tensile test results of specimens from 1# to 4# and fracture locations of specimens. The red box shows the location of the break.
Metals 15 00910 g012
Figure 13. Distribution of microhardness in the WM and base material regions of specimens from 1# to 4#.
Metals 15 00910 g013
Figure 14. Charpy impact toughness values for WM of specimens from 1# to 4#.
Metals 15 00910 g014
Figure 15. Fracture surfaces graphic of impact test specimens for: (a) 1#, (b) 2#, (c) 3#, (d) 4#, respectively. Dimples and the dimensions of the oxidized inclusions are indicated in the diagram.
Metals 15 00910 g015
Figure 16. Potentiodynamic polarization curves for WM of specimens from 1# to 4# in 3.5 wt% NaCl solution.
Metals 15 00910 g016
Table 1. Chemical compositions (wt%) of 2205 DSS and 316L ASS.
MaterialsCrNiMnMoSiCNSPFe
220522.465.71.2483.020.0570.0190.1560.00050.021Bal.
316L17.9210.060.952.060.330.0180.020.010.017Bal.
Table 2. Process parameters of K-TIG welding.
SpecimenCurrent (A)Voltage (V)Welding Speed (mm/min)Heat Input (KJ/mm)
1#50016.72801.79
2#50016.73001.67
3#50016.73201.58
4#50016.73401.47
5#50016.73601.39
Table 3. Austenite ratio and average grain size of WM.
Specimen1#2#3#4#
Grain size (μm)50.24 ± 41.7248.89 ± 40.447.03 ± 33.5544.55 ± 32.44
Austenite fraction (%)84.779.364.059.9
Table 4. Electrochemical parameters that resulted from Tafel extrapolation.
Specimen1#2#3#4#
Ecorr (V)−0.365−0.411−0.377−0.418
Icorr (A/cm2)6.1855 × 10−61.1858 × 10−61.6881 × 10−61.2361 × 10−6
Disclaimer/Publisher’s Note: The statements, opinions and data contained in all publications are solely those of the individual author(s) and contributor(s) and not of MDPI and/or the editor(s). MDPI and/or the editor(s) disclaim responsibility for any injury to people or property resulting from any ideas, methods, instructions or products referred to in the content.