Abstract
Stretch-bending straightening is used to ensure the desired flatness properties of packaging steel in the final stage of semi-finished product manufacturing. Not only is the flatness of the steel affected by the alternating bending load and the tensile load during the stretch-bending straightening process, but the mechanical properties also change depending on several factors. It was found out that the stretch-bending straightening parameters, the temper-rolling degree and the amount of interstitial elements have an influence on this change in mechanical properties. A follow-up ageing process, after stretch-bending straightening, also has a significant impact on this change. Based on these observations, a multivariate prediction model is developed describing the dependence between straightening parameters and resulting yield strength characteristics in non-aged and aged conditions for three different packaging steels.
1. Introduction
The stretch-bending straightening process is a widely used industrial technique for optimising flatness and reducing residual stresses in a variety of semi-finished products manufactured from different materials [1,2,3] and geometries [4,5,6,7,8,9]. In previous studies, the influence of the straightening process on flatness and residual stress reduction was analysed using both analytical approaches [10,11,12,13,14,15,16,17] and finite element (FE) simulations [18,19,20,21,22,23,24,25,26,27].
The stretch-bending straightening process is also a key part of the production of flat and residual stress-free packaging steels. These properties are essential for the processing of the packaging steel into final products such as tin cans or crown corks. In order to adjust the flatness of the packaging steel specifically, the parameters of the stretch-bending straightening process are adapted to the respective conditions. The plastic deformation of the material due to the alternating bending load and the superimposed tensile load results not only in the optimisation of the flatness properties but also in a change in the mechanical properties that has not yet been understood in detail. In addition to the direct impact on mechanical properties resulting from stretch-bending straightening, subsequent ageing of packaging steels leads to further changes in mechanical properties that are not fully understood.
Prior investigations have addressed these changes in mechanical properties, especially the yield strength charactersitics, for materials like aluminium [28,29] and steels [28,30,31,32] at different processing conditions.
A. Noé et al. [28] studied the stretch-bending straightening process applied to a deep-drawing steel (StW 24, 1.2 mm thickness) and an aluminium alloy (AlMg5, 0.336 mm thickness). In the case of the deep-drawing steel, degrees of stretching between 0.2% and 1.5% were applied at constant intermesh. The authors observed that the offset yield stress at 0.01% decreased at low degrees of stretching (<0.5%) compared to the untreated base material but increased again with higher degrees of stretching [28]. In contrast, the offset yield stress at 0.1% exhibited minimal sensitivity to stretching variation. Comparable trends were reported for the aluminium alloy AlMg5 [28].
Harangozó et al. [29] examined the effects of stretch-bending straightening on aluminium sheet materials, in particular, AlMg3 and AlMg4.5 alloys. For AlMg3, four process routes differing in cold rolling and heat treatment steps were compared. The results showed that yield strength consistently increased following straightening, while elongation at break decreases. Tensile strength rose only marginally in comparison [29].
Hoggan et al. [30] evaluated low-carbon steels (0.055 wt. %) and ultra-low-carbon steels (0.002 wt. %) with thicknesses ranging from 0.4 mm to 0.8 mm. These materials were either recrystallised or annealed using batch or continuous annealing, followed by skin-pass or stretch-bending operations. Degrees of stretching varied from 0.05% to 1%. For recrystallised materials, increasing the degree of stretching led to higher yield strength and reduced elongation at break, while tensile strength remained relatively unchanged [30]. In annealed samples, tensile strength increased initially but decreased after a threshold. Elongation at break improved from 0.6% to 6.7% as degrees of stretching increased [30].
Zhang et al. [31] analysed hot-rolled steel with a thickness of 2.3 mm steel subjected to varying intermeshes and degrees of stretching. Increasing intermesh initially raised elongation at break, which then decreased after reaching a maximum. Compared to the untreated base material, elongation at break was generally lower across all conditions [31]. The lower yield strength and tensile strength increased consistently with intermesh, indicating material hardening. When stretch levels ranged from 1.2% to 1.8%, strength and elongation values remained nearly constant [31].
O. Noé [32] further investigated cold-rolled steel strips (0.056–0.1% C, thickness of 0.75–1.5 mm) that were either temper-rolled or annealed before straightening on a three-roll stretch-bending straightening machine. The yield strengths of the temper-rolled variants, which were straightened at low degrees of stretching, demonstrate reduced yield strengths in comparison to the material that underwent 10 months of ageing. Above a 1.5% degree of stretching, yield strength surpassed that of the base material. Smaller roller diameters tended to increase yield strength at a constant degree of stretching. Notably, even minor degrees of stretching suppressed yield point elongation [32]. In a separate set of experiments, O. Noé analysed recrystallised and aged materials and found that extended ageing time increased yield strength. Ageing effects were delayed in stretch-bent materials compared to temper-rolled ones [32].
Despite these findings, a systematic investigation of different packaging steels that considers both stretch-bending straightening parameters and the ageing process has not yet been investigated. Building upon previous work [33] that focussed on non-aged packaging steel, the present study extends the analysis to include various production routes and ageing conditions. The test materials vary in chemical composition and temper-rolling degree. The goal is to systematically analyse the influence of stretch-bending straightening on yield strength characteristics in both material states. The resulting experimental data support the development of a predictive model that correlates straightening parameters with yield strength characteristics. Separate modelling is conducted for non-aged and aged conditions. An earlier modelling approach, effective for predicting offset yield stress at 0.2% in the non-aged condition [33], proved unsuitable for the aged condition, necessitating a revised methodology. This study contributes to the improved prediction of yield behaviour resulting from both the stretch-bending straightening and ageing processes. It also enables comparative evaluation of production route variations for the same packaging steel specification.
2. Materials and Methods
2.1. Materials
The material analysed in this study is a TH550 packaging steel with a thickness ranging from 0.190 mm to 0.210 mm. This specification is characterised by its recrystallisation treatment, performed via a continuous annealing process. According to DIN EN 10202 [34], the yield strength of TH550 in the aged condition is typically 550 ± 50 MPa. This specification can be produced using various chemical compositions and particularly with differing levels of interstitial elements such as carbon and nitrogen. Additionally, the degree of temper rolling applied during processing can vary. As part of the present investigation, the tensile properties following stretch-bending straightening were examined for three TH550 variants, each produced via different process routes and chemical compositions. Table 1 summarises the relevant process parameters and the characteristic tensile properties of the untreated base material (BM) before stretch-bending straightening for the tested variants. Figure 1 presents the corresponding stress–strain diagrams for one representative sample from each material variant, both in the non-aged and aged conditions.

Table 1.
Process parameters and characteristic tensile test values of the to-be-investigated materials in non-aged and aged condition.
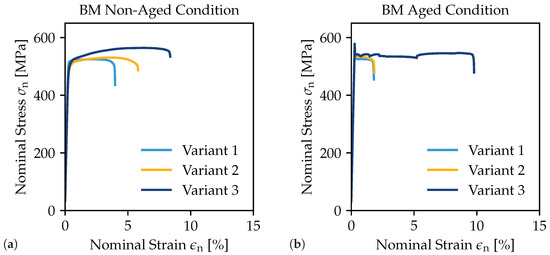
Figure 1.
Stress–strain diagrams of the three variants in non-aged (a) and aged (b) condition.
2.2. Methods
A series of tests is carried out on a laboratory scale in order to investigate the influence of the stretch-bending straightening process on the mechanical properties. A total of 25 distinct stretch-bending straightening parameter variations of the three variants, as shown in Table 2, are subjected to a comparative analysis. In this regard, five distinct intermeshes between 1 mm and 5 mm are configured within the inlet of the straightening cassette. This is defined as the distance between the first upper and lower straightening rollers. The intermesh configuration of the cassette outlet is determined by the thickness of the sheet. Furthermore, five different degrees of stretching between 0.125% and 1% are set. This is defined as the plastic change in length of the strip as a result of the straightening process. A comprehensive account of the test facility, its preparation for the test series and the execution of the stretch-bending straightening tests can be found in the preceding publication by Möller et al. [33]. Following the stretch-bending straightening process, the samples of the 25 settings are examined in two conditions: non-aged and aged. To avoid the ageing process of the non-aged condition, the specimens are immediately stored at −20 °C after the stretch-bending straightening process. The specimen that are tested in the aged condition are artificially aged at 200 °C for 20 min after the stretch-bending straightening process. The ageing parameters used are in accordance with the standardised test parameters defined in the DIN EN 10202 [34] standard, which are applicable to the packaging steel industry.
Table 2.
Statistic values of the offset yield stress in non-aged and upper yield strength in aged condition.
Subsequently, uniaxial tensile tests are conducted at ambient temperature in accordance with DIN EN ISO 6892-1 [35]. For each of the 25 different settings of the stretch-bending straightener, the two varying test conditions and the three variants, eight samples are stamped out parallel to the rolling direction and aligned in this direction during tensile testing. The surfaces of the samples are not treated in accordance with DIN EN ISO 6892-1 [35]. This standard specifies that the rolled surface of the samples must not be machined. Furthermore, the standard specifies that any work hardening that could influence the mechanical properties must be removed. In this context, the punching burr on the edges is removed mechanically. This study is focussed on the initial yield point of the material under tensile stress, a critical parameter for the packaging steel industry. The determination of the initial yield stress is achieved through the implementation of the uniaxial tensile test. In the context of the packaging steel, the offset yield stress is evaluated at 0.2% in accordance with DIN EN 10202 [34] for continuous stress–strain curves. These curves are a characteristic of the material when it is non-aged. In the case of a discontinuous stress–strain curve, which occurs in aged materials, the upper yield strength is evaluated instead. Based on the tensile test results, a multivariate prediction model of the yield strength characteristics as a function of the set stretch-bending straightening parameters will be developed in non-aged and aged conditions.
3. Results
The measured yield strength characteristics of the non-aged and aged condition determined by the tensile test are shown in Table 2.
Therefore, the arithmetic mean value (AM) and the standard deviation (SD) of the offset yield stress at 0.2% in the non-aged condition and upper yield strength in aged condition are shown for the 25 settings and the three variants.
3.1. Modelling of Tensile Properties of the Straightened Material in the Non-Aged Condition
Figure 2 compares the stress–strain diagrams at constant degree of stretching of 0.125% of the three variants. In addition, the stress–strain diagrams of the five investigated intermeshes and the base material are compared in every subfigure. The results of the stress–strain diagrams at a constant degree of stretching show that with increasing intermesh, the nominal stress decreases. Also, the strain at break increases with increasing intermesh at all the three investigated variants. The findings of the tensile tests of the remaining stretch-bending straightening settings, as illustrated in Table 2, indicate that the offset yield stress generally increases with an increasing degree of stretching. Increases in the intermeshes at the investigated degrees of stretching are associated with decreases in the offset yield stress.
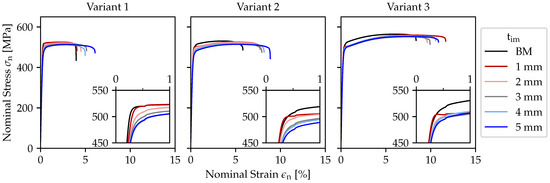
Figure 2.
Exemplary stress–strain diagrams of the base material and the straightened material at a constant degree of stretching of 0.125% and different intermeshes of the three variants in non-aged condition.
For the modelling, an exponential mathematical formula for the description of the dependency between the intermeshes and the offset yield stress in the non-aged condition as well as the upper yield strength in the aged condition is generated. By the PythonTM module SciPy using the function scipy.optimize.curve_fit, the coefficients are calculated for the five set degrees of stretching and the three variants by minimizing the sum of the squared deviations (residuals).
Equation (1) is used in the first step to model the dependence of the offset yield stress on the stretch-bending straightening parameters. That equation is comprised of two material- and process-specific parameters, denoted by the symbols and . In this context, the parameter is scaled by the function as a function of the intermesh . The parameter represents the asymptotic limit value that the offset yield stress is aiming for:
Based on Equation (1), the parameters describing the dependency between the offset yield stress and the intermesh for the investigated degrees of stretching are calculated. The results for the three variants can be found in Table 3.
Table 3.
Model parameters for the description of the dependence of the offset yield stress on the intermesh for the respective degrees of stretching of the analysed variants in non-aged condition.
The results indicate a decrease in the parameter as the degree of stretching increases from 0.125% and 0.75%. As the degree of stretching is increased to 1%, a slight rise is observed. The parameter exhibits a contrary behaviour. The increase is observed to occur within the range of 0.125% and 1%. This behaviour has been observed in all three variants. As the analysis of statistical values indicates, variants 1 and 2 display coefficients of determination of between 0.84 and 0.98. Lower ranging from 0.66 to 0.98 are achieved for variant 3 in comparison to variants 2 and 3. In the case of root mean square error (RMSE) and maximal error (ME), variant 3 reaches smaller values than variants 1 and 2.
Based on the calculated coefficients, Equation (1) is extended by the degree of stretching . In this context, the dependence of the parameters and , and the degree of stretching of the various variants, is initially analysed. To this end, the parameters previously determined were plotted against the degree of stretching, shown in Figure 3.
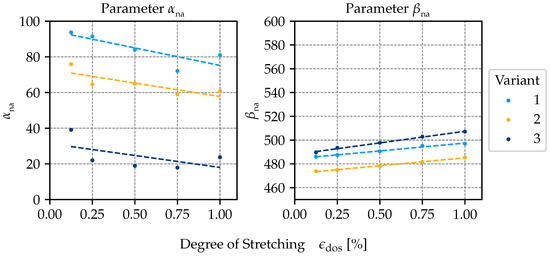
Figure 3.
Correlation between the parameters and and the degree of stretching of the three variants in non-aged condition. The previously determined parameters are displayed as data points, with the linear fits illustrated as dashed lines.
The establishment of a mathematical relationship between the parameters as well as and the degree of stretching is achieved through the implementation of a linear fit. The ensuing equations are thus derived:
where the parameters and describe the gradient, and the parameters and describe the ordinate intercept.
The values of the calculated parameters and the corresponding statistical data can be found in Table 4. The results demonstrate that the parameter assumes a negative value for all of the analysed variants. Therefore, the parameter undergoes a decrease in proportion to the degree of stretching. Conversely, the parameter has been shown to exhibit consistently positive values. Consequently, the parameter rises in proportion to the degree of stretching. When the parameter is compared across all variants, the highest value of 94.8 is observed in variant 1, and the lowest value of 31.4 is seen in variant 3. The parameter exhibits a contradictory behaviour in relation to the variants. The statistical values, which evaluate the linear dependence of and the degree of stretching, show of 0.99–1.00 and RMSE of 0.2 and 0.5 for all variants. The of the linear dependence are between , and varying degrees of stretching are between 0.31 and 0.66. The calculated RMSEs are between 4.5 and 6.4, and the MEs are between 4.9 and 9.4.
Table 4.
Calculated model parameters for the linear dependency between the previous calculated parameters and and the degree of stretching in the non-aged condition.
On the basis of the calculated parameters , , and , the model description used in Equation (1) can be extended to
The model parameters determined for the individual variants are then inserted into the equation, and the validity of the model is checked.
The calculated models are also demonstrated graphically as a relationship between intermesh and offset yield stress. The calculated offset yield stresses of the analysed range are displayed as dotted lines in Figure 4. Furthermore, the measured offset yield stresses are shown as dots, with the respective SD indicated.
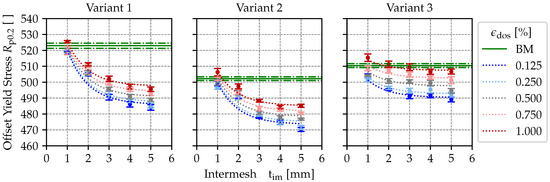
Figure 4.
Correlation between the offset yield stress and the set intermesh at the straightening process for the different degrees of stretching in non-aged condition. The measured values are displayed as dots, while the calculated values are represented by dashed lines. The offset yield stress of straightened material is also compared to the base material.
The results demonstrate that the offset yield stress generally decreases with increasing intermesh and increases with an increasing degree of stretching across all the variants analysed. In comparison to the base material, each variant has a tendency to soften. In the range of investigated parameters, exceptions to this are low intermeshes and high degrees of stretching. A comparison of the variants indicates that variant 1 exerts the most significant softening effects, while variant 3 exhibits the least significant impact.
The material- and process-specific parameters and the statistics of the generated models for the analysed variants have been calculated and are presented in Table 5. As is evident from the data, the models achieve an ranging from 0.90 to 0.95. The ME of the model of the variants considered is between 3.3 MPa and 7.9 MPa, and the RMSE is between 1.5 MPa and 3.2 MPa.
Table 5.
Calculated model parameters and statistic values for the generated multivariate prediction model of the three variants in non-aged condition.
The approach presented in this publication differs from the approach described in the previous publication [33], which is based on a different mathematical equation:
The calculated parameters as well as the statistical characteristics are shown in Table 6. The statistical characteristics demonstrate higher , as well as lower RSME and ME, compared to the novel modelling approach. It should be noted that this previously generated model approach was based purely on the non-aged state of variant 1, whereby the ageing process and the associated varying behaviour with increasing intermesh were not taken into account. Mathematically, it is not possible to describe the divergent dependence of the upper yield strength on the intermesh with varying degrees of stretching within a variant using the previous multivariate model approach. This can only describe a pure reduction or increase in the yield strength characteristics, with increasing intermesh within a variant. Based on this, the newly presented model approach is used.
Table 6.
Multi-linear regression coefficients, intercept and statistic parameters for the previously used equation [33].
3.2. Modelling of Tensile Properties of the Straightened Material in the Aged Condition
Analogous to the prediction modelling in the non-aged condition, the dependence of the upper yield strength on the parameters intermesh and the degree of stretching is investigated in the aged condition. Figure 5 compares the stress–strain diagrams in the aged condition of the same set degree of stretching of 0.125% and intermeshes between 1 mm and 5 mm, as shown for the non-aged condition in Figure 2.
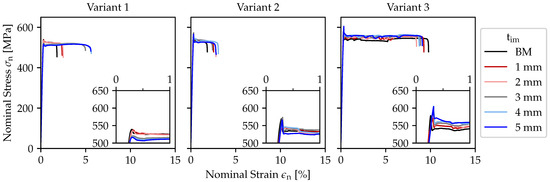
Figure 5.
Exemplary stress–strain diagrams of the base material and the straightened material at a constant degree of stretching of 0.125% and different intermeshes of the three variants in aged condition.
The results of the stress–strain diagrams at a constant degree of stretching show that with increasing intermesh, the nominal stress decreases at variant 1. Also, the strain at break increases with increasing intermesh at variant 1. Variant 3 exhibits a behaviour that is the opposite of variant 1. As the intermesh increases, the nominal stress increases, and the elongation at break decreases. The findings of the tensile tests of the remaining stretch-bending straightening settings, as illustrated in Table 2, indicate that the upper yield strength generally increases with an increasing degree of stretching. Increasing the intermesh leads to different upper yield strength changes depending on the degree of stretching and the variants tested.
The dependency between the intermeshes and the upper yield strength of the individual degrees of stretching for the three variants is initially calculated for each variant by the following equation:
The calculated values for the investigated degrees of stretching and variants are shown in Table 7.
Table 7.
Model parameters for the description of the dependence of the upper yield strength on the intermesh for the respective degrees of stretching of the analysed variants in non-aged condition.
Figure 6 plots the calculated parameters and of the three analysed variants against the degree of stretching.
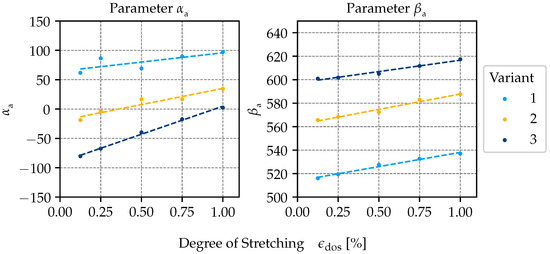
Figure 6.
Correlation between the parameters and and the degree of stretching of the three variants in aged condition. The previously determined parameters are displayed as data points, with the linear fits illustrated as dashed lines.
As with the non-aged condition, parameter demonstrates a tendency to increase in proportion to the degree of stretching. A comparison of this parameter reveals that it assumes both positive and negative values in variants 2 and 3. The parameter of variant 1 shows exclusively positive values. An increase in parameter is accompanied by an increase in the degree of stretching. In comparison with the non-aged condition, this parameter is shifted upwards to higher values. It is notable that parameter of variant 1 attains the lowest values, while those of variant 3 reach the highest. This phenomenon can be likened to the non-aged condition.
The linear fit results in the characteristic values for describing the gradient and the ordinate intercept of the individual factors, which can be found in Table 8. It is, therefore, possible to use the equation to calculate the upper yield strengths of the model, based on the given parameters:
Table 8.
Calculated model parameters for the linear dependency between the previous calculated parameters and and the degree of stretching in the aged condition.
As illustrated in Figure 7, the dependency between the stretch-bending straightening parameters and the measured upper yield strength is comparable to that shown in Figure 4. Furthermore, the modelled upper yield strength of the three variants for the investigated degrees of stretching are displayed.
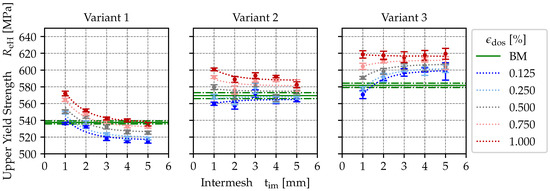
Figure 7.
Correlation between the upper yield strength and the set intermesh at the straightening process for the different degrees of stretching in non-aged condition. The measured values are displayed as dots, while the calculated values are represented by dashed lines. The upper yield strength of straightened material is also compared to the base material.
It is evident that an increase in the degree of stretching at a constant intermesh results in an increase in the upper yield strength. Variant 1 demonstrates a reduction in upper yield strength with increasing intermesh for all degrees of stretching analysed. In variant 3, an increase in the intermesh generally results in an increase in the upper yield strength for the degrees of stretching analysed between 0.125% and 0.750%. When the degree of stretching is set at 1%, the upper yield strength plateaus at the level of the intermeshes that have been analysed. Variant 2 shows an increase in upper yield strength when increasing intermesh is evident for degrees of stretching of 0.125% and 0.250%. For degrees of stretching of 0.750% and 1%, a decrease in upper yield strength with increasing intermesh can be identified. In comparison to the base material, it has been observed that low intermeshes tend to result in an increase in the upper yield strength for variant 1. It has been demonstrated that high intermeshes result in a reduction in the upper yield strength. In the case of variant 3, the stretch-bending straightening parameters that are investigated resulted in an increase in the upper yield strength. Exceptions are the set intermesh of 1 mm and the degree of stretching of 0.125%. Variant 2 demonstrates a reduction in the upper yield strength compared to the base material at straight degrees of stretching of 0.125% and 0.250% and an increase at degrees of stretching of 0.750% and 1%.
The modelling of the dependence of the upper yield strength on the stretch-bending straightening parameters for the three investigated variants in aged condition shows a between 0.82 and 0.98, shown in Table 9. The RMSEs of the modelled variants are between 1.7 and 5 MPa, and the MEs are between 3.5 and 10.4 MPa.
Table 9.
Calculated model parameters and statistic values for the generated multivariate prediction model of the three variants in aged condition.
4. Discussion
The results of the investigation show that in the non-aged condition, an increasing degree of stretching is accompanied by an increase in the offset yield stress at 0.2% of the packaging steels analysed. Contrary to this, an increase in the intermesh leads to a reduction in . Compared to the untreated base material, the stretch-bending straightening process tends to lead to a softening of the material under the test conditions. In the aged condition, an increase in the upper yield strength with an increasing degree of stretching can also be observed in the analysed variants. The increase in intermesh leads to varying changes in upper yield strength, depending on the variant investigated and the degree of stretching. A comparison with the aged base material revealed that softening or hardening effects occurred depending on the degree of stretching and the variants analysed. The newly generated modelling approach has enabled the reliable description of the dependencies of the yield strength characteristics for the variants investigated, both in the non-aged and in the aged state.
The results regarding the increase in yield strength characteristics with an increasing degree of stretching are congruent with the findings of A. Noé et al. [28], Hoggan et al. [30] and O. Noé [32]. The yield strength characteristics demonstrate a trend towards the softening of the stretch-bending straightened material in the non-aged state in comparison to the base material, a finding that was also determined by A. Noé et al. [28]. In contrast, Harangozó et al. [29] and Zhang et al. [31] exhibited a hardening effect as a consequence of the stretch-bending straightening process. Zhang et al. [31] also found that in the case of hot-rolled steel, an increasing intermesh leads to an increase in the lower yield strength. It was observed that the upper yield strength of two investigated packaging steels in the aged condition exhibited a comparable pattern. A direct comparison with previous publications is difficult due to the use of varying materials and test conditions [28,29,30,31,32].
The review of the generated multivariate prediction model indicates an value ranging from 0.90 to 0.95 for the variants investigated. In addition, the model displays a maximum root mean square error of 3.2 MPa, which represents 6.4% of the specified tolerance of the TH550 of ±50 MPa. This finding suggests that the modelling is meaningful. Figure 8 shows the deviations between the measured yield strength values and those predicted by the multivariate model.
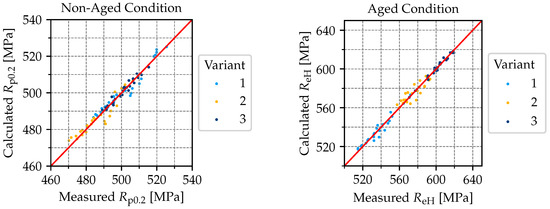
Figure 8.
Check of the quality of the model by comparing the calculated offset yield stress in the non-aged condition and the upper yield strength in the aged condition with the measured values.
Figure 4 shows that the offset yield stress decreases with increasing intermesh. It can also be seen that this effect is less pronounced as the degree of stretching increases. A cross-comparison of the analysed variants shows that variant 1 exhibits the strongest and variant 3 the least softening effects. This behaviour can also be quantified using the model parameters. All variants show a positive , which, when inserted into the Equation (4), results mathematically in a reduction in the offset yield stress with increasing intermesh. In addition, shows the highest values for variant 1 and the lowest values for variant 3. Mathematically, this results in variant 1 showing the steepest drop as a function of the intermesh. Furthermore, the model parameter can be interpreted in such a way that it describes the technical value that is aimed for at an infinitely large intermesh. The maximum theoretical softening of the investigated materials can, therefore, be calculated for each degree of stretching.
It is evident from the results that the non-aged condition can be accurately characterised using the generated multivariate model. In addition, the model parameters can be used to describe the behaviour of the different materials with varying stretch-bending straightening parameters. This can be done in both qualitative and quantitative ways. It is evident that the stretch-bending straightening process results in a comparatively low softening of the material under the specified framework conditions, with temper-rolling degrees that are comparably low in combination with high nitrogen contents (variant 3). In contrast, the stretch-bending straightening process has been shown to result in significantly greater softening effects for materials with comparably high temper-rolling degrees and low carbon and nitrogen contents (variant 3). It is hypothesised that there is a superposition of strength-increasing mechanisms based on the increasing degree of stretching and strength-reducing mechanisms based on increasing intermeshes within the material. It has been determined that an increased alternating bending load as a result of increasing intermeshes leads to stronger softening effects. Conversely, an increase in the degree of stretching leads to enhanced strength. This behaviour could be attributed to the increasing cold deformation due to the increasing plastic elongation of the material. When compared to the base material, this superposition results in different degrees of change in the offset yield stress as a result of the stretch-bending straightening process. The approach to describing the softening and hardening effects at the microstructural level is purely hypothetical and based on the results. Further investigations, such as scanning electron microscopy (SEM) or electron backscatter diffraction (EBSD), are necessary to substantiate these hypotheses.
The ageing effect was also included in the modelling. For this purpose, the dependence of the upper yield strength on the stretch-bending straightening parameters was described, using the same mathematical model equations as in the non-aged condition. By that, it is possible to create a multivariate prediction model of the upper yield strength as a function of the intermesh and degree of stretching based on the linear description of the model parameters. In the case of the analysed variants, this demonstrates highly significant results, which are supported by high and very high values ranging from 0.82 to 0.98. The maximum root mean square error of the model is 5 MPa for variant 2. In relation to the normative tolerance range of the TH550 of ±50 MPa, this corresponds to 10%. In Figure 8, the deviations between the measured upper yield strengths and those predicted by the multivariate model are shown. The larger root mean square errors and of variant 2 compared to variants 1 and 3 could, for example, be due to material inhomogeneities. These could be attributed to microstructural heterogeneity or local differences in ageing response due to varying interstitial element content.
Different behaviours of the change in the upper yield strength as a function of the stretch-bending straightening parameters can be seen at the variants. At variant 1 an increase in the intermesh results in a reduction in the upper yield strength. Variant 3 shows exactly the opposite behaviour, which can be described mathematically using the parameter . In variant 3, this parameter assumes negative values for the analysed stretch-bending straightening parameters. In variant 1, as in the as-delivered condition for parameter , purely positive values occur. Variant 2 shows a mixture of the two behaviours, where the upper yield strength tends to be reduced at high degrees of stretching and increased at low degrees of stretching with increasing intermesh. This behaviour is also reflected in the model parameter , which assumes negative values for degrees of stretching of 0.125% and 0.250% and positive values for degrees of stretching of 0.5% to 1%.
In particular, this divergent behaviour of the dependence of the upper yield strength on the intermesh at different degrees of stretching in the aged condition can be described mathematically using the newly developed multivariate model approach. The multivariate model approach used in the previous publication [33] is mathematically unsuitable for describing this behaviour.
The findings indicate that a multivariate prediction model can be formulated that describes the alterations in upper yield strength resulting from the stretch-bending straightening process and followed by ageing. Furthermore, the findings demonstrate that divergent changes in the upper yield strength as a result of the stretch-bending straightening process with subsequent ageing are caused by different temper-rolling degrees in combination with varying carbon and nitrogen contents. In this context, it can be hypothesised that the dislocation structure and density remain constant as a consequence of the ageing process. The recovery process, which would result in such a change, commences at a temperature of approximately 400 °C for steel [36]. Consequently, it can be hypothesised that the ageing process alone leads to a change in the upper yield strength compared to the base material in the aged condition. A comparison of the dependencies of the upper yield strength on the intermesh of the aged condition with the non-aged condition revealed significant variations across different variants. This phenomenon may be attributed to the variable carbon and nitrogen contents. As previously outlined, the descriptions of the microstructural changes are purely hypothetical and require substantiation through further investigation.
It can be concluded that the multivariate prediction models generated allow for a satisfactory prediction of the yield strength characteristics, both in the non-aged and in the aged state. These models can be utilised to generate stretch-bending straightening process windows. By that, it is possible to adapt the stretch-bending straightening parameter degree of stretching and intermesh to the individual and unpredictable flatness error without the yield strength characteristics being outside the specification. The process windows for the three analysed variants of the TH550 packaging steel specification are shown in Figure 9.
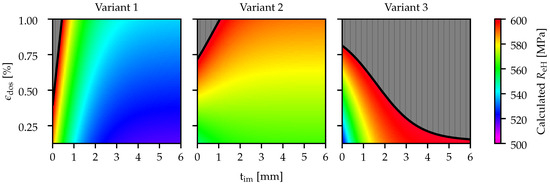
Figure 9.
Predictive modelling of the combined influence of stretch-bending straightening process and ageing on the calculated upper yield strength of different TH550 packaging steels. The calculated upper yield strengths within the tolerances of 550 ± 50 MPa are scaled in color depending on the parameters intermesh and degree of stretching . The settings that would lead to a violation of the tolerance range are shaded in gray.
These can be used to determine all stretch-bending straightening parameter variations that do not exceed the specified upper tolerance limit of the upper yield strength (600 MPa) after subsequent ageing. However, it should be noted that the models are limited to the conditions of the test series. This is because the characteristics determined are not only material-dependent but also process-dependent. It should be mentioned that the characteristics determined are only valid for the stretch-bending straightener of the laboratory plant. However, it is possible to transfer the mathematical description and the trends of the dependency of the determined yield strength characteristics to the stretch-bending straightening parameters to other stretch-bending straighteners. It should be noted that the models were created on the basis of the arithmetic mean values (AM) of the yield strength characteristics of the respective stretch-bending straightening parameters. This approach simplifies the analysis but does not take into account the possible fluctuations within the data. Consequently, these could be overlooked in the modelling process, potentially compromising the accuracy and robustness of the results.
5. Conclusions
This study systematically analysed the influence of the stretch-bending parameters on the yield strength characteristics of three variants of a TH550 packaging steel specification. Furthermore, the combined influence of stretch-bending straightening followed by ageing on the yield strength characteristics was investigated.
- It was found that the offset yield stress of the investigated variants was significantly influenced by the stretch-bending straightening process parameters. An increase in the intermesh results in a reduction, while an increase in the degree of stretching results in an increase in the offset yield stress. The combination of these effects typically results in a softening of the straightened material compared to the untreated base material. The degree of softening is variant-specific and depends on the amount of interstitial elements and the temper-rolling degree.
- A combined analysis of the stretch-bending straightening process with subsequent ageing shows that the yield strength increases with the degree of stretching. As the intermesh increases, the change in yield strength varies depending on the variant and the degree of stretching analysed. As a result of the superposition of the two process parameters, both softening and hardening effects of the stretch-bending straightened and aged material compared to the untreated base material can be seen, depending on the variant.
- A recently developed mathematical approach has enabled the establishment of a correlation between the stretch-bending straightening parameters and the yield strength characteristics in both the non-aged and aged conditions, as outlined in Equations (4) and (7). Based on these findings, a prediction model with adequate-to-excellent predictive power could be developed for both ageing states. These can be used to determine process windows for the stretch-bending straightening process, with which individual flatness errors can be eliminated without violating the yield strength specification.
Author Contributions
Conceptualization, S.M., D.N., B.E., and C.D.; methodology, S.M., D.N., B.E., and C.D.; software, S.M. and C.D.; validation, S.M., D.N., B.E., and C.D.; formal analysis, S.M. and C.D.; investigation, S.M. and C.D.; resources, S.M., D.N., and B.E.; data curation, S.M. and C.D.; writing—original draft preparation, S.M.; writing—review and editing, S.M., H.A., and C.D.; visualization, S.M. and C.D.; supervision, H.A. and C.D.; project administration, S.M.; funding acquisition, S.M. All authors have read and agreed to the published version of the manuscript.
Funding
This research received no external funding.
Data Availability Statement
The datasets presented in this article are not readily available due to techinical limitations. Requests to access the datasets should be directed to Sebastian Möller.
Conflicts of Interest
The authors Sebastian Möller, Dimitrios Nouskalis and Björn Ehmke were employed by the company thyssenkrupp Rasselstein GmbH. The remaining authors declare that the research was conducted in the absence of any commercial or financial relationships that could be construed as a potential conflict of interest.
Nomenclature
The following abbreviations are used in this manuscript:
| Material- and process-specific parameter in aged condition | |
| Material- and process-specific parameter in aged condition | |
| Material- and process-specific parameter in aged condition | |
| Material- and process-specific parameter in non-aged condition | |
| Material- and process-specific parameter in non-aged condition | |
| Material- and process-specific parameter in non-aged condition | |
| Material- and process-specific parameter in aged condition | |
| Material- and process-specific parameter in aged condition | |
| Material- and process-specific parameter in aged condition | |
| Material- and process-specific parameter in non-aged condition | |
| Material- and process-specific parameter in non-aged condition | |
| Material- and process-specific parameter in non-aged condition | |
| Degree of stretching | |
| Nominal strain | |
| Nominal stress | |
| A | Strain at break |
| Offset yield stress at 0.01% | |
| Offset yield stress at 0.1% | |
| Offset yield stress at 0.2% | |
| Upper yield strength | |
| Lower yield strength | |
| Tensile strength | |
| Intermesh |
References
- Mathieu, N.; Dimitriou, R.; Parrico, A.; Potier-Ferry, M.; Zahrouni, H. Flatness defects after bridle rolls: A numerical analysis of leveling. Int. J. Mater. Form. 2011, 6, 255–266. [Google Scholar] [CrossRef]
- Morris, J.W.; Hardy, S.J.; Thomas, J.T. Effects of tension levelling process parameters on cold rolled strip characteristics using a designed factorial analysis approach. Ironmak. Steelmak. 2005, 32, 443–448. [Google Scholar] [CrossRef]
- Shelest, A.; Yusupov, V.; Rogachev, S.; Andreev, V.; Perkas, M. Refinement of the Model of Alternating Elastoplastic Bending for the Deformation of a Sheet Material on a Roll Leveling Machine. Russ. Metall. (Metally) 2023, 2022, 1408–1413. [Google Scholar] [CrossRef]
- Huh, H.; Heo, J.H.; Lee, H.W. Optimization of a roller levelling process for Al7001T9 pipes with finite element analysis and Taguchi method. Int. J. Mach. Tools Manuf. 2003, 43, 345–350. [Google Scholar] [CrossRef]
- Mathieu, N.; Potier-Ferry, M.; Zahrouni, H. Reduction of flatness defects in thin metal sheets by a pure tension leveler. Int. J. Mech. Sci. 2017, 122, 267–276. [Google Scholar] [CrossRef]
- Grüber, M.; Hirt, G. Investigation of correlation between material properties, process parameters and residual stresses in roller levelling. Procedia Manuf. 2018, 15, 844–851. [Google Scholar] [CrossRef]
- Liu, Z.; Wang, Y.; Ou, H.; Yan, X.; Luo, Y. An analytical leveling model of curvature and residual stress simulation for H-beams. J. Constr. Steel Res. 2014, 102, 13–23. [Google Scholar] [CrossRef]
- Cui, L.; Shi, Q.Q.; Liu, X.; Hu, X.L. Residual Curvature of Longitudinal Profile Plate Roller in Leveling Process. J. Iron Steel Res. Int. 2013, 20, 23–27. [Google Scholar] [CrossRef]
- Nastran, M.; Kuzman, K. Stabilisation of mechanical properties of the wire by roller straightening. J. Mater. Process. Technol. 2002, 125, 711–719. [Google Scholar] [CrossRef]
- Liu, Z.; Luo, Y.; Wang, Y.; Liao, T.; Deng, M. An analytical study of optimal roller intermeshes for the plate leveling process. Proc. Inst. Mech. Eng. Part B J. Eng. Manuf. 2020, 235, 095440542094795. [Google Scholar] [CrossRef]
- Yi, G.; Wang, Z.; Hu, Z. A Novel Modeling Method in Metal Strip Leveling Based on a Roll-Strip Unit. Math. Probl. Eng. 2020, 2020, 1486864. [Google Scholar] [CrossRef]
- Misaka, Y.; Masui, T. Shape Correction of Steel Strip by Tension Leveller. ISIJ Int. 1978, 18, 475–484. [Google Scholar] [CrossRef]
- Liu, Z.; Luo, Y.; Wang, Y.; Liao, T. A New Curvature Analytical Method in Plate Leveling Process. ISIJ Int. 2018, 58, 1094–1101. [Google Scholar] [CrossRef][Green Version]
- Kuo, S.K.; Ou, Y.L.; Wang, D.A. An Analytical Model for Stress and Curvature Prediction of a Strip Leveling Process. Metals 2022, 12, 757. [Google Scholar] [CrossRef]
- Doege, E.; Menz, R.; Huinink, S. Analysis of the levelling process based upon an analytic forming model. Cirp-Ann.-Manuf. Technol. 2002, 51, 191–194. [Google Scholar] [CrossRef]
- Chen, W.; Liu, J.; Cui, Z.; Wang, Y.; Wang, Y. A 2.5-dimensional Analytical Model of Cold Leveling for Plates with Transverse Wave Defects. J. Iron Steel Res. Int. 2015, 22, 664–671. [Google Scholar] [CrossRef]
- Shelest, A.; Yusupov, V.; Rogachev, S.; Andreev, V.; Karelin, R.; Perkas, M. Additional Effect of Elastoplastic Alternating Deformation on the Properties of Metallic Materials during Their Processing on a Roll Leveling Machine. Russ. Metall. (Metally) 2023, 2023, 68–75. [Google Scholar] [CrossRef]
- Seo, J.; Vantyne, C.; Moon, Y.H. Effect of roll configuration on the levelling efficiency of tail-up bent plate using finite element analysis. J. Manuf. Sci. Eng. 2015, 138, 071004. [Google Scholar] [CrossRef]
- Sun, J.L.; Du, X.M.; Li, K.; Peng, Y. Longitudinally profiled plate leveling theory based on linear decreasing leveling scheme. J. Iron Steel Res. Int. 2018, 26, 130–136. [Google Scholar] [CrossRef]
- Garcia, A.; Trinidad, J.; Otegi, N.; Mendiguren, J.; de Argandoña, E.S.; Silvestre, E.; Galdos, L. The influence of the kinematic hardening on the FEM simulation of Tension Levelling Process. Procedia Manuf. 2020, 47, 1381–1386. [Google Scholar] [CrossRef]
- Yoshida, F.; Urabe, M. Computer-aided process design for the tension levelling of metallic strips. J. Mater. Process. Technol. 1999, 89–90, 218–223. [Google Scholar] [CrossRef]
- Grüber, M.; Hirt, G. A strategy for the controlled setting of flatness and residual stress distribution in sheet metals via roller levelling. Procedia Eng. 2017, 207, 1332–1337. [Google Scholar] [CrossRef]
- Silvestre, E.; Sáenz de Argandoña, E.; Galdos, L.; Mendiguren, J. Testing and Modeling of Roll Levelling Process. Key Eng. Mater. 2014, 611, 1753–1762. [Google Scholar] [CrossRef]
- Kotov, K.A.; Bolobanova, N.L.; Nushtaev, D.V. Modeling the Stress State of a Steel Strip with a Roller Leveling Machine under Cyclic Alternating Deformations. Steel Transl. 2020, 50, 750–755. [Google Scholar] [CrossRef]
- Li, S.Z.; Yin, Y.D.; Xu, J.; Hou, J.M.; Yoon, J. Numerical Simulation of Continuous Tension Leveling Process of Thin Strip Steel and Its Application. J. Iron Steel Res. Int. 2007, 14, 8–13. [Google Scholar] [CrossRef]
- Wang, H.; Zhang, Y.; Fan, C.; Chen, D.; Guo, J.; Yanagimoto, J. Effects of yield point and plastic anisotropy on results of elastic–plastic finite element analysis of tension leveling. J. Braz. Soc. Mech. Sci. Eng. 2022, 44. [Google Scholar] [CrossRef]
- Laugwitz, M.; Jochum, M.; Scheffer, T.; Lohmar, J. Towards hot levelling strategies for steel heavy plates: Analysis of flatness evolution in accelerated cooling, hot levelling, and final air cooling via thermo-mechanical FE modelling. Int. J. Adv. Manuf. Technol. 2022, 120, 2469–2488. [Google Scholar] [CrossRef]
- Noé, A.; Fischer, F.D.; Schwenzfeier, W. Theoretische und Praktische Untersuchungen zum Streckbiegerichten. Stahl und Eisen 1986, 106, 67–73. [Google Scholar]
- Harangozó, D.; Czinege, I. Effect of Roller Levelling on Tensile Properties of Aluminum Sheets. Materials 2023, 2023, 3001. [Google Scholar] [CrossRef]
- Hoggan, E.; Scott, R.; Barnett, M.; Hodgson, P. Mechanical properties of tension levelled and skin passed steels. J. Mater. Process. Technol. 2002, 125, 155–163. [Google Scholar] [CrossRef]
- Zhang, J.; Zhou, C.; Li, H.; Zhang, X.; Li, M. Influence of Tension Leveling Parameters on the Microstructure and Mechanical Properties of Steel Strip. JOM 2017, 69, 937–941. [Google Scholar] [CrossRef]
- Noé, O. Einfluß des Kontinuierlichen Streckbiegerichtens auf Die Bandeigenschaften; Verlag Stahleisen: Düsseldorf, Germany, 1971. [Google Scholar]
- Möller, S.; Nouskalis, D.; Ehmke, B.; Matusch, D.; Dresbach, C.; Altenbach, H. Effects of Stretch-Bending Straightening on the Tensile Properties of Cold Rolled Packaging Steel. Metals 2024, 14, 1203. [Google Scholar] [CrossRef]
- DIN EN 10202:2022-07; Cold Reduced Tinmill Products–Electrolytic Tinplate and Electrolytic Chromium/Chromium Oxide Coated Steel. German Institute for Standardisation: Berlin, Germany, 2022.
- DIN EN ISO 6892-1:2020-06; Metallic Materials—Tensile Testing—Part 1: Method of Test at Room Temperature (ISO 6892-1:2019). German Institute for Standardisation: Berlin, Germany, 2020.
- Berns, H.; Theisen, W. Eisenwerkstoffe—Stahl und Gusseisen, 4th ed.; Springer: Berlin/Heidelberg, Germany, 2008. [Google Scholar] [CrossRef]


Disclaimer/Publisher’s Note: The statements, opinions and data contained in all publications are solely those of the individual author(s) and contributor(s) and not of MDPI and/or the editor(s). MDPI and/or the editor(s) disclaim responsibility for any injury to people or property resulting from any ideas, methods, instructions or products referred to in the content. |
© 2025 by the authors. Licensee MDPI, Basel, Switzerland. This article is an open access article distributed under the terms and conditions of the Creative Commons Attribution (CC BY) license (https://creativecommons.org/licenses/by/4.0/).