
Corrosion Behavior and Mechanism of Mg-1Bi and Mg-1Sn Extruded Alloys


Abstract

1. Introduction
2. Materials and Methods
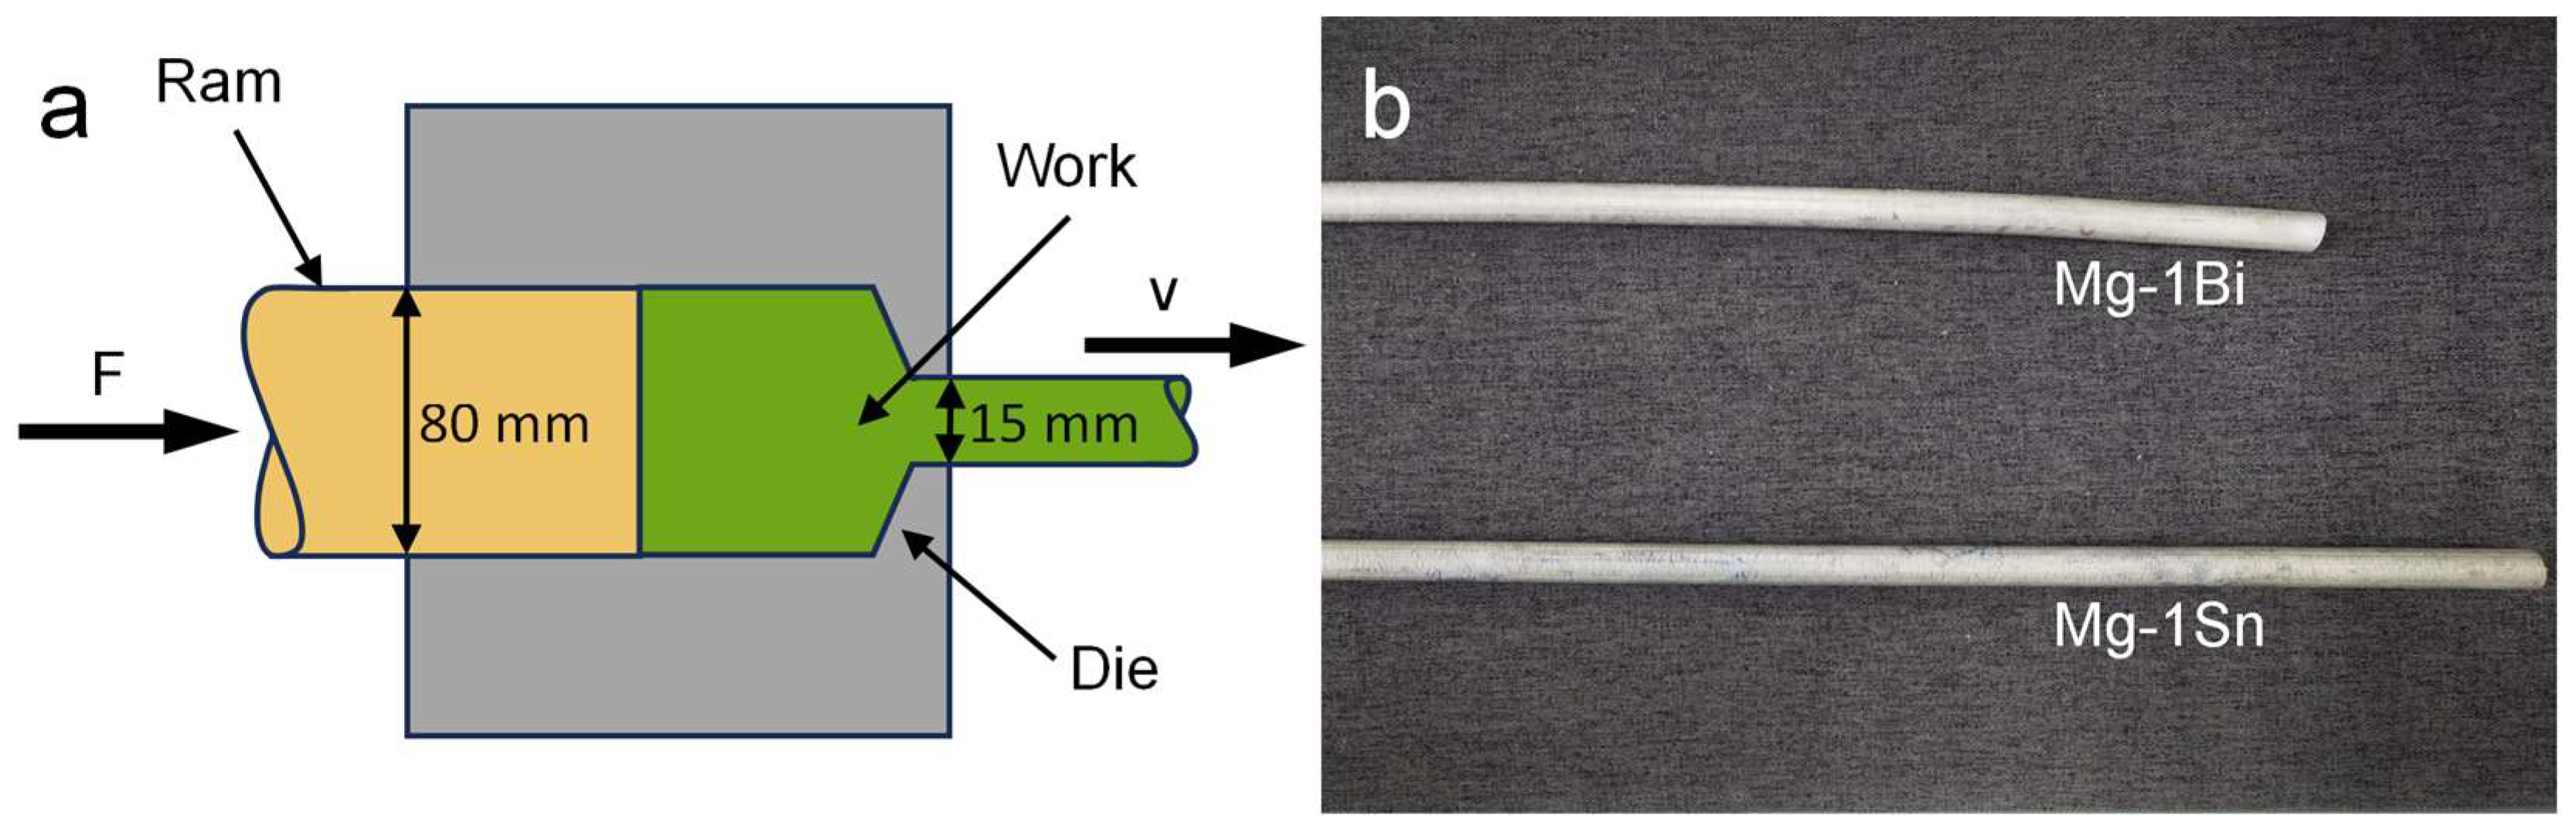
2.1. Materials Preparation
2.2. Microstructural Characterization
2.3. Immersion Experiments
2.4. Electrochemical Measurements
2.5. Localized Potential Distribution
3. Results and Discussion
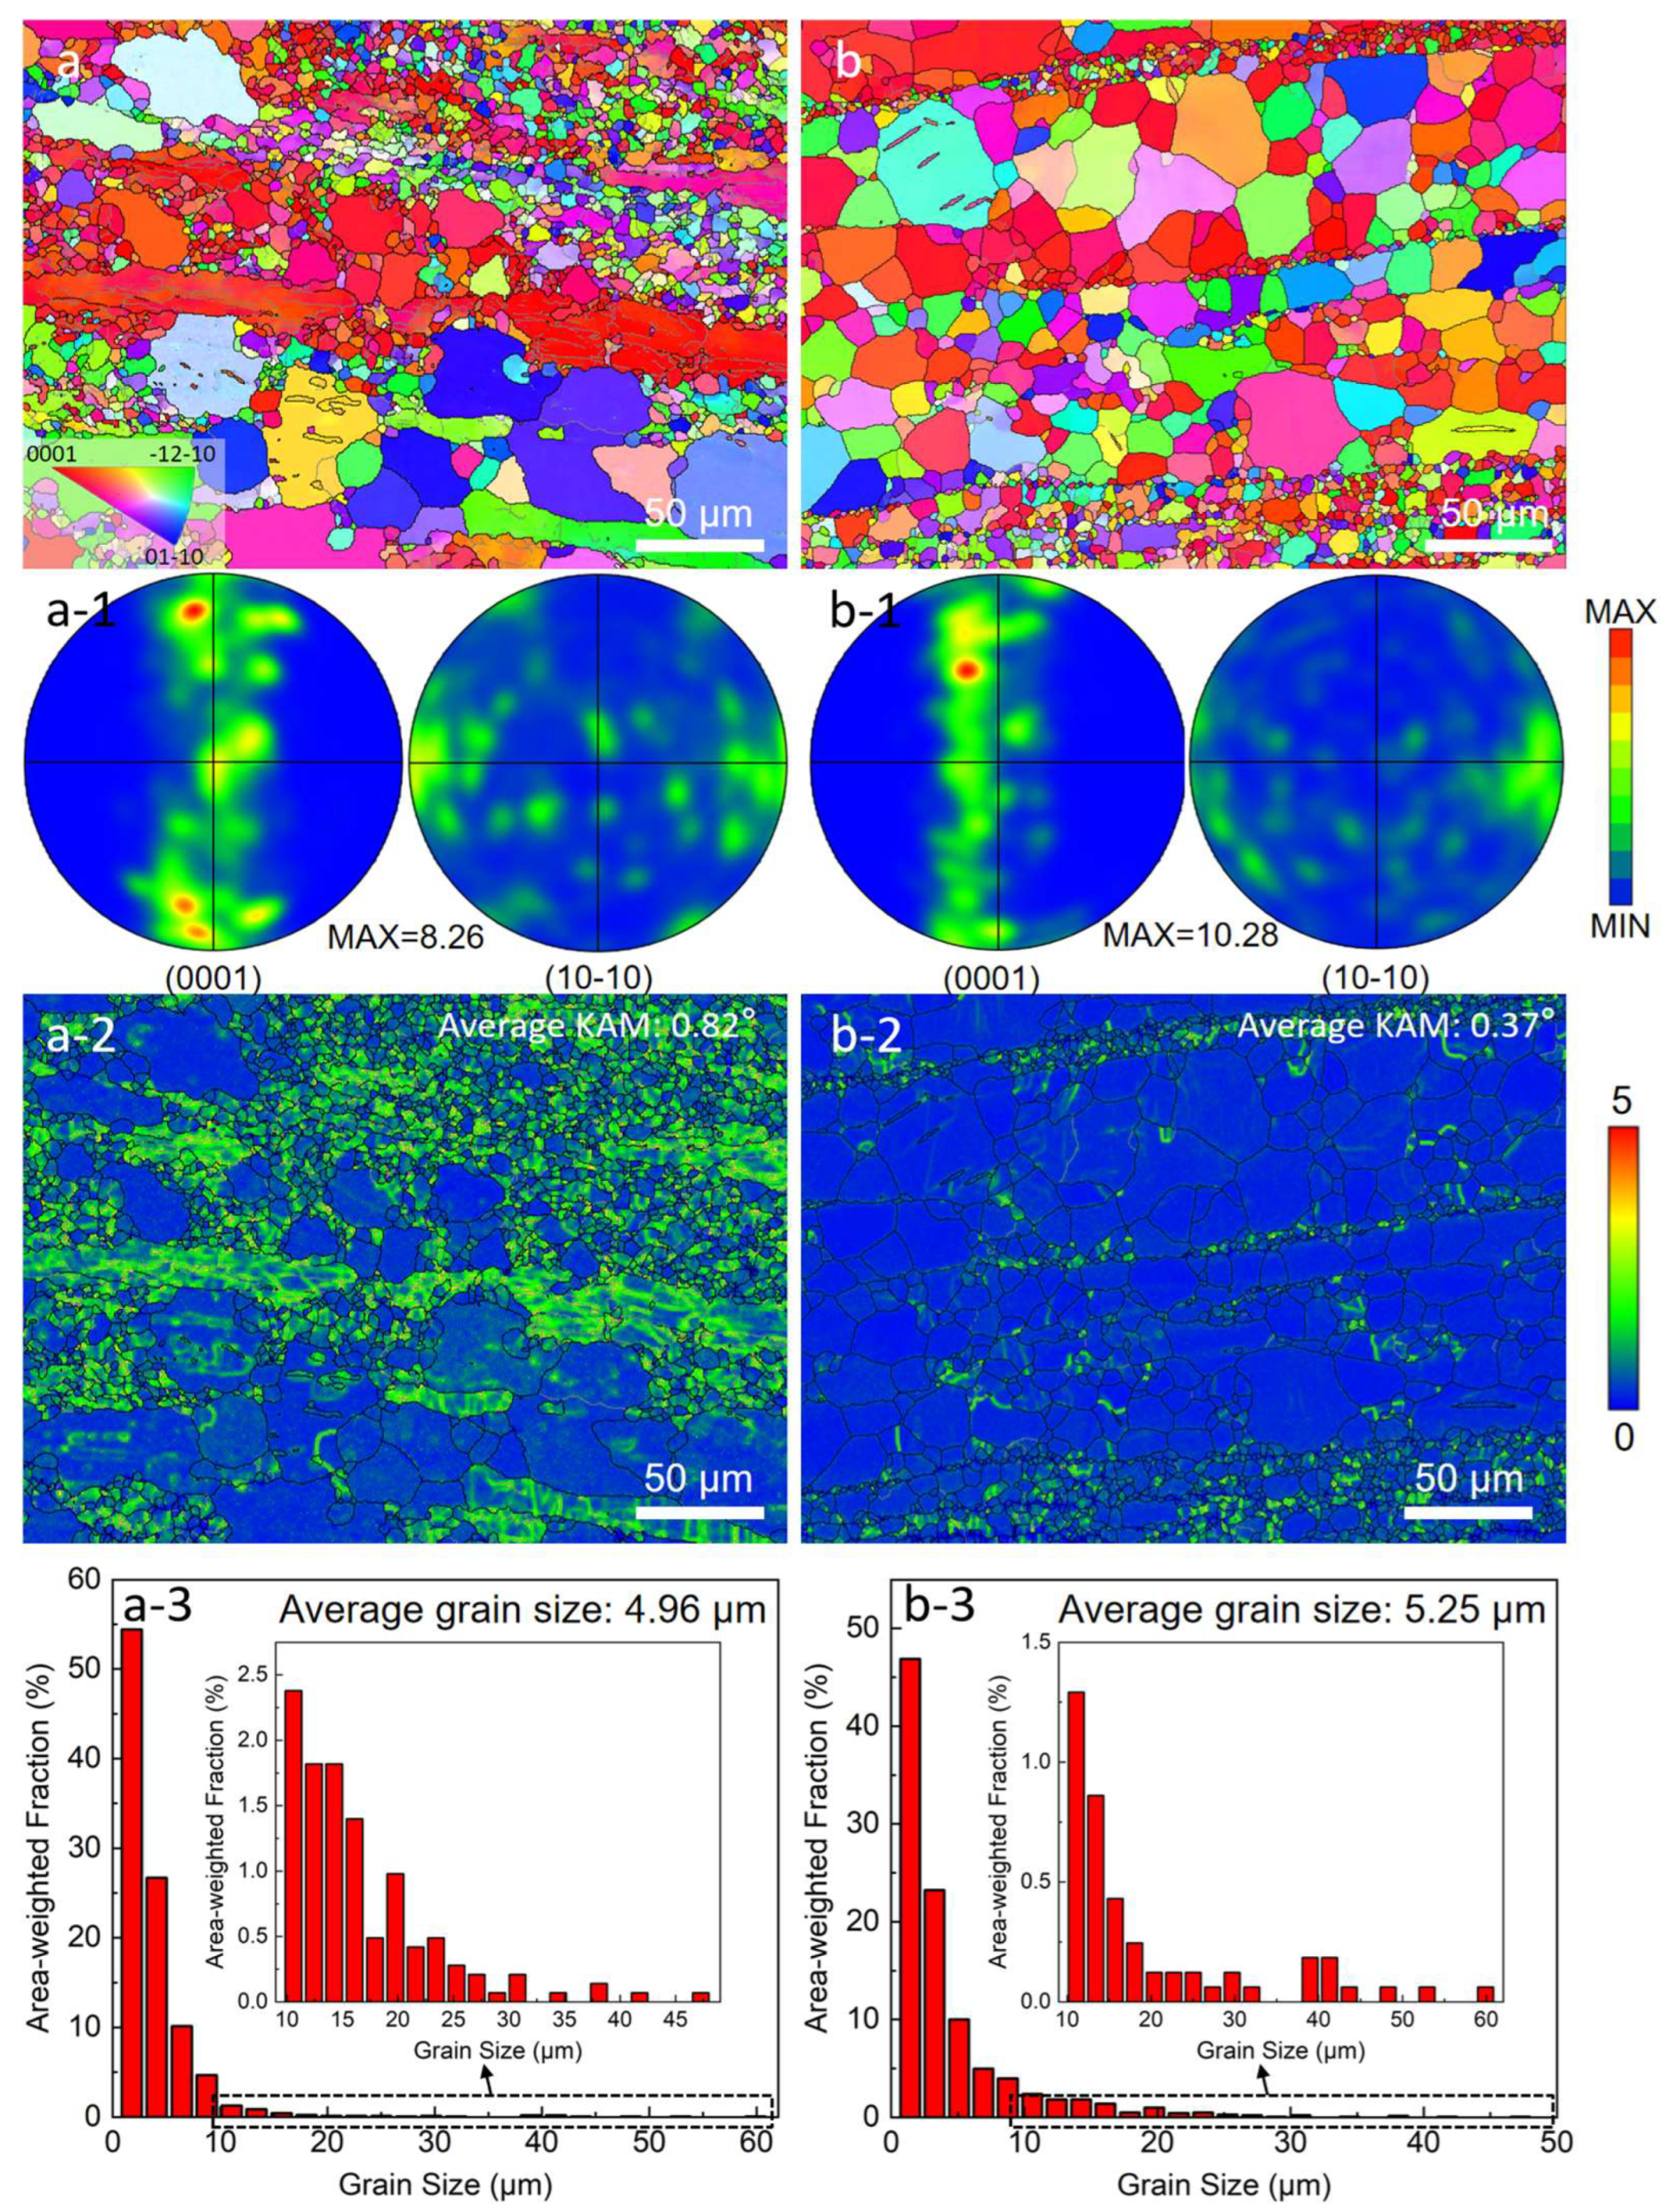
3.1. Microstructure Characteristics
3.2. Corrosion Behavior
3.2.1. Corrosion Rate in Immersion Testing
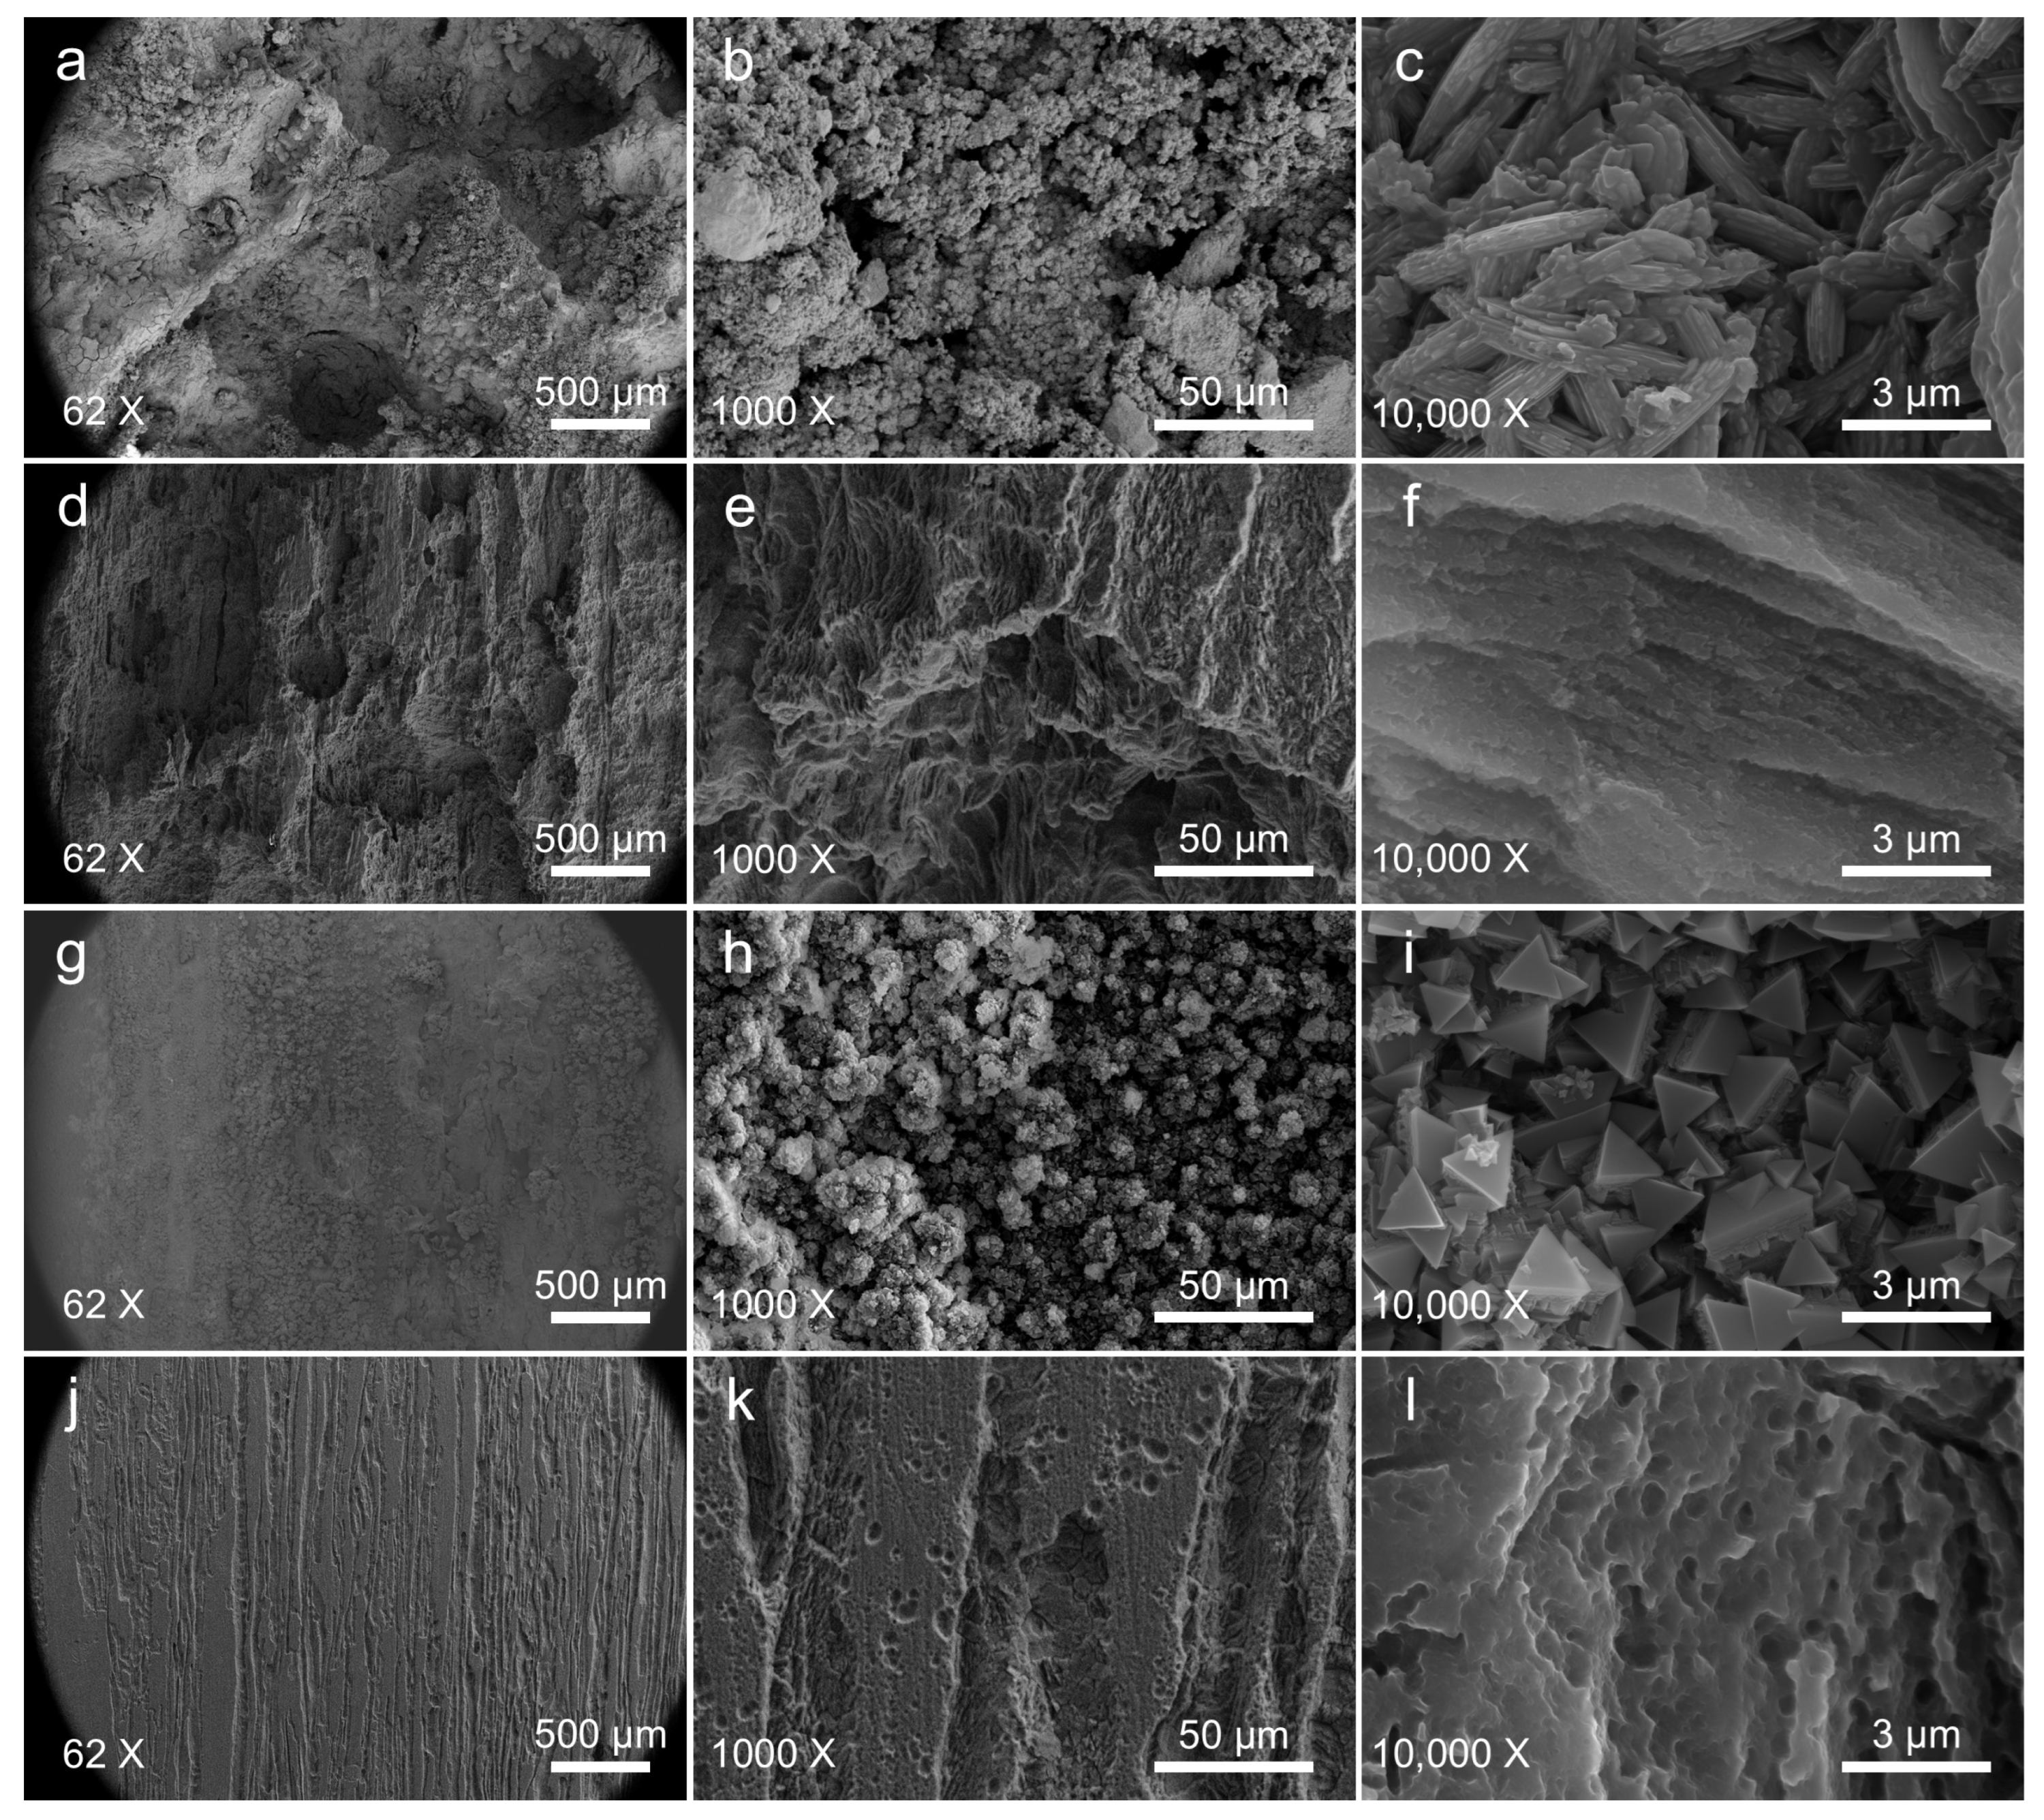
3.2.2. Corrosion Morphology and Product
3.2.3. Local Potential Distribution
3.2.4. Corrosion Behavior in Electrochemical Testing
4. Conclusions
- (1)
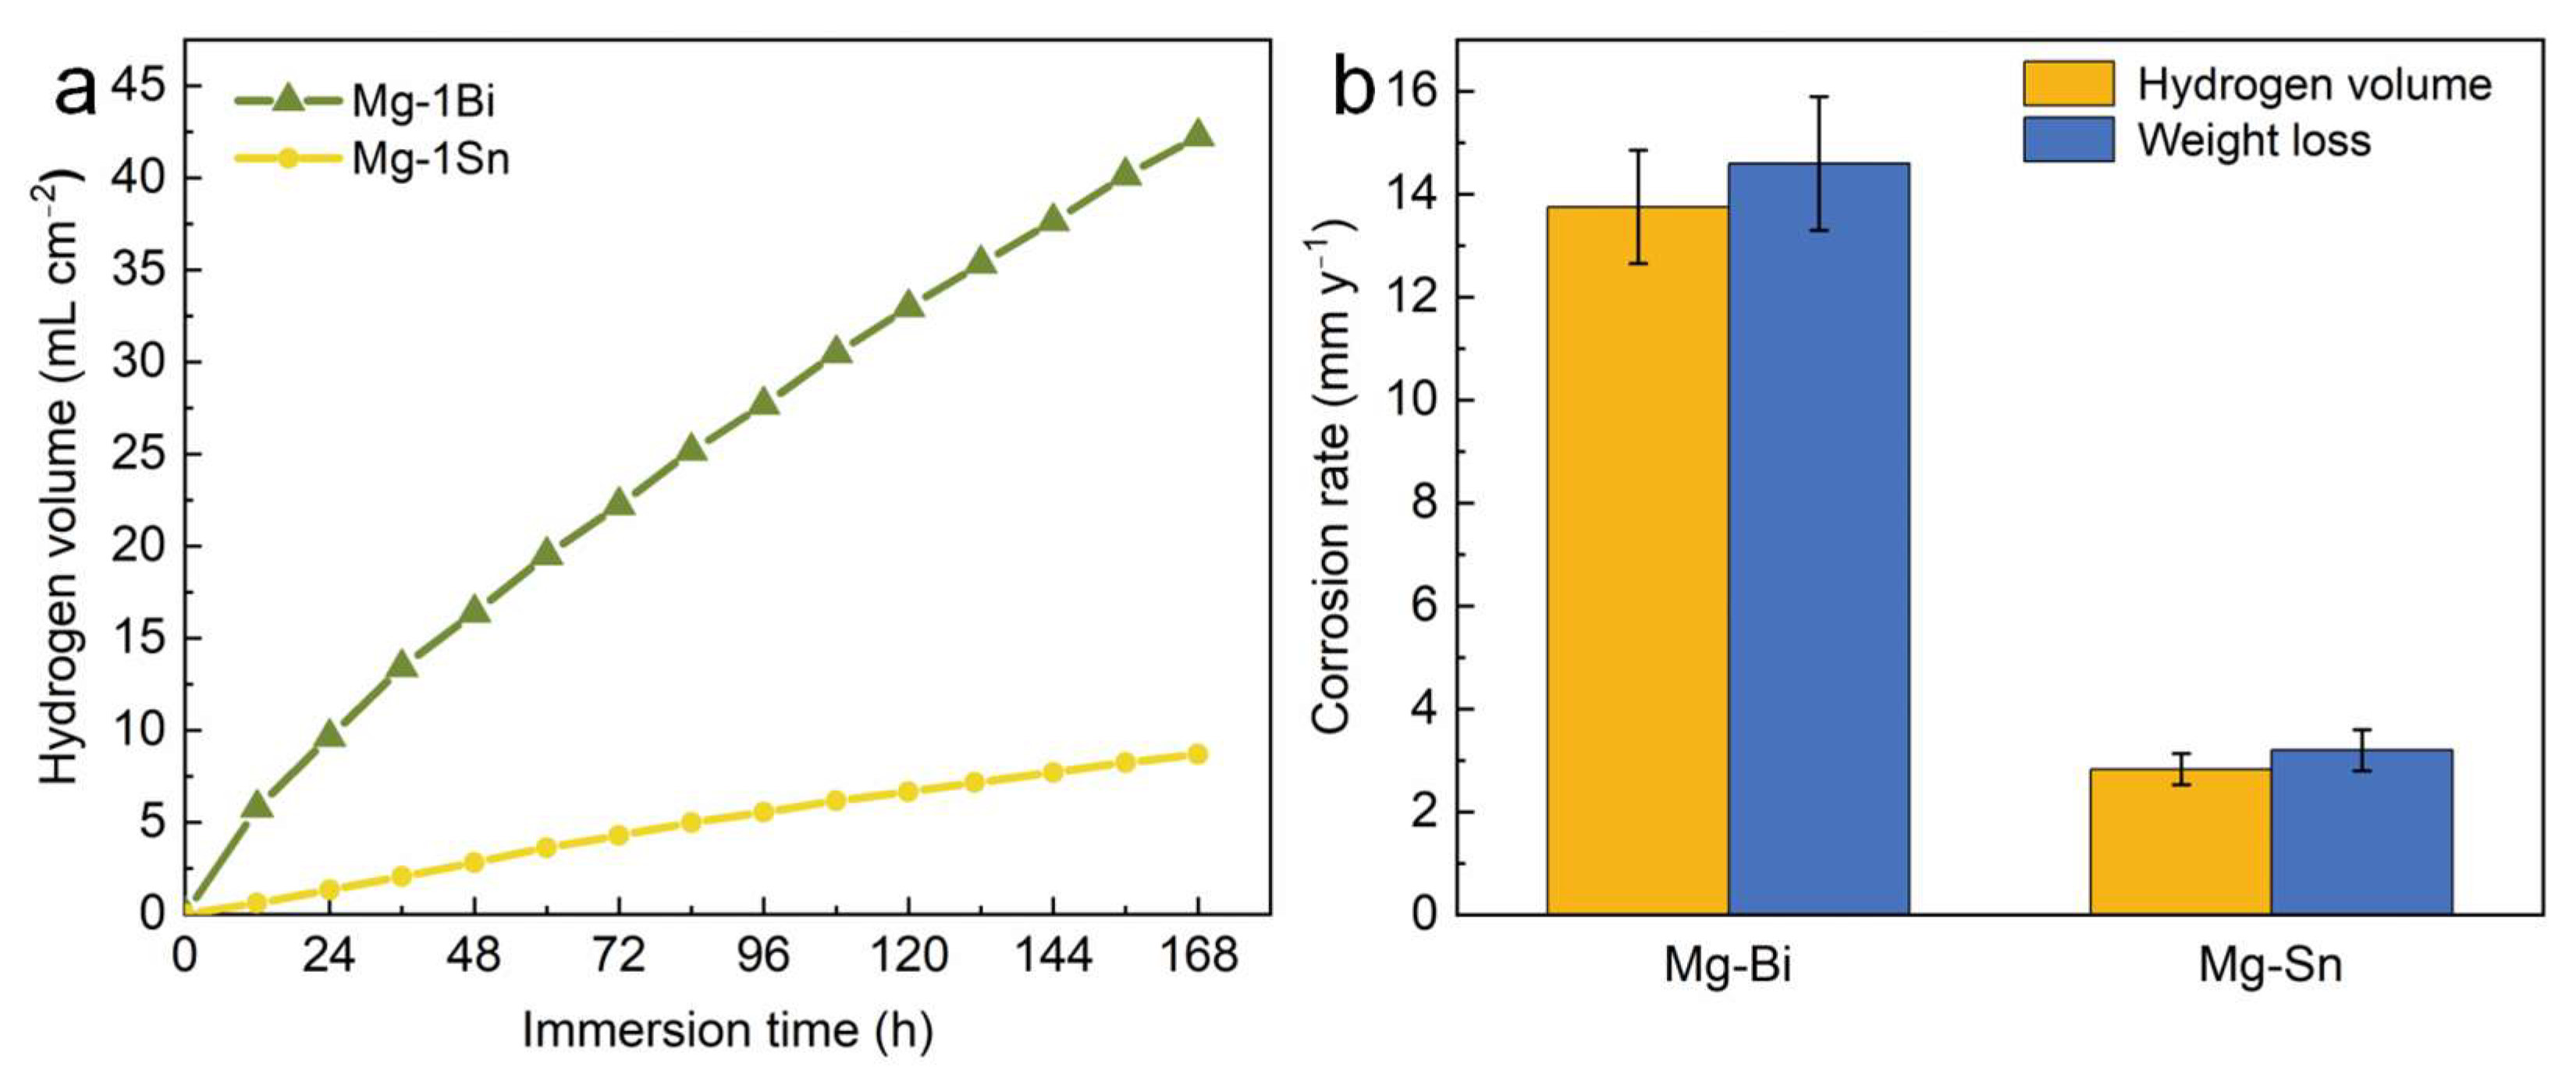
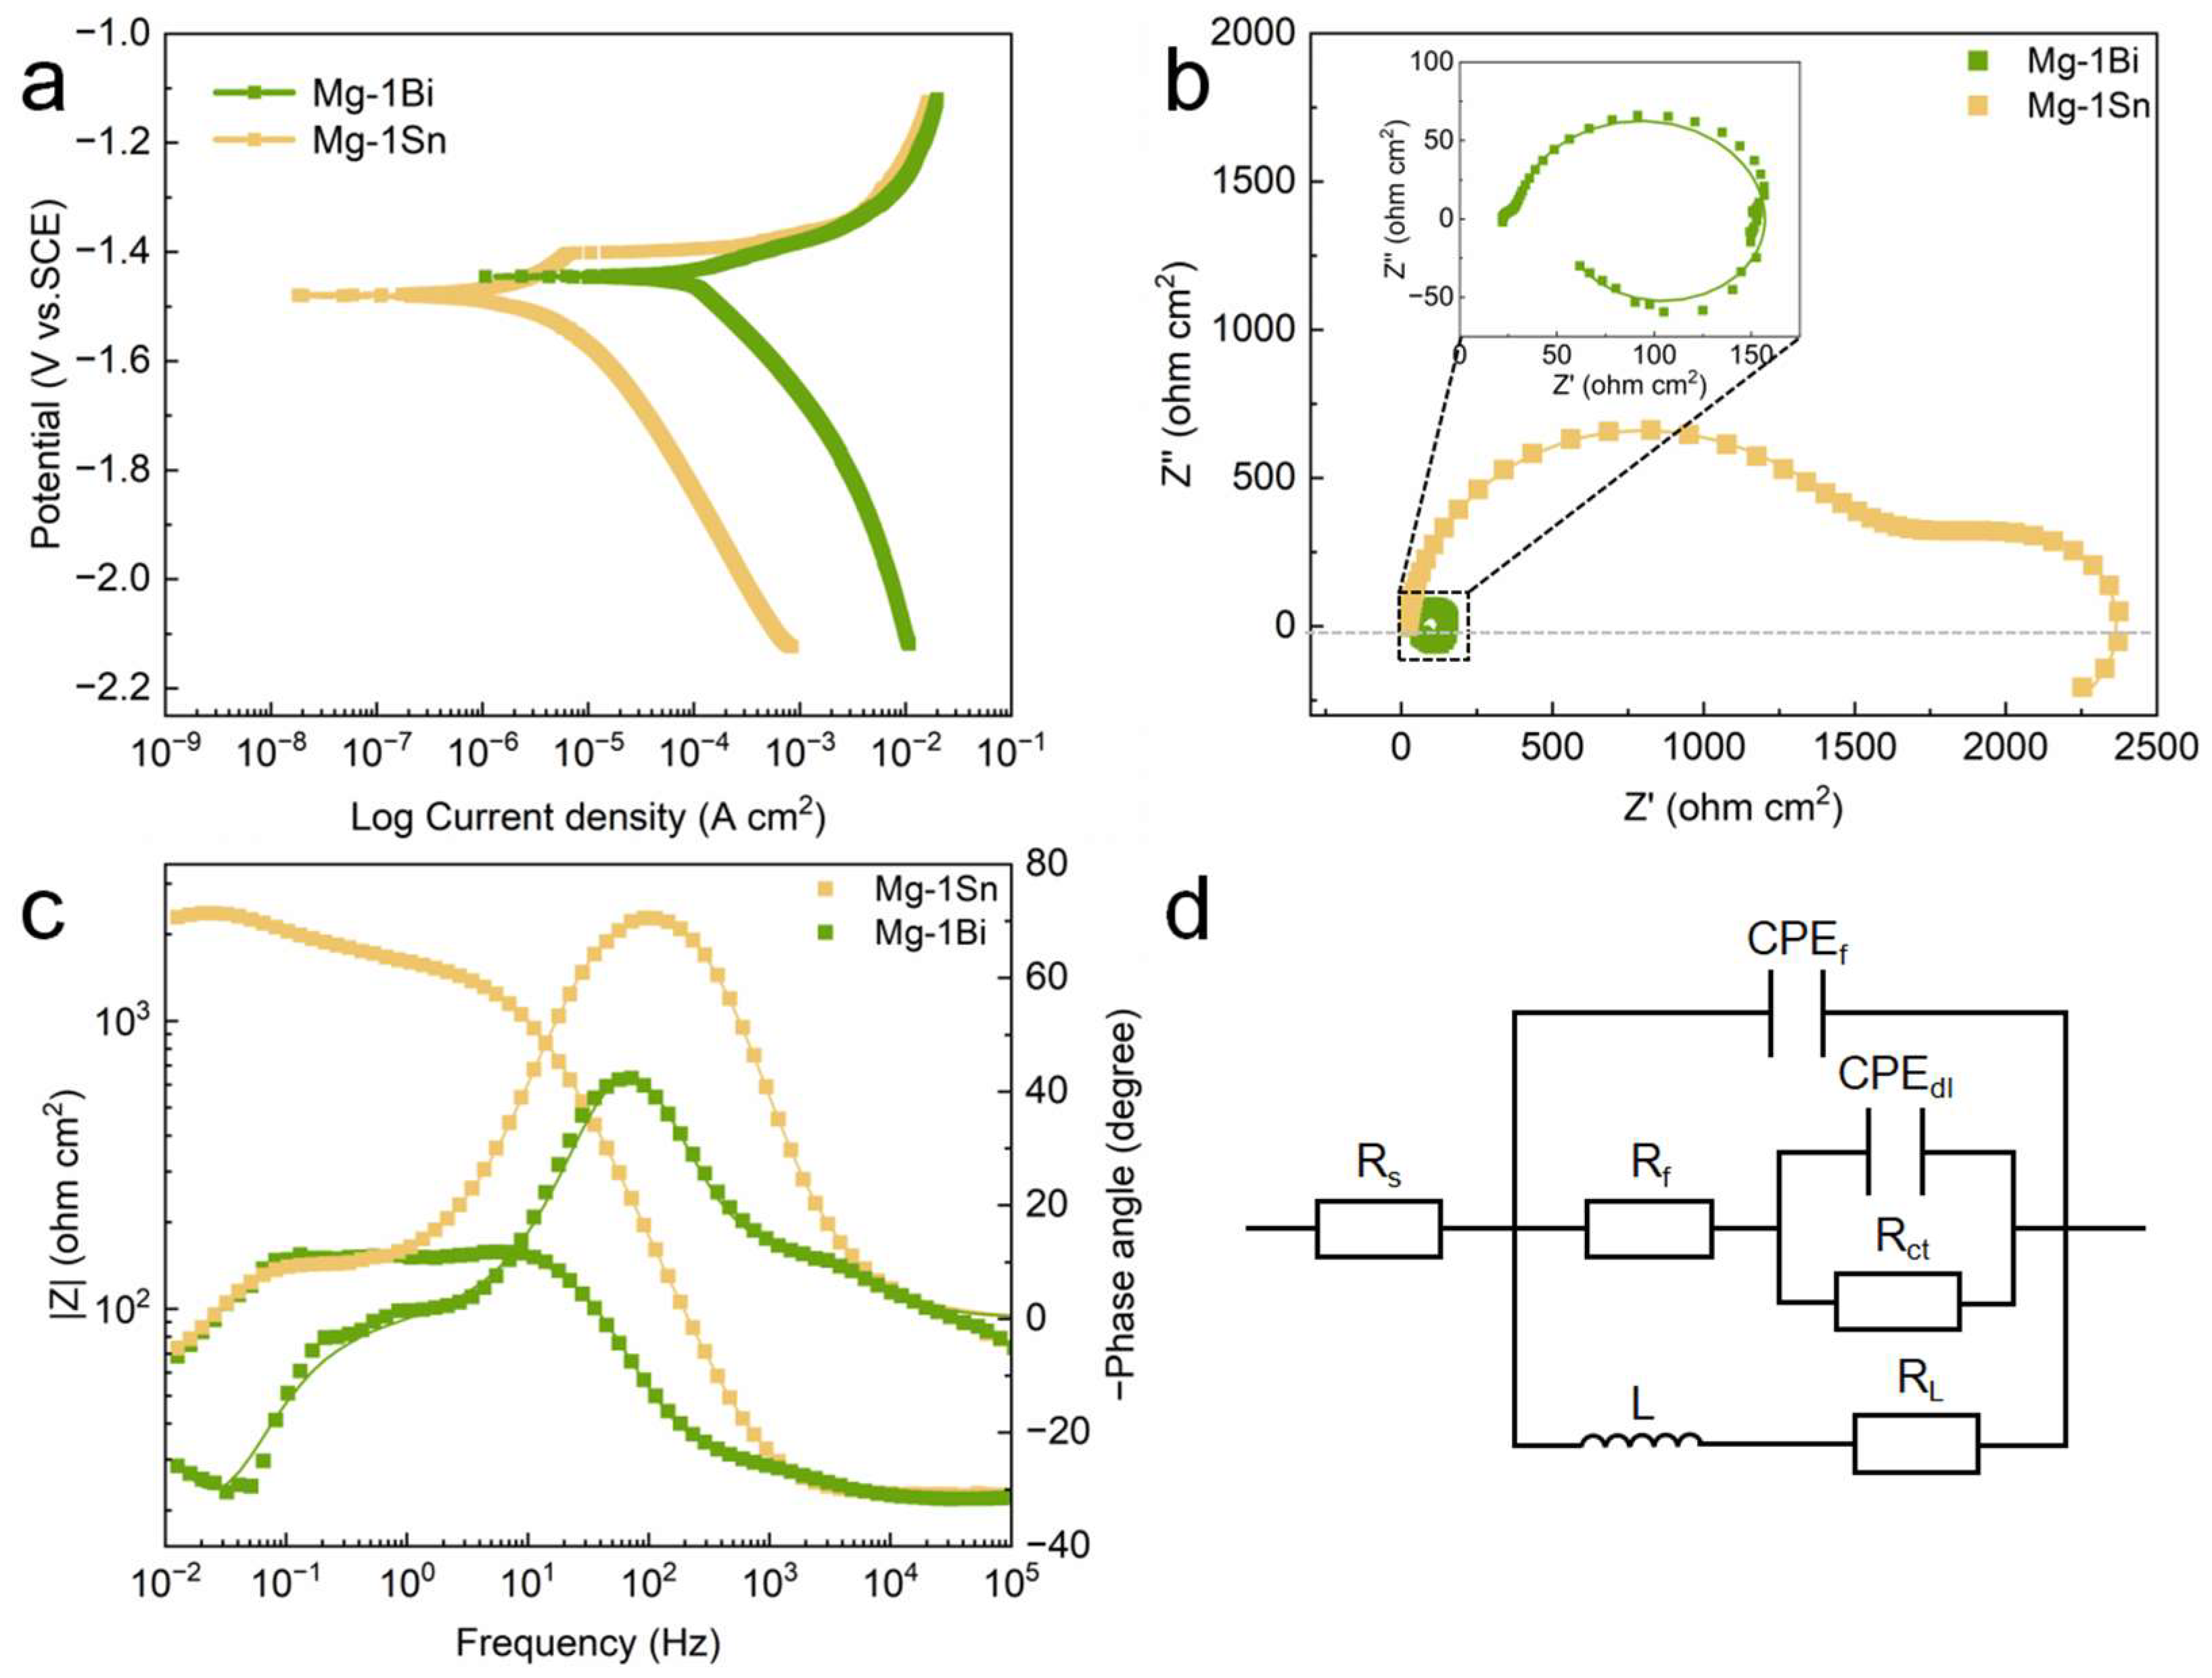
- In immersion and electrochemical experiments, the Mg-1Sn alloy exhibits better corrosion resistance than the Mg-1Bi alloy. The corrosion rate of the Mg-1Sn alloy (PH: 2.83 ± 0.19 mm y−1) is significantly lower than that of the Mg-1Bi alloy (PH: 13.75 ± 1.12 mm y−1).
- (2)
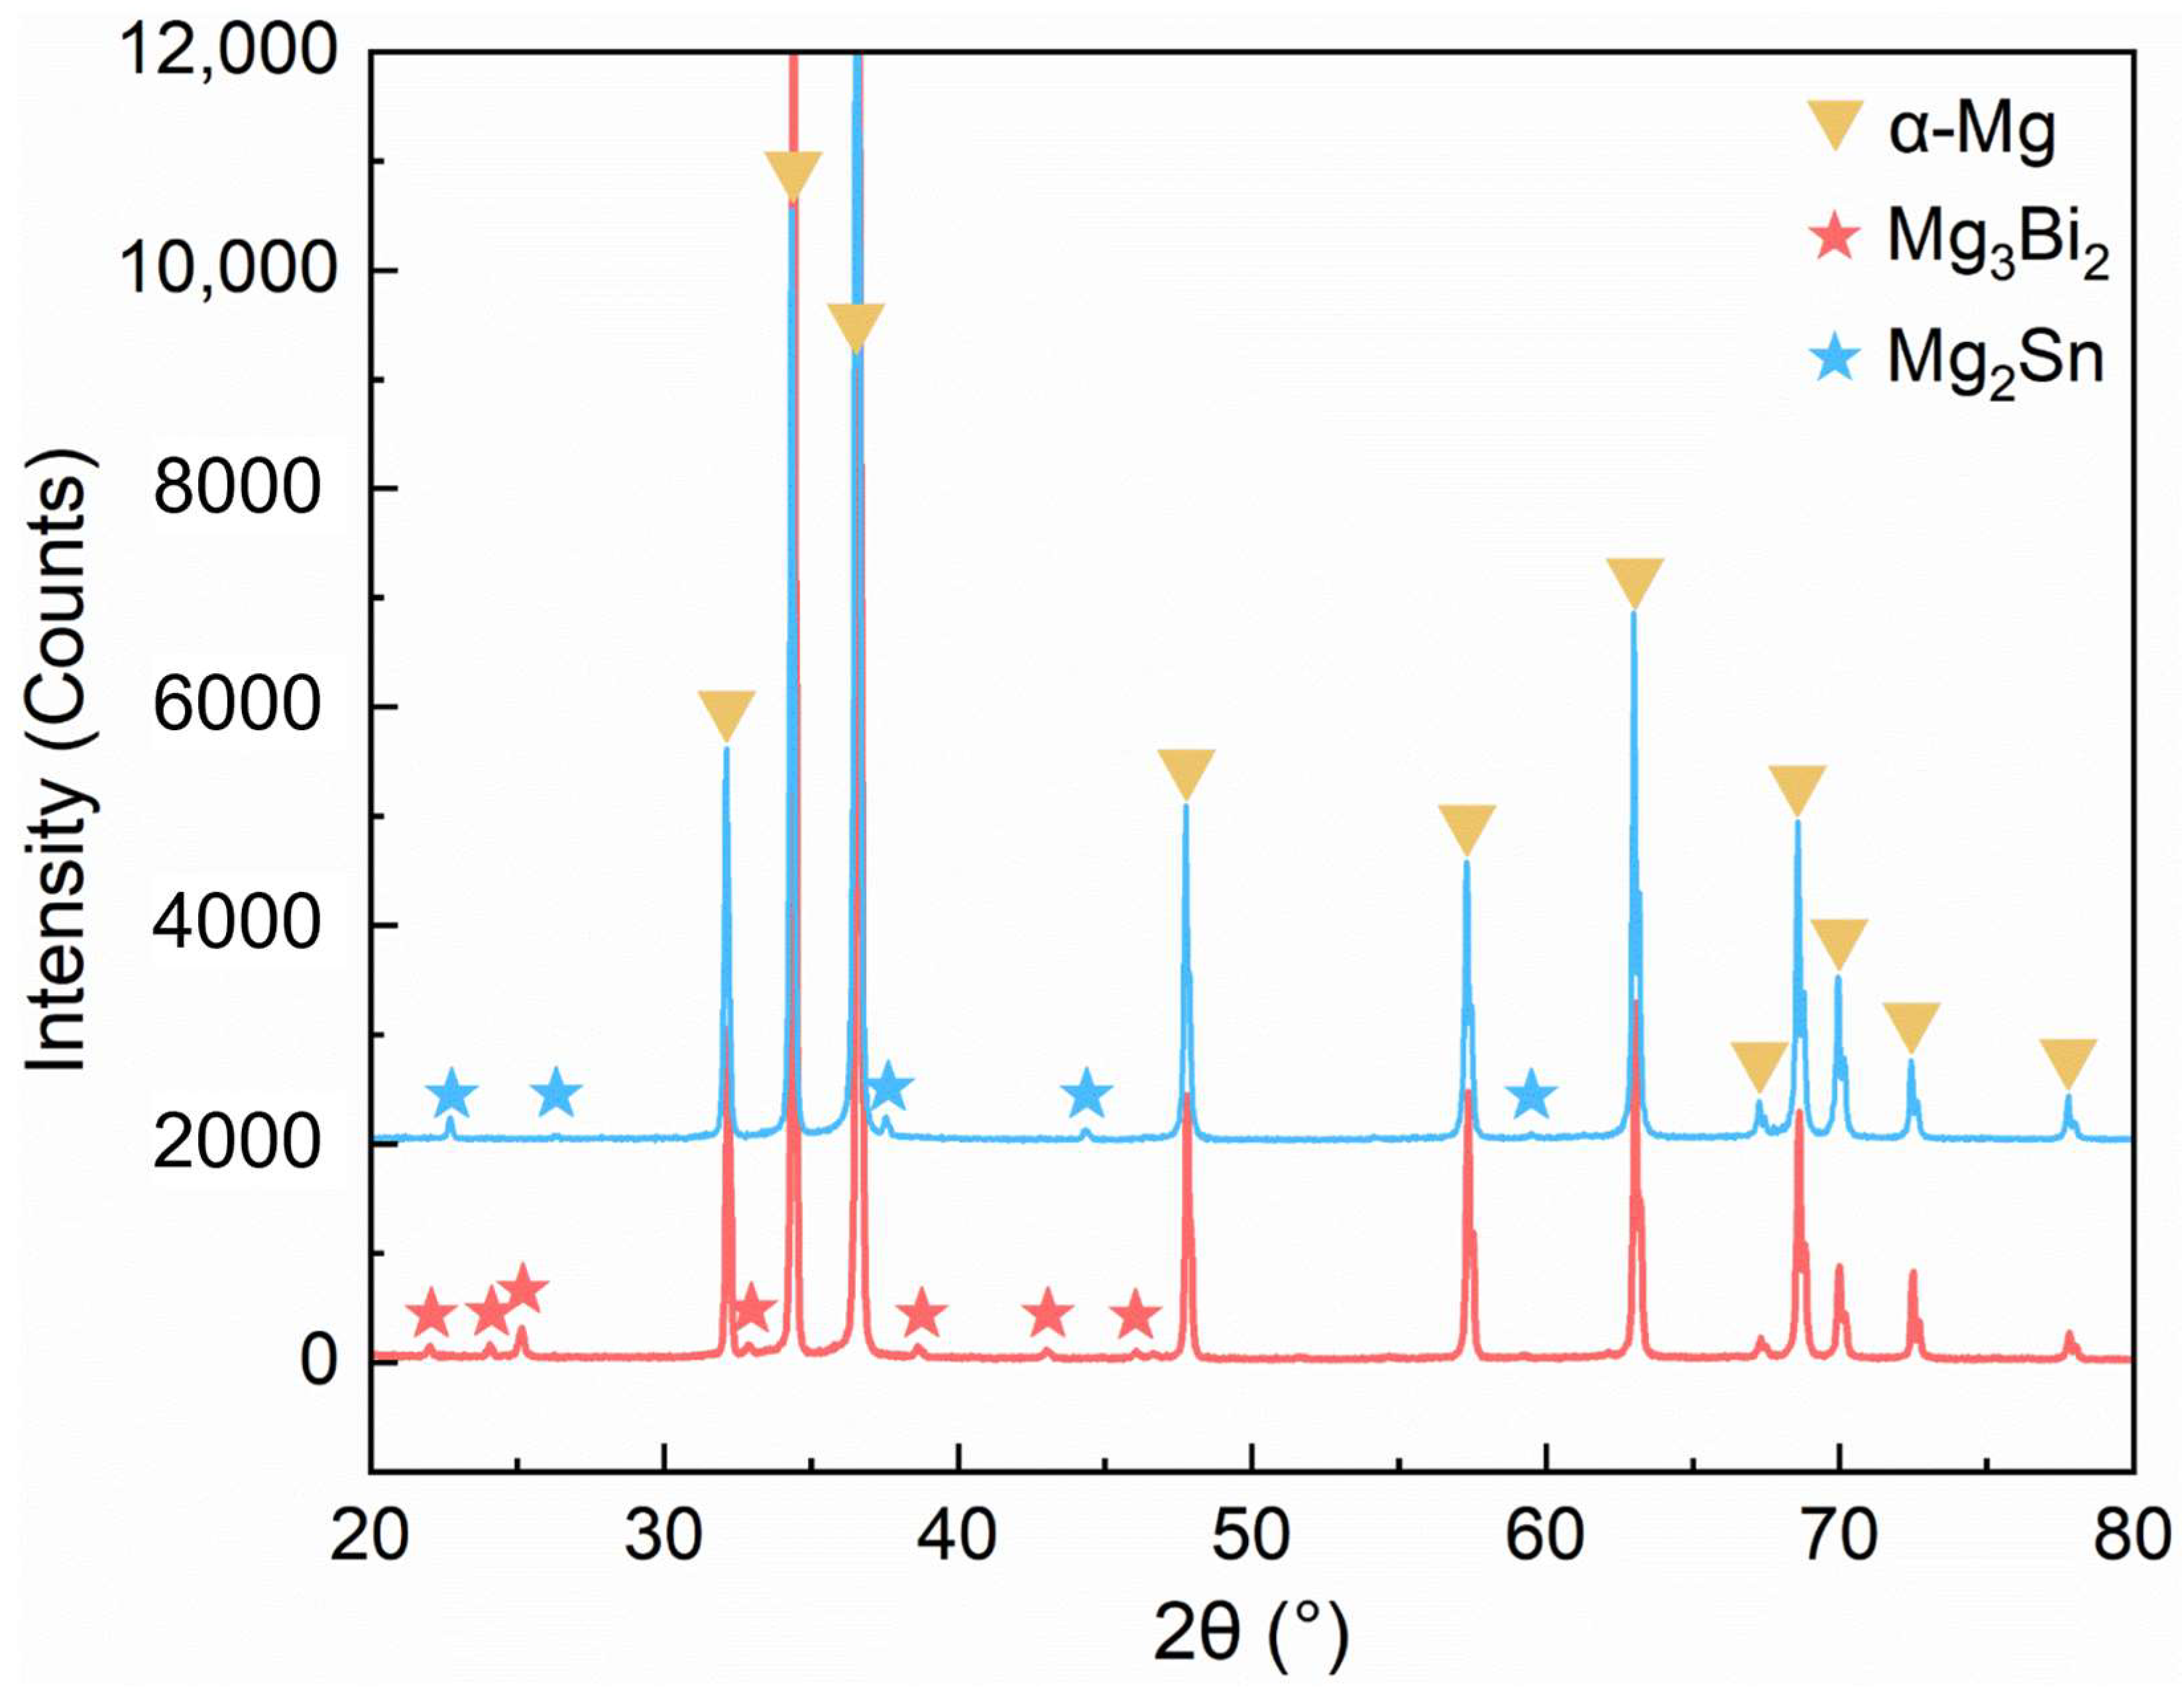
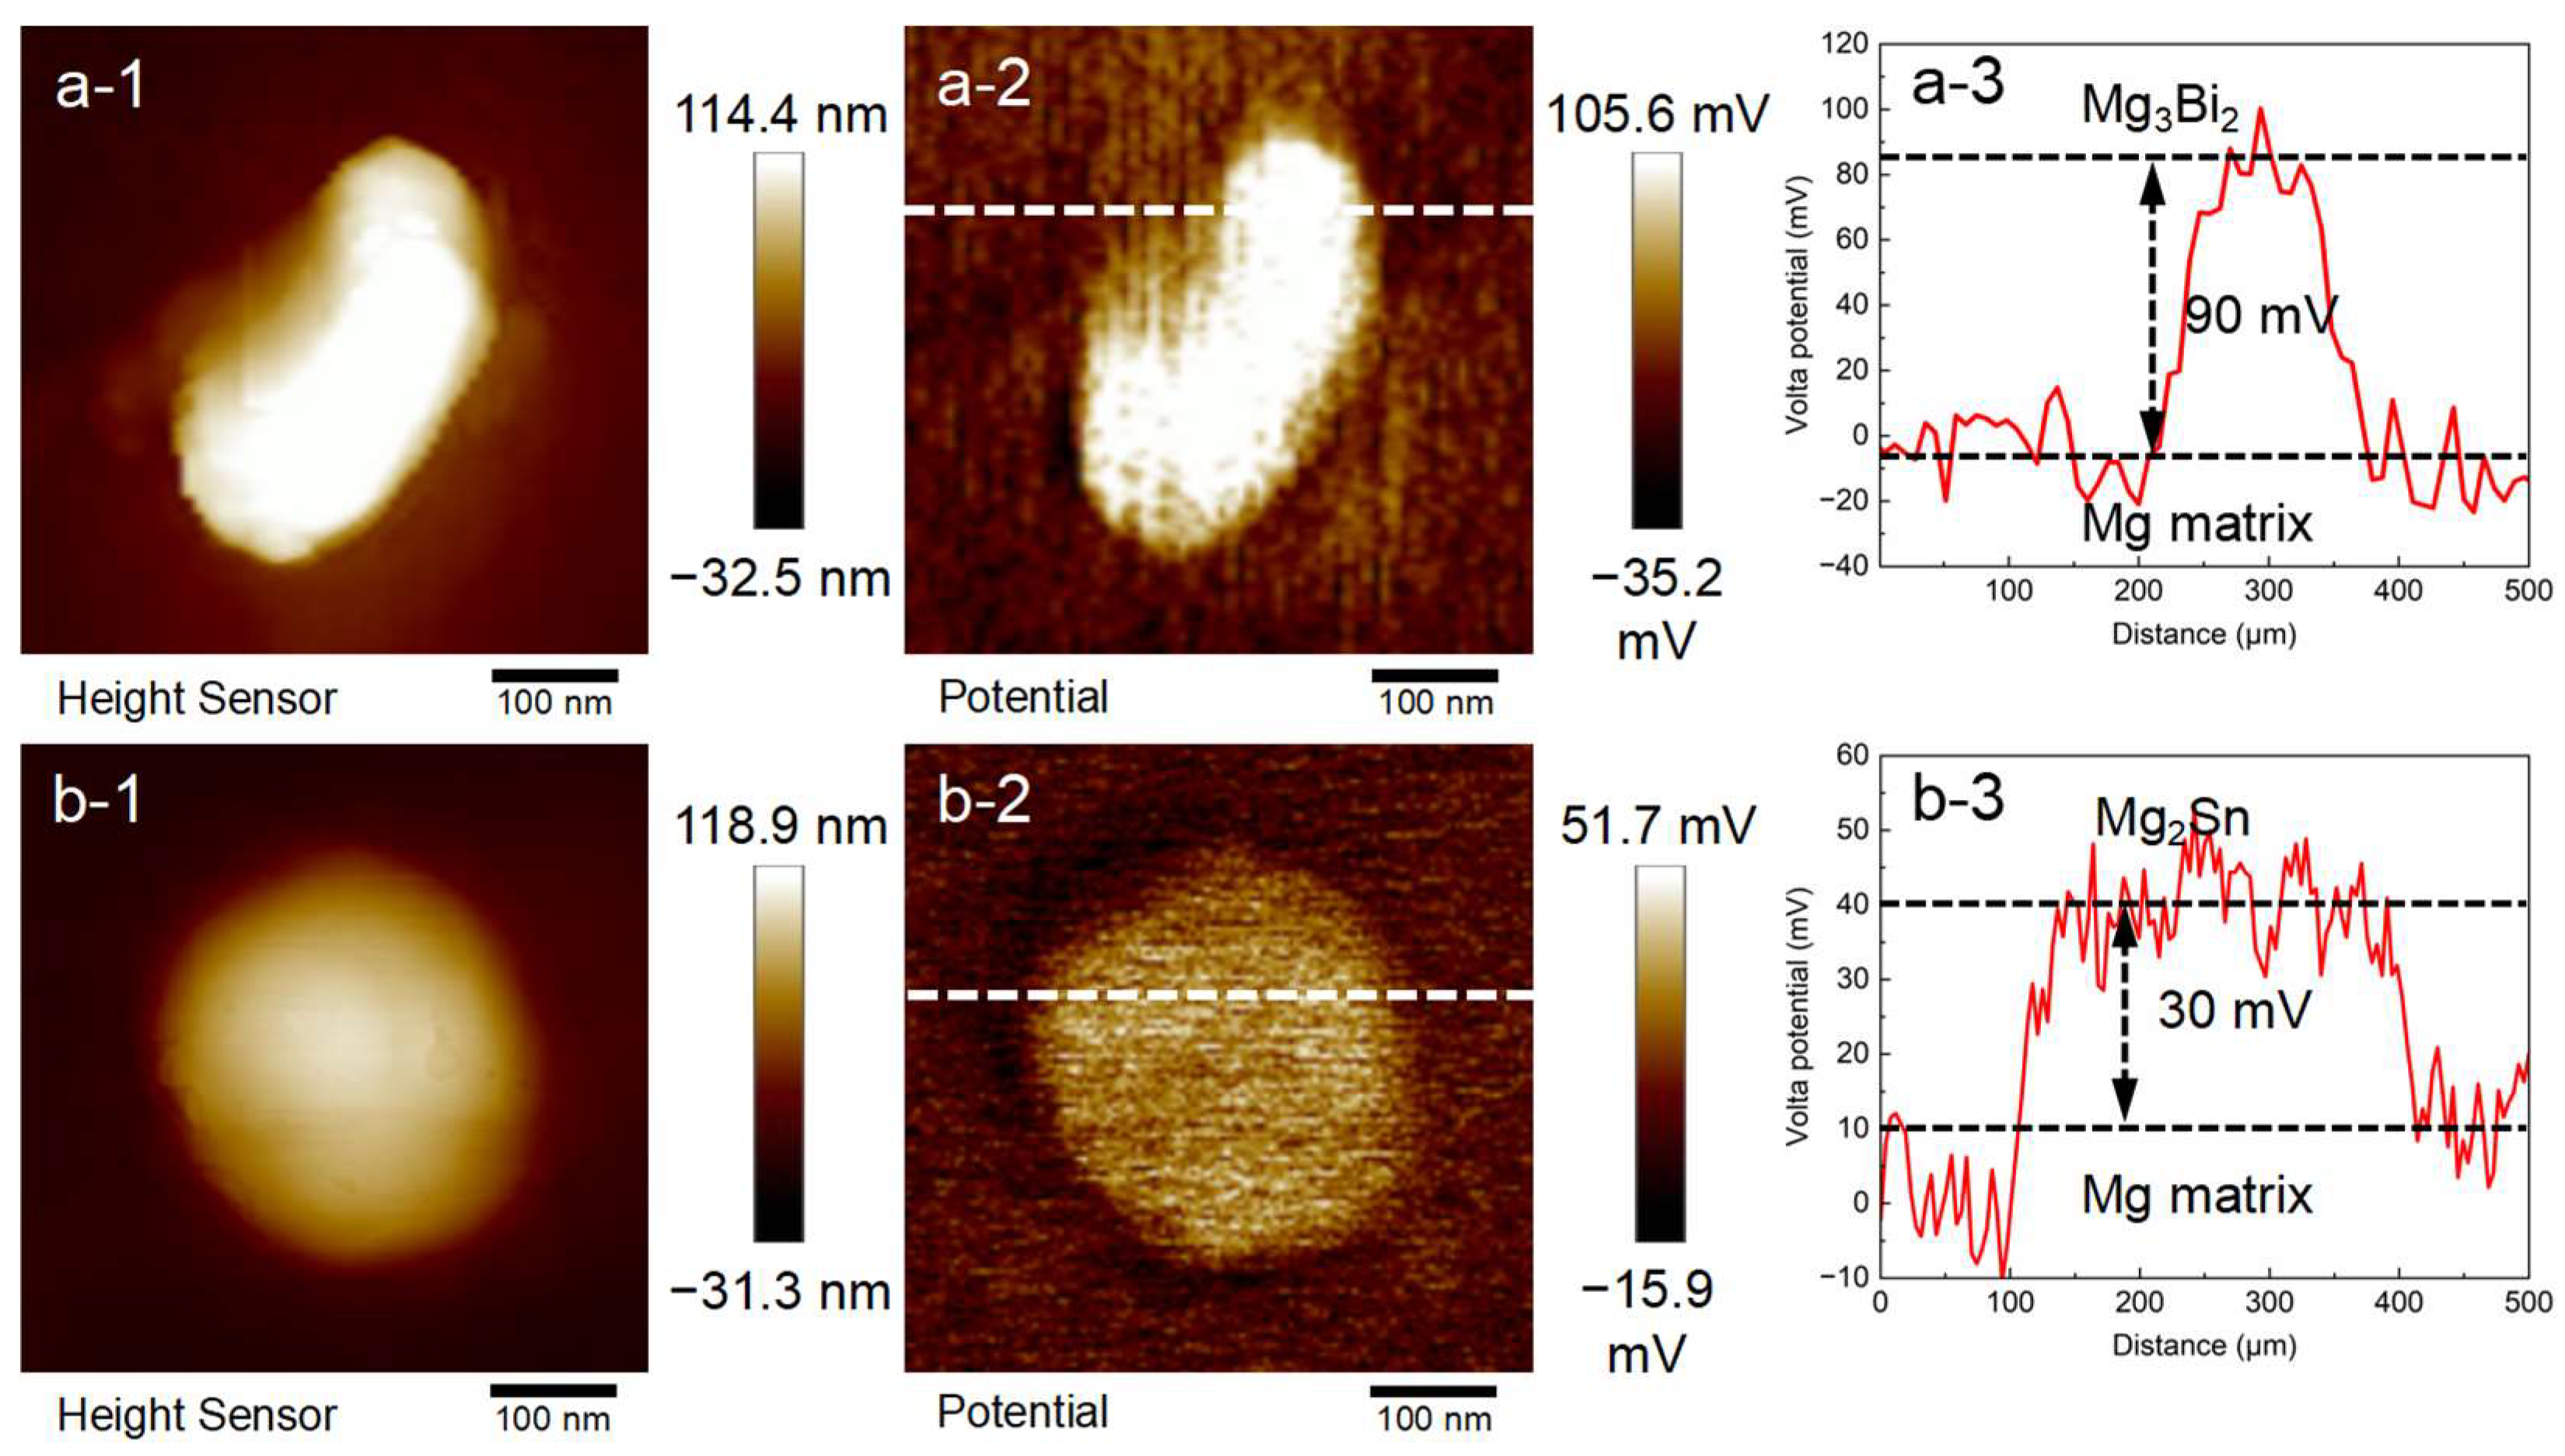
- The main secondary phase of the Mg-1Bi alloy is Mg3Bi2, and that of the Mg-1Sn alloy is Mg2Sn. Their PD values are ~90 mV and ~30 mV, respectively. The lower PD in the Mg-1Sn alloy indicates a weaker tendency of micro-galvanic corrosion, which is one of the reasons for its higher corrosion resistance.
- (3)
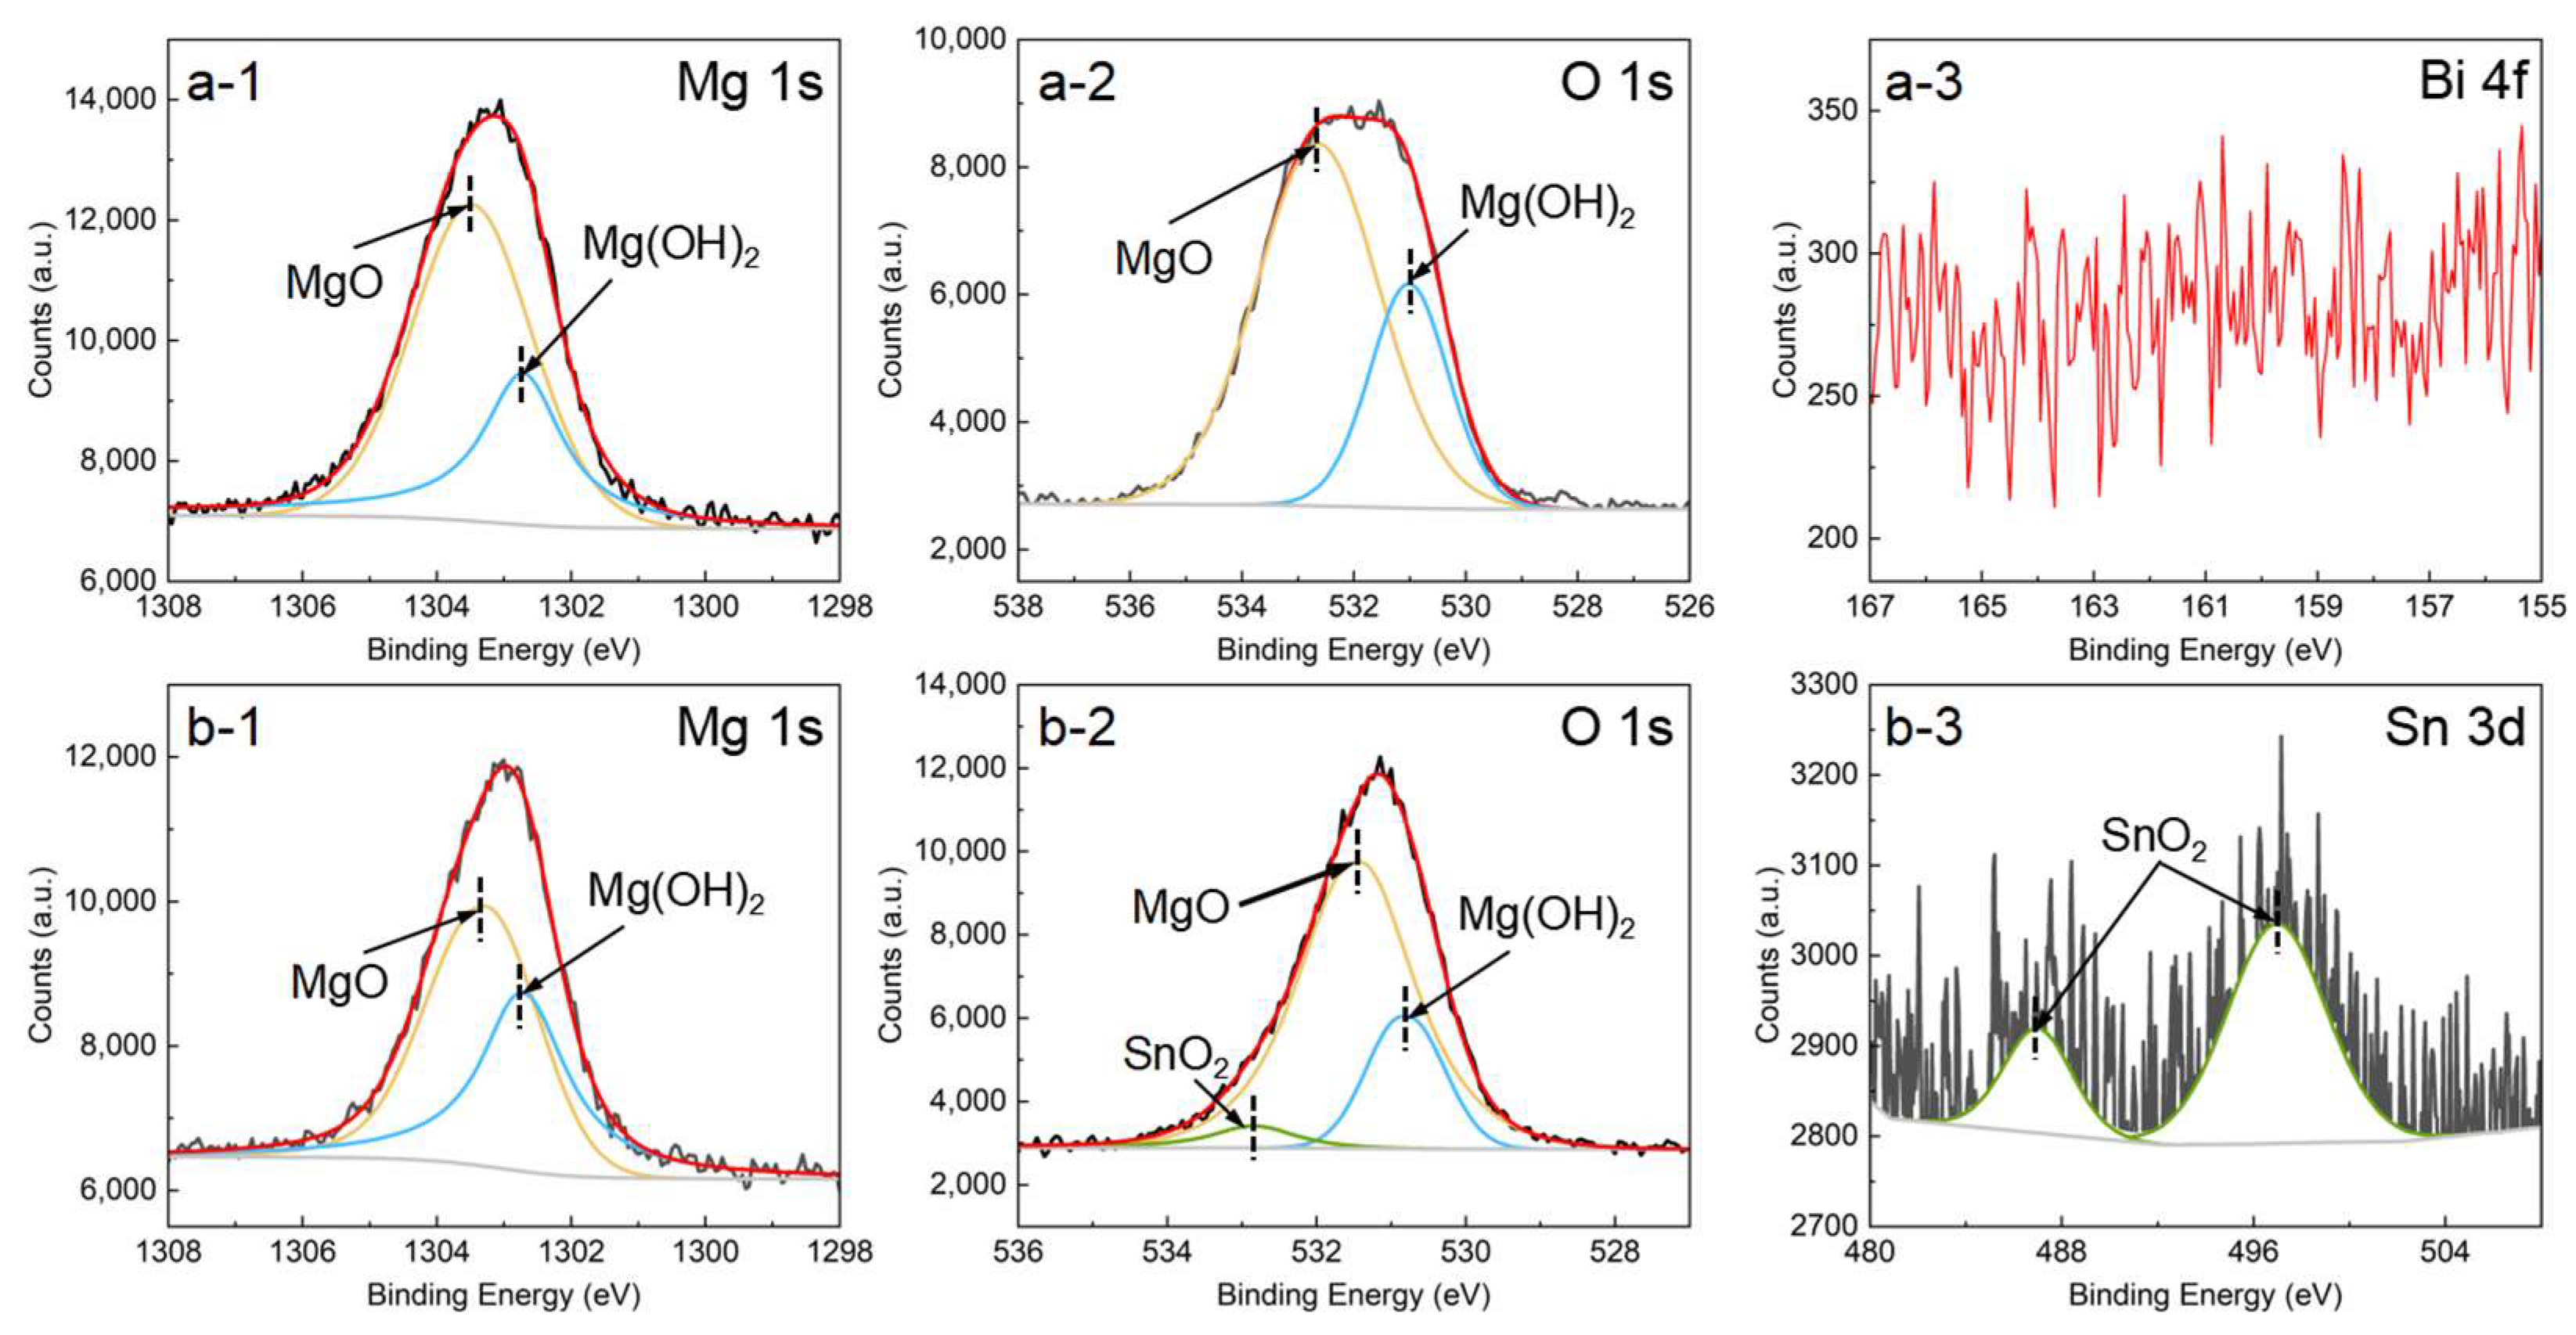
- The addition of Bi has little effect on the corrosion film, while the addition of Sn makes the corrosion film on the Mg-1Sn alloy contain SnO2. The corrosion film containing SnO2 is more compact, confirmed by the appearance of a passivation platform and larger Rf, thus improving the protective effect, which is also responsible for the lower corrosion rate of the Mg-1Sn alloy.
- (4)
- Compared with Bi-containing alloys, Sn alloying demonstrates greater potential for improving the corrosion resistance of Mg alloys, offering a promising pathway to develop high-strength and high-corrosion-resistant Mg alloys.
Author Contributions
Funding
Data Availability Statement
Conflicts of Interest
Abbreviations
| PD | Potential difference |
| RE | Rare earth |
| ICP-AES | Inductively coupled plasma atomic emission spectrometry |
| TEM | Transmission electron microscope |
| SEM | Scanning electron microscope |
| EBSD | Electron backscatter diffraction |
| XRD | X-ray diffraction |
| EDS | Energy dispersive spectrometer |
| XPS | X-ray photoelectron spectroscopy |
| SCE | Saturated calomel electrode |
| OCP | Open-circuit potential |
| EIS | Electrochemical impedance spectroscopy |
| SKPFM | Scanning Kelvin probe force microscope |
| IPF | Inverse pole figure |
| ND | Normal direction |
| KAM | Kernel average misorientation |
References
- Zhu, Q.; Li, Y.; Cao, F.; Qiu, D.; Yang, Y.; Wang, J.; Zhang, H.; Ying, T.; Ding, W.; Zeng, X. Towards development of a high-strength stainless Mg alloy with Al-assisted growth of passive film. Nat. Commun. 2022, 13, 5838. [Google Scholar] [CrossRef] [PubMed]
- Zhang, Z.; Xie, J.; Zhang, J.; Yang, X.; Wu, R. Towards designing high mechanical performance low-alloyed wrought magnesium alloys via grain boundary segregation strategy: A review. J. Magnes. Alloys 2024, 12, 1774–1791. [Google Scholar] [CrossRef]
- Li, Z.; Zhang, J.; Sun, B.; Liu, S.; Qiu, X.; Liu, L.; Zhi, G.; He, Y.; Yang, Q.; Gu, H.; et al. Achieving strength-ductility synergistic improvement in Mg alloy via non-uniform precipitate-induced nanoscale-microzone heterostructure. Mater. Res. Lett. 2025, 13, 657–665. [Google Scholar] [CrossRef]
- Wan, X.; Kang, C.; Tian, Q.; Zhou, J.; Qian, S.; Ma, C. Effect of Ca Content on Electrochemical Discharge and Corrosion Performance of Mg-6Al-1Sn Alloy Anodes for Mg-Air Batteries. Materials 2025, 18, 1562. [Google Scholar] [CrossRef]
- Zhang, H.; He, Y.; Zhang, J.; Dong, H.; Liu, S.; Jiao, X.; Wu, R.; Zhang, X. Developing high anti-corrosion dilute Mg-La-Ca-Ge alloy as promising anode for primary Mg-air batteries. J. Alloys Compd. 2024, 978, 173473. [Google Scholar] [CrossRef]
- Tok, H.; Hamzah, E.; Bakhsheshi-Rad, H. The role of bismuth on the microstructure and corrosion behavior of ternary Mg–1.2Ca–xBi alloys for biomedical applications. J. Alloys Compd. 2015, 640, 335–346. [Google Scholar] [CrossRef]
- He, Y.; Zhang, J.; Li, Z.; Sun, B.; Wang, L.; Dong, H.; Yang, Q.; Liu, S.; Wu, R.; Zhang, X.; et al. Insight into dissolution rate-regulated advanced films on Mg-Gd-Sm alloy with high anti-corrosion and discharge properties. Acta Mater. 2025, 290, 120952. [Google Scholar] [CrossRef]
- Tariq, H.; Ishtiaq, M.; Kang, H.; Chaudry, U.; Jun, T. A Critical Review on the Comparative Assessment of Rare-Earth and Non-Rare-Earth Alloying in Magnesium Alloys. Metals 2025, 15, 128. [Google Scholar] [CrossRef]
- Wang, B.; Li, M.; Li, Y.; Wang, Y.; Gao, Y.; Wang, H. Effect of Al/Mn ratio on corrosion behavior of lean Mg-Zn-Ca-Al-Mn alloy processed by twin-roll casting. Corros. Sci. 2023, 212, 110938. [Google Scholar] [CrossRef]
- Chen, W.; Gong, C.; Jiang, P.; Gan, L.; Ren, Y.; Li, C.; Chen, J.; Qiu, W. Enhancing corrosion resistance of Mg-Alloys by regulating precipitates at grain boundaries using rare earth oxides. J. Mater. Sci. Technol. 2025, 231, 256–269. [Google Scholar] [CrossRef]
- Liu, K.; Fu, J.; Liang, H.; Li, S.; Du, X.; Zhang, Y.; Du, W. Elucidating the dominant role of second phase morphology in corrosion behavior of biodegradable Mg-Zn-Mn-Ca alloys. J. Alloys Compd. 2025, 1020, 179540. [Google Scholar] [CrossRef]
- Feng, K.; Lai, T.; Chen, Y.; Yin, Z.; Wu, Z.; Yan, H.; Song, H.; Luo, C.; Hu, Z. Micro-galvanic corrosion behaviour of Mg-(7,9)Al-1Fe-xNd alloys. Trans. Nonferrous Met. Soc. China. 2024, 34, 2828–2848. [Google Scholar] [CrossRef]
- Yang, Y.; Ling, C.; Li, Y.; Peng, S.; Xie, D.; Shen, L.; Tian, Z.; Shuai, C. Microstructure development and biodegradation behavior of additively manufactured Mg-Zn-Gd alloy with LPSO structure. J. Mater. Sci. Technol. 2023, 144, 1–14. [Google Scholar] [CrossRef]
- Wang, H.; Wang, J.; Yang, Y.; Ying, T.; Xin, Z.; Hao, N.; Huang, W.; Zeng, X. Development of highly corrosion-resistant Mg-Al-Y extruded alloy via regulating the Mg17Al12 phase. Corros. Sci. 2024, 234, 112124. [Google Scholar] [CrossRef]
- Ci, W.; Deng, L.; Chen, X.; Liu, C.; Pan, F. Effect of minor Ca addition on microstructure and corrosion behavior of Mg-Y-Ca alloys. J. Mater. Res. Technol. 2023, 26, 7502–7515. [Google Scholar] [CrossRef]
- Ci, W.; Chen, X.; Sun, Y.; Dai, X.; Zhu, G.; Zhao, D.; Pan, F. Effect of Zn on mechanical and corrosion properties of Mg-Sc-Zn alloys. J. Mater. Sci. Technol. 2023, 158, 31–42. [Google Scholar] [CrossRef]
- Chen, Y.; Ying, T.; Yang, Y.; Wang, J.; Zeng, X. Regulating corrosion resistance of Mg alloys via promoting precipitation with trace Zr alloying. Corros. Sci. 2023, 216, 111106. [Google Scholar] [CrossRef]
- Majhi, J.; Mondal, A. Microstructure and impression creep characteristics of squeeze-cast AZ91 magnesium alloy containing Ca and/or Bi. Adv. Mater. Sci. Eng. 2019, 744, 691–703. [Google Scholar] [CrossRef]
- Sun, W.; Deng, Y.; Hu, Y.; Zhan, H.; Yan, K.; Shuai, S.; Guo, E.; Zheng, Z.; Zeng, G. Enhanced high-temperature strength of a Mg-4Sn-3Al-1Zn alloy with good thermal stability via Mg2Sn precipitation. J. Magnes. Alloys 2025. [Google Scholar] [CrossRef]
- Li, H.; Zhang, Z.; Xu, C.; Liu, Y.; Jiang, L.; Yin, S.; Kang, H.; Chen, Z.; Guo, E.; Wang, T. Achieving high strength via significantly enhanced precipitation strengthening in Mg-5Bi-3Al-xSn alloys. J. Alloys Compd. 2025, 1033, 181269. [Google Scholar] [CrossRef]
- Li, Y.; Li, M.; Wang, B.; Ren, M.; Wang, C.; Zha, M.; Gao, Y.; Wang, H. Effect of Sn addition on the microstructure and corrosion behavior of dilute wrought Mg-Zn-Ca series alloys. Corros. Sci. 2024, 235, 112180. [Google Scholar] [CrossRef]
- Xu, W.; Cheng, W.; Guo, Z.; Yu, H.; Wang, L.; Li, H.; Wang, H.; Wang, J.; Meng, S. Development of dilute Mg-Bi alloy sheet with good synergy of corrosion-resistance and tensile properties. J. Mater. Res. Technol.. 2023, 25, 3929–3942. [Google Scholar] [CrossRef]
- Zhao, T.; Zhang, J.; Yang, Q.; Liu, S.; He, Y.; Xu, Z.; Li, Z.; Dong, H.; Wu, R.; Zhang, X.; et al. Synergistically enhancing corrosion resistance and discharge performance in Mg-Al-Mn-Ca alloy by adding trace Sm. J. Alloys Compd. 2025, 1021, 179633. [Google Scholar] [CrossRef]
- Xu, G.; Cheng, W.; Luo, Y.; Yu, H.; Wang, L.; Li, H.; Wang, H.; Wang, J. Elucidating the role of precipitated phase particles in modifying creep properties of as-cast Mg-Bi/Sn-based alloys. J. Magnes. Alloys 2024, 12, 4682–4693. [Google Scholar] [CrossRef]
- Chen, W.; Liu, Y.; Ma, S.; Wang, L.; Wang, H.; Niu, X. Microstructural Characteristics, Mechanical and Corrosion Properties of an Extruded Low-Alloyed Mg-Bi-Al-Zn Alloy. Front. Mater. 2020, 7, 55. [Google Scholar] [CrossRef]
- Luo, Y.; Cheng, W.; Li, H.; Yu, H.; Wang, H.; Niu, X.; Wang, L.; You, Z.; Hou, H. Achieving high strength-ductility synergy in a novel Mg-Bi-Sn-Mn alloy with bimodal microstructure by hot extrusion. Mater. Sci. Eng. A. 2022, 834, 142623. [Google Scholar] [CrossRef]
- Zhou, Y.; Xue, H.; Zhang, J.; Lan, S.; Wang, J.; She, J.; Zhang, D.; Pan, F. Achieving strength-ductility synergy of Mg–Al–Ca–Zn alloy with a lamellar heterogeneous structure. J. Mater. Res. Technol. 2025, 36, 2353–2366. [Google Scholar] [CrossRef]
- Chang, F.; Song, Y.; Dong, K.; Han, E. Study on the synergistic effect of second phases and product films to significantly improve the corrosion resistance of Mg-Gd-Y-Nd alloy. Corros. Sci. 2024, 237, 112304. [Google Scholar] [CrossRef]
- Hua, Z.; Yin, Z.; Yin, Z.; Wang, K.; Liu, Q.; Sun, P.; Yan, H.; Song, H.; Luo, C.; Guan, H.; et al. Corrosion behavior characterization of as extruded Mg-8Li-3Al alloy with minor alloying elements (Gd, Sn and Cu) by scanning Kelvin probe force microscopy. Corros. Sci. 2020, 176, 108923. [Google Scholar] [CrossRef]
- Dong, Q.; Jiang, J.; Zhang, J.; Hu, Z.; Zhang, X. Clarifying stress corrosion cracking behavior of biomedical Mg-Gd-Zn-Zr alloy. J. Magnes. Alloys 2024. [Google Scholar] [CrossRef]
- Jin, Y.; Lyu, B.; Yu, Q.; Chen, M. Optimizing the Mechanical Properties and Corrosion Performance of Low-Alloyed Mg-Zn-Ca Alloy by Regulating Zn/Ca Atomic Ratios. Solids 2025, 6, 17. [Google Scholar] [CrossRef]
- Xu, Z.; Zhang, J.; He, Y.; Yang, Q.; Liu, S.; Zhao, T.; Dong, H.; Wu, R.-Z.; Zhang, X.; Qiu, X. Revealing anti-corrosion mechanism of low-alloyed Mg-Gd-Zn-Zr alloy with ultra-low corrosion rate. Corros. Sci. 2025, 251, 112931. [Google Scholar] [CrossRef]
- Ci, W.; Chen, X.; Dai, X.; Liu, C.; Ma, Y.; Zhao, D.; Pan, F.S. Achieving ultra-high corrosion-resistant Mg-Zn-Sc alloys by forming Sc-assisted protective corrosion product film. J. Mater. Sci. Technol. 2024, 181, 138–151. [Google Scholar] [CrossRef]
- Zemková, M.; Minárik, P.; Dittricha, J.; Bohlen, J.; Robert, K. Individual effect of Y and Nd on the microstructure formation of Mg-Y-Nd alloys processed by severe plastic deformation and their effect on the subsequent mechanical and corrosion properties. J. Magnes. Alloys 2023, 11, 509–521. [Google Scholar] [CrossRef]
- Luo, Q.; Guo, Y.; Liu, B.; Feng, Y.; Zhang, J.; Li, Q.; Chou, K. Thermodynamics and kinetics of phase transformation in rare earth-magnesium alloys: A critical review. J. Mater. Sci. Technol. 2020, 44, 171–190. [Google Scholar] [CrossRef]
- Liu, S.; Zhang, K.; Wang, C.; Wang, D.; Li, M.; Yang, Y.; Guan, K.; Volochko, A.; Wang, H. Dramatic enhancement of the corrosion resistance of dilute Mg-Al-Mn-Ca alloy through Gd alloying. Corros. Sci. 2024, 238, 112351. [Google Scholar] [CrossRef]
- Li, M.; Wang, C.; Li, Y.; Wang, D.; Zha, M.; Gao, Y.; Wang, H. Tailoring the microstructure and enhancing the corrosion resistance of extruded dilute Mg-0.6Al-0.5Mn-0.25Ca alloy by adding trace Ce. Corros. Sci. 2022, 207, 110605. [Google Scholar] [CrossRef]
- Atrens, A.; Shi, Z.; Mehreen, S.; Johnston, S.; Song, G.; Chen, X.; Pan, F. Review of Mg alloy corrosion rates. J. Magnes. Alloys 2020, 8, 989–998. [Google Scholar] [CrossRef]
- Jaffery, S.; Sabri, M.; Rozali, S.; Hasan, S.; Mahdavifard, M.; AL-Zubiady, D.; Ravuri, B. Oxidation and wetting characteristics of lead-free Sn-0.7Cu solder alloys with the addition of Fe and Bi. Microelectron. Reliab. 2022, 139, 114802. [Google Scholar] [CrossRef]
- Feng, Y.; Yi, J.; Luo, Q.; Liu, B.; Yang, X.; Li, Q. The correlation between grain structures and the corrosion behaviors of as-extruded Mg-Sm-Zn-Zr alloys. Corros. Sci. 2024, 239, 112397. [Google Scholar] [CrossRef]
- Feng, B.; Zhu, K.; Shang, X.; Chen, Y.; Wang, H.; Yan, C.; Yang, Y.; Wang, J.; Ying, T.; Liu, Y.; et al. Improving the corrosion and mechanical properties of Mg-8Gd-3Y-0.4Zr alloy synergistically via regulating micro-galvanic corrosion and dislocation density. Corros. Sci. 2024, 237, 112275. [Google Scholar] [CrossRef]


| Alloys | Actual Compositions (wt%) | |||
|---|---|---|---|---|
| Mg | Bi | Sn | Fe | |
| Mg-1Bi | Bal. | 0.97 ± 0.07 | - | 0.015 ± 0.002 |
| Mg-1Sn | Bal. | - | 1.05 ± 0.06 | 0.015 ± 0.002 |
| Alloys | Ecorr (V vs. SCE) | icorr (µA cm−2) | βc (−mV decade−1) | Eb (V vs. SCE) | Eb − Ecorr (mV) |
|---|---|---|---|---|---|
| Mg-1Bi | −1.44 | 105.90 | 207.51 | - | - |
| Mg-1Sn | −1.48 | 44.42 | 289.16 | −1.40 | 76 |
| Alloys | Rs (ohm cm2) | Rf (ohm cm2) | CPEf | Rct (ohm cm2) | CPEdl | L (H cm−2) | RL (ohm cm2) | ||
|---|---|---|---|---|---|---|---|---|---|
| Y0, f* | nf | Y0, dl* (µF cm−2 sn−1) | ndl | ||||||
| Mg-1Bi | 22.15 | 11.55 | 8.93 | 0.9993 | 123.3 | 38.56 | 0.9819 | 544.5 | 21.91 |
| Mg-1Sn | 22.57 | 1373.00 | 13.06 | 0.9421 | 1500.0 | 1129.00 | 0.5172 | 21430.0 | 714.61 |
Disclaimer/Publisher’s Note: The statements, opinions and data contained in all publications are solely those of the individual author(s) and contributor(s) and not of MDPI and/or the editor(s). MDPI and/or the editor(s) disclaim responsibility for any injury to people or property resulting from any ideas, methods, instructions or products referred to in the content. |
© 2025 by the authors. Licensee MDPI, Basel, Switzerland. This article is an open access article distributed under the terms and conditions of the Creative Commons Attribution (CC BY) license (https://creativecommons.org/licenses/by/4.0/).
Share and Cite
Dong, H.; Zhao, Y.; He, Y.; Liu, S.; Zhang, J. Corrosion Behavior and Mechanism of Mg-1Bi and Mg-1Sn Extruded Alloys. Metals 2025, 15, 871. https://doi.org/10.3390/met15080871
Dong H, Zhao Y, He Y, Liu S, Zhang J. Corrosion Behavior and Mechanism of Mg-1Bi and Mg-1Sn Extruded Alloys. Metals. 2025; 15(8):871. https://doi.org/10.3390/met15080871
Chicago/Turabian StyleDong, Hao, Yongqiang Zhao, Yuying He, Shujuan Liu, and Jinghuai Zhang. 2025. "Corrosion Behavior and Mechanism of Mg-1Bi and Mg-1Sn Extruded Alloys" Metals 15, no. 8: 871. https://doi.org/10.3390/met15080871
APA StyleDong, H., Zhao, Y., He, Y., Liu, S., & Zhang, J. (2025). Corrosion Behavior and Mechanism of Mg-1Bi and Mg-1Sn Extruded Alloys. Metals, 15(8), 871. https://doi.org/10.3390/met15080871