

Microstructure, Mechanical Properties, and Magnetic Properties of 430 Stainless Steel: Effect of Critical Cold Working Rate and Heat Treatment Atmosphere


Abstract

1. Introduction
2. Experimental Procedures
3. Results and Discussion
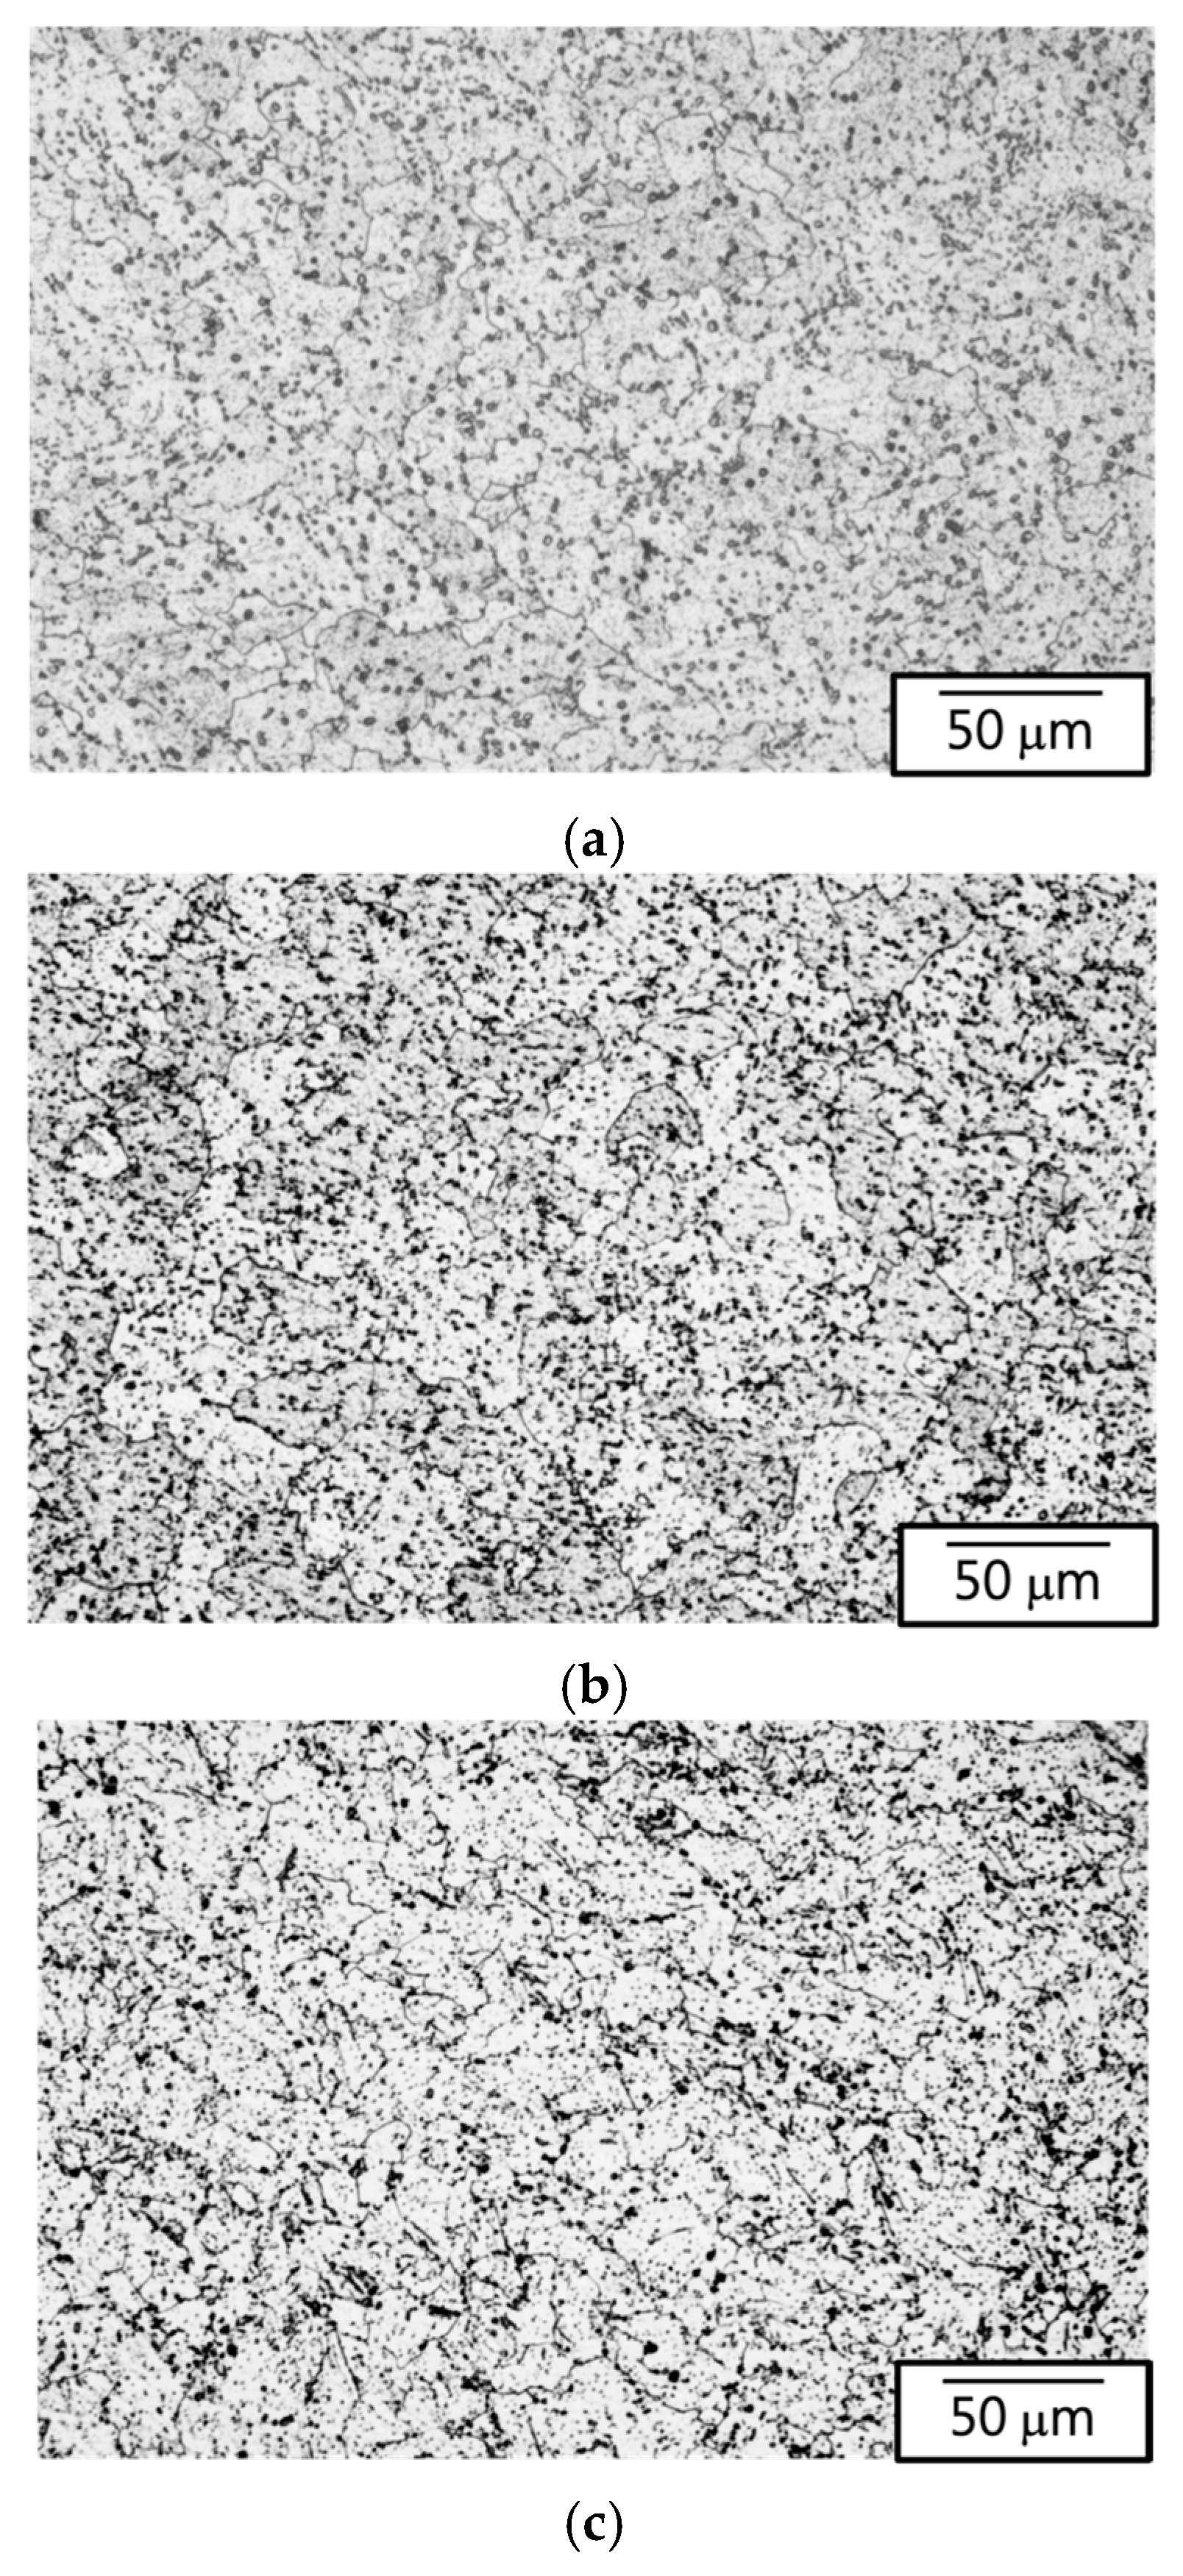
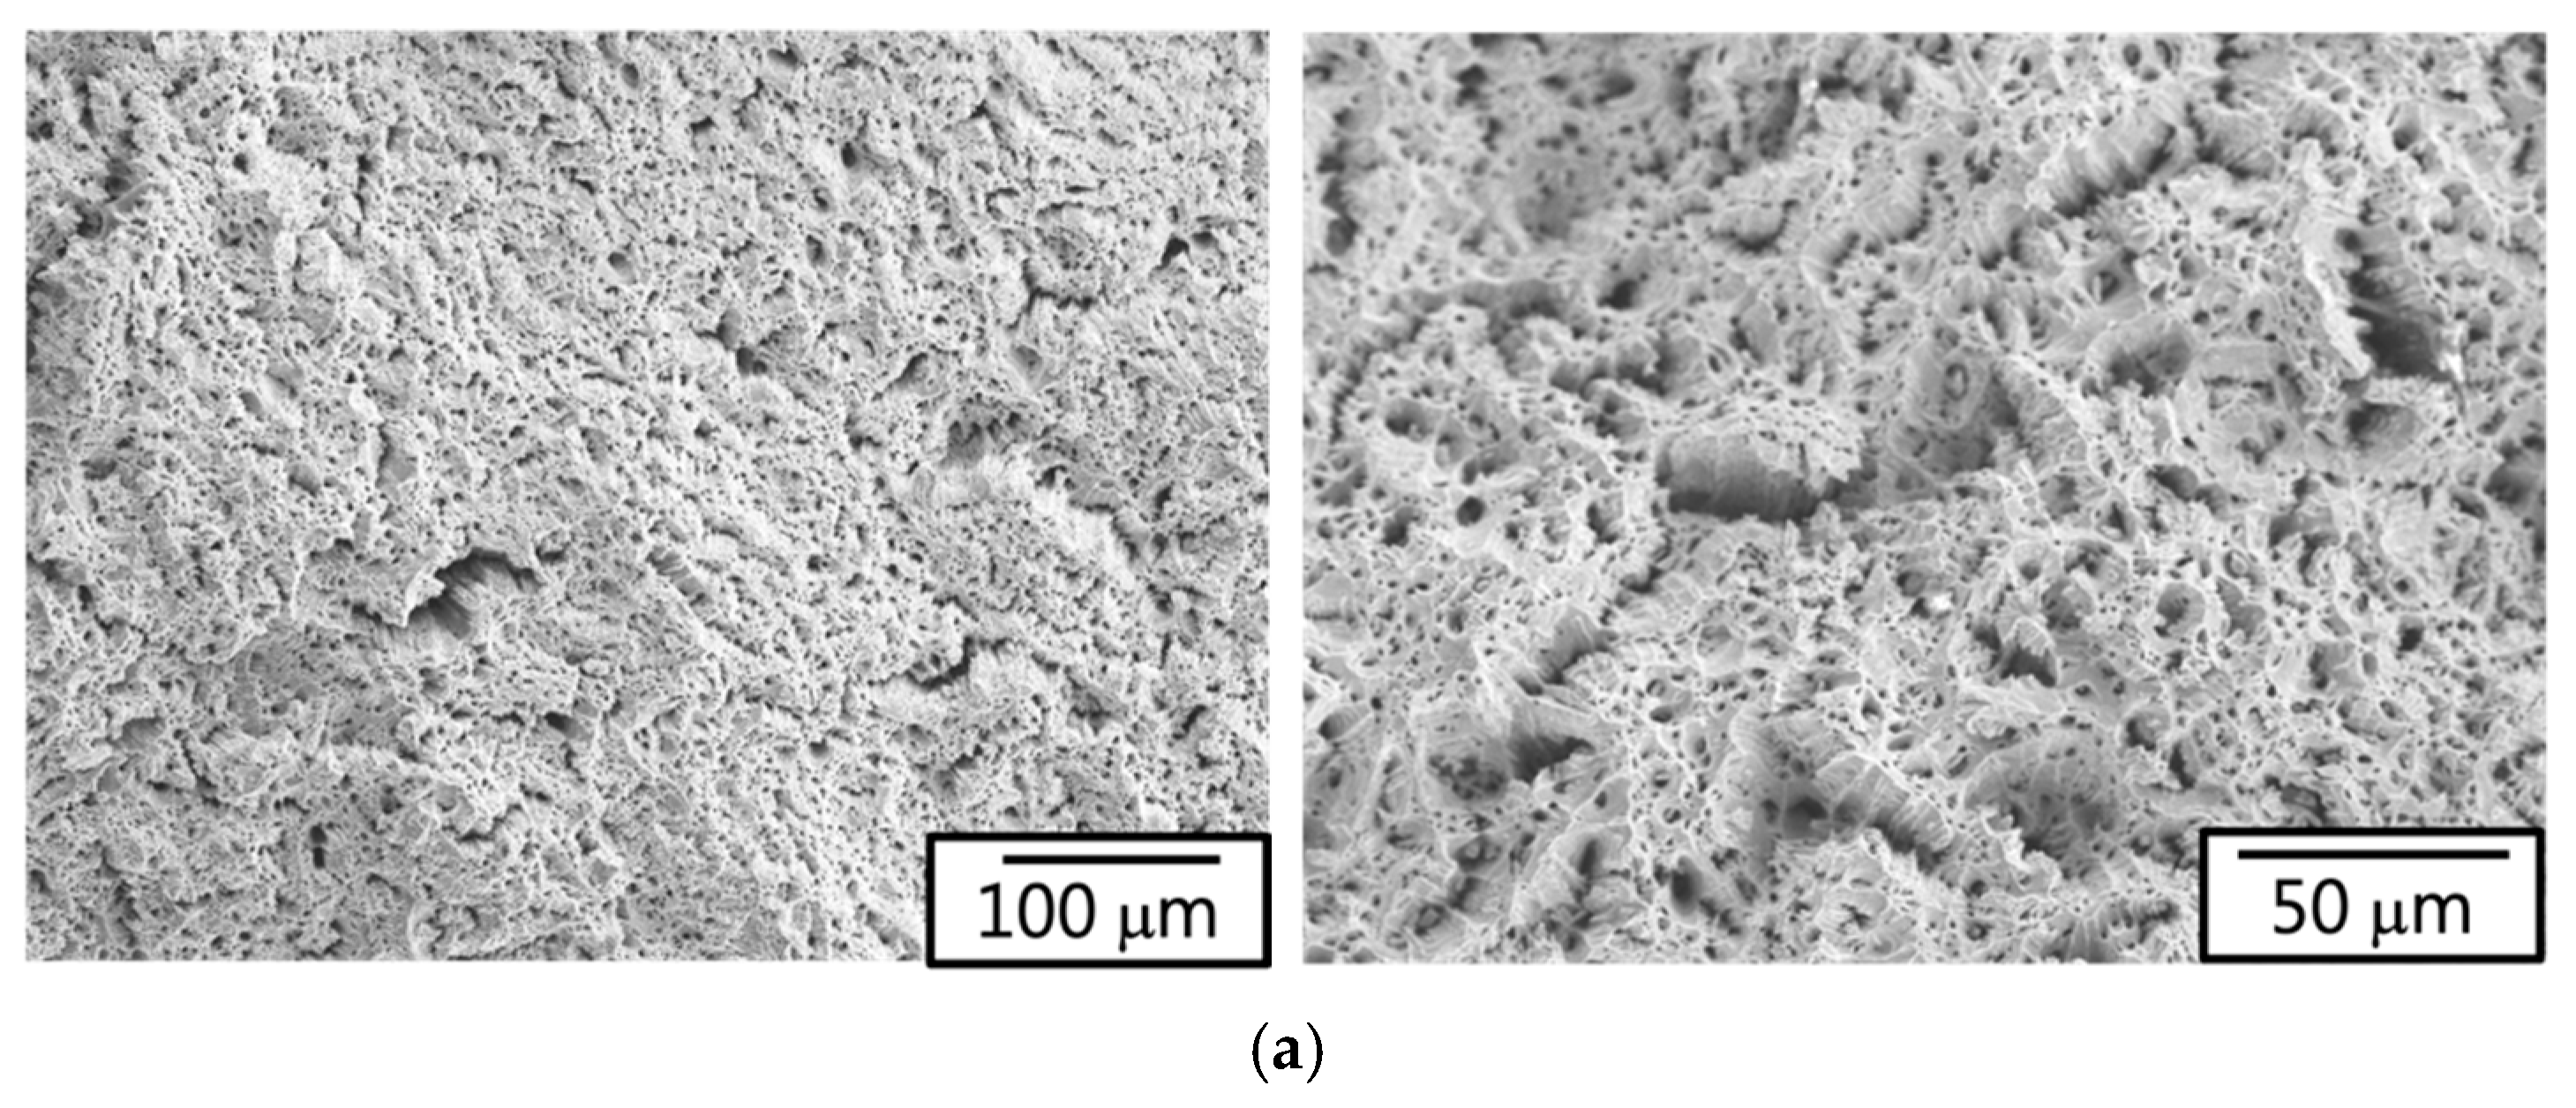
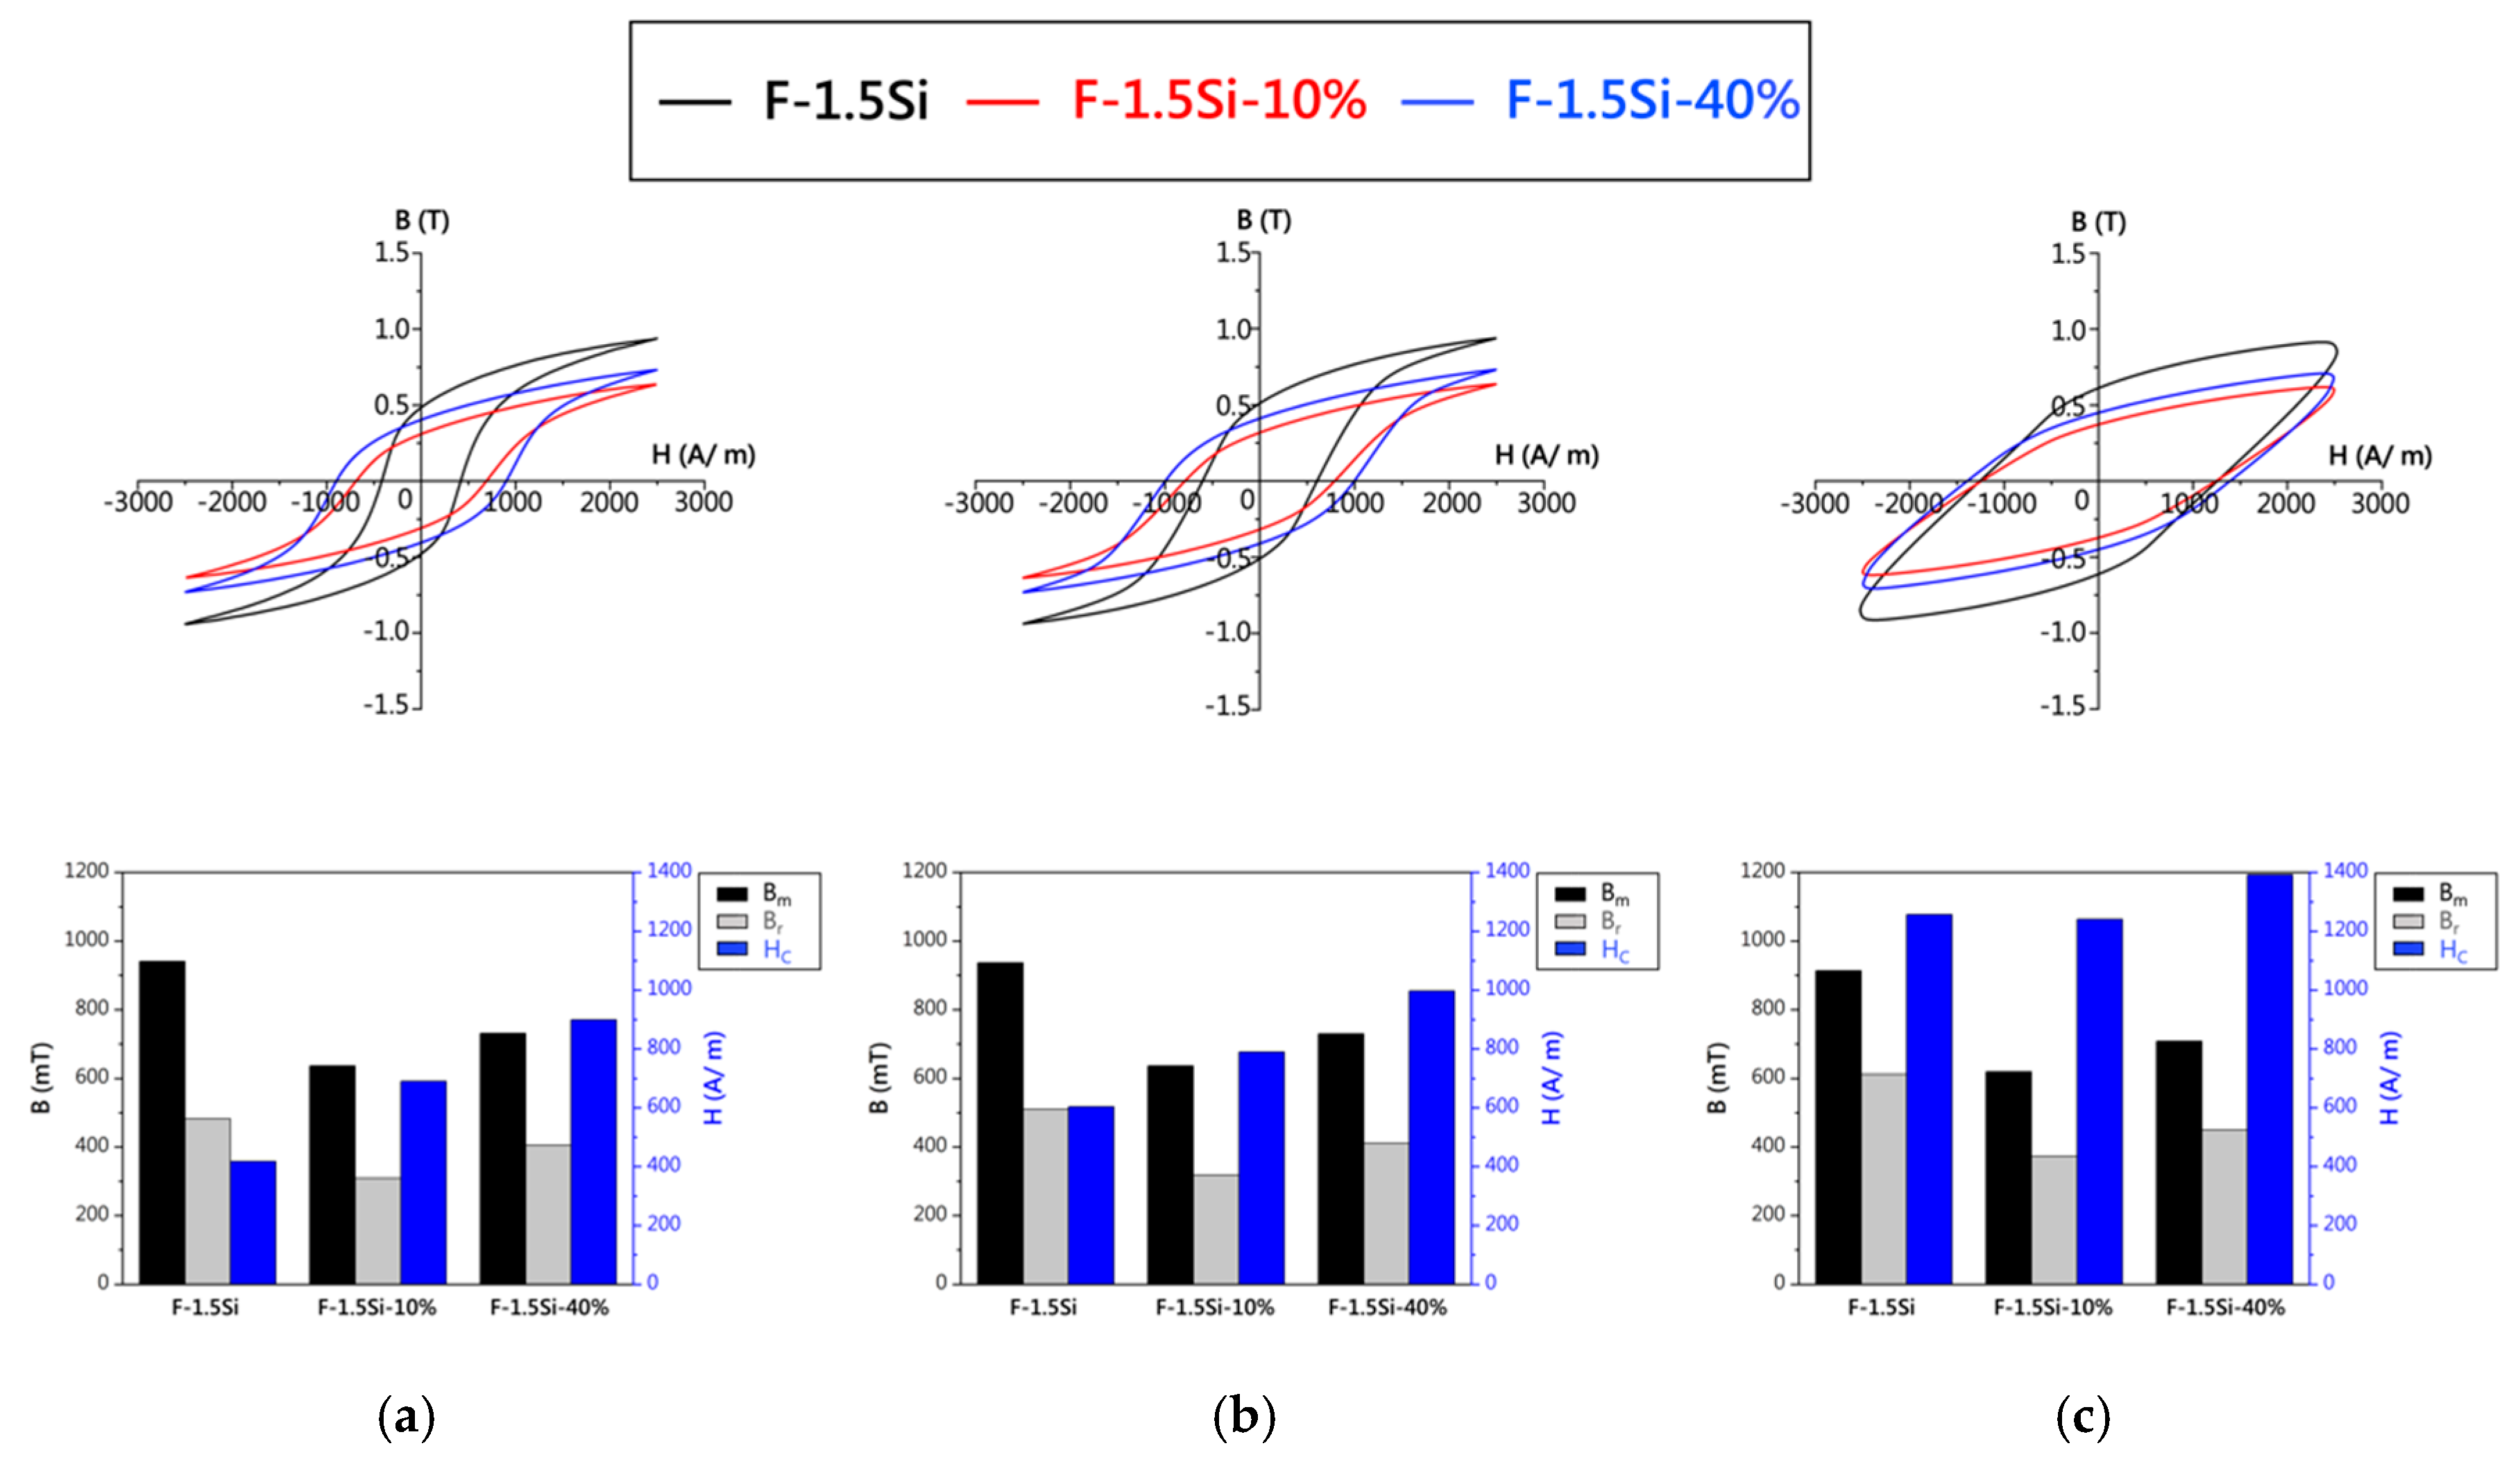
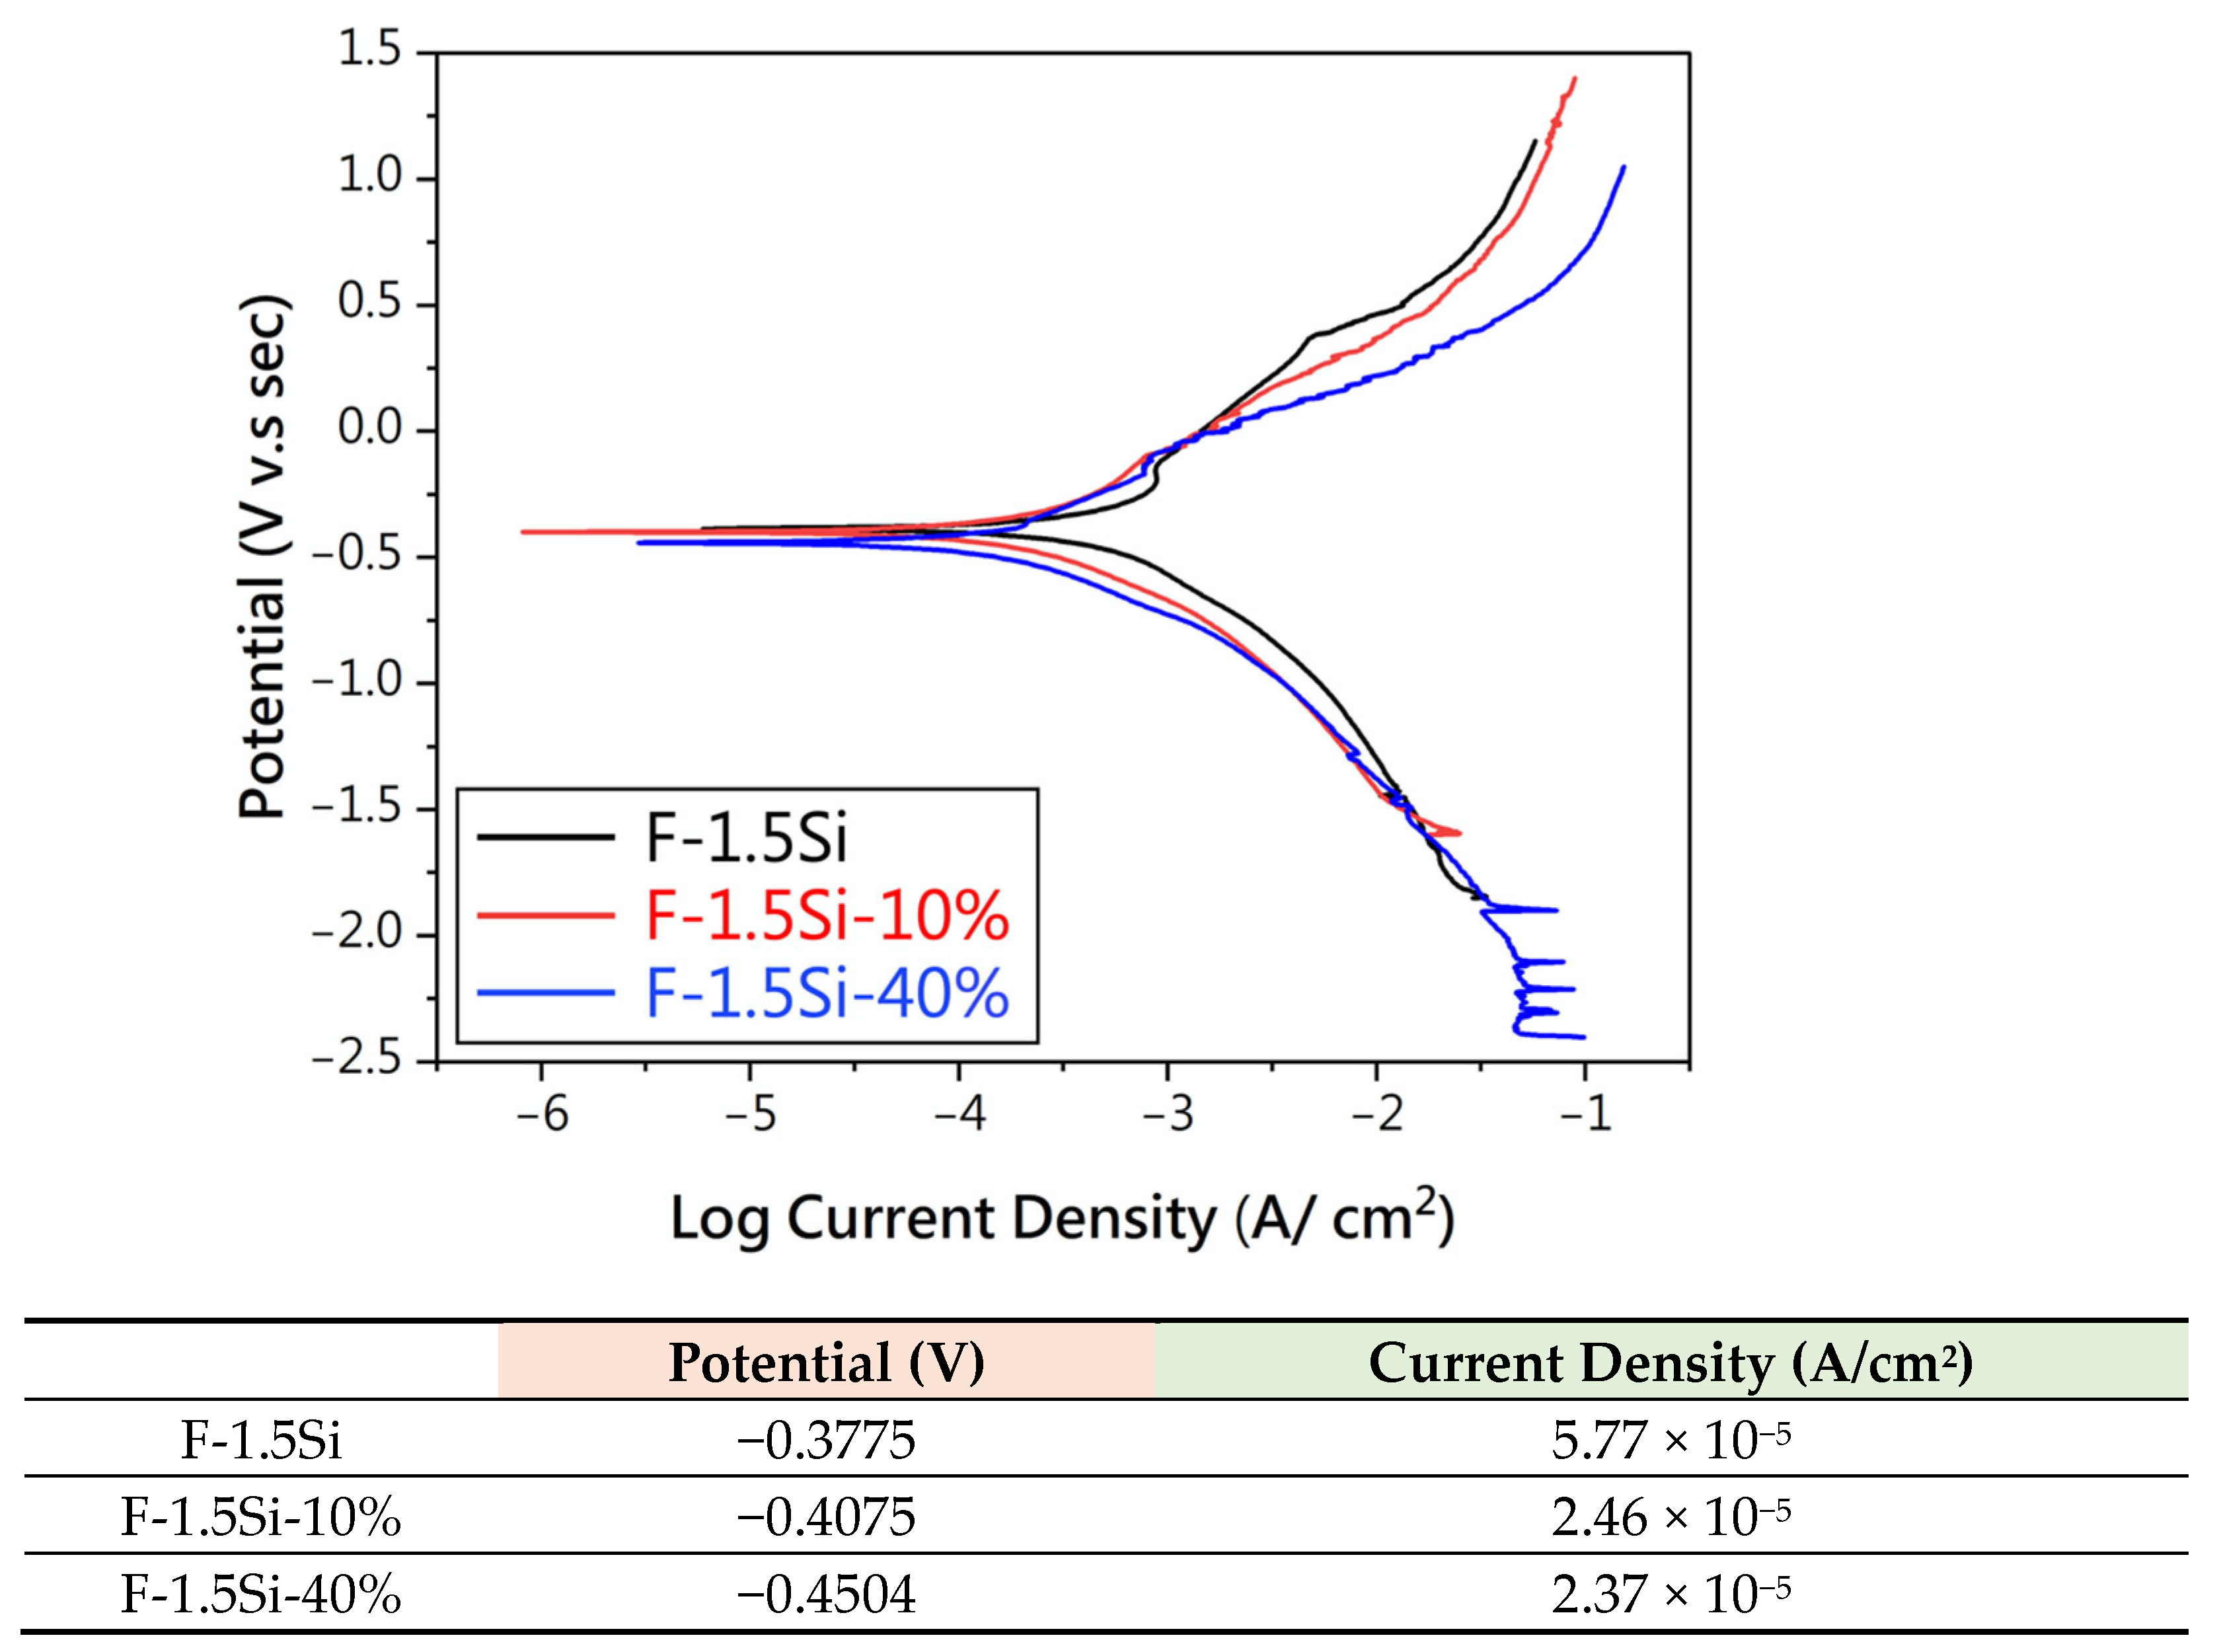
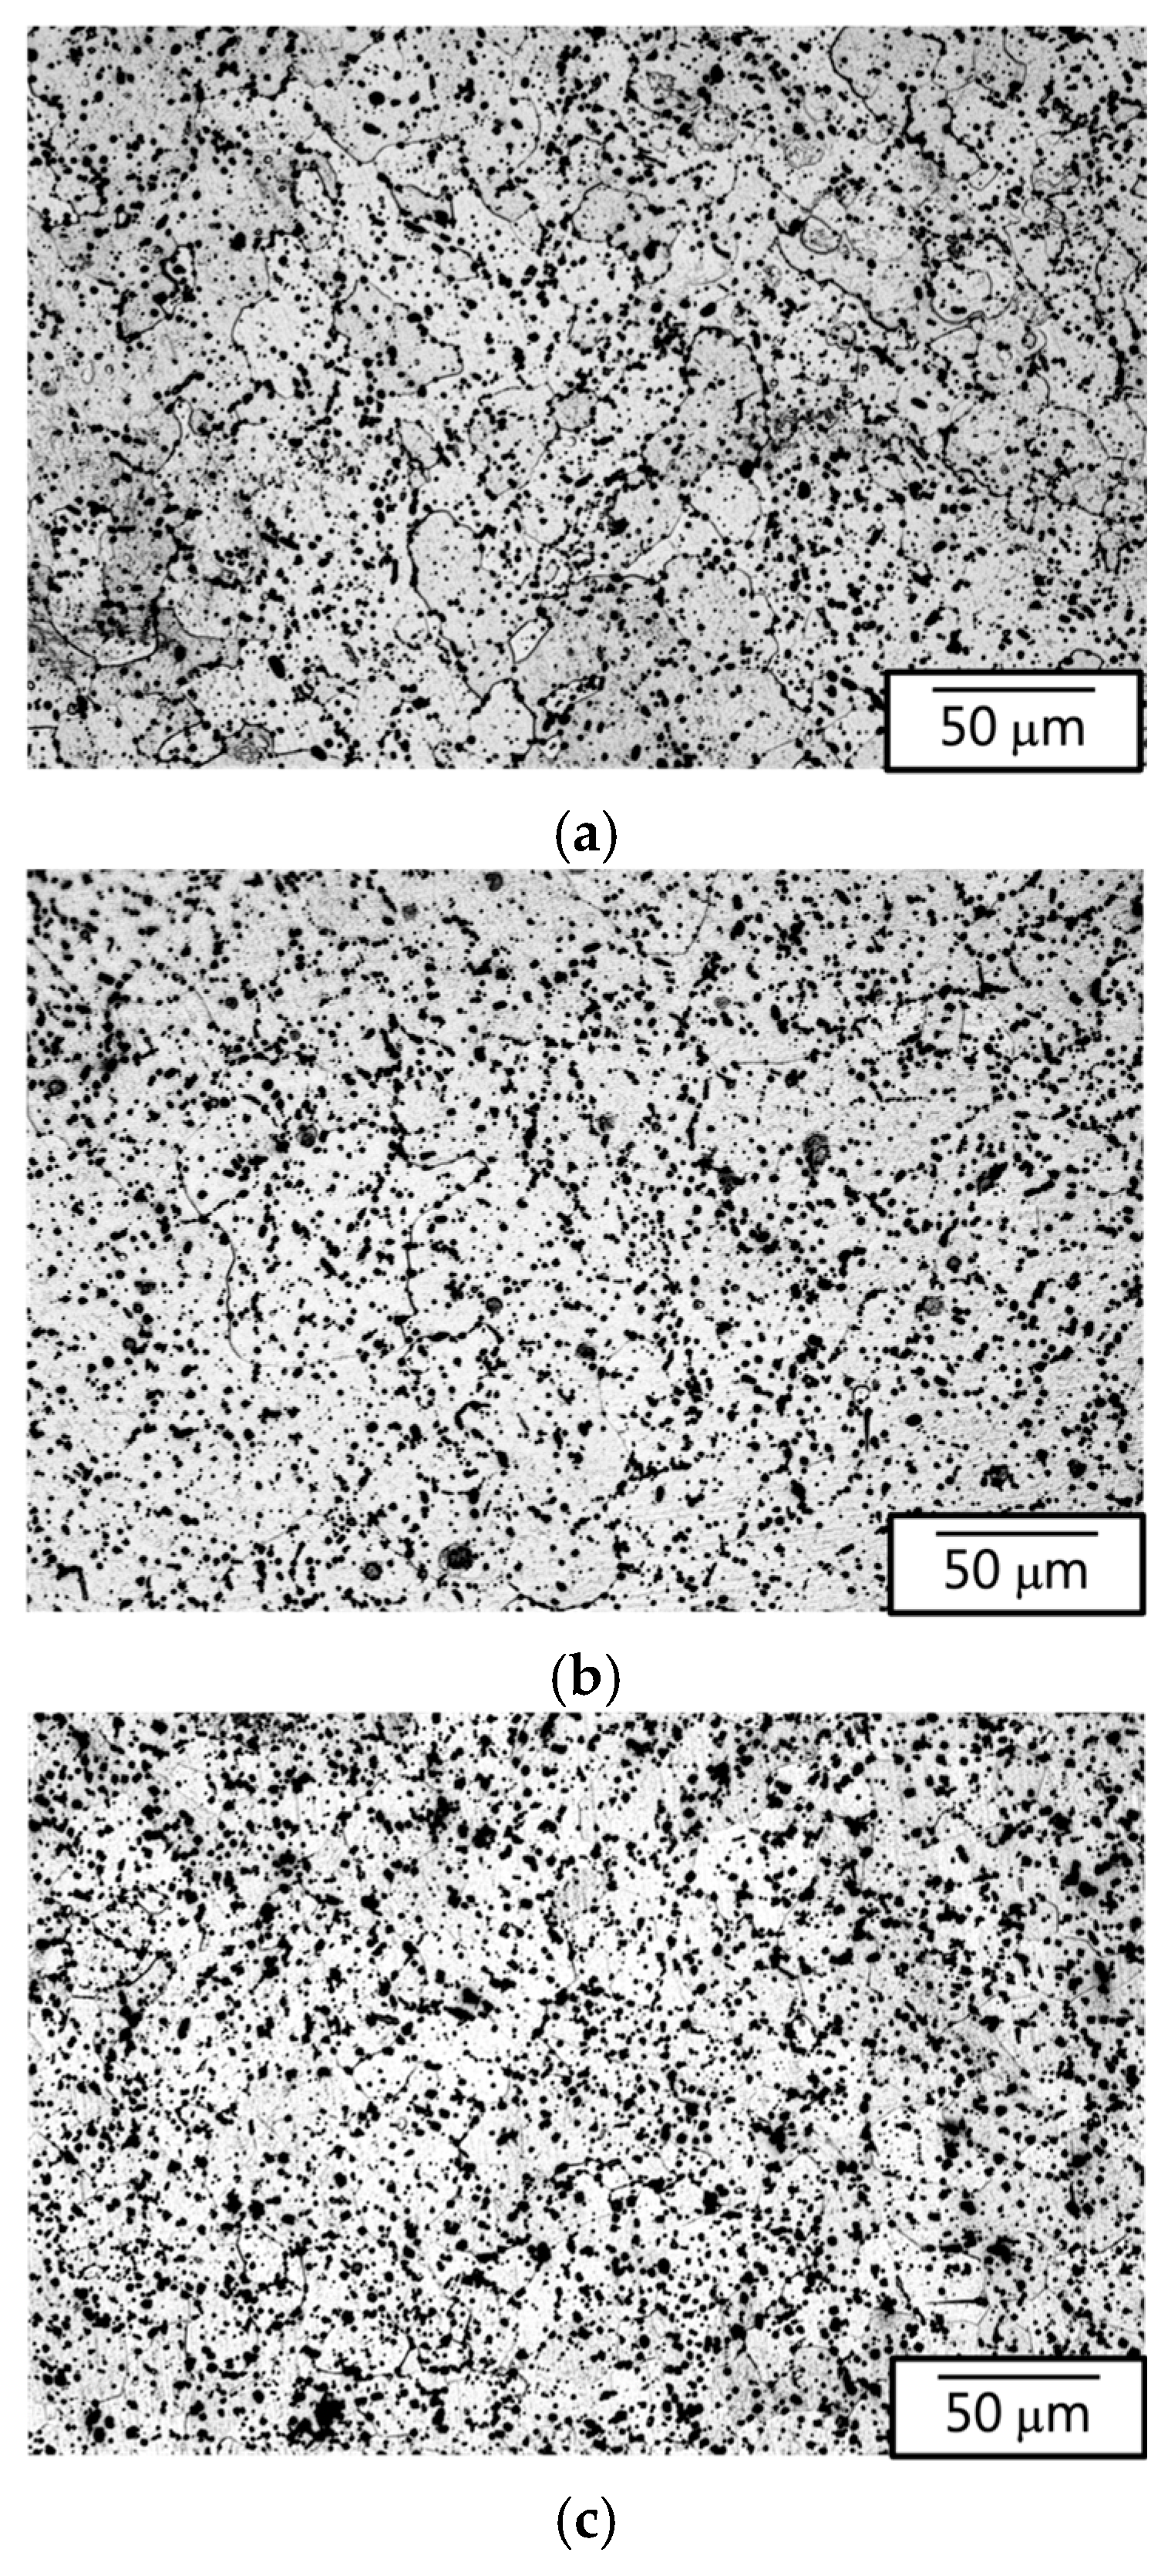
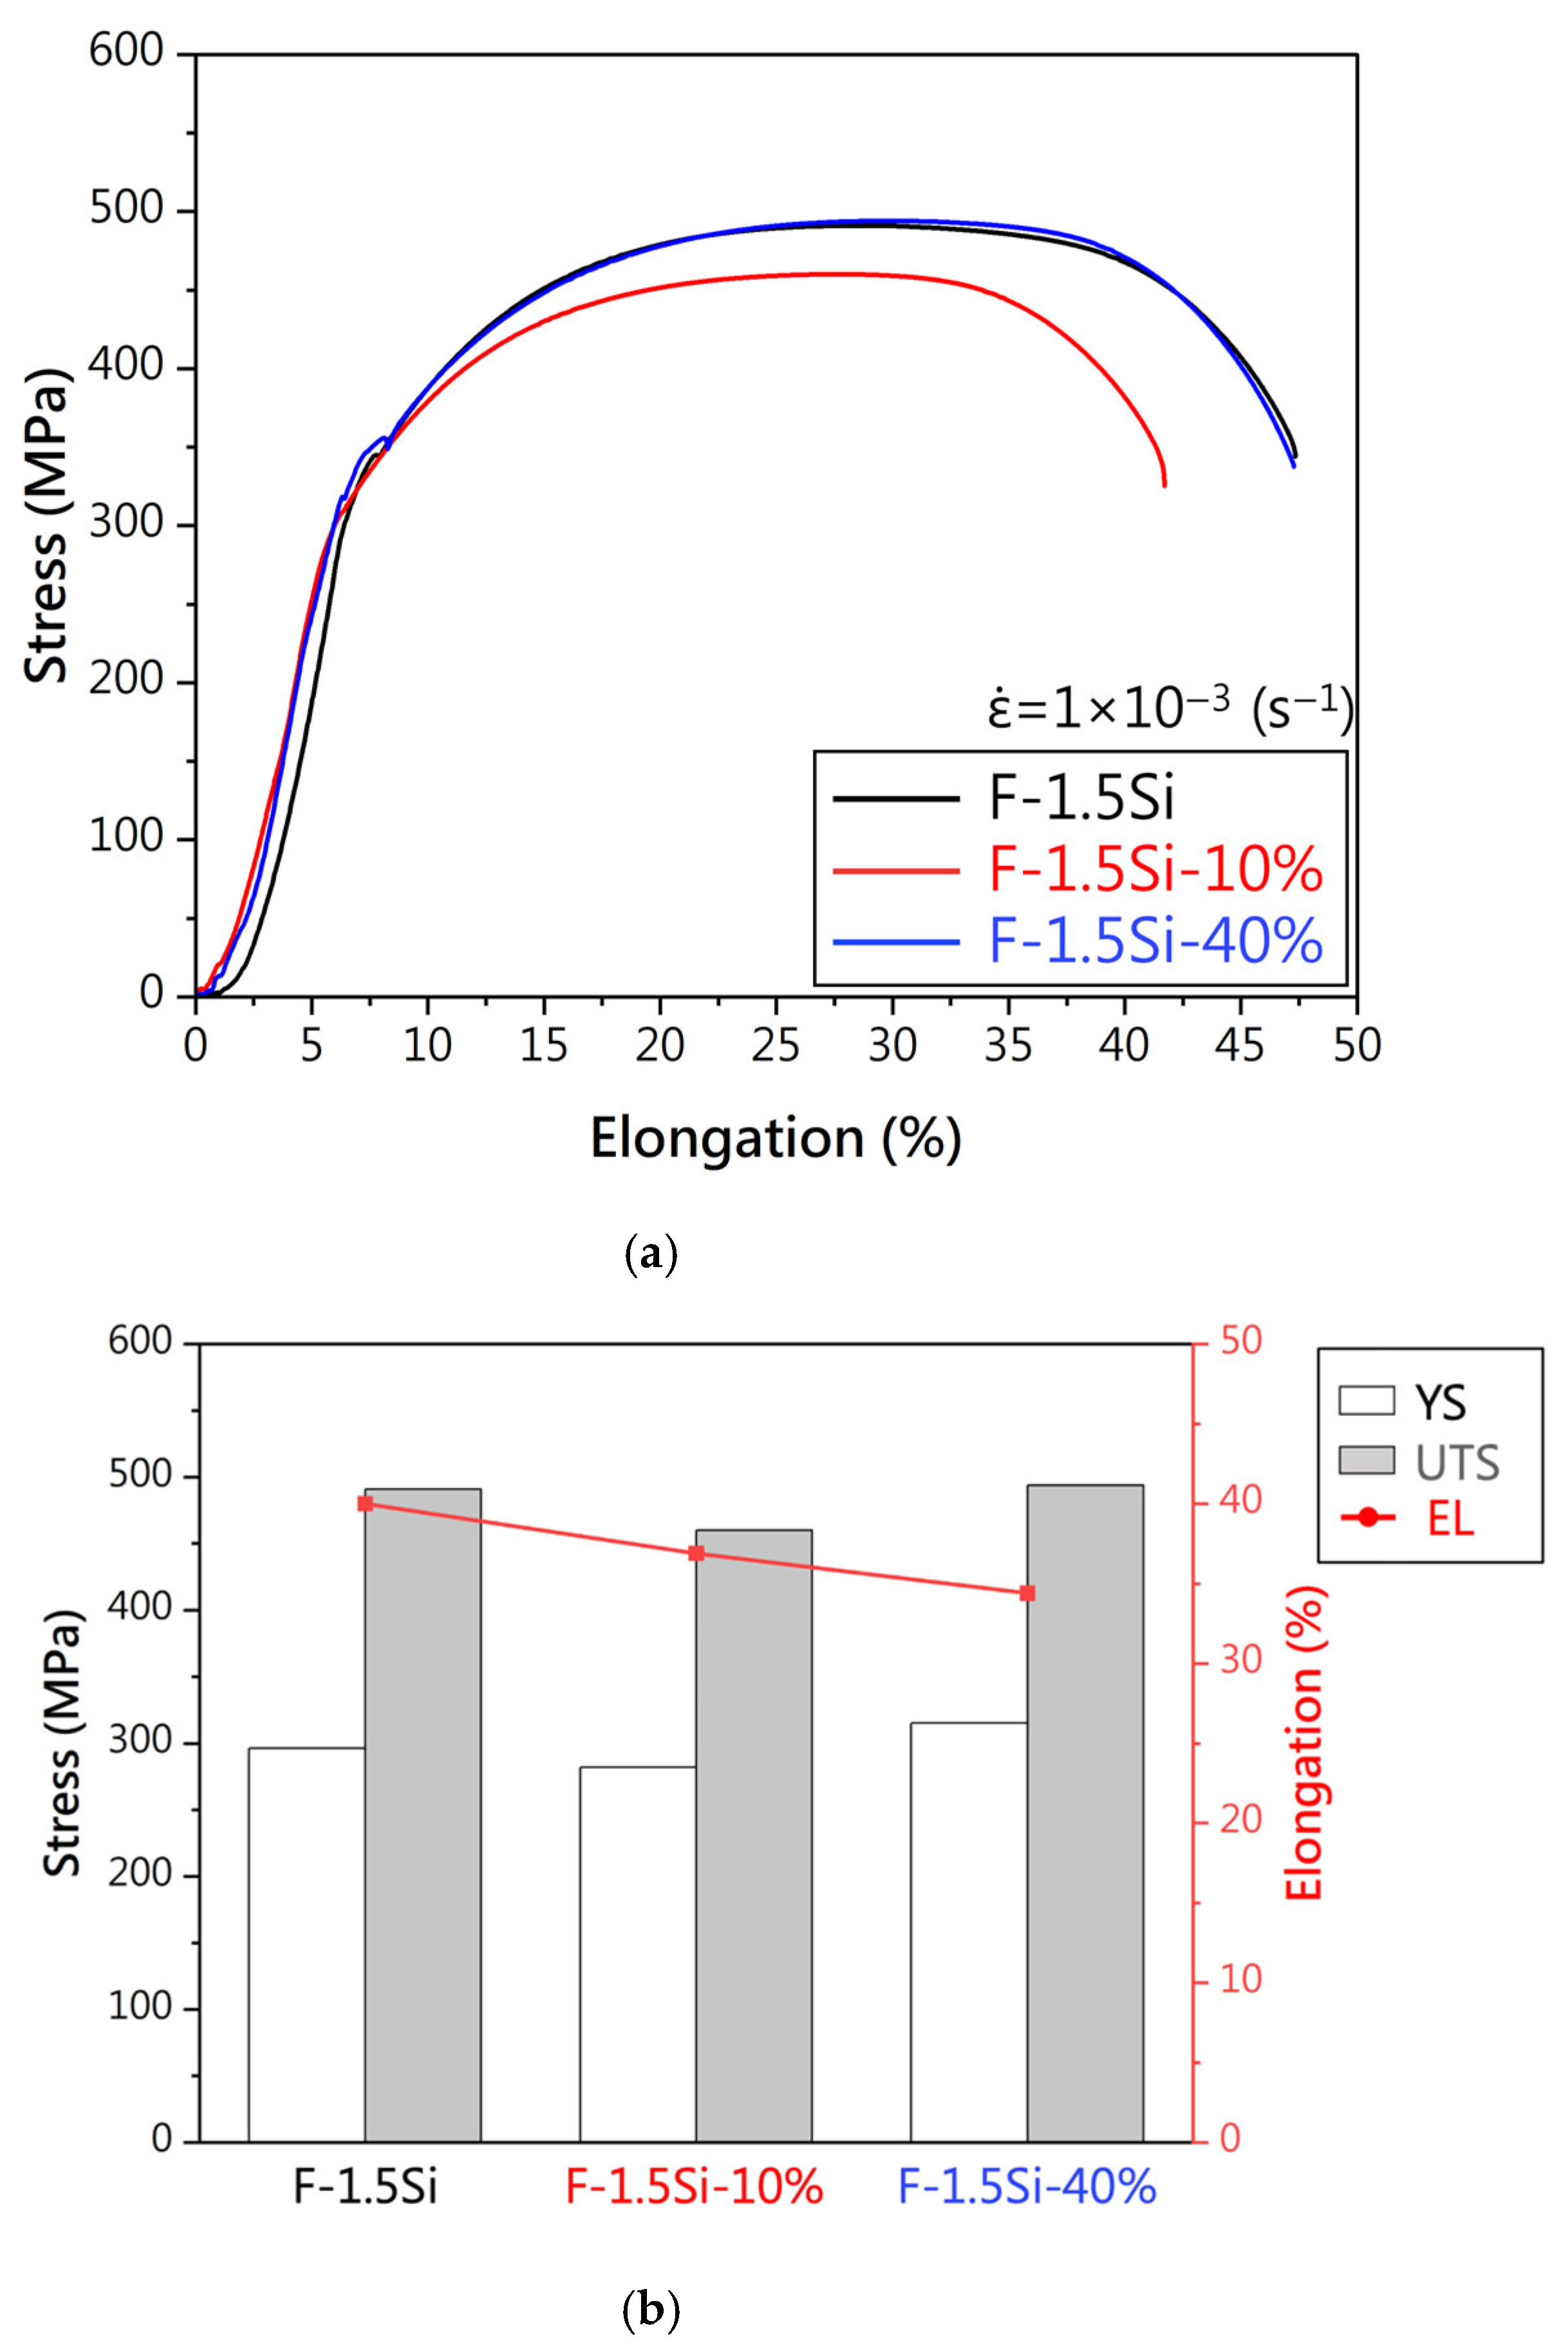
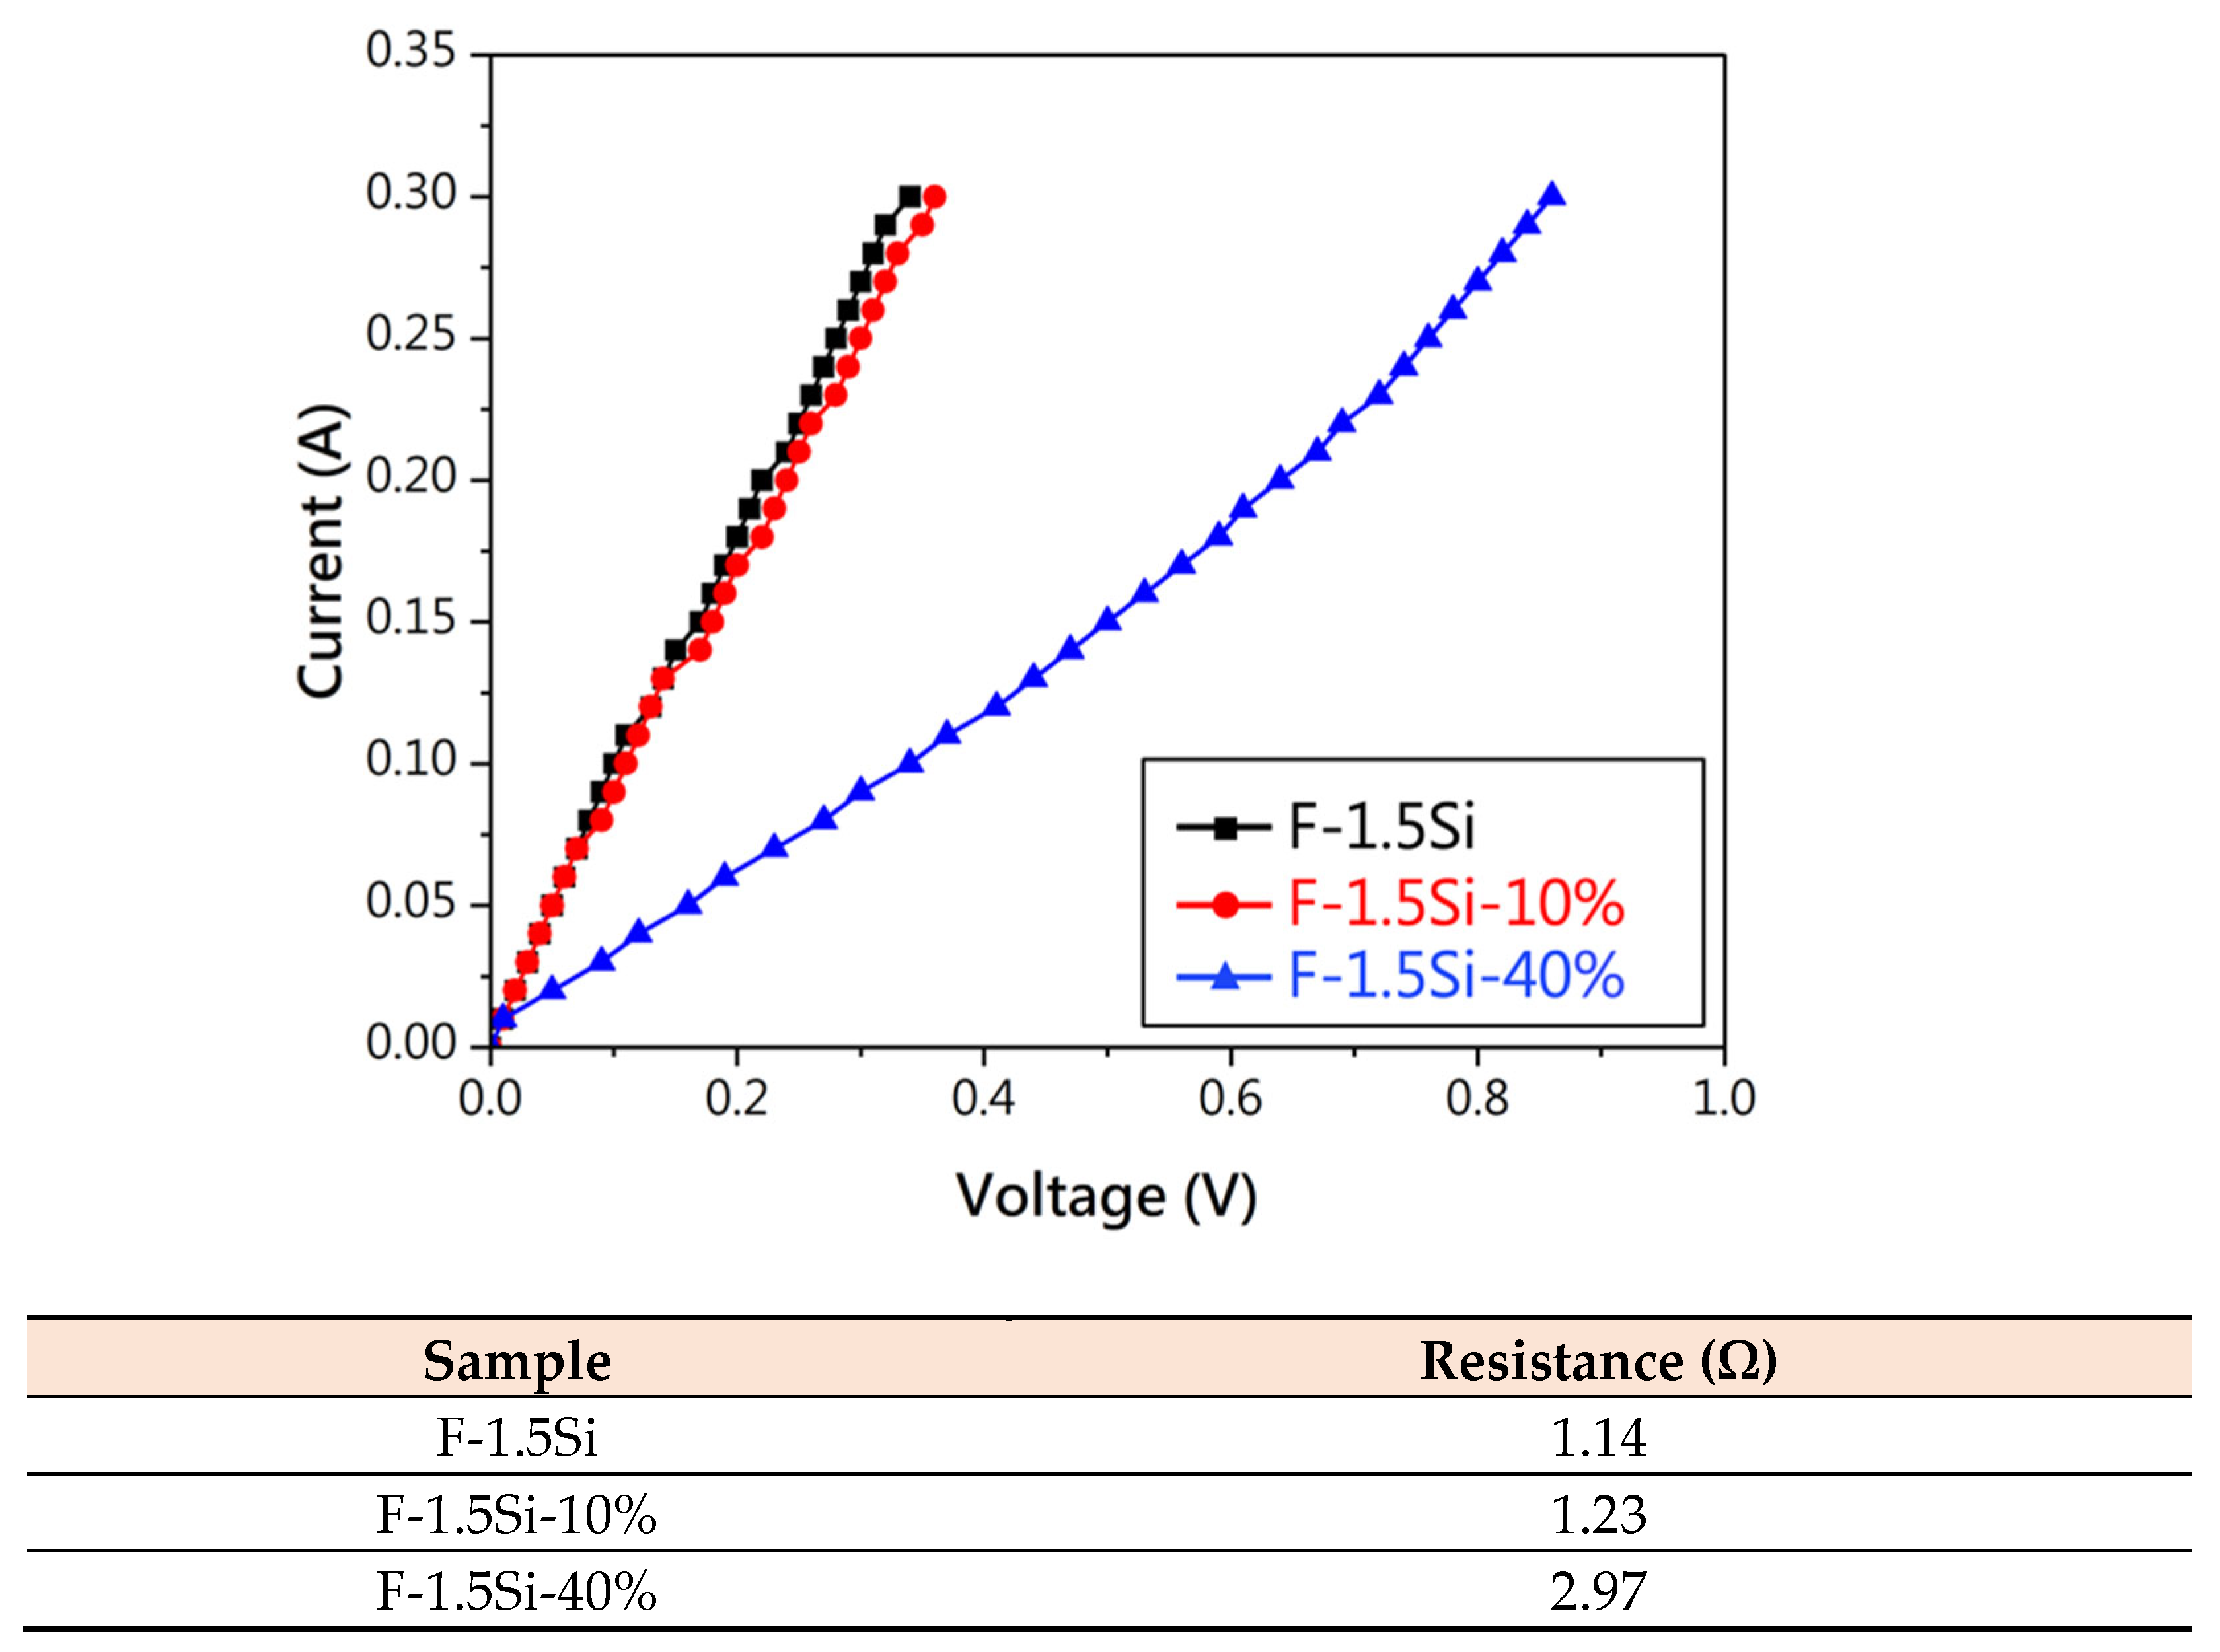
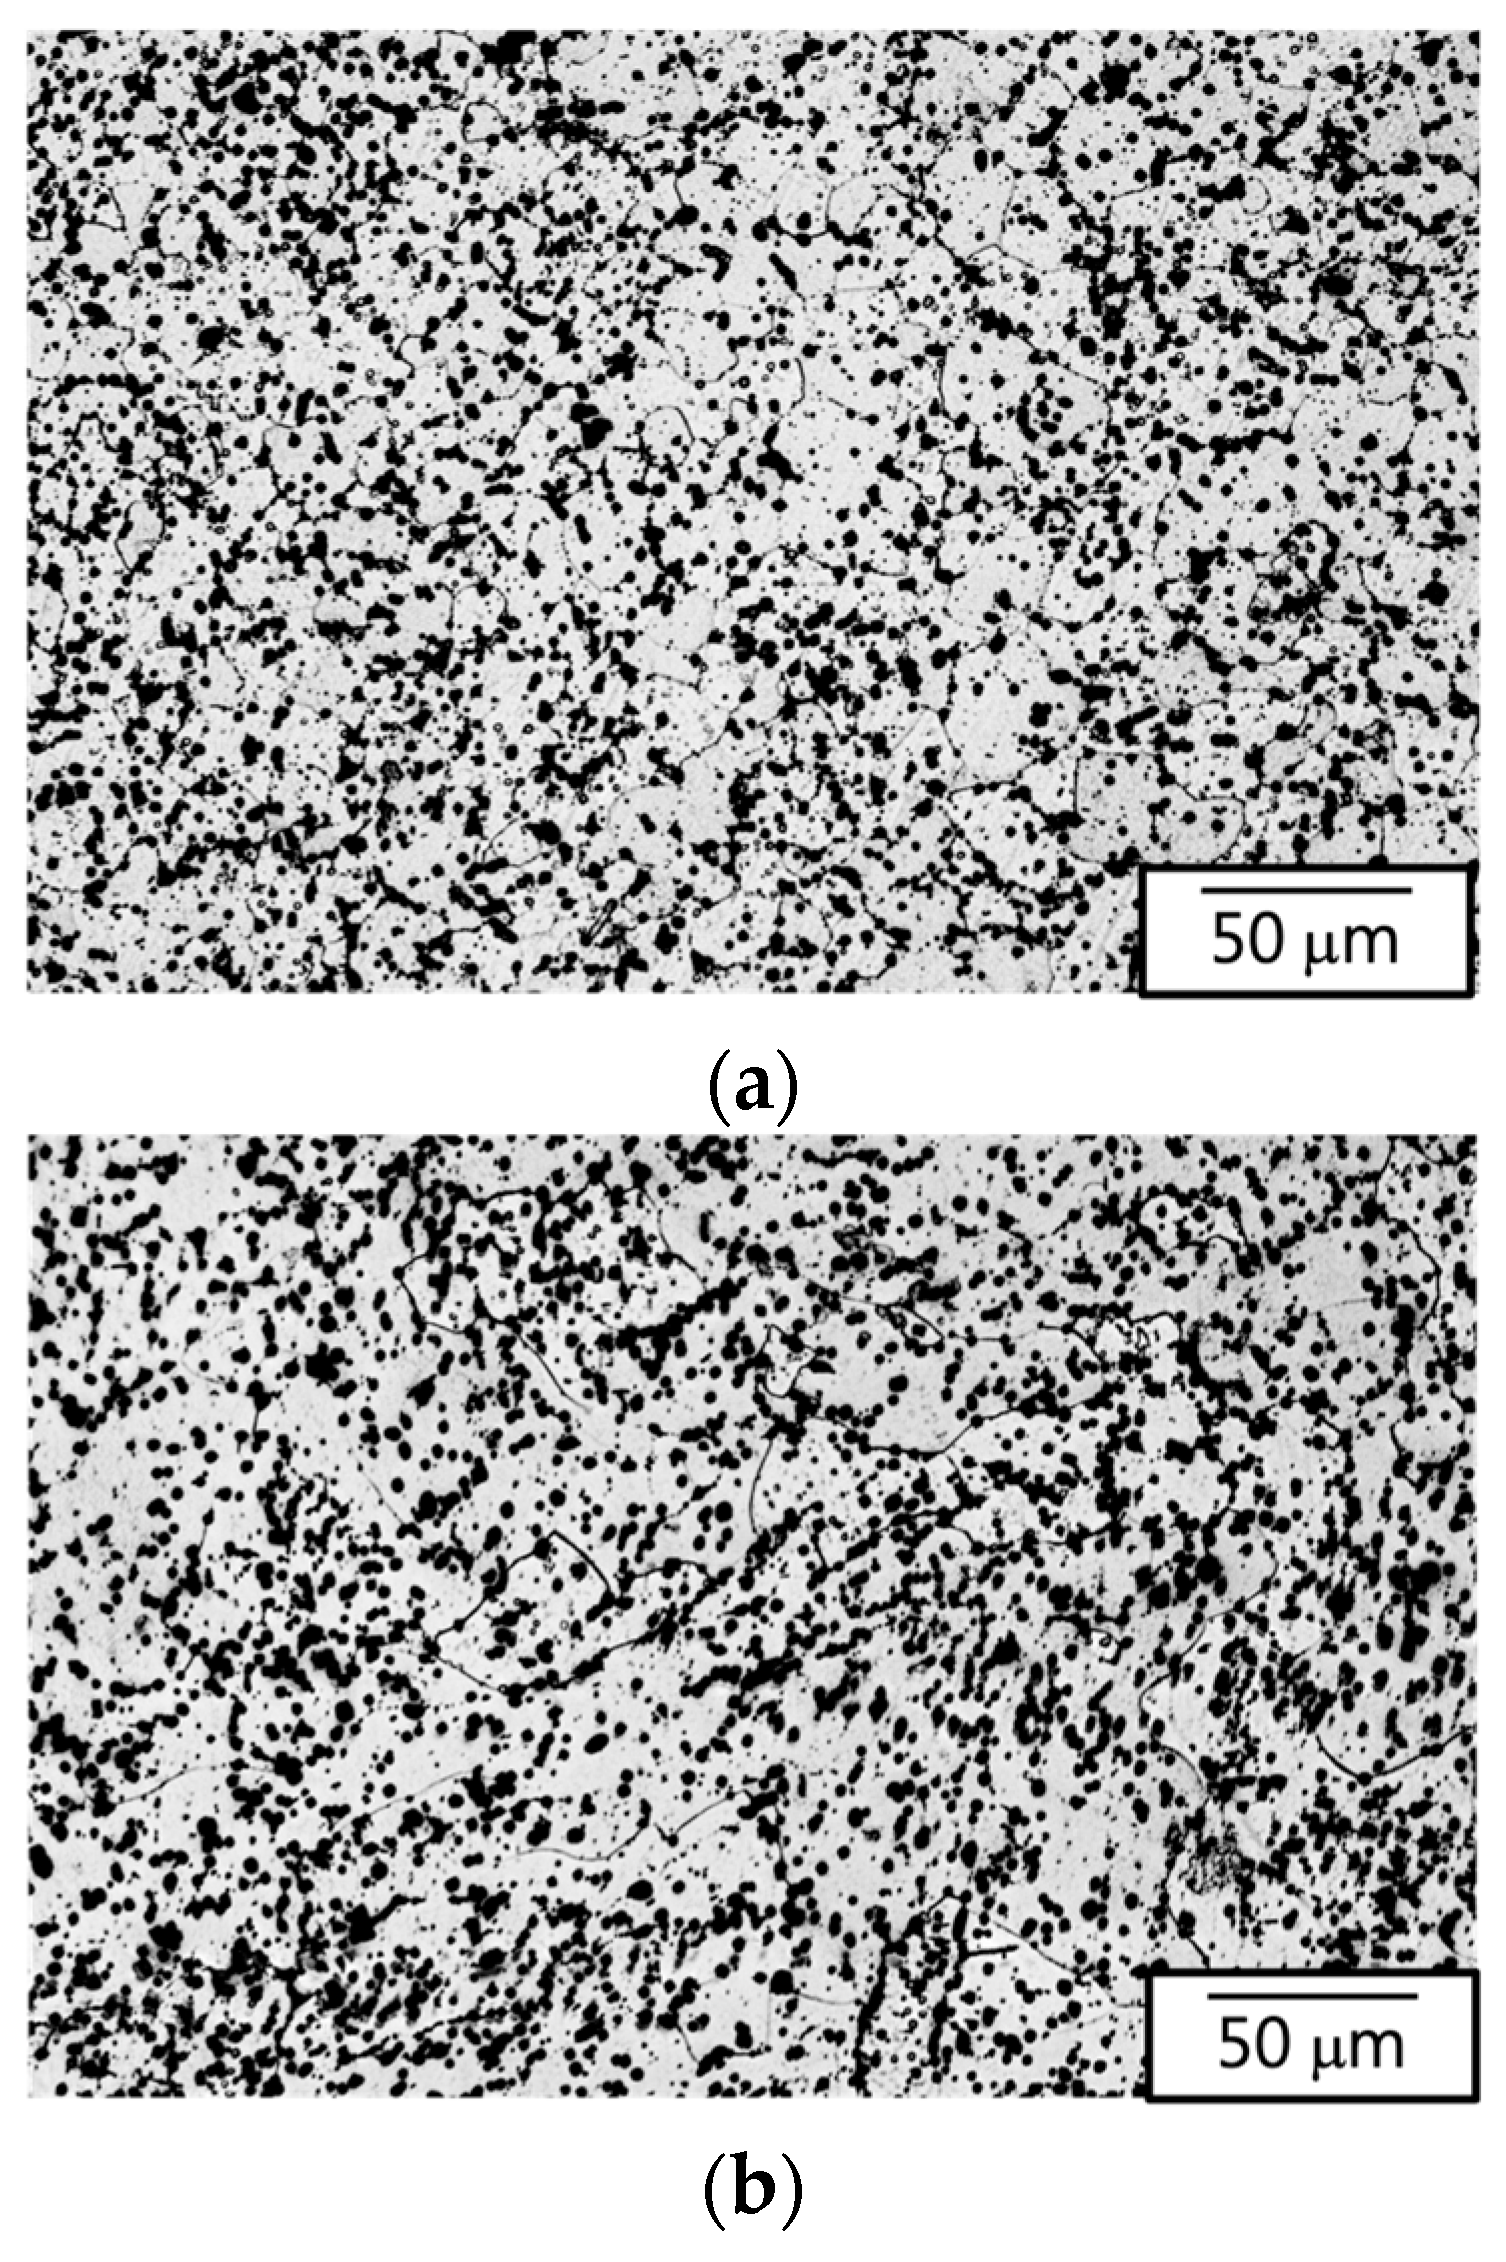
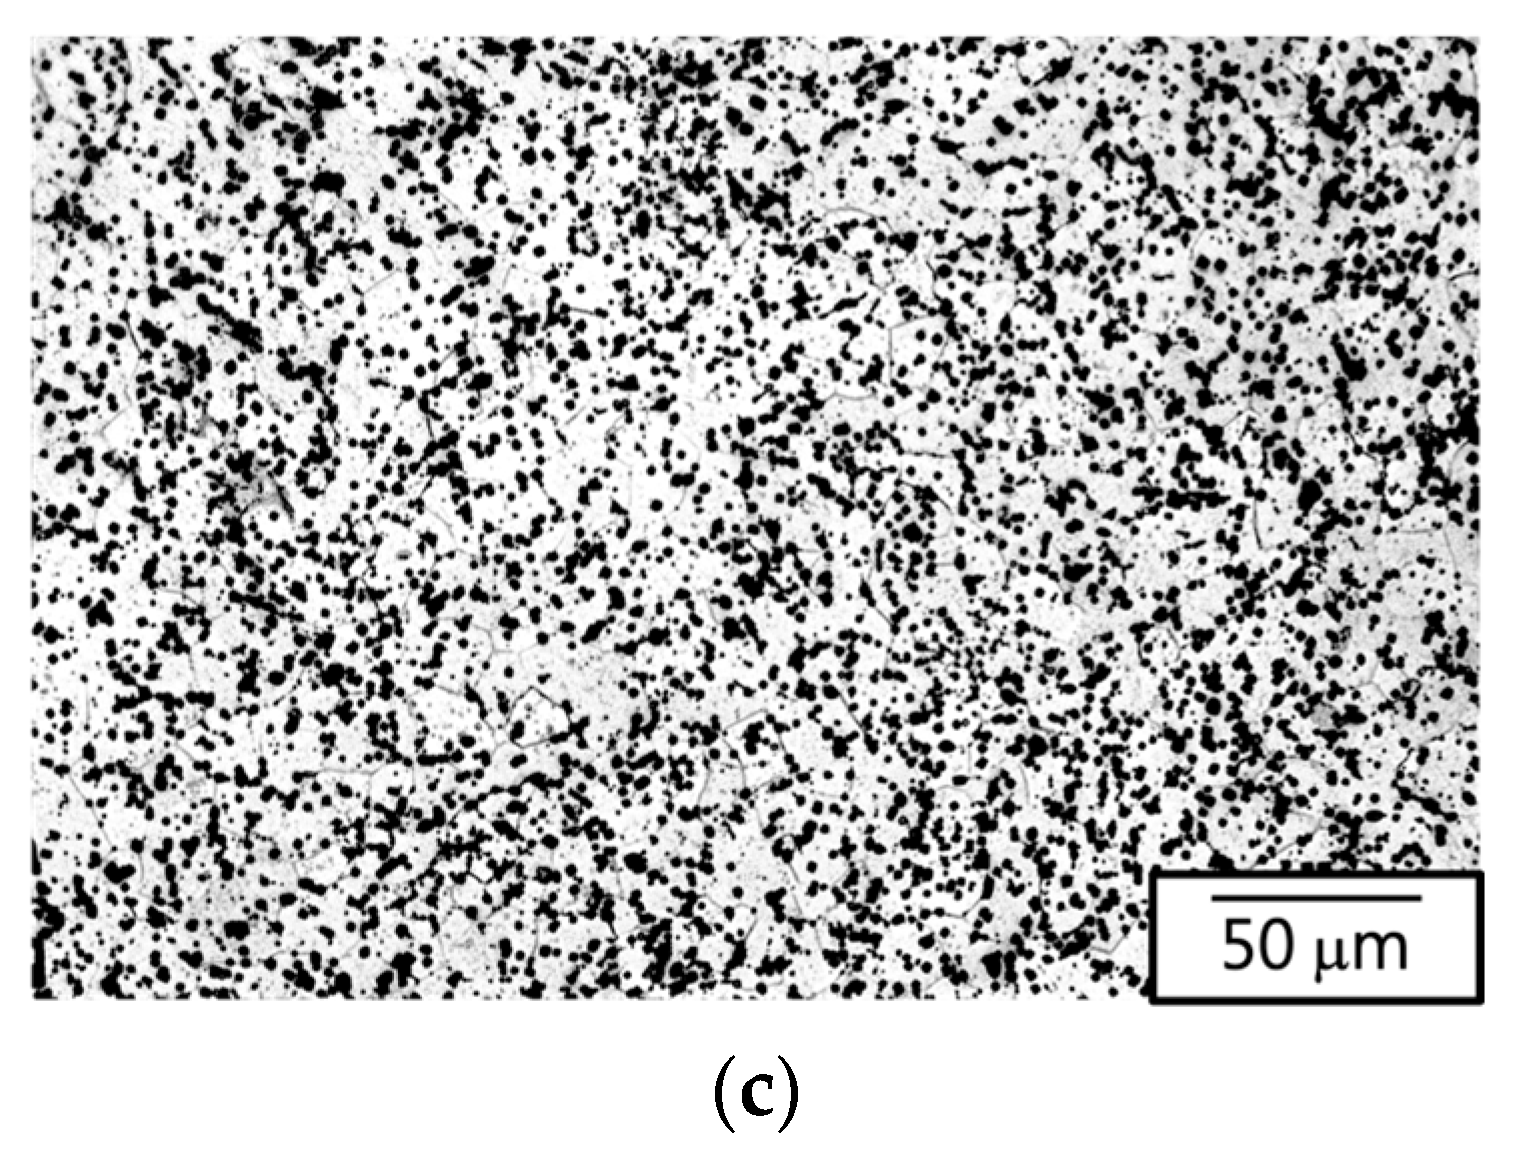
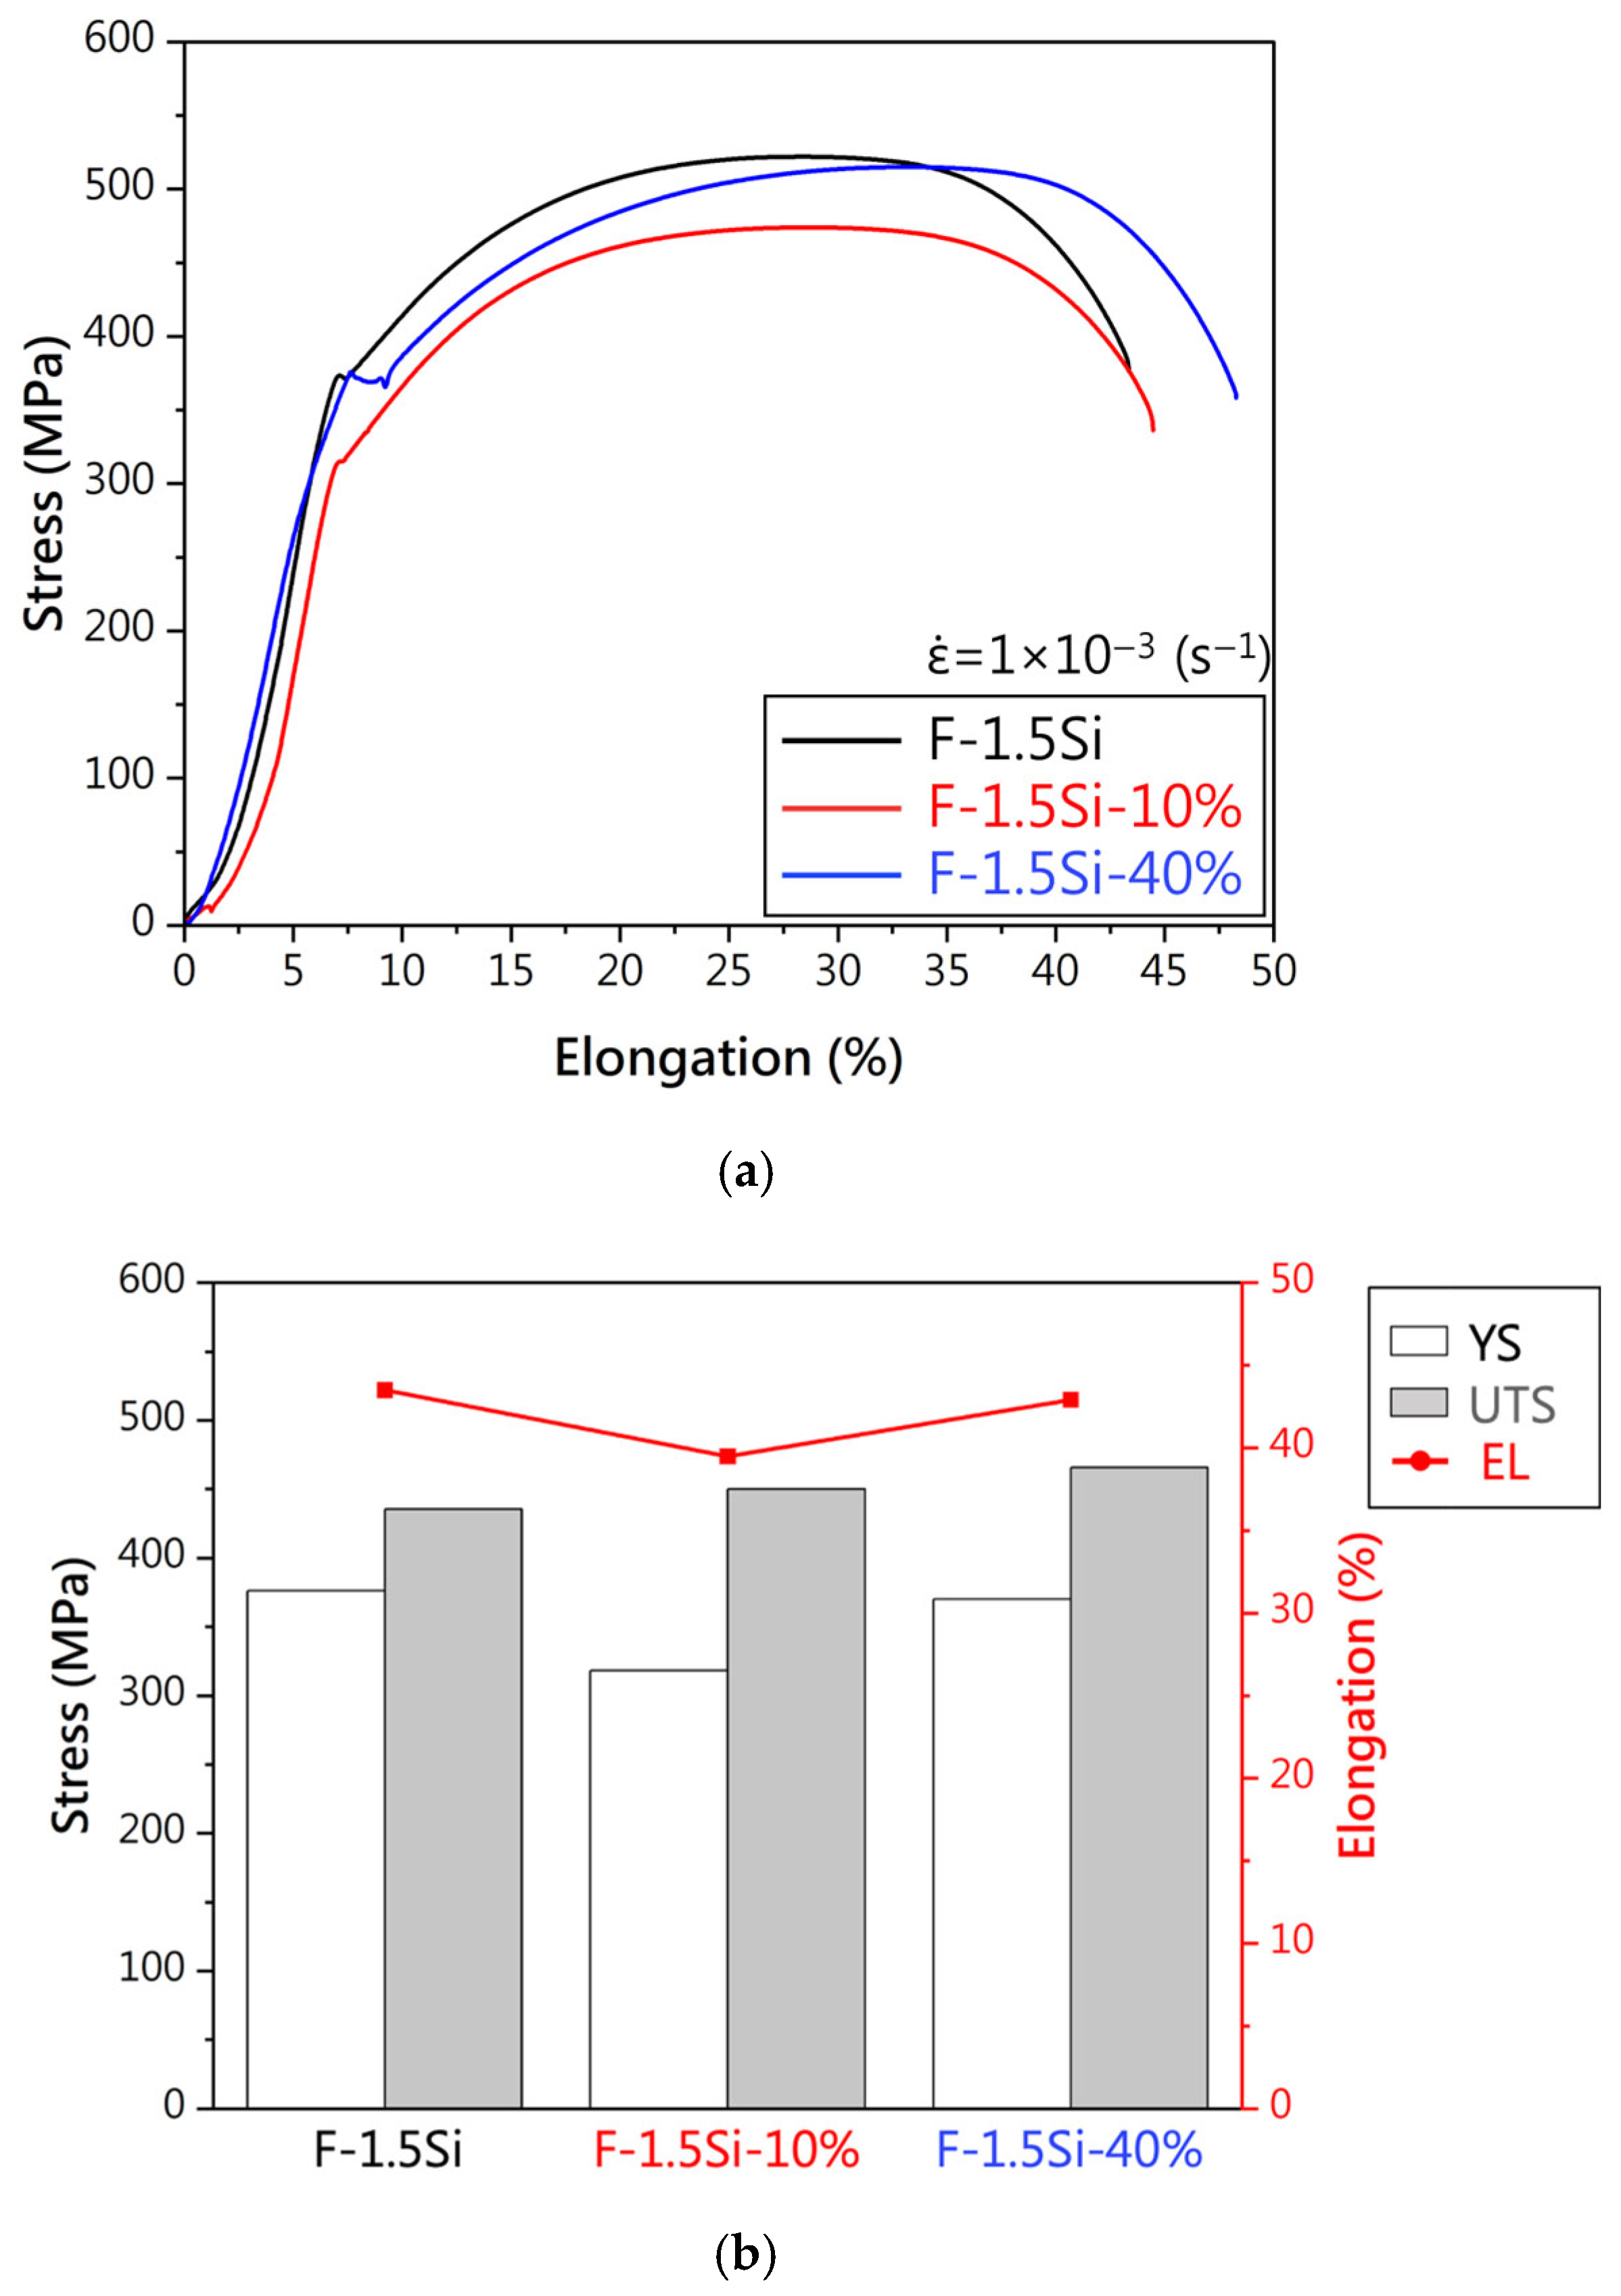
3.1. Analysis of Fundamental Material Properties
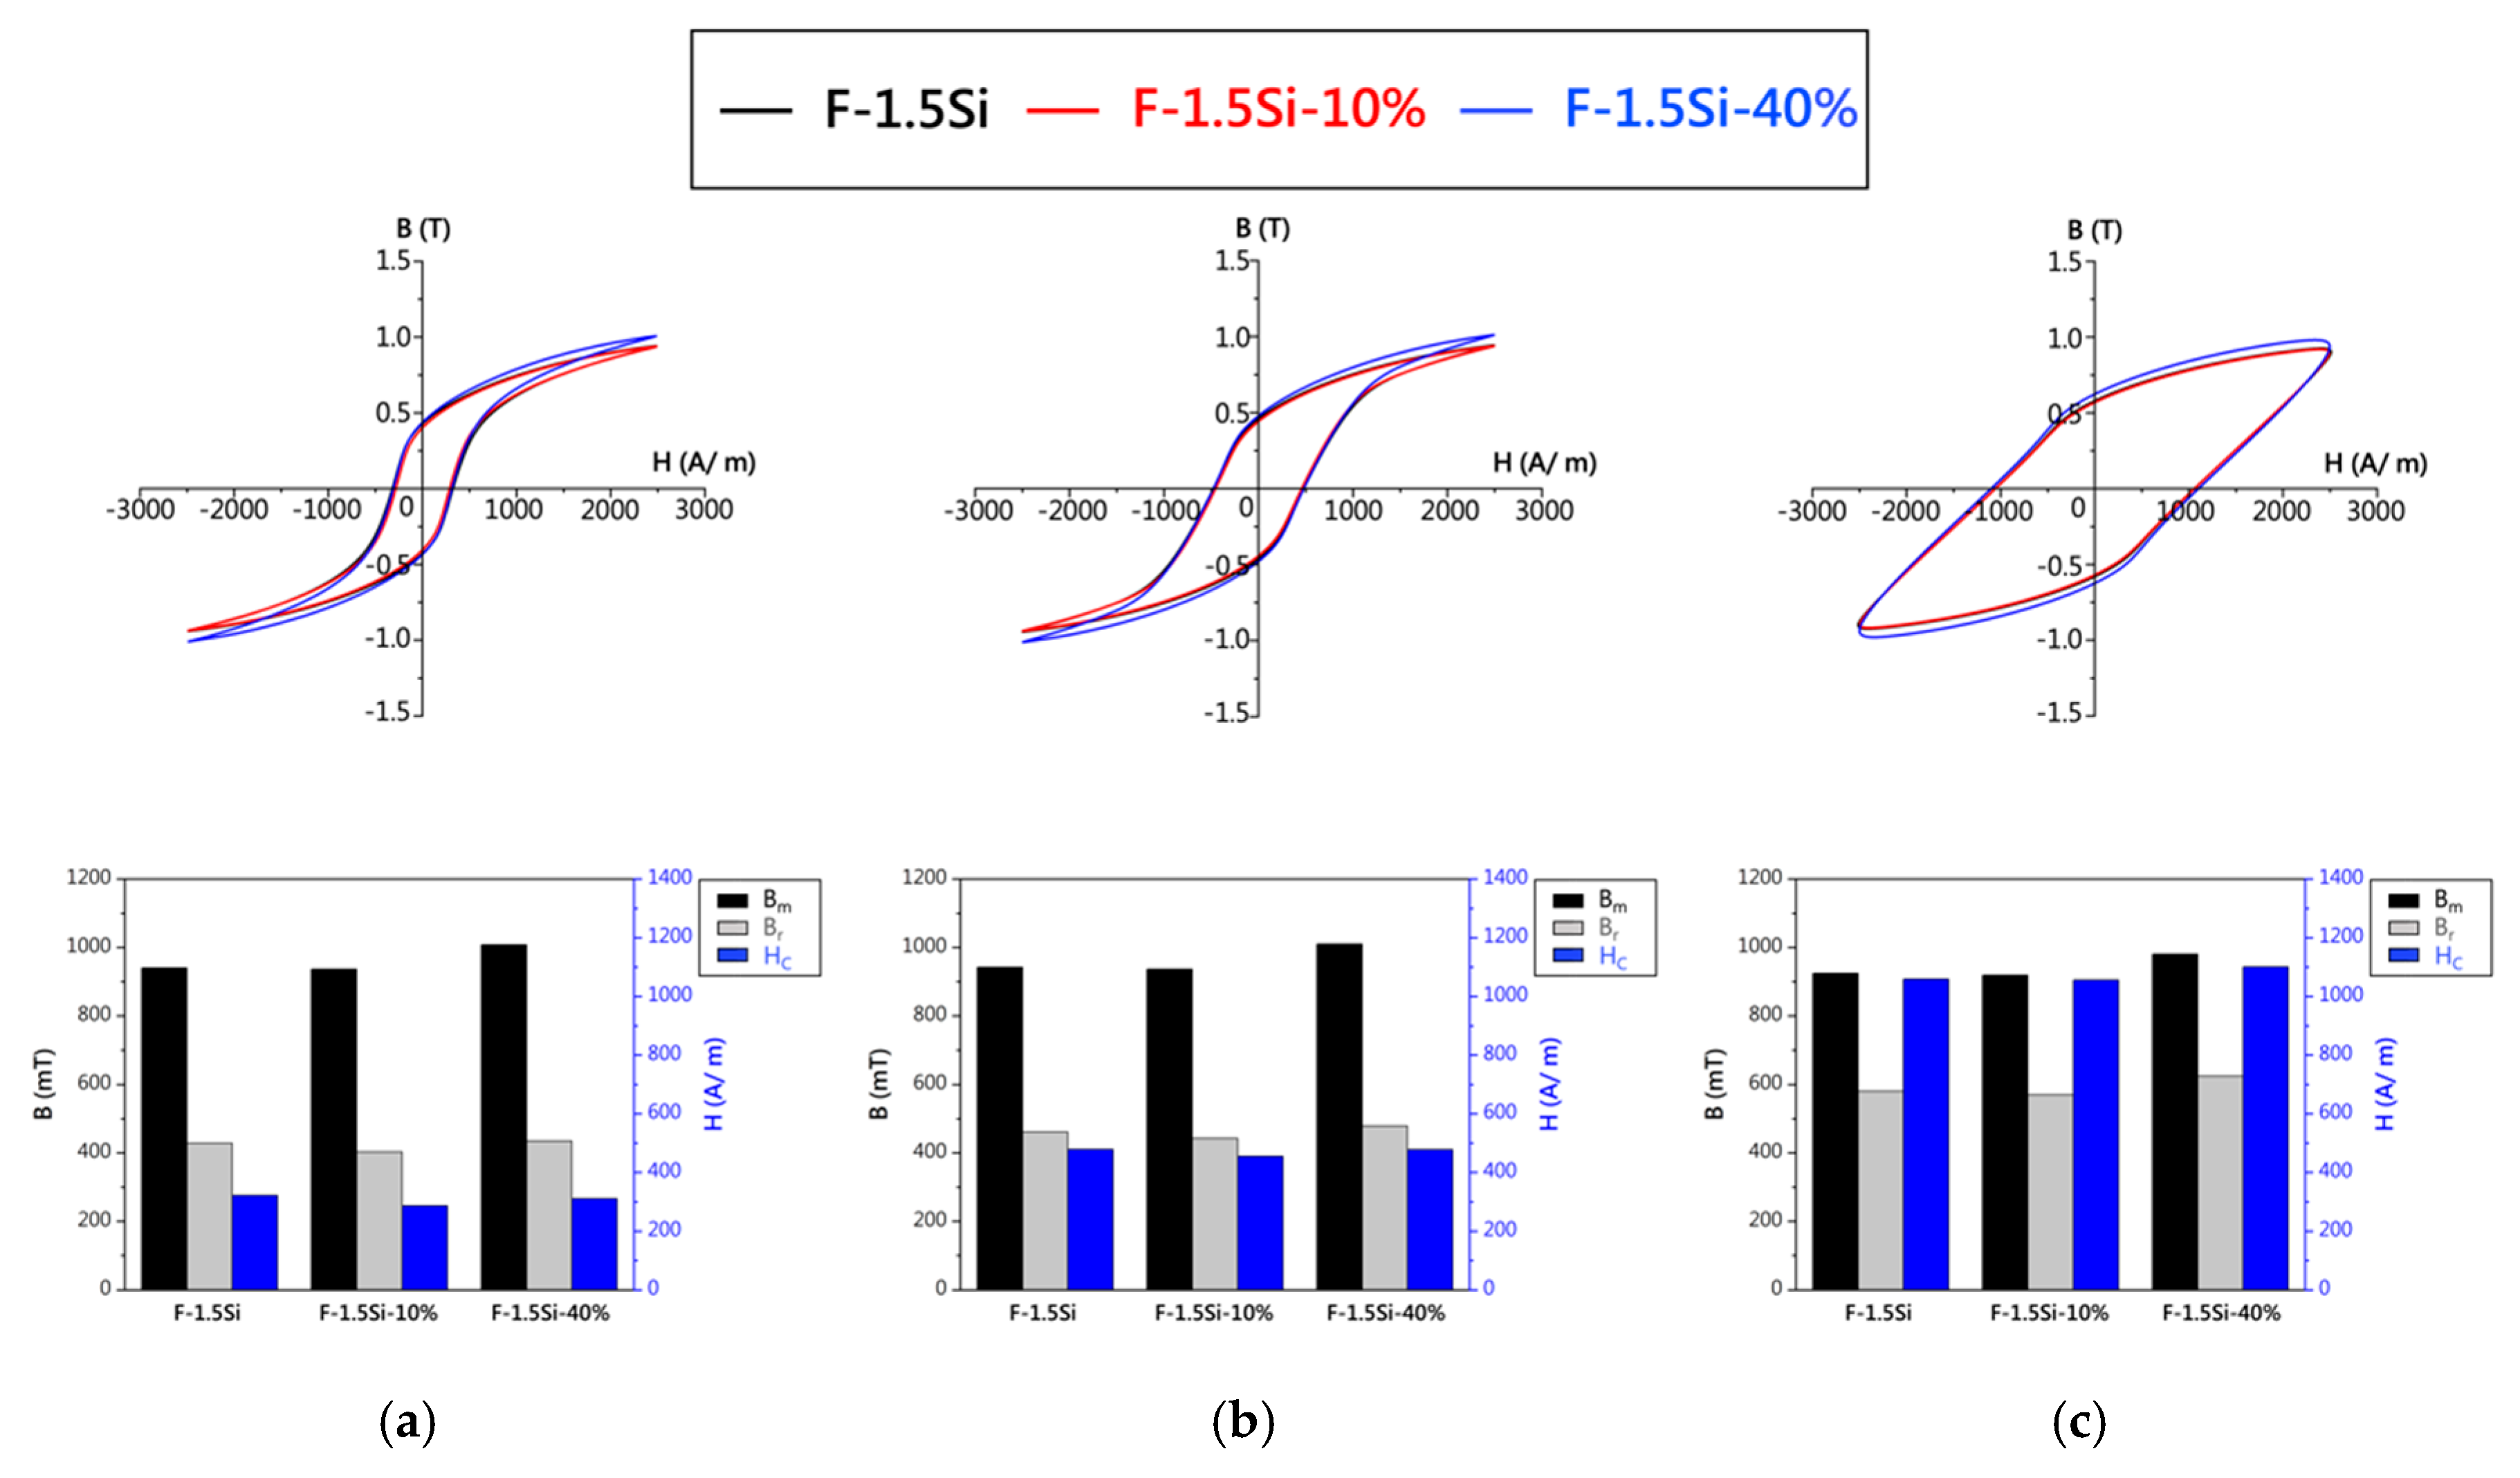
3.2. Atmospheric Magnetic Annealing Process
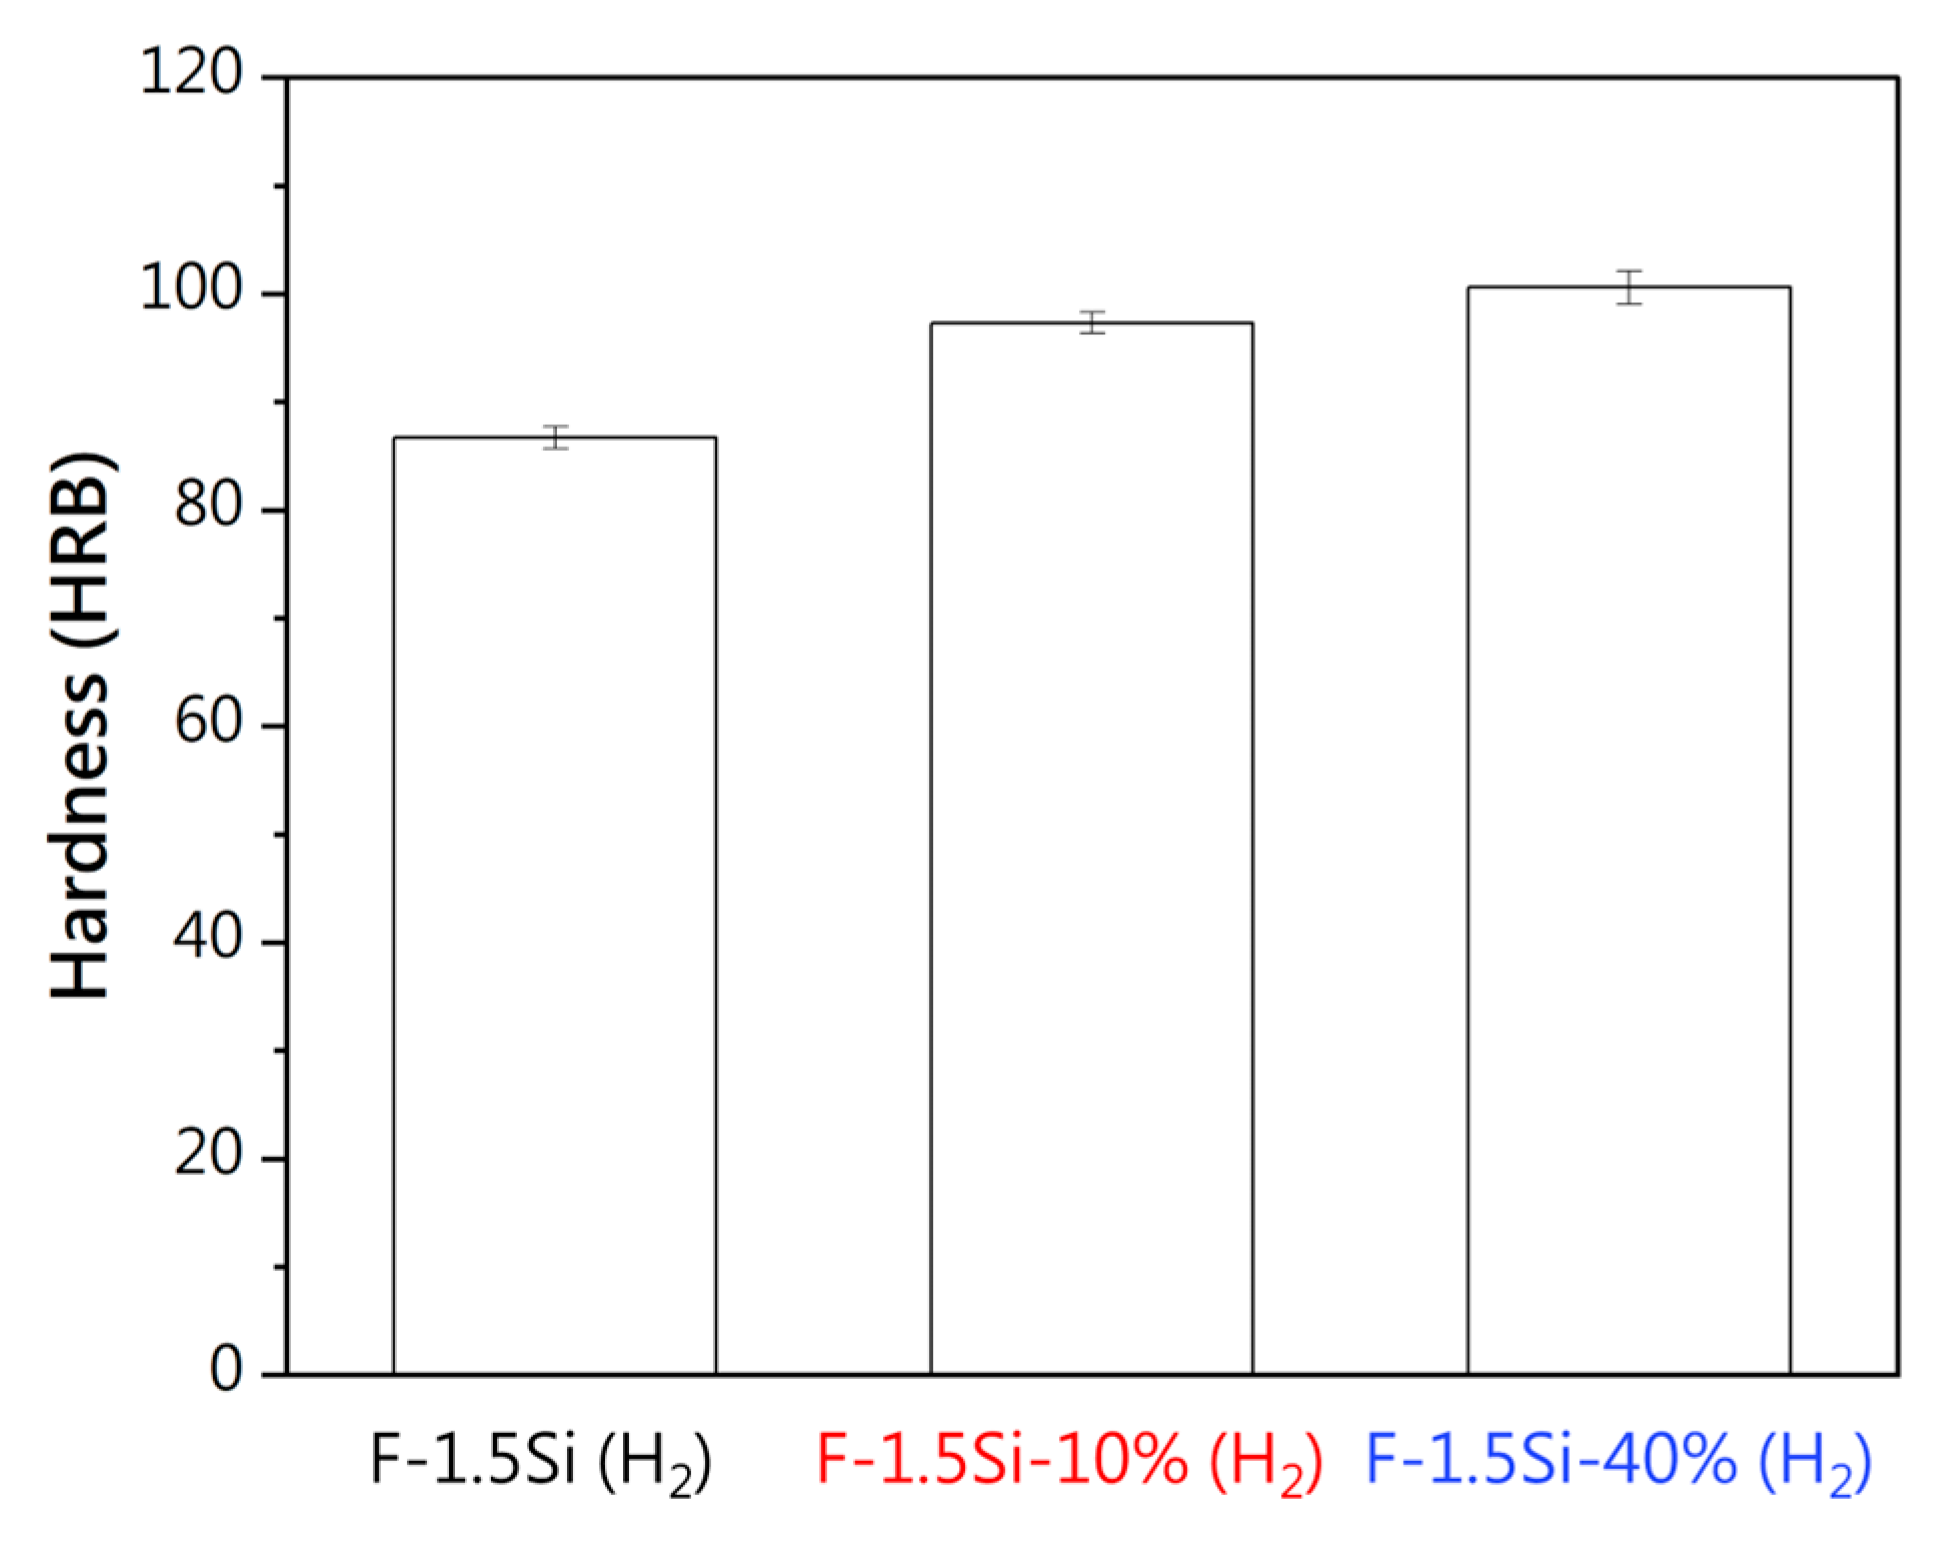
3.3. Hydrogen Magnetic Annealing Process
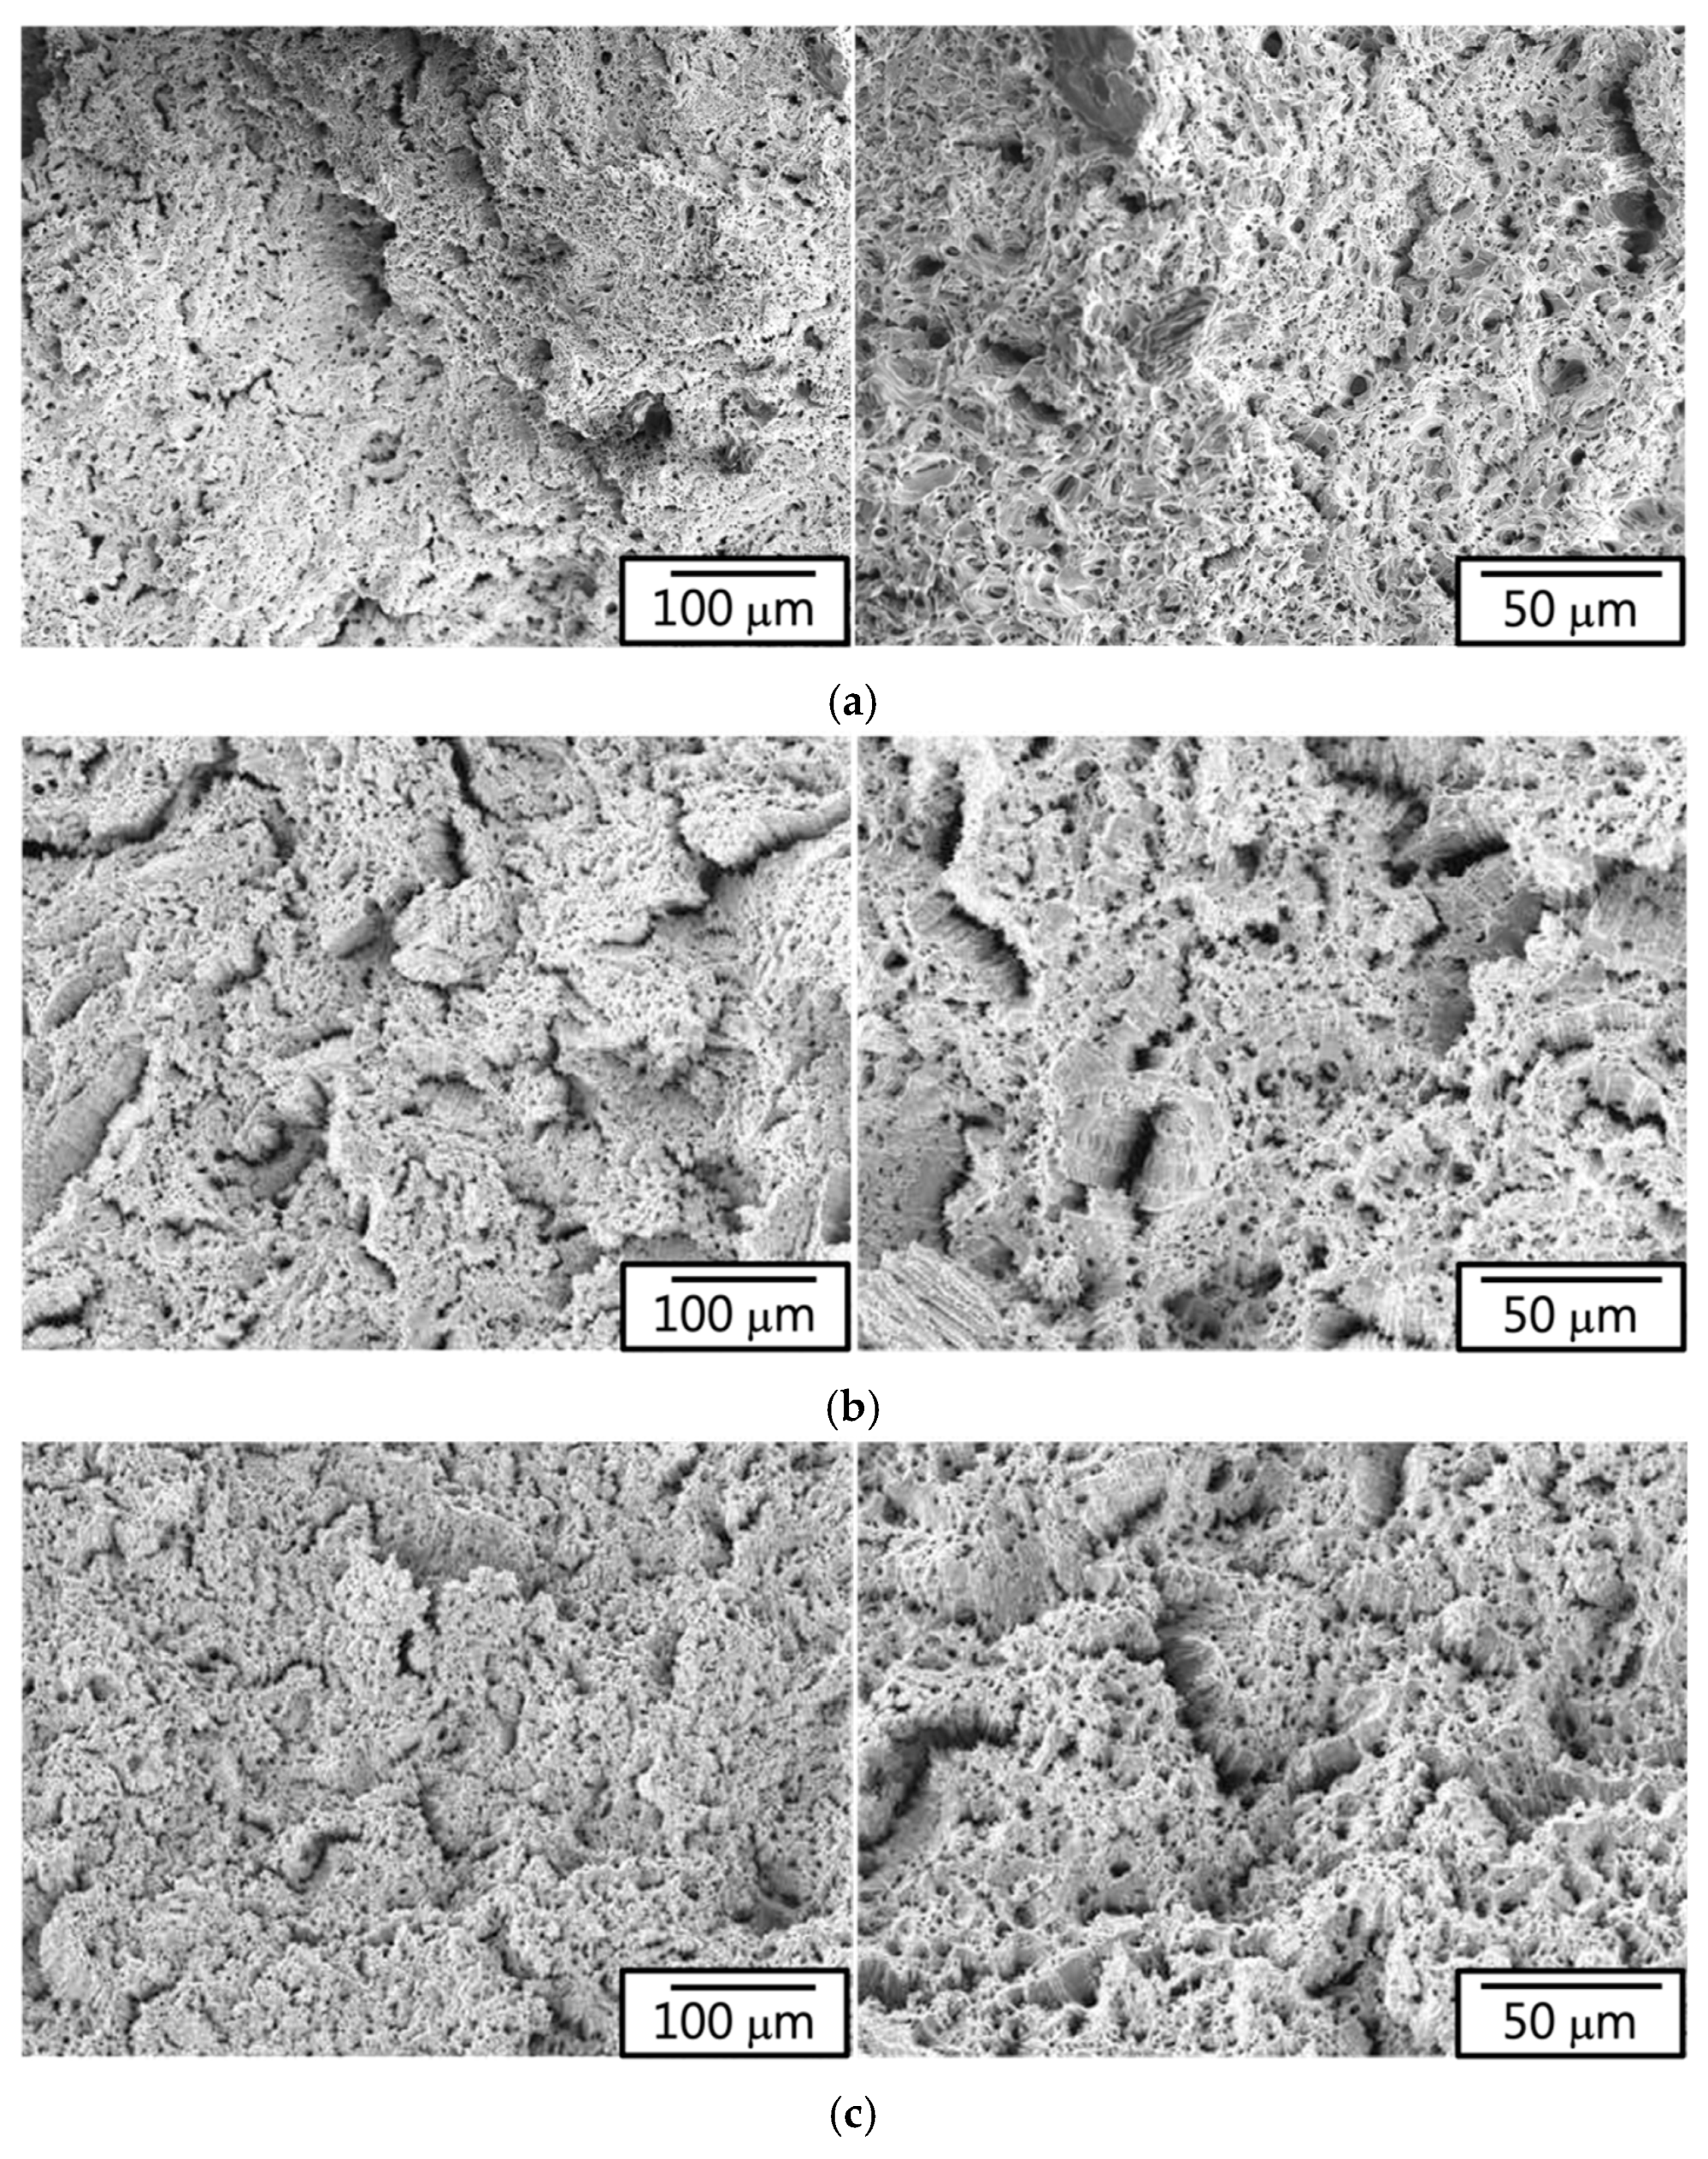
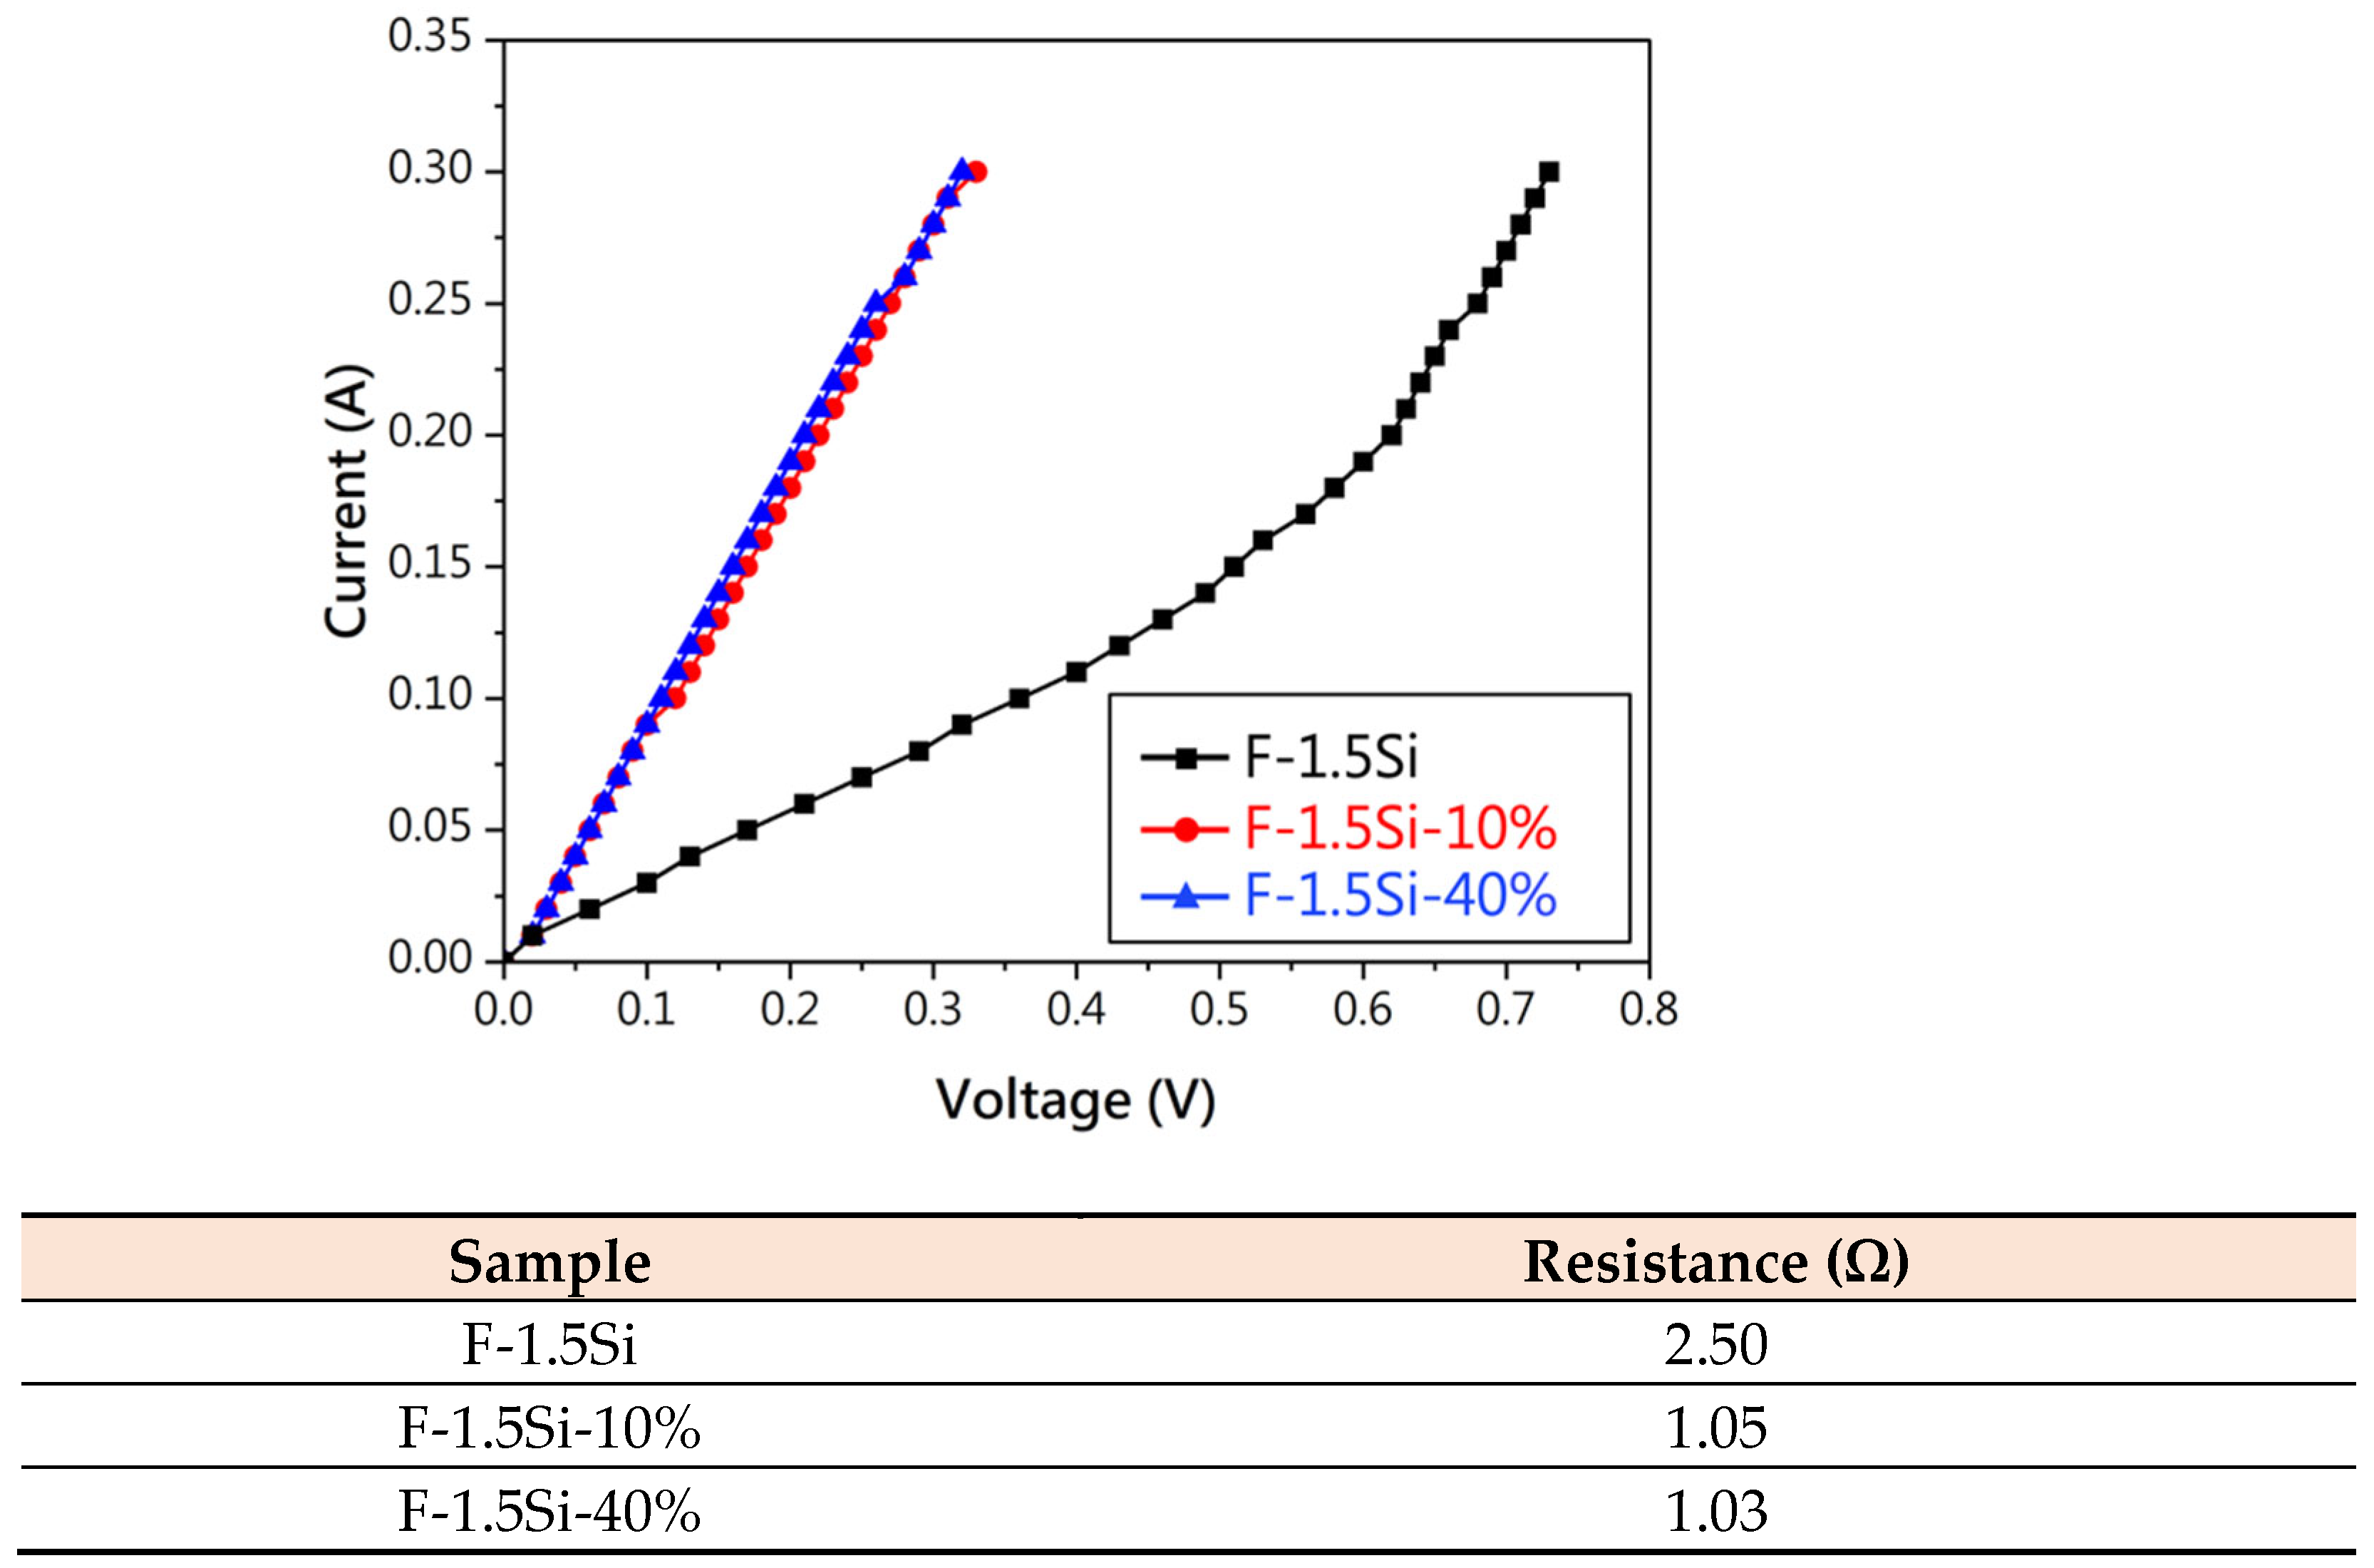
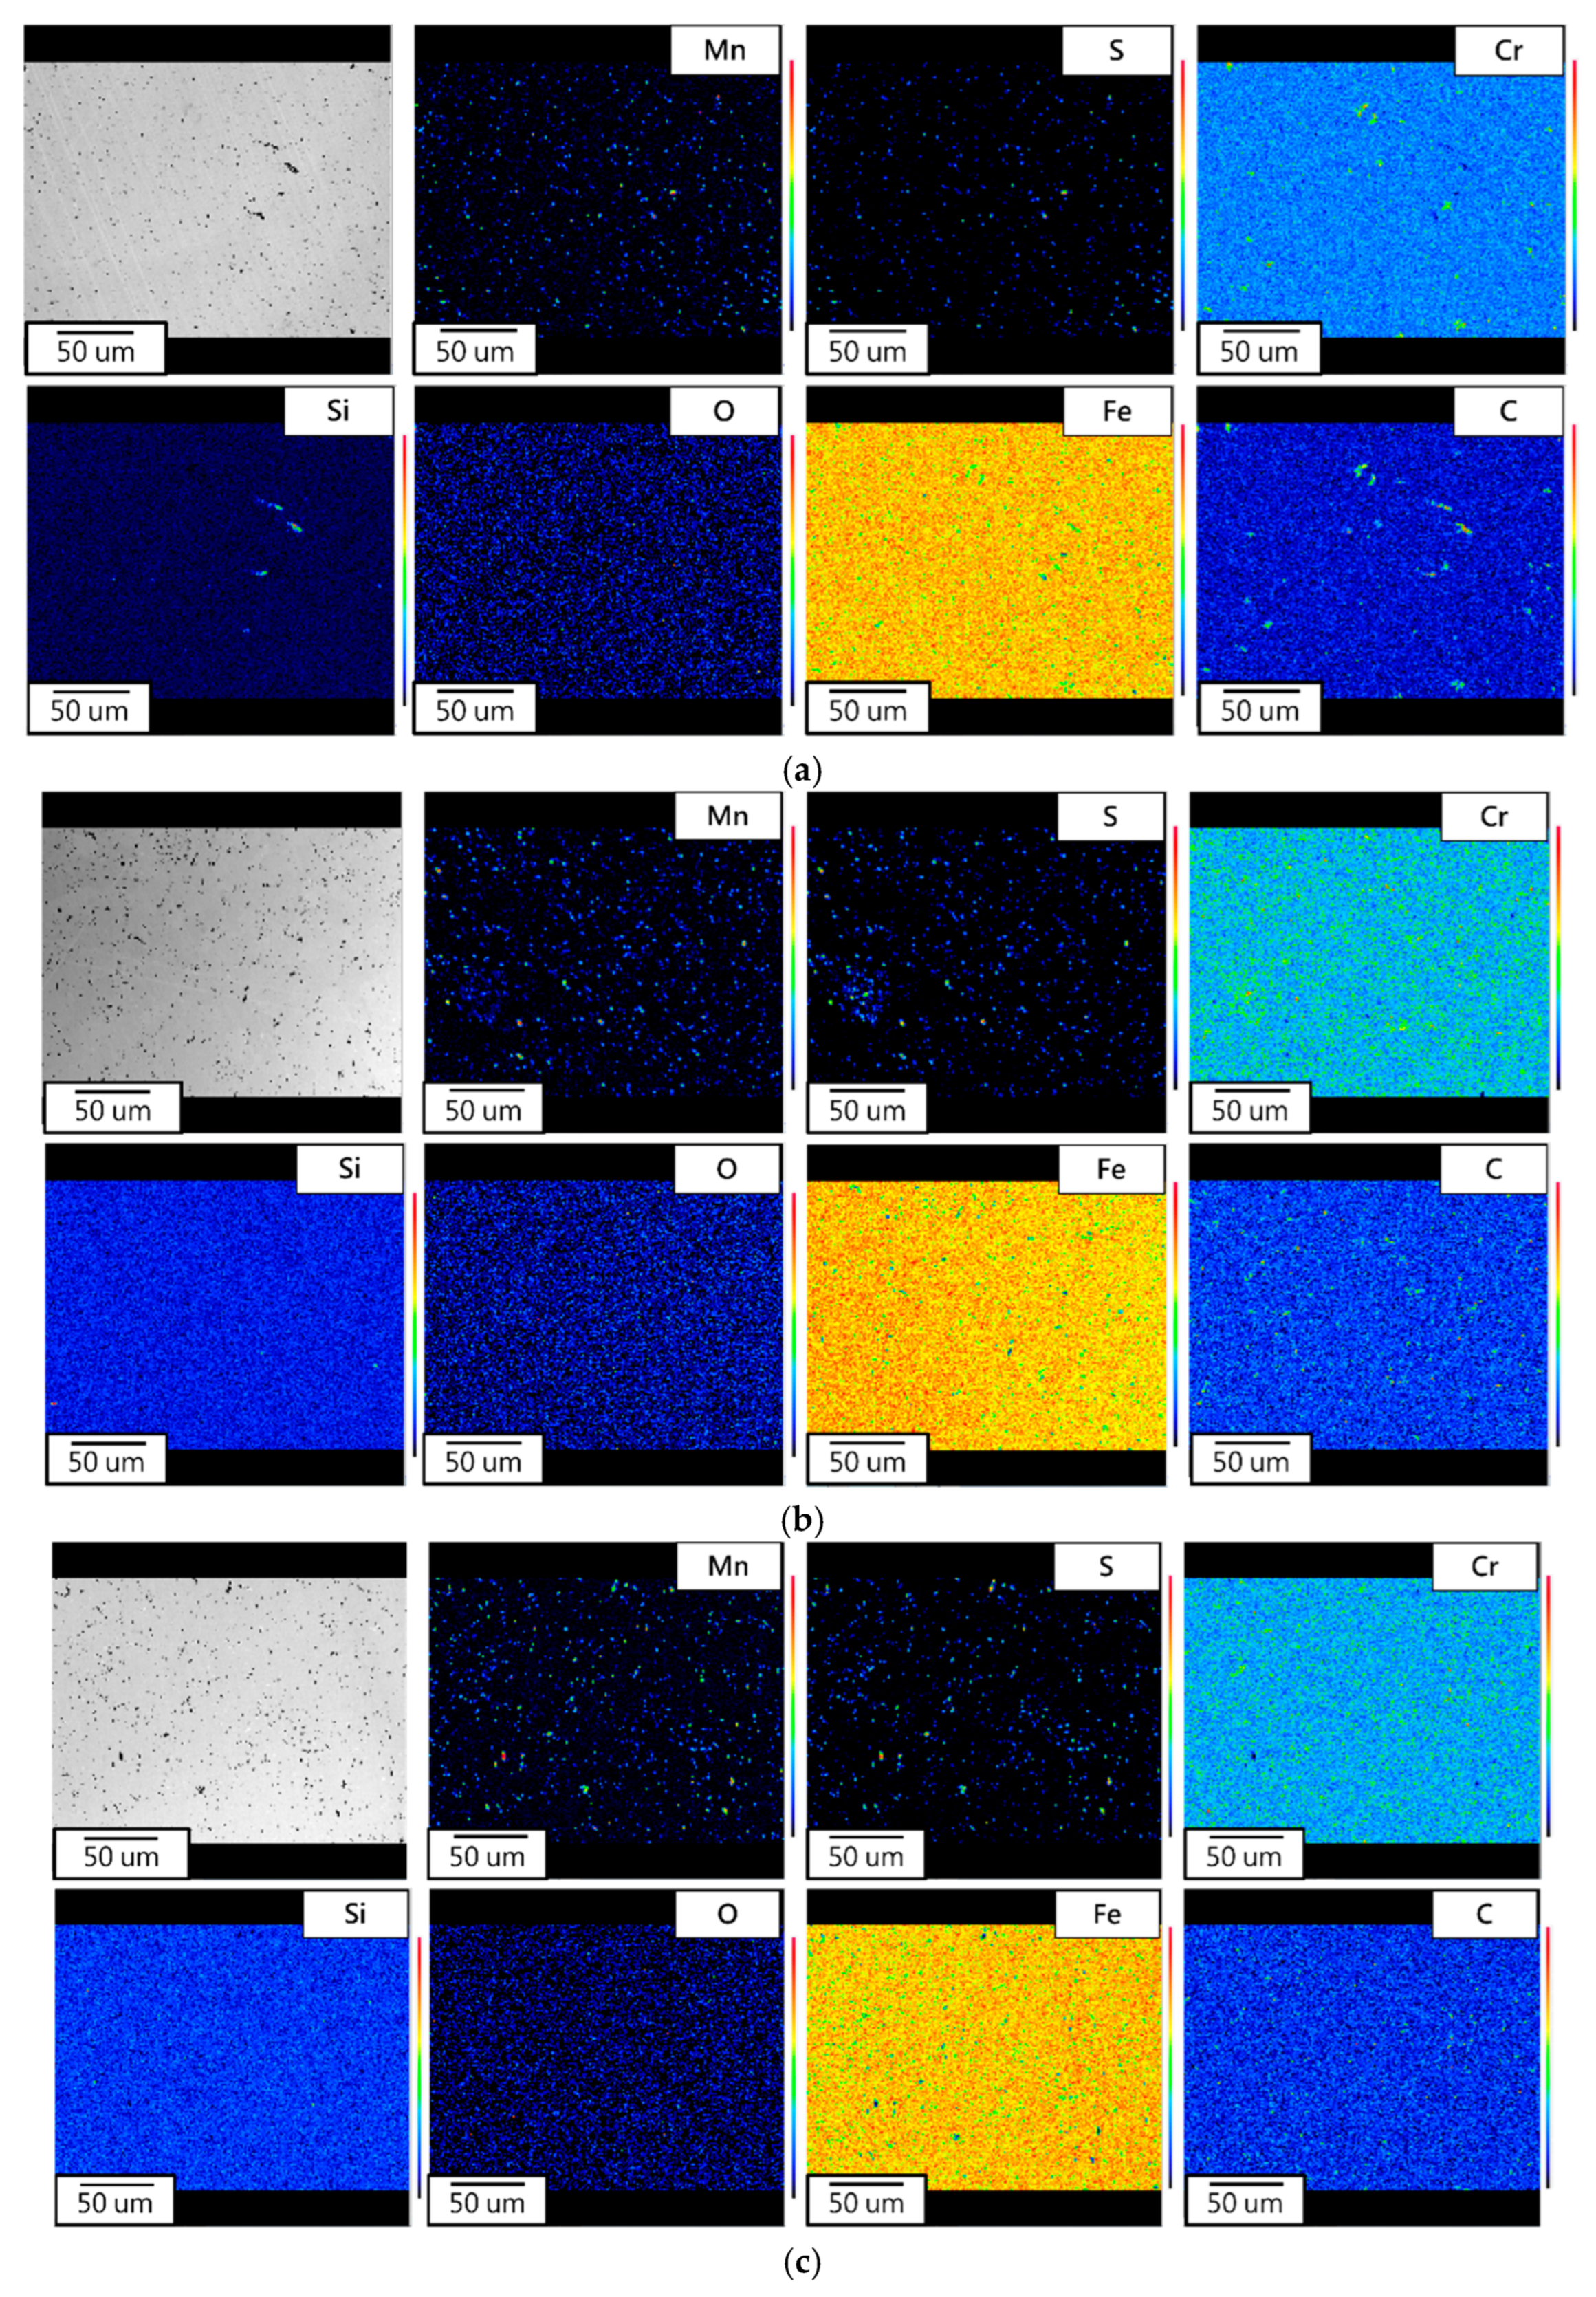
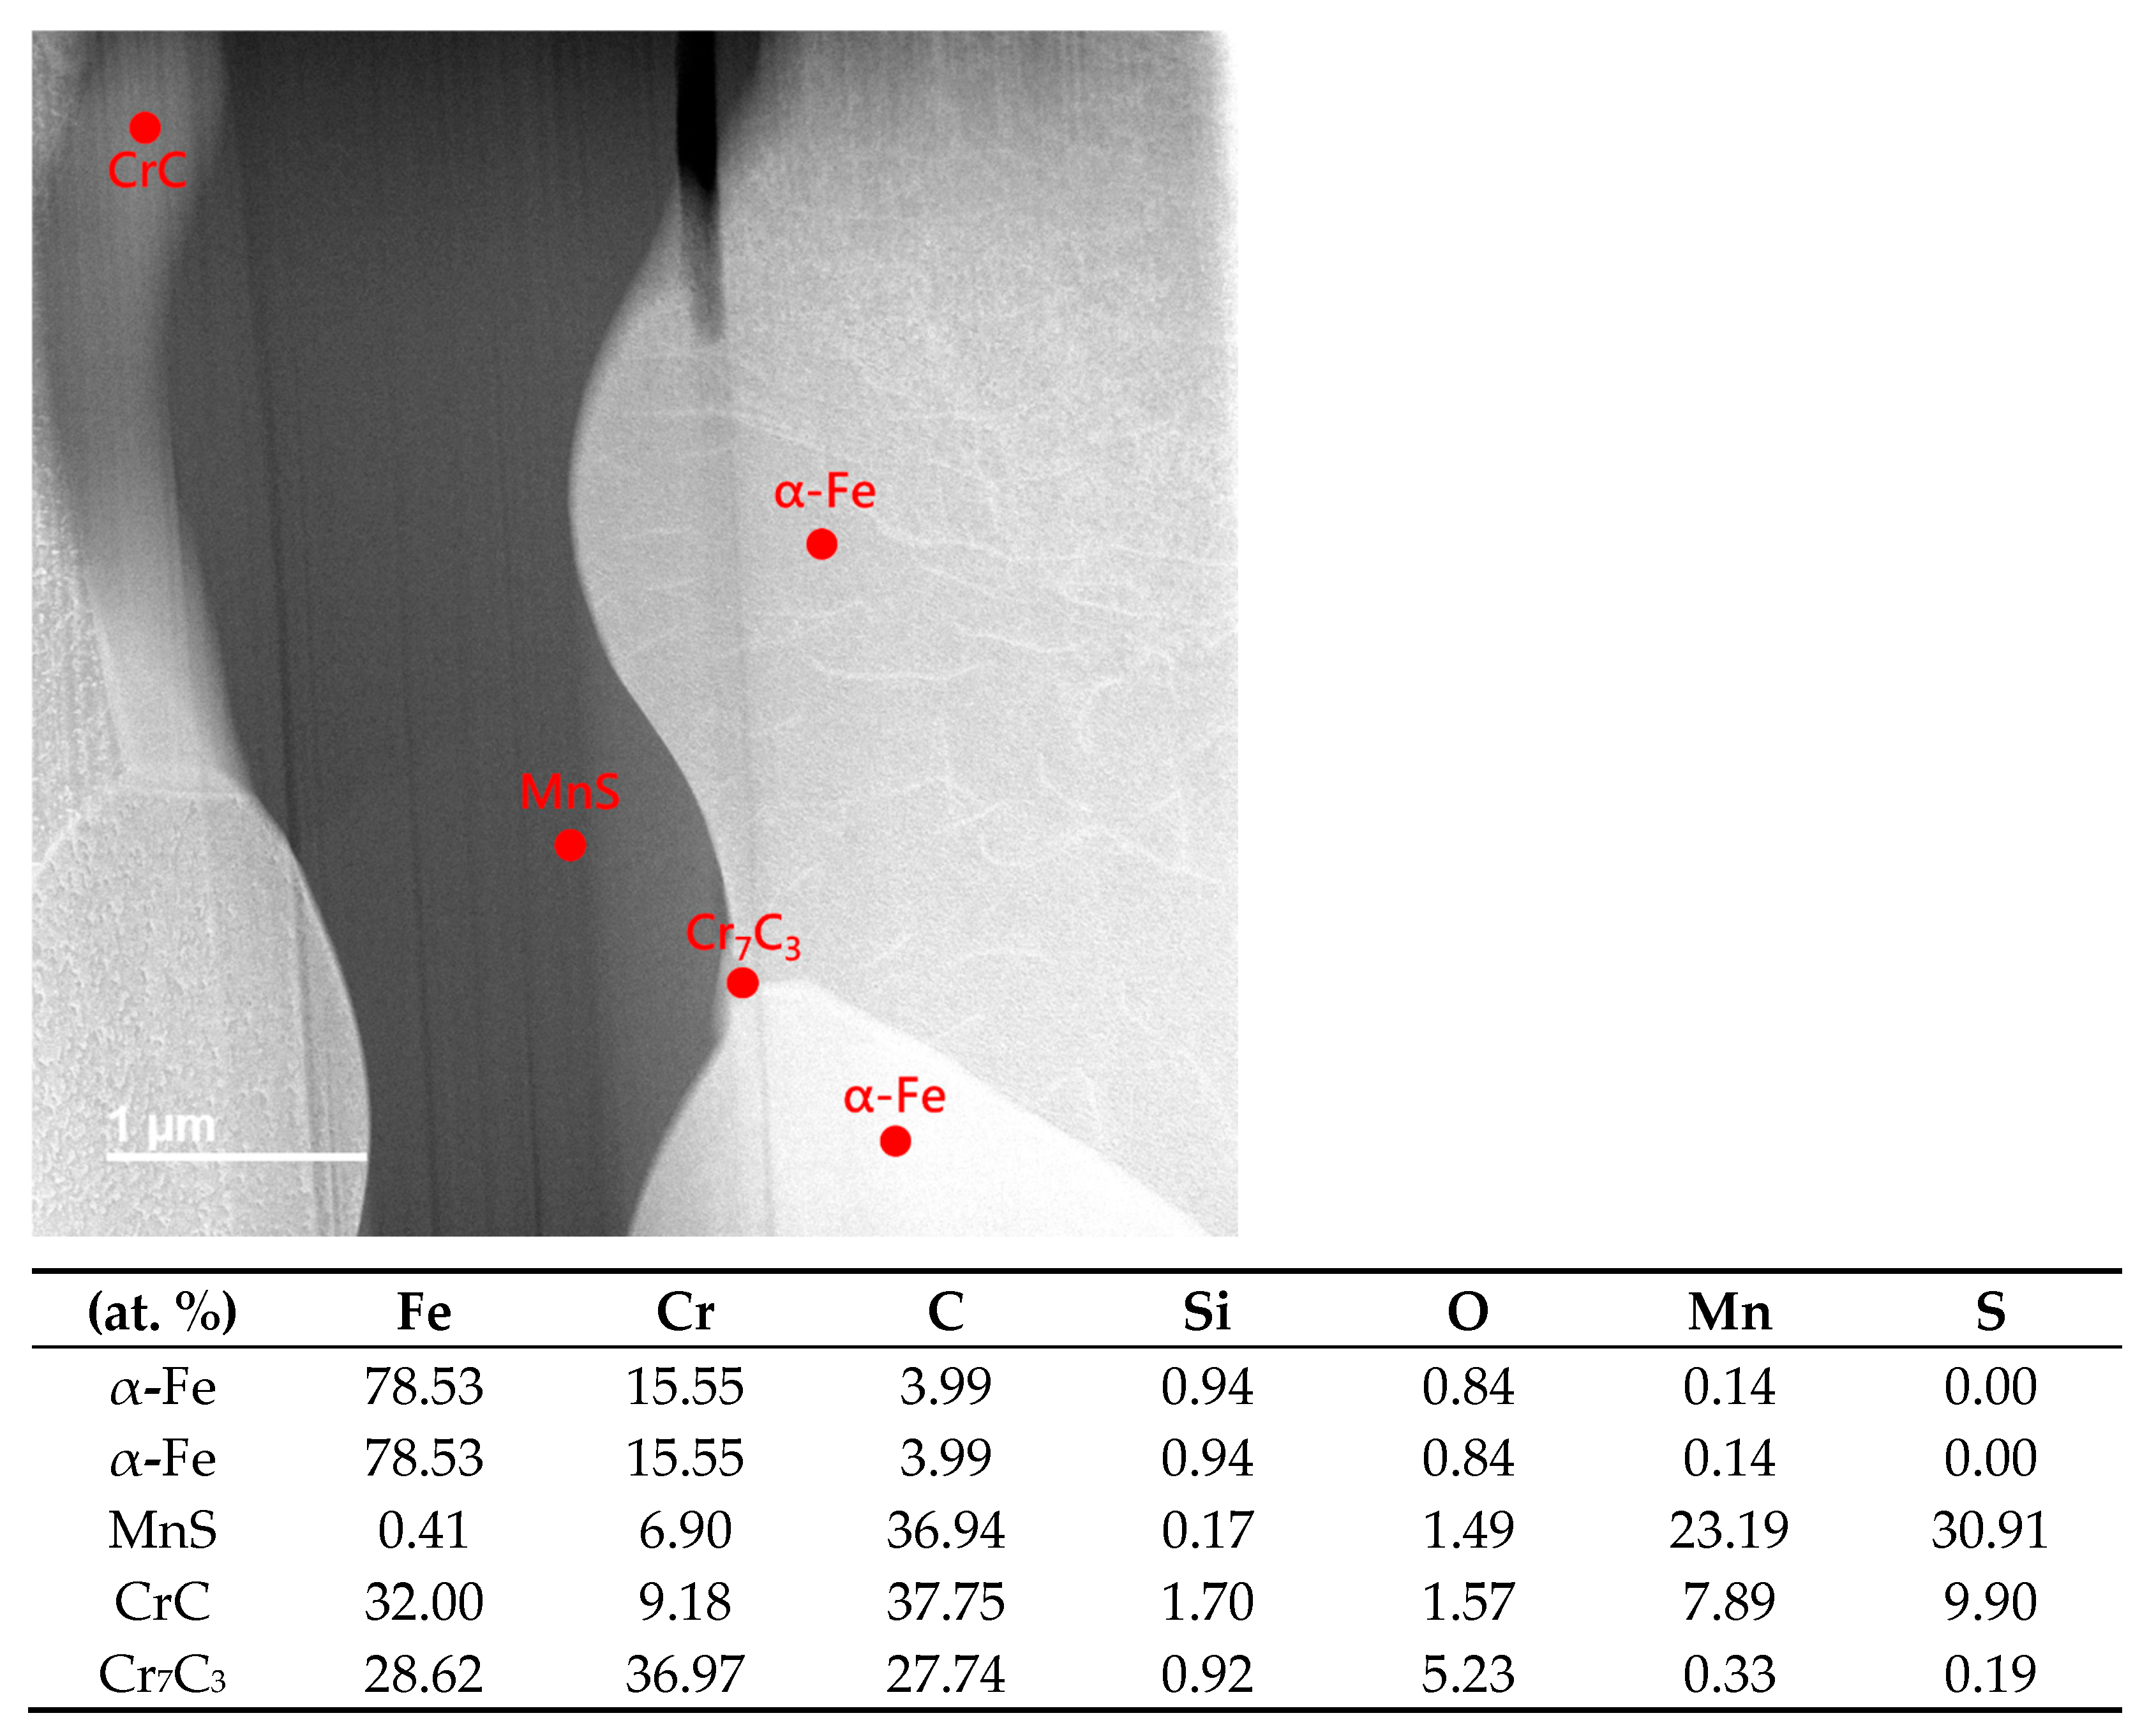
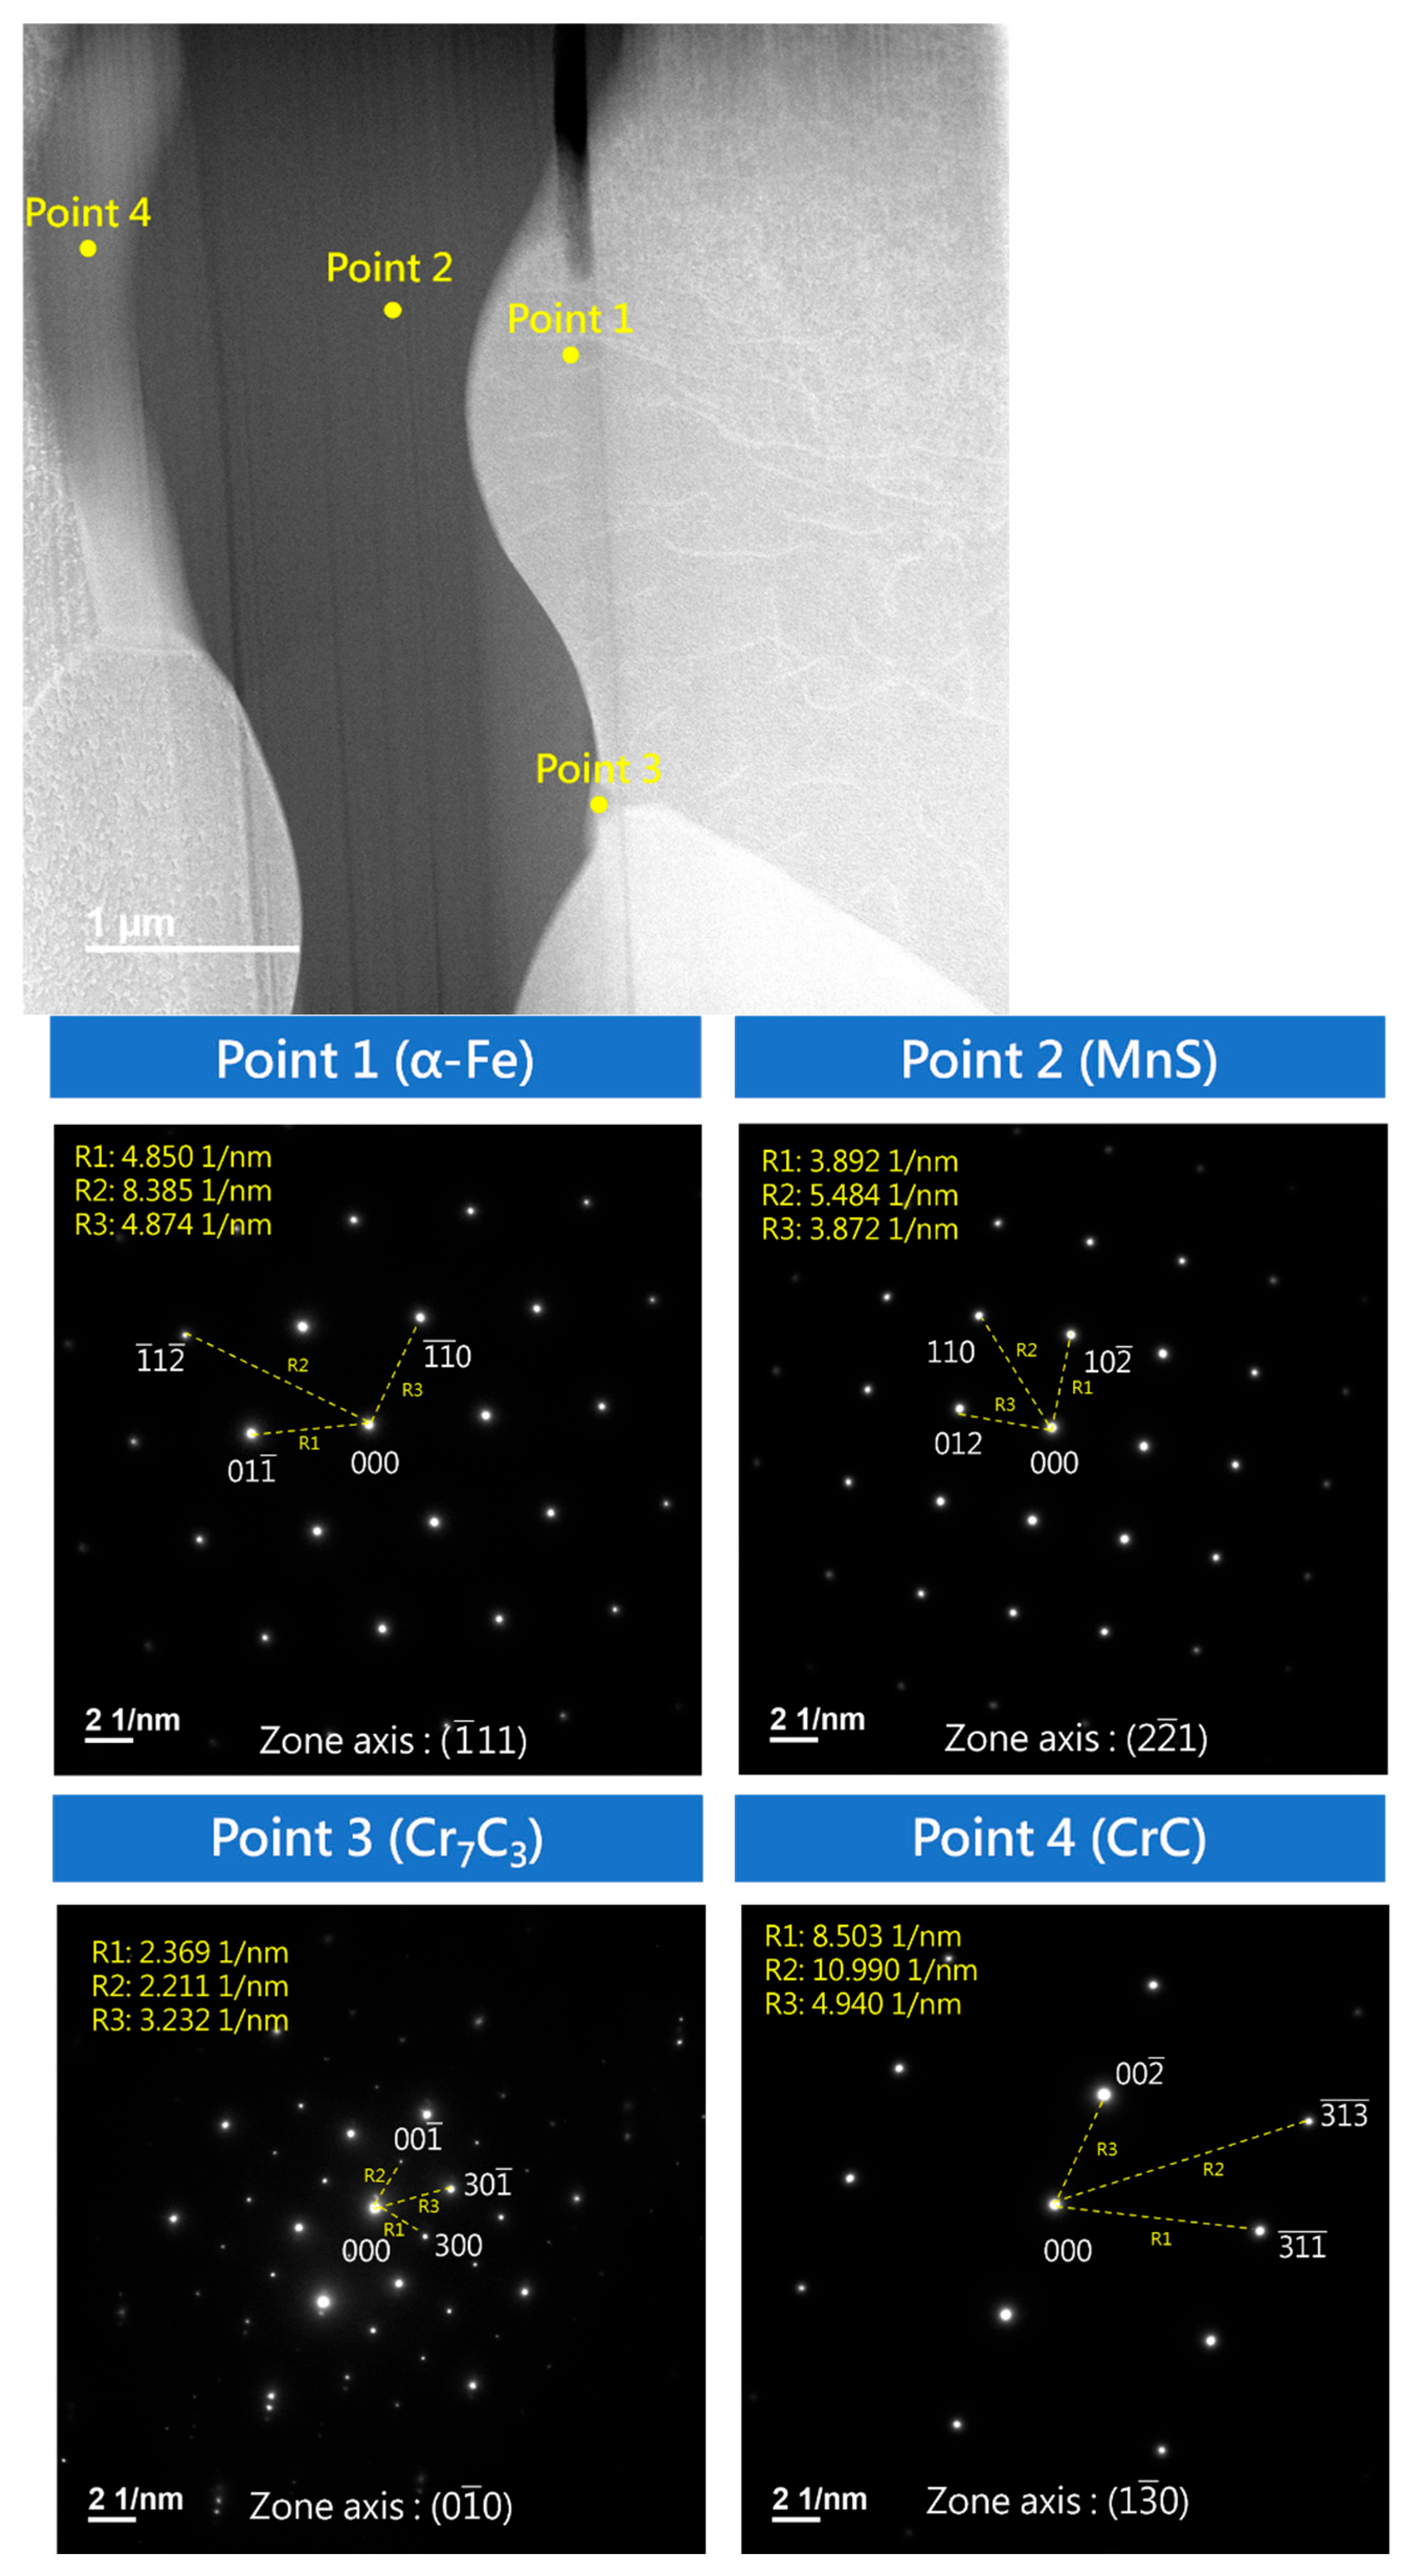
3.4. Surface Element Analysis and Related Mechanisms
4. Limitation
5. Conclusions
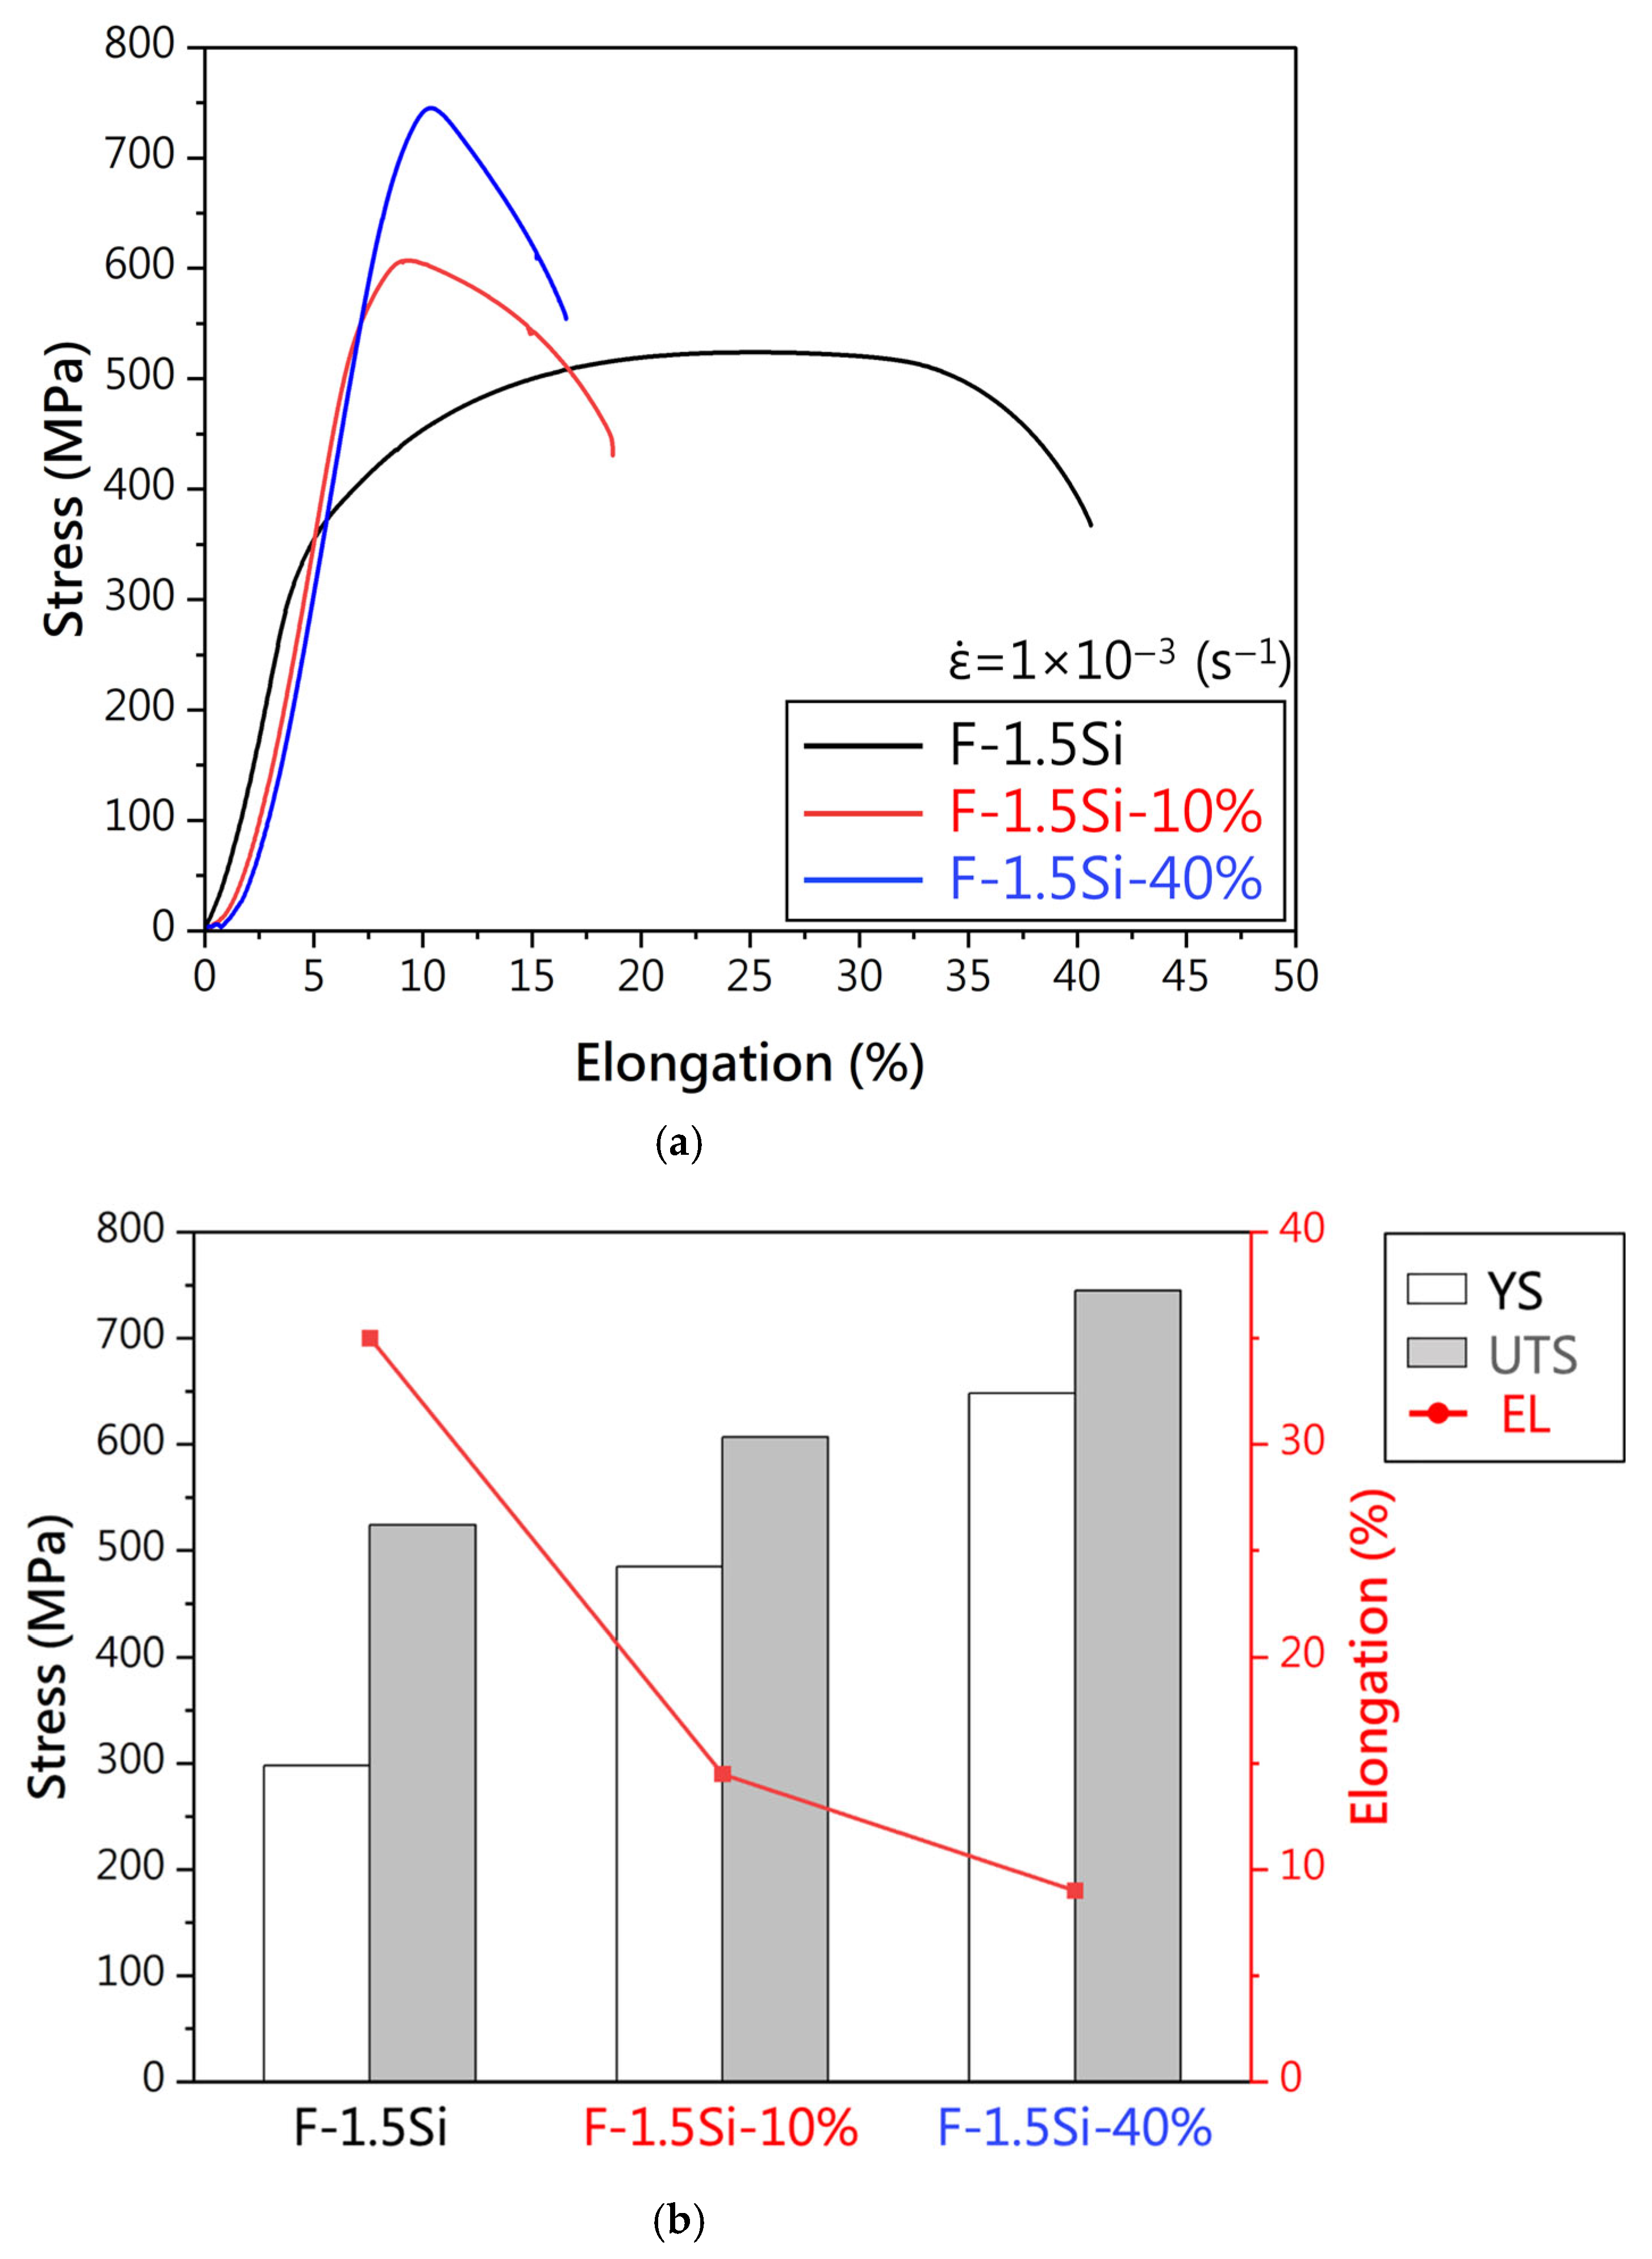
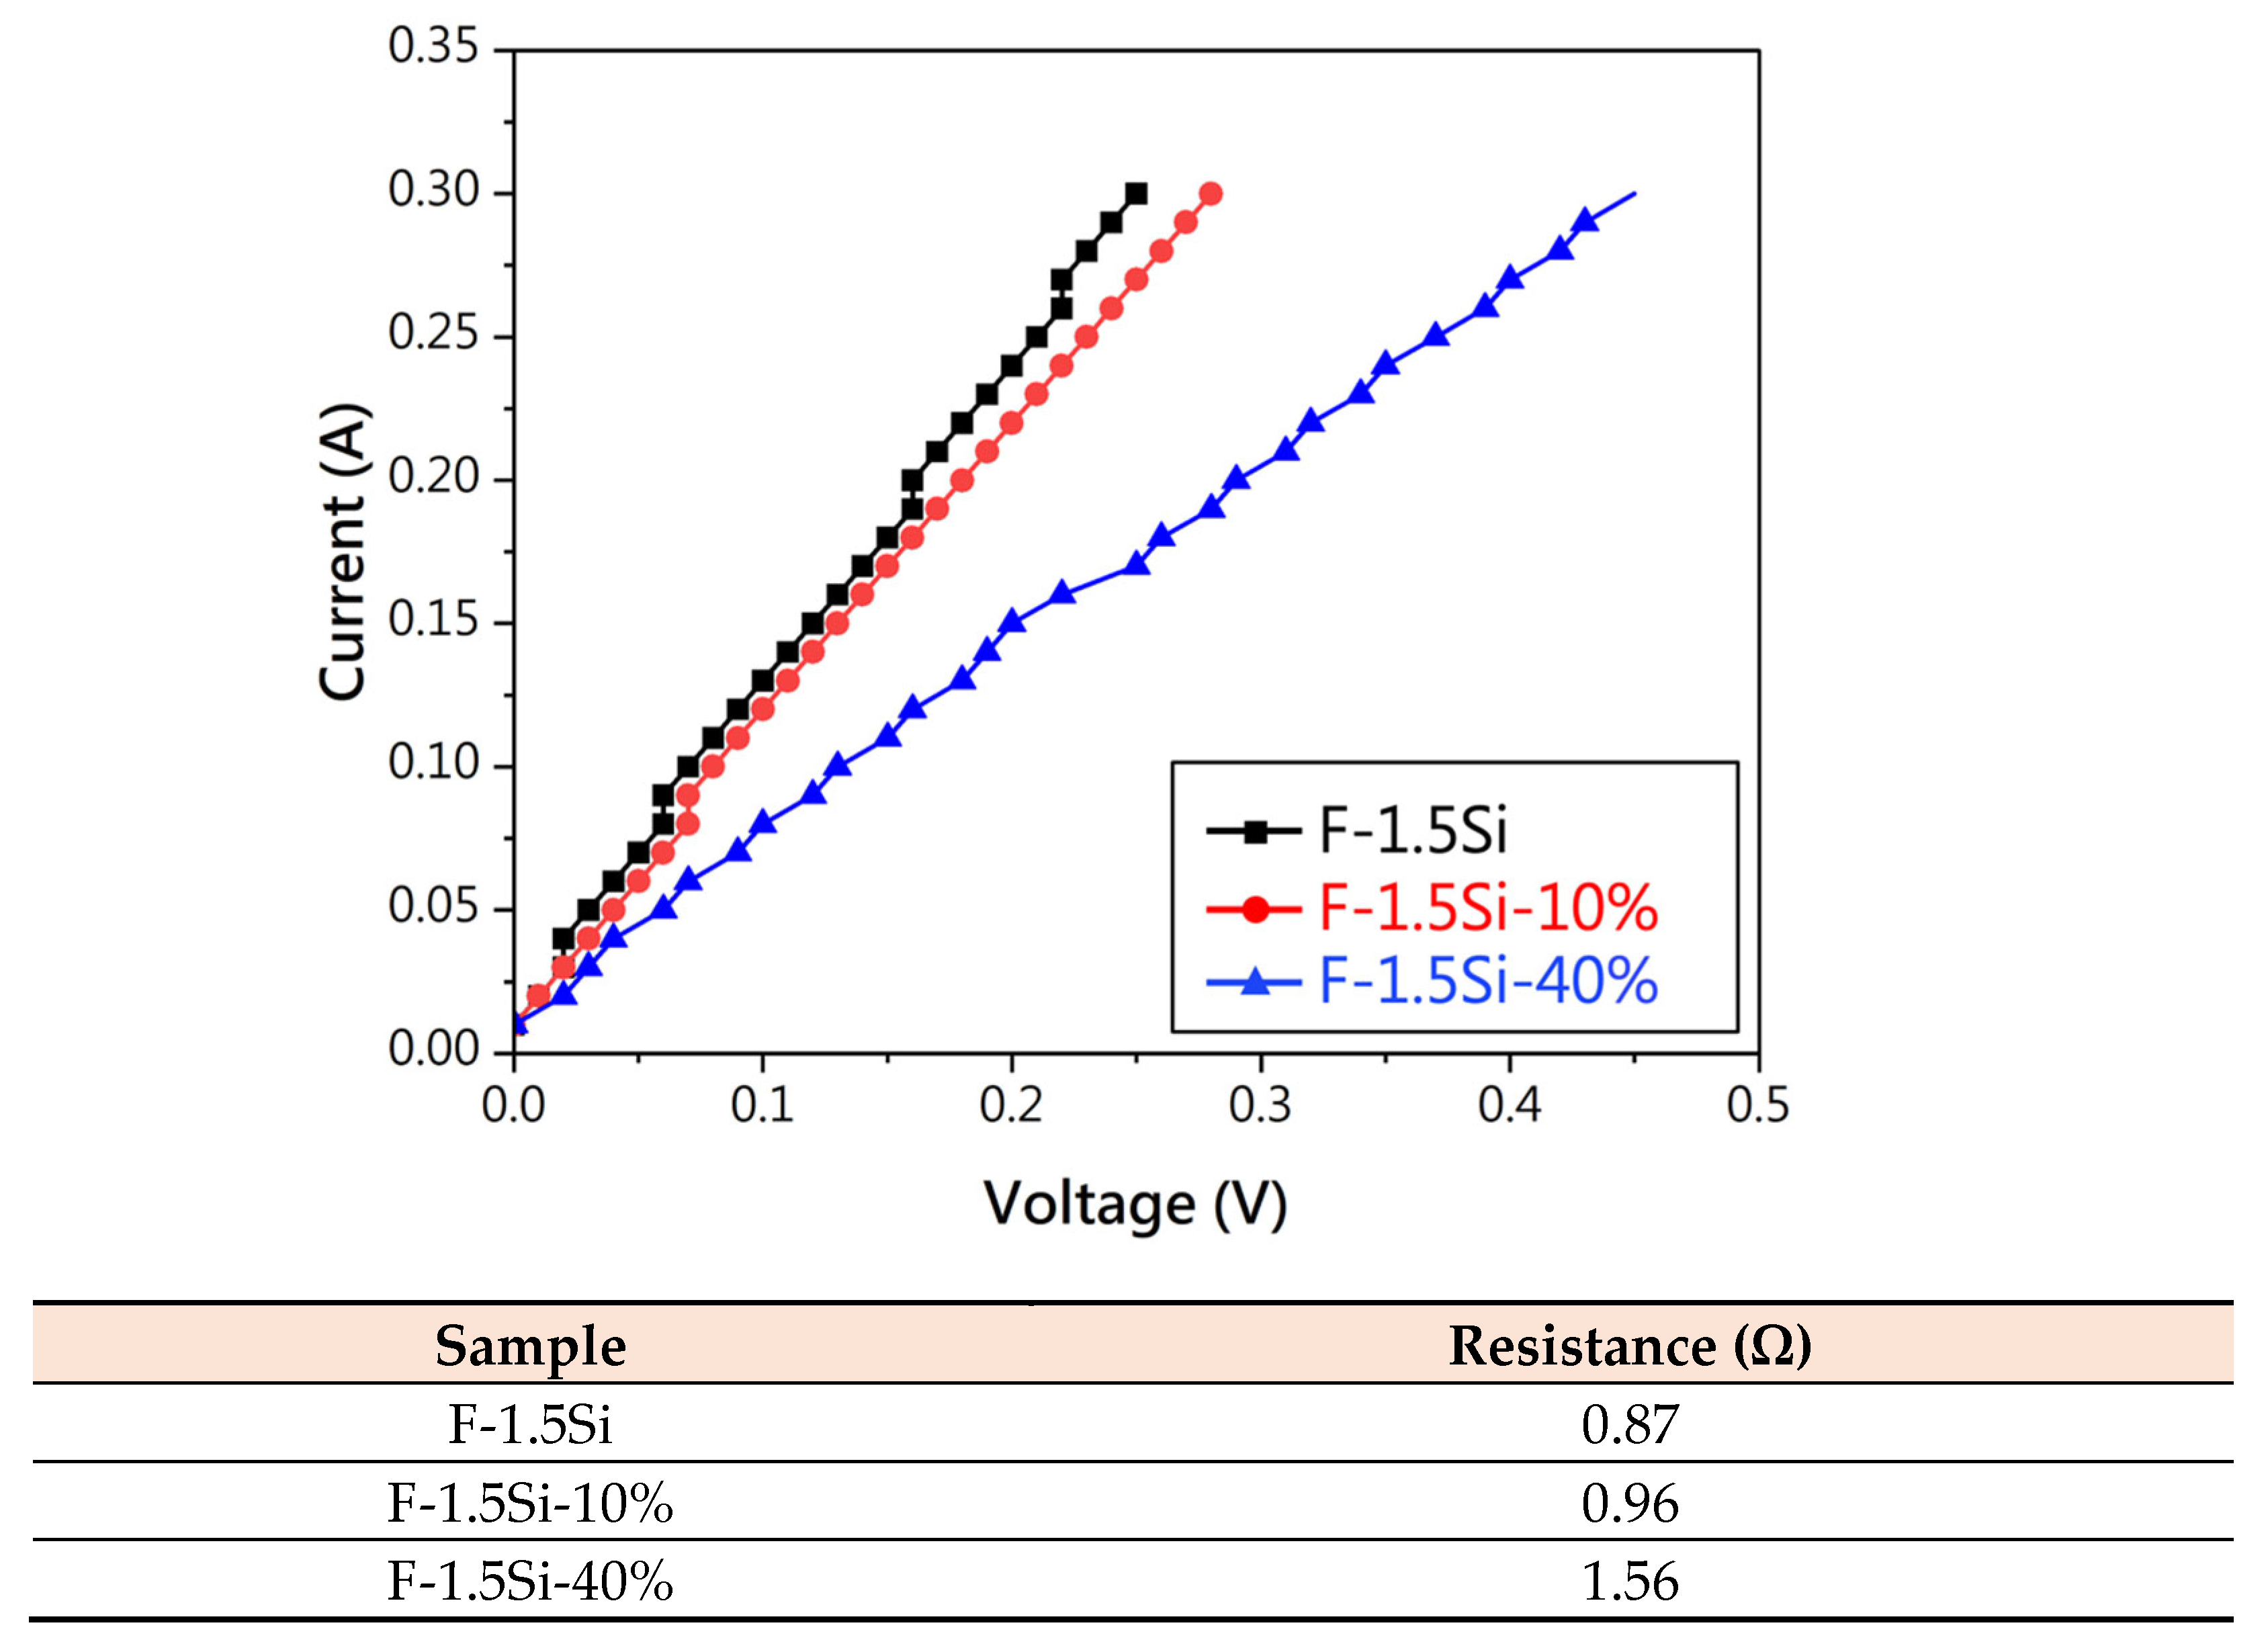
- Increasing the cold working rate of F-1.5Si effectively enhances its mechanical properties. However, no significant changes in corrosion resistance were observed under different cold working rates.
- After atmospheric magnetic annealing, the grain size of F-1.5Si with different cold working rates is reduced, and partial recrystallization occurs in the matrix, resulting in uniform hardness and increased yield strength. Additionally, atmospheric magnetic annealing effectively reduces the material’s coercive force (Hc).
- Hydrogen magnetic annealing leads to a reduction in grain size and hardness. Regarding yield strength and magnetic properties, the F-1.5Si-10% material exhibited the best electromagnetic application performance after hydrogen magnetic annealing.
- The TEM analysis revealed that the second phase, manganese sulfide (MnS), has an FCC structure and exhibits diamagnetic behavior. This indicates that MnS precipitation can stabilize the BCC structure of the matrix, thereby enhancing its soft magnetic properties.
Author Contributions
Funding
Data Availability Statement
Acknowledgments
Conflicts of Interest
References
- Jia, X.; Li, Y.; Xie, G.; Qi, T.; Zhang, W. Role of Mo addition on structure and magnetic properties of the Fe85Si2B8P4Cu1 nanocrystalline alloy. J. Non-Cryst. Solids 2018, 481, 590–593. [Google Scholar] [CrossRef]
- Fiorillo, F.; Bertotti, G.; Appino, C.; Pasquale, M. Soft magnetic materials. In Wiley Encyclopedia of Electrical and Electronics Engineering; John Wiley Sons, Inc.: Hoboken, NJ, USA, 2016; pp. 1–42. [Google Scholar]
- Lashgari, H.R.; Chu, D.; Xie, S.; Sun, H.; Ferry, M.; Li, S. Composition dependence of the microstructure and soft magnetic properties of Fe-based amorphous/nanocrystalline alloys: A review study. J. Non-Cryst. Solids 2014, 391, 61–82. [Google Scholar] [CrossRef]
- Ho, K. A constitutive model for the frequency dependence of magnetic hysteresis. Phys. B Condens. Matter 2014, 450, 143–145. [Google Scholar] [CrossRef]
- Mostaan, H.; Rafiei, M. Prediction and optimization of magnetic properties of laser welded AISI 430 Stainless steels. Arch. Metall. Mater. 2018, 63, 1673–1682. [Google Scholar] [CrossRef]
- Zhang, X.; Wen, Z.; Dou, R.; Zhou, G.; Li, Z. Evolution of microstructure and mechanical properties of cold-rolled SUS430 stainless steel during a continuous annealing process. Mater. Sci. Eng. A 2014, 598, 22–27. [Google Scholar] [CrossRef]
- Levchuk, L.; Shkarban, R.; Kotenko, I.; Graivoronska, K.; Fesenko, O.; Lukianenko, I.; Verbytska, T.; Makogon, I.; Barabash, M. Changes in raman spectra upon formation of ordered l10 FePd phase during annealing in vacuum and in hydrogen atmosphere. Thin Solid Films 2024, 789, 140200. [Google Scholar] [CrossRef]
- Lu, C.W.; Hung, F.Y.; Chang, T.W.; Hsieh, H.Y. Study and application on the electromagnetic stainless steel: Microstructure, tensile mechanical behavior, and magnetic properties. Materials 2024, 17, 2998. [Google Scholar] [CrossRef] [PubMed]
- Yao, Y.D.; Yen, T.Y.; Chen, J.Y. Electrical resistivity and magnetization studies of some commercial steels. Phys. Status Solidi 1986, 98, 285–289. [Google Scholar] [CrossRef]
- Hinton, J.S.; Beynon, J.H. A laboratory steckel mill simulation. Steel Res. Int. 2008, 79, 278–286. [Google Scholar] [CrossRef]
- Chang, Y.T.; Hung, F.Y.; Wu, B.D. Comparison of the microstructural characteristics and the electrothermal fracture mechanism of Au-Pd-Coated Copper wire and Cu-Ti micro-alloyed wire. J. Electron. Mater. 2024, 53, 1695–1707. [Google Scholar] [CrossRef]
- ASTM A262; Standard Practices for Detecting Susceptibility to Intergranular Attack in Austenitic Stainless Steels. American Society for Testing and Materials: West Conshohocken, PA, USA, 2011.
- Yang, K.; Gou, H.; Zhang, B.; Huang, R.; Li, H.; Lu, M.; Zhang, X.; Zhang, J. Microstructures and fracture features of cold-rolled low carbon steel sheet after annealing and mechanical stress concurrently loaded. Mater. Sci. Eng. A 2009, 502, 126–130. [Google Scholar] [CrossRef]
- Karolik, A.S.; Luhvich, A.A. Calculation of electrical resistivity produced by dislocations and grain boundaries in metals. J. Phys. Condens. Matter 1994, 6, 873–880. [Google Scholar] [CrossRef]
- Yaegashi, K. Dependence of magnetic susceptibility on dislocation density in tensile deformed iron and Mn-steel. ISIJ Int. 2007, 47, 327–332. [Google Scholar] [CrossRef]
- Meletis, E.I.; Lian, K. A vacancy/dislocation interaction mechanism of transgranular stress corrosion cracking. J. Mech. Behav. Mater. 1995, 6, 69–84. [Google Scholar] [CrossRef]
- Wang, J.A.; Chen, Y.; Luo, L.; Chen, J.; He, Y. Influence of cold rolling on the recrystallization texture and ridging of AISI 430 type ferritic stainless steel. J. Mater. Eng. Perform. 2021, 30, 3342–3351. [Google Scholar] [CrossRef]
- Hansen, N.; Jensen, D.J. Development of microstructure in FCC metals during cold work. Philos. Trans. R. Soc. London. Ser. A Math. Phys. Eng. Sci. 1999, 357, 1447–1469. [Google Scholar] [CrossRef]
- Bishara, H.; Lee, S.; Brink, T.; Ghidelli, M.; Dehm, G. Understanding grain boundary electrical resistivity in Cu: The effect of boundary structure. ACS Nano 2021, 15, 16607–16615. [Google Scholar] [CrossRef] [PubMed]
- Smialowski, M. Hydrogen in Steel: Effect of Hydrogen on Iron and Steel During Production, Fabrication, and Use; Elsevier: Amsterdam, The Netherlands, 2014. [Google Scholar]
- Neeraj 2014, T.; Srinivasan, R.; Li, J. Hydrogen embrittlement of ferritic steels: Observations on deformation microstructure, nanoscale dimples and failure by nanovoiding. Acta Mater. 2012, 60, 5160–5171. [Google Scholar] [CrossRef]
- Calin, M.D.; Helerea, E.; Oltean, I.D. New considerations regarding frequency influence on soft magnetic materials characteristics. In Proceedings of the 2010 3rd International Symposium on Electrical and Electronics Engineering (ISEEE), Galati, Romania, 16–18 September 2010; pp. 39–44. [Google Scholar]


| wt. (%) | Fe | Cr | C | Si | Mo | Mn | S | P |
|---|---|---|---|---|---|---|---|---|
| F-1.5Si | Bal. | 16–18 | 0.12 | 1.50 | - | 1.25 | 0.15 min | 0.06 |
| Magnetic Annealing Parameters | Name |
|---|---|
| 850 °C, 4 h, AC in air | (MA) |
| 760 °C, 4 h, FC in H2 | (H2) |
| 10 Hz | Bm (mT) | Br (mT) | Hc (A/m) |
|---|---|---|---|
| F-1.5Si | 941 | 482 | 418 |
| F-1.5Si-10% | 636 | 309 | 690 |
| F-1.5Si-40% | 7331 | 405 | 899 |
| F-1.5Si (MA) | 940 | 429 | 322 |
| F-1.5Si-10% (MA) | 937 | 403 | 286 |
| F-1.5Si-40% (MA) | 1008 | 435 | 311 |
| F-1.5Si (H2) | 968 | 431 | 347 |
| F-1.5Si-10% (H2) | 973 | 386 | 293 |
| F-1.5Si-40% (H2) | 964 | 449 | 318 |
| 100 Hz | Bm (mT) | Br (mT) | Hc (A/m) |
| F-1.5Si | 937 | 510 | 604 |
| F-1.5Si-10% | 636 | 318 | 790 |
| F-1.5Si-40% | 730 | 411 | 997 |
| F-1.5Si (MA) | 942 | 461 | 479 |
| F-1.5Si-10% (MA) | 937 | 442 | 455 |
| F-1.5Si-40% (MA) | 1010 | 479 | 478 |
| F-1.5Si (H2) | 970 | 468 | 520 |
| F-1.5Si-10% (H2) | 973 | 432 | 473 |
| F-1.5Si-40% (H2) | 967 | 485 | 489 |
| 1000 Hz | Bm (mT) | Br (mT) | Hc (A/m) |
| F-1.5Si | 914 | 612 | 1257 |
| F-1.5Si-10% | 619 | 373 | 1241 |
| F-1.5Si-40% | 708 | 450 | 1392 |
| F-1.5Si (MA) | 925 | 580 | 1059 |
| F-1.5Si-10% (MA) | 931 | 583 | 1084 |
| F-1.5Si-40% (MA) | 981 | 624 | 1101 |
| F-1.5Si (H2) | 940 | 599 | 1140 |
| F-1.5Si-10% (H2) | 860 | 551 | 1197 |
| F-1.5Si-40% (H2) | 945 | 606 | 1091 |
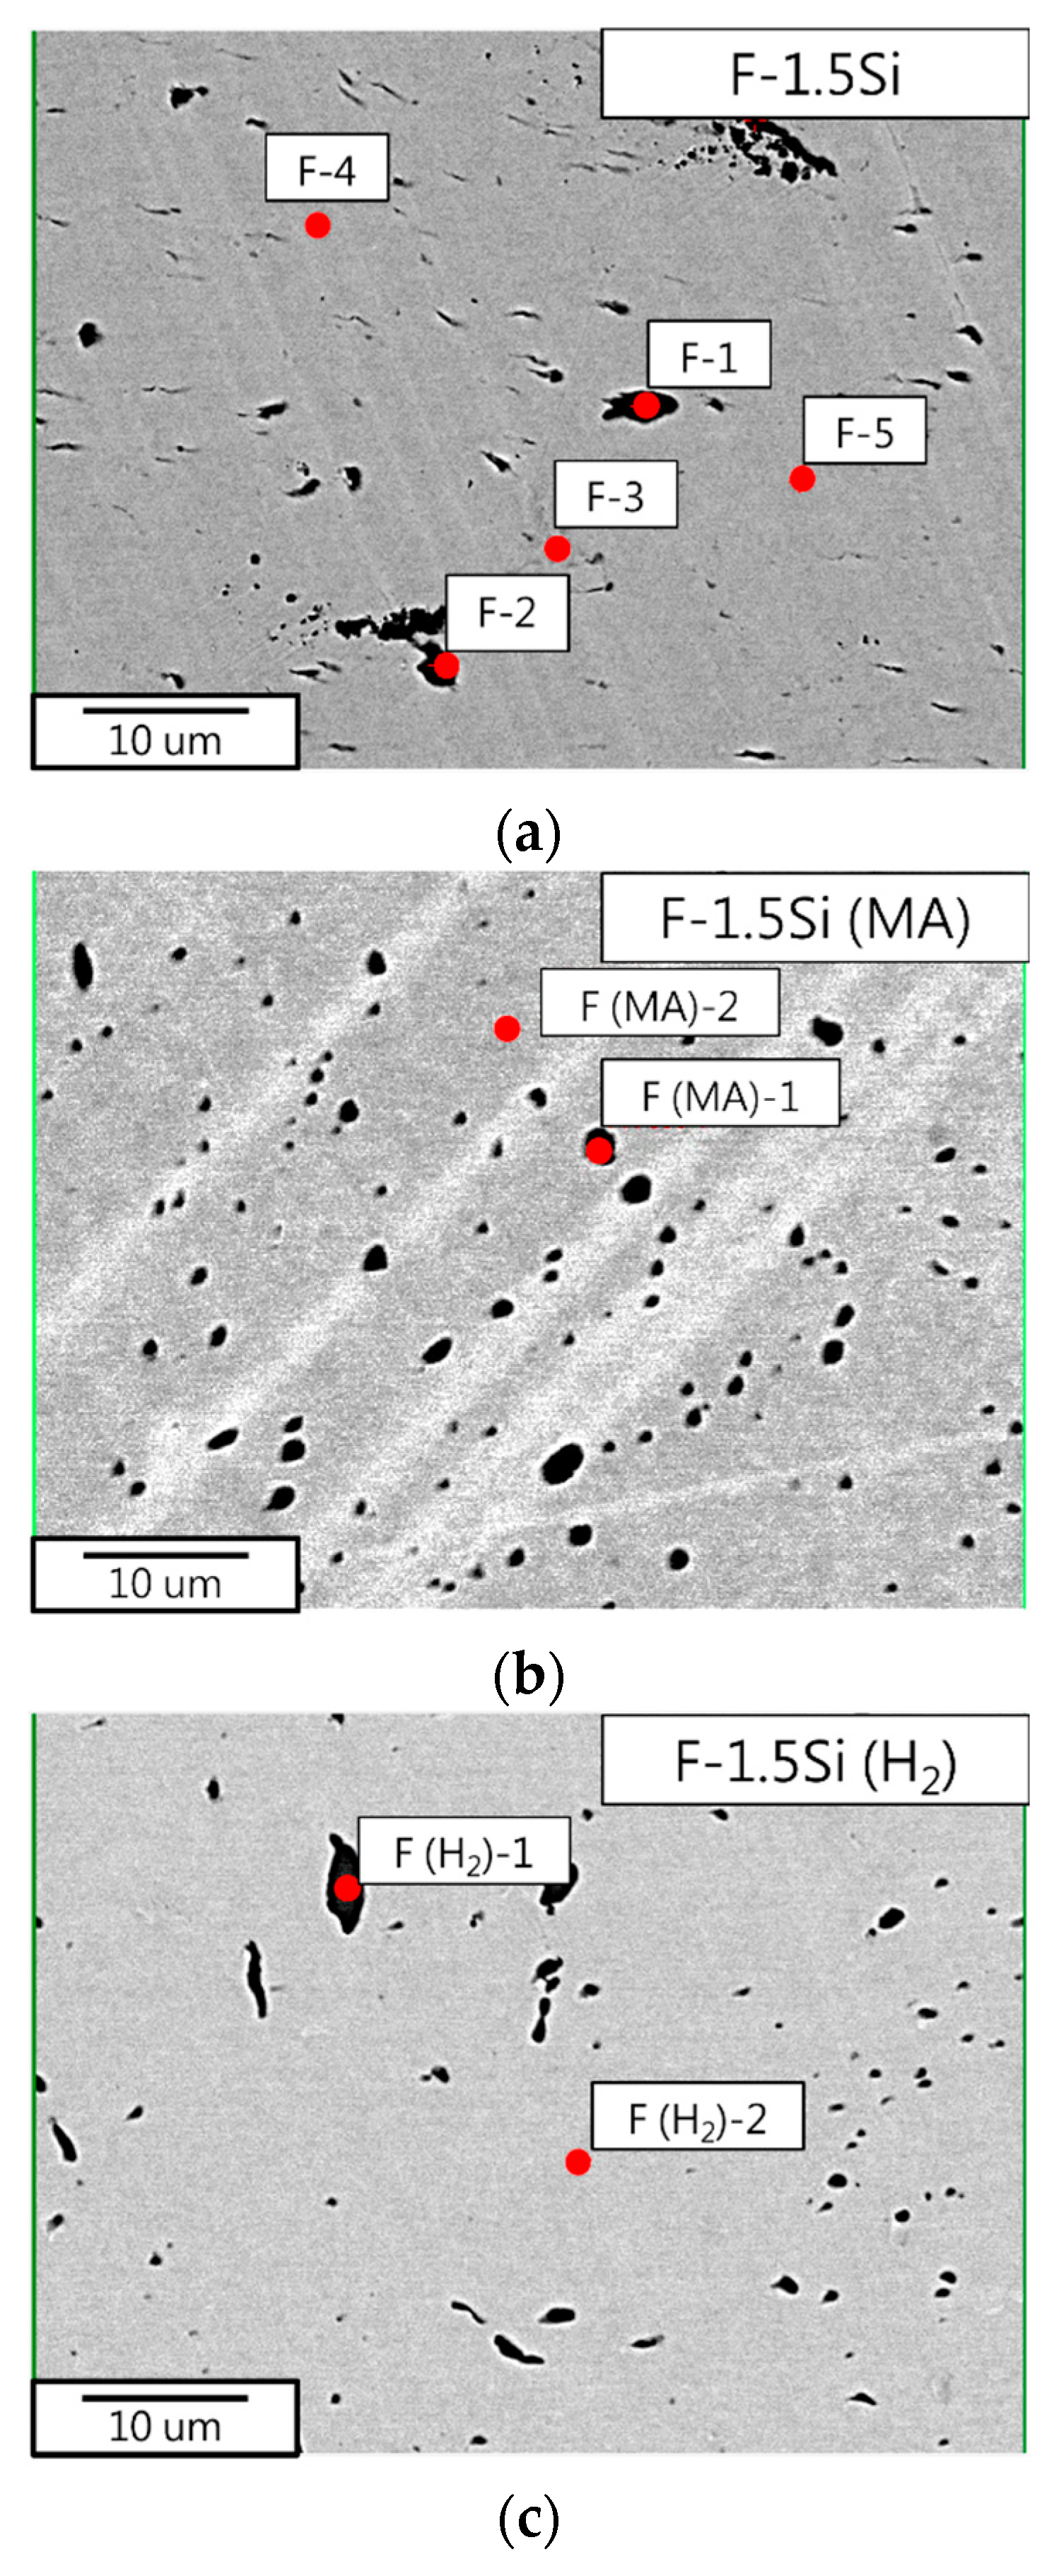
| F-1.5Si | |||||||
|---|---|---|---|---|---|---|---|
| (at. %) | C | O | Si | Fe | Cr | Mn | S |
| F-1 | 2.11 | 0.00 | 0.41 | 10.61 | 10.01 | 36.63 | 40.23 |
| F-2 | 1.80 | 0.00 | 0.35 | 11.09 | 10.92 | 36.80 | 39.04 |
| F-3 | 8.52 | 0.00 | 1.90 | 65.34 | 24.02 | 0.22 | 0.00 |
| F-4 | 1.45 | 0.00 | 2.46 | 77.94 | 17.87 | 0.25 | 0.03 |
| F-5 | 1.29 | 0.00 | 2.34 | 77.71 | 18.32 | 0.27 | 0.07 |
| F-1.5Si (MA) | |||||||
| (at. %) | C | O | Si | Fe | Cr | Mn | S |
| F (MA)-1 | 1.96 | 0.00 | 0.55 | 16.20 | 19.56 | 28.97 | 32.76 |
| F (MA)-2 | 1.04 | 0.00 | 2.43 | 78.13 | 18.26 | 0.11 | 0.03 |
| F-1.5Si (H2) | |||||||
| (at. %) | C | O | Si | Fe | Cr | Mn | S |
| F (H2)-1 | 2.34 | 0.00 | 0.04 | 2.43 | 6.14 | 45.14 | 43.91 |
| F (H2)-2 | 1.19 | 0.00 | 2.23 | 78.11 | 18.15 | 0.27 | 0.05 |
Disclaimer/Publisher’s Note: The statements, opinions and data contained in all publications are solely those of the individual author(s) and contributor(s) and not of MDPI and/or the editor(s). MDPI and/or the editor(s) disclaim responsibility for any injury to people or property resulting from any ideas, methods, instructions or products referred to in the content. |
© 2025 by the authors. Licensee MDPI, Basel, Switzerland. This article is an open access article distributed under the terms and conditions of the Creative Commons Attribution (CC BY) license (https://creativecommons.org/licenses/by/4.0/).
Share and Cite
Lu, C.-W.; Hung, F.-Y.; Chang, T.-W. Microstructure, Mechanical Properties, and Magnetic Properties of 430 Stainless Steel: Effect of Critical Cold Working Rate and Heat Treatment Atmosphere. Metals 2025, 15, 868. https://doi.org/10.3390/met15080868
Lu C-W, Hung F-Y, Chang T-W. Microstructure, Mechanical Properties, and Magnetic Properties of 430 Stainless Steel: Effect of Critical Cold Working Rate and Heat Treatment Atmosphere. Metals. 2025; 15(8):868. https://doi.org/10.3390/met15080868
Chicago/Turabian StyleLu, Che-Wei, Fei-Yi Hung, and Tsung-Wei Chang. 2025. "Microstructure, Mechanical Properties, and Magnetic Properties of 430 Stainless Steel: Effect of Critical Cold Working Rate and Heat Treatment Atmosphere" Metals 15, no. 8: 868. https://doi.org/10.3390/met15080868
APA StyleLu, C.-W., Hung, F.-Y., & Chang, T.-W. (2025). Microstructure, Mechanical Properties, and Magnetic Properties of 430 Stainless Steel: Effect of Critical Cold Working Rate and Heat Treatment Atmosphere. Metals, 15(8), 868. https://doi.org/10.3390/met15080868