Article

The Influence of Temperature on the Fracture Toughness and Fracture Mechanism of Ferritic Nodular Cast Iron

1
Nuclear Equipment Safety & Reliability Center, China Productivity Center for Machinery Co., Ltd., Beijing 100083, China
2
National Center for Materials Service Safety, University of Science and Technology Beijing, Beijing 100083, China
*
Author to whom correspondence should be addressed.
Metals 2025, 15(8), 828; https://doi.org/10.3390/met15080828
Submission received: 18 June 2025 / Revised: 11 July 2025 / Accepted: 14 July 2025 / Published: 23 July 2025
(This article belongs to the Special Issue Fracture and Fatigue of Advanced Metallic Materials)

Abstract

Nodular Cast Iron (NCI, also known as ductile iron) is widely used in important components such as crankshafts for automotive engines and internal combustion engines, as well as storage and transportation containers for spent fuel in nuclear power plants, due to its good comprehensive mechanical properties such as strength, toughness, and wear resistance. The effect of temperature on the fracture behavior of NCI was investigated using compact tensile (CT) specimens at different temperatures. The results showed that the conditional fracture toughness parameter (KQ) of the NCI specimens firstly increased and then decreased with decreasing temperature. The crack tip opening displacement δm shows a significant ductile–brittle transition behavior with the decreasing of temperature. δm remains constant in the upper plateau region but sharply decreases in the ductile–brittle region (−60 °C to −100 °C) and stabilizes at a smaller value in the lower plateau region. Multiscale fractographic analysis indicated that the fracture mechanism changed from ductile fracture (above −60 °C) to ductile–brittle mixed (−60 °C to −100 °C) and then to completely brittle fracture (below −100 °C). As the temperature decreased, the fracture characteristics changed from ductile dimples to dimple and cleavage mixed and then to brittle cleavage.

1. Introduction

Nodular cast iron (NCI), also known as ductile iron (DI), is characterized by its unique microstructure wherein graphite precipitates in spheroidal morphology [1,2]. Compared with gray cast iron or compacted graphite iron, this structural feature significantly mitigates the notch effect of graphite on the metallic matrix and gives NCI superior mechanical properties. Owing to these advantages, NCI has been widely adopted for manufacturing railway components, crankshafts, and specialized containers for radioactive material storage and transportation. In contrast to conventional lead-shielded containers fabricated from stainless steel or forged steel, NCI containers feature a monolithic shell with seamless construction. This design configuration results in enhanced radiation shielding performance while simultaneously offering reduced manufacturing cycles and lower production costs. The earliest industrial application of NCI in this domain can be traced back to the 1980s with the CSATOR series containers developed by Siempelkamp in Germany [3]. Afterwards, countries including China and Japan have conducted research on related technologies. Several NCI-based containment systems have been successfully implemented in practical applications.
Considering the radioactive hazards inherent in SNF management, international regulatory bodies have established rigorous technical specifications for storage and transportation systems. For instance, China’s GB11806 [4] mandate that transport containers must undergo sequential safety tests, including a 9 m free drop, 1 m puncture impact, 30 min fire exposure (800 °C minimum), and 15 m water immersion to validate structural integrity. Building upon these regulatory frameworks, the damage tolerance design methodology has emerged as a critical paradigm in nuclear containment engineering through advancements in fracture mechanics [5]. Within this theoretical framework, fracture toughness will serve as the fundamental parameter governing material selection and structural integrity assessment.
So far, many scholars have published their research results on the fracture toughness of NCI [2,6,7,8,9,10]. Salzbrenner [11] conducted a systematic investigation of NCI’s fracture toughness across varying microstructures. He found that there is a strong correlation between fracture toughness and graphite nodule spacing/size, while composition variation, ferrite grain size, and graphite content did not show a significant influence on fracture toughness. Kobayashi et al. [12] employed three-point bending specimens with digital image correlation (DIC) to characterize crack propagation dynamics. Their experimental results demonstrated a 15–20% reduction in crack tip opening displacement (CTOD) under dynamic loading compared to quasi-static conditions. As the average value of J(ΔC) and J(R), J(mid) was proposed to evaluate the fracture toughness of NCI under different loading conditions. Through meta-analysis of a large number of related experimental datasets, Baer [13] identified three critical factors influencing fracture mode transition: an increase in loading rate, a decrease in temperature, and an increase in stress triaxiality. These parameters collectively control the ductile-to-brittle transition behavior of NCI.
The operational environment of SNF containers may expose NCI components to subzero temperatures. Numerous studies have demonstrated temperature-dependent fracture mechanisms in structural alloys, particularly showing increased brittle failure propensity at low temperatures [14,15,16,17]. Menzemer et al. [18] quantified the ductile–brittle transition in 8320 alloy steel through Charpy V-notch testing across −190 °C to 300 °C. The variation in energy absorbed follows the characteristic ‘S’ shape curve, and the energy absorbed to failure decreased with a decrease in test temperature. Zhang et al. [19] investigated the impact toughness of EN-GJS-400-18-LT ductile iron at temperatures between −80 °C to 20 °C. With the three-dimensional reconstruction and microscopic analysis, they pointed out that deformation twins may act as cleavage crack initiation sites by interaction with other twins or at the grain boundary below the ductile–brittle transition temperature (DBTT). Shaw et al. [20] investigated the fracture toughness of NiCrMoV disk steel specimens with different shapes and sizes. For a given size and geometry, they found that the fracture toughness of the low-alloy steel increased with temperature. Additionally, experimental data below the transition temperature exhibited significant dispersion. Xue et al. [21] explored the influence of temperature on the fracture toughness of EH47 high-strength steel and found that the variation trend was consistent with the above description. Generally speaking, fracture toughness exhibits significant temperature dependence and decreases with decreasing temperature. The existence of the temperature effect adds more uncertain factors to practical use. Therefore, studying the fracture properties of NCI, especially at low temperatures, is of great significance for ensuring the safety and reliability of SNF containers.
Tensile tests and fracture toughness tests at different temperatures were conducted in this study, and scanning electron microscopy (SEM) images of the fracture surfaces were also obtained. By comparing the test values and microstructures under different testing conditions, the influence of temperature on the fracture properties and mechanisms of NCI was investigated. Provided data support for the practical application of NCI.

2. Materials and Methods

2.1. Material

An inductively coupled plasma atomic emission spectrometer (ICP-AES, Shimadzu ICPE-9810, Shimadzu, Colombia, MD, USA) was used to determine the precise chemical compositions, and the results are shown in Table 1. The experimental NCI was spheroidized with mixed rare earth elements, and the rare earth composition was not listed. To achieve full ferritization, the as-cast material underwent controlled annealing. The specific process is as follows: heating to 920 °C for 2 h, followed by furnace cooling to 720 °C for 4 h, and then air cooling to room temperature after furnace cooling to 600 °C. Metallographic preparation involved sequential grinding (SiC 240~2000 grit), diamond polishing, and 4% nital etching for 15–20 s. The microstructure of the NCI is shown in Figure 1. Referring to ISO 945-4 [22], the proportion of graphite is 10.11%, with an average spheroidization rate of 87%. The graphite sizes cover size 6 (30–60 μm) and size 7 (15–30 μm).

2.2. Tensile Test

The shape and size of the tensile specimen are shown in Figure 2, with a 150 mm total length, 50 mm gauge length, and 10 mm nominal diameter. Uniaxial tensile tests were performed using a W + B LFV-100 kN universal testing system. The testing temperature covered from room temperature to −120 °C (−20 °C, −40 °C, −60 °C, −80 °C, −100 °C, and −120 °C). Each specimen underwent 10 min of thermal stabilization after reaching the experimental temperature. The displacement-controlled loading was applied through a constant crosshead velocity of 0.75 mm/min, corresponding to the strain rate of 2.5 × 10⁻⁴/s.

2.3. Fracture Toughness Tests

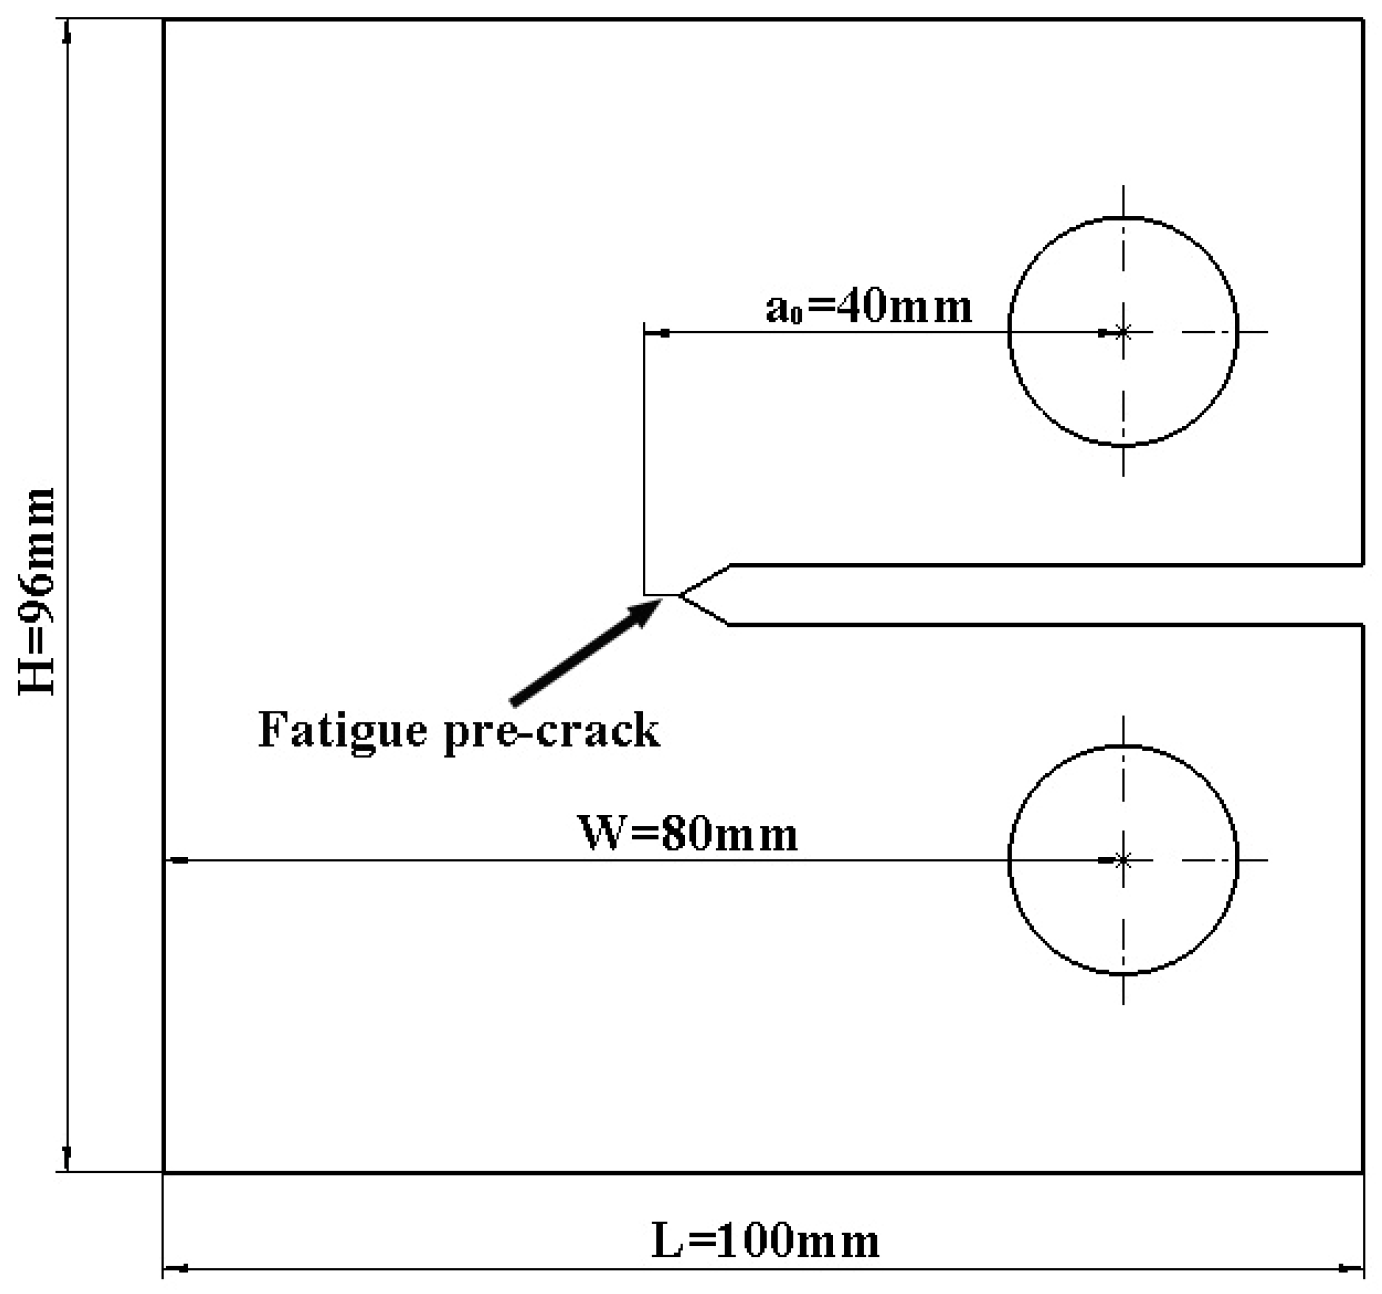
Fracture toughness evaluation was performed with ISO 12135 [23], using standard compact tension (CT) specimens (W/B = 2, a0/W = 0.5). The specific dimensions of B = 40 mm specimens are shown in Figure 3. The fracture toughness test was conducted using the same system as tensile tests, with experimental temperatures of 20 °C, −20 °C, −40 °C, −60 °C, −80 °C, −100 °C, and −120 °C. Displacement-controlled loading with 0.025 mm/s was maintained as a quasi-static condition. After breaking, the specimens were removed from the cryostat as soon as possible, and the fracture surface was dried immediately to ensure it would not be corroded.
During the experimental process, the displacement of the crack mouth and the load were automatically recorded to obtain the load–CMOD (p-V) curve. Due to the large temperature span of the experiment, the fracture toughness of the material was characterized using the stress intensity factor KQ and the maximum values of crack-tip opening displacement (δm). The calculation formula for KQ is as follows:
K Q = F Q B W 0.5 g 2 a 0 W
g 2 a 0 W = 2 + a 0 W 0.886 + 4.64 a 0 W 13.32 a 0 W 2 + 14.72 a 0 W 3 5.6 a 0 W 4 1 a 0 W 3 / 2
where FQ is the intersection of the p-V curve with a straight line, which has a slope of 95% of the linear segment of the p-V curve. B is the thickness of the CT specimen, W is the ligament length, and α0 is the initial crack length. Furthermore, it should be noted that only when the maximum load Fmax, B, W, and α0 satisfy Formulas (3) and (4), the conditional fracture toughness value KQ calculated by Formula (1) can be considered as the effective plane strain fracture toughness value KIC. And Rp0.2 is the yield strength at the test temperature.
F m a x F Q 1.1
B , W , α 0 2.5 K Q R p 0.2 2
δm was calculated as follows:
δ m = P B W 0.5 × g 2 a 0 W 2 1 v 2 m R p 0.2 E + τ · 0.52 W a 0 V p 0.52 W + 0.48 a 0
m = 4.9 3.5 R p 0.2 R m
τ = 1.4 R p 0.2 R m 2 + 2.8 R p 0.2 R m 0.35 0.8 + 0.2 e x p 0.019 B 25
V = 0.52 W a 0 + a 0 0.52 W a 0 + a 0 + 0.25 W V g
where p is the unstable crack propagation force or maximum force during the test process, v is the Poisson’s ratio, which was assumed to be 0.3, Rm is the tensile strength at the test temperature, E is Young’s modules, and Vp is the plastic component of the V. V was converted from the clip gauge output Vg using Formula (8).

2.4. Microscopic Observation of Fracture Surfaces

The fracture surfaces of the tensile specimen and CT specimen were observed by SEM to study the fracture mechanism at different temperatures. The cleavage initiation site was located by tracing the river pattern lines to their origins.

3. Results

3.1. Tensile Properties Results

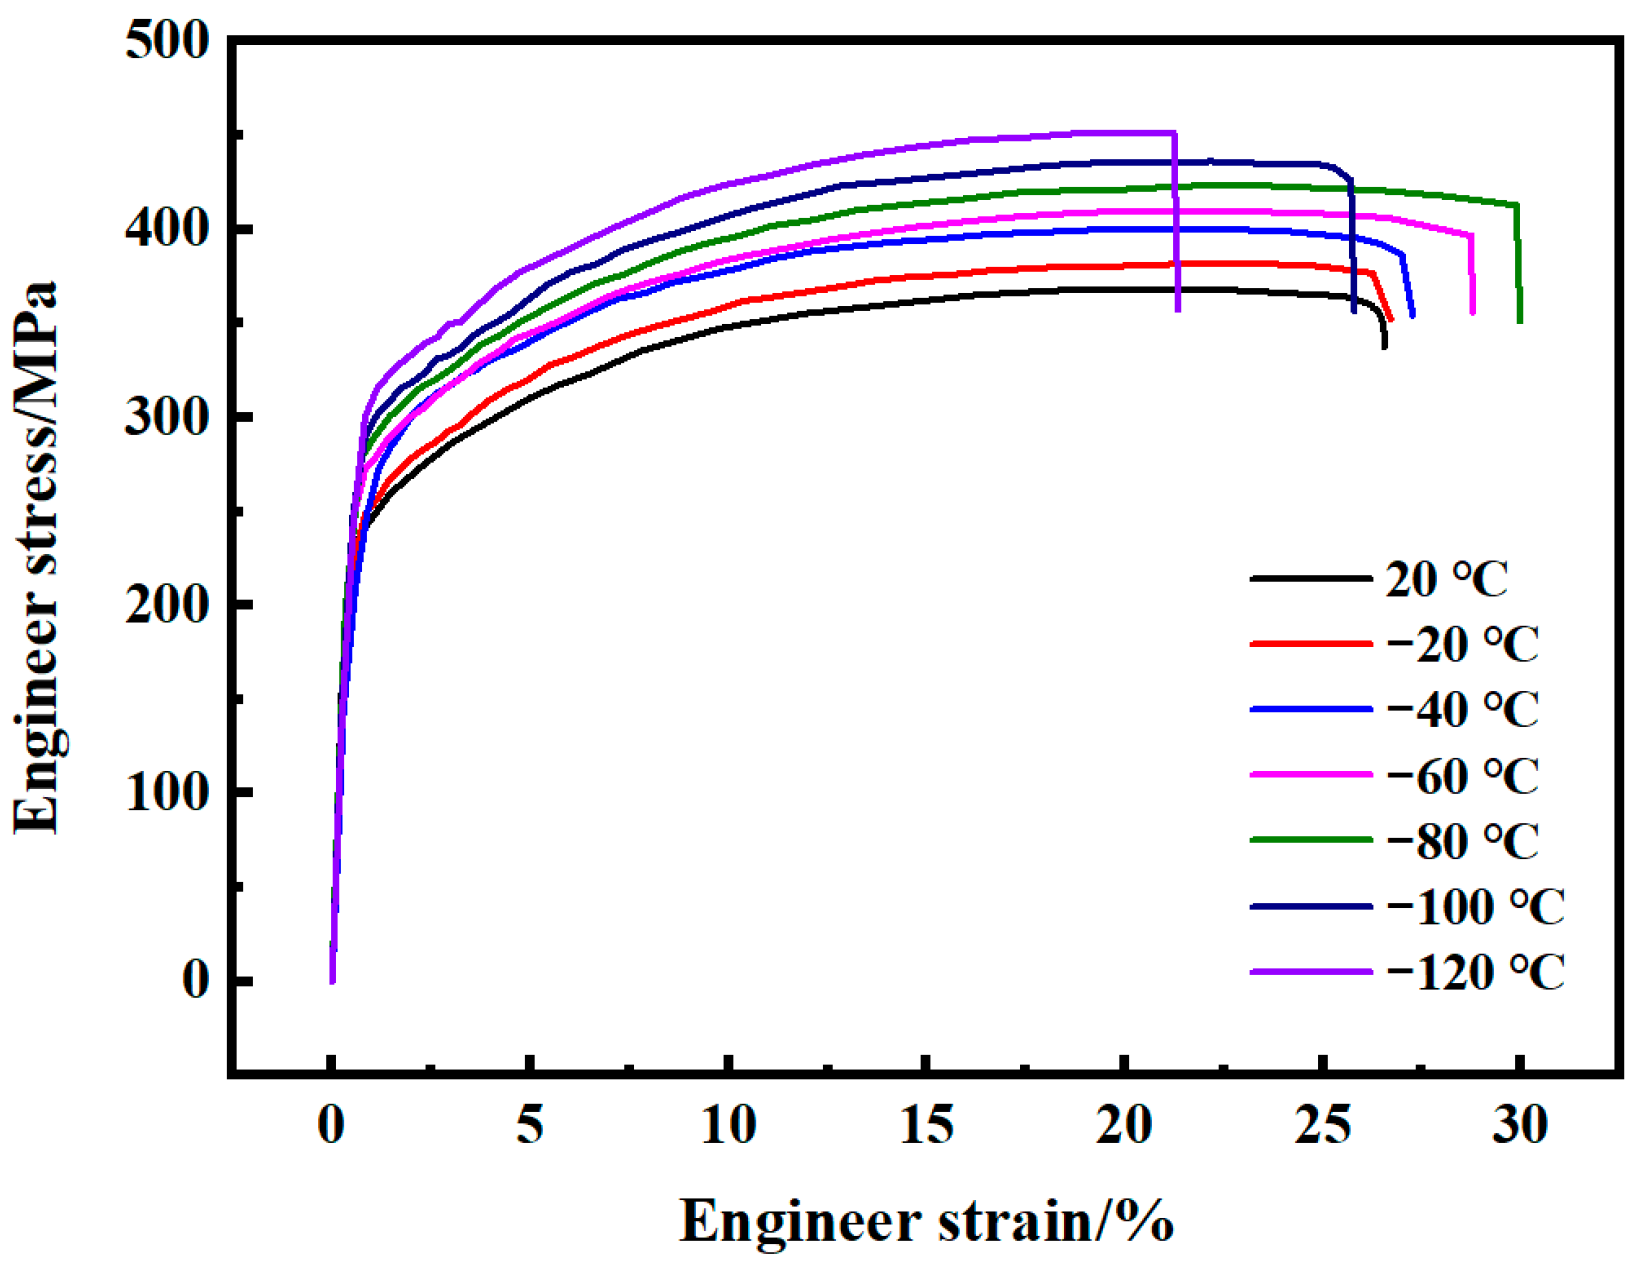
Figure 4 presents the engineering stress–strain curves of NCI with the temperature ranging from 20 °C to −120 °C. According to the test results, the NCI used in the experiment is EN-GJS-350-22 grade according to ISO 1083 [24]. Quantitative analysis reveals a significant temperature dependence of mechanical strength, showing a monotonic increase in both yield and ultimate tensile strength with decreasing temperature. The corresponding mechanical properties are listed in Table 2. The temperature-dependent mechanical behavior of NCI aligns with established constitutive models for metallic materials. As demonstrated in previous studies, the yield strength Rp0.2 and ultimate tensile strength Rm of metallic materials at a specific temperature T can be expressed as follows [25]:
R p 0.2 = R p 0.2 A × e x p k s T T 0
R m = R m A × e x p k b T T 0
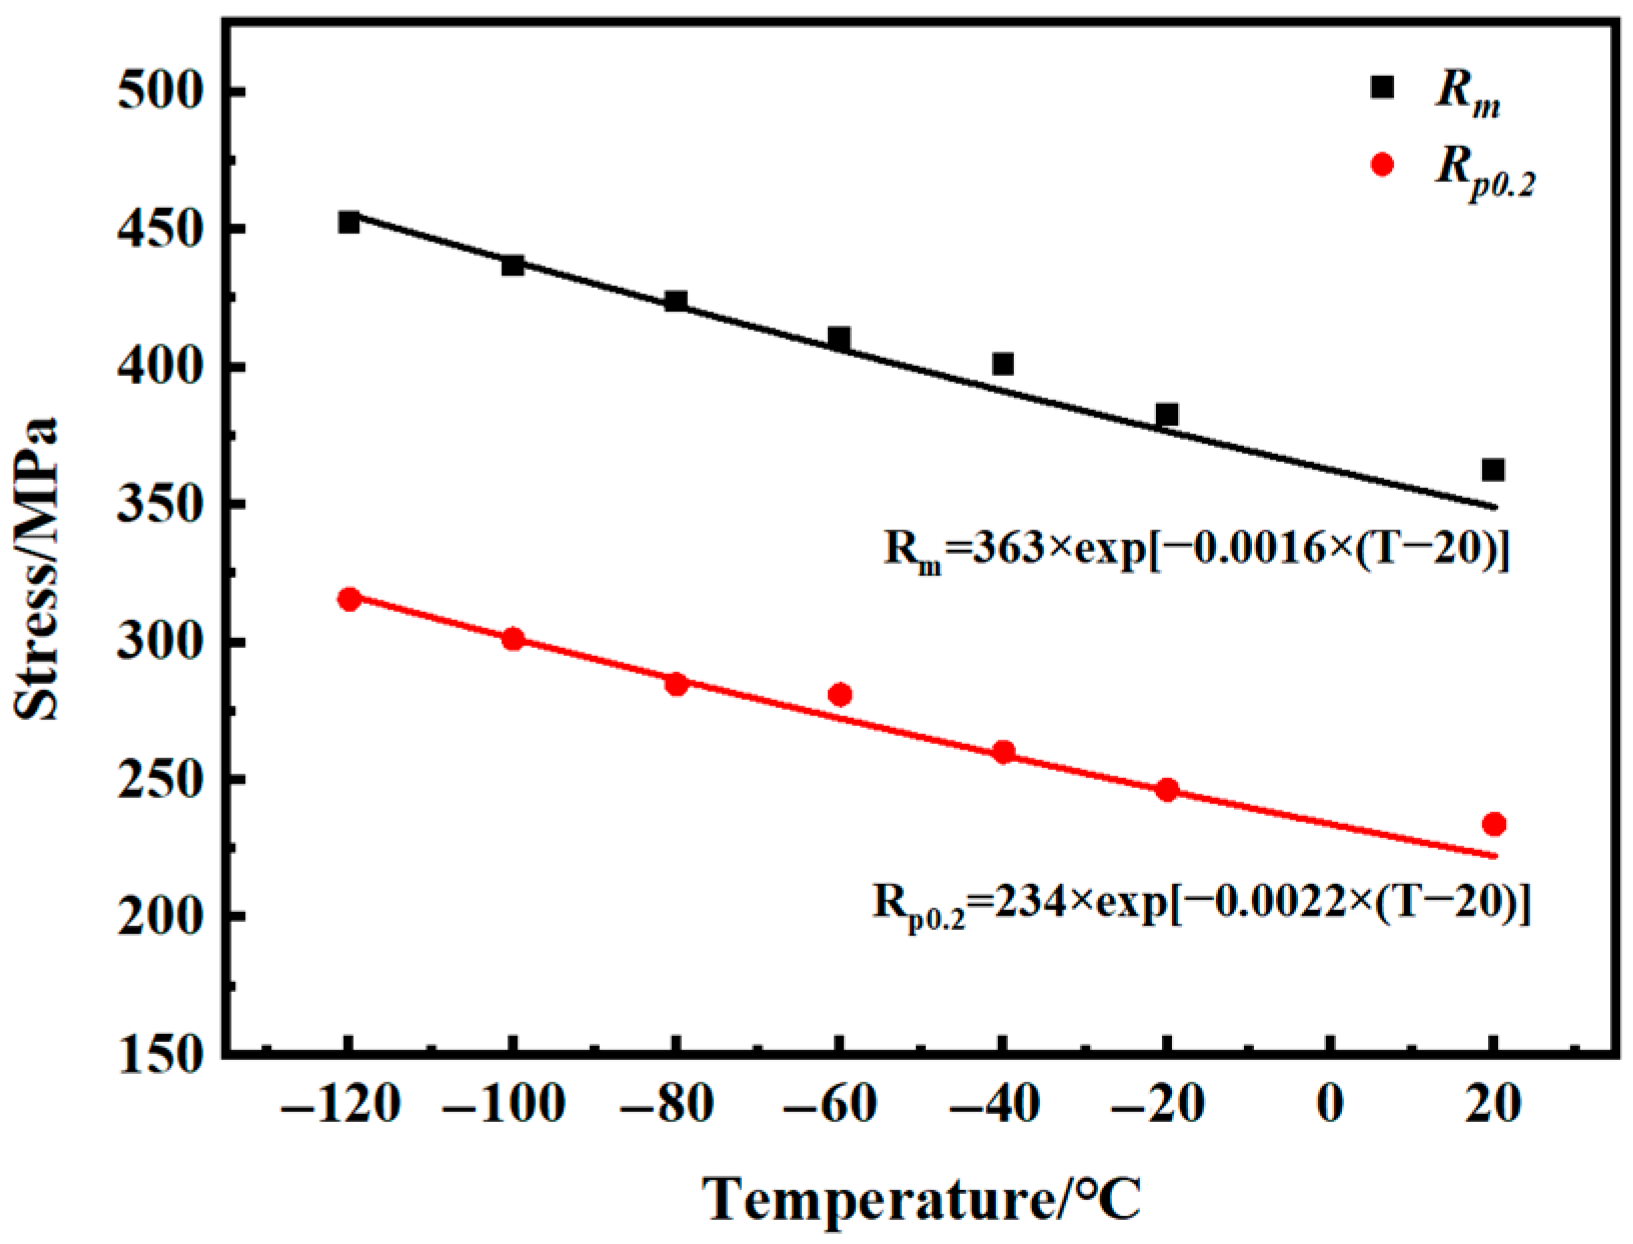
where Rp0.2A and RmA represent the reference yield strength and ultimate tensile strength at a specific temperature. Temperature sensitivity coefficients ks and kb were determined through nonlinear regression analysis, and the fitting results of NCI are as follows:
R p 0.2 = 363 × e x p 0.0016 T 20
R m = 234 × e x p 0.0022 T 20
From Figure 5, it can be seen that both coefficients are negative, indicating that the ultimate tensile strength and yield strength of NCI increased with decreasing temperature. These established temperature–strength correlations enable the reliable prediction of NCI’s mechanical properties at different temperatures.
Figure 6 presents the fracture surface of tensile specimens characterized through SEM. At room temperature and −40 °C, the fracture surfaces exhibited micro-voids coalescence patterns, manifested as uniformly distributed dimple structures. During the stretching process, the matrix underwent significant deformation. At −80 °C, ductile–brittle mixed fracture became apparent, which demonstrated brittle-ductile competing failure mechanisms. When the temperature dropped to −120 °C, dimples disappeared, and a completely brittle cleavage fracture occurred. The change in fracture morphology indicates that as the temperature decreased, there was a significant ductile–brittle transition behavior in the fracture of NCI.

3.2. Fracture Test Results

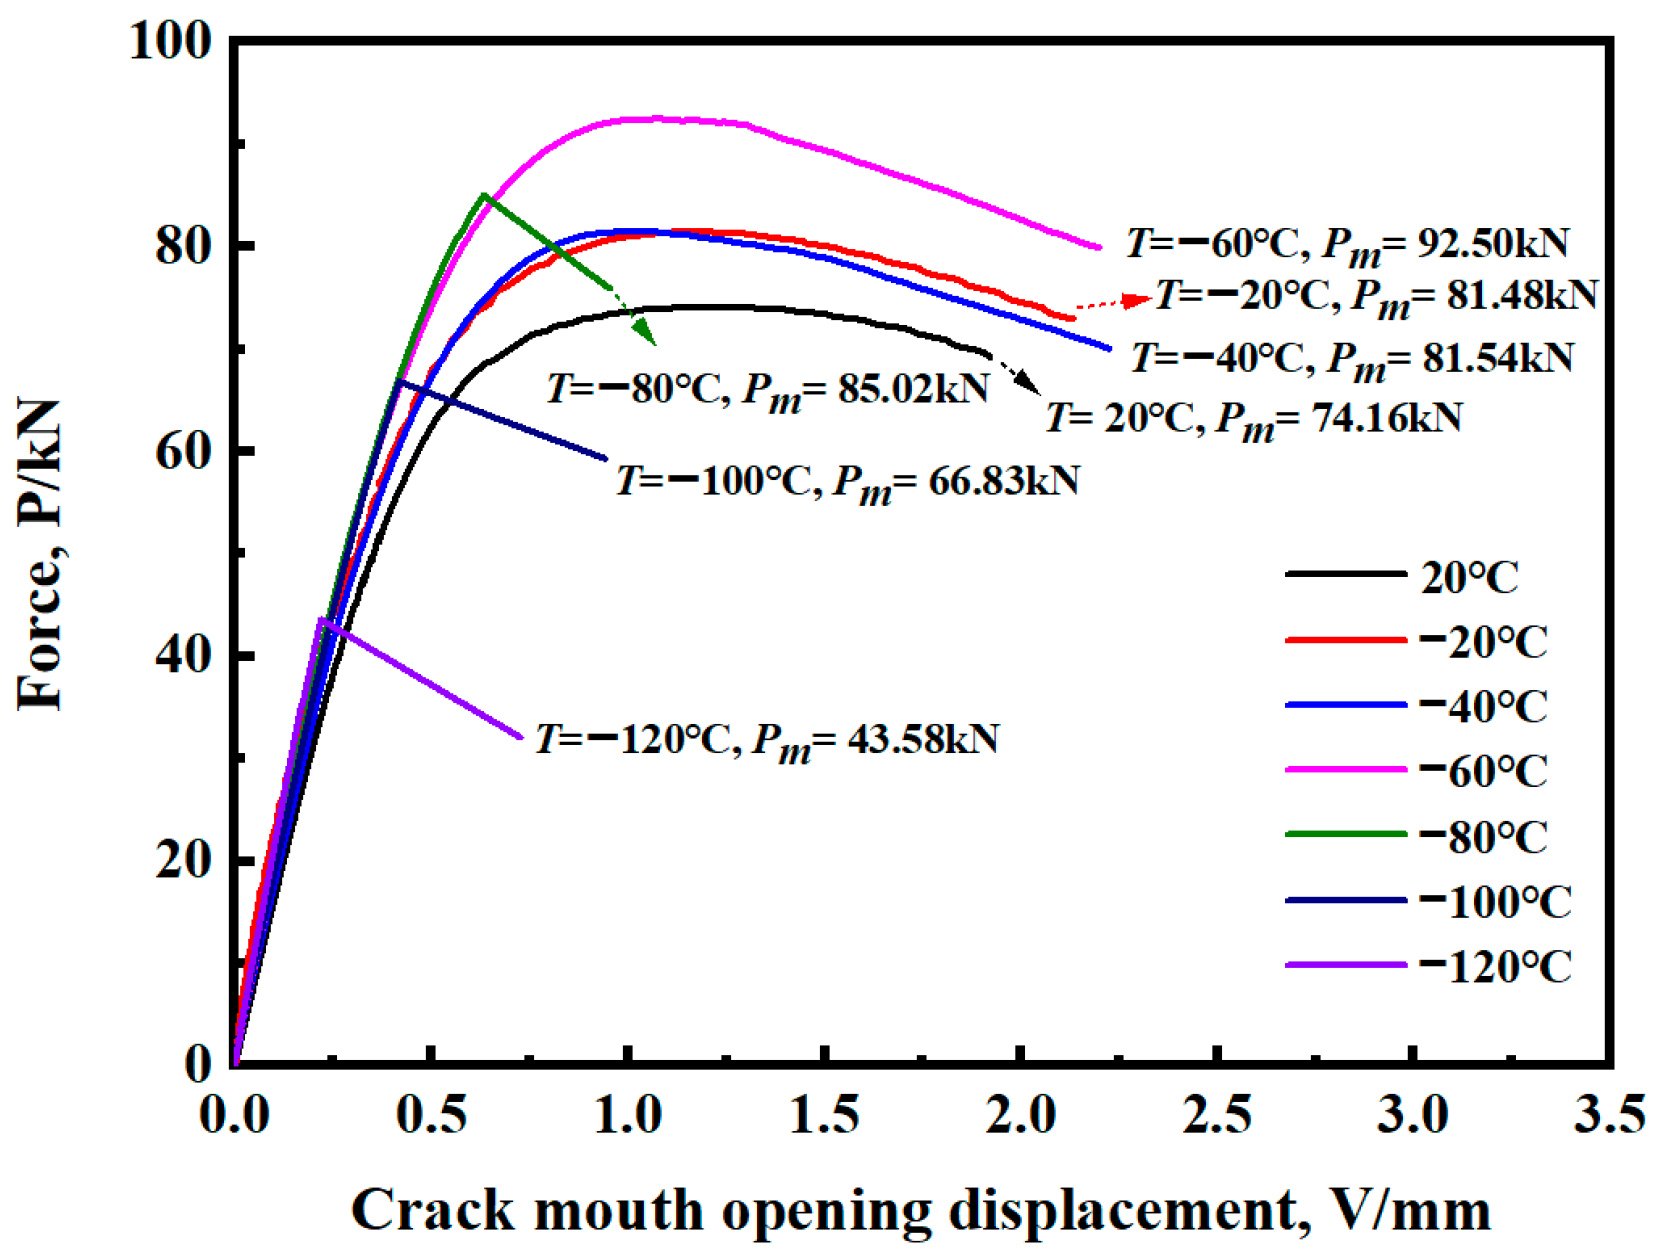
Figure 7 presents the typical loading curves obtained from CT specimens under various temperatures. Through systematic evaluation of curve morphology, three characteristic fracture regimes were identified: (a) no fracture after yielding (−40 °C to 20 °C), (b) fracture after obvious yielding (−60 °C and −80 °C), and (c) fracture before yielding (−100 °C and −120 °C).
In the temperature range above −60 °C, specimens exhibited classical ductile fracture characteristics. After the load reached its maximum value, the curve slowly decreased. This deformation pattern correlates with the high fracture toughness values of NCI at these temperatures. The transition region (−80 °C) displayed hybrid fracture behavior, where initial linear elastic loading transitioned to limited plastic deformation, followed by abrupt failure at maximum load. This multistage progression suggests competing ductile and brittle fracture mechanisms. At −100 °C and below, the mechanical response mainly became linear–elastic. The load increased linearly with the increase in CMOD. Once the tensile force reached its maximum value, the curve immediately dropped. No significant plastic deformation before fracture.
The fracture assessment of cracked components mainly adopts two different analysis methods: energy-based approaches (global methodology) and stress intensity-based methodologies (local analysis). Energy dissipation analysis, particularly effective for elastoplastic fracture characterization, utilizes parameters such as the J-integral and crack-tip opening displacement (CTOD) to quantify crack propagation resistance. Conversely, stress intensity factor (K) analysis, rooted in linear elastic fracture mechanics principles, provides critical insights into brittle fracture initiation through singular stress field characterization at the crack tip. Within the temperature range of the experiment, the stress intensity factor KQ and the crack-tip opening displacement (CTOD) δm were calculated separately. All fracture parameters are systematically listed in Table 3. No test result satisfied the plane thickness requirement (Equation (4)).
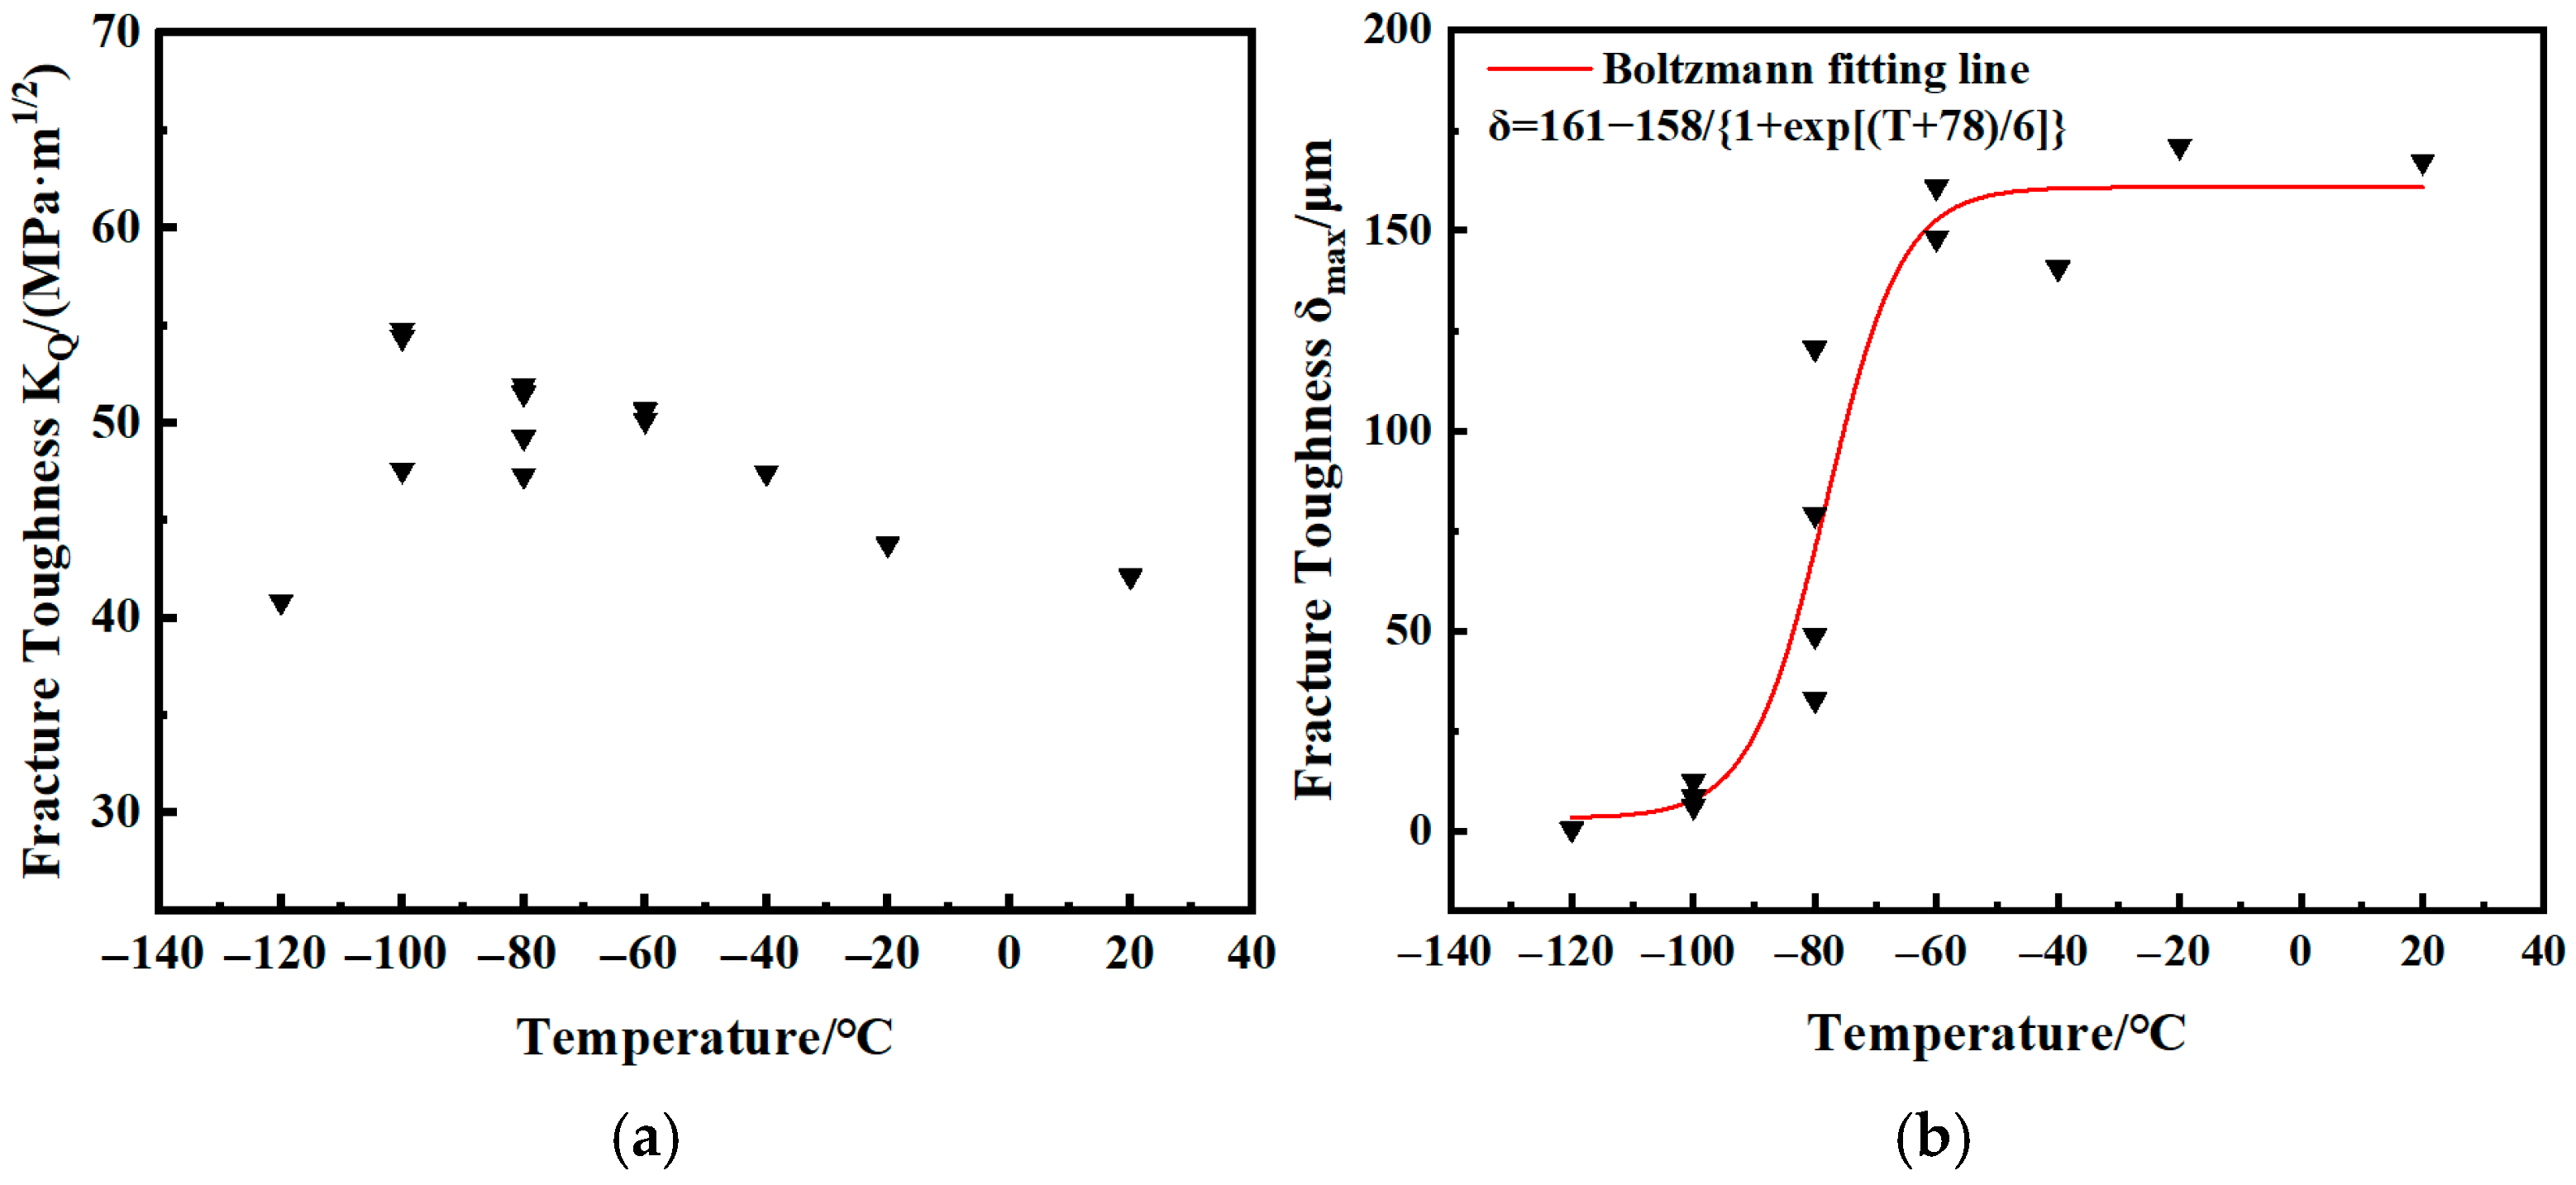
Figure 8 shows the temperature-dependent evolution of fracture toughness parameters (KQ or δmax). Both KQ and δmax parameters manifested a non-monotonic temperature dependence. Figure 8a shows that above −80 °C, KQ gradually increases as the temperature decreases; the main reason is that as the temperature decreases, the yield strength of the material increases. When the temperature drops below 100 °C, KQ decreases with decreasing temperature.
Based on Figure 8b, the whole temperature range can be divided into three parts: the upper shelf region (above −60 °C), the transition region (−60 °C to −100 °C), and the lower shelf region (below −100 °C). In the upper shelf and lower shelf regions, there were no significant changes in fracture toughness δmax, while in the transition zone, δmax changed dramatically with temperature and exhibited significant dispersion at the same temperature. The solid line in Figure 8b is the fitted curve of the values at different temperatures, which was fitted by the Boltzmann function.
δ m = δ m 2 + δ m 1 δ m 2 1 + e T T 0 / d T
where δm is the fracture toughness at different temperatures (μm), δm1 and δm2 are the lower and upper shelf values, respectively, T0 is the ductile–brittle transition temperature, which is the temperature corresponding to δ = (δ1 + δ2)/2; dT characterizes the transition temperature span; and T is the test temperature. The relationship between temperature and δm can be expressed as follows:
δ m = 161 158 1 + e T + 78 / 6
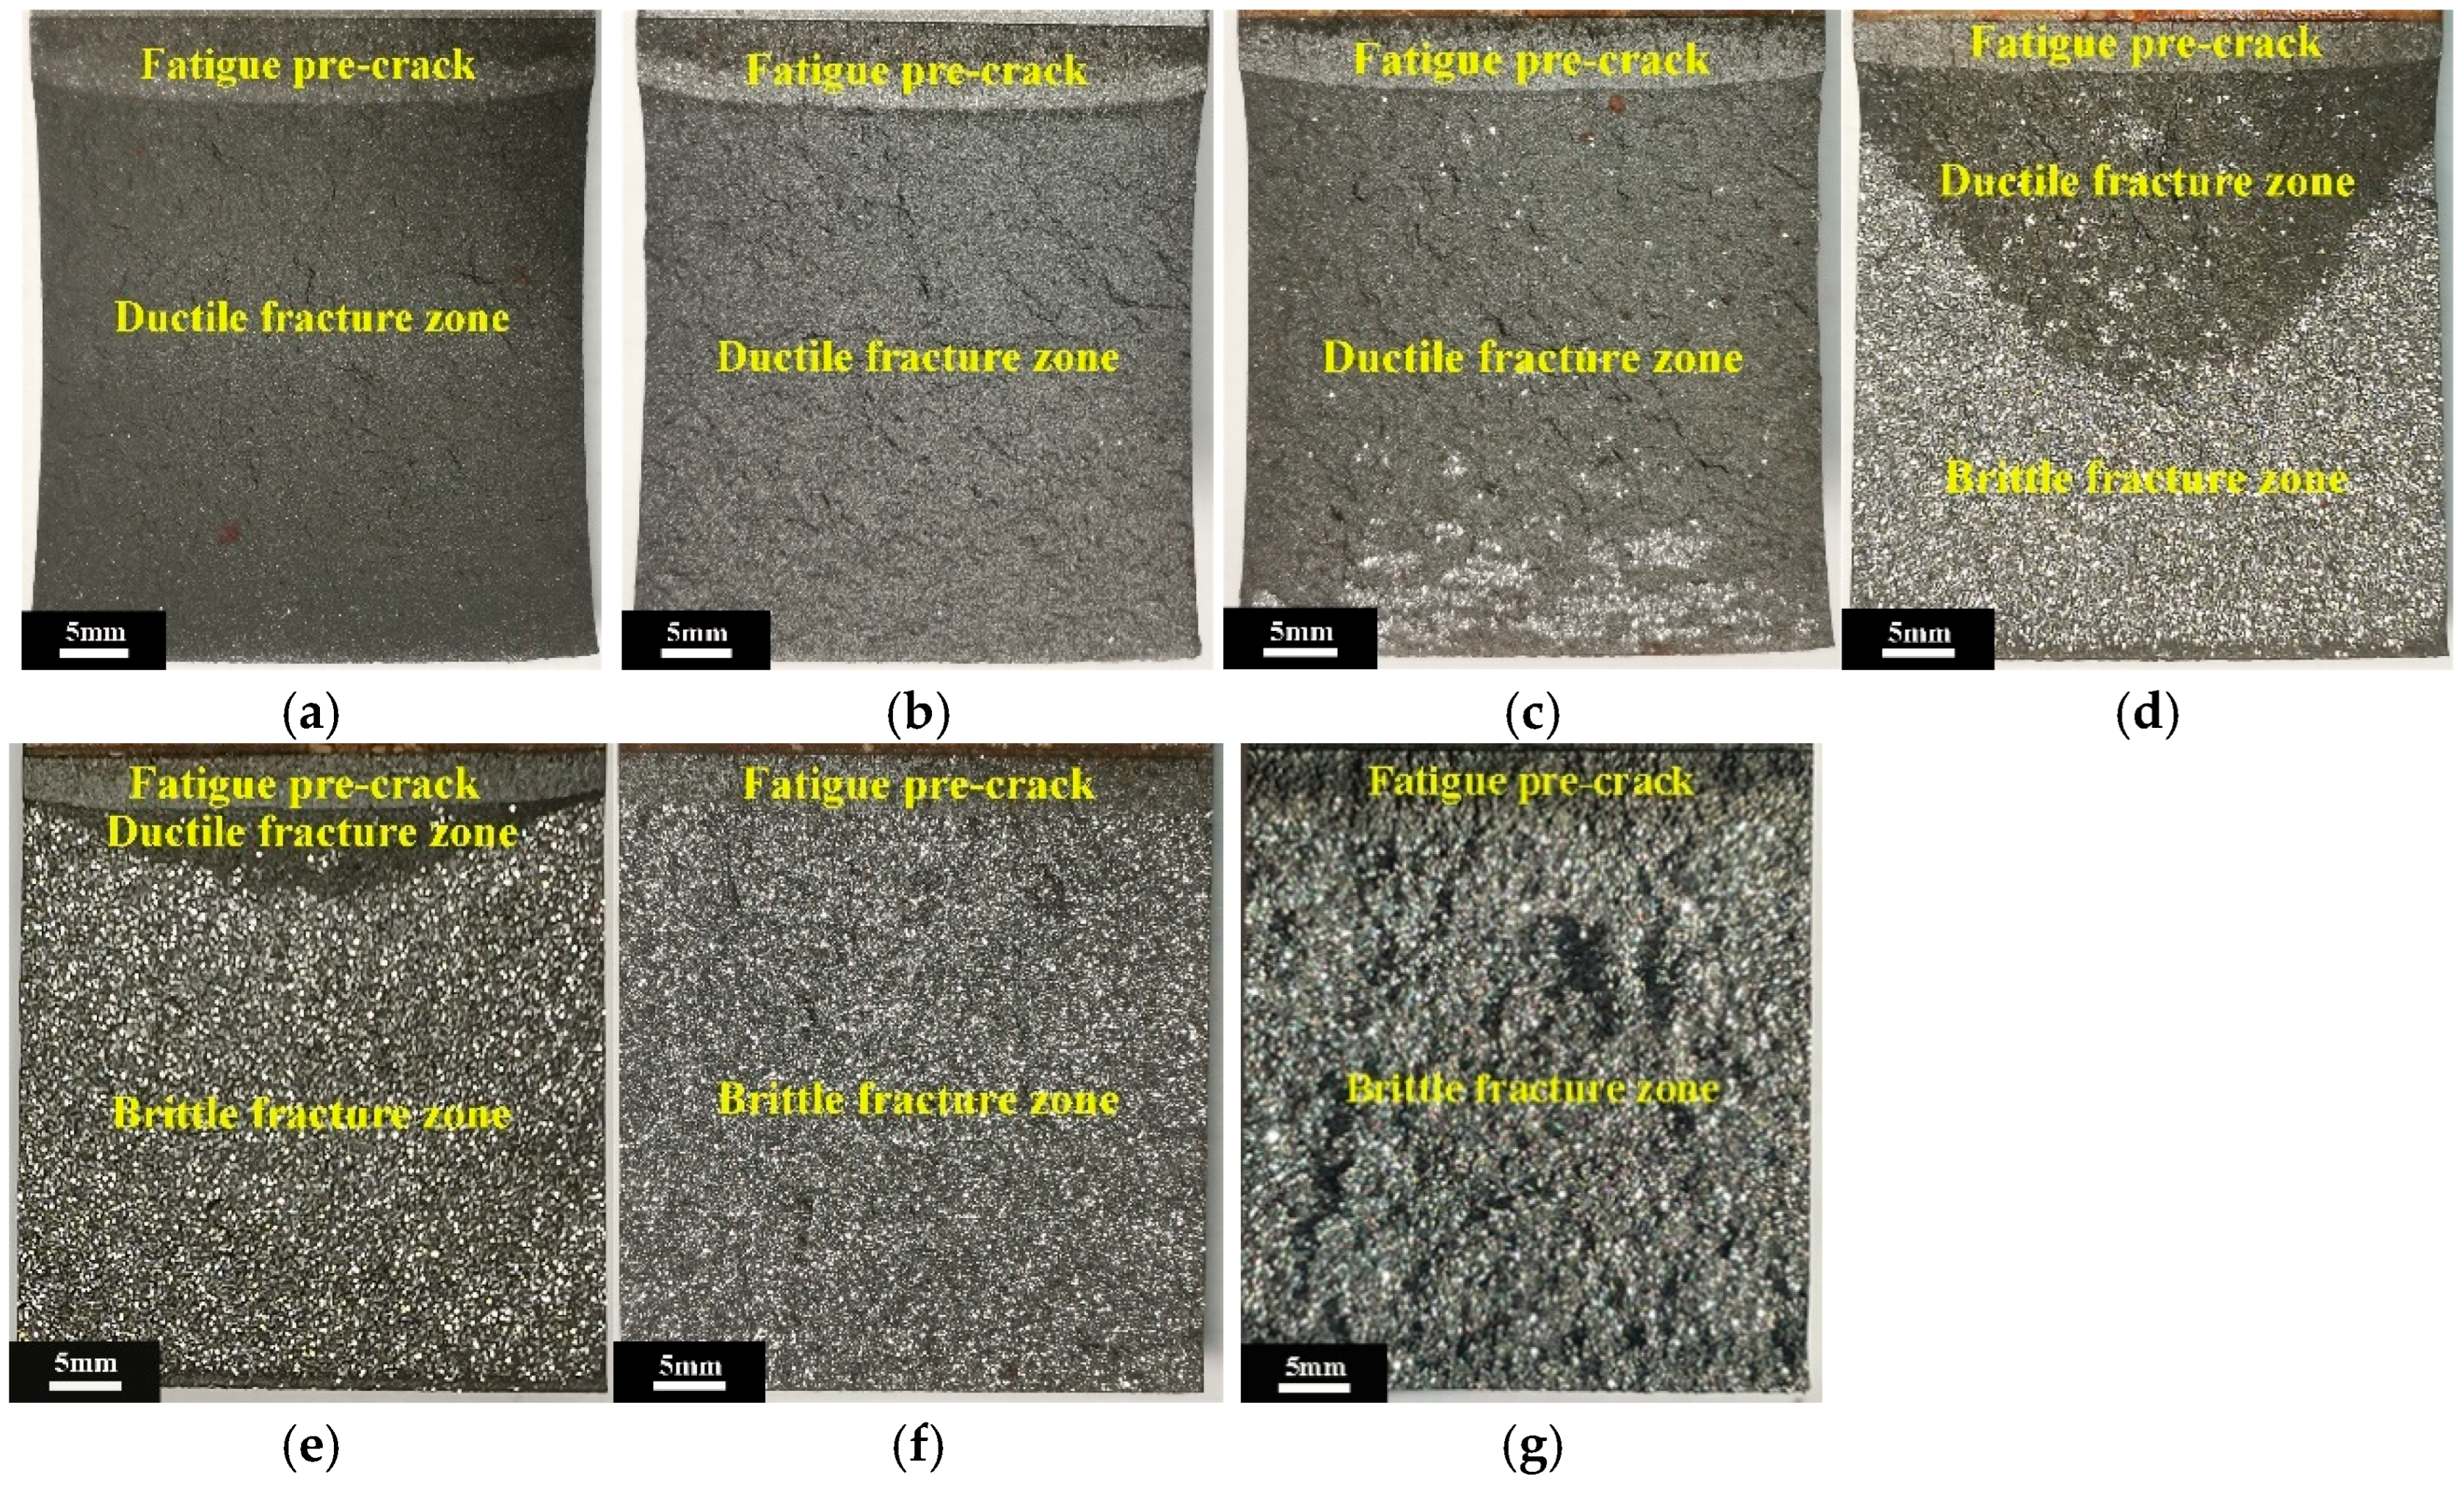
Figure 9 shows the macroscopic fracture characteristics of CT specimens under different temperatures. The room temperature fracture surface (Figure 9a) exhibits a homogeneous dark gray morphology, as a result of stable crack propagation through ductile tearing mechanisms. Digital image quantification revealed a significant chromatic contrast between the fatigue pre-crack zone and ductile fracture zone. This optical disparity arises from different degrees of plastic deformation during the crack propagation process. Notably, the specimen exhibited significant plastic deformation with thickness reduction in the absence of shear lip formation.
With decreasing temperature, the emergence of quasi-cleavage facets exhibiting metallic luster became apparent on the fracture surface (Figure 9c). Comparative analysis of fracture surfaces at −40 °C and −60 °C (Figure 9c,d) demonstrated a temperature-dependent increase in the areal fraction of cleavage facets. The fracture zone can be categorized into a ductile fracture zone and a brittle fracture zone based on its morphological characteristics. Progressive temperature reduction led to gradual diminution of the ductile fracture zone (Figure 9d,e).
In the lower shelf region, specimens underwent abrupt brittle fracture upon reaching peak load, manifesting as a complete cleavage fracture surface (Figure 9f,g). The absence of measurable plastic contraction in the thickness direction corroborates the transition to fully brittle fracture behavior. These morphological observations confirm that NCI exhibits significantly reduced fracture toughness in the lower shelf temperature region.
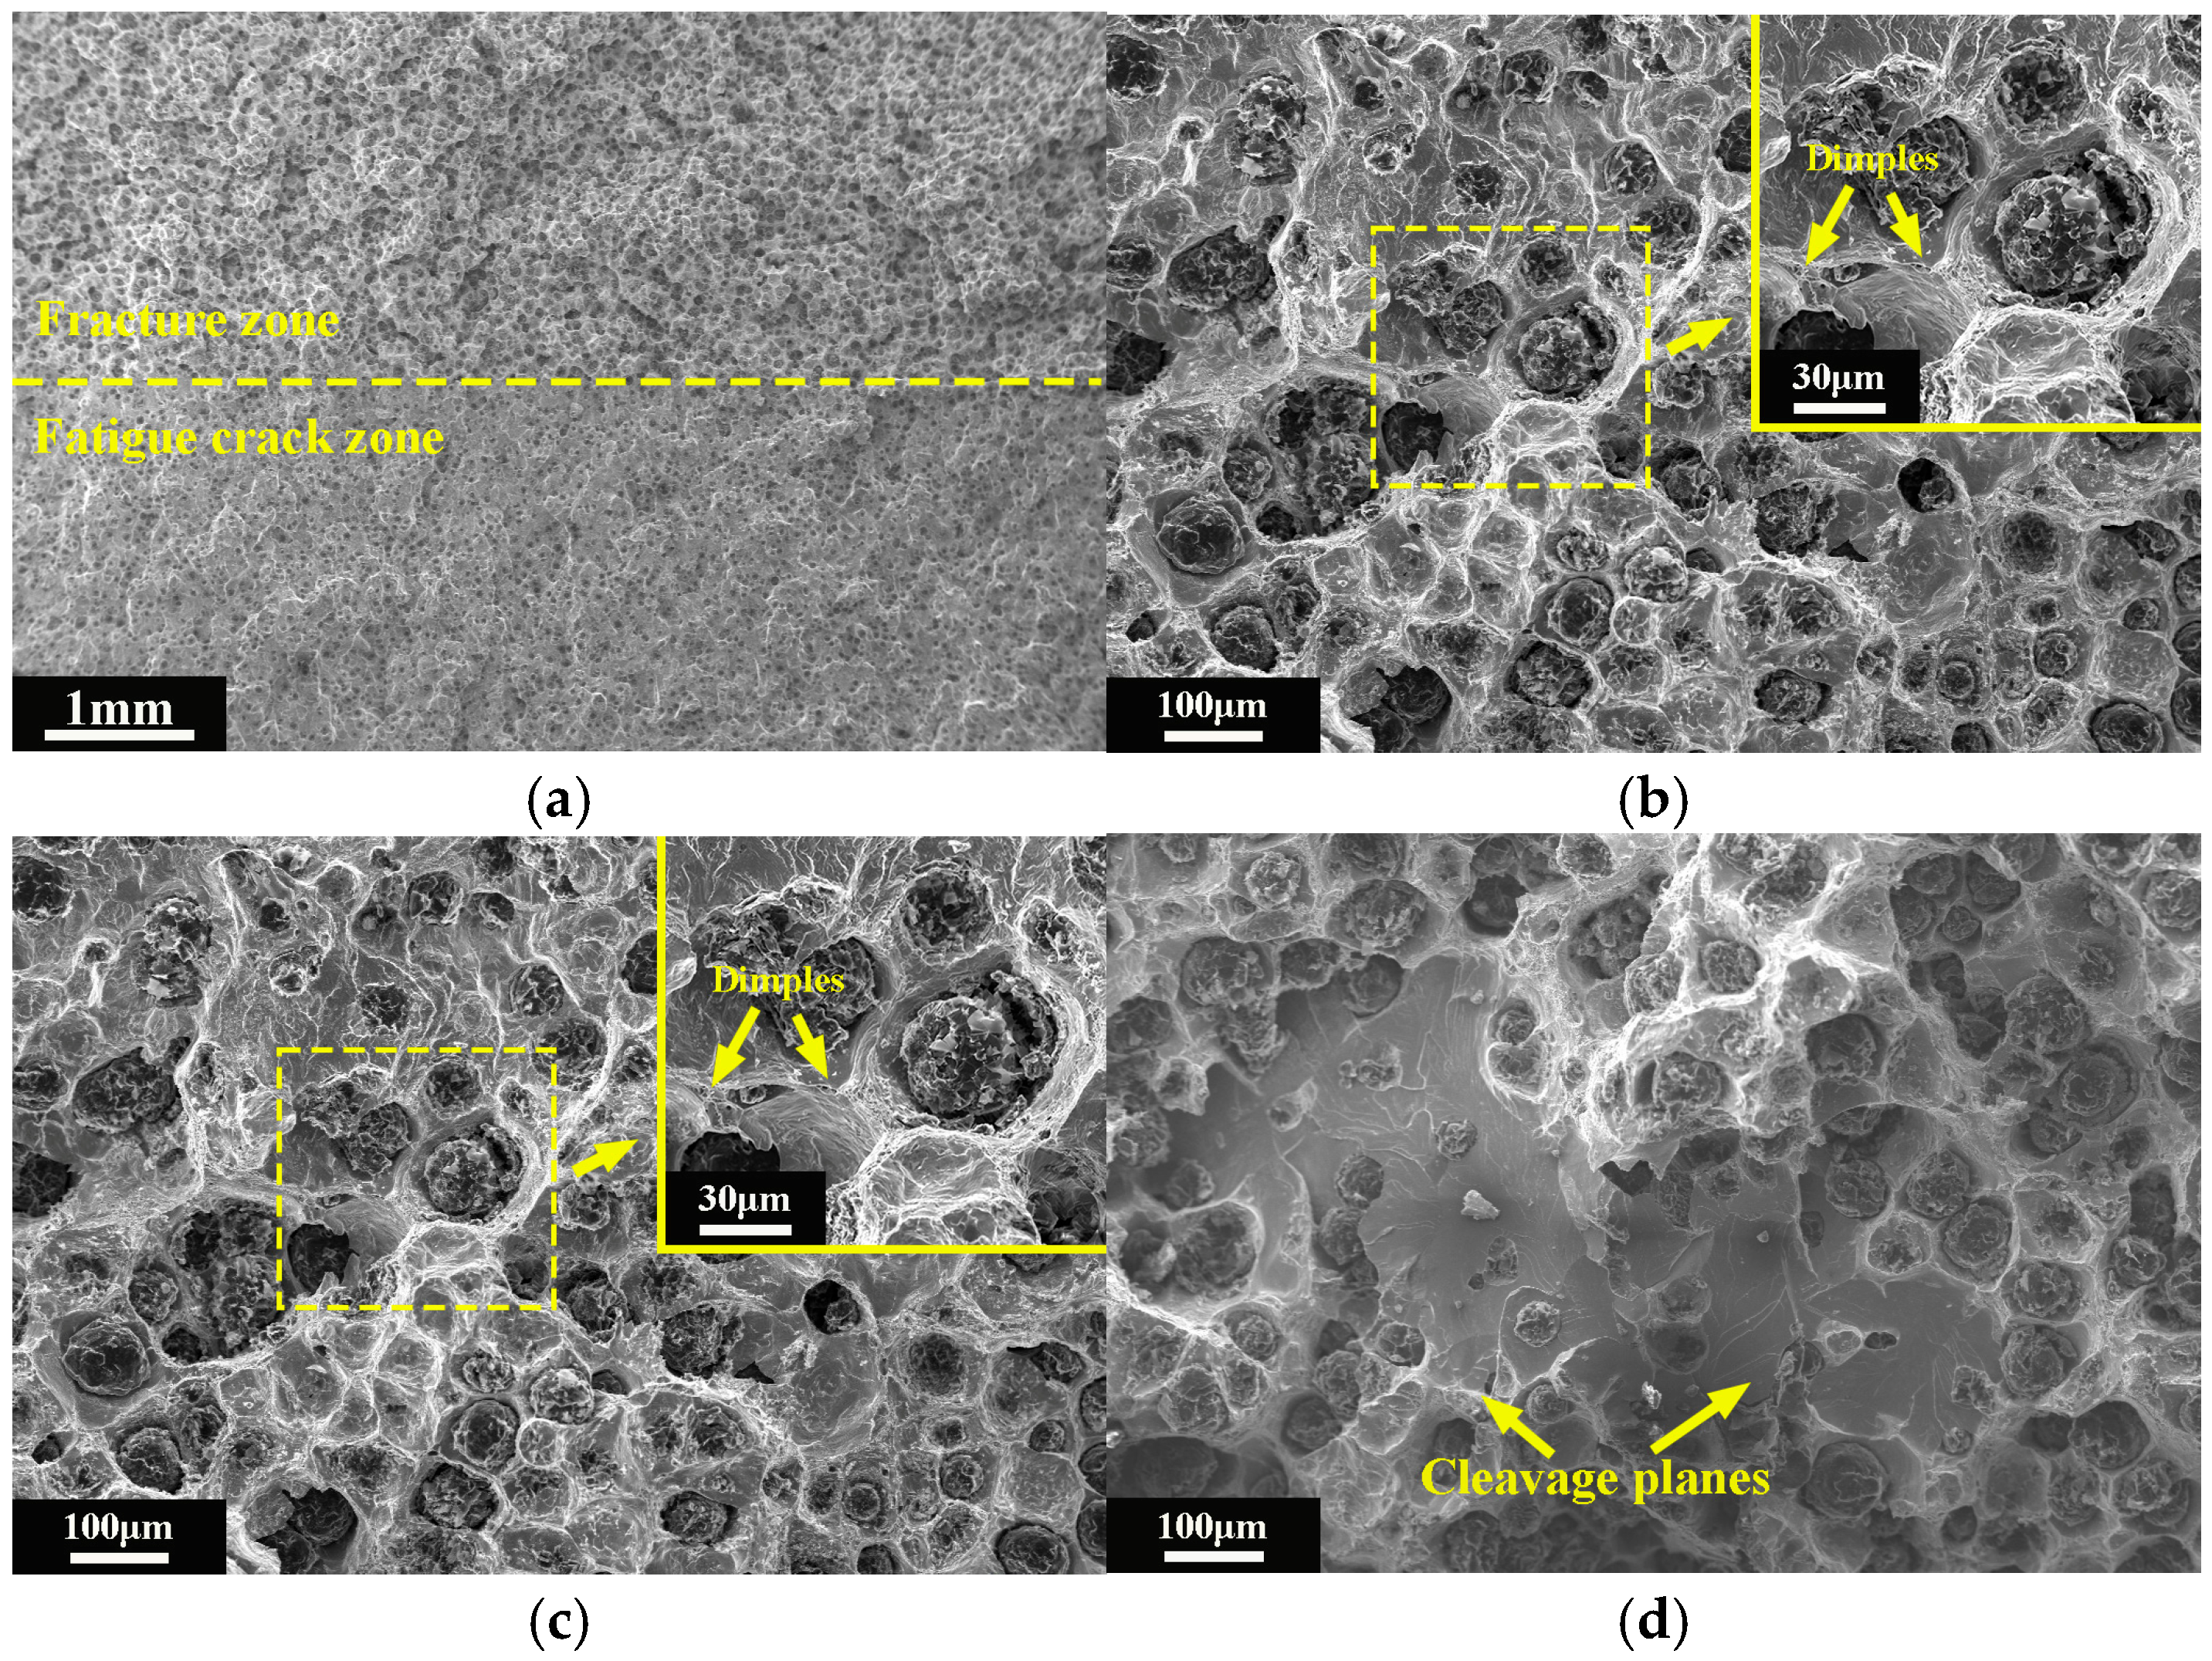
To investigate the fracture mechanism in different temperature regions, the microscopic surface was observed by SEM. Figure 10 presents the fracture morphology of CT specimens in the upper shelf region. Low-magnification images (Figure 10a,c) reveal a distinct morphological contrast between the fatigue pre-crack zone and fracture zone. The fatigue crack zone displays relatively planar fracture surfaces with characteristic river patterns, indicative of stable crack growth under cyclic loading. While in the fracture zone, extensive plastic deformation of the ferritic matrix surrounding graphite nodules is evident, manifested as ductile dimples interconnected by micro-void coalescence (Figure 10b). Dimples and tearing ridges confirm the dominance of ductile fracture mechanisms at room temperature. Additionally, interfacial decohesion between graphite nodules and metallic matrix was observed. When the temperature dropped to −40 °C, small cleavage planes appeared in multiple areas of the fracture zone (Figure 10c,d). This demonstrates a transition from ductile fracture to brittle fracture in some fracture areas.
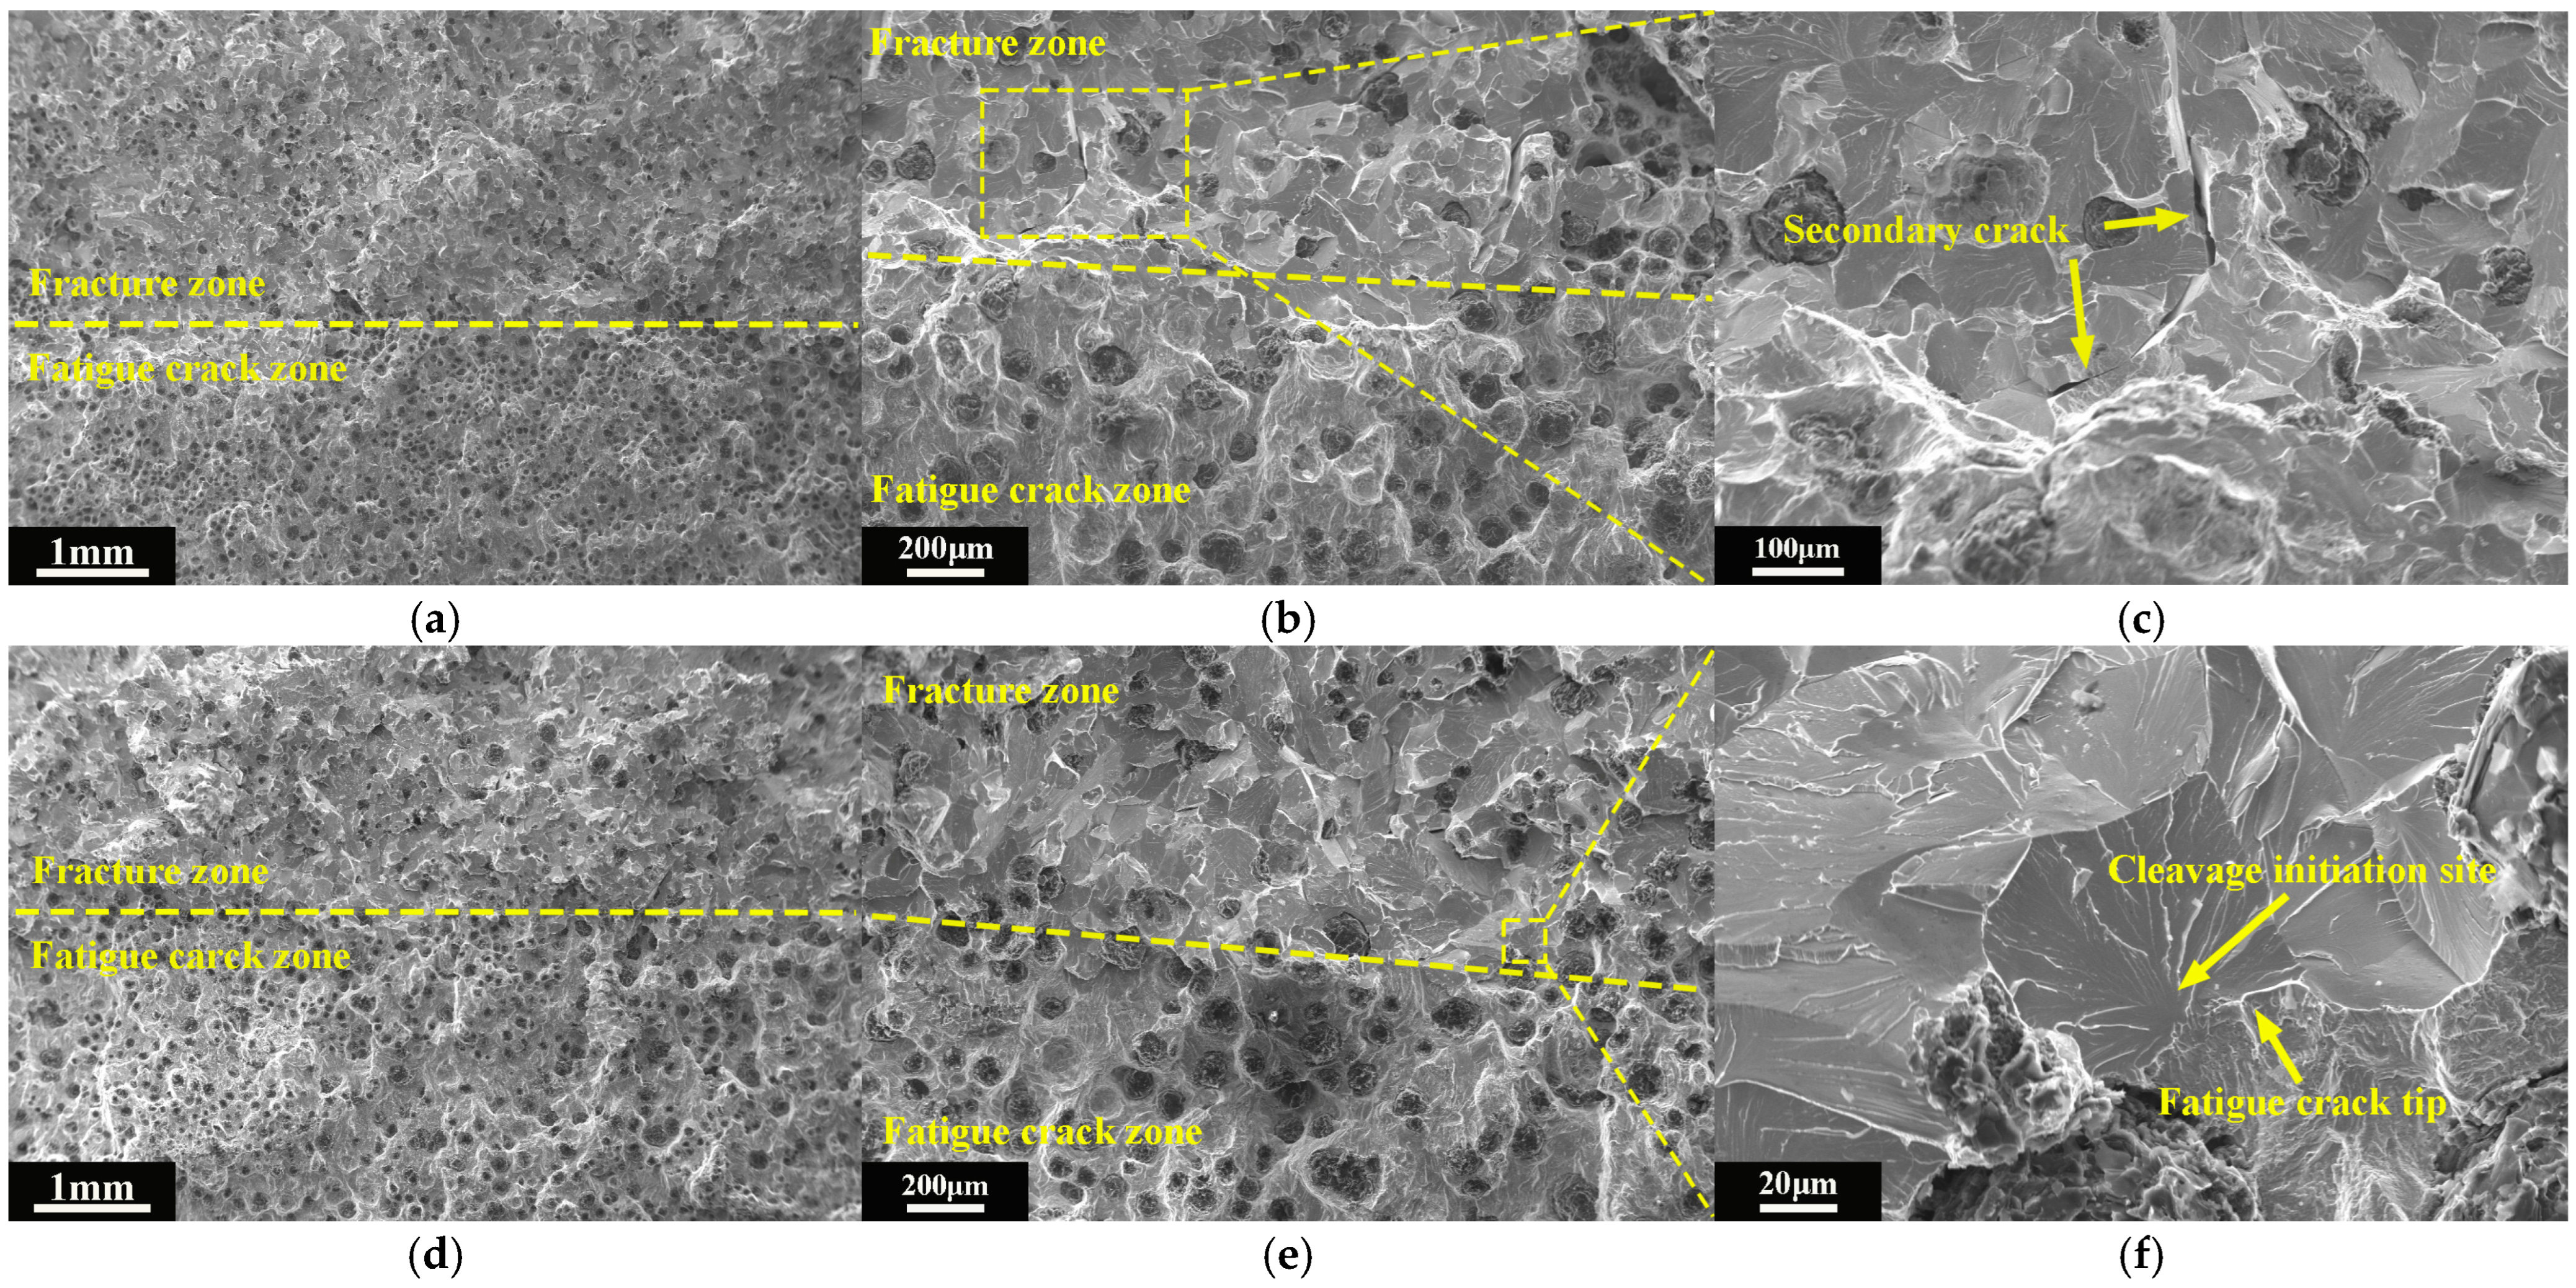
Figure 11a,b reveals the microstructure of the fracture surface at −80 °C. Comparative analysis with the −40 °C condition demonstrates progressive expansion of cleavage-dominated fracture regions. The mixed fracture morphology exhibits ductile dimples and cleavage fracture surface, indicating competing ductile and brittle fracture mechanisms during crack propagation.
When approaching the lower shelf temperature (−100 °C), specimens exhibit a complete cleavage fracture surface. From Figure 11e, it can be seen that the dimple morphology almost completely disappeared in the fracture zone. The ferrite matrix at the tip of the pre-crack hardly underwent plastic deformation. In Figure 11d, the cleavage initiation site is directly connected to the fatigue crack tip, indicating that the cleavage crack immediately expanded once it nucleated.

4. Discussion

4.1. Fracture Mechanisms in Different Temperature Regions

4.1.1. Fracture Mechanisms in the Upper Shelf Region

As shown in Figure 10, ductile dimples were observed on the fracture surface within the upper shelf range. The dimple is a typical feature of a ductile fracture. The critical condition for triggering cleavage fracture is that the normal stress (σyy) in front of the crack tip reaches the value of the local cleavage stress σf [26]. As demonstrated by Cao et al. [27], maximum crack-tip σyy reaches approximately 3.5Rp0.2 (yield stress). Given the room-temperature Rp0.2 of 231 MPa for NCI, the calculated σyy-max ≈ 809 MPa remains subcritical for cleavage initiation. Additionally, there are more movable slip systems in the upper shelf region. Multiple active slip systems promote coordinated grain deformation. The combination of low yield stress and multi-slip capability establishes intrinsic resistance to brittle crack nucleation and propagation.
These combined factors engender superior fracture toughness through stable micro-void coalescence mechanisms, consistent with classical ductile fracture characters in high-ductility materials.

4.1.2. Fracture Mechanisms in the Transition Region

The observed ductile–brittle transition behavior stems from dual synergistic mechanisms: thermally activated yield strength elevation and crack-tip stress field reconfiguration. Figure 11b demonstrates coexisting cleavage facets and ductile dimples, confirming mixed-mode fracture characteristics in the region. As previously mentioned, cleavage initiation critically depends on material yield strength or plastic flow stress. Temperature reduction induces progressive NCI yield strength and flow stress enhancement, driving σyy-max toward critical cleavage stress σf. On the other hand, Ostby et al. [28] pointed out that the propagation of ductile crack modifies crack-tip triaxiality and changes the local near-tip stress/strain field, amplifying maximum normal stress intensity by ≥6% through strain-induced constraint elevation. This synergistic intensification mechanism promotes the fracture mode from ductile dimples to unstable cleavage fracture.

4.1.3. Fracture Mechanisms in the Lower Shelf Region

In the lower shelf region, the pronounced yield strength elevation enables NCI to consistently satisfy cleavage fracture initiation criteria. Figure 11d reveals complete suppression of plastic blunting at fatigue pre-crack tips. The crack propagation zones exclusively exhibit cleavage features. The absence of ductile dimples and immediate cleavage initiation post-crack nucleation confirms a cleavage-controlled fracture mechanism in the lower shelf region.

4.2. The Role of Graphite Nodules in the Crack Propagation Process

Extensive experimental and theoretical investigations have been conducted to explain the fracture mechanisms of NCI [29,30,31,32]. Under ductile failure conditions, the characteristic fracture progression in NCI involves five sequential stages: (a) separation between nodular graphite and matrix under low stress; (b) plastic deformation in matrix around nodular graphite; (c) initiation of microcracks in deformed matrix between nodular graphite; (d) linkage of graphite elements by microcracks and formation of larger microcracks; (e) linkage of the main crack and selected microcracks to form macrocracks; Based on the in situ observation, Di Cocco et al. [31] pointed out that the main ferritic NCI damaging micro-mechanism consists of cracks nucleation and propagation in the graphite shell coming from the reduced carbon solubility in γ phase. From the fracture surface at room temperature (Figure 10b), it can be seen that the matrix between graphite nodules formed tearing edges under the influence of plastic flow or the growth and merging of micro-voids. Some graphite nodules were separated from the matrix, while others also suffered varying degrees of damage. During the plastic deformation, graphite nodules often served as the core for void deformation, promoting the formation of ductile dimples.
Figure 12 presents the cross-section near the fatigue pre-crack tip of the CT specimens at room temperature and −120 °C, with the crack propagation direction from right to left. Compared to room temperature, the fracture surface at low temperature is relatively flat, and the ferrite matrix exhibits negligible plastic deformation. The growth process of micro-voids was inhibited at low temperatures, and the stress concentration at the crack tip increased. In some fracture areas, the crack hardly deflected during propagation and directly bypassed the graphite nodule. Thus, a relatively flat cleavage plane was form macroscopically.

5. Conclusions

In this paper, the fracture toughness and fracture mechanism of NCI at different temperatures were investigated. The conclusions are as follows:
(1)
The fracture toughness of NCI demonstrates a temperature-dependent trend. KQ increased with decreasing temperature when the temperature was above −80 °C, and then decreased with decreasing temperature. δm shows a significant ductile–brittle transition behavior with the decrease in temperature.
(2)
The increased yield strength and reconstructed crack-tip stress field at low temperatures lead to the progressive fulfillment of cleavage fracture conditions in localized regions. The fracture mechanism undergoes progressive transition from ductile micro-void coalescence (above −60 °C) through mixed-mode propagation (−60 °C to −100 °C) to fully brittle cleavage fracture (below −100 °C).
(3)
In the case of ductile fracture, graphite nodules will promote the formation of dimples. At low temperature, the formation of dimples was inhibited, and the crack continued to expand in its original direction after bypassing the graphite nodule.

Author Contributions

Conceptualization, G.D. and X.R.; investigation, G.D., J.Z. and Y.J.; data analysis, Y.Z.; literature research, Y.J.; data curation, J.Z.; validation, G.D.; methodology, Y.Z. and X.R.; writing—original draft preparation, Y.J. and J.Z.; writing—review and editing, G.D., Y.Z. and X.R.; Resources, X.R. All authors have read and agreed to the published version of the manuscript.

Funding

This work was supported by the Ministry of Industry and Information Technology (TC240AAKP-156).

Data Availability Statement

The original contributions presented in this study are included in the article. Further inquiries can be directed to the corresponding author.

Acknowledgments

The authors gratefully thank Zhou Zhou from the Nuclear Equipment Safety and Reliability Center, China Productivity Center for Machinery Co., Ltd., for his assistance during the experiments and article writing process.

Conflicts of Interest

Authors Guobin Duan, Yu Jiang, and Yongxin Zhang are employed by the Nuclear Equipment Safety and Reliability Center, China Productivity Center for Machinery Co., Ltd. The remaining authors declare that the research was conducted in the absence of any commercial or financial relationships that could be construed as a potential conflict of interest.

References

  1. Morrogh, H.; Williams, W.J. The production of nodular graphite structures in cast iron. J. Iron Steel Inst. 1948, 158, 306–322. [Google Scholar]
  2. Bradley, W.L.; Srinivasan, M.N. Fracture and fracture toughness of cast irons. Int. Mater. Rev. 1990, 35, 129–161. [Google Scholar] [CrossRef]
  3. Bralower Paul, M. Ductile Iron Cask Cleared for Nuclear Fuel Storage. Mod. Cast. 1987, 77, 21–23. [Google Scholar]
  4. GB11806-2019; Regulations for the Safe Transport of Radioactive Materials. Standardization Administration of China: Beijing, China, 2019.
  5. Yu, P.S.; Zhao, J.H.; Guo, W.L. Three-dimensional Damage Tolerance Design: Out-of-plane Constraint Theory and Fatigue/Fracture Criteria. Jixie Gongcheng Xuebao/J. Mech. Eng. 2021, 57, 87–105. [Google Scholar]
  6. Ikeda, T.; Umetani, T.; Kai, N.; Noda, N.-A.; Sano, Y. Strain rate and temperature insensitiveness of notch-bend strength for high Si ductile cast iron. ISIJ Int. 2016, 56, 868–874. [Google Scholar] [CrossRef]
  7. Wang, W.; Wang, Z.; Sun, Z.; Zhou, Z.; Zhang, K.; Ma, L.; Wang, Y.; Yang, S.; Huang, Z.; Wang, K. Study of fractography of ferritic ductile iron at different temperatures and loading conditions. Mater. Res. Express 2024, 11, 016511. [Google Scholar] [CrossRef]
  8. Minnebo, P.; Nilsson, K.F.; Blagoeva, D. Tensile, compression and fracture properties of thick-walled ductile cast iron components. J. Mater. Eng. Perform. 2007, 16, 35–45. [Google Scholar] [CrossRef]
  9. Hütter, G.; Zybell, L.; Kuna, M. Micromechanisms of fracture in nodular cast iron: From experimental findings towards modeling strategies—A review. Eng. Fract. Mech. 2015, 144, 118–141. [Google Scholar] [CrossRef]
  10. Ghahremaninezhad, A.; Ravi-Chandar, K. Deformation and failure in nodular cast iron. Acta Mater. 2012, 60, 2359–2368. [Google Scholar] [CrossRef]
  11. Salzbrenner, R. Fracture toughness behaviour of ferritic ductile cast iron. J. Mater. Sci. 1987, 22, 2135–2147. [Google Scholar] [CrossRef]
  12. Kobayashi, T.; Yamada, S. Evaluation of static and dynamic fracture toughness in ductile cast iron. Metall. Mater. Trans. A 1994, 25, 2427–2436. [Google Scholar] [CrossRef]
  13. Baer, W. Performance of modern DCI materials—Investigation of microstructural, temperature and loading rate effects on mechanical and fracture mechanical properties. Mater. Sci. Forum 2014, 783–786, 2244–2249. [Google Scholar] [CrossRef]
  14. Zhu, M.L.; Xuan, F.Z. Effects of temperature on tensile and impact behavior of dissimilar welds of rotor steels. Mater. Des. 2010, 31, 3346–3352. [Google Scholar] [CrossRef]
  15. Jang, Y.C.; Lee, Y. A model to predict the fracture distance of cleavage fracture as a function of temperature. Eng. Fract. Mech. 2011, 78, 2082–2087. [Google Scholar] [CrossRef]
  16. Shashank Dutt, B.; Nani Babu, M.; Venugopal, S.; Sasikala, G.; Bhaduri, A.K. Effect of test temperature on fracture toughness of modified 9Cr-1Mo steel. Mater. Sci. Technol. 2011, 27, 1527–1533. [Google Scholar] [CrossRef]
  17. Xue, C.; Yang, M.; Liu, P.; Yan, L.; Shang, X.; Liang, Z.; Ren, X. Effects of rolling process and microstructure on the brittle crack initiation and arrest of a marine steel under low-temperature. Fatigue Fract. Eng. Mater. Struct. 2024, 47, 2841–2856. [Google Scholar] [CrossRef]
  18. Menzemer, C.C.; Srivatsan, T.S.; Ortiz, R. Influence of temperature on impact fracture behavior of an alloy steel. Mater. Des. 2001, 22, 659–667. [Google Scholar] [CrossRef]
  19. Zhang, X.N.; Qu, Y.D.; Li, R.D. Low Temperature Impact Toughness and Fracture Analysis of EN-GJS-400-18-LT Ductile Iron under Instrumented Impact Load. J. Iron Steel Res. Int. 2015, 22, 864–869. [Google Scholar] [CrossRef]
  20. Shaw, N.B.; Spink, G.M. Effect of Temperature, Specimen Size, and Geometry on the Fracture Toughness of a 3 Pct NiCrMoV Low Pressure Turbine Disc Steel. Metall. Trans. A 1983, 14, 751–759. [Google Scholar] [CrossRef]
  21. Xue, C.; Yang, M.; Liu, P.; Cheng, Y.; Shang, X.; Ren, X. Fracture Toughness and Fracture Mechanism of EH47 High-Strength Steel Subjected to Different Temperatures. Metall. Mater. Trans. A Phys. Metall. Mater. Sci. 2022, 53, 3588–3603. [Google Scholar] [CrossRef]
  22. ISO 945-4; Microstructure of Cast Irons—Part 4. International Organization for Standardization: Geneva, Switzerland, 2019.
  23. ISO 12135; Metallic Materials—Unified Method of Test for the Determination of Quasistatic Fracture Toughness. International Organization for Standardization: Geneva, Switzerland, 2021.
  24. ISO 1083; Spheroidal Graphite Cast Irons—Classification. International Organization for Standardization: Geneva, Switzerland, 2018.
  25. Spätig, P.; Odette, G.R.; Lucas, G.E. Low temperature yield properties of two 7-9Cr ferritic/martensitic steels. J. Nucl. Mater. 1999, 275, 324–331. [Google Scholar] [CrossRef]
  26. Chen, J.H.; Wang, G.Z. Study of mechanism of cleavage fracture at low temperature. Metall. Trans. A 1992, 23, 509–517. [Google Scholar] [CrossRef]
  27. Cao, R.; Li, G.; Fang, X.Y.; Song, J.; Chen, J.H. Investigation on the effects of microstructure on the impact and fracture toughness of a C-Mn steel with various microstructures. Mater. Sci. Eng. A 2013, 564, 509–524. [Google Scholar] [CrossRef]
  28. Østby, E.; Thaulow, C.; Zhang, Z.L. Numerical simulations of specimen size and mismatch effects in ductile crack growth—Part II: Near-tip stress fields. Eng. Fract. Mech. 2007, 74, 1793–1809. [Google Scholar] [CrossRef]
  29. Dai, P.Q.; He, Z.R.; Zheng, C.M.; Mao, Z.Y. In-situ SEM observation on the fracture of austempered ductile iron. Mater. Sci. Eng. A 2001, 319, 531–534. [Google Scholar] [CrossRef]
  30. Fan, Z.K.; Smallman, R.E. Some observations on the fracture of austempered ductile iron. Scr. Metall. Mater. 1994, 31, 137–142. [Google Scholar] [CrossRef]
  31. Di Cocco, V.; Iacoviello, F.; Cavallini, M. Damaging micromechanisms characterization of a ferritic ductile cast iron. Eng. Fract. Mech. 2010, 77, 2016–2023. [Google Scholar] [CrossRef]
  32. Zhang, X.N.; Qu, Y.D.; Li, R.D.; You, J.H. Mechanism of crack nucleation and propagation of ferrite ductile iron during impact fracture under low temperatures. Jinshu Xuebao/Acta Metall. Sin. 2015, 51, 1333–1340. [Google Scholar]
Figure 1. Optical micrographs of NCI: (a) metallographic structure after polishing; (b) metallographic structure after etching.
Metals 15 00828 g001
Figure 2. Dimensions of tensile specimen.
Metals 15 00828 g002
Figure 3. Dimensions of CT specimen.
Metals 15 00828 g003
Figure 4. Tensile stress–strain curves at different temperatures.
Metals 15 00828 g004
Figure 5. Yield and ultimate tensile strength of NCI at different temperatures.
Metals 15 00828 g005
Figure 6. Microscopic surfaces of tensile specimens at different temperatures: (a,b) room temperature; (c,d) −40 °C; (e,f) −80 °C; and (g,h) −120 °C.
Metals 15 00828 g006
Figure 7. Typical loading curves of CT specimens at different temperatures.
Metals 15 00828 g007
Figure 8. Variations in fracture toughness with temperature: (a) KQ and (b) δmax.
Metals 15 00828 g008
Figure 9. Macroscopic surface of CT specimens at different temperatures: (a) room temperature; (b) −20 °C; (c) −40 °C; (d) −60 °C; (e) −80 °C; (f) −100 °C; (g) −120 °C.
Metals 15 00828 g009
Figure 10. Microscopic surface of CT specimens: (a,b) room temperature; (c,d) −40 °C.
Metals 15 00828 g010
Figure 11. Microscopic surface of CT specimens: (ac) −80 °C; (df) −100 °C.
Metals 15 00828 g011
Figure 12. The profile fracture morphology of NCI: (a,b) room temperature; (c,d) −120 °C.
Metals 15 00828 g012
Table 1. Chemical composition of experimental NCI (wt.%).
CSiNipMnAlCrTiSFe
2.971.850.550.0280.0250.0120.0110.010.0046Balance
Table 2. Tensile test results of NCI tested at different temperatures.
Temperature
T (°C)
Yield Strength
Rp0.2 (MPa)
Ultimate Tensile Strength
Rm (MPa)
Elongation
(Pct)
Reduction in Area
(Pct)
20230.84361.7526.0021.68
−20246.50382.5126.8020.79
−40260.17400.7925.8023.44
−60281.00410.2327.0022.56
−80284.70423.7128.8020.79
−100301.20436.7625.0017.19
−120315.70452.2920.2015.36
Table 3. Fracture toughness values of ductile iron at different temperatures.
Temperature
(°C)
Sample IDα0/WFQ or Fmax
(kN)
F m a x F Q KQ
(Mpa m0.5)
2.5 K Q R p 0.2 2
(mm)
δm
(μm)
201-10.5246.351.6342.1481.07167.30
−202-10.5051.291.6043.7978.57171.10
−403-10.5252.151.5647.4583.27140.59
−604-10.5058.611.5850.6681.26160.85
4-20.5058.201.6050.1579.63148.08
−805-10.5063.041.3551.9482.6248.79
5-20.5063.221.2951.5281.3032.77
5-30.5146.831.6349.2874.39120.57
5-40.5146.571.5747.3168.5579.04
−1006-10.5162.041.0854.7782.778.39
6-20.5062.811.0154.4081.656.17
6-30.5149.371.2247.6062.5212.38
−1207-10.5043.631.0040.8441.760.41
Disclaimer/Publisher’s Note: The statements, opinions and data contained in all publications are solely those of the individual author(s) and contributor(s) and not of MDPI and/or the editor(s). MDPI and/or the editor(s) disclaim responsibility for any injury to people or property resulting from any ideas, methods, instructions or products referred to in the content.