
Experimental Investigation on Microstructure and Mechanical Properties of Deep Cryogenically Treated Vanadium Alloy Steels


Abstract
1. Introduction
2. Materials and Experimental Methods
2.1. Materials
2.2. Experimental Methods
3. Results and Discussion
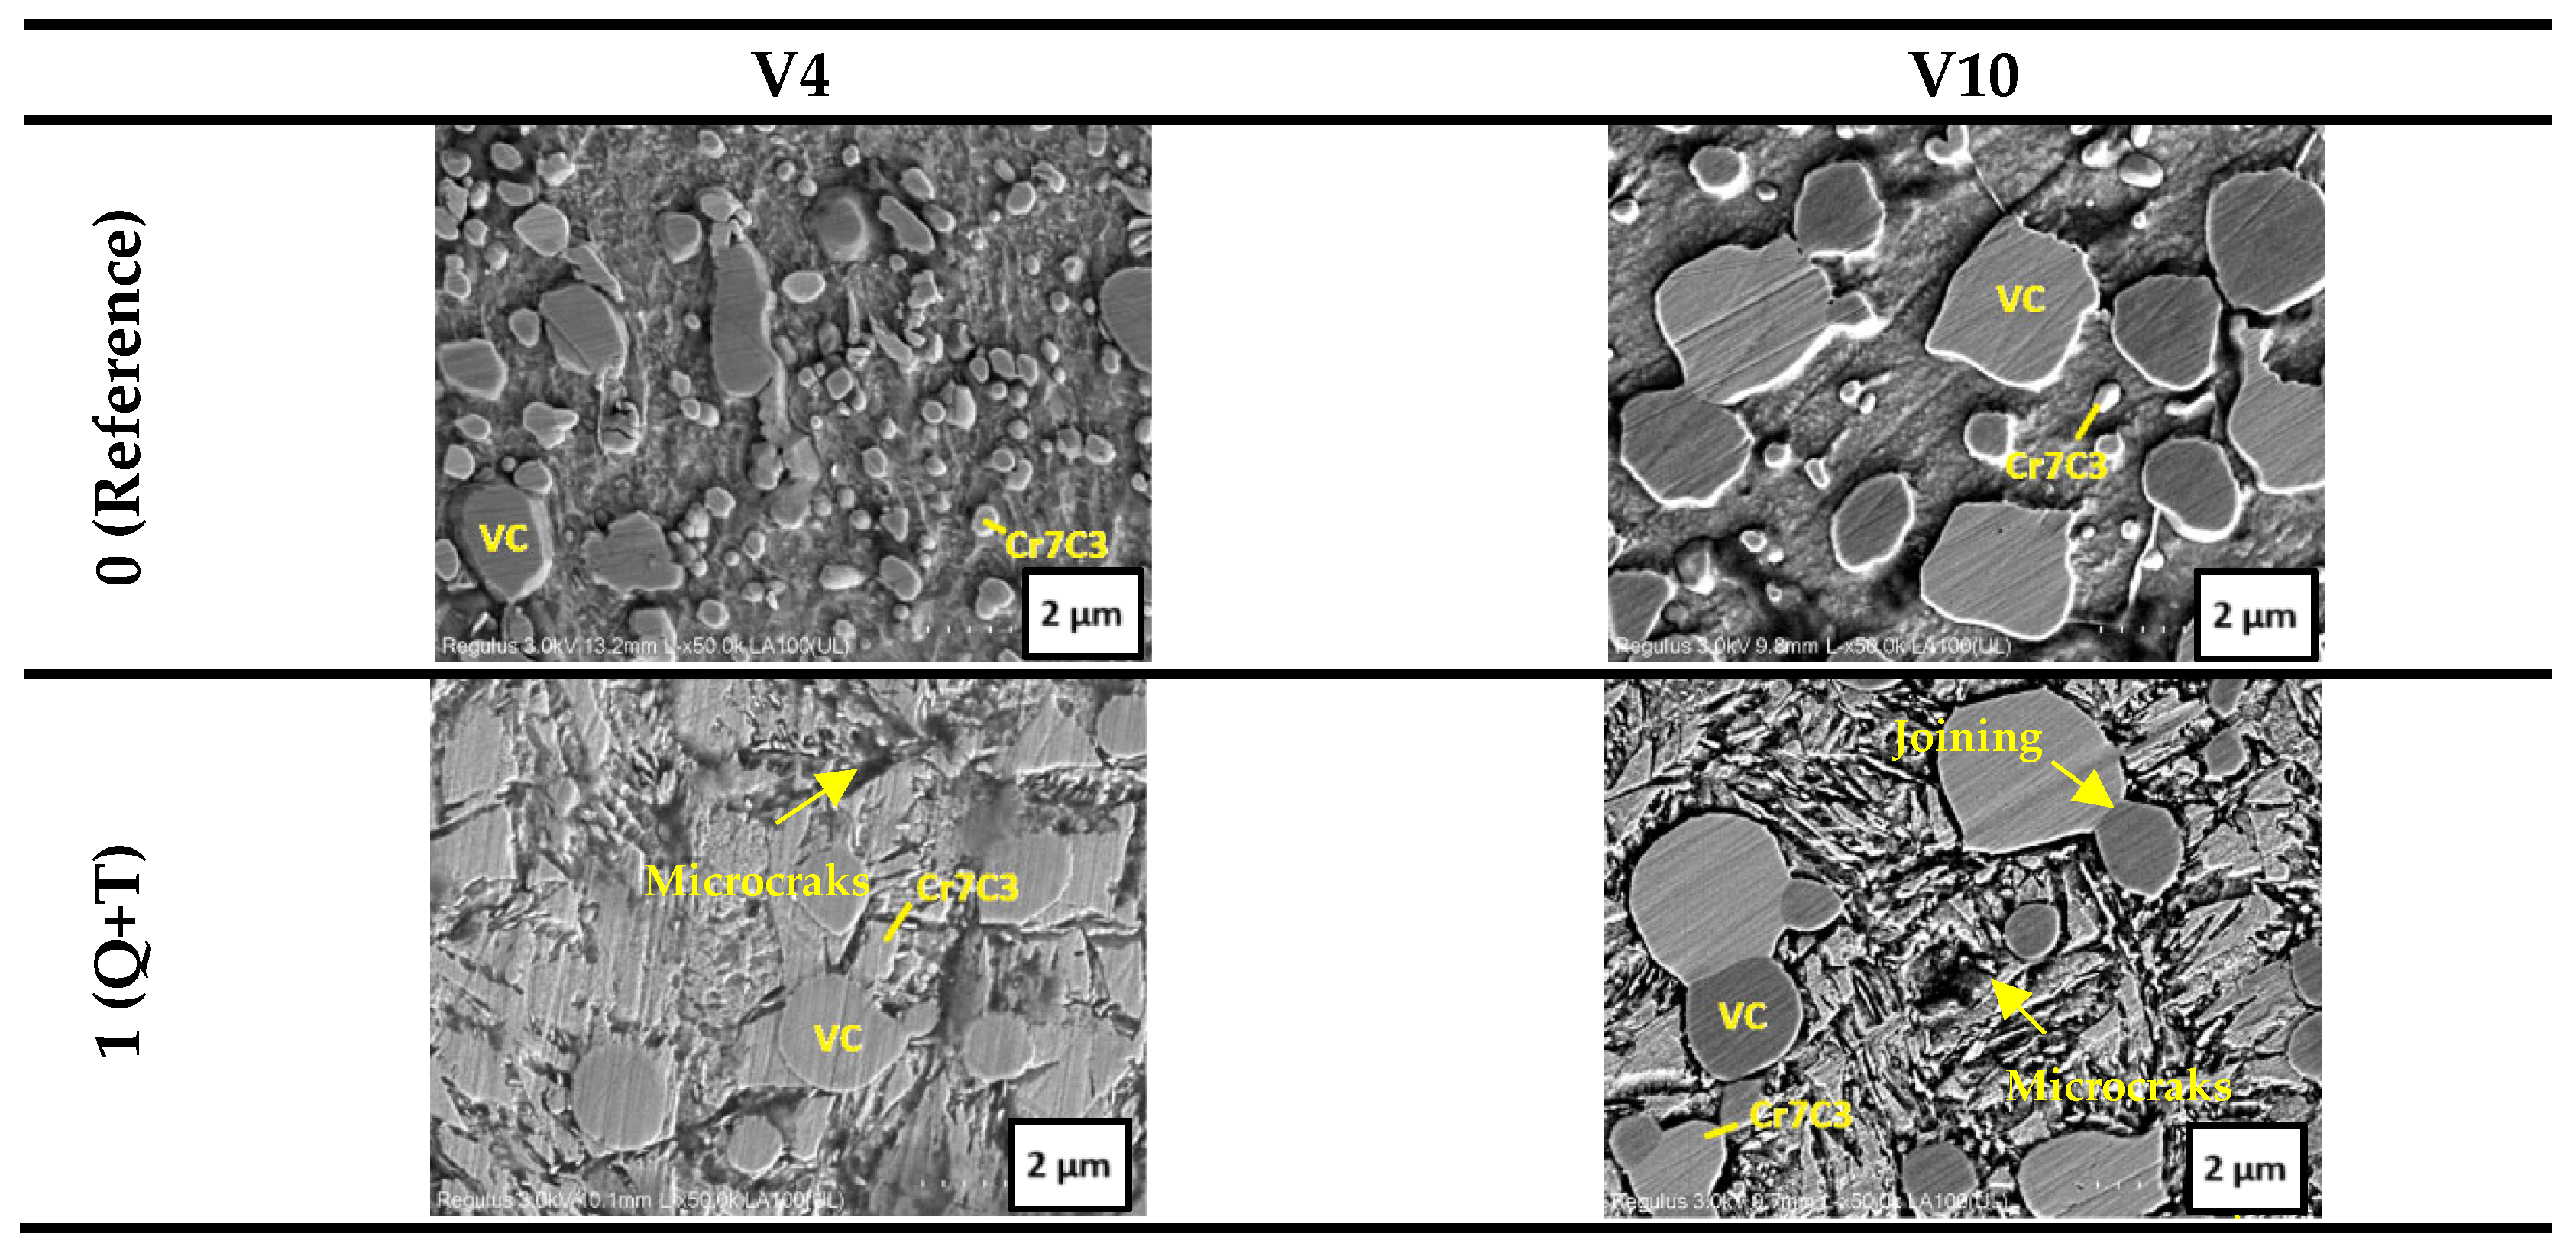
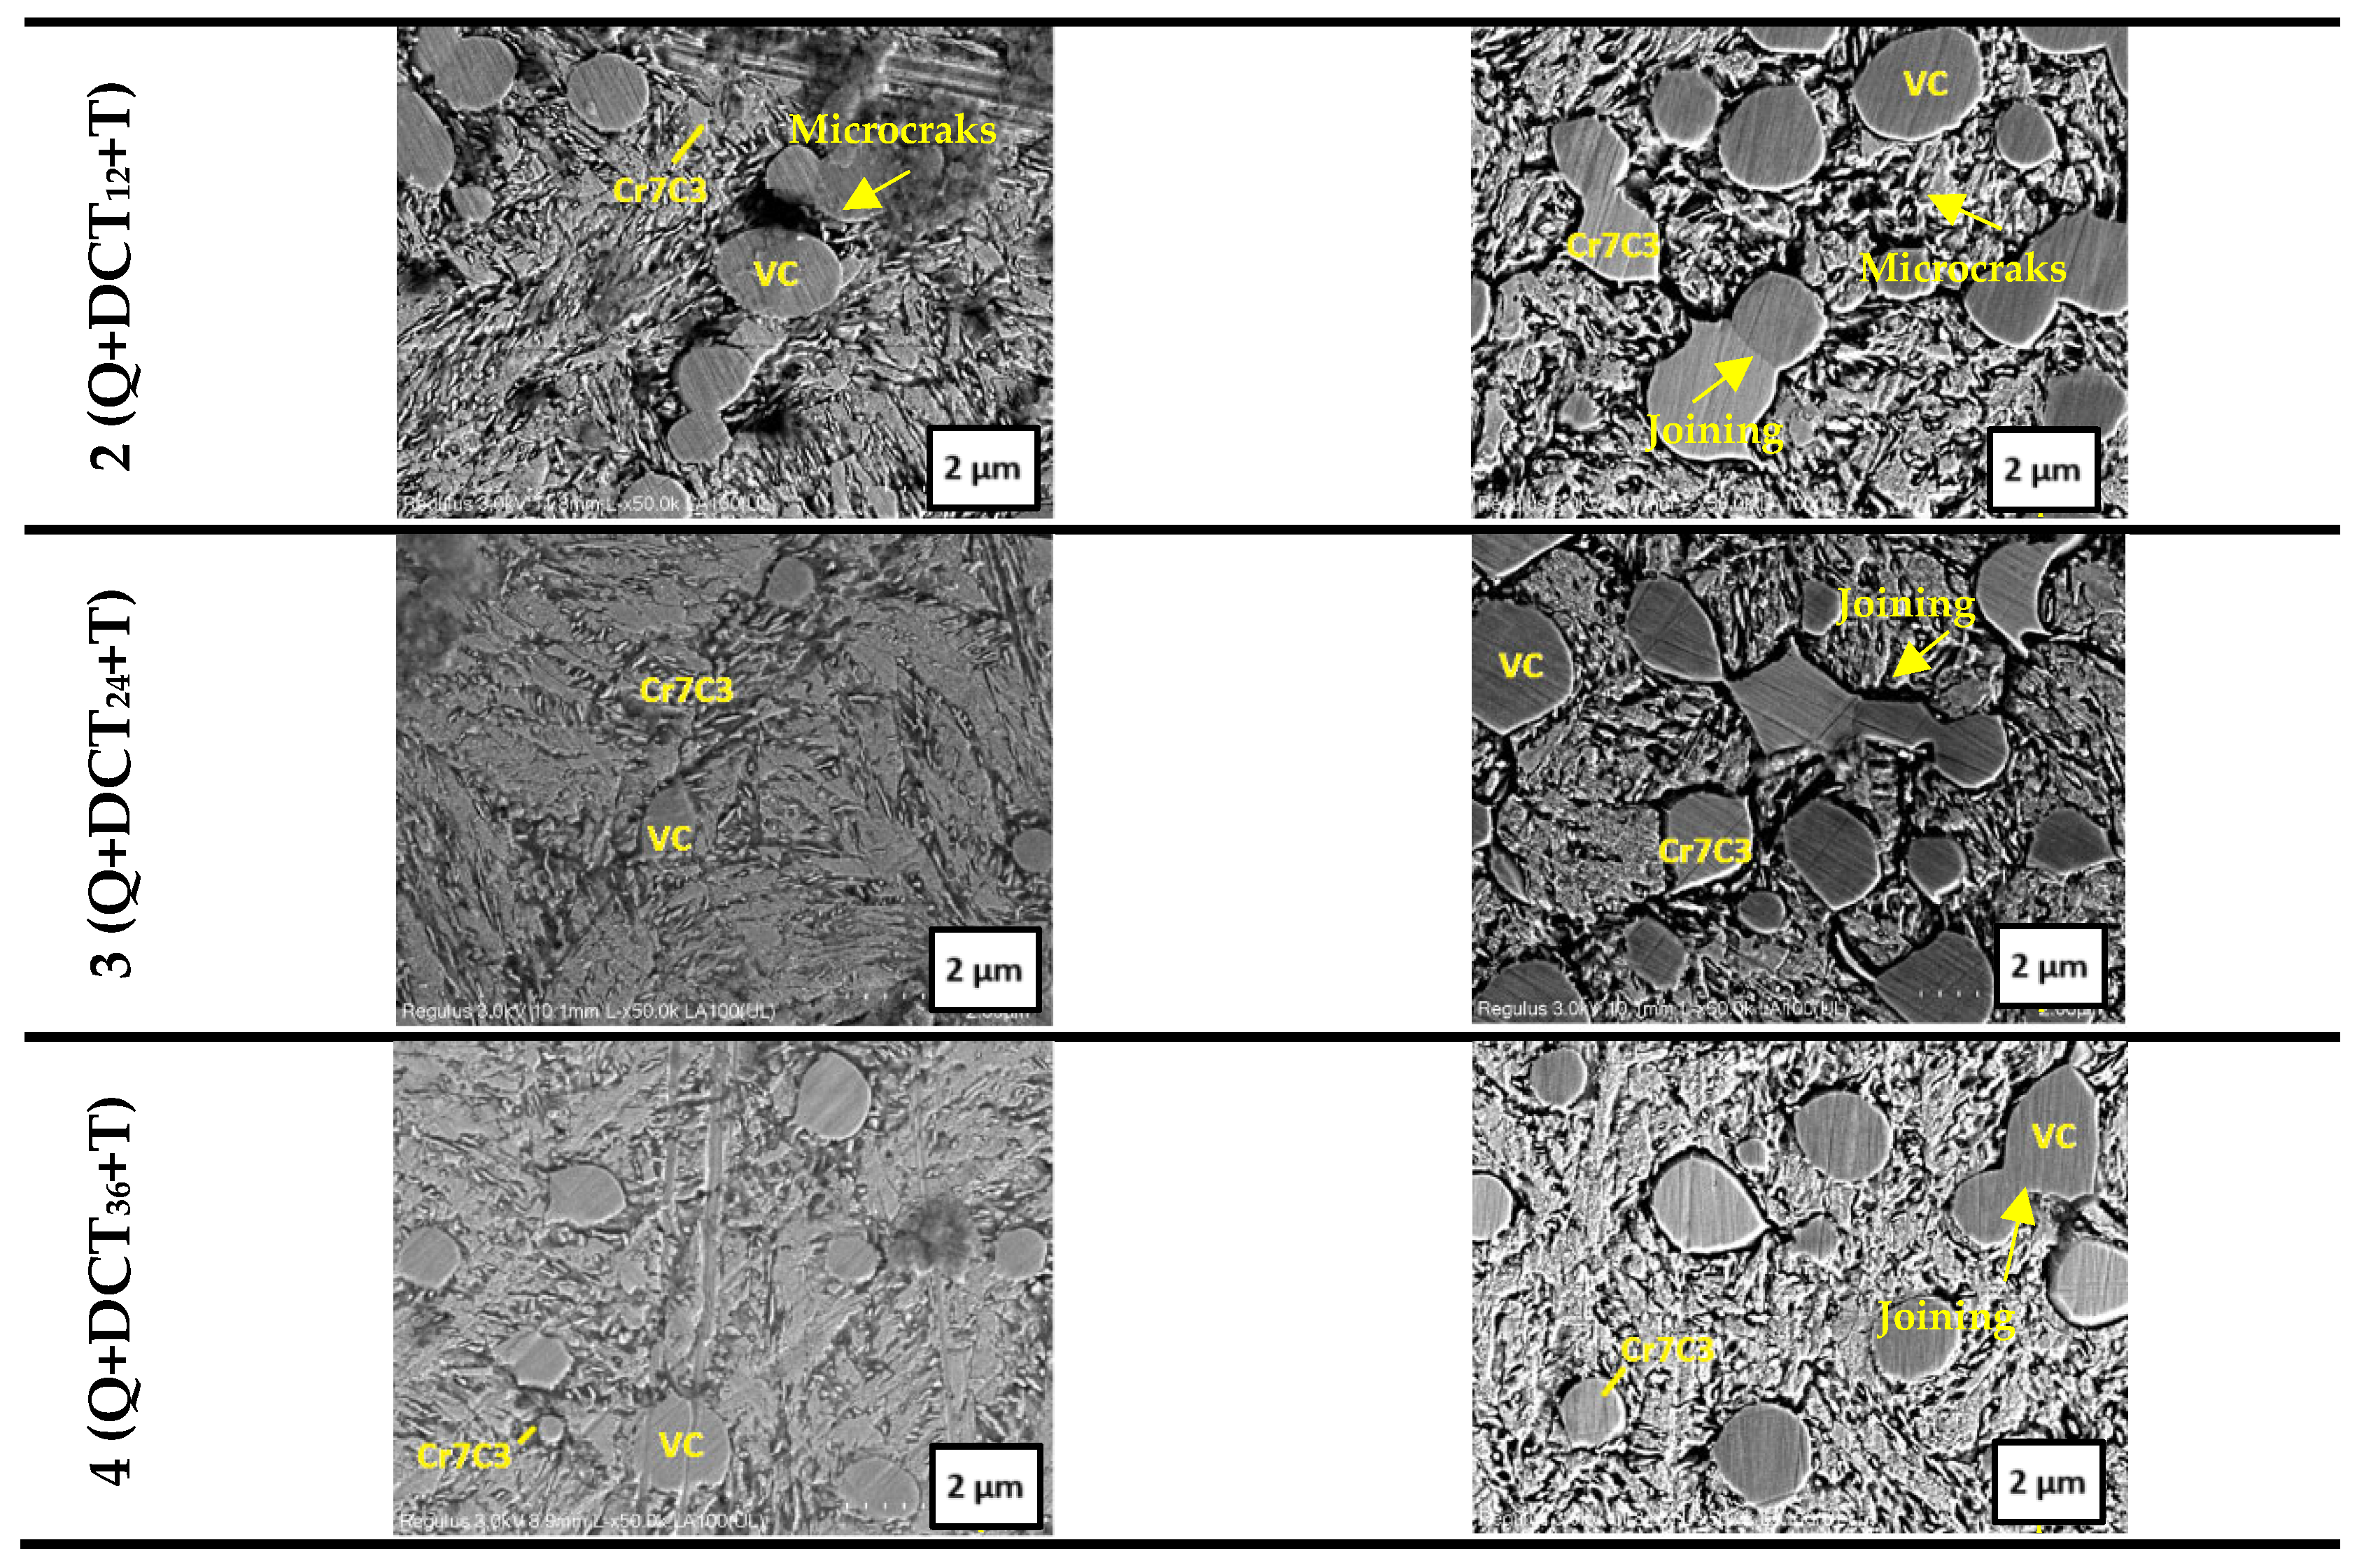
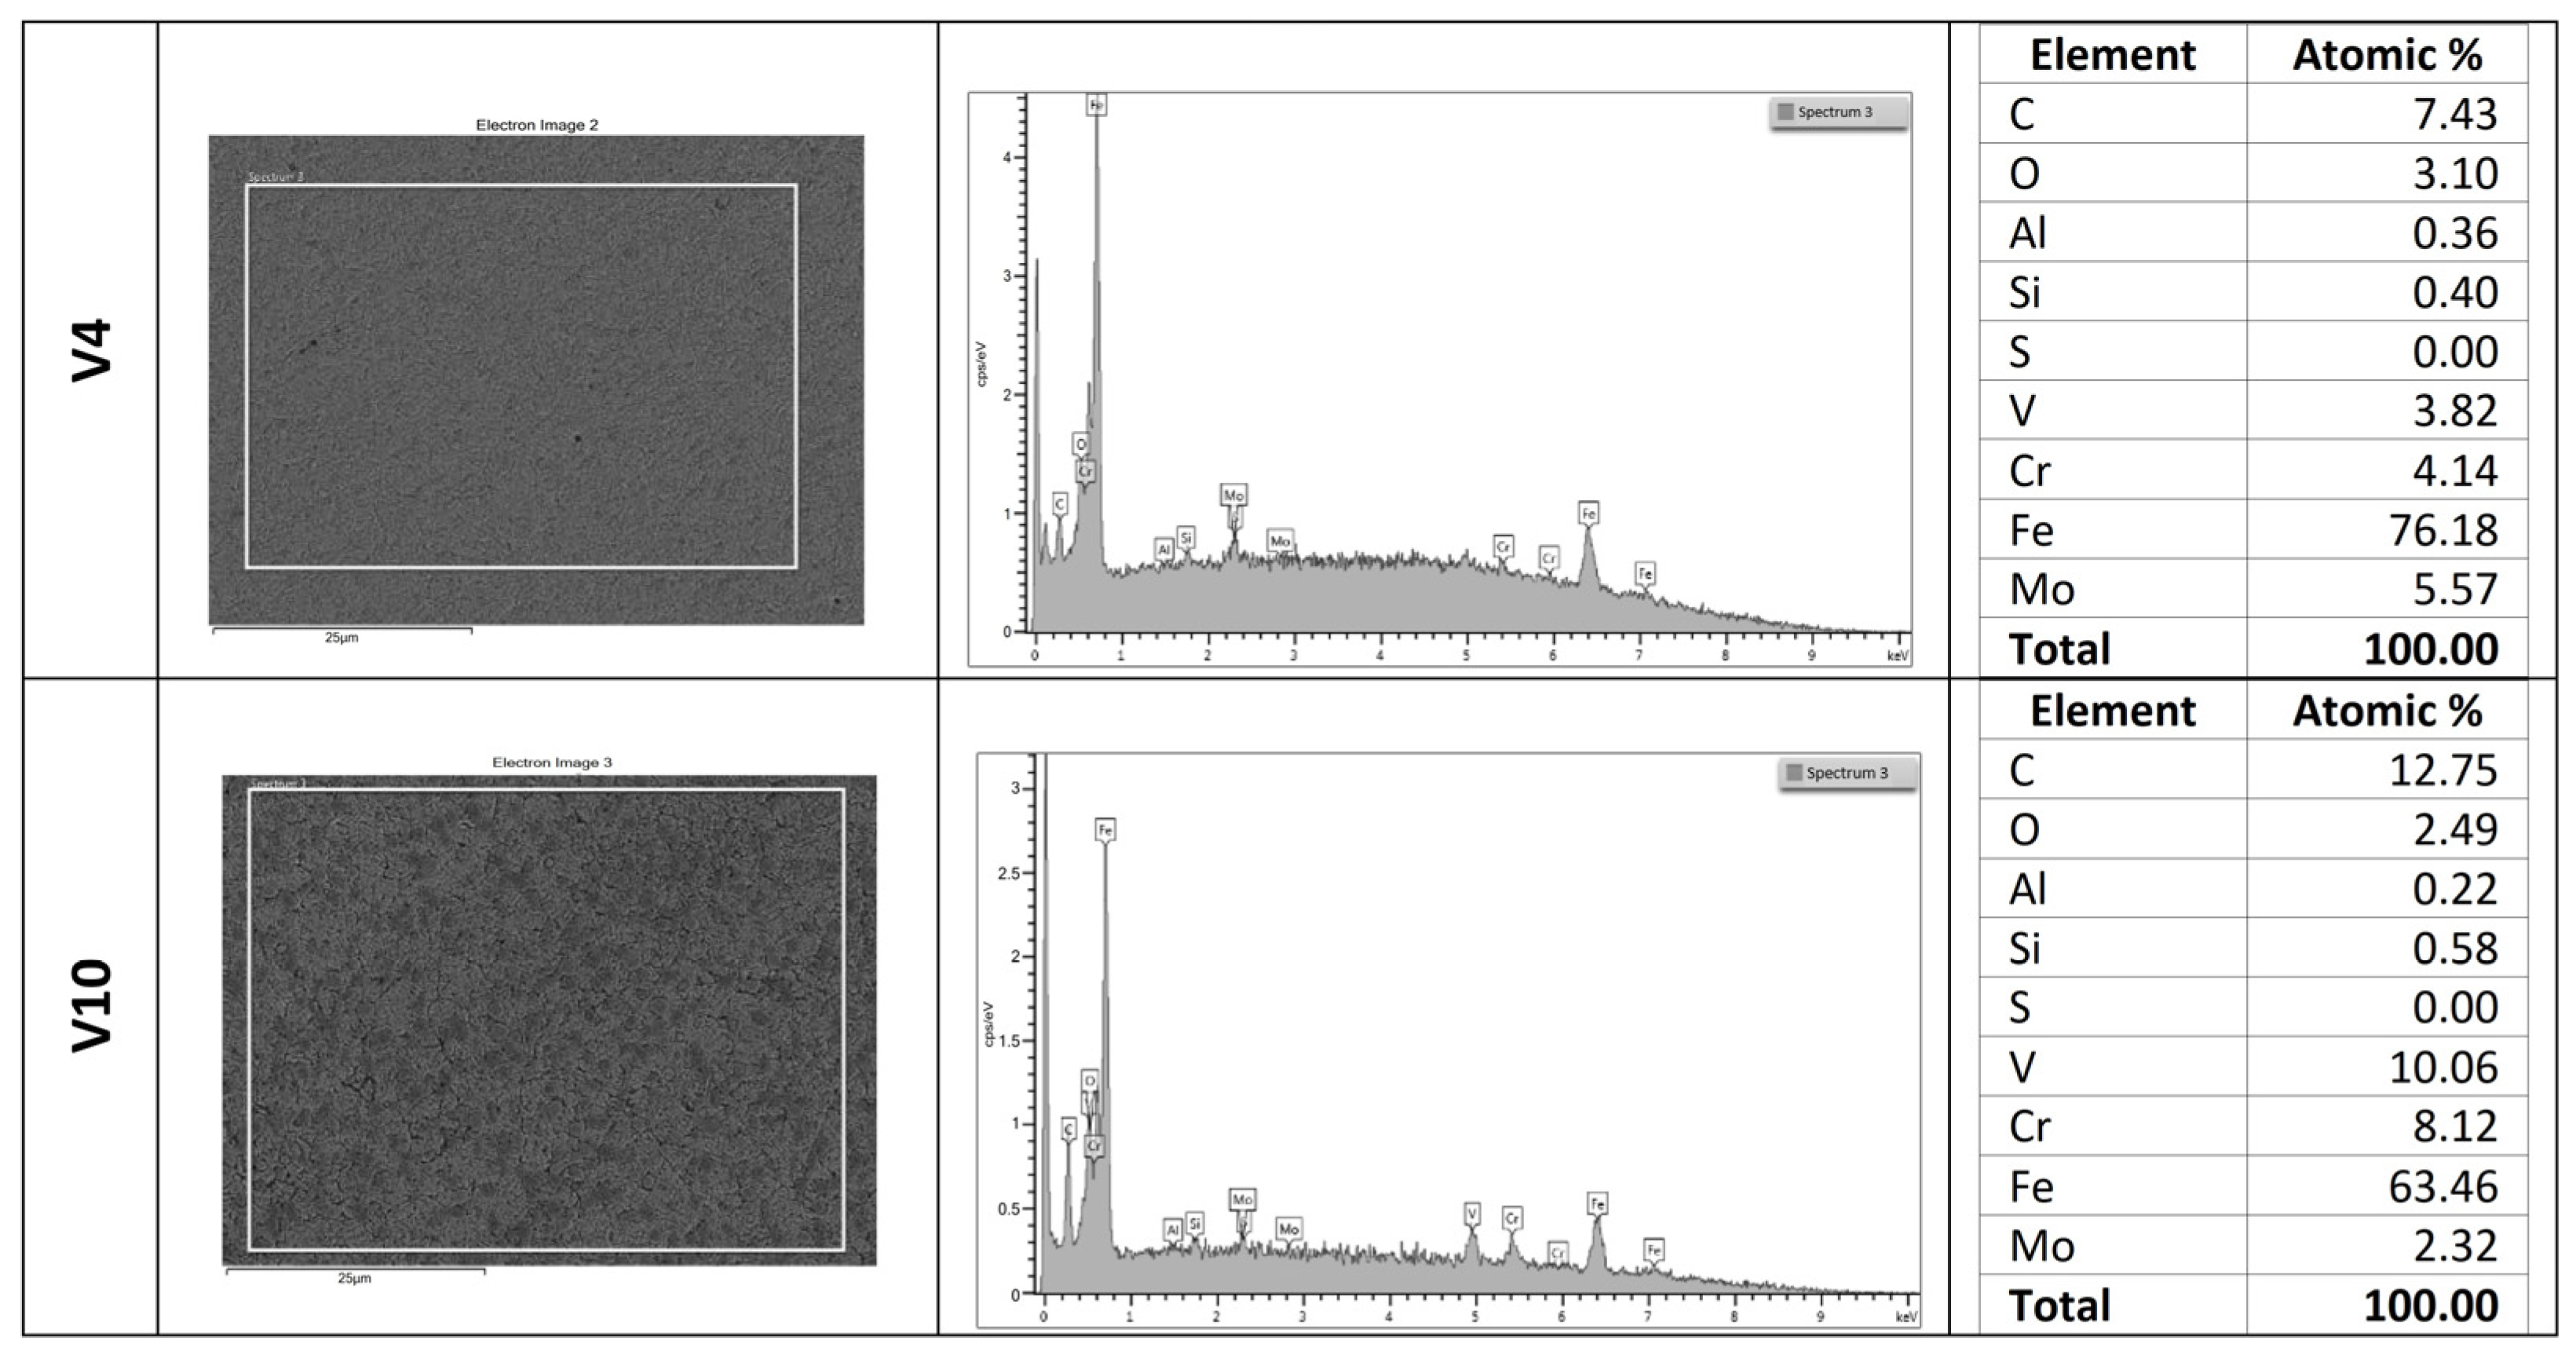
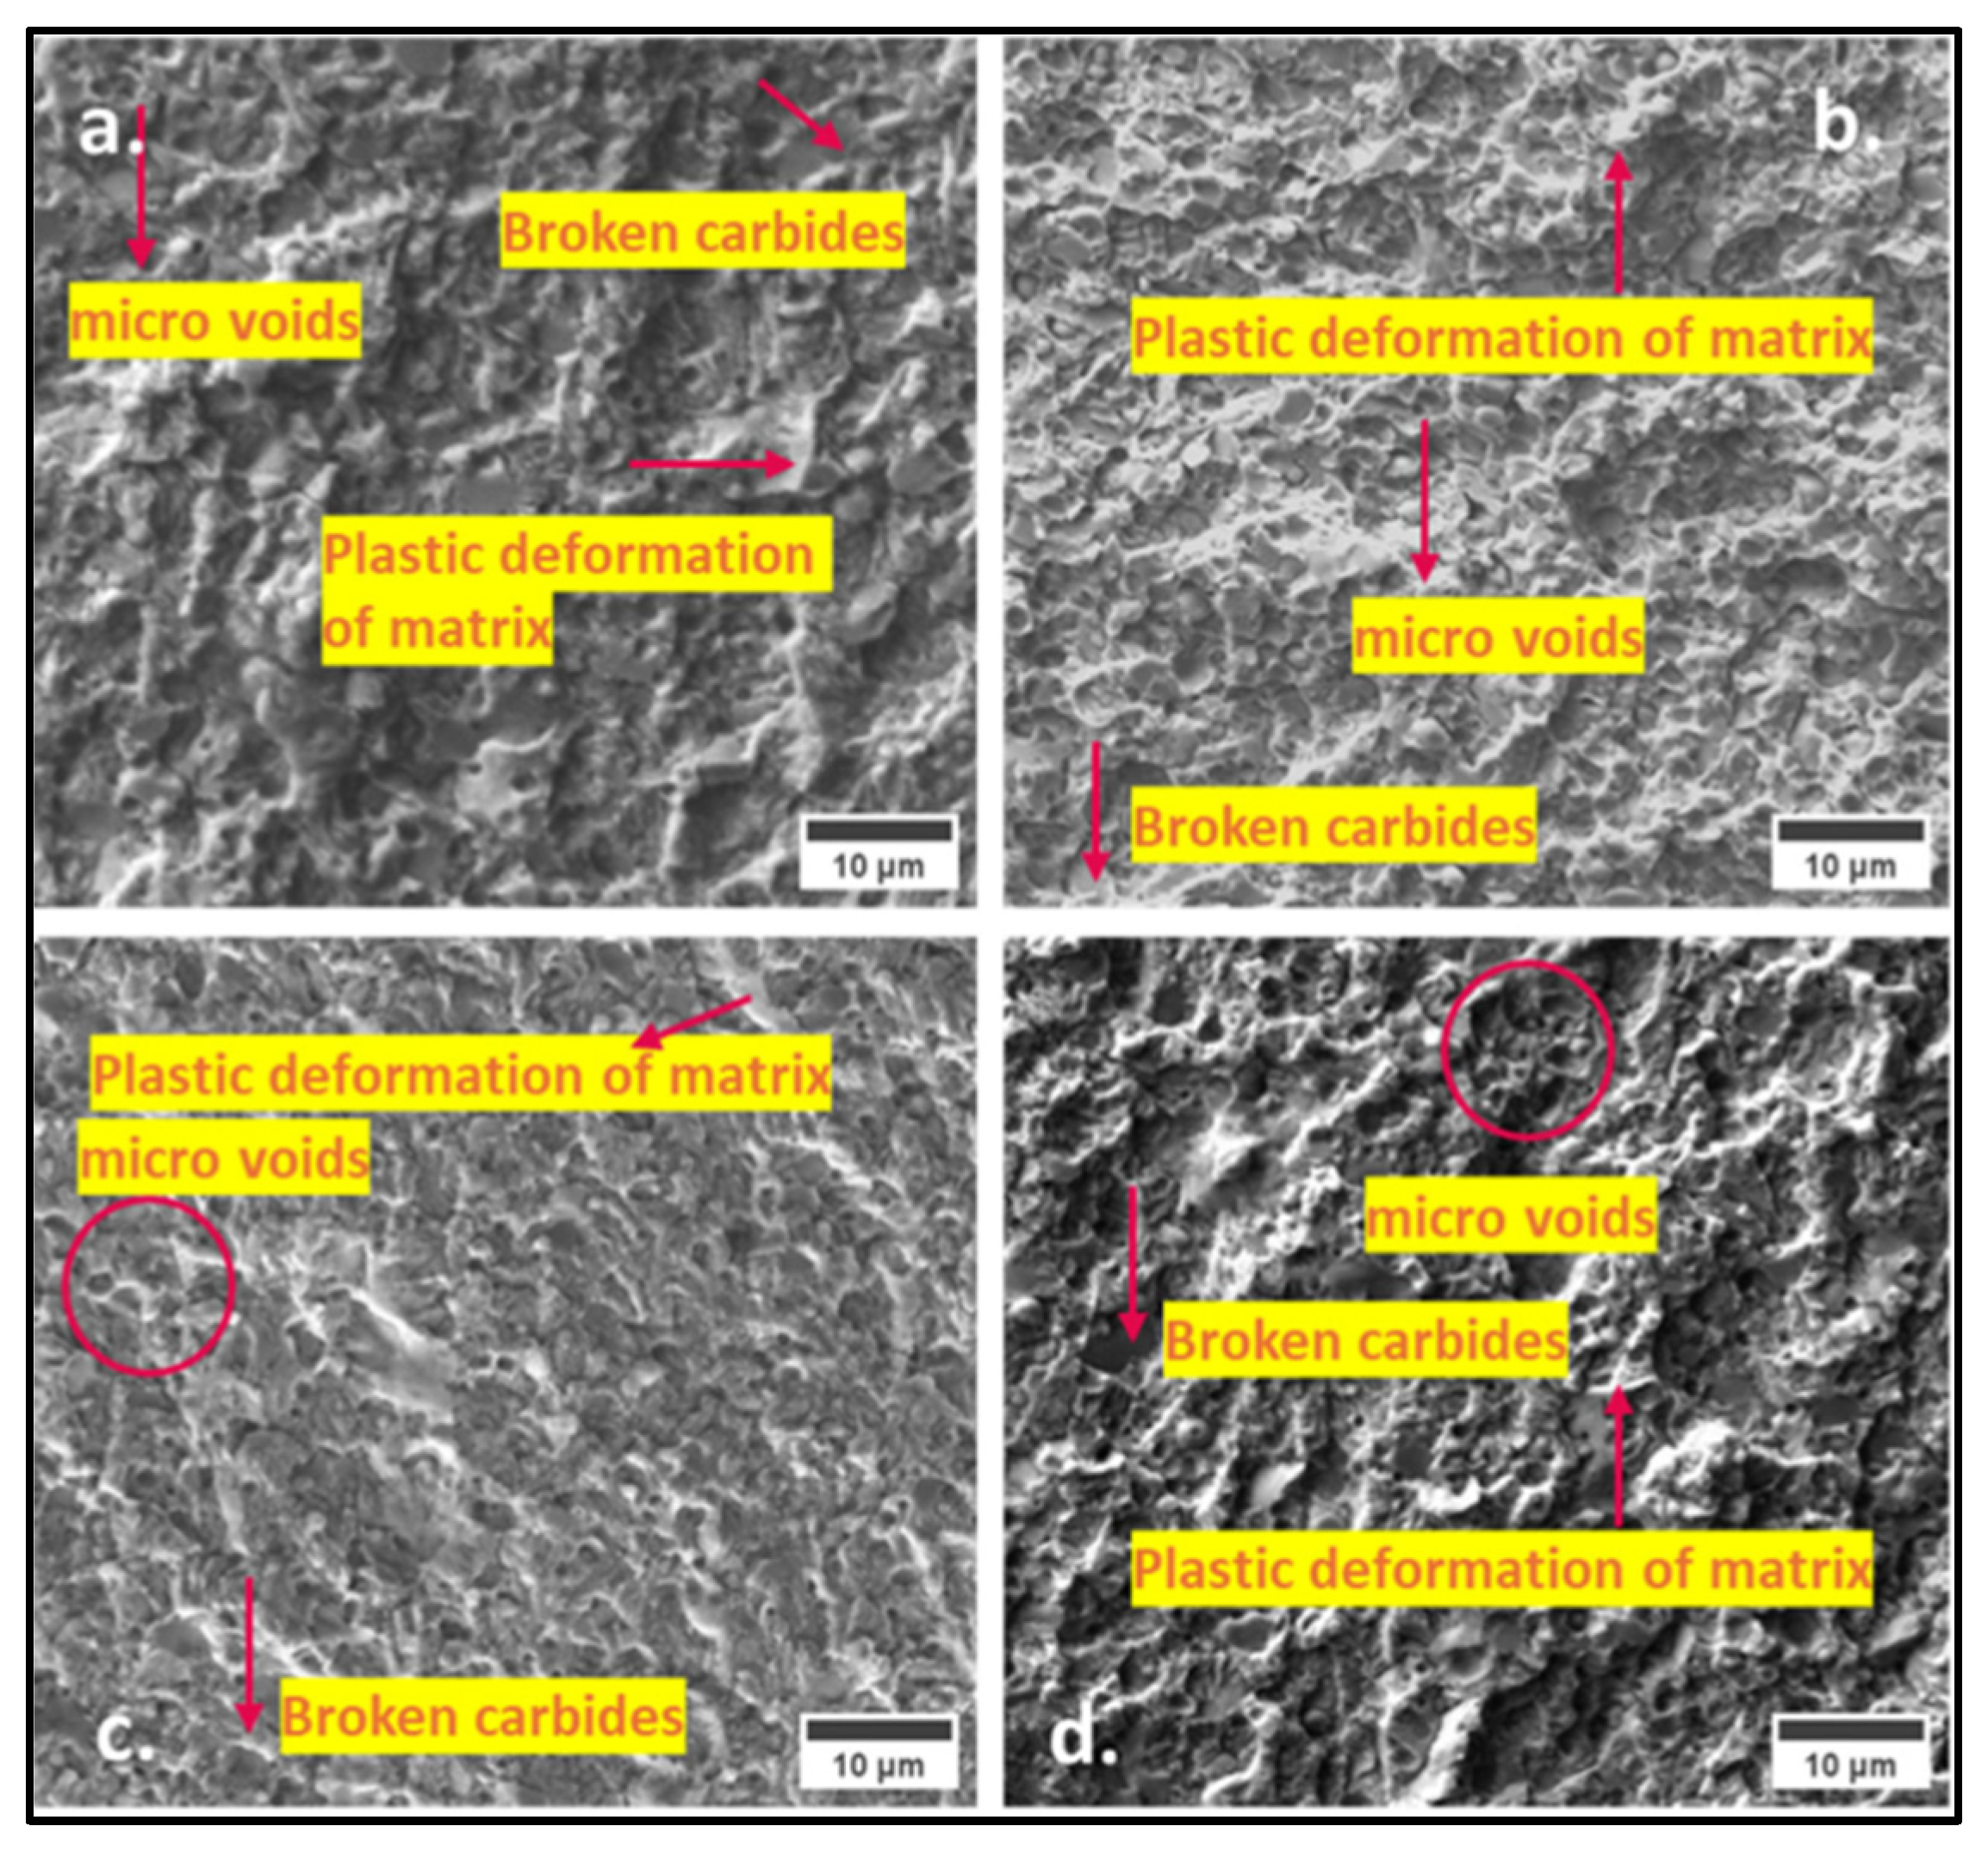
3.1. SEM–EDS Analysis
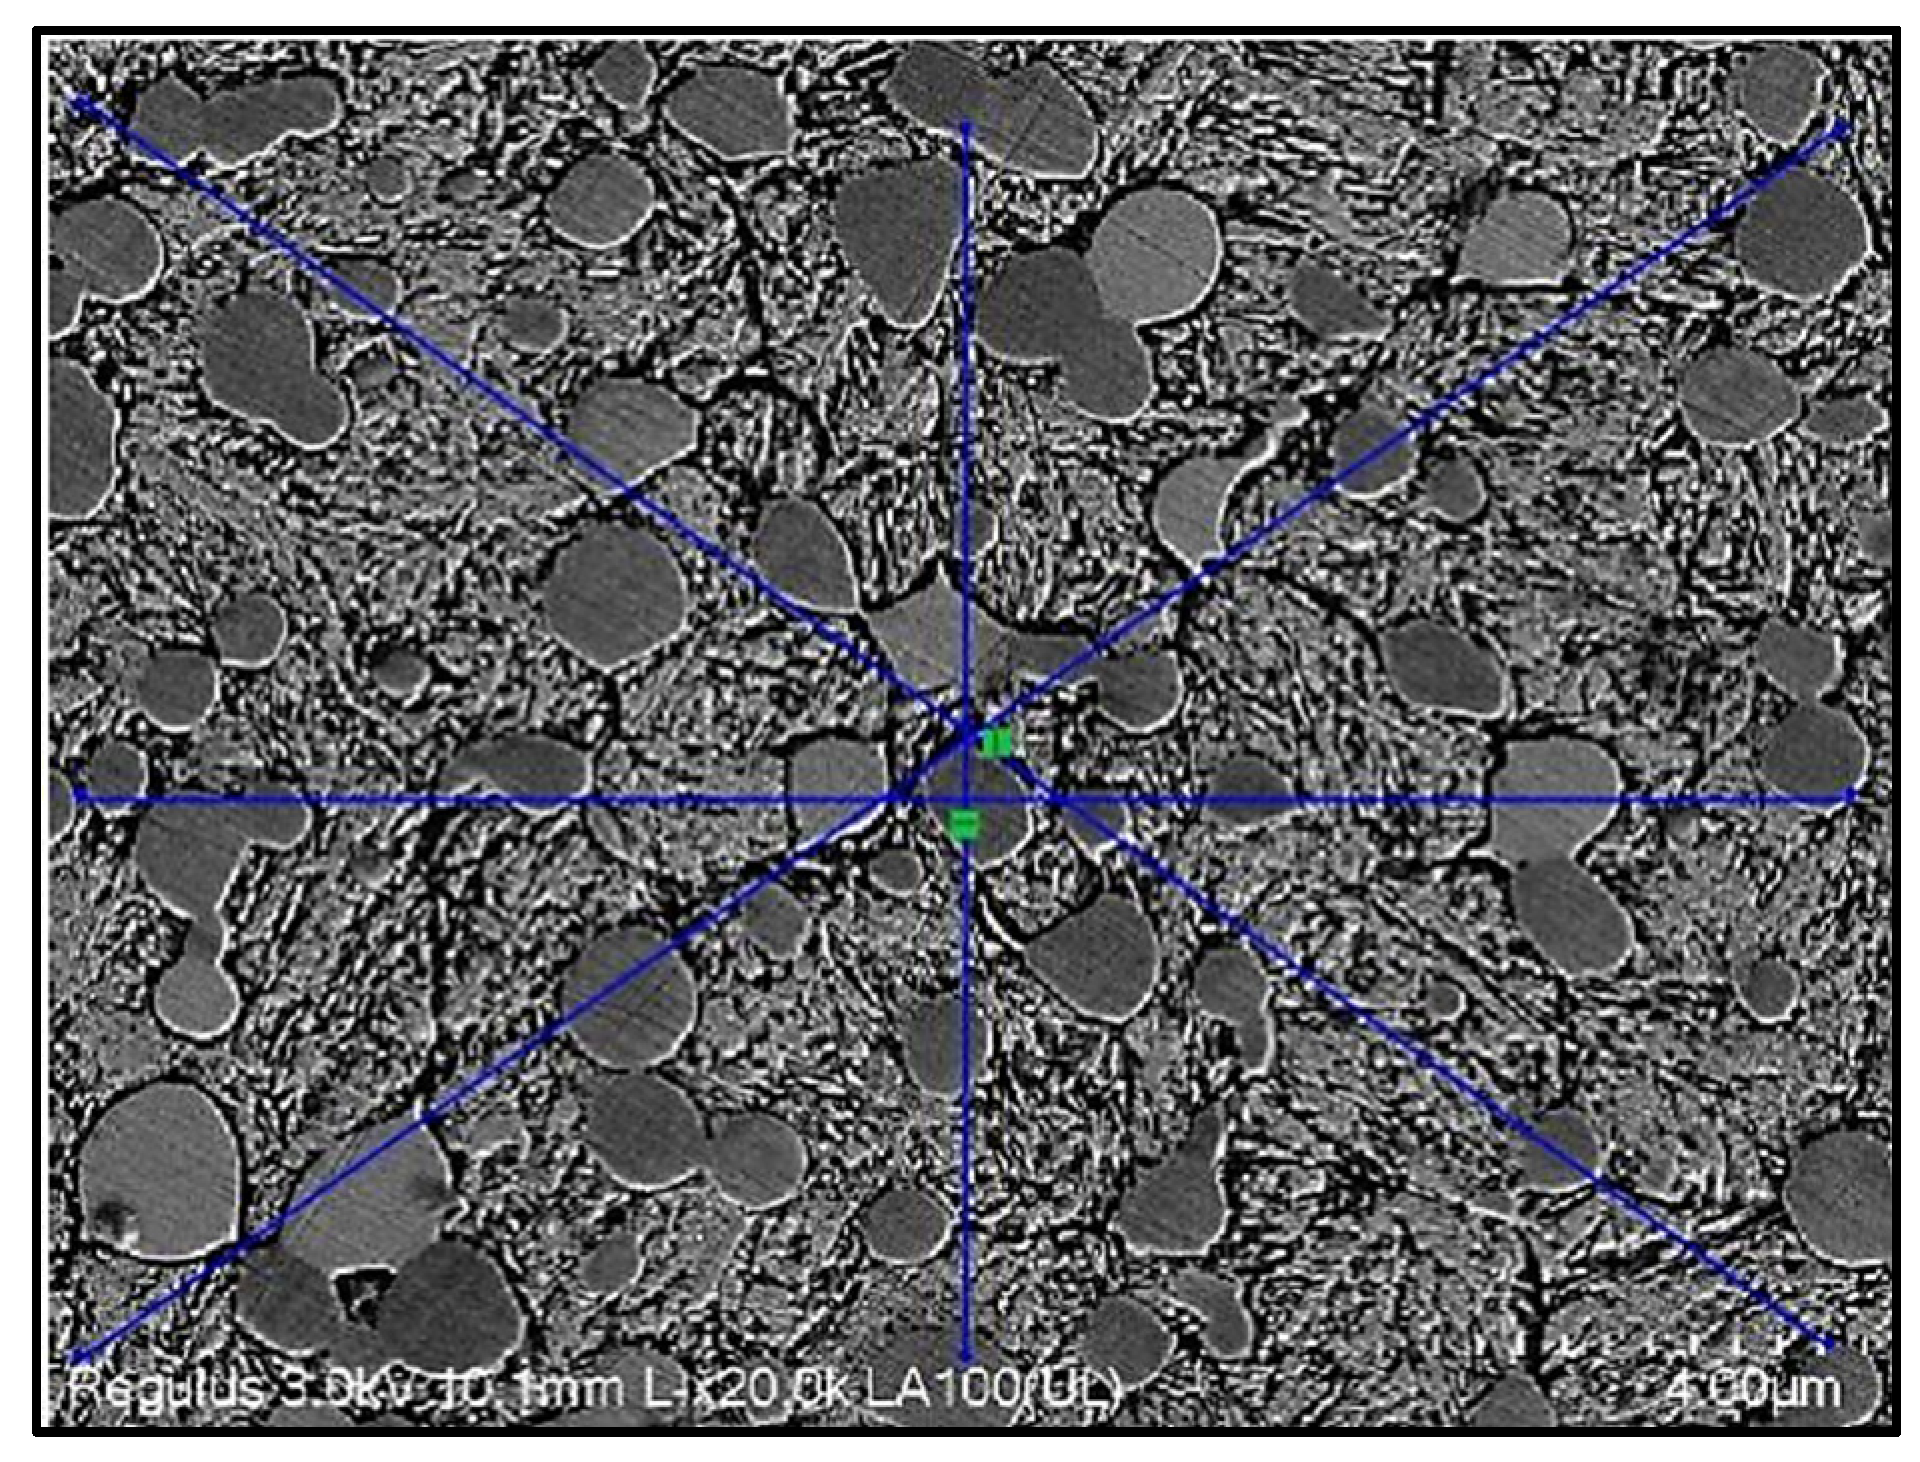
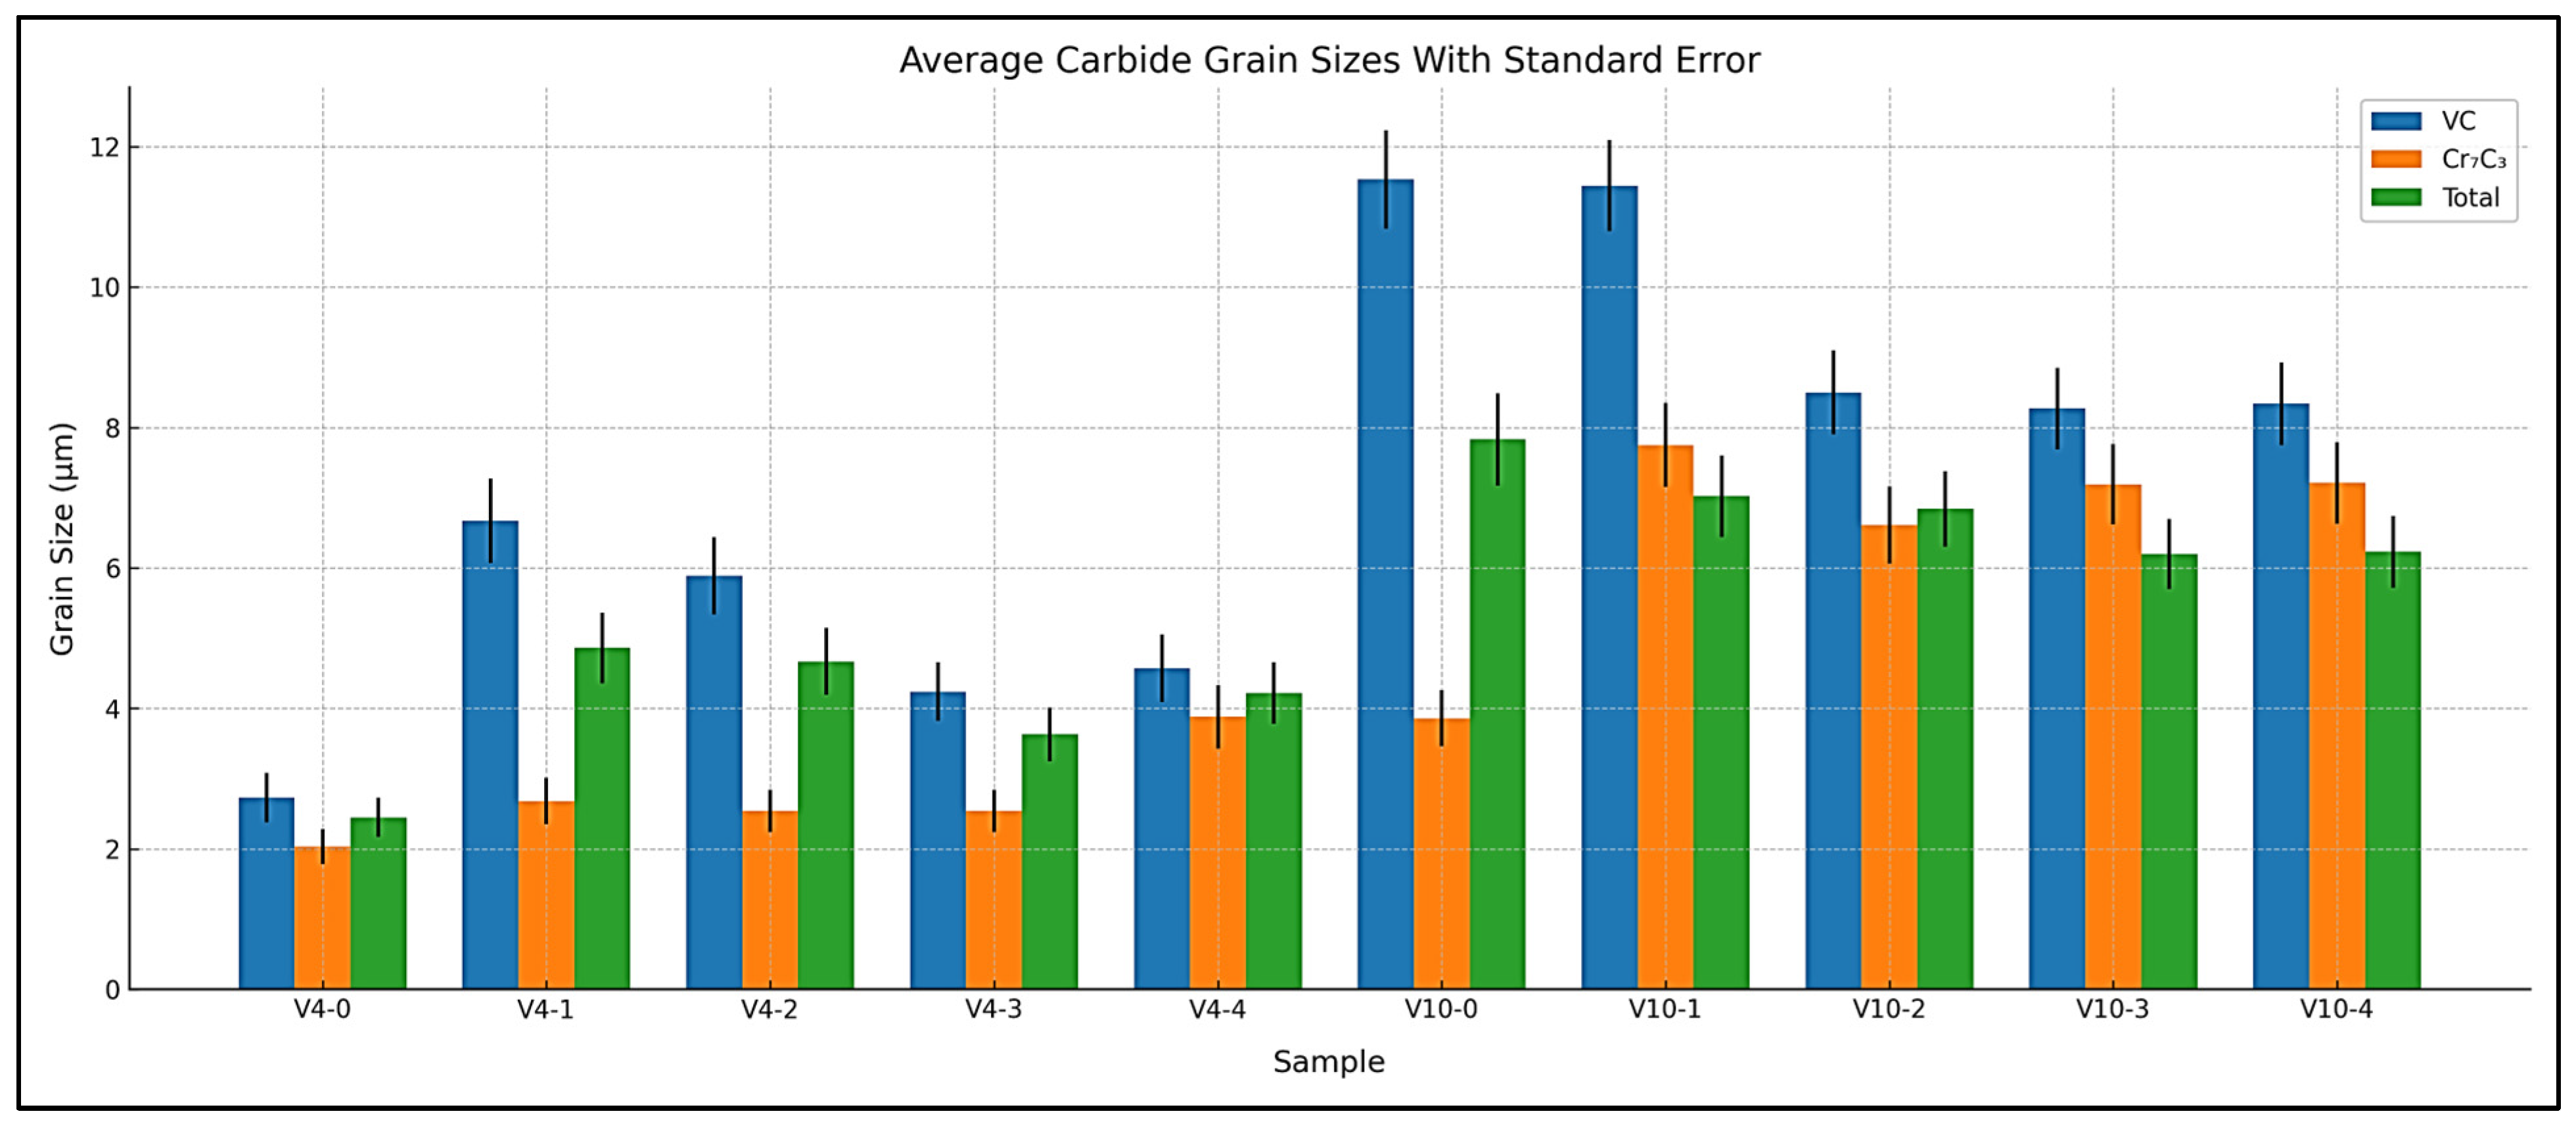
3.2. Carbide Size Measurement
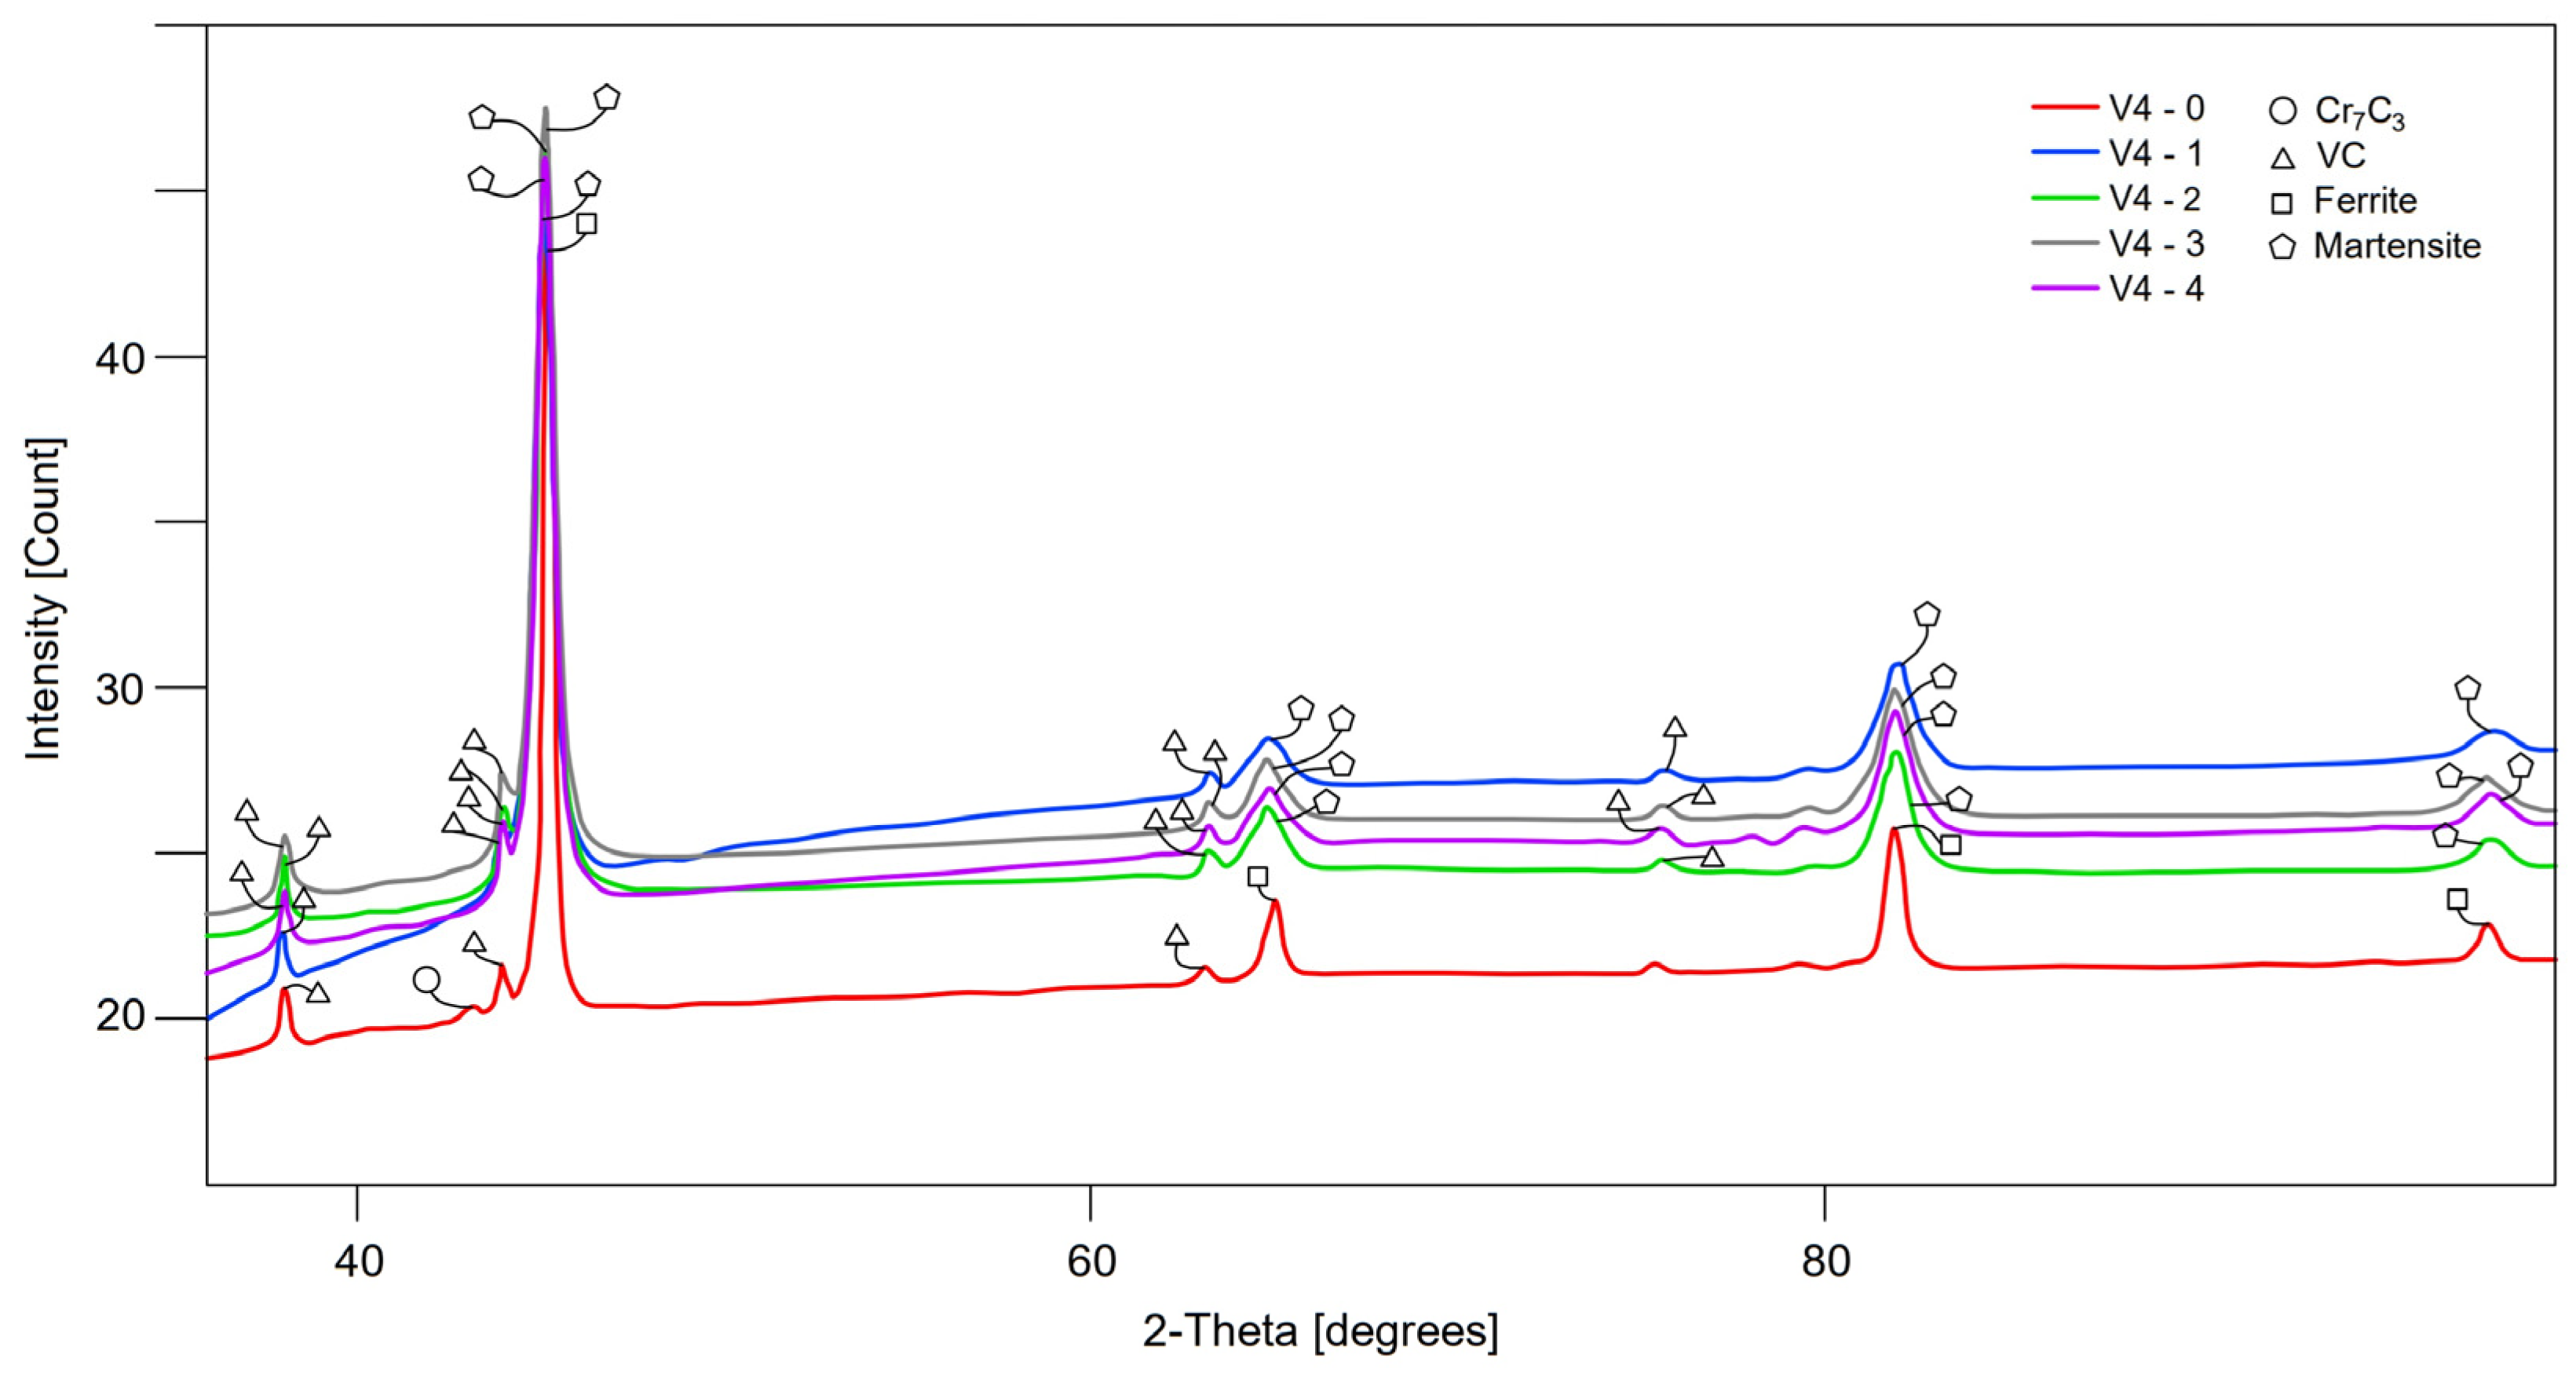
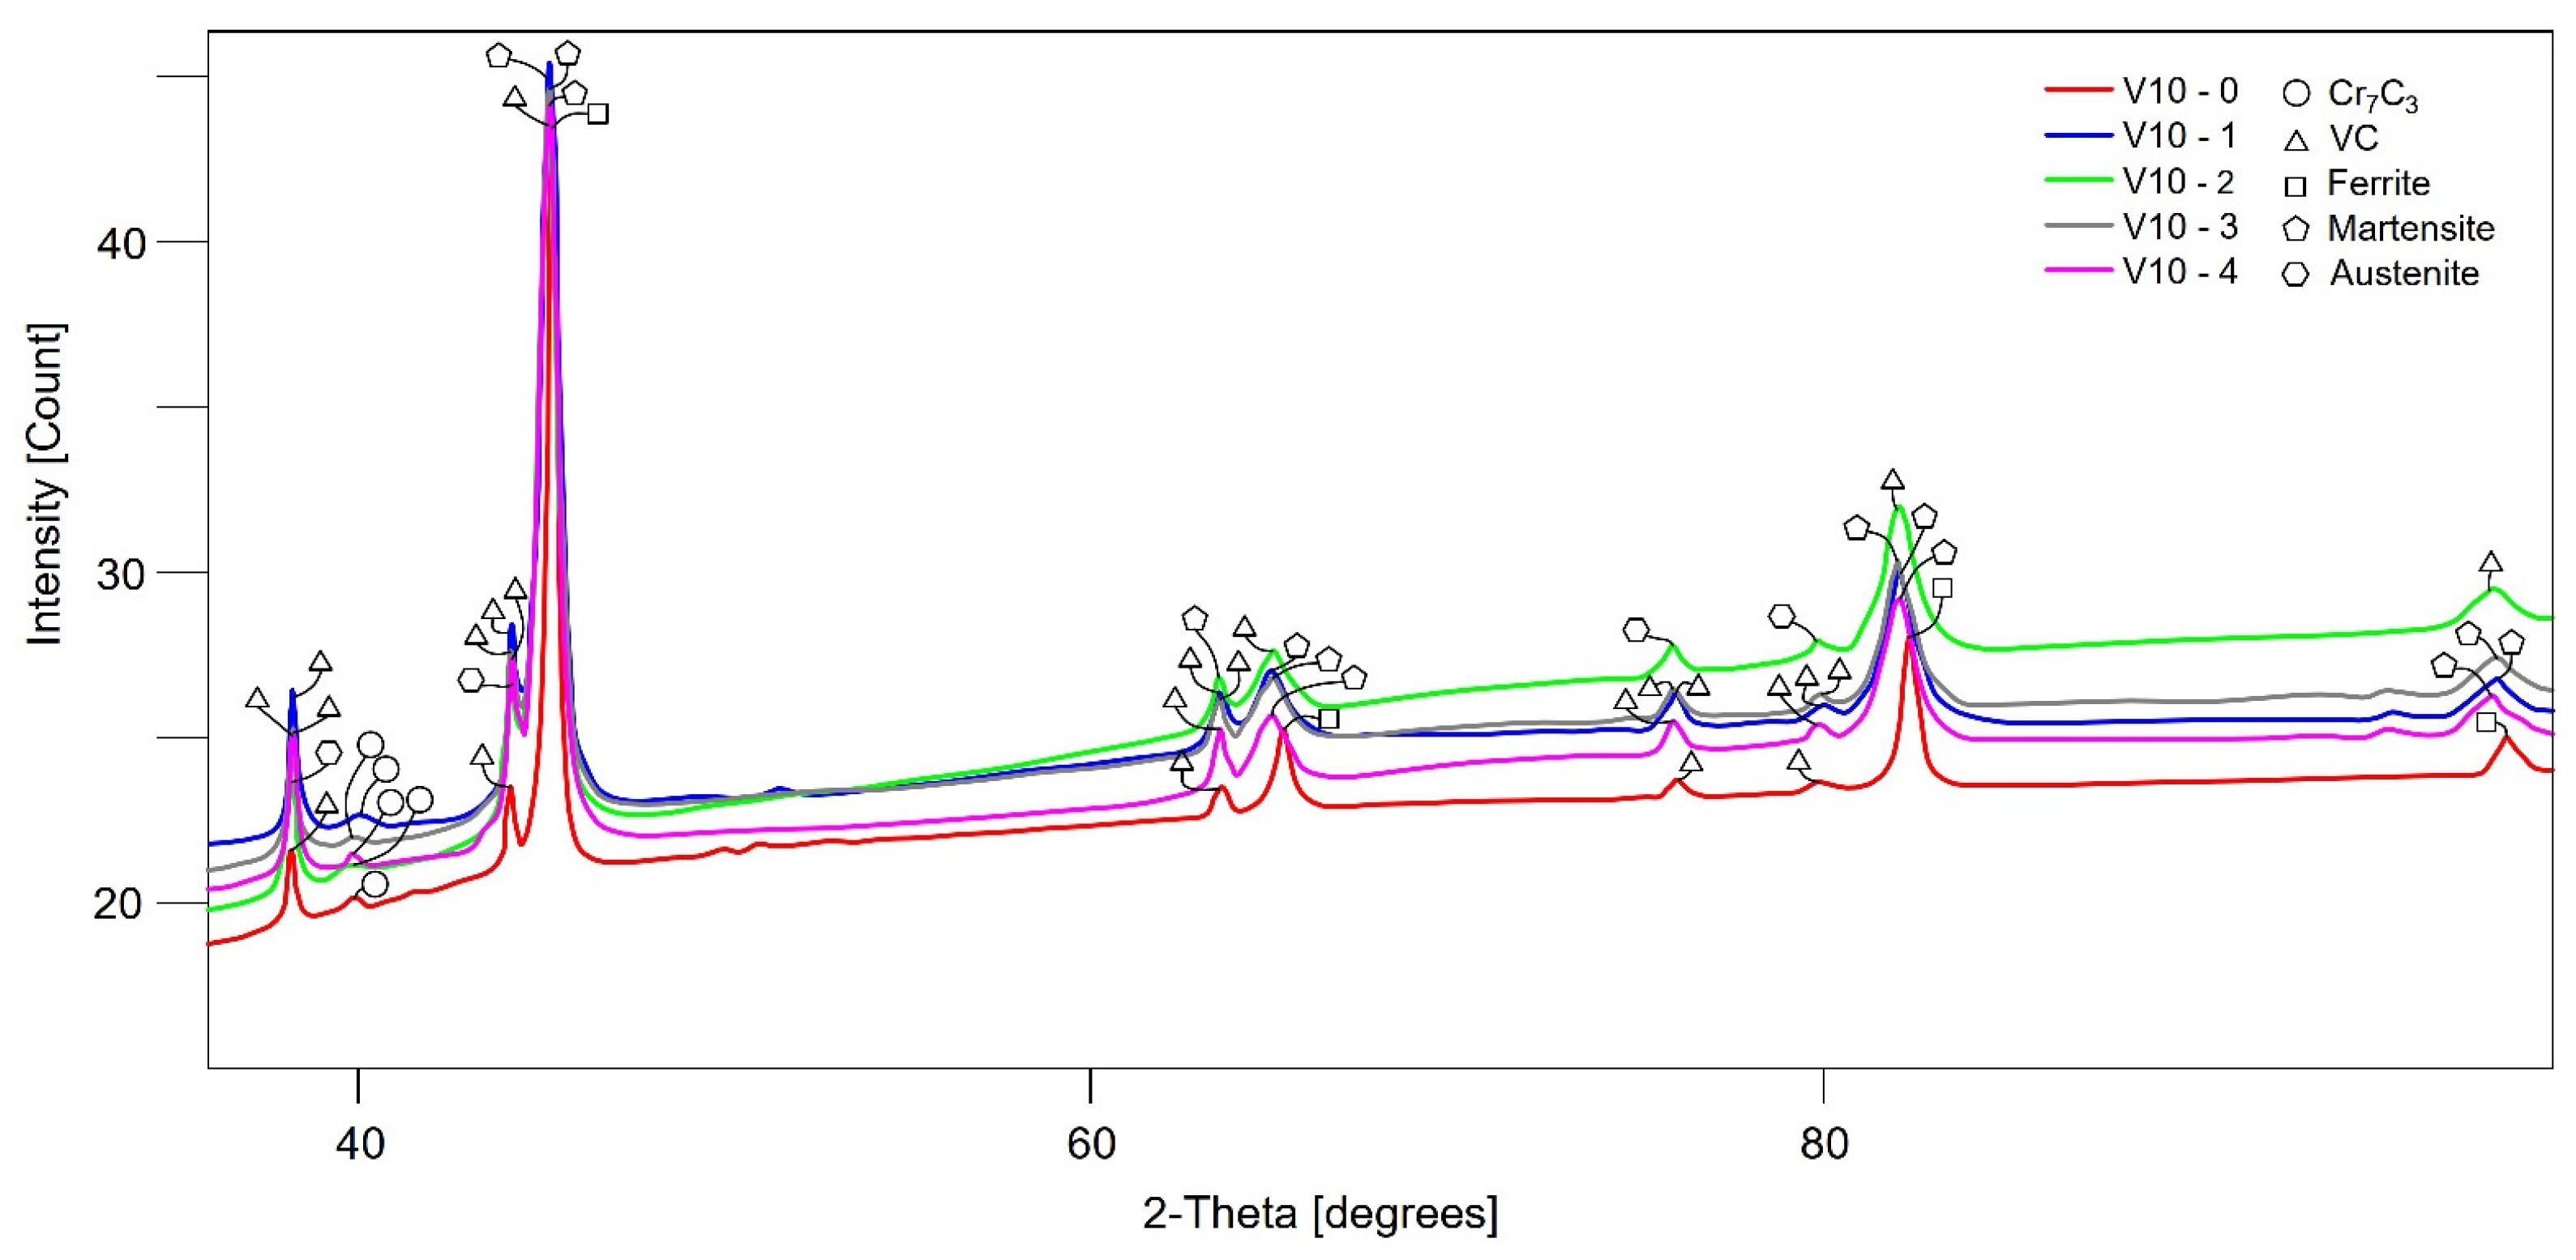
3.3. XRD and Rietveld Analysis
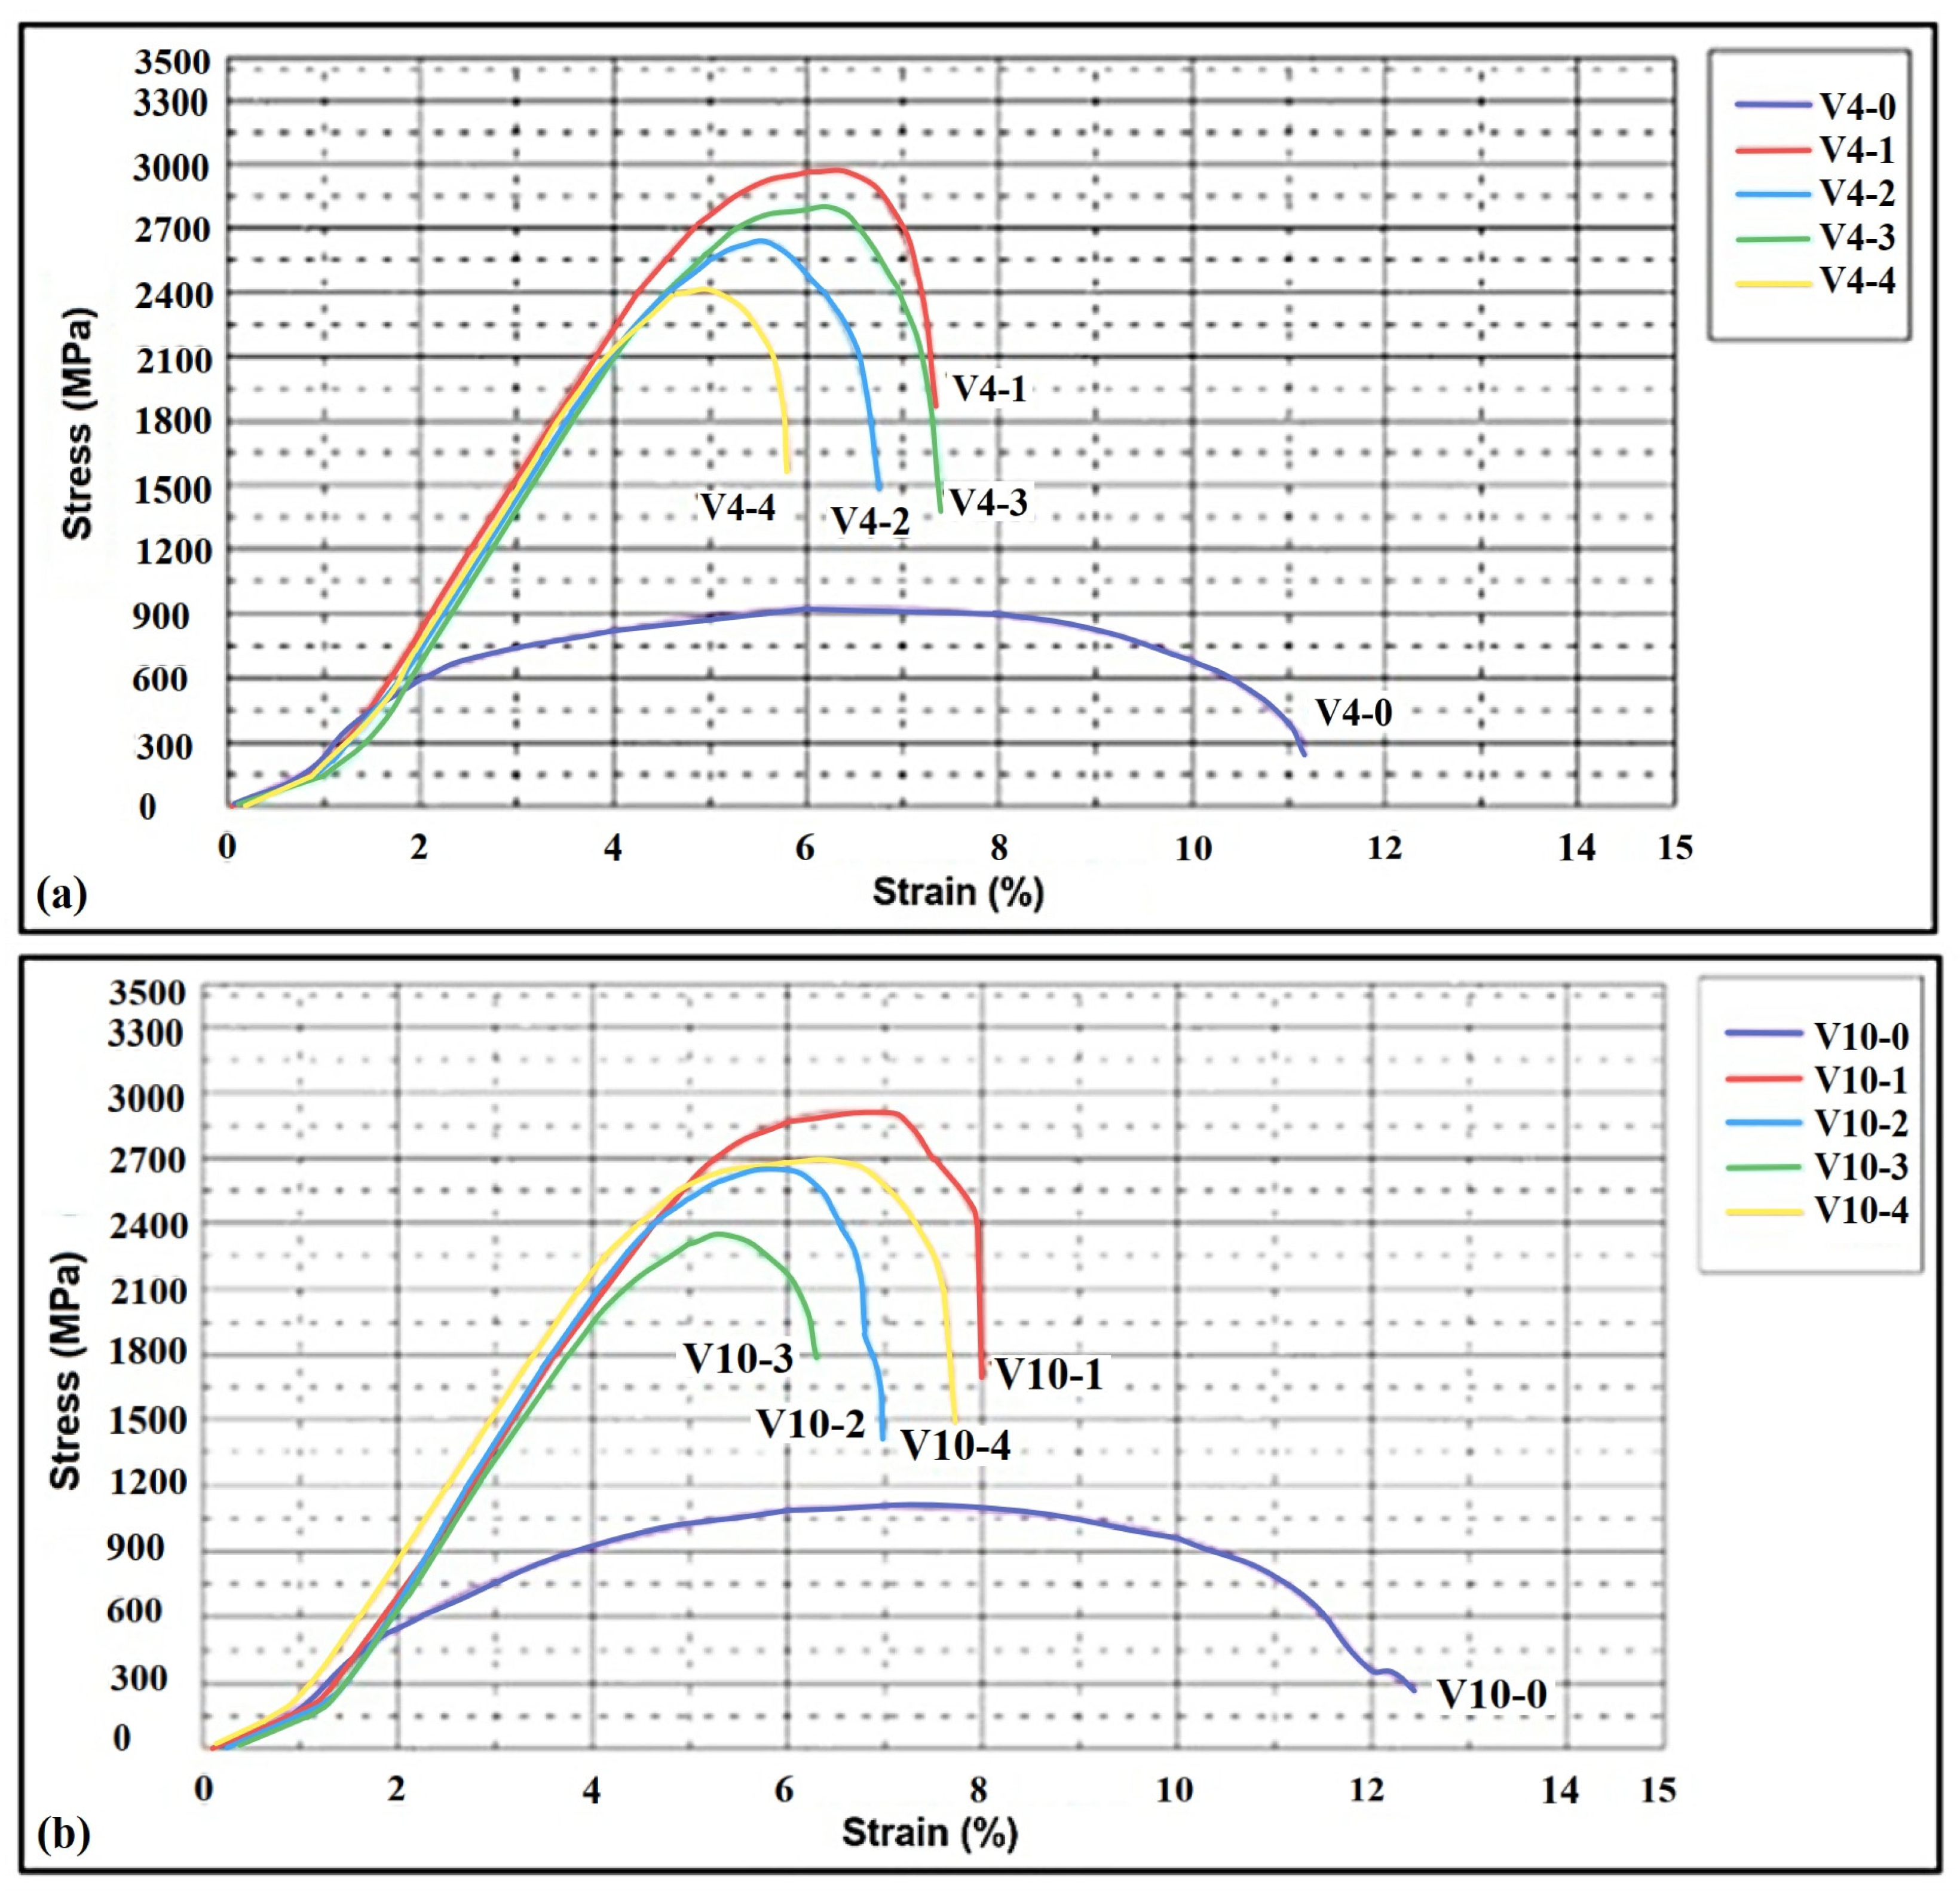
3.4. The Compression Test
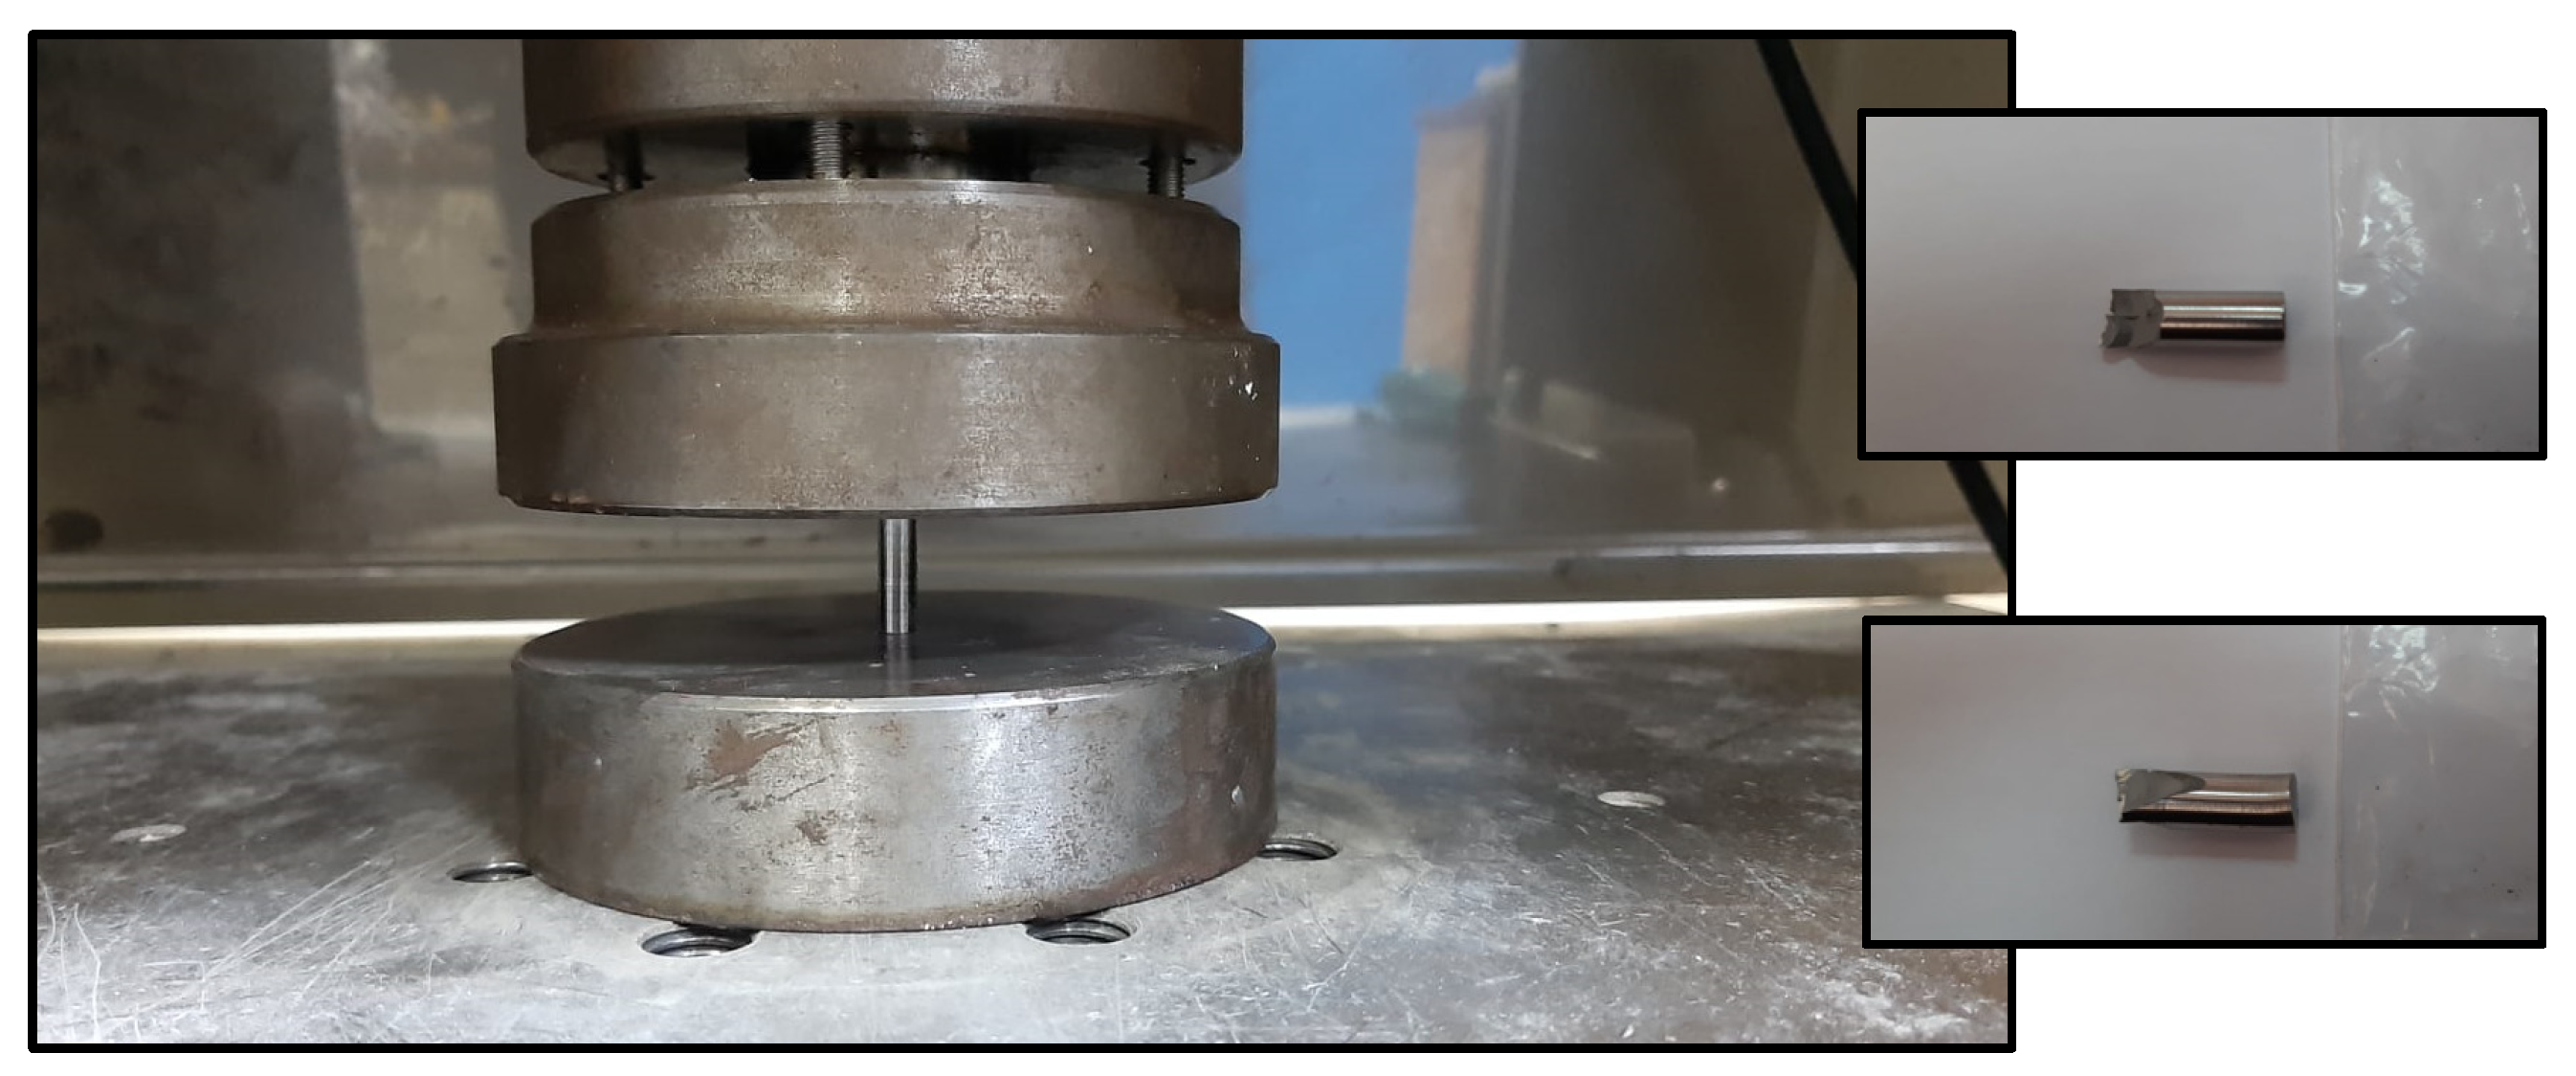
3.5. The Tensile Test
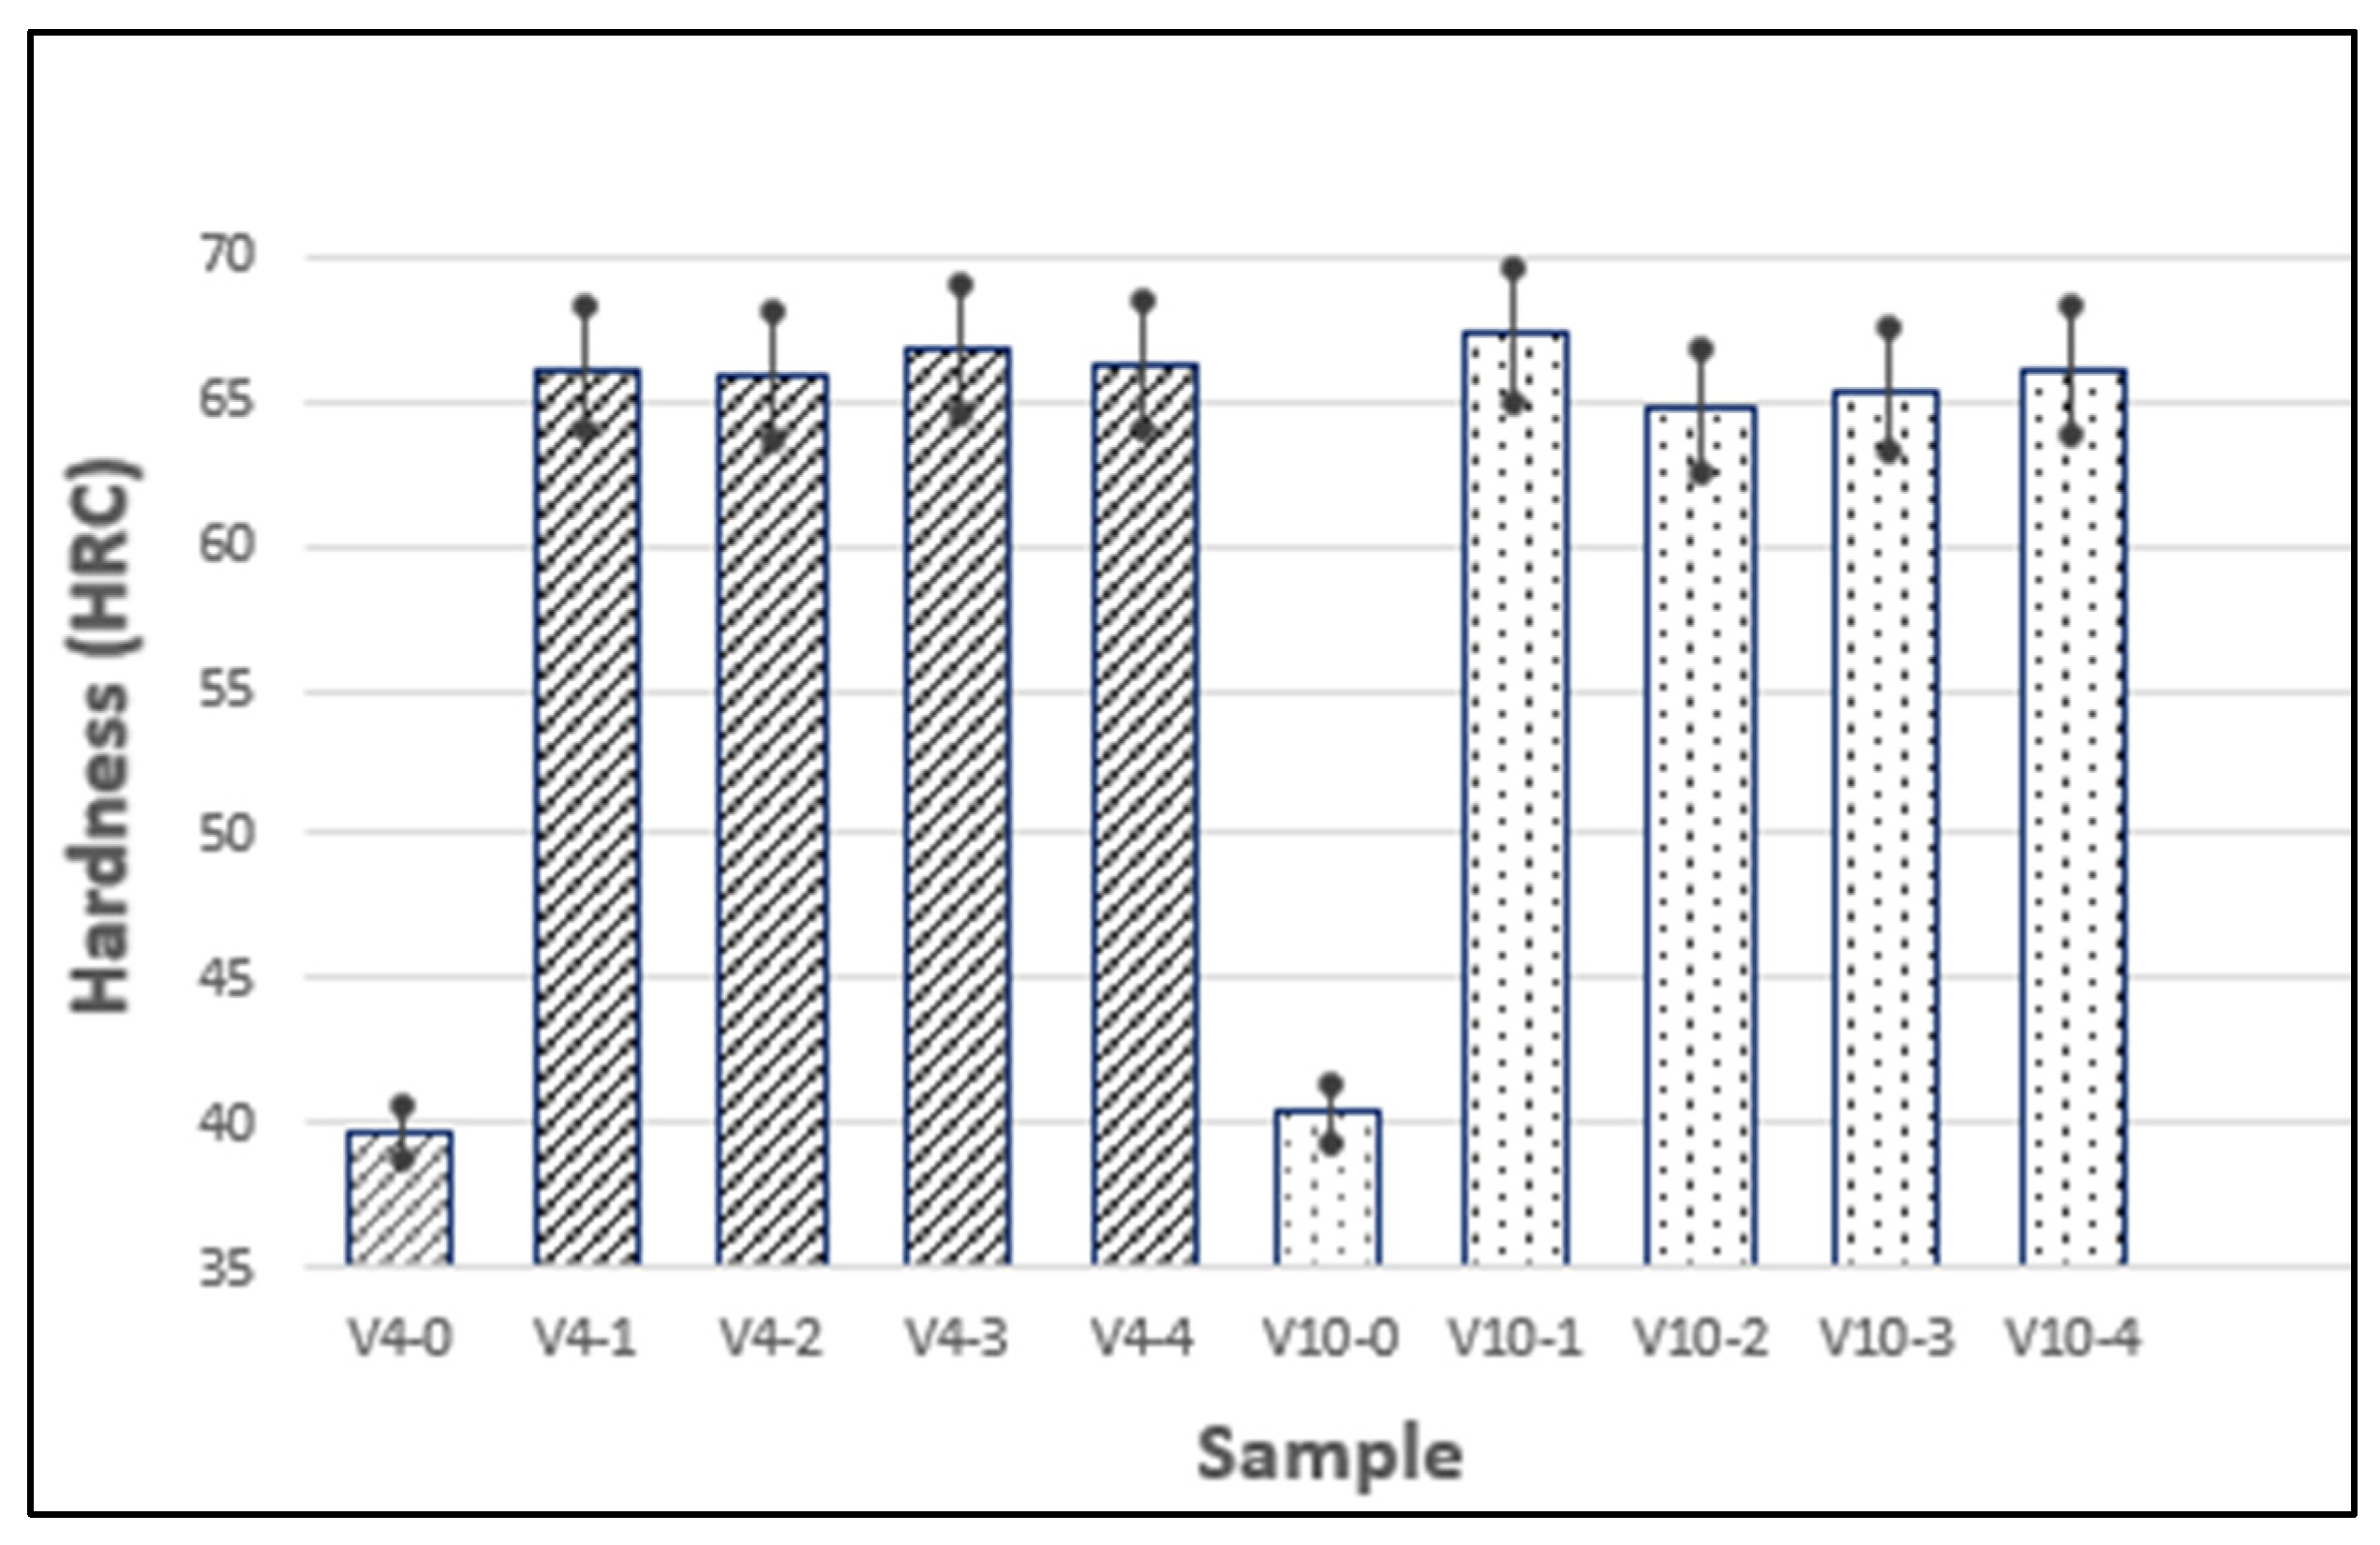
3.6. The Hardness Test
4. Conclusions
Author Contributions
Funding
Data Availability Statement
Acknowledgments
Conflicts of Interest
References
- Essam, M.A.; Megahed, H. Influence of micro-alloying elements and deep cryogenic treatment on microstructure and mechanical properties of S5 cold work shock resisting tool steel. Res. Mater. 2023, 18, 100374. [Google Scholar] [CrossRef]
- Kara, F.; Altaş, E.; Küçük, Y.; Uygur, İ. Effect of cryogenic treatment on wear behavior of Sleipner cold work tool steel. Tribol. Int. 2023, 181, 108301. [Google Scholar] [CrossRef]
- Chang, S.-H.; Chen, C.-Y.; Huang, K.T. Microstructure, retained austenite, and mechanical properties evaluation of Vanadis 60-HfC-Ta0.6Nb0.4C steel matrix composite by vacuum sintering, sub-zero, and heat treatments. Vacuum 2023, 213, 111885. [Google Scholar] [CrossRef]
- Nas, E. Experimental and statistical investigation of electro-erosion machining performance of cryogenic treated hardened AISI H13 hot work tool steel. Tribol. Int. 2024, 191, 109453. [Google Scholar] [CrossRef]
- Huang, Y.; Sun, W.; Huang, C.; Shi, L.; Li, L.; Zhou, Y. Mechanical and physical properties of modified N50 steel at cryogenic temperatures. Cryogenics 2024, 132, 103827. [Google Scholar] [CrossRef]
- Razavykia, A.; Delprete, C.; Baldissera, P. Correlation between microstructural alteration, mechanical properties and manufacturability after cryogenic treatment: A review. Materials 2019, 12, 3302. [Google Scholar] [CrossRef]
- Anoop, C.R.; Singh, R.K.; Kumar, R.R.; Jayalakshmi, M.; Prabhu, T.A.; Tharian, K.T.; Murty, S.V.S.N. A review on steels for cryogenic applications. Mater. Perform. Charact. 2021, 10, 16–88. [Google Scholar] [CrossRef]
- Yan, Y.; Luo, Z.; Liu, K.; Zhang, C.; Wang, M.; Wang, X. Effect of Cryogenic Treatment on the Microstructure and Wear Resistance of 17Cr2Ni2MoVNb Carburizing Gear Steel. Coatings 2022, 12, 281. [Google Scholar] [CrossRef]
- López-Leyva, A.; Luis-Pantoja, G.; Juárez-Islas, J.A.; Mejía-Caballero, I.; Campos-Silva, I. Influence of heat and cryogenic treatments on the abrasive wear behavior of H13 tool steel. J. Mater. Eng. Perform. 2023, 32, 7842–7853. [Google Scholar] [CrossRef]
- Jovičević-Klug, P.; Tóth, L.; Podgornik, B. Comparison of K340 steel microstructure and mechanical properties using shallow and deep cryogenic treatment. Coatings 2022, 12, 1296. [Google Scholar] [CrossRef]
- Yarasu, V.; Jurci, P.; Hornik, J.; Krum, S. Optimization of cryogenic treatment to improve the tribological behavior of Vanadis 6 steel using the Taguchi and grey relation approach. J. Mater. Res. Technol. 2022, 17, 2371–2380. [Google Scholar] [CrossRef]
- Kiraz, C.; Birol, B.; Sağın, A. The effect of cryogenic treatment on W360 and E38K hot work tool steels. Steel Res. Int. 2024, 95, 2400285–2400297. [Google Scholar] [CrossRef]
- Ptačinová, J.; Sedlická, V.; Hudáková, M.; Dlouhý, I.; Jurci, P. Microstructure–toughness relationships in sub-zero treated and tempered Vanadis 6 steel compared to conventional treatment. Mater. Sci. Eng. A 2017, 698, 152–158. [Google Scholar] [CrossRef]
- Essam, M.A.; Shash, A.Y.; El-Fawakhry, M.K.; El-Kashif, E.; Megahed, H. Effect of deep cryogenic treatment on wear behavior of cold work tool steel. Metals 2023, 13, 382. [Google Scholar] [CrossRef]
- Zhang, J.; Mao, H.; Meng, Y.; Shi, R.; Fang, J. Effect of deep cryogenic time on the microstructure and mechanical property of Cr-Mn-Si high-strength alloy steel. Metals 2023, 13, 1449. [Google Scholar] [CrossRef]
- Dhokey, N.B.; Maske, S.S.; Ghosh, P. Effect of tempering and cryogenic treatment on wear and mechanical properties of hot work tool steel (H13). Mater. Today Proc. 2021, 43, 3006–3013. [Google Scholar] [CrossRef]
- Mochtar, M.A.; Putra, W.N.; Abram, M. Effect of tempering temperature and subzero treatment on microstructures, retained austenite, and hardness of AISI D2 tool steel. Mater. Res. Express 2022, 9, 126519. [Google Scholar] [CrossRef]
- Bayata, F.; Vatan, S.B. Mechanical properties of vanadium-alloyed austempered ductile iron for crankshaft applications. Front. Mech. Eng. 2023, 18, 30. [Google Scholar] [CrossRef]
- Dubiel, S.M.; Cieślak, J. Sigma-phase in Fe-Cr and Fe-V alloy systems and its physical properties. Crit. Rev. Solid State Mater. Sci. 2011, 36, 155–179. [Google Scholar] [CrossRef]
- Uddeholm Vanadis® 4 Extra SuperClean Data Sheet. Available online: https://www.uddeholm.com/app/uploads/sites/216/productdb/api/tech_uddeholm-vanadis-4-extra_en.pdf (accessed on 24 June 2025).
- Uddeholm Vanadis® 10 Data Sheet. Available online: http://www.uddeholm.gr/Storage/Media/Shared/SteelBrochures/Vanadis%2010/PB_vanadis_10_english.pdf (accessed on 24 June 2025).
- ISO 6892-1:2019; Metallic Materials—Tensile Testing—Part 1: Method of Test at Room Temperature. International Organization for Standardization: Geneva, Switzerland, 2019.
- ASTM E9-19; Standard Test Methods of Compression Testing of Metallic Materials at Room Temperature. ASTM International: West Conshohocken, PA, USA, 2019.
- ASTM E112-13; Standard Test Methods for Determining Average Grain Size. ASTM International: West Conshohocken, PA, USA, 2013.
- Li, H.; Tong, W.; Cui, J.; Zhang, H.; Chen, L.; Zuo, L. The influence of deep cryogenic treatment on the properties of high-vanadium alloy steel. Mater. Sci. Eng. A 2016, 658, 364–371. [Google Scholar] [CrossRef]
- Jurči, P.; Dlouhý, I. Cryogenic treatment of martensitic steels: Microstructural fundamentals and implications for mechanical properties and wear and corrosion performance. Materials 2024, 17, 548. [Google Scholar] [CrossRef] [PubMed]
- Muradian, S.; Liu, M.; Sun, Y. Effect of aging on the structure and mechanical properties of austenite stainless steel N50 alloyed with nitrogen, niobium, and vanadium. Mater. Res. Express 2023, 10, 106504. [Google Scholar] [CrossRef]
- Szajna, A.; Bazan, A.; Tymczyszyn, J.; Kawalec, M.; Rydzak, T.; Kubik, P. The effect of milling parameters of Vanadis 4 Extra steel on cutting force values and roughness of machined surface. J. Mach. Eng. 2023, 23, 56–63. [Google Scholar] [CrossRef] [PubMed]
- Arslan, F.K.; Altınsoy, I.; Hatman, A.; İpek, M.; Zeytin, S.; Bindal, C. Characterization of cryogenic heat treated Vanadis 4 PM cold work tool steel. Vacuum 2011, 85, 1037–1043. [Google Scholar] [CrossRef]
- Jurci, P.; Domankova, M.; Caplovic, L.; Ptačinová, J.; Sobotová, J.; Salábová, P.; Prikner, O.; Sustarsic, B.; Jenko, D. Microstructure and hardness of sub-zero treated and no tempered P/M Vanadis 6 ledeburitic tool steel. Vacuum 2014, 105, 63–70. [Google Scholar] [CrossRef]
- Podgornik, B.; Paulina, I.; Zajec, B.; Jacobson, S.; Leskovšek, V. Deep cryogenic treatment of tool steels. J. Mater. Process. Technol. 2015, 222, 392–398. [Google Scholar] [CrossRef]
- Yarasu, V.; Jurci, P.; Ptačinová, J.; Dlouhý, I.; Hornik, J. Effect of cryogenic treatments on hardness, fracture toughness, and wear properties of Vanadis 6 tool steel. Materials 2024, 17, 1688. [Google Scholar] [CrossRef]
- Jurči, P.; Dománková, M.; Hudáková, M.; Ptačinová, J.; Pašák, M.; Palček, P. Characterization of microstructure and tempering response of conventionally quenched, short- and long-time sub-zero treated PM Vanadis 6 ledeburitic tool steel. Mater. Charact. 2017, 133, 398–415. [Google Scholar] [CrossRef]
- Idayana, A.; Gnanavelbabu, A.; Rajkumar, K. Influence of deep cryogenic treatment on the mechanical properties of AISI 440C bearing steel. Procedia Eng. 2014, 97, 869–874. [Google Scholar] [CrossRef]
- Zhirafara, S.; Rezaeian, A.; Pugh, M. Effect of cryogenic treatment on the mechanical properties of 4340 steel. J. Mater. Process. Technol. 2007, 189, 170–175. [Google Scholar] [CrossRef]
- Akhbarizadeh, A.; Shafyei, A.; Golozar, M.A. Effects of cryogenic treatment on wear behavior of D6 tool steel. Mater. Des. 2009, 30, 2359–2364. [Google Scholar] [CrossRef]

| C | Si | Mn | Cr | Mo | V | Fe | |
|---|---|---|---|---|---|---|---|
| V4 | 1.4 | 0.4 | 0.4 | 4.7 | 3.5 | 3.7 | 85.9 |
| V10 | 2.9 | 0.5 | 0.5 | 8.0 | 1.5 | 9.8 | 76.8 |
| Sample | Parameters | ||||
|---|---|---|---|---|---|
| 0 (V4-0 and V10-0) | - | - | - | - | - |
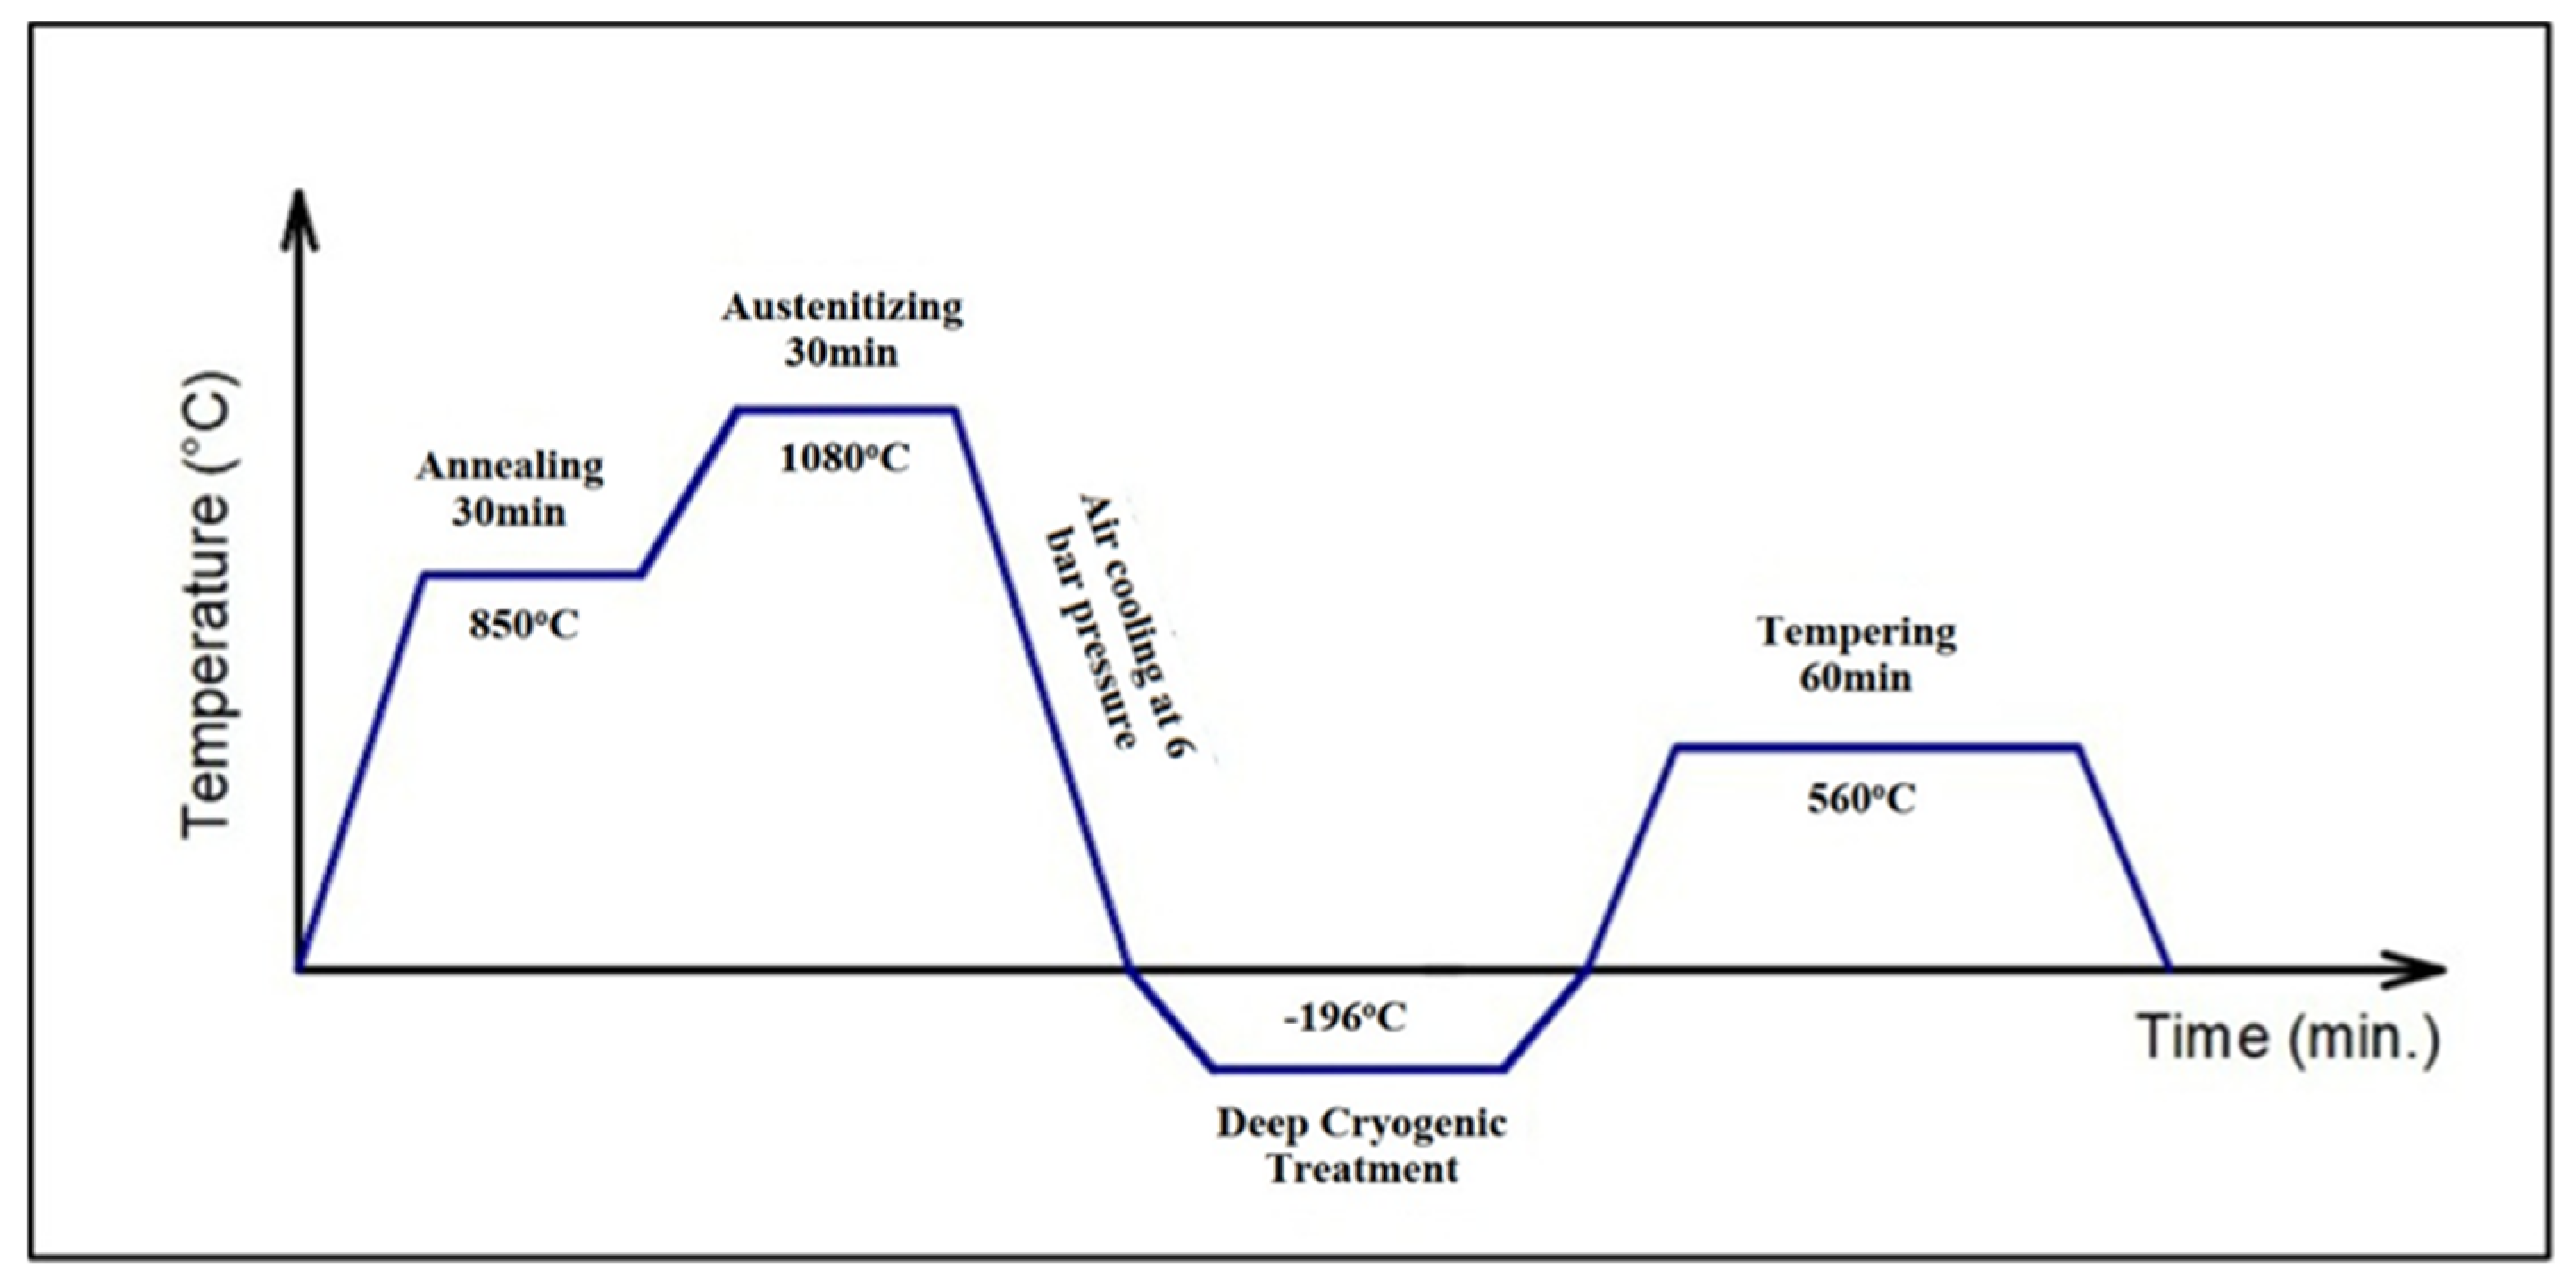
| HT (V4-1 and V10-1) | Pre-heating at 850 °C for 30 min | Austenitizing at 1080 °C for 30 min | Air cooling at 6 bar pressure | - | Tempering at 560 °C for 60 min |
| DCT-12h (V4-2 and V10-2) | 12 h | ||||
| DCT-24h (V4-3 and V10-3) | 24 h | ||||
| DCT-36h (V4-4 and V10-4) | 36 h | ||||
| Sample | Martensite | a | b | c | Austenite | a | VC | a | Cr7C3 | a | b | c | Sigma |
|---|---|---|---|---|---|---|---|---|---|---|---|---|---|
| V4-0 | 82.89 (*) | 2.878 | 2.878 | 2.878 | - | - | 9.73 | 4.182 | 7.38 | 4.552 | 7.038 | 12.177 | 1.184 |
| V4-1 | 90.95 | 2.906 | 2.906 | 3.392 | 0.64 | 3.607 | 5.46 | 4.192 | 2.95 | 4.530 | 6.976 | 12.110 | 1.132 |
| V4-2 | 88.14 | 2.893 | 2.893 | 3.138 | 0.25 | 3.600 | 9.39 | 4.183 | 2.22 | 4.534 | 6.973 | 12.070 | 1.185 |
| V4-3 | 86.39 | 2.891 | 2.891 | 3.046 | - | - | 11.23 | 4.182 | 2.38 | 4.534 | 6.975 | 12.080 | 1.142 |
| V4-4 | 87.45 | 2.894 | 2.894 | 3.131 | - | - | 10.39 | 4.183 | 2.16 | 4.542 | 7.002 | 12.005 | 1.148 |
| V10-0 | 74.99 (*) | 2.879 | 2.879 | 2.879 | - | - | 16.56 | 4.169 | 8.43 | 4.514 | 7.027 | 12.264 | 1.203 |
| V10-1 | 74.41 | 2.892 | 2.892 | 3.283 | 1.18 | 3.585 | 20.39 | 4.164 | 4.02 | 4.520 | 7.043 | 12.217 | 1.181 |
| V10-2 | 73.56 | 2.887 | 2.887 | 2.938 | 0.91 | 3.589 | 22.42 | 4.166 | 3.11 | 4.521 | 7.046 | 12.200 | 1.176 |
| V10-3 | 75.10 | 2.891 | 2.891 | 2.956 | 0.89 | 3.589 | 21.12 | 4.167 | 2.89 | 4.522 | 7.038 | 12.203 | 1.214 |
| V10-4 | 72.85 | 2.837 | 2.837 | 2.905 | 0.85 | 3.585 | 23.18 | 4.163 | 3.12 | 4.521 | 7.040 | 12.200 | 1.289 |
| Sample | Compressive Strength (MPa) | Standard Deviation (MPa) | Compressive Strain (%) | Modulus of Elasticity (MPa) |
|---|---|---|---|---|
| V4-0 | 932.33 | 19.15 | 11.18 | 83.39 |
| V4-1 (Q + T) | 2968.80 | 156.77 | 7.33 | 405.02 |
| V4-2 (Q + DCT12 + T) | 2637.16 | 49.25 | 6.75 | 390.69 |
| V4-3 (Q + DCT24 + T) | 2801.73 | 58.2 | 7.43 | 377.08 |
| V4-4 (Q + DCT36 + T) | 2410.33 | 23.12 | 5.83 | 413.44 |
| V10-0 | 1104.29 | 28.77 | 12.45 | 88.70 |
| V10-1 (Q + T) | 2913.46 | 125.97 | 8.03 | 362.82 |
| V10-2 (Q + DCT12 + T) | 2657.10 | 69.6 | 6.99 | 380.13 |
| V10-3 (Q + DCT24 + T) | 2347.73 | 131.97 | 6.31 | 372.06 |
| V10-4 (Q + DCT36 + T) | 2687.48 | 78.63 | 7.73 | 347.67 |
| Factor | Dof | F | p Value | Pc (%) |
|---|---|---|---|---|
| Vanadium wt.% (A) | 1 | 35.84 | 0.002 | 38.26 |
| Cryogenic time (B) | 2 | 21.15 | 0.005 | 29.77 |
| Tempering (C) | 1 | 14.68 | 0.008 | 17.34 |
| A (V wt.%) × B (Time) | 2 | 9.45 | 0.021 | 8.13 |
| A (V wt.%) × C (Temp.) | 1 | 4.33 | 0.067 | 2.5 |
| B (Time) × C (Temp.) | 2 | 2.19 | 0.131 | 1.46 |
| Error | 10 | - | - | 2.54 |
| Sample | Ultimate Tensile Strength (MPa) | Standard Deviation (MPa) | Yield Strength (MPa) | Relative Elongation (%) |
|---|---|---|---|---|
| V4-0 | 806.23 | 11.23 | 697.39 | 12.84 |
| V4-1 (Q + T) | 2040.94 | 26.83 | 1928.48 | 15.04 |
| V4-2 (Q + DCT12 + T) | 2042.60 | 27.36 | 1860.99 | 13.91 |
| V4-3 (Q + DCT24 + T) | 2125.47 | 25.64 | 1914.69 | 14.11 |
| V4-4 (Q + DCT36 + T) | 2110.51 | 27.89 | 1921.20 | 12.41 |
| V10-0 | 809.39 | 10.42 | 947.87 | 11.07 |
| V10-1 (Q + T) | 962.62 | 19.48 | 860.00 | 11.18 |
| V10-2 (Q + DCT12 + T) | 1342.00 | 25.51 | 1063.00 | 24.52 |
| V10-3 (Q + DCT24 + T) | 1345.00 | 25.71 | 1063.48 | 25.13 |
| V10-4 (Q + DCT36 + T) | 1129.00 | 22.58 | 892.12 | 20.22 |
| Factor | Dof | F | p Value | Pc (%) |
|---|---|---|---|---|
| Vanadium wt.% (A) | 1 | 210.14 | 0.000 | 36.35 |
| Cryogenic time (B) | 4 | 0.00 | 1.000 | 0.00 |
| Tempering (C) | 1 | 219.25 | 0.000 | 37.96 |
| A (V wt.%) × B (Time) | 4 | 9.98 | 0.012 | 10.33 |
| A (V wt.%) × C (Temp.) | 1 | 53.92 | 0.002 | 9.34 |
| Error | 8 | - | - | 6.02 |
| Sample | Average Hardness (HRC) | Standard Deviation (HRC) |
|---|---|---|
| V4-0 | 39.68 | 0.2125 |
| V4-1 (Q + T) | 66.15 | 0.2463 |
| V4-2 (Q + DCT12 + T) | 65.90 | 0.2760 |
| V4-3 (Q + DCT24 + T) | 66.90 | 0.1953 |
| V4-4 (Q + DCT36 + T) | 66.25 | 0.3162 |
| V10-0 | 40.33 | 0.1800 |
| V10-1 (Q + T) | 67.30 | 0.3482 |
| V10-2 (Q + DCT12 + T) | 64.75 | 0.2928 |
| V10-3 (Q + DCT24 + T) | 65.40 | 0.2451 |
| V10-4 (Q + DCT36 + T) | 66.10 | 0.3217 |
| Factor | Dof | F | p Value | Pc (%) |
|---|---|---|---|---|
| Vanadium wt.% (A) | 1 | 10.008 | 0.00297 | 0.01 |
| Cryogenic time (B) | 4 | 20,191.049 | 0.00000 | 67.38 |
| Tempering (C) | 1 | 38,871.418 | 0.00000 | 32.43 |
| A (V wt.%) × C (Temp.) | 4 | 42.547 | 0.00000 | 0.14 |
| Error | 40 | - | - | 0.03 |
Disclaimer/Publisher’s Note: The statements, opinions and data contained in all publications are solely those of the individual author(s) and contributor(s) and not of MDPI and/or the editor(s). MDPI and/or the editor(s) disclaim responsibility for any injury to people or property resulting from any ideas, methods, instructions or products referred to in the content. |
© 2025 by the authors. Licensee MDPI, Basel, Switzerland. This article is an open access article distributed under the terms and conditions of the Creative Commons Attribution (CC BY) license (https://creativecommons.org/licenses/by/4.0/).
Share and Cite
Gök, D.A.; İpek, R. Experimental Investigation on Microstructure and Mechanical Properties of Deep Cryogenically Treated Vanadium Alloy Steels. Metals 2025, 15, 822. https://doi.org/10.3390/met15080822
Gök DA, İpek R. Experimental Investigation on Microstructure and Mechanical Properties of Deep Cryogenically Treated Vanadium Alloy Steels. Metals. 2025; 15(8):822. https://doi.org/10.3390/met15080822
Chicago/Turabian StyleGök, Dilşad Akgümüş, and Rasim İpek. 2025. "Experimental Investigation on Microstructure and Mechanical Properties of Deep Cryogenically Treated Vanadium Alloy Steels" Metals 15, no. 8: 822. https://doi.org/10.3390/met15080822
APA StyleGök, D. A., & İpek, R. (2025). Experimental Investigation on Microstructure and Mechanical Properties of Deep Cryogenically Treated Vanadium Alloy Steels. Metals, 15(8), 822. https://doi.org/10.3390/met15080822