
Development of a Technique for Toughness Estimation in Dual-Phase Steels Using Representative Volume Elements


Abstract
1. Introduction
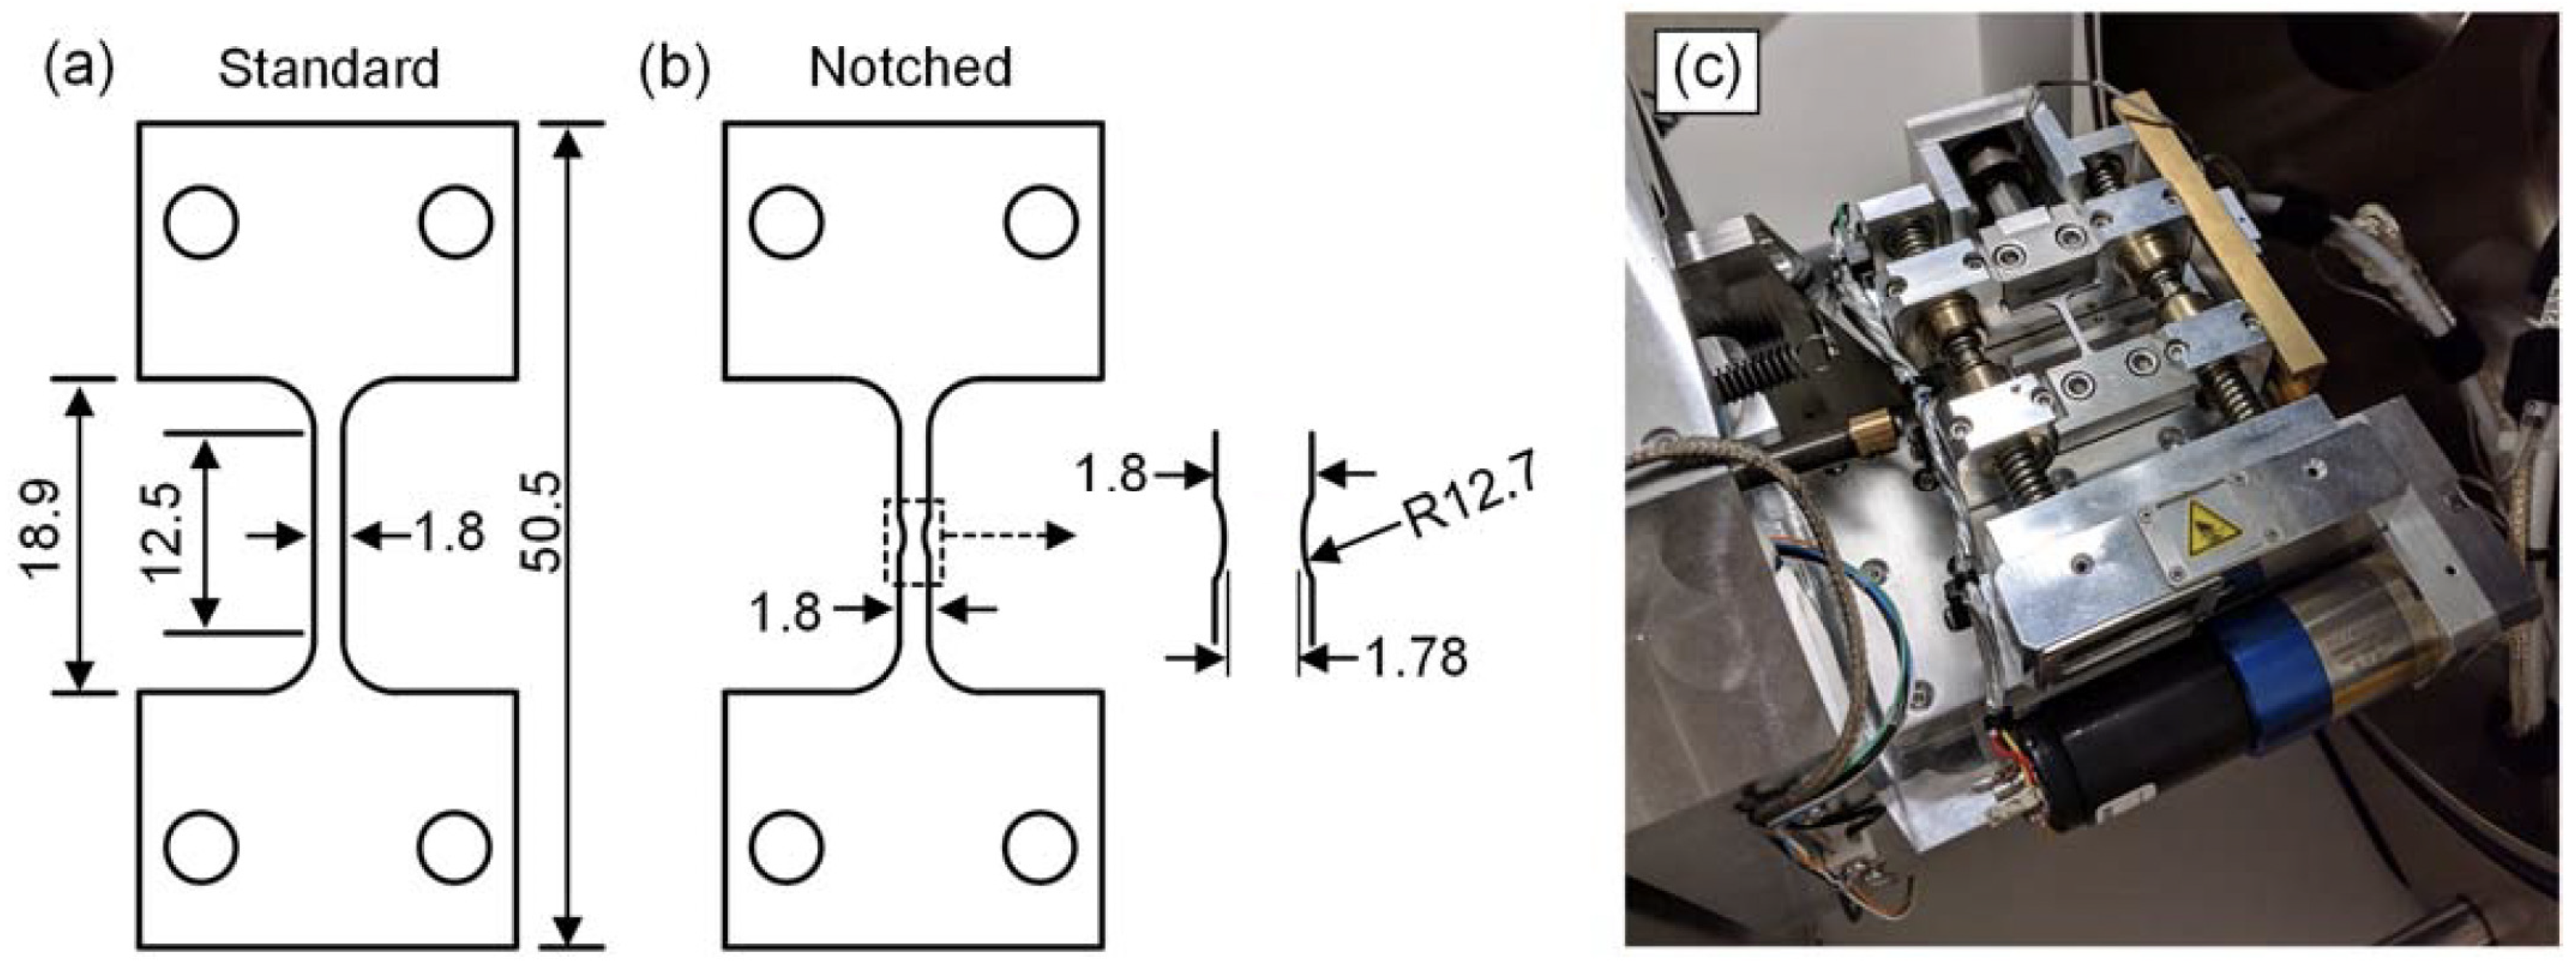
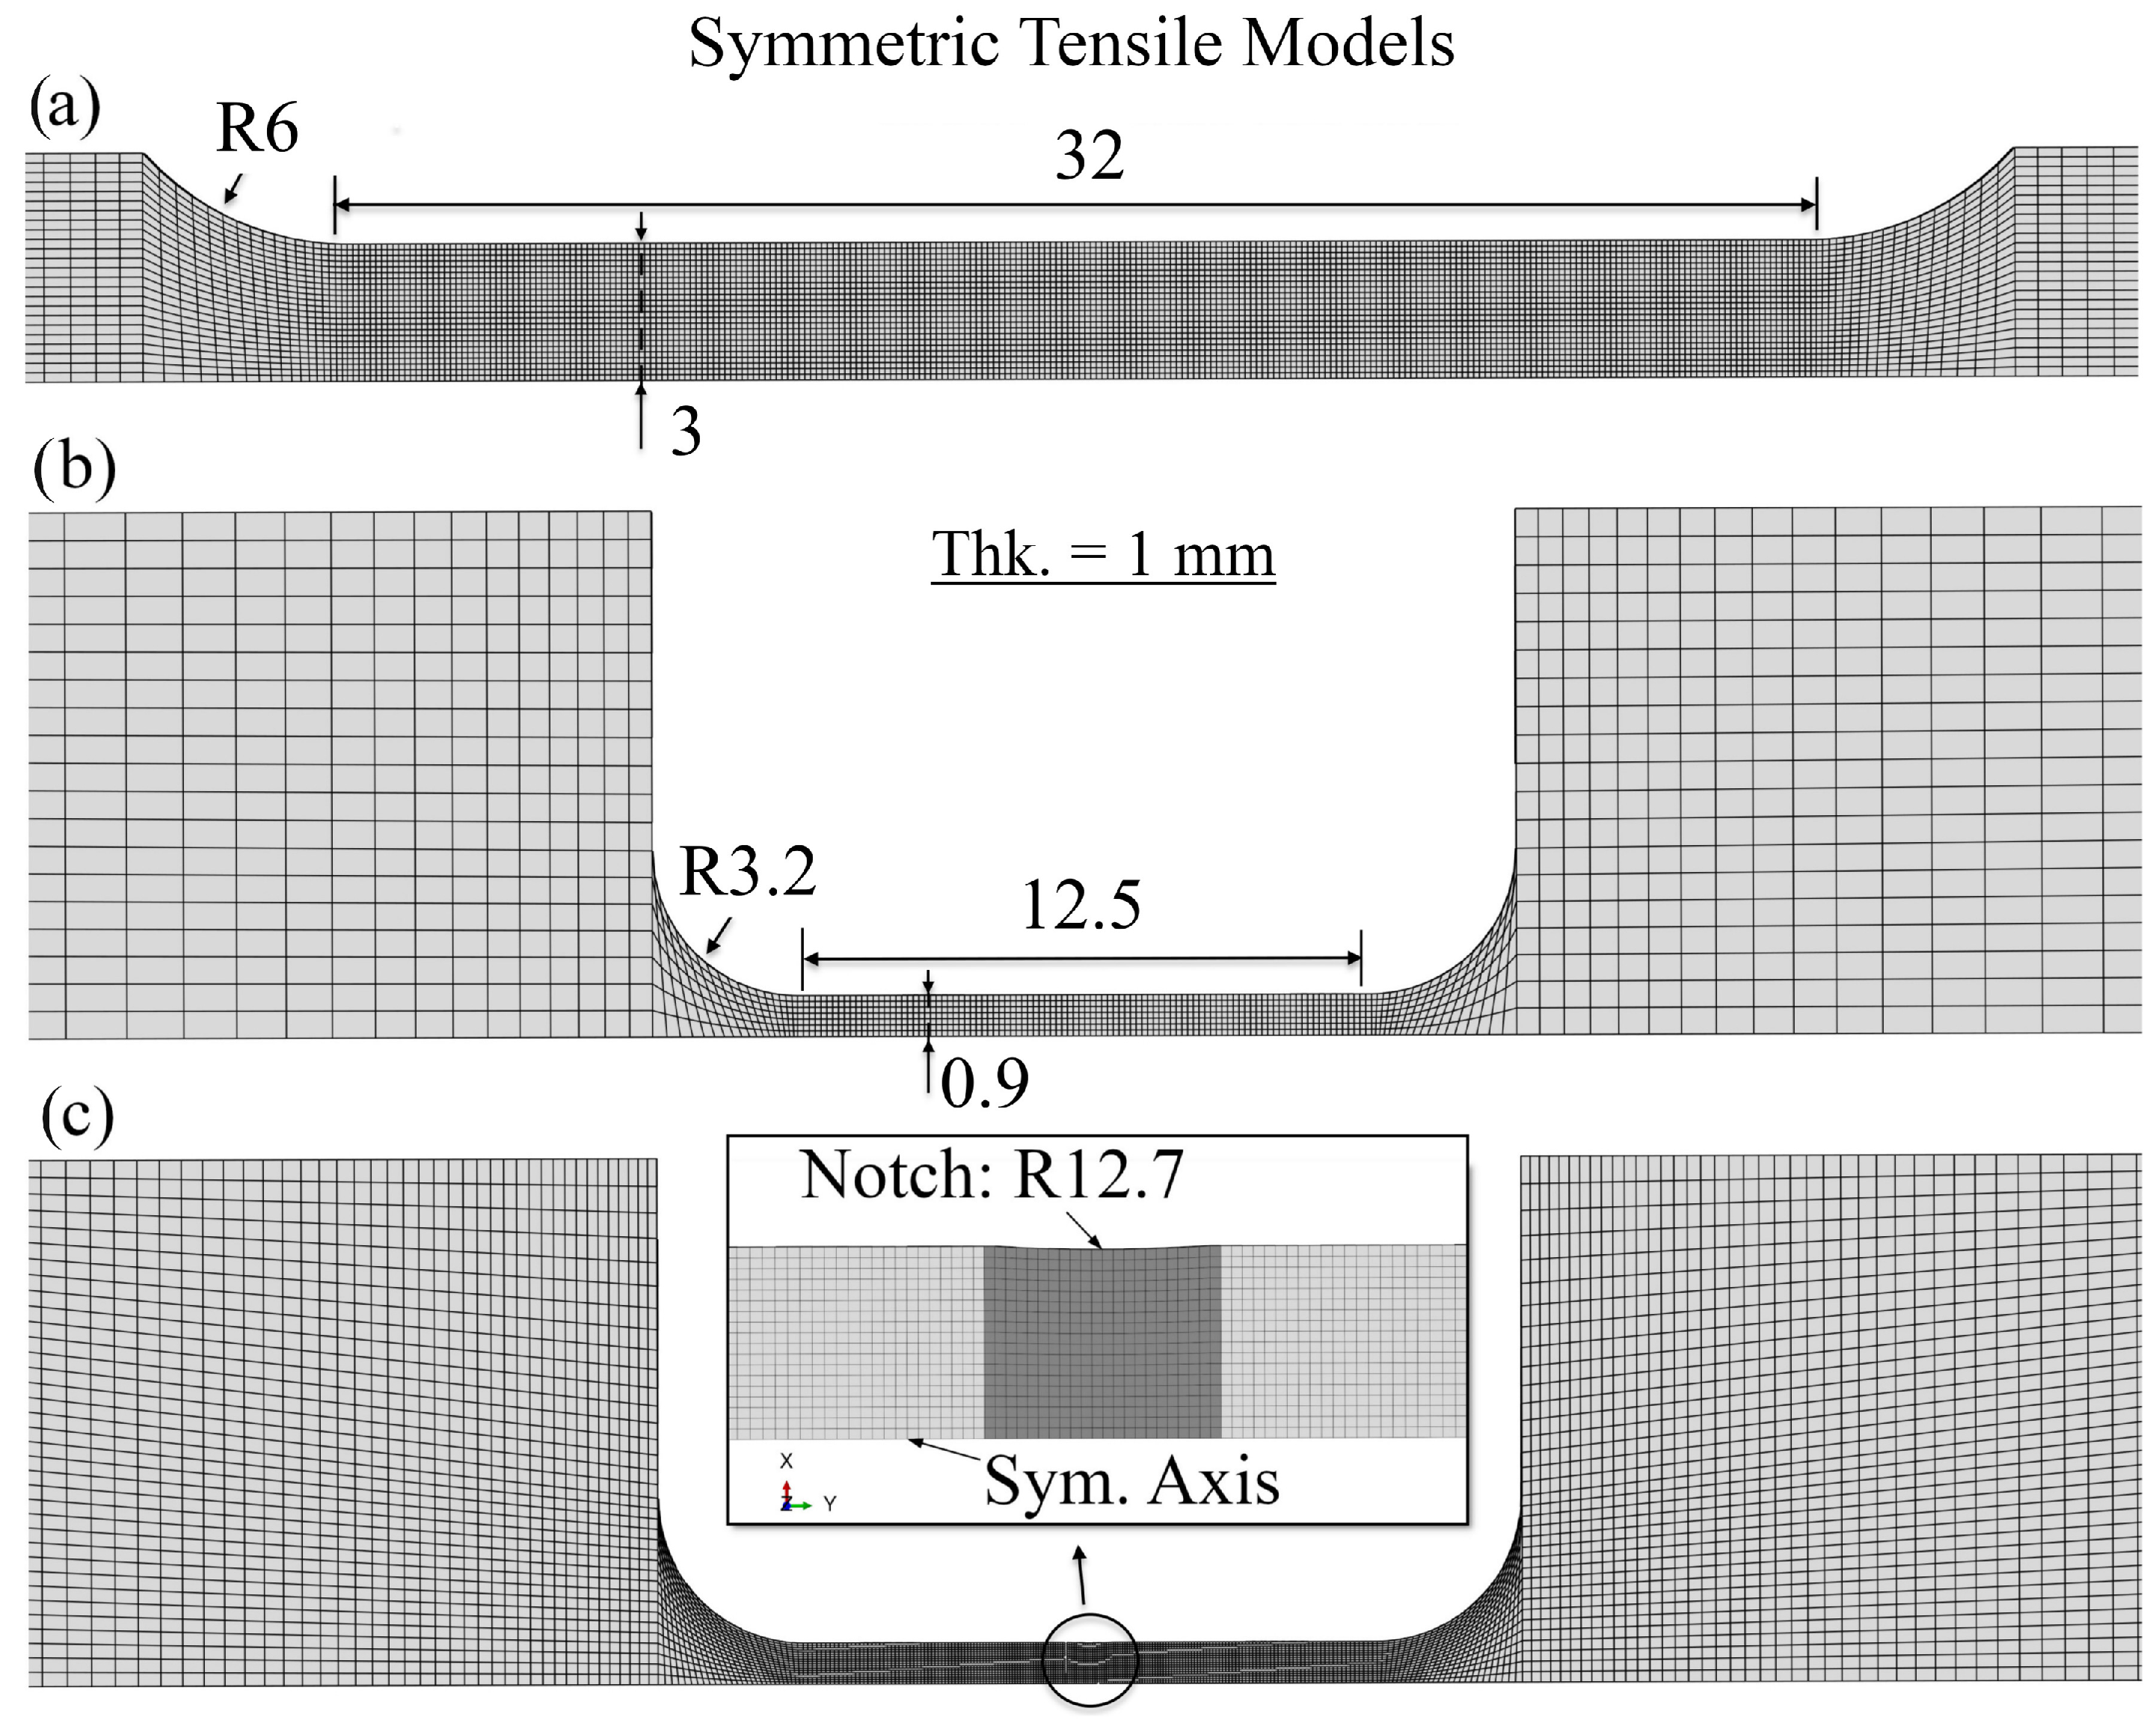
2. Materials and Test Methods
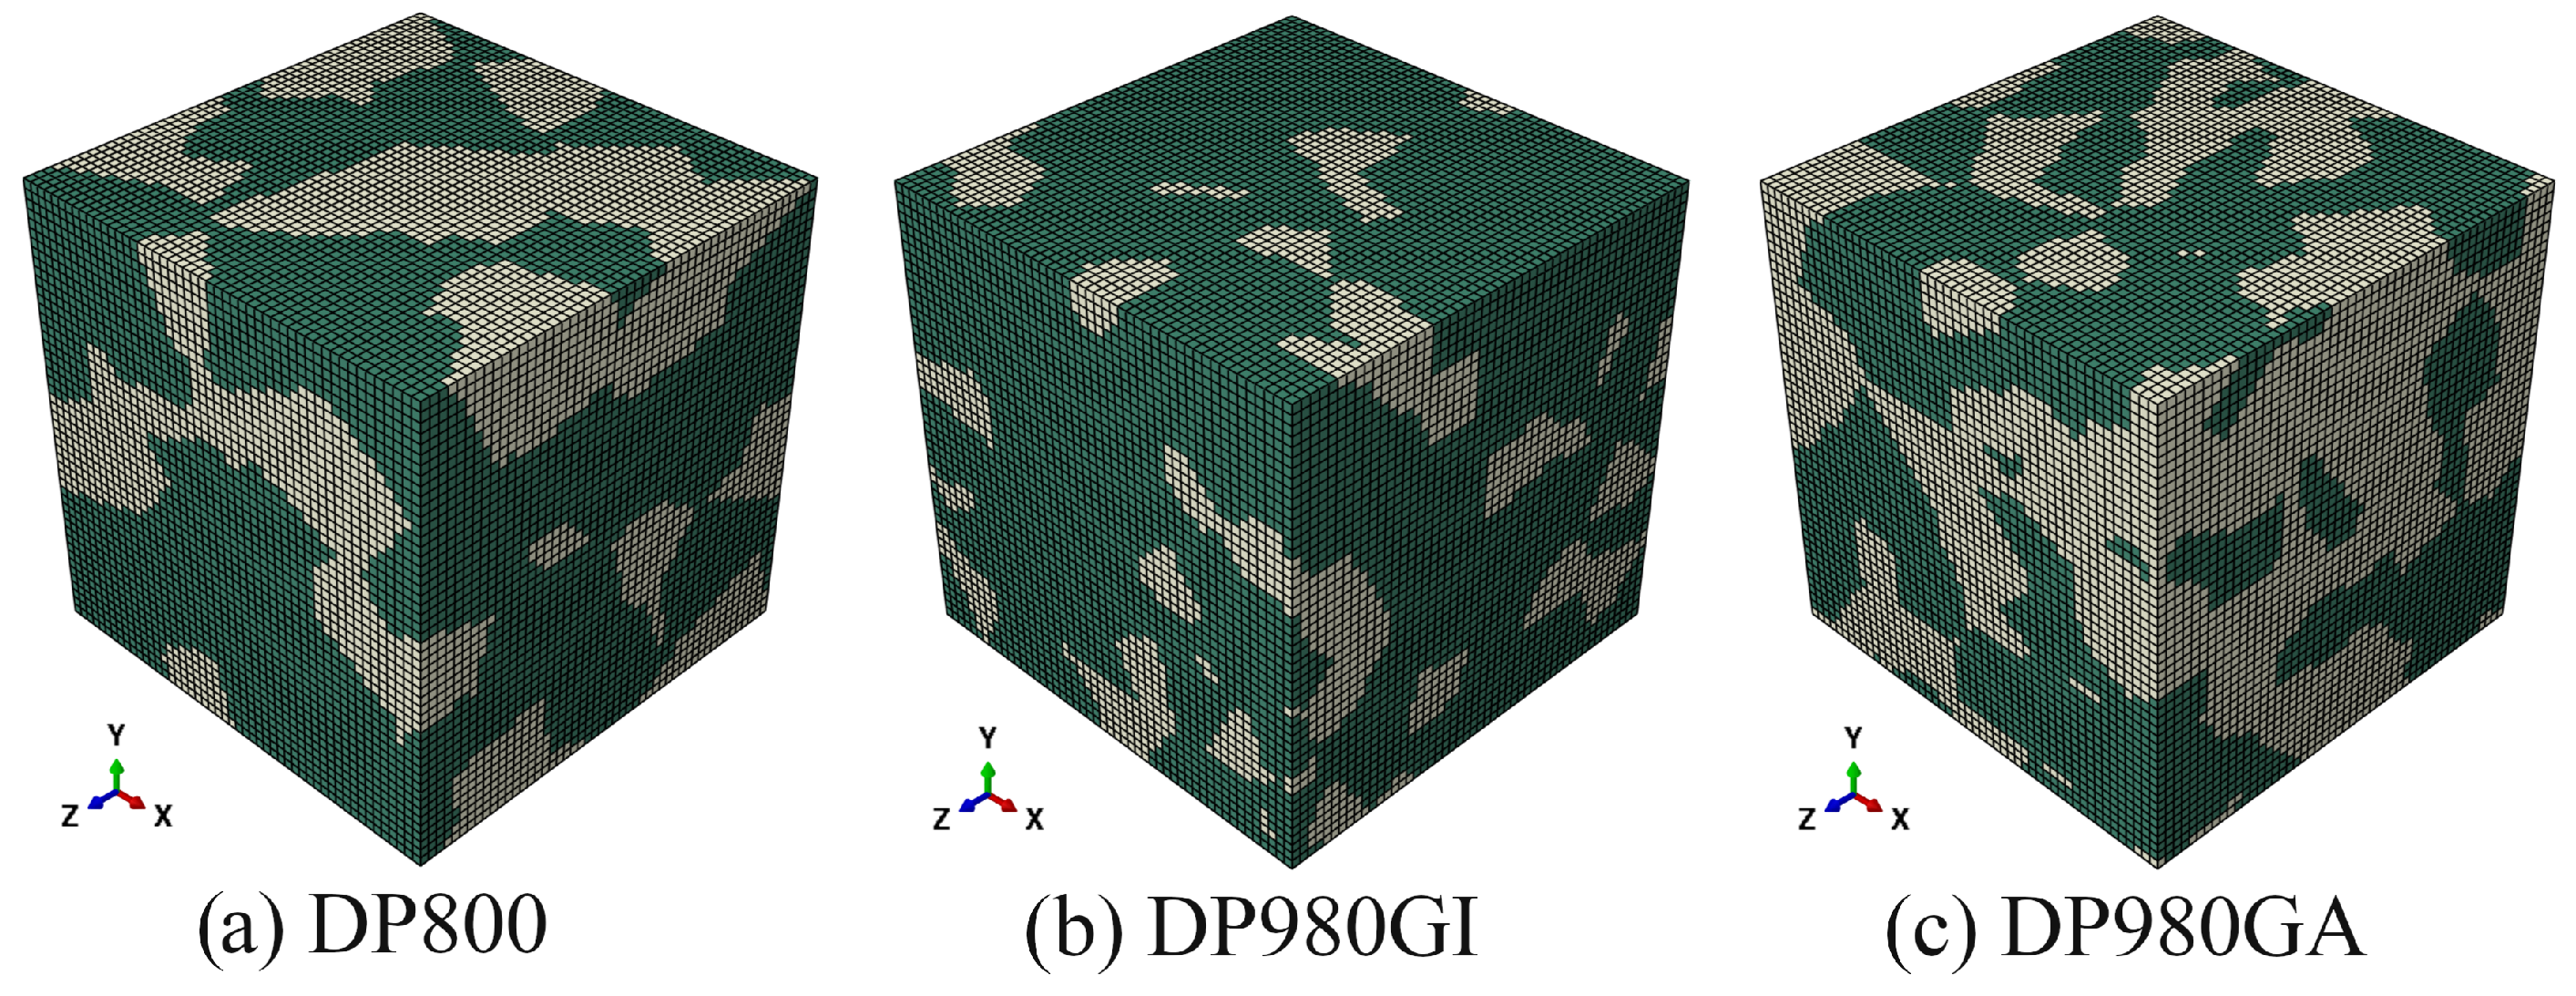
3. Rve Modeling for True Stress–Strain Prediction
3.1. True Flow Behavior of the Individual Phases
3.2. Predicting the True Flow Behavior of DP Steels
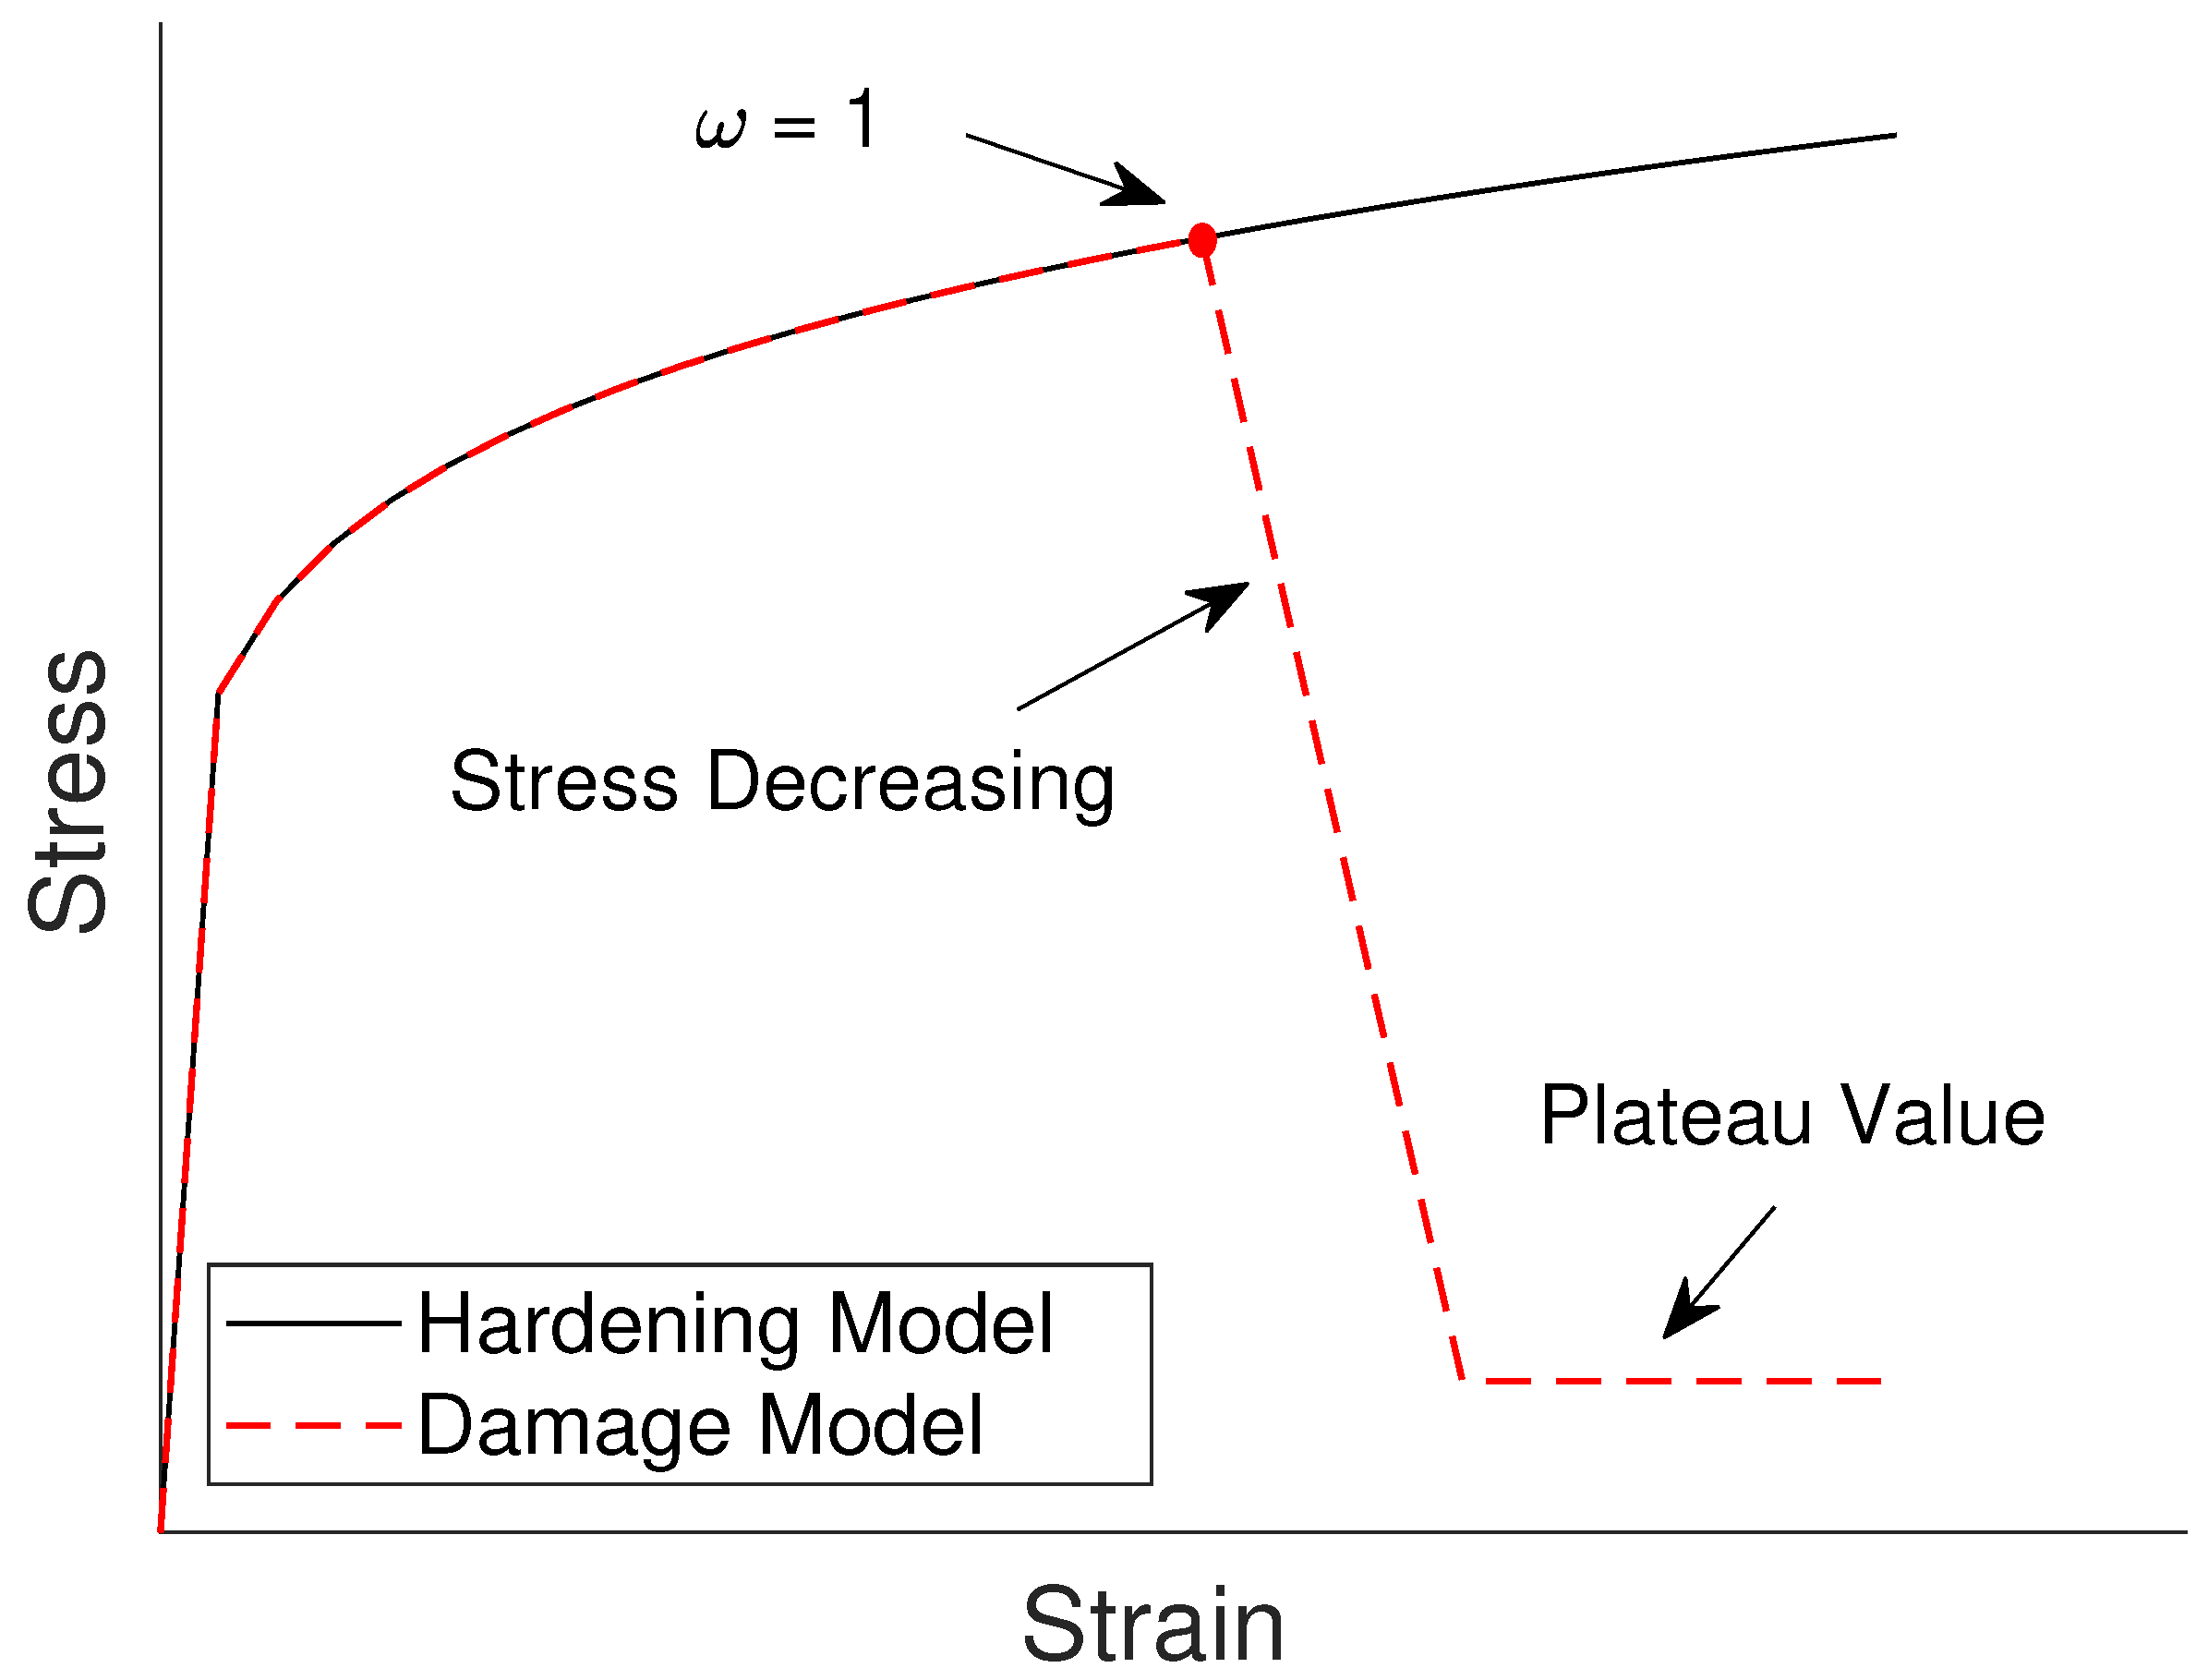
4. Damage Model and Failure Simulation
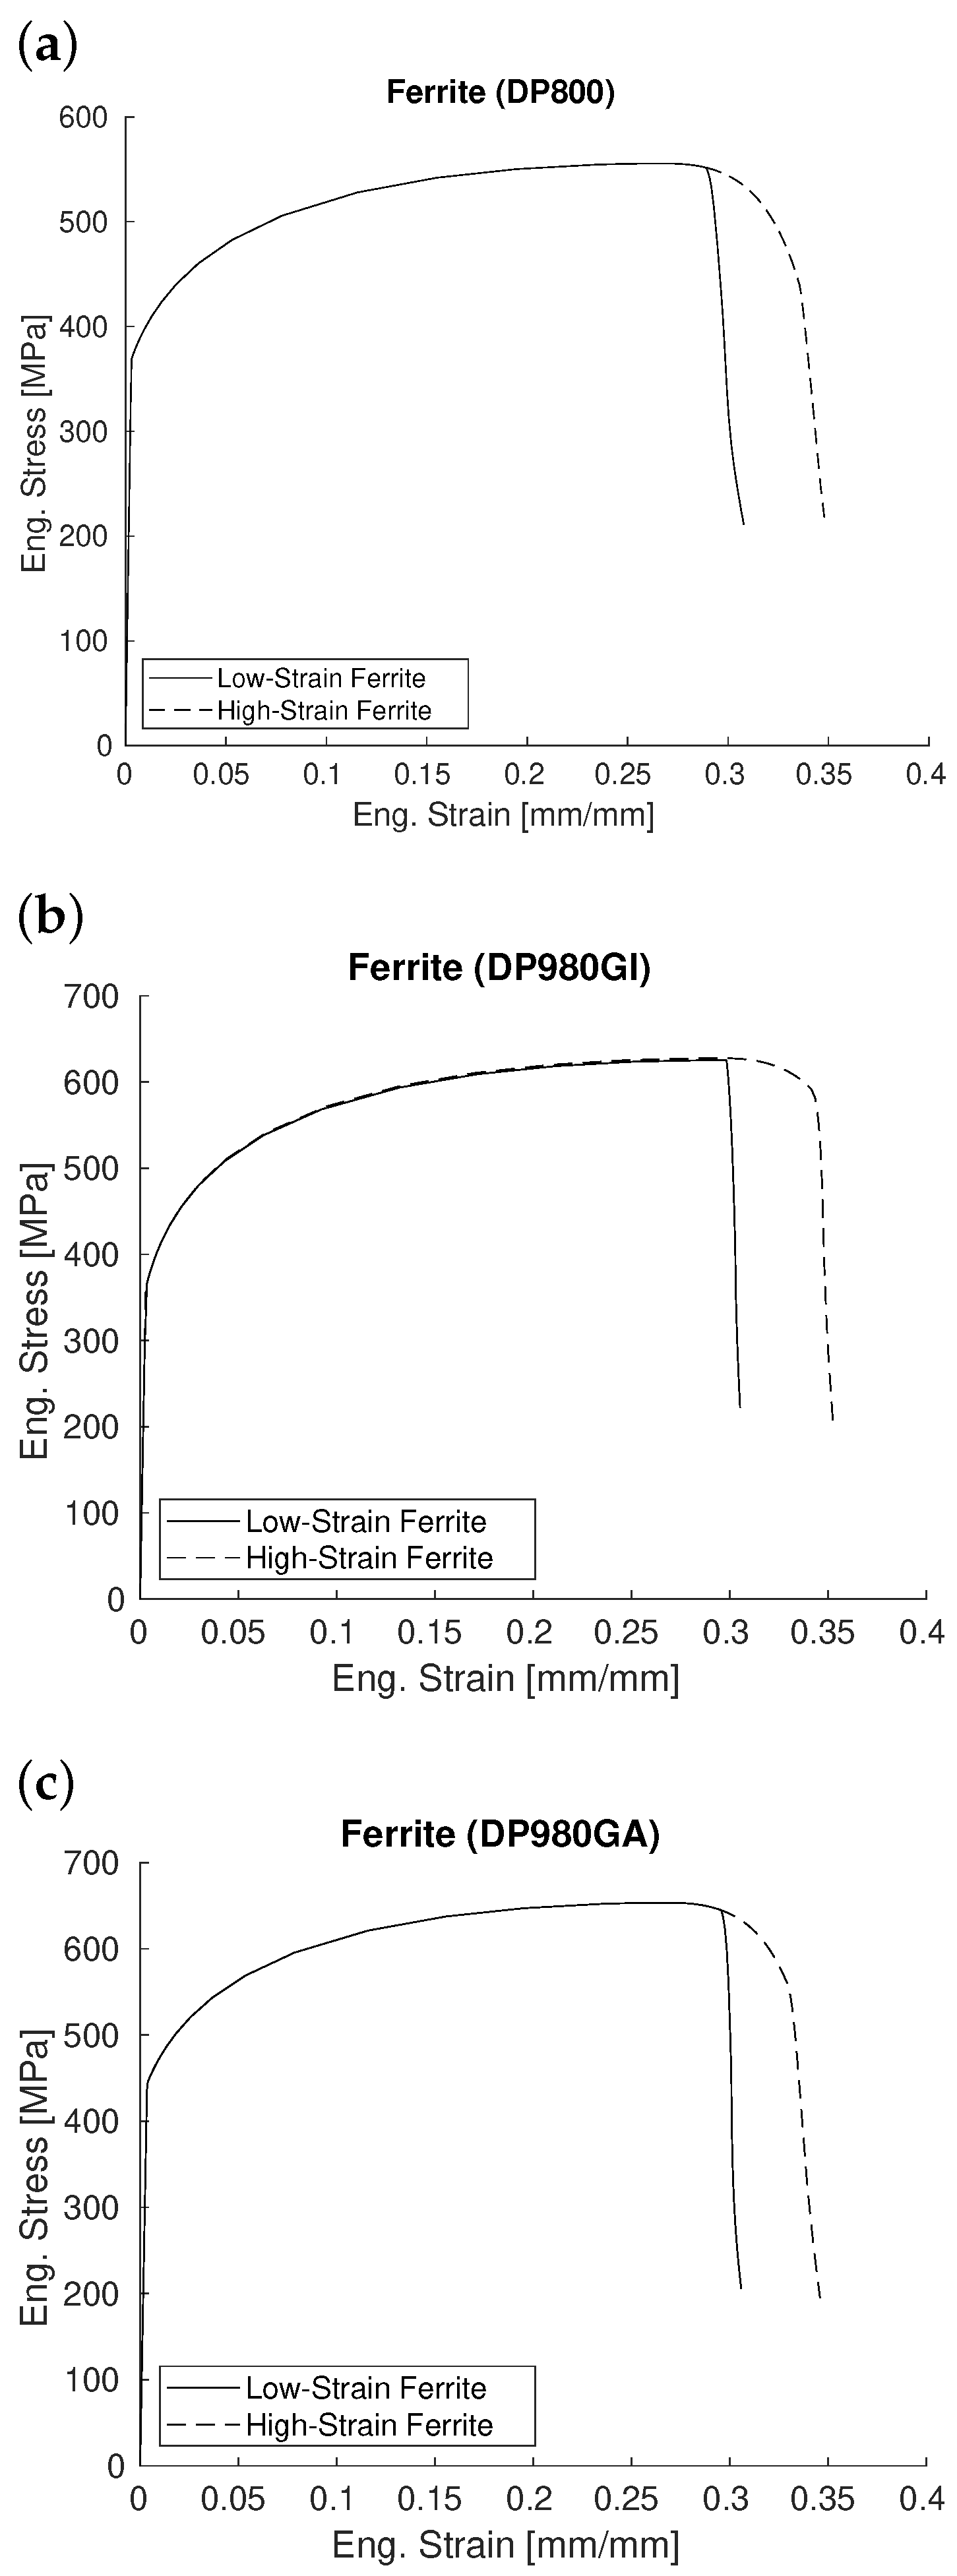
Failure Strain in Pure Ferrite Specimens
5. Estimating the Entire Engineering Stress–Strain Curve
5.1. Step 1
5.2. Step 2
5.3. Step-3
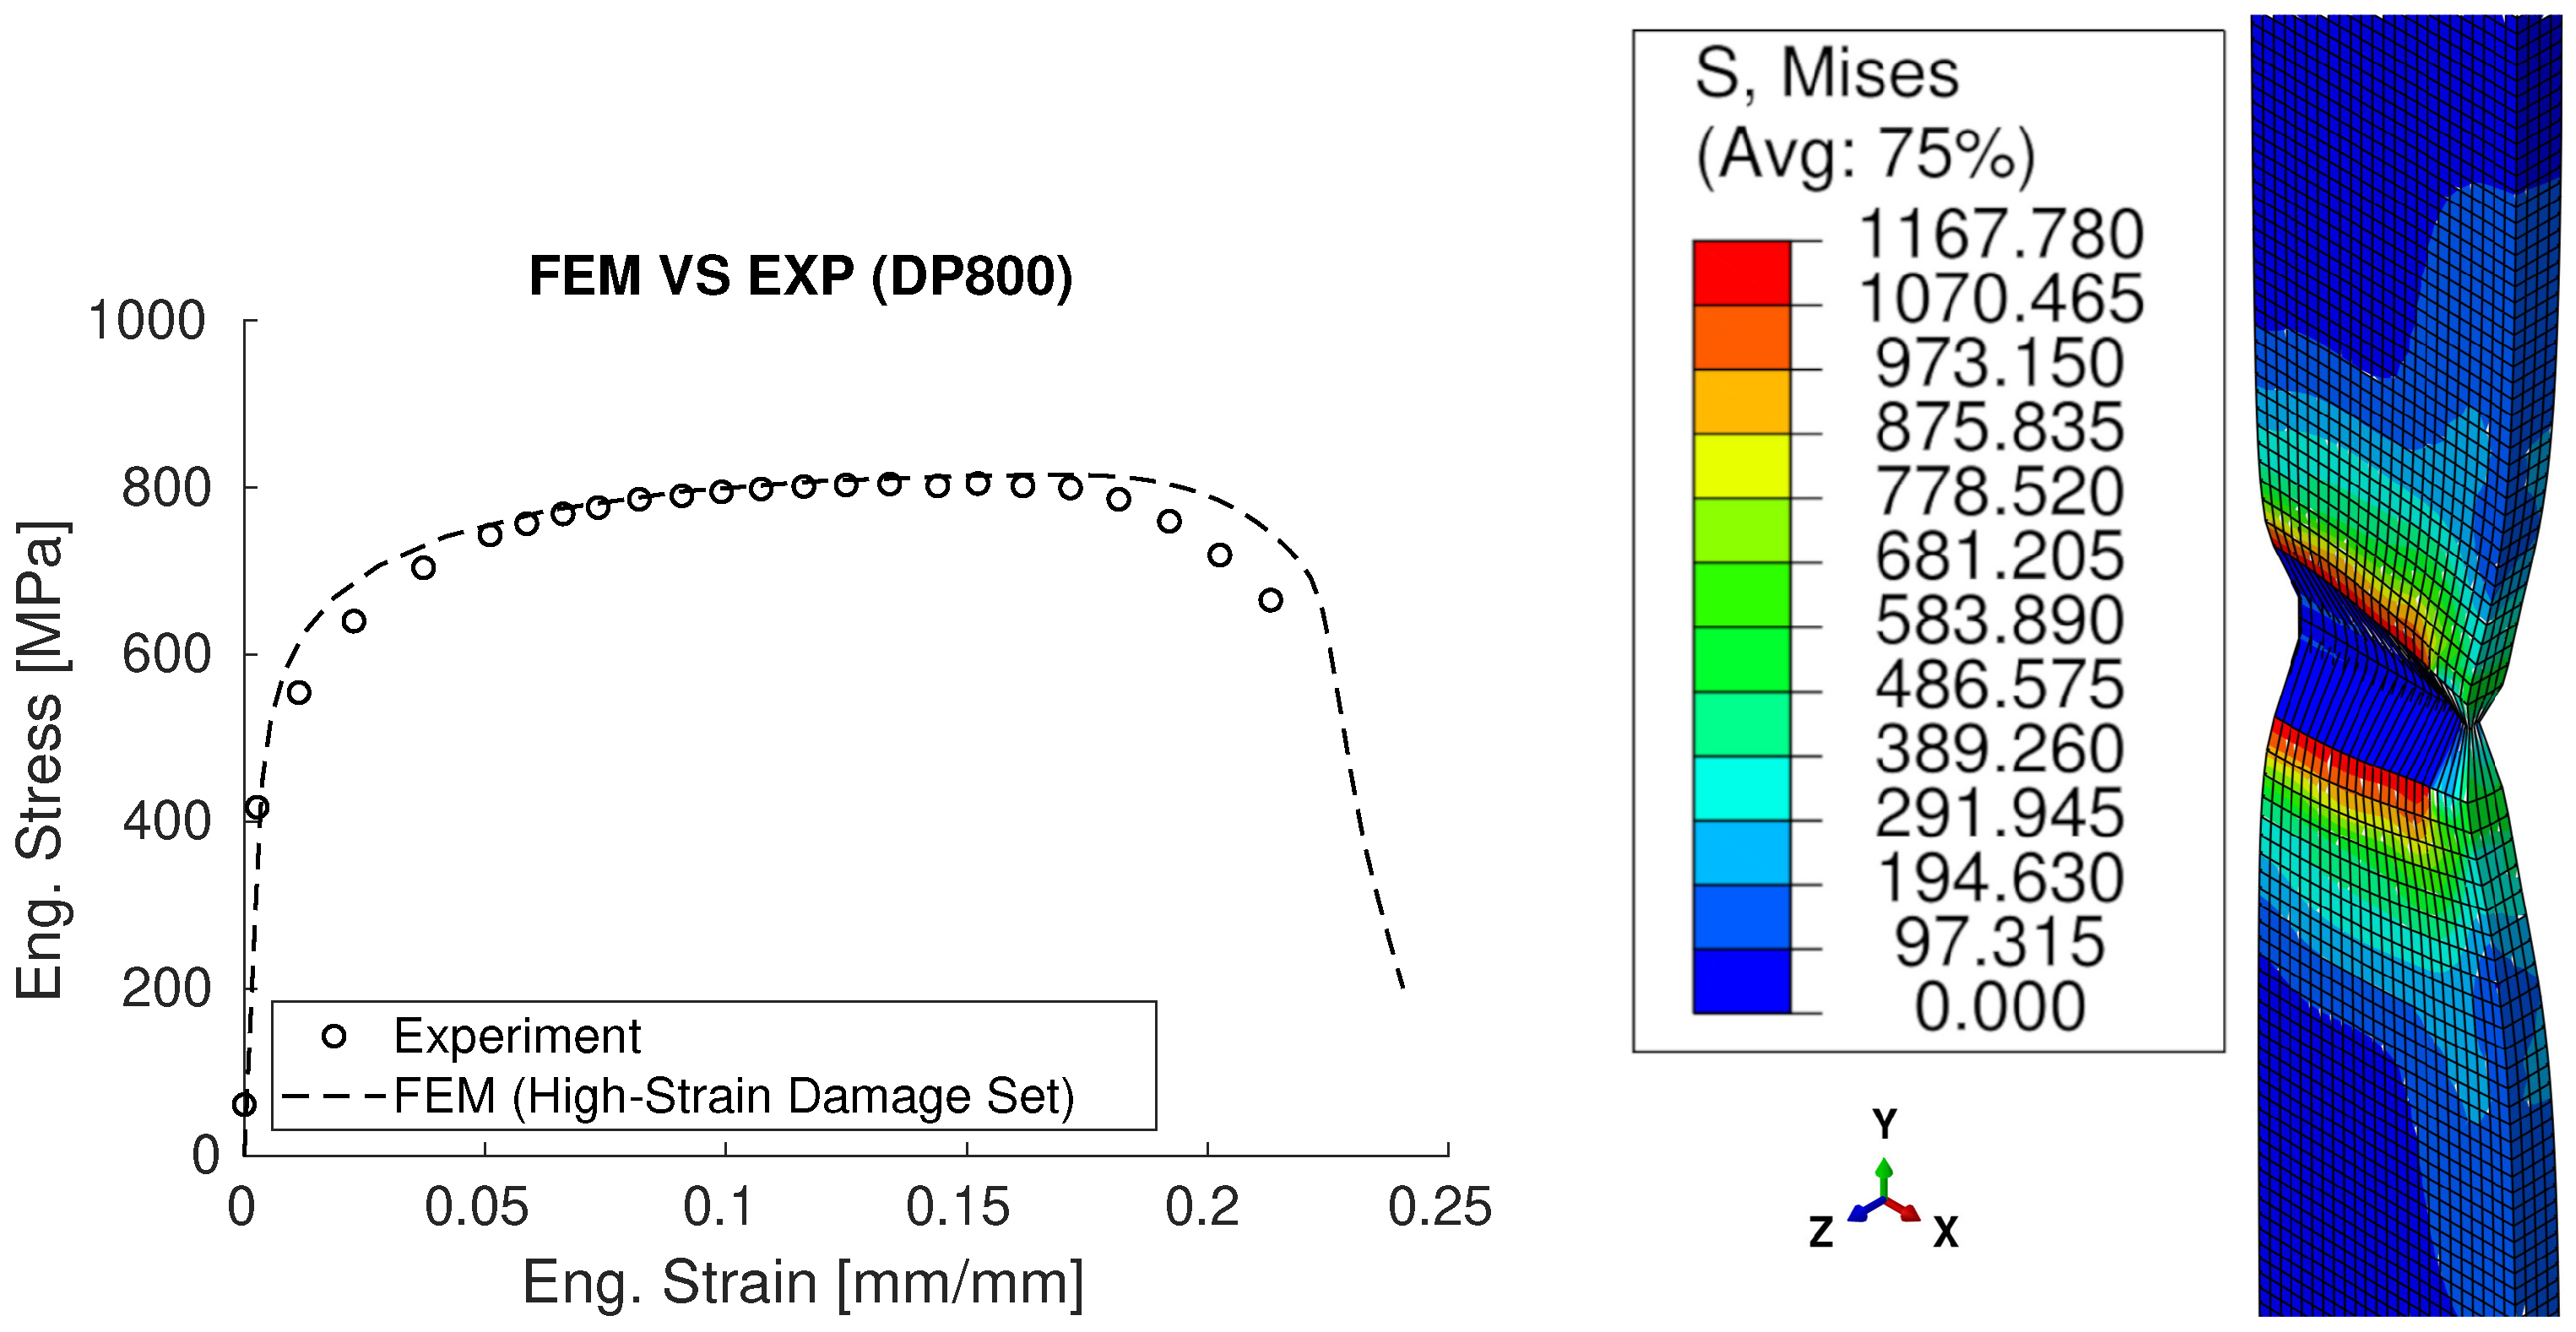
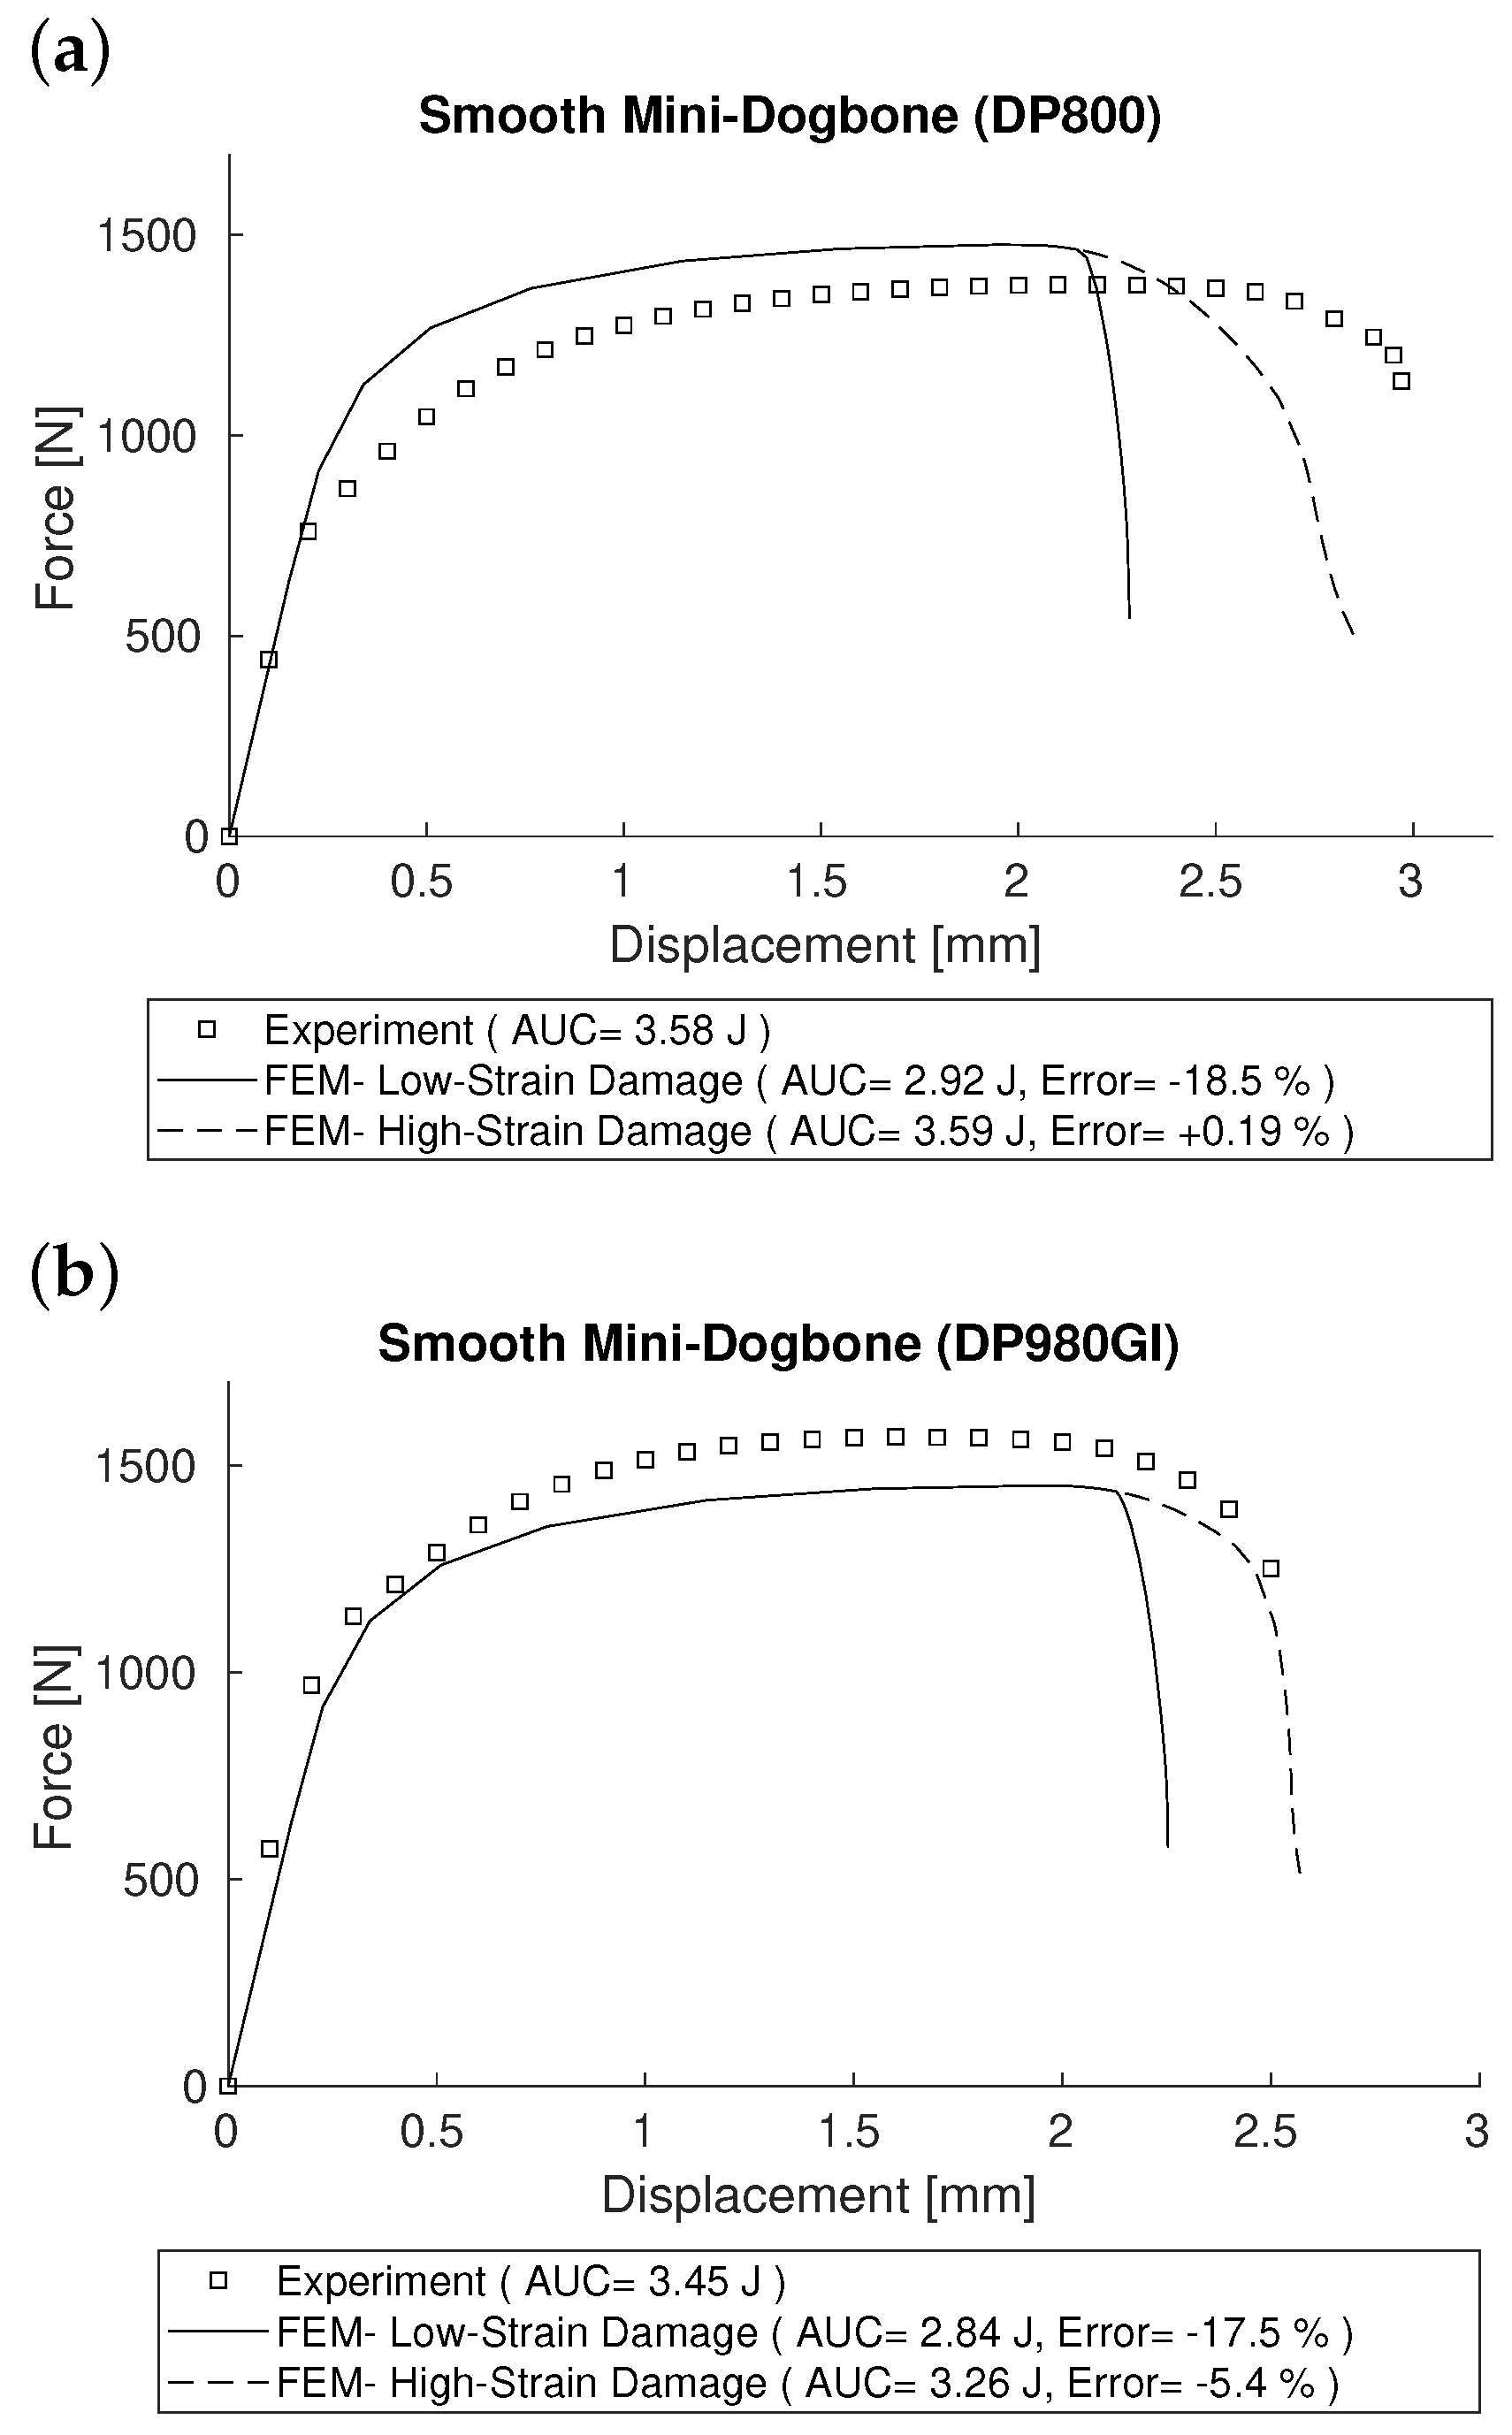
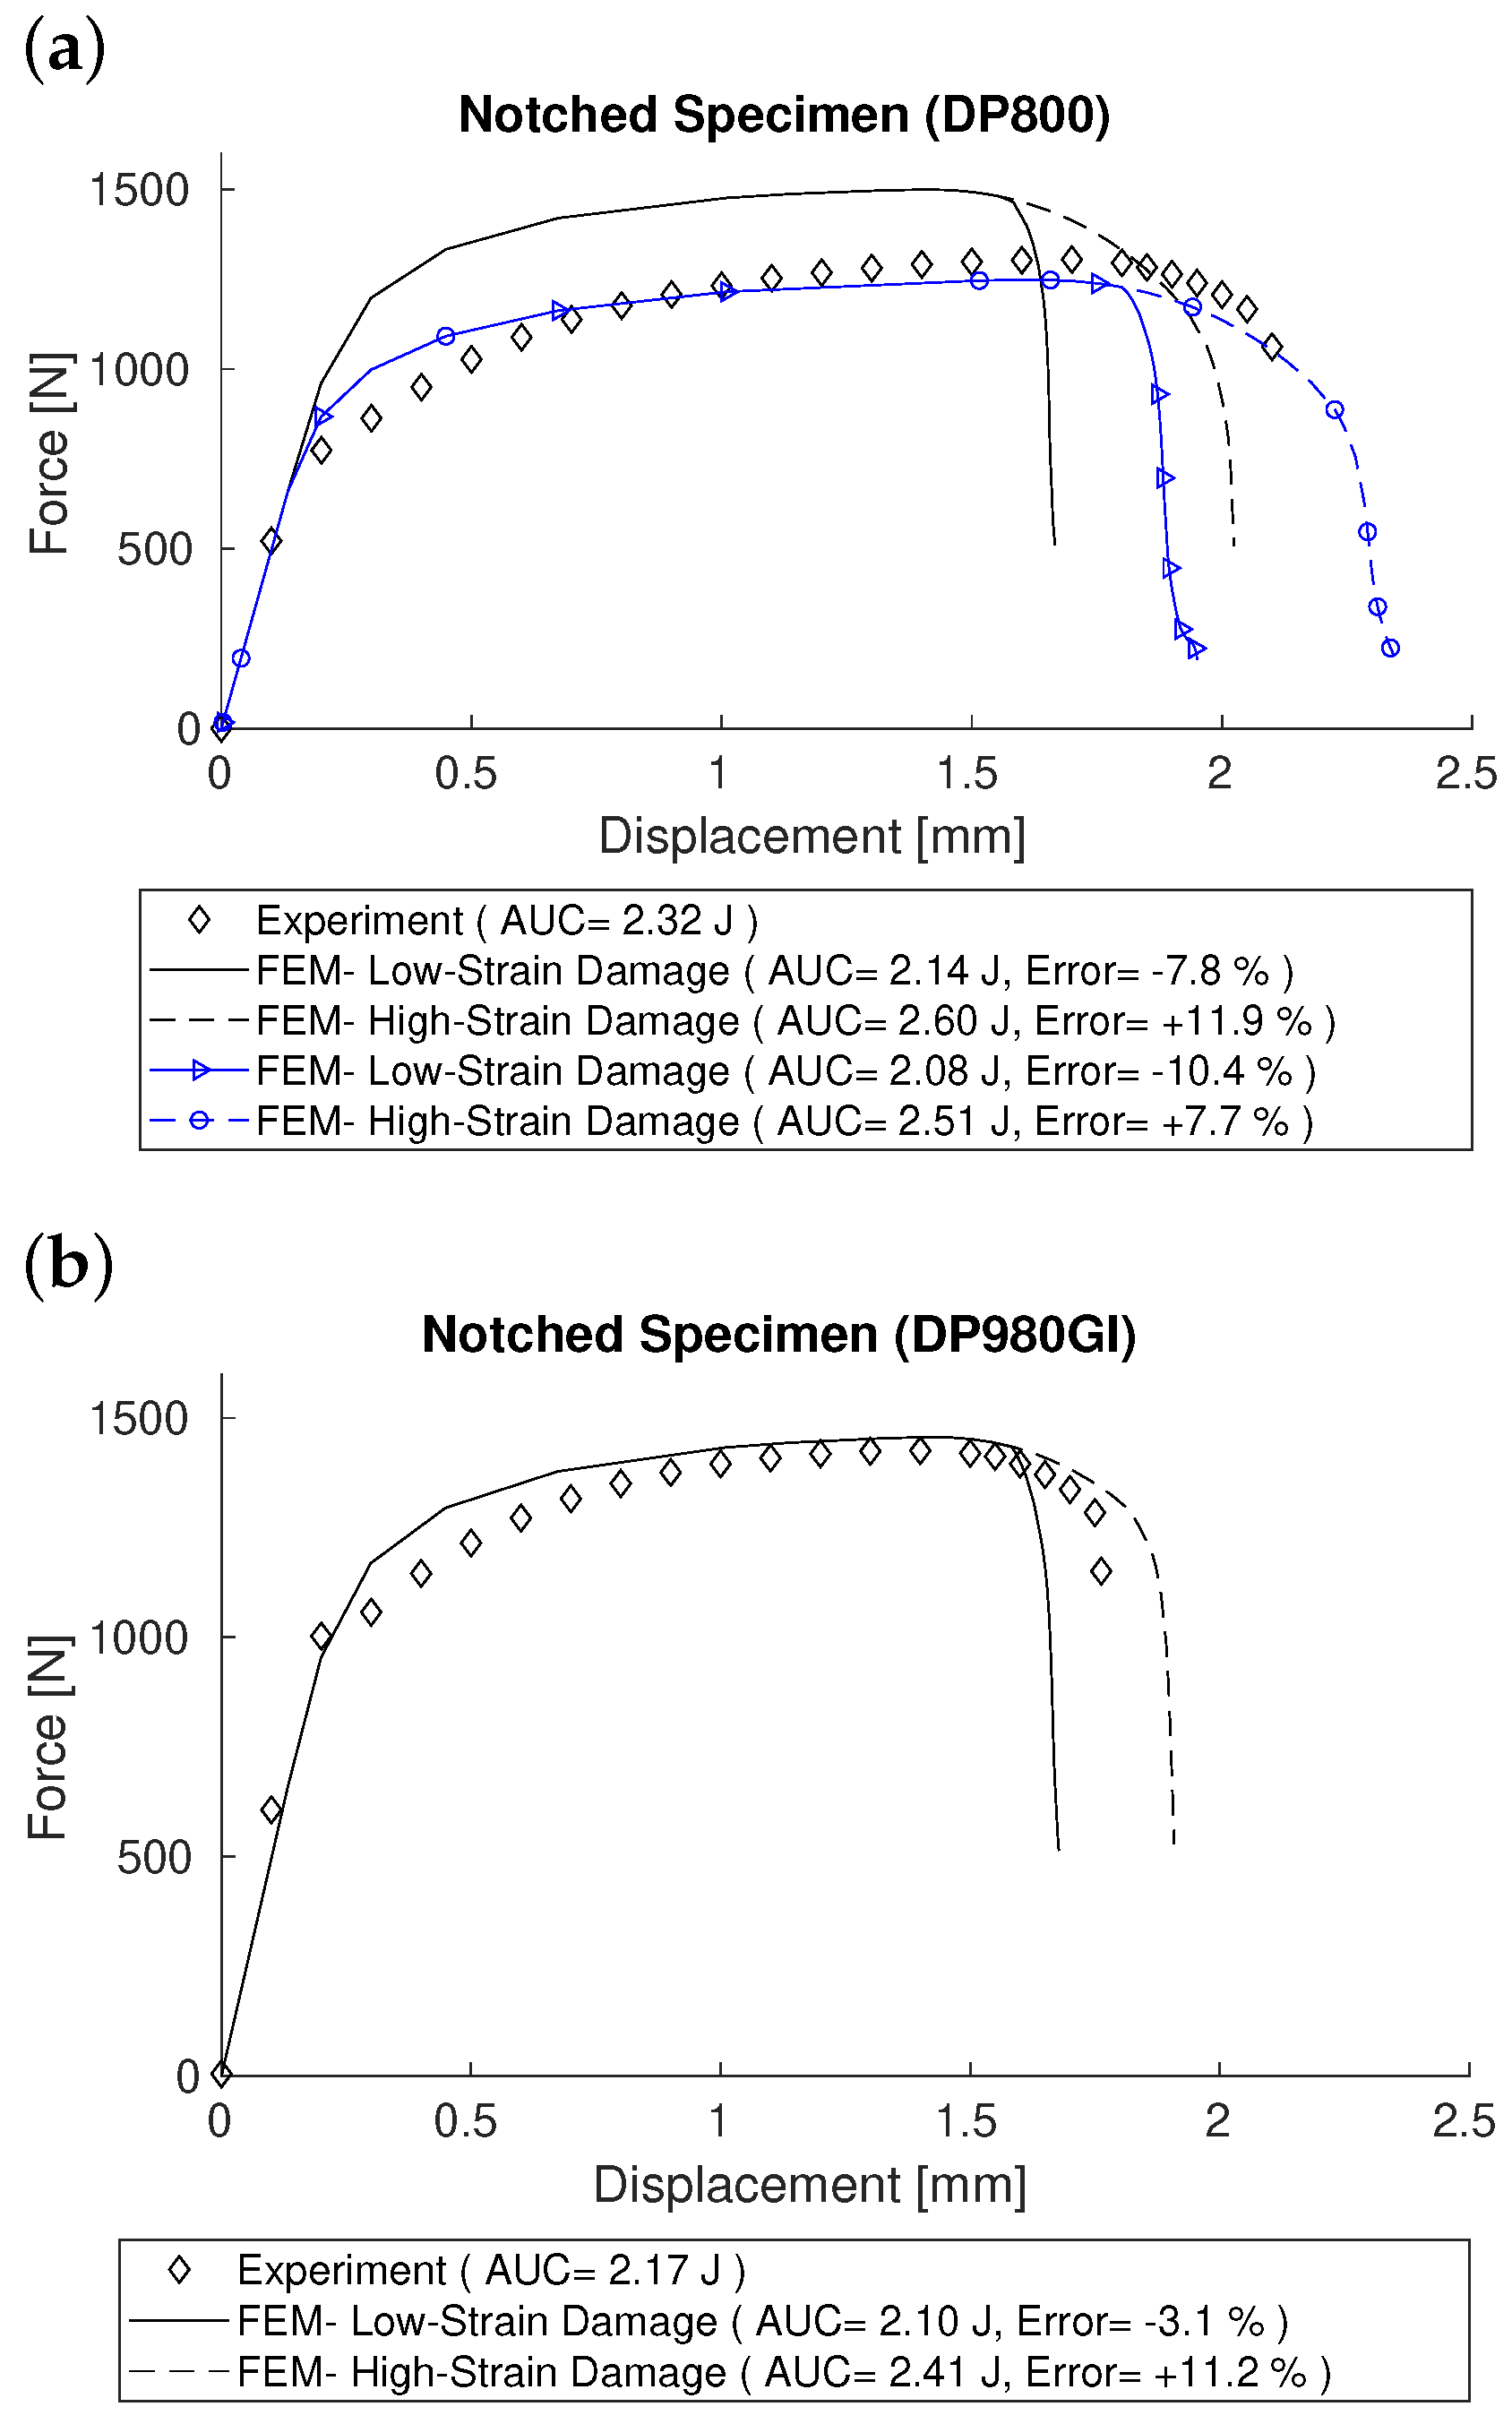
5.4. Step 4: Applying the Adjusted Damage Parameters to Tensile Specimens Using the Material Properties Predicted in the Second Step
5.5. Step 5: Validation Based on Experimental and Predicted Absorbed Energies
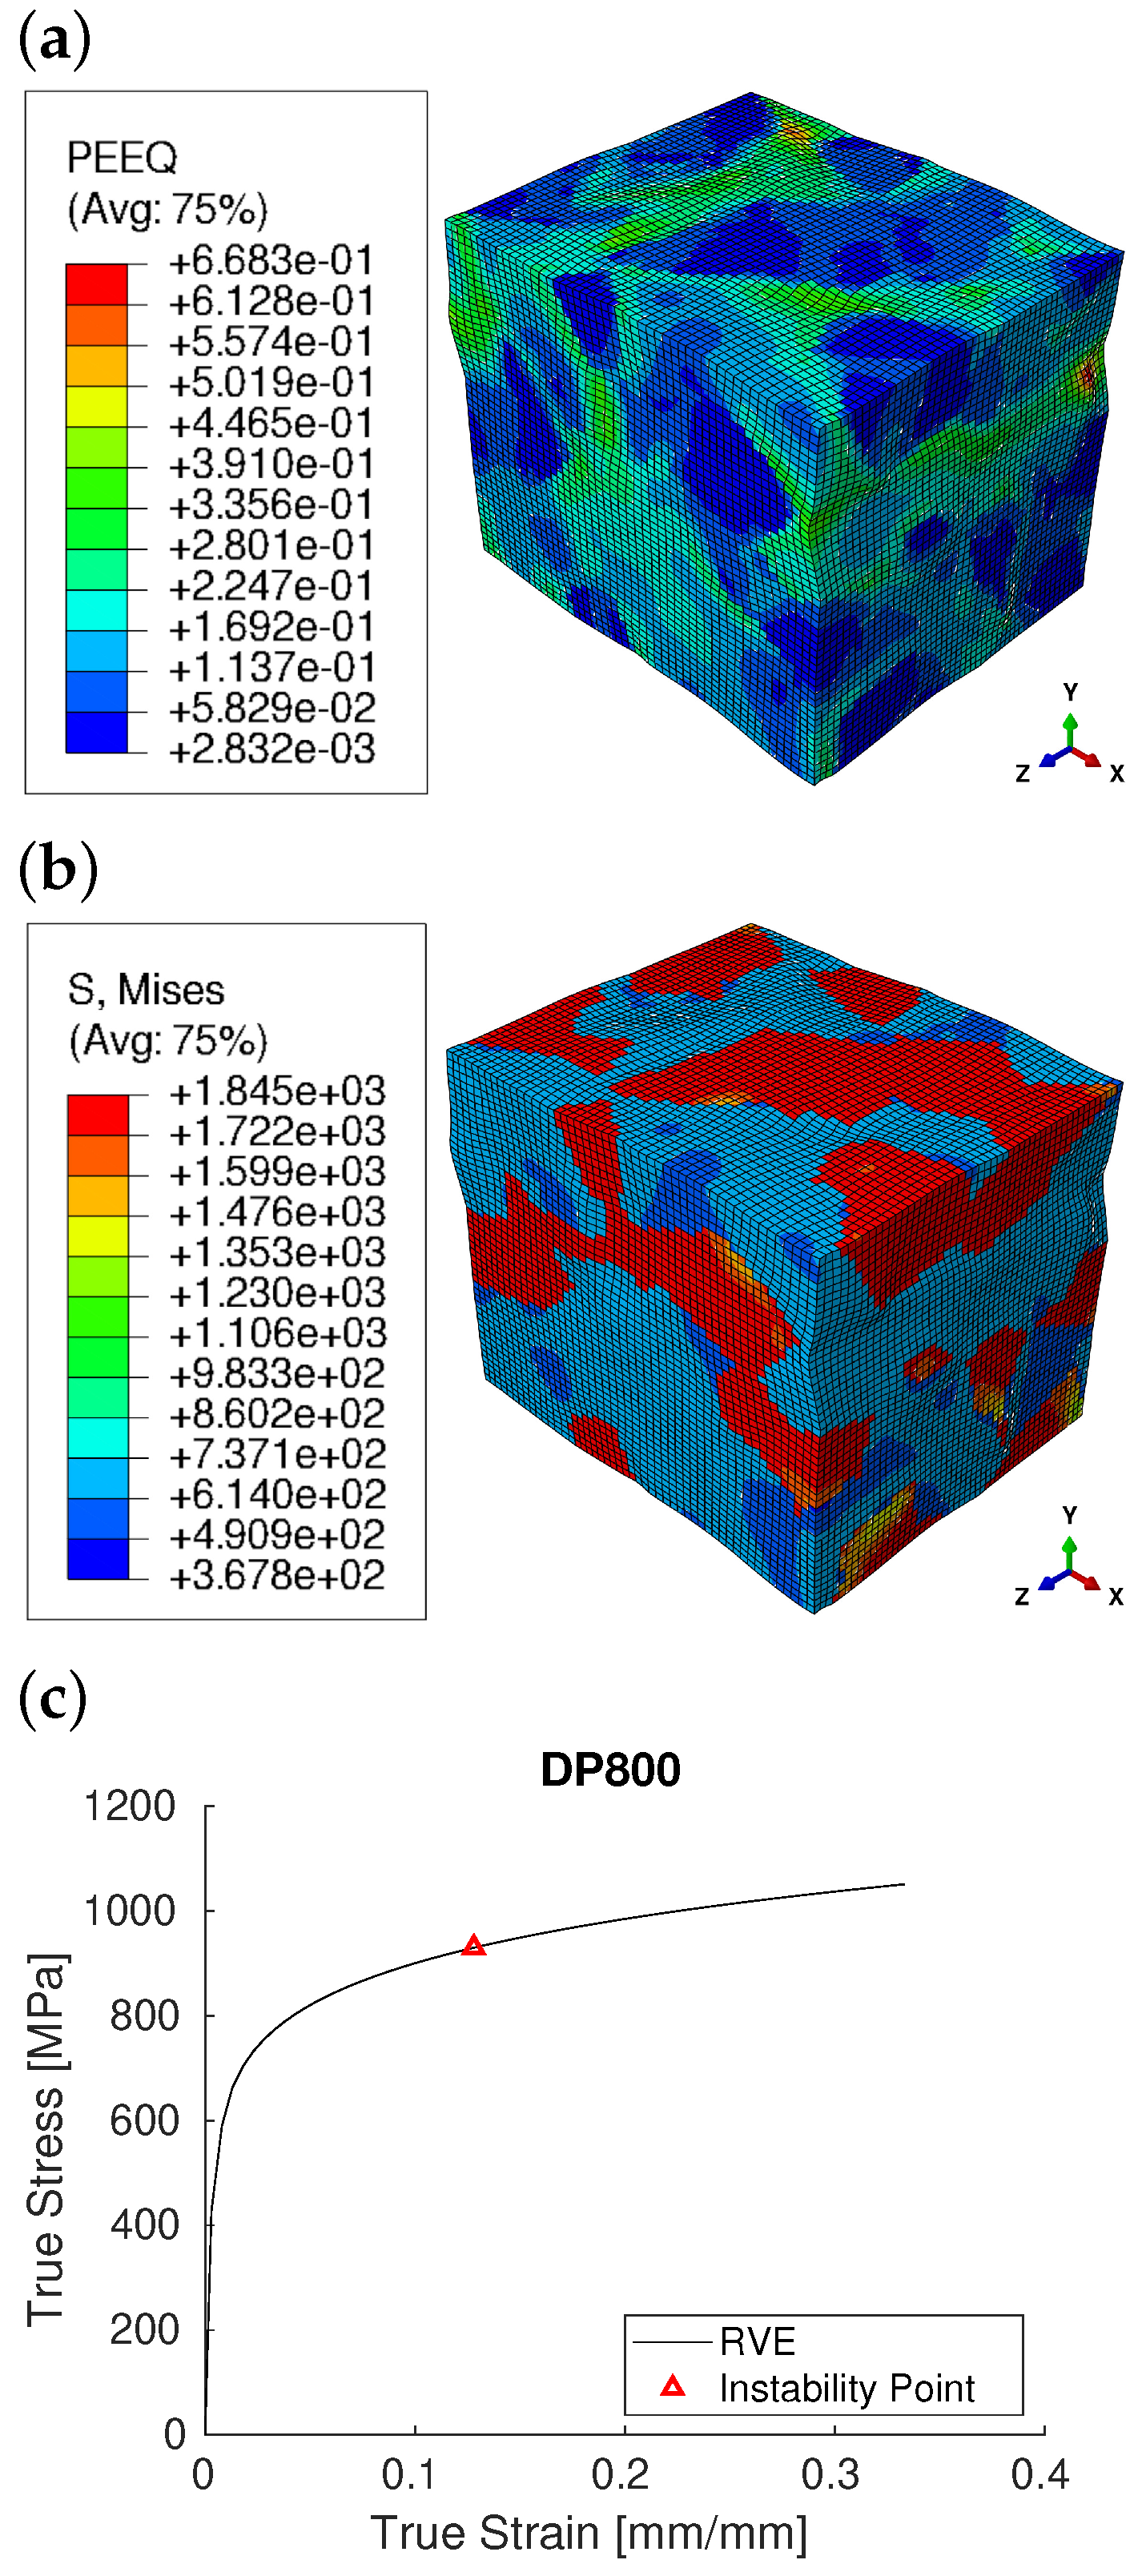
6. Results
7. Discussion
8. Conclusions
- Idealized RVEs, built from microstructure data, are sufficiently reliable to predict the true stress–strain response of DP steels.
- Calibrated damage parameters for high-strain ferrite (with a failure strain of 35%) can be directly used to predict the full stress–strain curve and the corresponding failure in absorbed energy.
- Incorporating the triaxiality adjustment parameter, D, into the damage model—which is based on the average triaxiality of the ferrite regions in the RVE—enables the calibrated damage parameters for pure ferrite to be effectively applied to DP grades to predict fracture-absorbed energy.
- This approach to predicting failure-absorbed energy in a uniaxial tensile test is effective for all geometries due to the natural adjustments to triaxiality and plastic strain with changes in geometry.
Author Contributions
Funding
Data Availability Statement
Acknowledgments
Conflicts of Interest
References
- Bouaziz, O.; Zurob, H.; Huang, M. Driving Force and Logic of Development of Advanced High Strength Steels for Automotive Applications. Steel Res. Int. 2013, 84, 937–947. [Google Scholar] [CrossRef]
- Tasan, C.; Diehl, M.; Yan, D.; Bechtold, M.; Roters, F.; Schemmann, L.; Zheng, C.; Peranio, N.; Ponge, D.; Koyama, M.; et al. An Overview of Dual-Phase Steels: Advances in Microstructure-Oriented Processing and Micromechanically Guided Design. Annu. Rev. Mater. Res. 2015, 45, 391–431. [Google Scholar] [CrossRef]
- Allain, S.; Bouaziz, O.; Pushkareva, I.; Scott, C. Towards the microstructure design of DP steels: A generic size-sensitive mean-field mechanical model. Mater. Sci. Eng. A 2015, 637, 222–234. [Google Scholar] [CrossRef]
- Sardar, A.; Simha, C.; Bardelcik, A. Phenomenological model for yield, flow, and failure behavior of dual-phase steels. Mater. Sci. Eng. A 2020, 798, 140136. [Google Scholar] [CrossRef]
- Öztürk, E.; Arıkan, H. Investigation of mechanical properties of laser welded dual-phase steels at macro and micro levels. Opt. Laser Technol. 2023, 157, 108713. [Google Scholar] [CrossRef]
- Espinosa, E.; Sardar, A.; Simha, C.H.M.; Bardelcik, A. Realistic Morphology-Based Representative Volume Elements for Dual-Phase Steels. Mech. Mater. 2021, 160, 24. [Google Scholar] [CrossRef]
- Ha, J.; Lee, J.; Kim, J.H.; Lee, M.G.; Barlat, F. Investigation of plastic strain rate under strain path changes in dual-phase steel using microstructure-based modeling. Int. J. Plast. 2017, 93, 89–111. [Google Scholar] [CrossRef]
- Cavusoglu, O.; Toros, S. Three-Dimensional Micromechanical Modeling of Martensite Particle Size Effects on the Deformation Behavior of Dual-Phase Steels. Materials 2024, 17, 5004. [Google Scholar] [CrossRef]
- Amirmaleki, M.; Samei, J.; Green, D.E.; Van Riemsdijk, I.; Stewart, L. 3D micromechanical modeling of dual phase steels using the representative volume element method. Mech. Mater. 2016, 101, 27–39. [Google Scholar] [CrossRef]
- Mecking, H.; Kocks, U. Kinetics of flow and strain-hardening. Acta Metall. 1981, 29, 1865–1875. [Google Scholar] [CrossRef]
- Allain, S.; Bouaziz, O.; Takahashi, M. Toward a New Interpretation of the Mechanical Behaviour of As-quenched Low Alloyed Martensitic Steels. ISIJ Int. 2012, 52, 717–722. [Google Scholar] [CrossRef]
- Park, E.K.; Hwang, J.H.; Kim, Y.J.; Kumagai, T. Strain-Based damage model for ductile tearing simulation under combined tensile and shear modes. Eng. Fract. Mech. 2024, 303, 110122. [Google Scholar] [CrossRef]
- Nahrmann, M.; Matzenmiller, A. Modelling of nonlocal damage and failure in ductile steel sheets under multiaxial loading. Int. J. Solids Struct. 2021, 232, 111166. [Google Scholar] [CrossRef]
- Simha, C.H.M.; Xu, S.; Tyson, W. Computational modeling of the drop-weight tear test: A comparison of two failure modeling approaches. Eng. Fract. Mech. 2015, 148, 304–323. [Google Scholar] [CrossRef]
- Gurson, A.L. Continuum Theory of Ductile Rupture by Void Nucleation and Growth: Part I—Yield Criteria and Flow Rules for Porous Ductile Media. J. Eng. Mater. Technol. 1977, 99, 2–15. [Google Scholar] [CrossRef]
- Tvergaard, V.; Needleman, A. Analysis of the cup-cone fracture in a round tensile bar. Acta Metall. 1984, 32, 157–169. [Google Scholar] [CrossRef]
- Dotta, F.; Ruggieri, C. Structural integrity assessments of high pressure pipelines with axial flaws using a micromechanics model. Int. J. Press. Vessel. Pip. 2004, 81, 761–770. [Google Scholar] [CrossRef]
- Espeseth, V.; Morin, D.; Børvik, T.; Hopperstad, O.S. A gradient-based non-local GTN model: Explicit finite element simulation of ductile damage and fracture. Eng. Fract. Mech. 2023, 289, 109442. [Google Scholar] [CrossRef]
- Pericoli, V.; Lao, X.; Ziccarelli, A.; Kanvinde, A.; Deierlein, G. Integration of an adaptive cohesive zone and continuum ductile fracture model to simulate crack propagation in steel structures. Eng. Fract. Mech. 2021, 258, 108041. [Google Scholar] [CrossRef]
- Cornec, A.; Scheider, I.; Schwalbe, K.H. On the practical application of the cohesive model. Eng. Fract. Mech. 2003, 70, 1963–1987. [Google Scholar] [CrossRef]
- Nam, H.S.; Lee, J.M.; Kim, Y.J.; Kim, J.W. Numerical ductile fracture prediction of circumferential through-wall cracked pipes under very low cycle fatigue loading condition. Eng. Fract. Mech. 2018, 194, 175–189. [Google Scholar] [CrossRef]
- Oh, C.S.; Kim, N.H.; Kim, Y.J.; Baek, J.H.; Kim, Y.P.; Kim, W.S. A finite element ductile failure simulation method using stress-modified fracture strain model. Eng. Fract. Mech. 2011, 78, 124–137. [Google Scholar] [CrossRef]
- Rice, J.; Tracey, D. On the ductile enlargement of voids in triaxial stress fields. J. Mech. Phys. Solids 1969, 17, 201–217. [Google Scholar] [CrossRef]
- ASTM E8/E8M-22; Standard Test Methods for Tension Testing of Metallic Materials. ASTM International: West Conshohocken, PA, USA, 2022. Available online: https://www.astm.org/e0008_e0008m-22.html (accessed on 4 July 2025).
- Bardelcik, A.; Worswick, M.; Winkler, S.; Wells, M. A strain rate sensitive constitutive model for quenched boron steel with tailored properties. Int. J. Impact Eng. 2012, 50, 49–62. [Google Scholar] [CrossRef]
- Bardelcik, A.; Butler, Q. Strain partitioning characterization of advanced high strength steels using in-situ tensile tests with Micro digital image correlation—Methodology and analysis. Mater. Charact. 2024, 218, 114451. [Google Scholar] [CrossRef]
- Lertkiatpeeti, K.; Janya-Anurak, C.; Uthaisangsuk, V. Effects of spatial microstructure characteristics on mechanical properties of dual phase steel by inverse analysis and machine learning approach. Comput. Mater. Sci. 2024, 245, 113311. [Google Scholar] [CrossRef]
- Nam, H.S.; Oh, Y.R.; Kim, Y.J.; Kim, J.S.; Miura, N. Application of engineering ductile tearing simulation method to CRIEPI pipe test. Eng. Fract. Mech. 2016, 153, 128–142. [Google Scholar] [CrossRef]
- Anderson, D.; Winkler, S.; Bardelcik, A.; Worswick, M. Influence of stress triaxiality and strain rate on the failure behavior of a dual-phase DP780 steel. Mater. Des. 2014, 60, 198–207. [Google Scholar] [CrossRef]
- Liu, L. The unexpected low fracture toughness of dual-phase steels caused by ferrite/martensite interface decohesion. Scr. Mater. 2024, 244, 116030. [Google Scholar] [CrossRef]
- Chen, H. Microstructure, mechanical properties and strengthening mechanism of high strength hot-rolled ferrite-martensite dual phase steel. Mater. Charact. 2024, 207, 113545. [Google Scholar] [CrossRef]
- Dulucheanu, C.; Severin, T.L.; Cerlinca, D.A.; Irimescu, L. Structures and Mechanical Properties of Some Dual-Phase Steels with Low Manganese Content. Metals 2022, 12, 189. [Google Scholar] [CrossRef]
- Wang, J. Effect of martensite morphology and volume fraction on the low-temperature impact toughness of dual-phase steels. Mater. Sci. 2022, 832, 142424. [Google Scholar] [CrossRef]
- Bergstrom, Y.; Granbom, Y.; Sterkenburg, D. A Dislocation-Based Theory for the Deformation Hardening Behavior of DP Steels: Impact of Martensite Content and Ferrite Grain Size. J. Metall. 2010, 2010, 647198. [Google Scholar] [CrossRef]
- Son, Y.I.; Lee, Y.K.; Park, K.T.; Lee, C.S.; Shin, D.H. Ultrafine grained ferrite–martensite dual phase steels fabricated via equal channel angular pressing: Microstructure and tensile properties. Acta Materialia 2005, 53, 3125–3134. [Google Scholar] [CrossRef]
- Ahmad, E.; Manzoor, T.; Ali, K.L.; Akhter, J.I. Effect of microvoid formation on the tensile properties of dual-phase steel. J. Mater. Eng. Perform. 2000, 9, 306–310. [Google Scholar] [CrossRef]
- Kim, N.J.; Thomas, G. Effects of morphology on the mechanical behavior of a dual phase Fe/2Si/0.1C steel. Metall. Mater. Trans. A 1981, 12, 483–489. [Google Scholar] [CrossRef]
- Han, Q.; Kang, Y.; Hodgson, P.D.; Stanford, N. Quantitative measurement of strain partitioning and slip systems in a dual-phase steel. Scr. Mater. 2013, 69, 13–16. [Google Scholar] [CrossRef]
- Kang, J.; Ososkov, Y.; Embury, J.; Wilkinson, D. Digital image correlation studies for microscopic strain distribution and damage in dual phase steels. Scr. Mater. 2007, 56, 999–1002. [Google Scholar] [CrossRef]


| Grade | C | Mn | Si | Cr | Mo | Cu | Nb | Ni | Ti | V | P | S |
|---|---|---|---|---|---|---|---|---|---|---|---|---|
| DP800 | 0.10 | 2.27 | 0.03 | 0.24 | <0.01 | 0.04 | 0.038 | 0.02 | 0.029 | <0.005 | 0.015 | <0.005 |
| DP980GI | 0.10 | 2.51 | 0.13 | 0.35 | <0.01 | 0.04 | 0.045 | 0.02 | 0.032 | <0.005 | 0.013 | <0.005 |
| DP980GA | 0.17 | 2.49 | 0.10 | 0.35 | <0.01 | 0.04 | 0.043 | 0.02 | 0.031 | <0.005 | 0.013 | <0.005 |
| Grade | Ferrite (%) | Martensite (%) | (μm) | (μm) |
|---|---|---|---|---|
| DP800 | 63 | 37 | 3.5 | 4.0 |
| DP980GI | 78 | 22 | 2.3 | 3.6 |
| DP980GA | 53 | 47 | 2.7 | 3.0 |
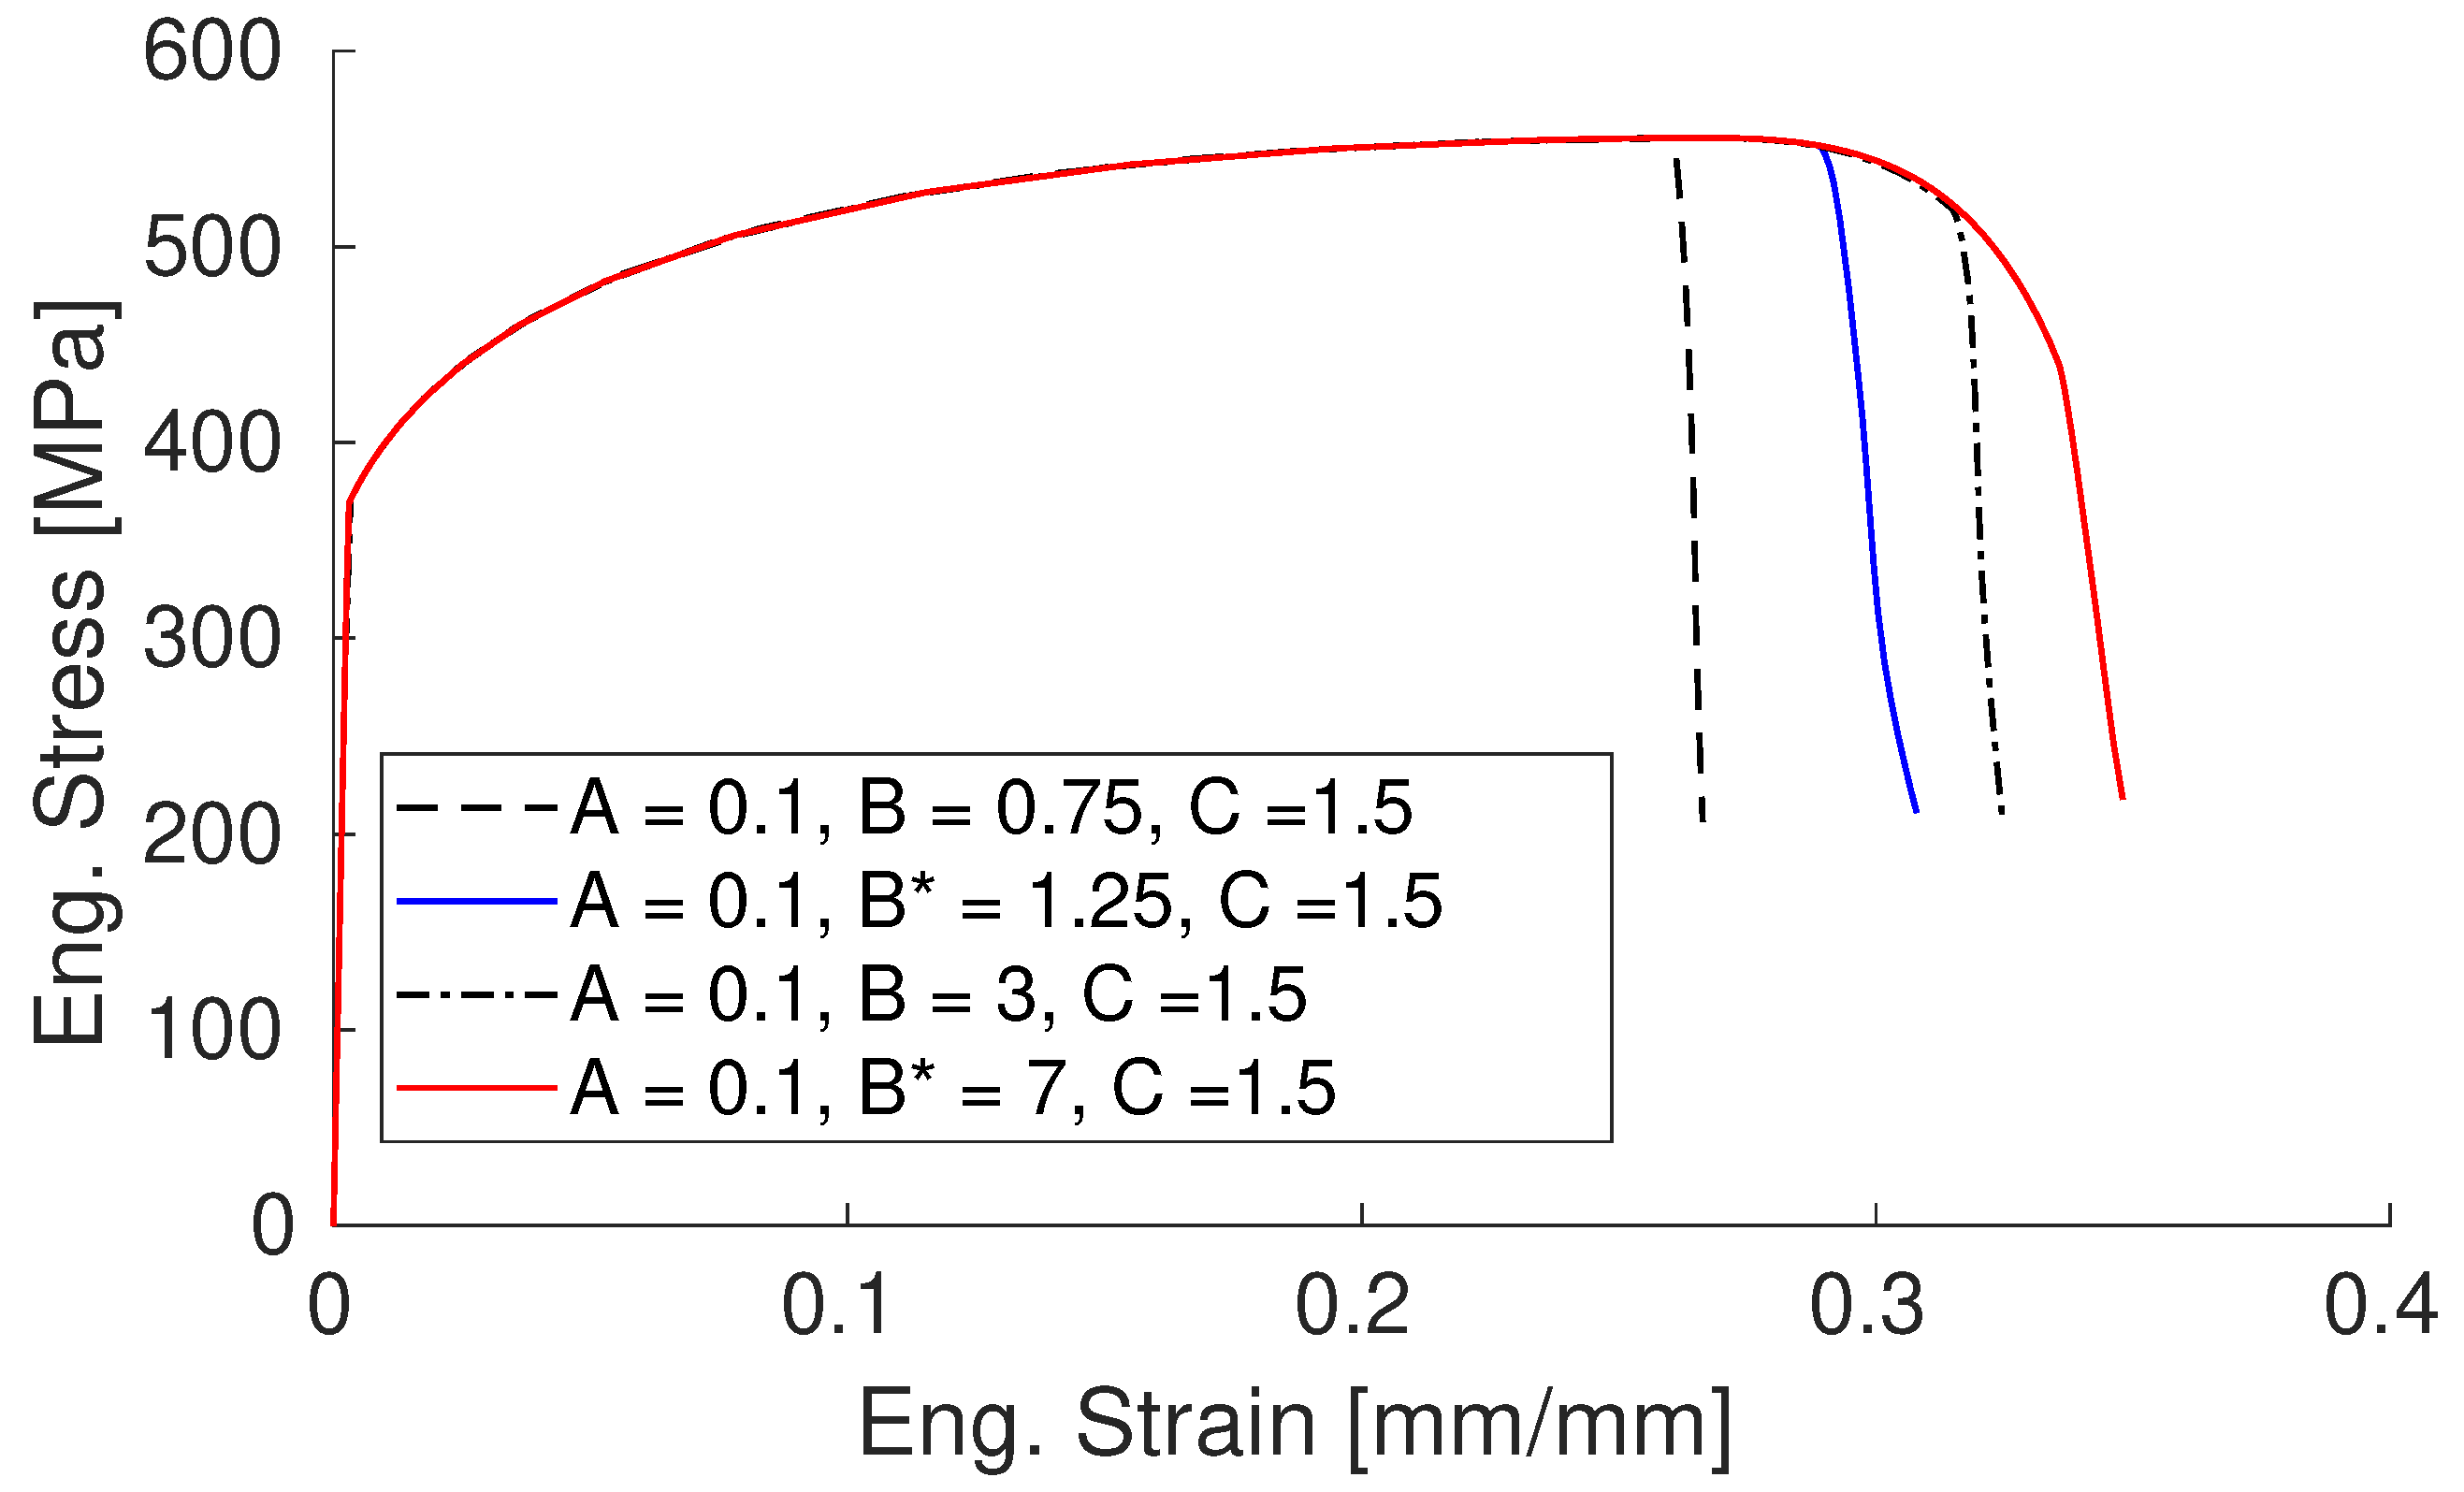
| Phase | Grade | A | B | C |
|---|---|---|---|---|
| Low-Strain Ferrite | DP800 | 0.1 | 1.25 | 1.5 |
| DP980GI | 0.1 | 1 | 1.5 | |
| DP980GA | 0.1 | 1.5 | 1.5 | |
| High-Strain Ferrite | DP800 | 0.1 | 7 | 1.5 |
| DP980GI | 0.1 | 3 | 1.5 | |
| DP980GA | 0.1 | 5.5 | 1.5 |
| RVE | Ferrite Ave. Triaxiality | D |
|---|---|---|
| DP800 | 0.516 | 1.56 |
| DP980GI | 0.422 | 1.28 |
| DP980GA | 0.567 | 1.72 |
| RVE | (MPa) | a | n |
|---|---|---|---|
| DP800 | 427 | 0.125 | |
| DP980GI | 448 | 0.121 | |
| DP980GA | 487 | 0.085 |
Disclaimer/Publisher’s Note: The statements, opinions and data contained in all publications are solely those of the individual author(s) and contributor(s) and not of MDPI and/or the editor(s). MDPI and/or the editor(s) disclaim responsibility for any injury to people or property resulting from any ideas, methods, instructions or products referred to in the content. |
© 2025 by the authors. Licensee MDPI, Basel, Switzerland. This article is an open access article distributed under the terms and conditions of the Creative Commons Attribution (CC BY) license (https://creativecommons.org/licenses/by/4.0/).
Share and Cite
Latifi Vanjani, A.; Simha, H.M.; Bardelcik, A. Development of a Technique for Toughness Estimation in Dual-Phase Steels Using Representative Volume Elements. Metals 2025, 15, 788. https://doi.org/10.3390/met15070788
Latifi Vanjani A, Simha HM, Bardelcik A. Development of a Technique for Toughness Estimation in Dual-Phase Steels Using Representative Volume Elements. Metals. 2025; 15(7):788. https://doi.org/10.3390/met15070788
Chicago/Turabian StyleLatifi Vanjani, Amin, Hari M. Simha, and Alexander Bardelcik. 2025. "Development of a Technique for Toughness Estimation in Dual-Phase Steels Using Representative Volume Elements" Metals 15, no. 7: 788. https://doi.org/10.3390/met15070788
APA StyleLatifi Vanjani, A., Simha, H. M., & Bardelcik, A. (2025). Development of a Technique for Toughness Estimation in Dual-Phase Steels Using Representative Volume Elements. Metals, 15(7), 788. https://doi.org/10.3390/met15070788