Article

Rotational Bending Fatigue Crack Initiation and Early Extension Behavior of Runner Blade Steels in Air and Water Environments

by
Bing Xue
1,2,
Yongbo Li
1,2,
Wanshuang Yi
1,2,
Wen Li
3 and
Jiangfeng Dong
3,*
1
China Yangtze Power Co., Ltd. (CYPC), Yichang 443002, China
2
Hubei Technology Innovation Center for Smart Hydropower, Wuhan 430000, China
3
MOE Key Laboratory of Deep Earth Science and Engineering, College of Architecture and Environment, Sichuan University, Chengdu 610065, China
*
Author to whom correspondence should be addressed.
Metals 2025, 15(7), 783; https://doi.org/10.3390/met15070783
Submission received: 7 May 2025 / Revised: 16 June 2025 / Accepted: 3 July 2025 / Published: 11 July 2025
(This article belongs to the Special Issue Microstructure, Deformation and Fatigue Behavior in Metals and Alloys)

Abstract

This study provides a comprehensive analysis of the fatigue cracking behavior of super martensitic stainless steel in air and water environments, highlighting the critical influence of environmental factors on its mechanical properties. By examining the distribution of fatigue test data, the Weibull three-parameter model was identified as the most accurate descriptor of fatigue life data in both environments. Key findings reveal that, in air, cracks predominantly propagate along the densest crystallographic planes, whereas, in water, corrosive media significantly accelerate crack initiation and propagation, reducing fatigue resistance, creating more tortuous crack paths, and inducing microvoids and secondary cracks at the crack tip. These corrosive effects adversely alter the material’s microstructure, profoundly impacting fatigue life and crack propagation rates. The insights gained from this research are crucial for understanding the performance of super martensitic stainless steel in aqueous environments, offering a reliable basis for its engineering applications and contributing to the development of more effective design and maintenance strategies.

1. Introduction

Super martensitic stainless steel, specifically 04Cr13Ni5Mo with a carbon content of less than 0.02%, is widely used as a turbine blade material in hydropower plants due to its excellent strength and corrosion resistance [1,2]. During long-term operation, hydraulic turbine runner blades are subjected to repeated cycles of fatigue loading. Additionally, these blades alternate between exposure to air and water environments. As a result, the combined action of mechanical fatigue, corrosion-induced degradation, and vibration-induced resonance leads to periodic blade damage and fractures, ultimately compromising the structural integrity and reliability of the system [3,4,5]. Research has shown that fatigue damage is a significant cause of failures in hydraulic turbine runner blades [2,3,4]. Therefore, investigating the high-cycle fatigue behavior of 04Cr13Ni5Mo steel under long-term exposure to air and water environments is essential for ensuring the structural integrity of hydraulic turbine runner blades.
With growing attention to the fatigue issues in hydraulic turbines, many researchers have recently started to study the various dynamic loads and how they affect the fatigue life of hydropower components [6,7]. However, when it comes to design and manufacturing, reliability is the most important thing. In the past, Georgievskaia [8] came up with a way to estimate the life of the stress-strain field at the crack tip, based on fracture mechanics. Later, Gagnon et al. [9] added the idea of the weakest link (WL) to perform a probabilistic fatigue assessment of test results, taking into account typical defect distributions. Romano et al. [10] then expanded on this by using “extreme value statistics” (EVS), a statistical method, to do probabilistic fatigue assessments of defects. Also, another study [11] highlighted how important defects are in the fatigue assessment of additive manufacturing by showing a turbine life prediction model that is based on defect size.
However, these life prediction methods, which depend only on theoretical algorithms or the initial characteristics of defects in the material, lack support from actual fatigue experiments. As a result, they are mostly just theoretical. Moreover, most of the previous studies on fatigue performance and life prediction have focused mainly on the effects of external loads. But in reality, hydraulic turbines face a complex combination of environmental corrosion, vibration, and fatigue. In particular, corrosion pits not only induce local stress concentrations on the surface of martensitic stainless steels but also create uneven corrosion interfaces, which can act as local weak points and significantly promote fatigue crack initiation [12]. Therefore, it is crucial to study the fatigue performance and develop a life prediction model for 04Cr13Ni5Mo steel, which is used in hydraulic turbines, in water environments.
Under high-cycle fatigue conditions, where the load amplitudes are relatively low, the crack initiation and early propagation phases usually make up most of the total fatigue life [12,13,14]. Therefore, understanding how cracks start and grow in the early stages is crucial for explaining why high-cycle fatigue failures happen. Chai [15] was the first to find that subsurface non-defective fatigue crack origins (SNDFCO) can form in martensite-ferrite structures, and this happens mainly through type I cracking [16]. On the other hand, Gao et al. [17] showed that in bainitic/maraging multiphase steels, cracks can start without inclusions, mostly due to maximum shear stress, which is related to mode II cracking. More recently, it has been found that in very high-cycle fatigue, cracks starting from tiny differences in the microstructure are mainly driven by mode II cracking [18]. Also, how cracks behave when they first form and start to grow is very sensitive to the environment [19,20].
Based on the existing literature of research, investigations into the crack initiation behavior of super martensitic stainless steels have largely focused on their performance in air environments. However, the impact of water environments on the fatigue behavior of 04Cr13Ni5Mo steel remains relatively underexplored. Given that hydraulic turbines are subjected to the combined effects of environmental corrosion, vibration, and fatigue, understanding the differences in early cracking behavior of 04Cr13Ni5Mo steel between air and aqueous environments is essential for ensuring the safety and reliability of the alloy during actual service. Therefore, this study aims to elucidate the crack initiation mechanisms of 04Cr13Ni5Mo steel in both air and water environments, providing a scientific basis for its safe and reliable engineering application.
This study addresses the aforementioned gap by systematically revealing the experimental mechanisms of crack initiation in 04Cr13Ni5Mo steel under both air and water environments. Unlike previous research, this work not only quantitatively evaluates the impact of aqueous corrosion on fatigue life but also elucidates the synergistic effects of corrosion and mechanical loading. Furthermore, it supplements the understanding of fatigue failure mechanisms in water environments, providing a solid theoretical foundation for fatigue life prediction and the safe service of engineering structures.

2. Materials and Methods

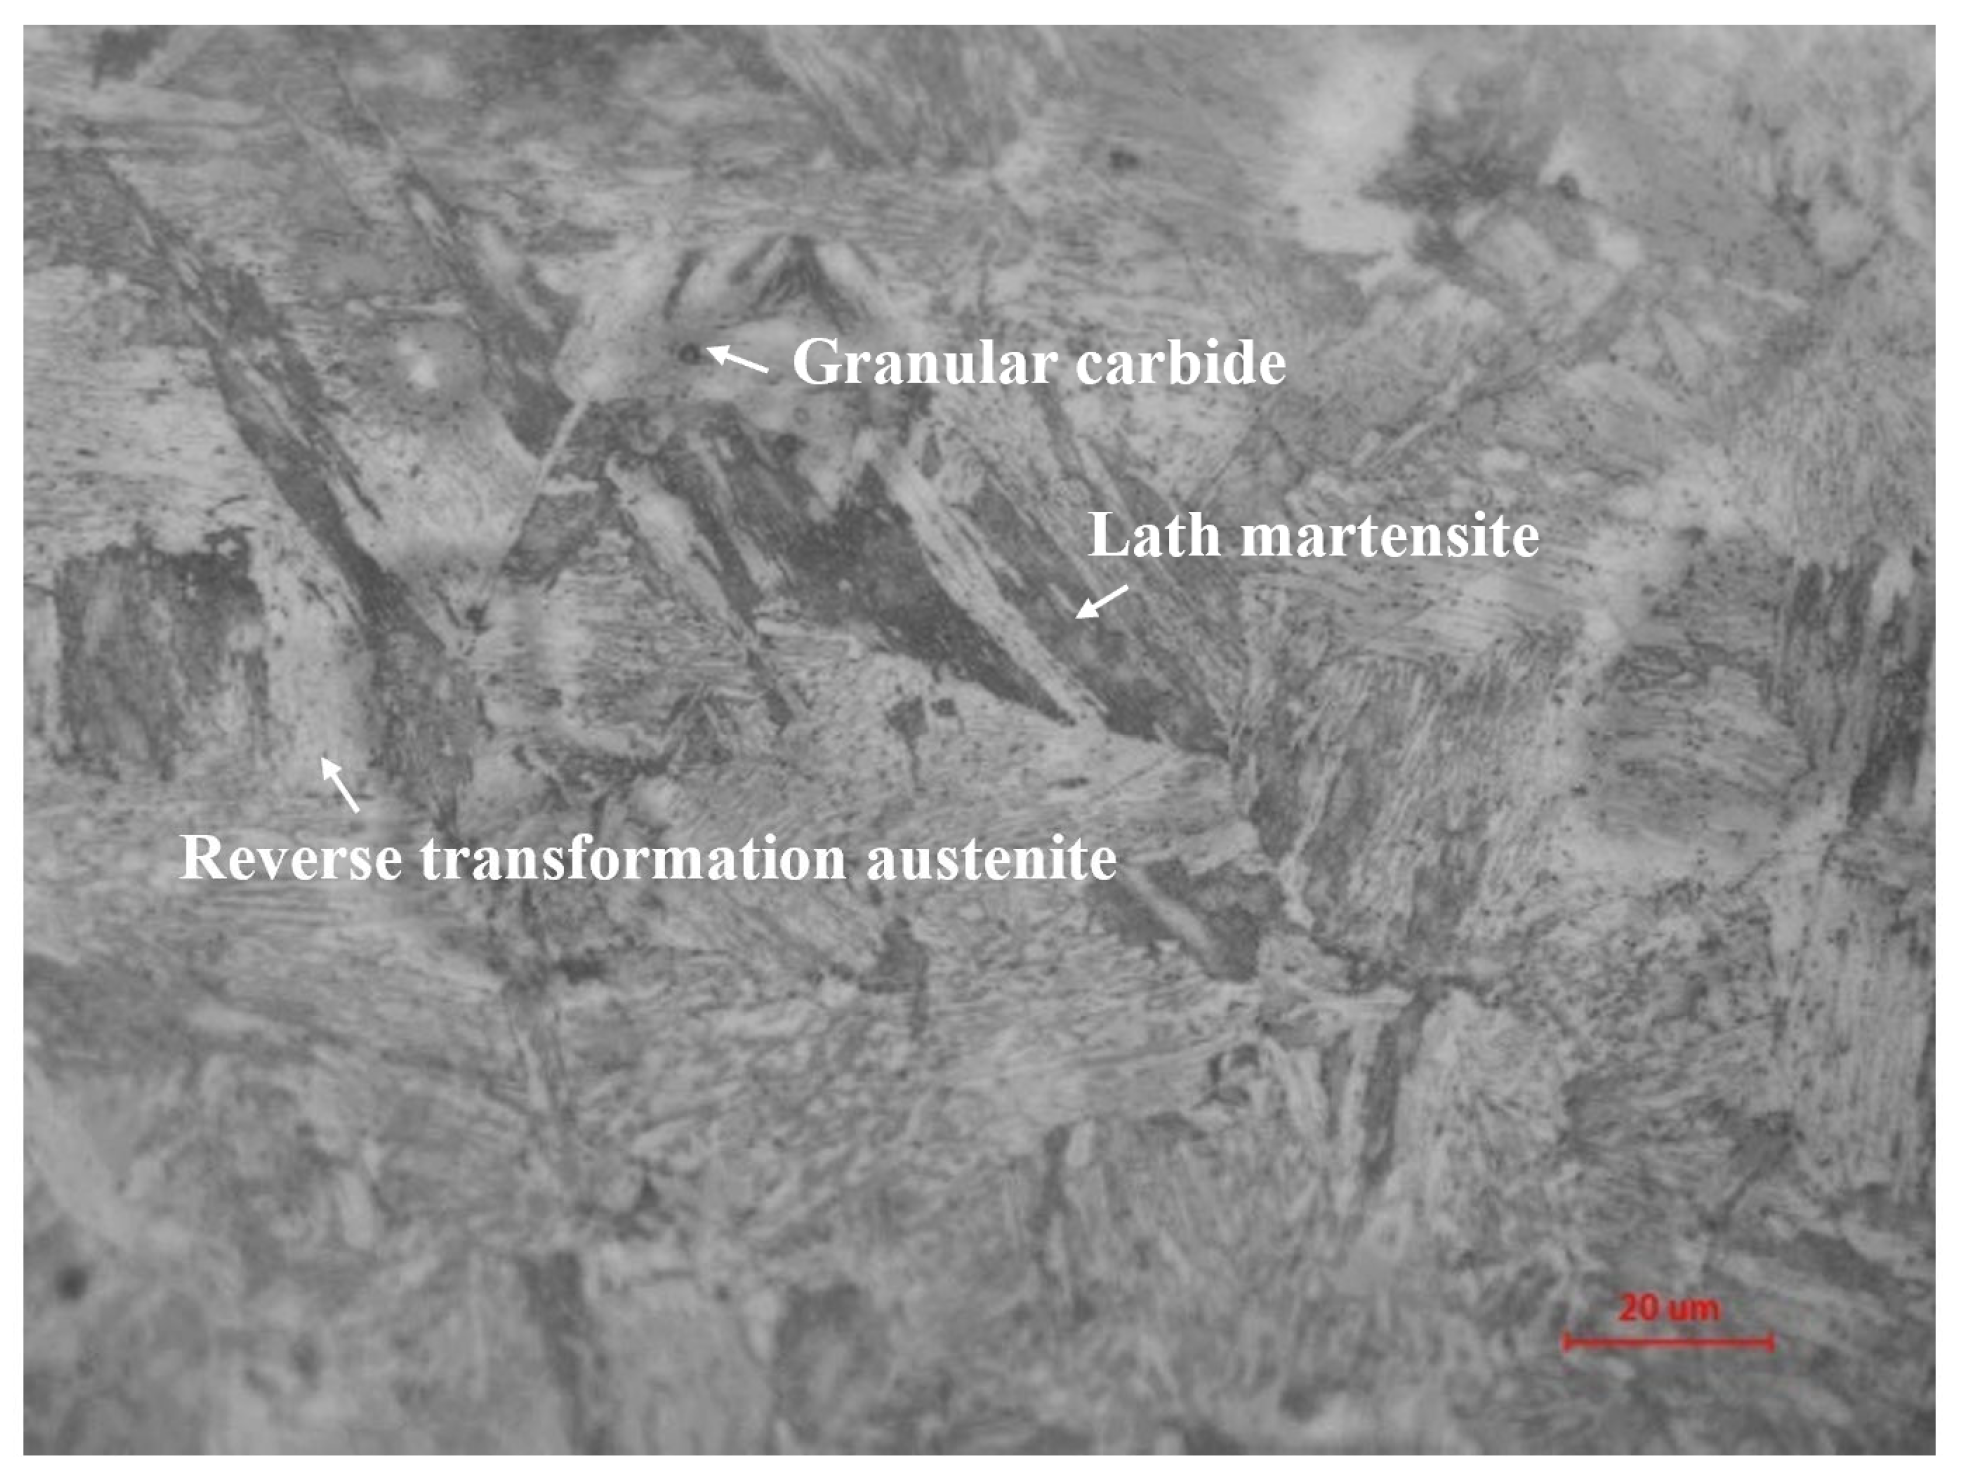
2.1. Material of 04Cr13Ni5Mo

The test material was obtained from 04Cr13Ni5Mo steel, produced by China Second Heavy Machinery Group Co., Ltd., Deyang, China, with its chemical composition and mechanical properties meeting the specified requirements for the steel grade. The material was processed by rolling, which helps refine the microstructure and reduce defects. To remove deeper surface scratches, the specimen surface was polished sequentially using sandpapers with grit sizes of 300#, 600#, 1000#, 2000#, and 3000#. The microstructure of the specimen, revealed after polishing and etching with a solution of HNO3:HCl:H2O in a 1:1:1 ratio, is shown in Figure 1.
It can be seen that the microstructure of 04Cr13Ni5Mo martensitic stainless steel (Figure 1) consists of granular carbide, lath martensite, and reverse-transformed austenite oriented in various directions, with a lath length of 25.4 ± 7.24 µm. The surface of the 04Cr13Ni5Mo steel was analyzed using an X-ray spectrometer (EDAX APEX, Mahwah, NJ, USA) to determine its primary chemical composition, which is detailed in Table 1.

2.2. Hardness and Tensile Properties
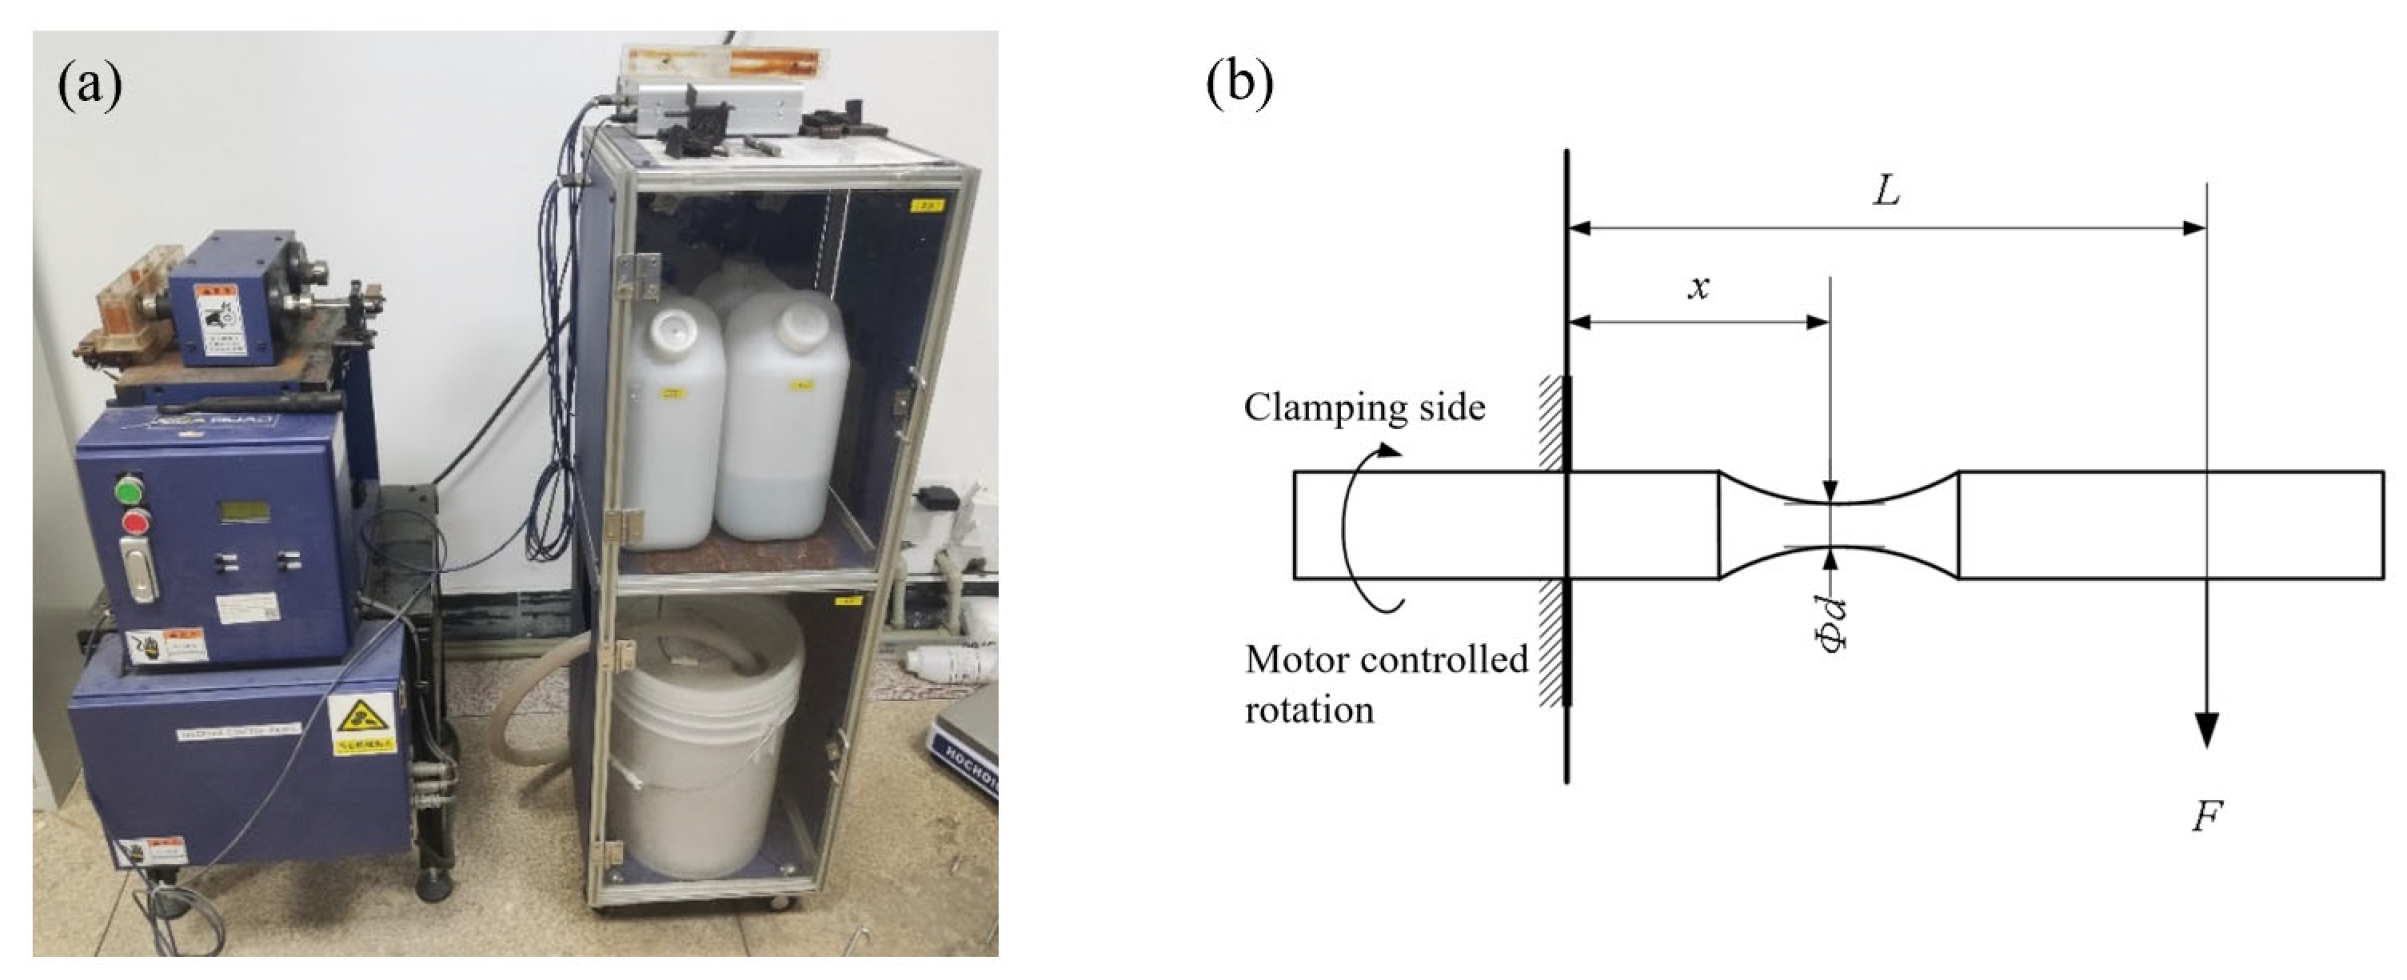
The hardness of such material was assessed by using a standard Vickers hardness tester (HVS-50, Shimadzu, Kyoto, Japan), with a loading time of 15 s and a loading force of 0.25 N. The average hardness value obtained was 455 HV at room temperature. For tensile testing, a Shimadzu Universal Testing Machine with a model of AG-X plus, Shimadzu, Japan was employed at a tensile rate of 2.5 × 10 4 / s , which gave a maximum tensile force of 100 kN. The tensile tests were conducted in accordance with the ASTM E8/E8M standard [21]. The tensile curves obtained from the tests are shown in Figure 2, indicating that the alloy’s ultimate tensile strength and yield strength are approximately 881.4 MPa and 717.2 MPa, respectively.

2.3. Fatigue Test

The detailed dimensions of the rotational bending fatigue test specimen are shown in Figure 3, with a specimen length of 100 mm and a rounded corner radius of 21.67 mm. Before the fatigue test, the specimen surface was carefully polished mechanically using sandpapers with grit sizes of 300#, 600#, and 1000# to achieve the desired surface roughness.
In the rotational bending fatigue test, the specimen is subjected to cyclic loading by fixing one end and rotating the other end, based on the cantilever principle. A weight is applied to the free end to induce a bending moment, as shown in Figure 4. Specifically, Figure 4a illustrates the test machine setup, while Figure 4b provides a detailed schematic of the specimen configuration. The tests were conducted at a rotational frequency of 100 Hz in air and 5 Hz in water, considering the time-dependent nature of corrosion in aqueous environments.
To better reflect real-world conditions, the water used in this experiment was sourced from the Yuexi River in Yibin, Sichuan Province. Key physicochemical parameters of the river water were measured and documented, including pH (7.24), dissolved oxygen (4.58 mg/L), temperature (14.6 °C), and electrical conductivity (628.3 μS/cm). The test is terminated either when the specimen fails or when the number of cyclic loadings exceeds 107, in order to conserve testing time. It is important to note that the mounting position of the weight in the water environment differs from that in the air environment to ensure proper contact between the liquid and the test plane. Based on the cantilever loading position and the position of the loaded weight, the relationship between the experimental stress and the mass of the loaded weight can be calculated for both the air and water environments, as shown in Equations (1) and (2), respectively.
S a i r = 32 F L x / ( π d 3 ) = 0 . 05026 m
S w a t e r = 32 F L x / ( π d 3 ) = 0 . 05337 m
where Sair and Swater represent the applied stress during fatigue testing in the air and water environments (in MPa), respectively. F denotes the applied force (in N), L is the distance from the fixed end to the point where the force is applied (in mm), d is the diameter of the specimen as shown in Figure 4 (in mm), x is the distance from the fixed end to the point of maximum flexural stress (in mm), and m is the mass of the weight applied at the location of F (in g).

2.4. Fatigue Analysis

To investigate the crack initiation behavior of the specimens in both air and water environments, a scanning electron microscope (SEM, JSM-6510, JEOL, Tokyo, Japan) and a non-contact optical measurement system (IFM G5, Olympus, Tokyo, Japan) were used. Specimens that exhibited typical failure modes in each environment were ground down to the crack initiation region and then subjected to copper powder inlay and polishing. These prepared samples were analyzed using an electron backscatter diffraction system (EBSD, OXFORD Symmetry S2, Abingdon, UK) to determine the crystallographic orientation of the microstructures and the extent of plastic deformation. This analysis was aimed at clarifying the differences in crack initiation mechanisms between the two environments. For the EBSD measurements, an accelerating voltage of 15 kV and a beam step size of 0.45 μm were used.

2.5. Crack Evolution Test

The CT (Compact Tension) samples were prepared in accordance with the ASTM E647 standard [22], as shown in Figure 5. Initial cracks were systematically introduced using a fatigue loading method to ensure a uniform crack growth from a predetermined position. The samples were securely mounted to prevent any displacement or tilting during loading.
For the cyclic loading conditions, a constant load amplitude was applied with a stress ratio of 0.1 and a cyclic frequency of 10 Hz. Throughout the experiments, crack propagation was monitored using a high-precision microscope. After measuring the initial crack length, cyclic loading was applied to extend the crack further. At the end of each loading cycle, the crack length, number of cycles, and load data were carefully recorded. Simultaneously, the microstructure at the crack tip was analyzed using the EBSD (Electron Backscatter Diffraction) technique to investigate the crack propagation mechanism.

3. Results

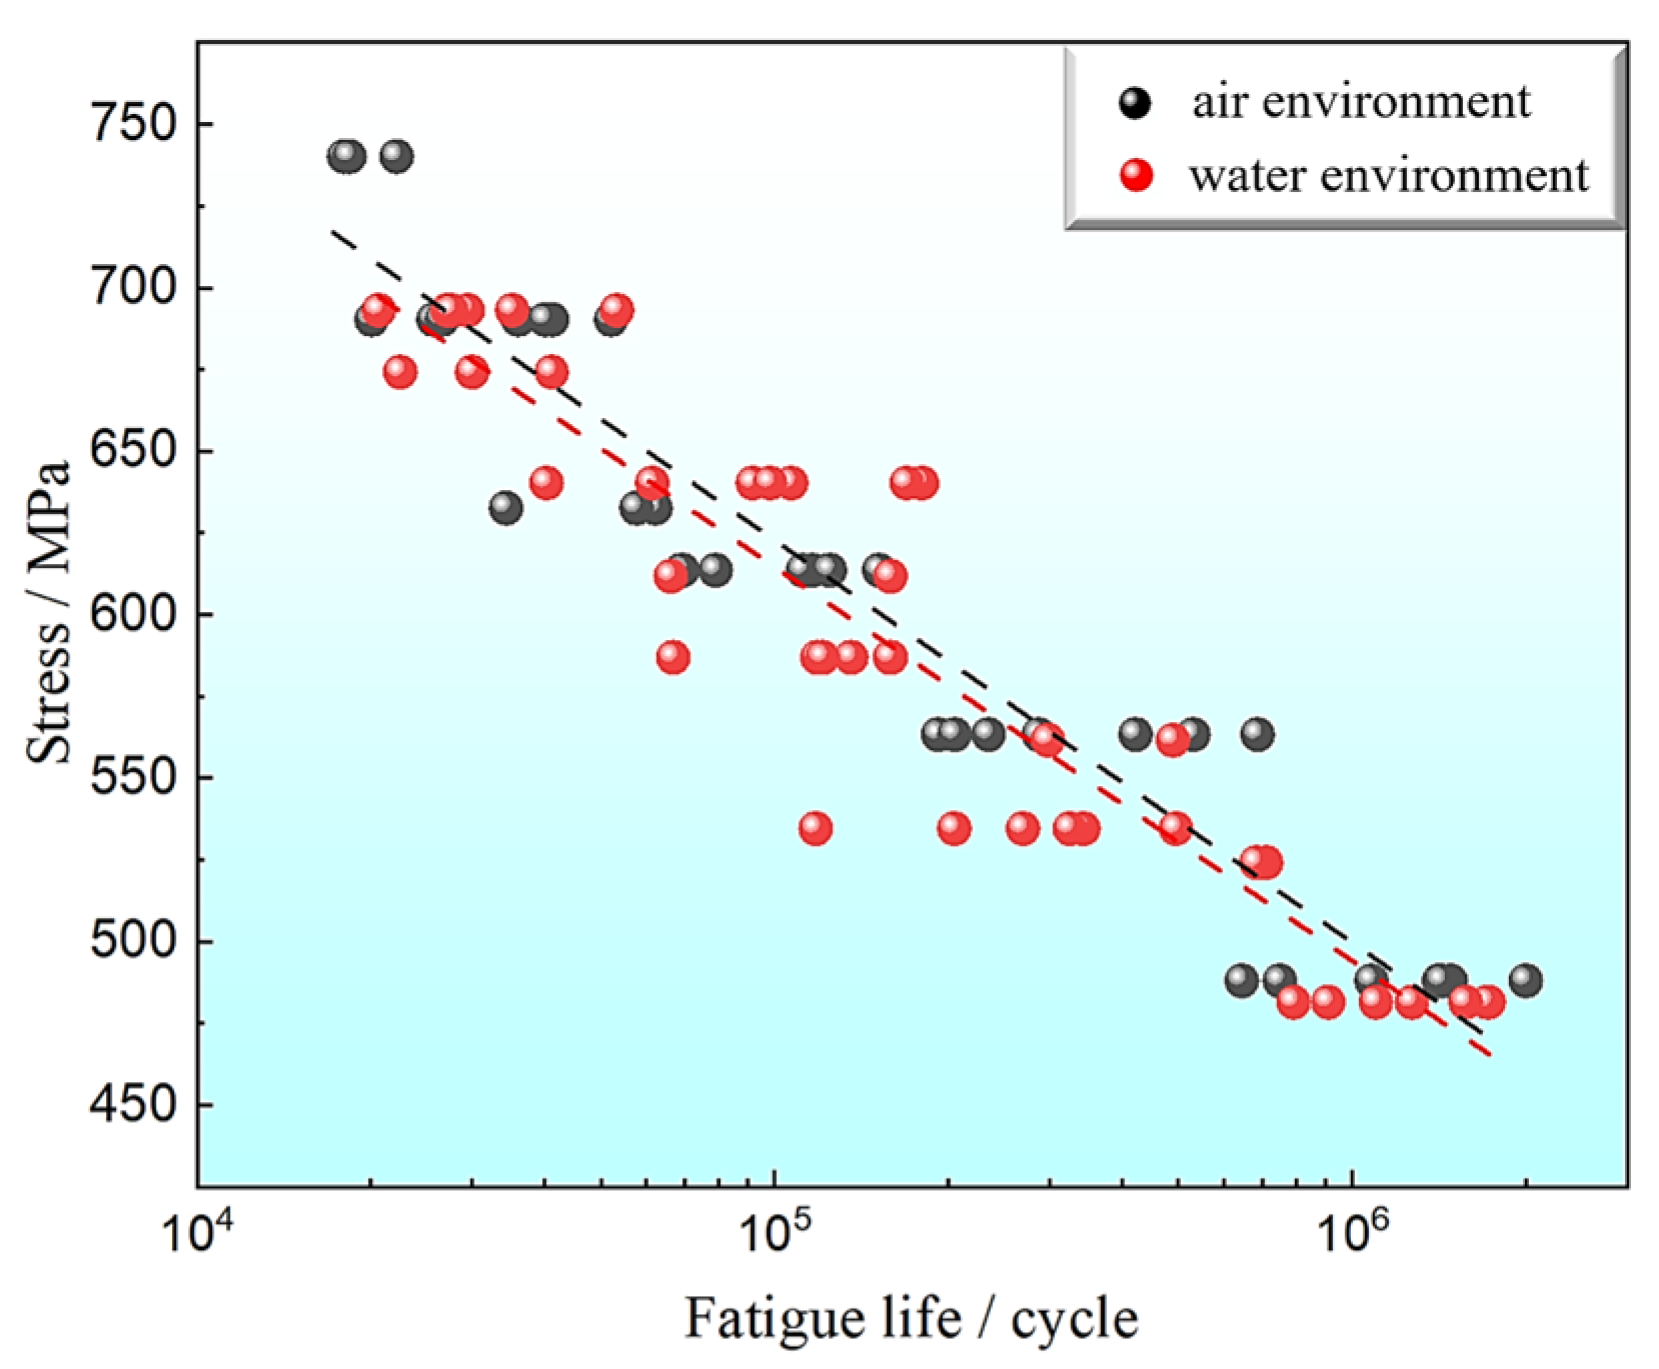
3.1. Rotational Bending Fatigue Results

Figure 6 presents the S-N (stress–life) curves for the material tested in both air and water environments. As expected, the fatigue life decreases with increasing stress levels, following the typical downward trend observed in the fatigue curves, with the fatigue life ranging from 104 to 107 cycles. In the water environment, the fatigue life similarly decreases as stress increases, but the decline is more pronounced compared to that in air. The regression line in the water environment has a steeper slope, indicating that the material is more susceptible to fatigue failure in the water environment due to the corrosive effects of the aqueous environment. Under a stress amplitude of 475 MPa, the fatigue life in the water environment was reduced by approximately 10.3% compared to that in air. This finding is consistent with previous studies on the fatigue behavior of stainless steel and aluminum alloys, which have shown a significant reduction in fatigue life under corrosive conditions compared to air [19,20].

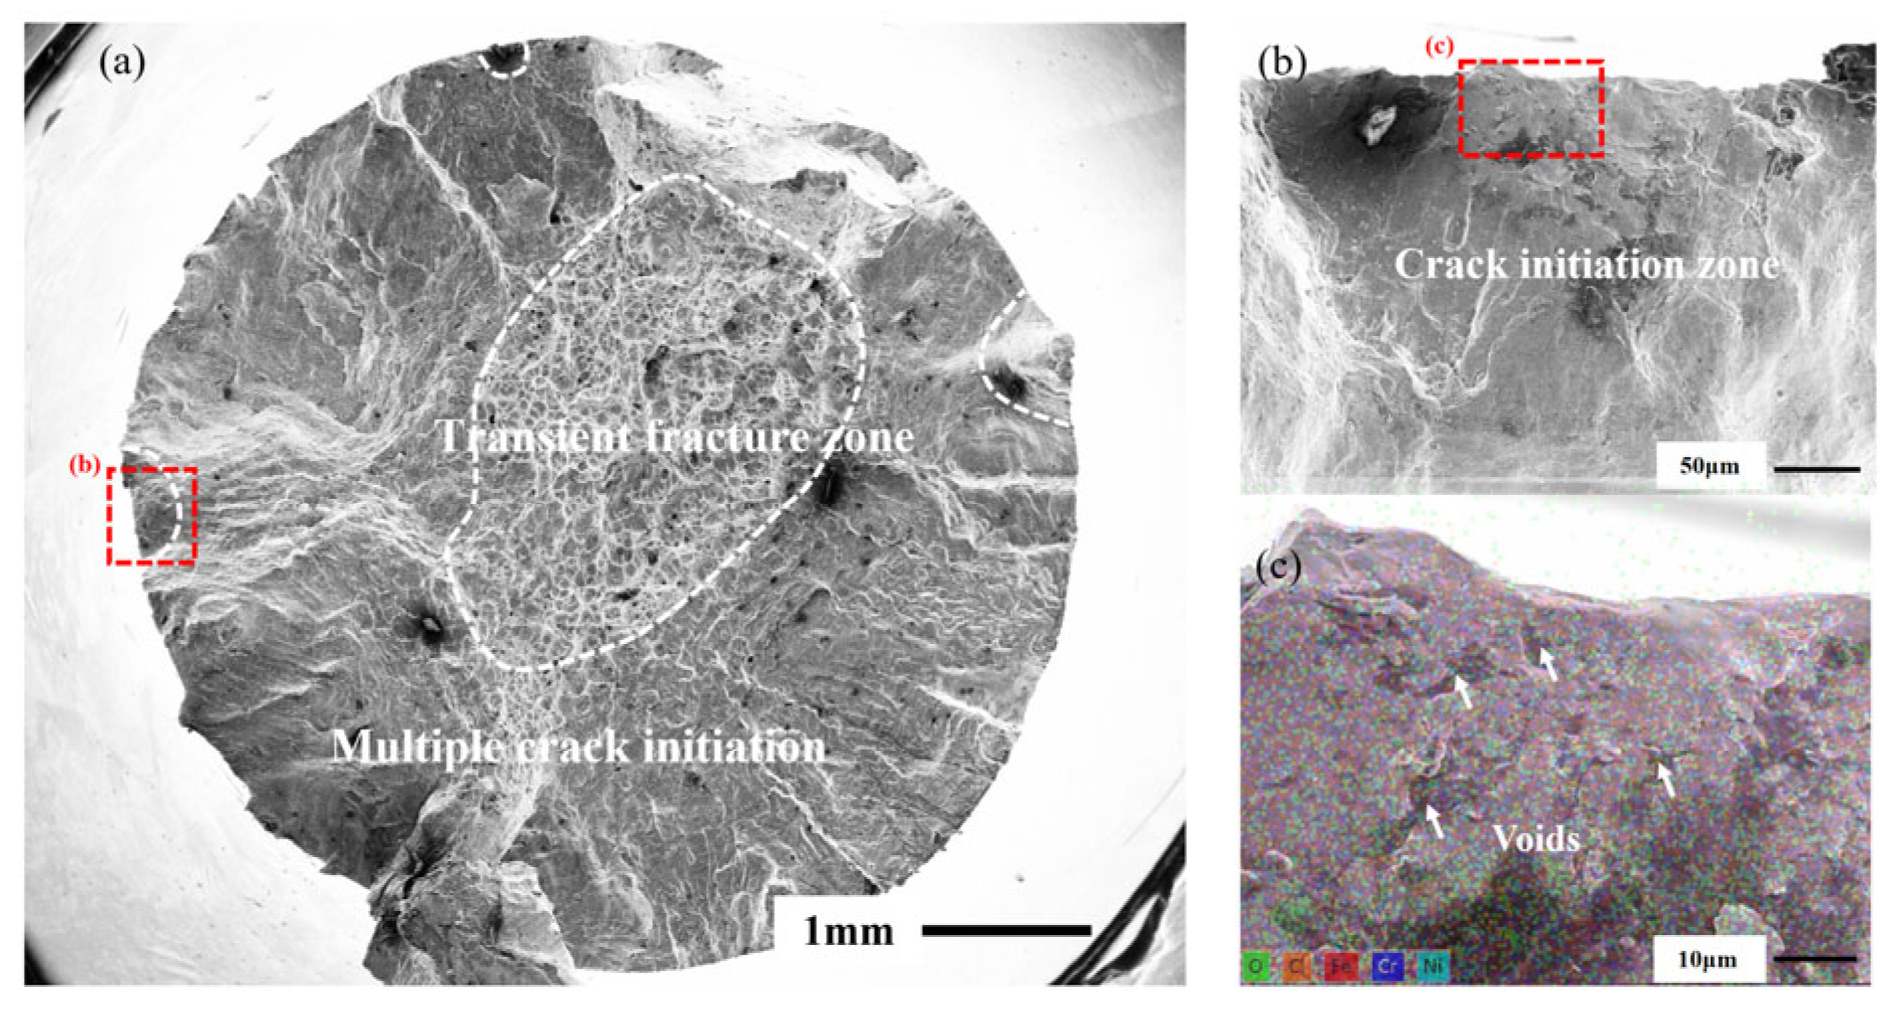
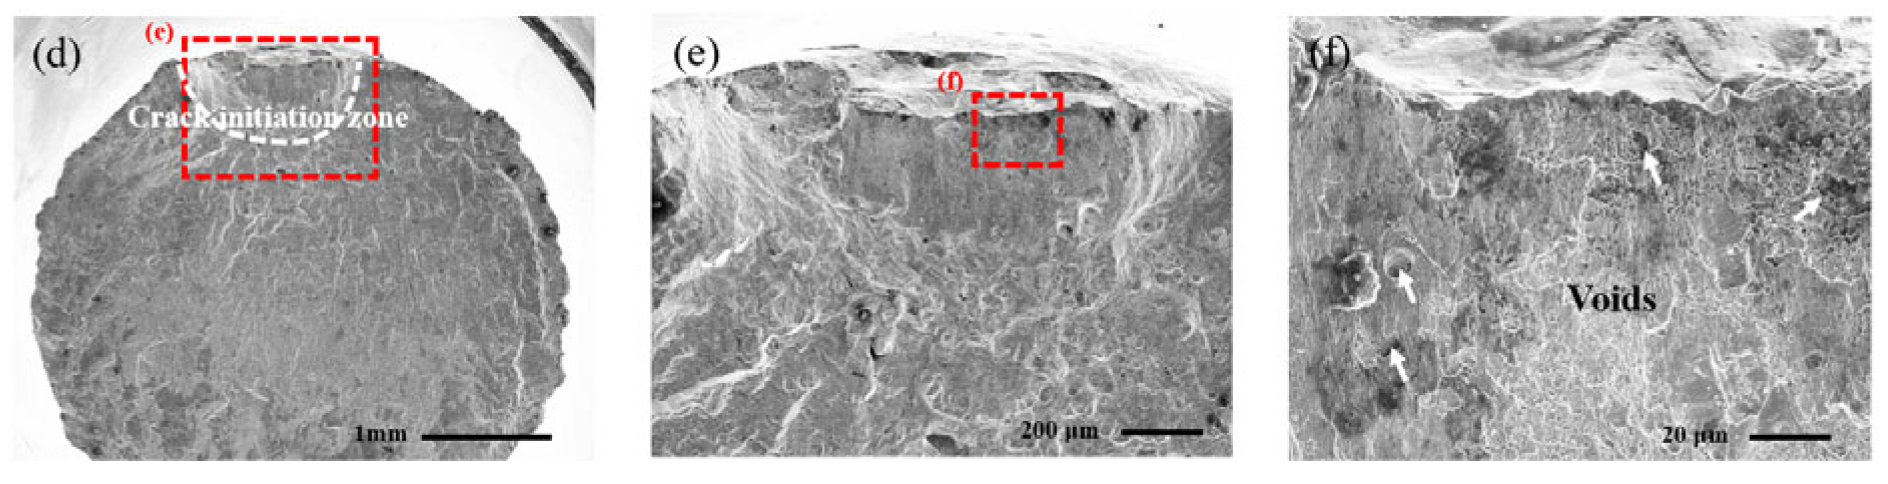
3.2. Fatigue Fracture Analysis

In this study, the fatigue experiments were conducted on specimens in both air and water environments, with surface crack initiation being a common feature. Figure 7a illustrates the fracture surface morphology of a specimen that failed under cyclic loading of 690 MPa in air. It can be seen that the multiple fatigue cracks are clearly visible, originating from the specimen surface and propagating inward. The final transient fracture zone is located centrally within the sample. Research has indicated that under high stress levels, fatigue cracks are more likely to initiate at multiple points [23]. This leads to a competitive merging process between neighboring cracks, with each crack having a limited propagation area, thereby resulting in a reduced fatigue life. As shown in Figure 7b, the number of fatigue crack initiation sites decreases with decreasing loading stress in the air environment. A closer examination of the crack initiation region, as depicted in Figure 7c, reveals a small, smooth plane. It has been reported that under low stress conditions, crack initiation is influenced by the maximum shear stress, with grains slipping along favorable orientations [24]. Thus, the formation of these smooth, small planes in the crack initiation region observed in the experiment is likely related to grain slip.
Figure 8 presents the fracture morphology of fatigue failure in an aqueous environment. Similar to the observations in air, crack initiation under high-stress cyclic loading occurs at multiple surface points, as depicted in Figure 8a. Upon closer inspection of one of these initiation sites, it is evident that the surface is not as flat and smooth as in air, with numerous dark areas visible, as shown in Figure 8b. The smoother fracture zone observed in air conditions is mainly due to the absence of corrosion effects in air. In the water environment, corrosion leads to the formation of corrosion products and secondary cracks, which roughen the fracture surface. These corrosion-induced features accelerate crack initiation and propagation, resulting in a more irregular fracture morphology. These dark areas are likely indicative of corrosion that occurred during fatigue loading in the water environment.
To further investigate the morphology of the non-smooth initiation region, a magnified view of the boxed area in Figure 8b reveals the presence of many corrosion voids in the initiation zone, as shown in Figure 8c. In addition, EDS analysis shows oxygen enrichment in the adjacent dark regions, further confirming the corrosive effect of the aqueous environment. Additionally, under low-stress cyclic loading, the crack initiation zone exhibits numerous voids, as illustrated in Figure 8d–f. The extended duration of exposure to the corrosive environment results in more pronounced corrosion, leading to the formation of larger voids, as shown in Figure 8f. These corrosion voids can be regarded as corrosion-induced weak points. These weak points act as stress concentrators and significantly reduce the local fatigue resistance of the material. Under cyclic loading, especially in corrosive environments, cracks are more likely to initiate from these sites. The presence and severity of such weak points may change the dominant crack initiation mechanism and reduce the overall fatigue life.
The findings suggest that variations in the environment can induce a shift in the crack initiation mechanism, thereby influencing the material’s high-cycle fatigue strength. The underlying mechanisms are elaborated and discussed in the following sections.

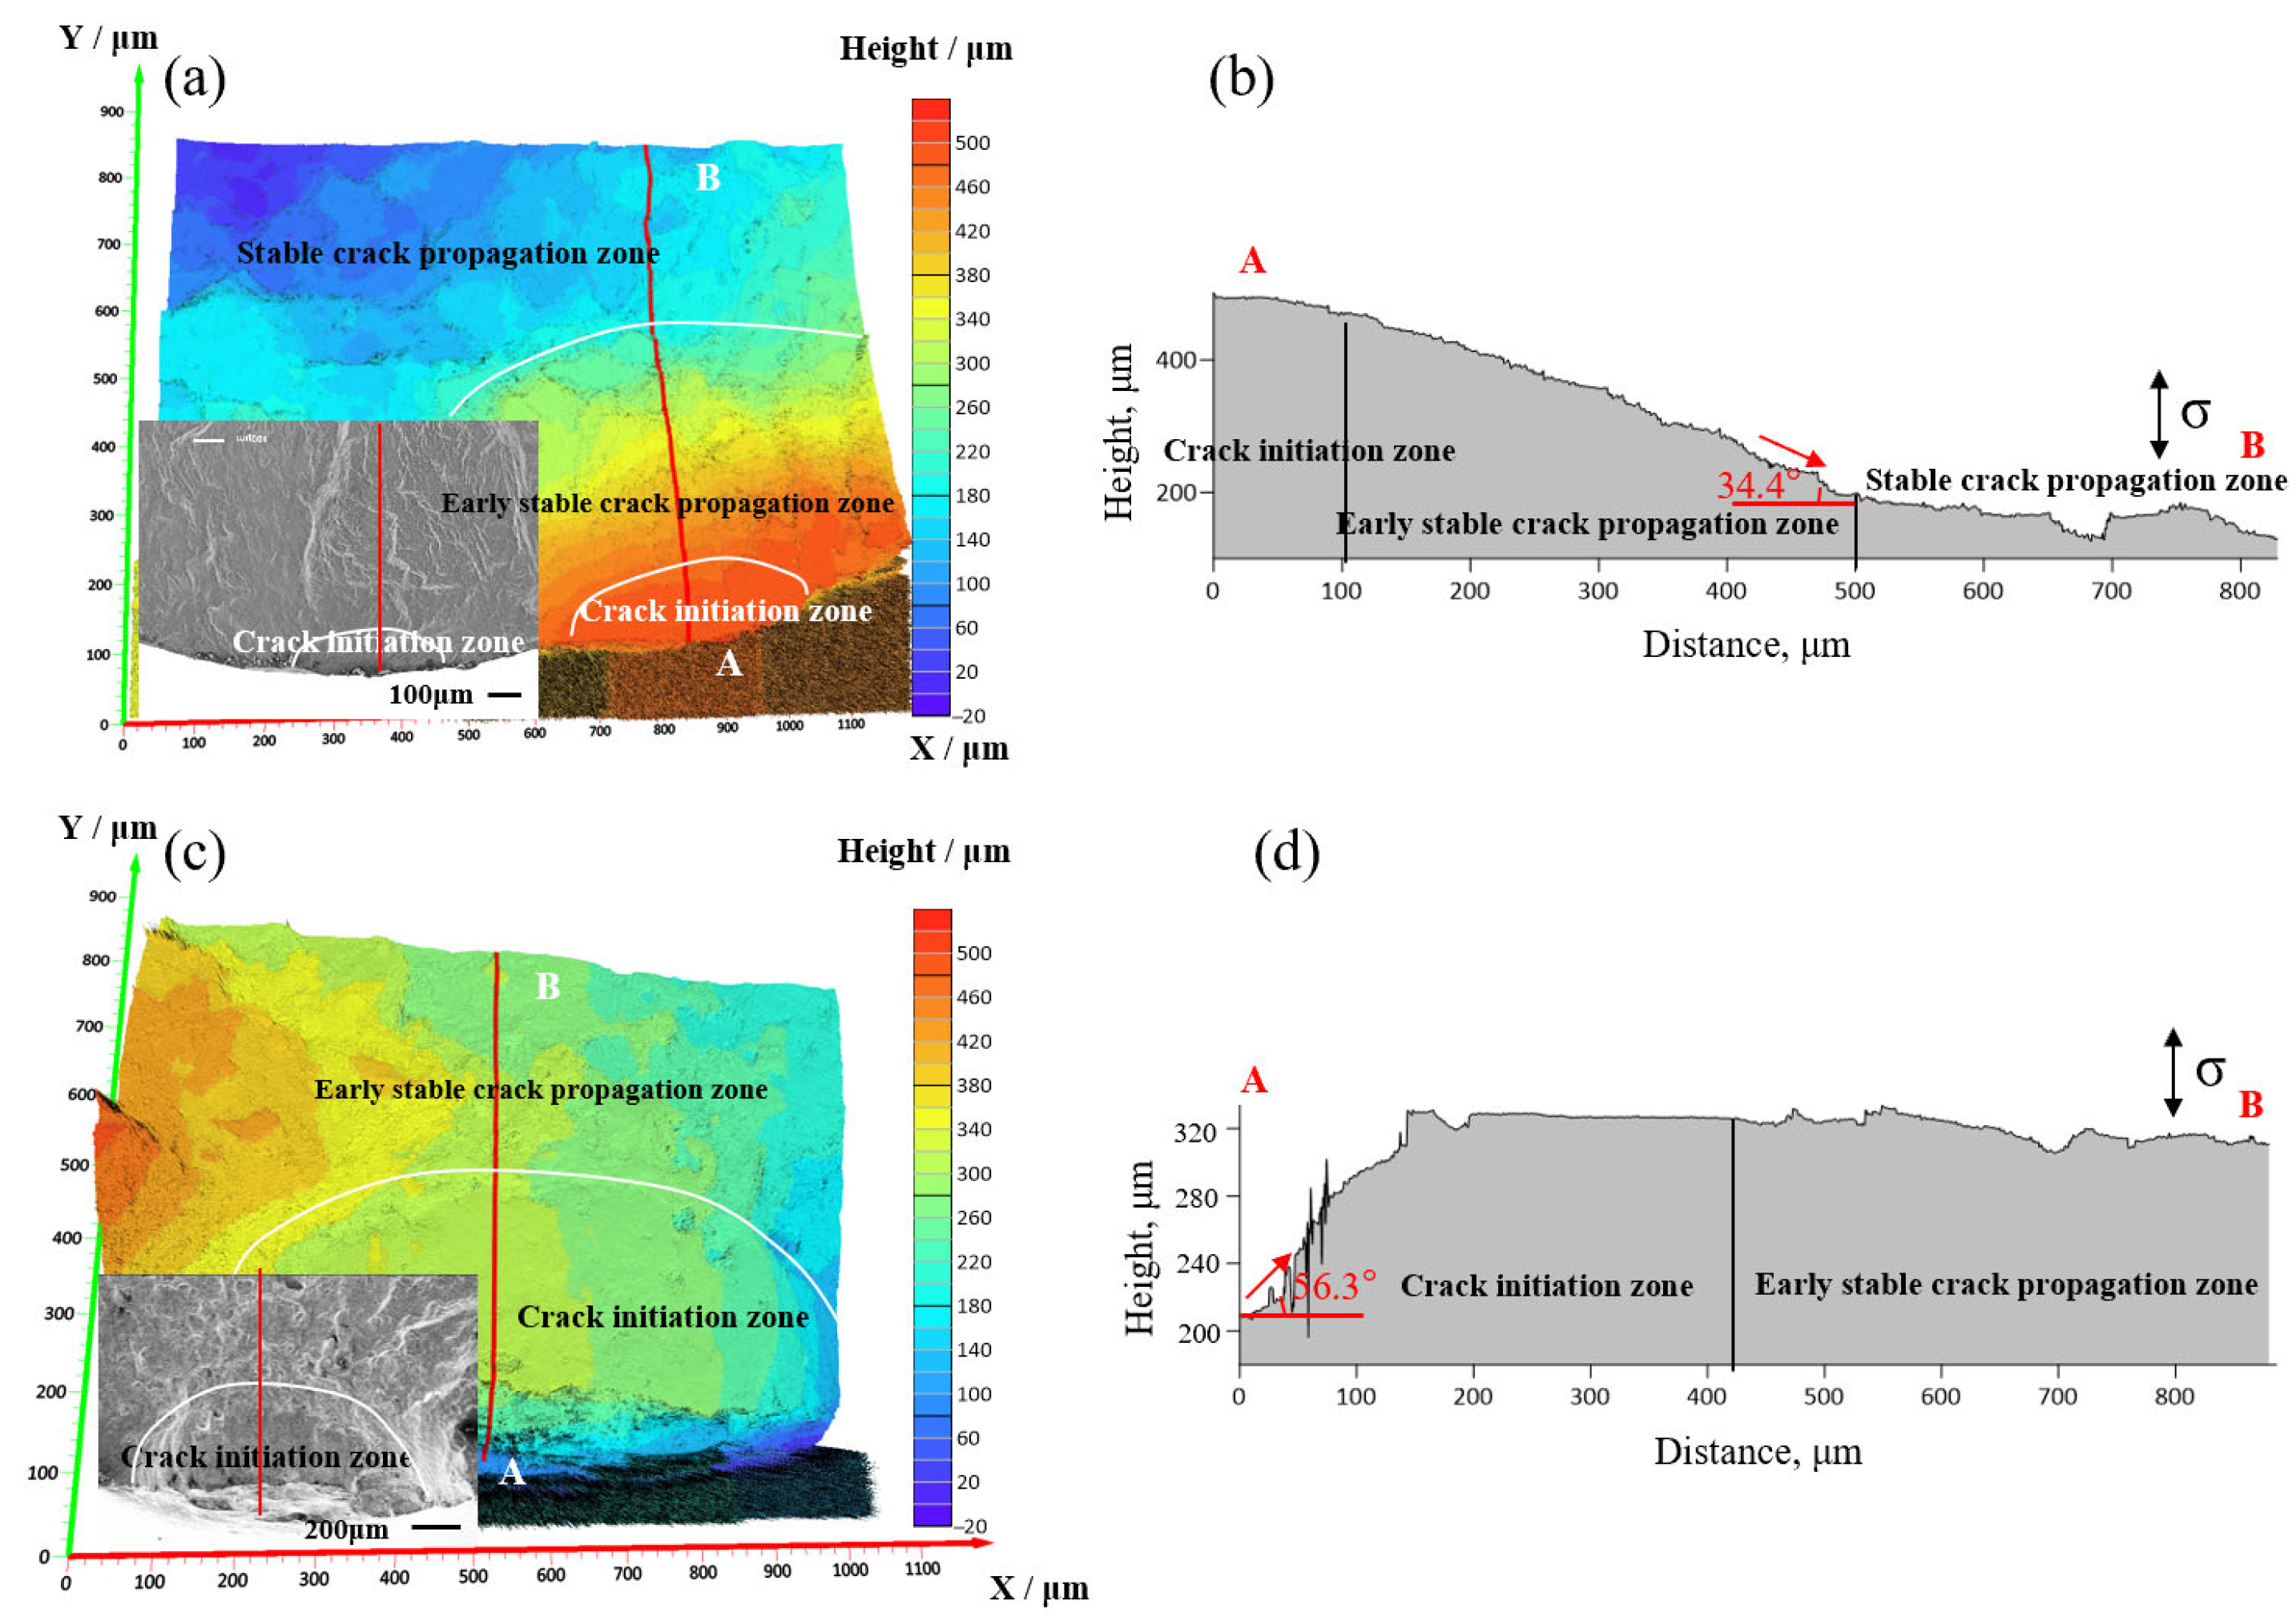
3.3. Morphological 3D Analysis

Figure 9 presents the three-dimensional morphology of ultra-high-cycle fatigue fractures under both air and water environmental conditions, alongside height maps of the sections at the indicated locations, with the red arrow indicating the direction of crack propagation. Figure 9a,b illustrates the 3D morphology and specified profile heights of the fatigue fracture in air conditions. Notably, during the initial stage of crack initiation and propagation, the crack deviates from the horizontal direction by an angle of 34.4°, which is close to the direction of maximum shear stress, before transitioning to horizontal propagation in the stable stage. This observation aligns with previous findings [25], indicating that the early crack propagation is influenced by mode II loading stresses. The crack initiation area also exhibits minimal height undulation, confirming the presence of a smooth, small flat surface.
In water conditions, as shown in Figure 9c,d, the initial angle between the crack and the horizontal direction is close to 45°, suggesting a mode II crack extension mode. However, the crack propagation direction shifts from inclined to horizontal, accompanied by significant height variations in the inclined surface during the initial crack initiation stage. This phenomenon is attributed to the influence of the water environment on crack propagation direction and the formation of corrosion pits at the crack initiation sites due to material corrosion by water.
The results demonstrate that crack initiation is primarily influenced by Type II stress loads, whereas after stable crack propagation, it is subjected to Type I cyclic loads. In air, cracks tend to initiate along planes of maximum shear stress, favoring the formation of smooth, small planes. Conversely, in a water environment, corrosion-induced pitting at the crack initiation sites alters the crack propagation direction to some extent.

4. Discussion

4.1. Fatigue Life Prediction

Fatigue test data often exhibit dispersion, even when specimens are manufactured under identical process conditions and controlled for consistency in load magnitude, experimental environment, and procedure. This variability in fatigue life results at the same stress level can arise from minor differences in manufacturing processes, testing machine errors, and other factors. Therefore, statistical analysis using mathematical statistics is essential to understand the distribution patterns and reliability characteristics of fatigue experimental data.
Commonly used models for analyzing fatigue test data include the normal distribution model, the lognormal distribution model, and the Weibull distribution model. The Weibull distribution model can be further categorized into the two-parameter and three-parameter models, depending on whether a minimum safe life factor (i.e., the limiting safe life for 100% survival) is included [26]. If a linear regression approach is applied to simulate the data, Y = A + B X , the following equations can be expressed [27,28]:
(1)
For the normal distribution model (ND model):
F x = 1 σ 2 π x + exp u μ 2 2 σ 2 d u = Φ x μ σ
In this model, the linear regression parameter Y = Φ 1 F x , X = x , A = μ σ , B = 1 σ ; x is a random variable for fatigue life, μ is the mean value of the parent of the normal distribution, σ is the standard deviation of the parent of the normal distribution, Φ μ is the standard normal distribution of the cumulative probability density, and F x is the inefficiency of the fatigue life.
(2)
For the normal logarithmic distribution model (LND mode):
F x = Φ lg x μ σ
where the linear regression parameter is X = lg x ; the other parameters are similar to the ND model.
(3)
For the Weibull two-parameter distribution model (Weibull-2 model):
F x = 1 exp x η β
where the linear regression parameter is Y = ln ln 1 1 F x , X = ln x , A = β ln η , B = β ; η is the size characteristic factor the fatigue life, and β is a shape parameter of the specimens.
(4)
For the Weibull three-parameter distribution model (Weibull-3 model):
F x = 1 exp x γ η β
where the linear regression parameter is X = ln x γ , γ is the position parameter of the minimum fatigue life, and the other parameters are similar to the Weibull-2 model. Based on the four possible models, the parameters in the different load levels of the specimens in the air environment are shown in Table 2.
The results in Table 2 indicate that the optimal model varies for different given load levels. To determine the best model for fatigue results, a comprehensive evaluation coefficient is calculated for the ND model, the LND model, the Weibull-2 model, and the Weibull-3 model. This coefficient, which considers factors such as distribution goodness-of-fit and parameter estimation accuracy, helps identify the model that best fits the data. A similar results were also found in the specimens in the water environment, as shown in Table 3.
The results in Table 2 and Table 3 indicate that the four models show a similar linear correlation at the same stress level, but the best-performing model differs across stress levels, necessitating further analysis for model selection, which needs to consider factors like distribution fitting and estimation accuracy; higher scores indicate better model performance. Such a formula for this evaluation can be expressed as follows [29]:
ρ ¯ i = j = 1 k ρ i , j 1 n i = 1 n ρ i , j
where i is the probability distribution type, j is the fatigue stress load level, ρ ¯ i is the combined evaluation coefficient under the ith probability distribution model, ρ i , j is the value of the linear correlation parameter, and k is the number of fatigue test stress load levels. Thus, the calculated results are shown in Table 4.
As shown in Table 4, among the four probability distribution models, the Weibull three-parameter model exhibits the highest integrated assessment parameter values across both fatigue environments, indicating the strongest descriptive capability. The LND model shows the second-best fit to the fatigue data compared to the Weibull-3 model, while the ND and Weibull-2 models demonstrate weaker descriptive abilities. Consequently, the Weibull-3 model was selected as the distribution model for the material in both air and water environments.
From the Weibull-3 model, the fatigue life NP can be calculated by considering the different fatigue stress load level S and the different inefficiency parameters P of 50%, 10%, 1%, and 0.1%, which is shown as follows [30]:
N P = γ + η ln 1 R 1 β
The inefficiency parameter P represents the probability of fatigue failure at a given number of cycles and is commonly used in fatigue life statistical modeling to describe the scatter of fatigue data. The values of 50%, 10%, 1%, and 0.1% were selected based on standard reliability levels used in engineering fatigue design. Specifically, P = 50% corresponds to the median fatigue life, while lower P values (10%, 1%, 0.1%) represent increasingly conservative design criteria, providing insight into the lower-bound fatigue performance of the material. Based on this, the fatigue lives of specimens under different stress levels in both air and water environments were calculated using the Weibull-3 model and are summarized in Table 5.

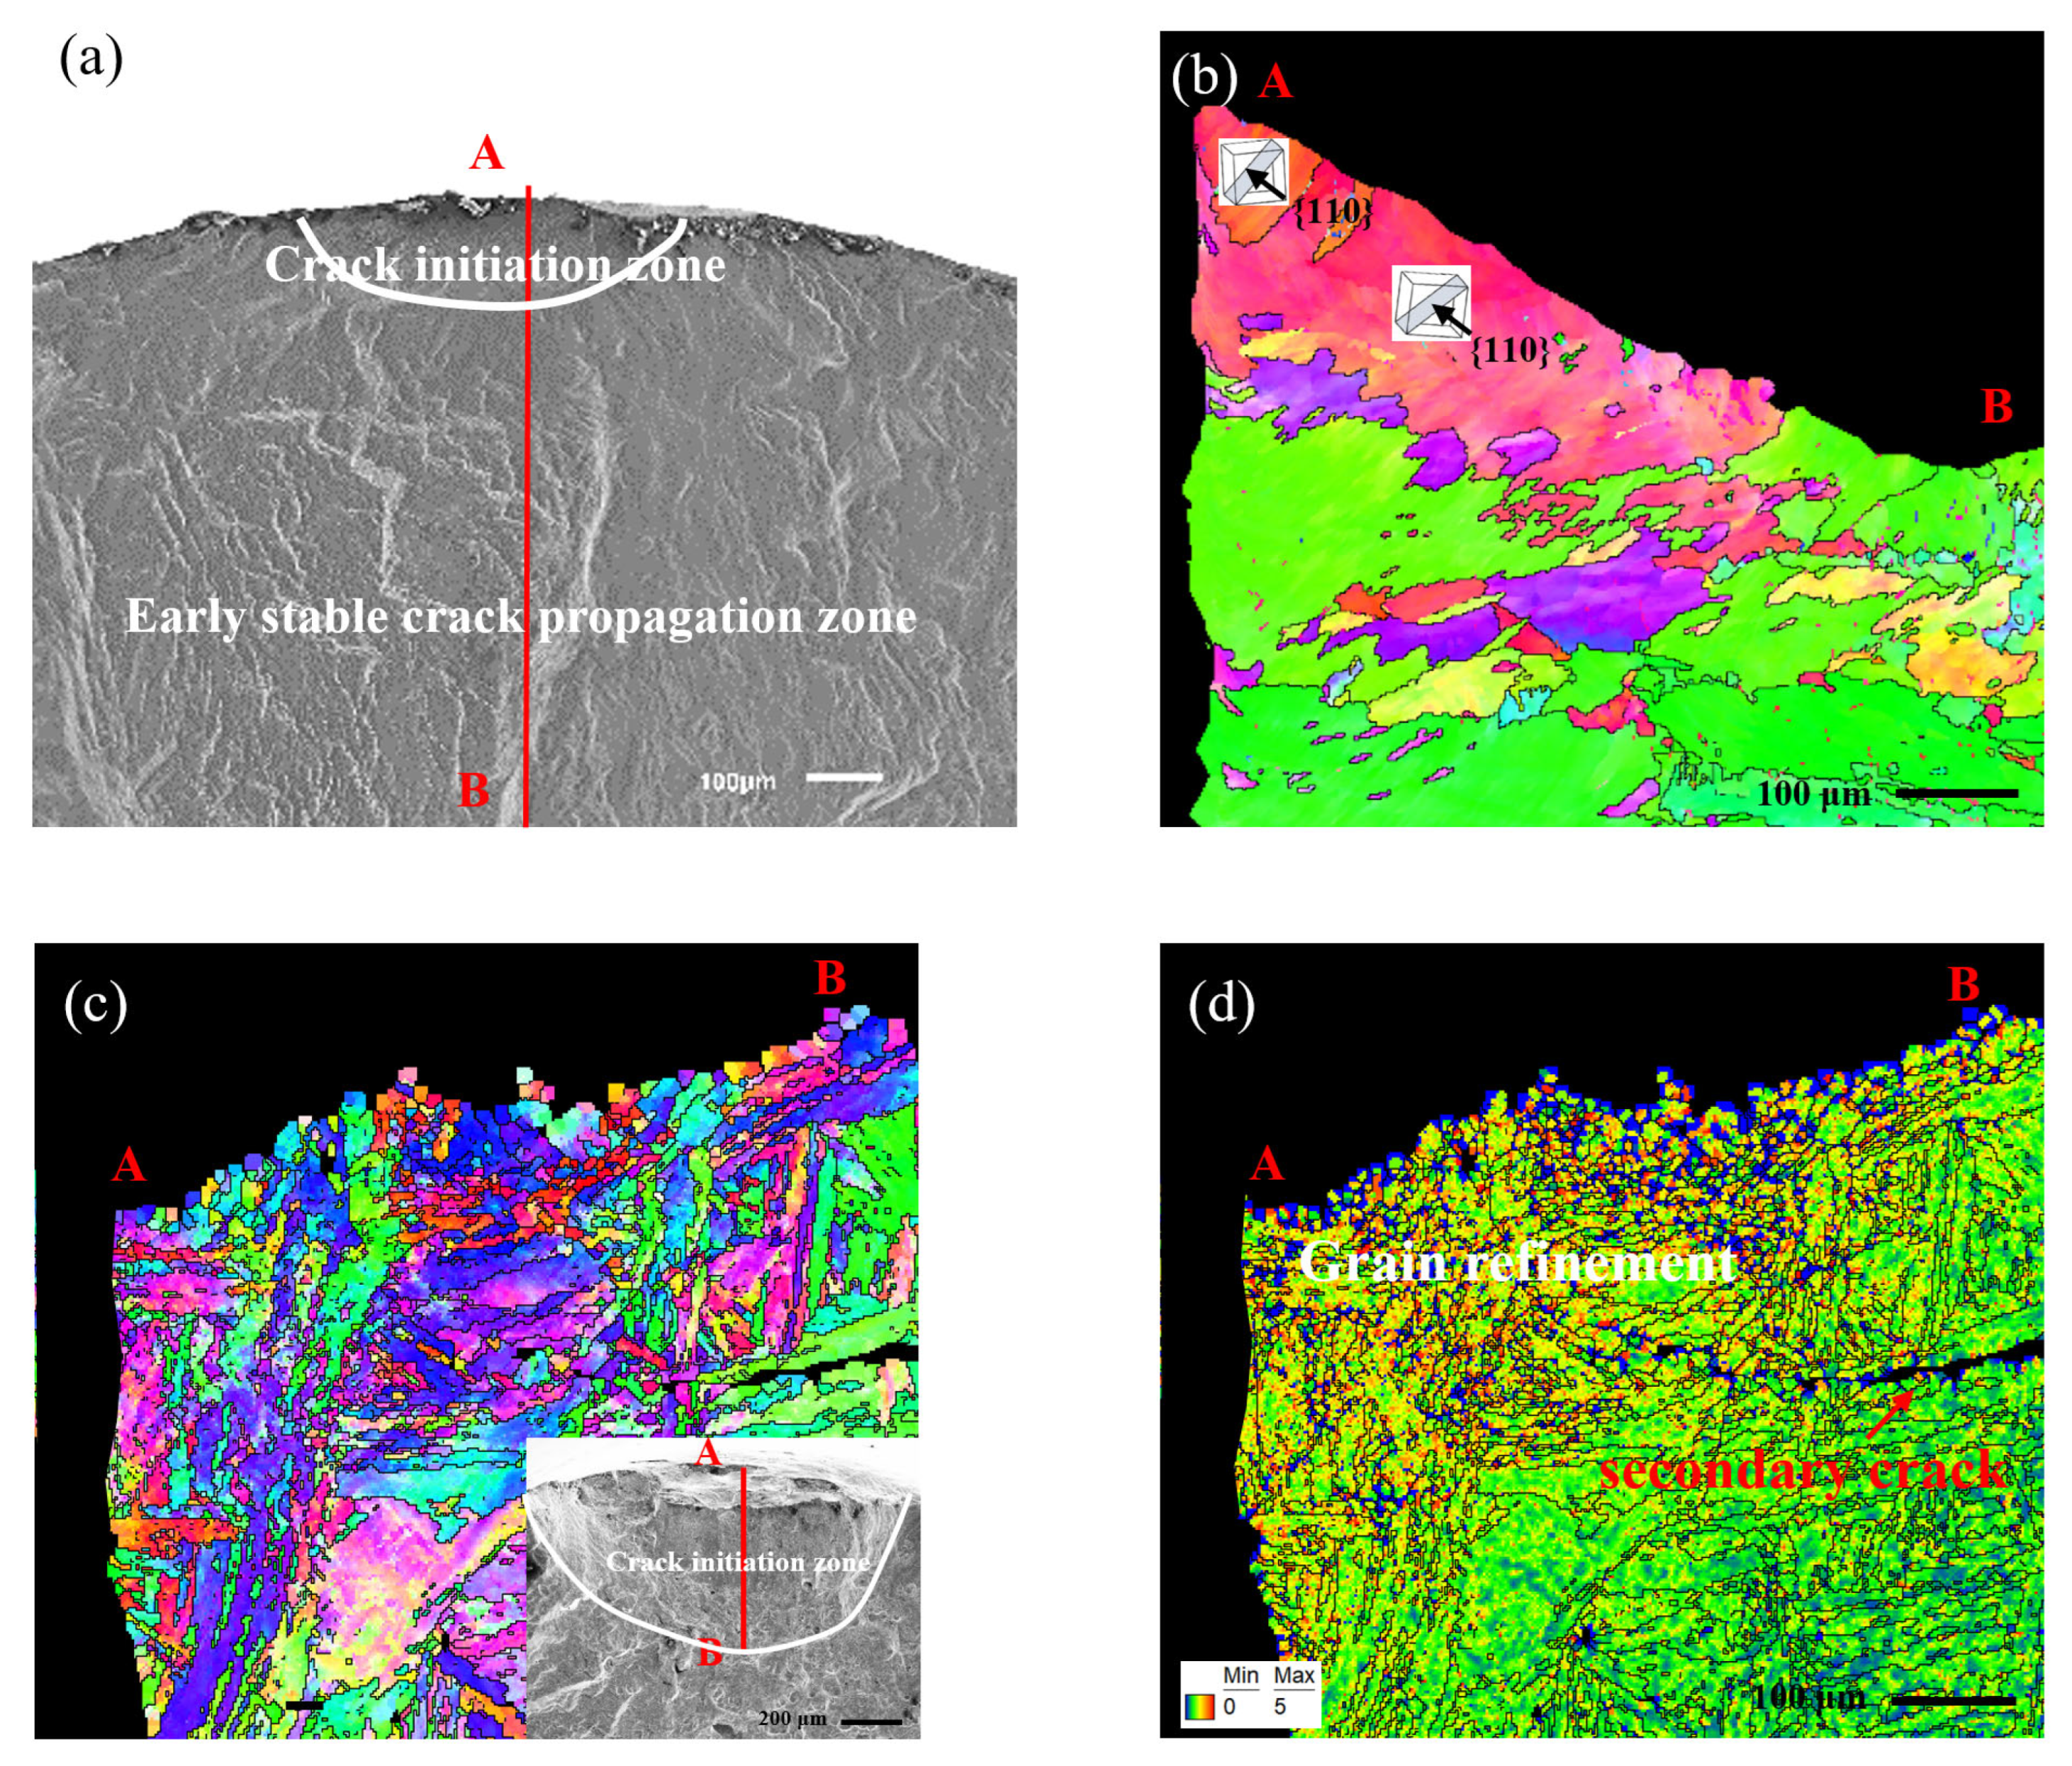
4.2. Crack Initiation Mechanism

The fracture analyses discussed above suggest that the crack initiation mechanisms of super martensitic stainless steels may differ between air and water environments. To elucidate these mechanisms in each environment, EBSD scans were performed on the profiles at the crack initiation sites of typical specimens from both environments. The results are depicted in Figure 10.
In ultra-high-cycle fatigue experiments in air conditions, the crack initiation phase is highly susceptible to maximum shear stress [18]. Figure 10a illustrates a typical fatigue fracture surface in air, while Figure 10b presents the IPF results for section A-B of Figure 10a. The results indicate that cracks slip along the densest {110} plane of the bcc lattice due to maximum shear stress. Comparing the grain boundaries in the IPF results with Figure 10a, it is evident that crack initiation involves slip within a single grain, while some grains in the early propagation region continue to slip along the {110} plane under maximum shear stress. Since crack initiation and early propagation account for the majority of the fatigue life [31,32], these findings underscore the significant impact of maximum shear stress in air on fatigue life. Additionally, analyzing the shape and size of grains in the crack initiation region reveals that fatigue damage in air tends to originate within reverse-transformed austenite. Moreover, the analysis of grain morphology and size in the crack initiation region reveals that fatigue damage in air preferentially originates within reverse-transformed austenite regions, which may act as localized weak zones due to their distinct mechanical properties compared to the surrounding martensitic matrix. This highlights the critical role of microstructural heterogeneity in governing fatigue crack nucleation in air conditions.
Figure 10c,d presents the Inverse Pole Figure (IPF) and Kernel Average Misorientation (KAM) plots, respectively, for a typical fracture cross-section in a water environment. The results in Figure 10c reveal significant differences in the EBSD analysis of the crack initiation region in water compared to air. Although the crack initiation region remains influenced by maximum shear stress, the crack initiation does not occur through slip. Instead, the initiation region forms an inclined surface with fine-grained regions on the surface due to cyclic shear stresses. Figure 10d illustrates the KAM results, which provide insight into the local strain gradient distribution within the current fatigue microstructure. The KAM values of surface grains are significantly higher than those of interior grains, and the surface-refined grains exhibit a certain thickness. This phenomenon is primarily attributed to the corrosive effects of the aqueous environment on metal surfaces [32,33]. Fatigue damage in the stress-water environment initiates at corrosion-induced weak points caused by the aqueous environment. Furthermore, the cyclic application of stress combined with water erosion leads to the formation of a fatigue-damaged layer of a certain thickness.
Furthermore, a secondary crack was observed in the lower part of the crack initiation zone, with a higher KAM value near the secondary crack. This is primarily attributed to corrosion-accelerated crack initiation and dislocation accumulation around the crack. As dislocation density increases, local crystal orientation changes, leading to the formation of secondary cracks with elevated KAM values. The environment plays a critical role in fatigue behavior, particularly in ultrasonic fatigue experiments. In air, fatigue crack initiation in super martensitic stainless steel typically occurs via slip along the densest crystallographic planes. In contrast, in water, the corrosive effects dominate, making cracks more likely to initiate from corrosion-induced weak points.

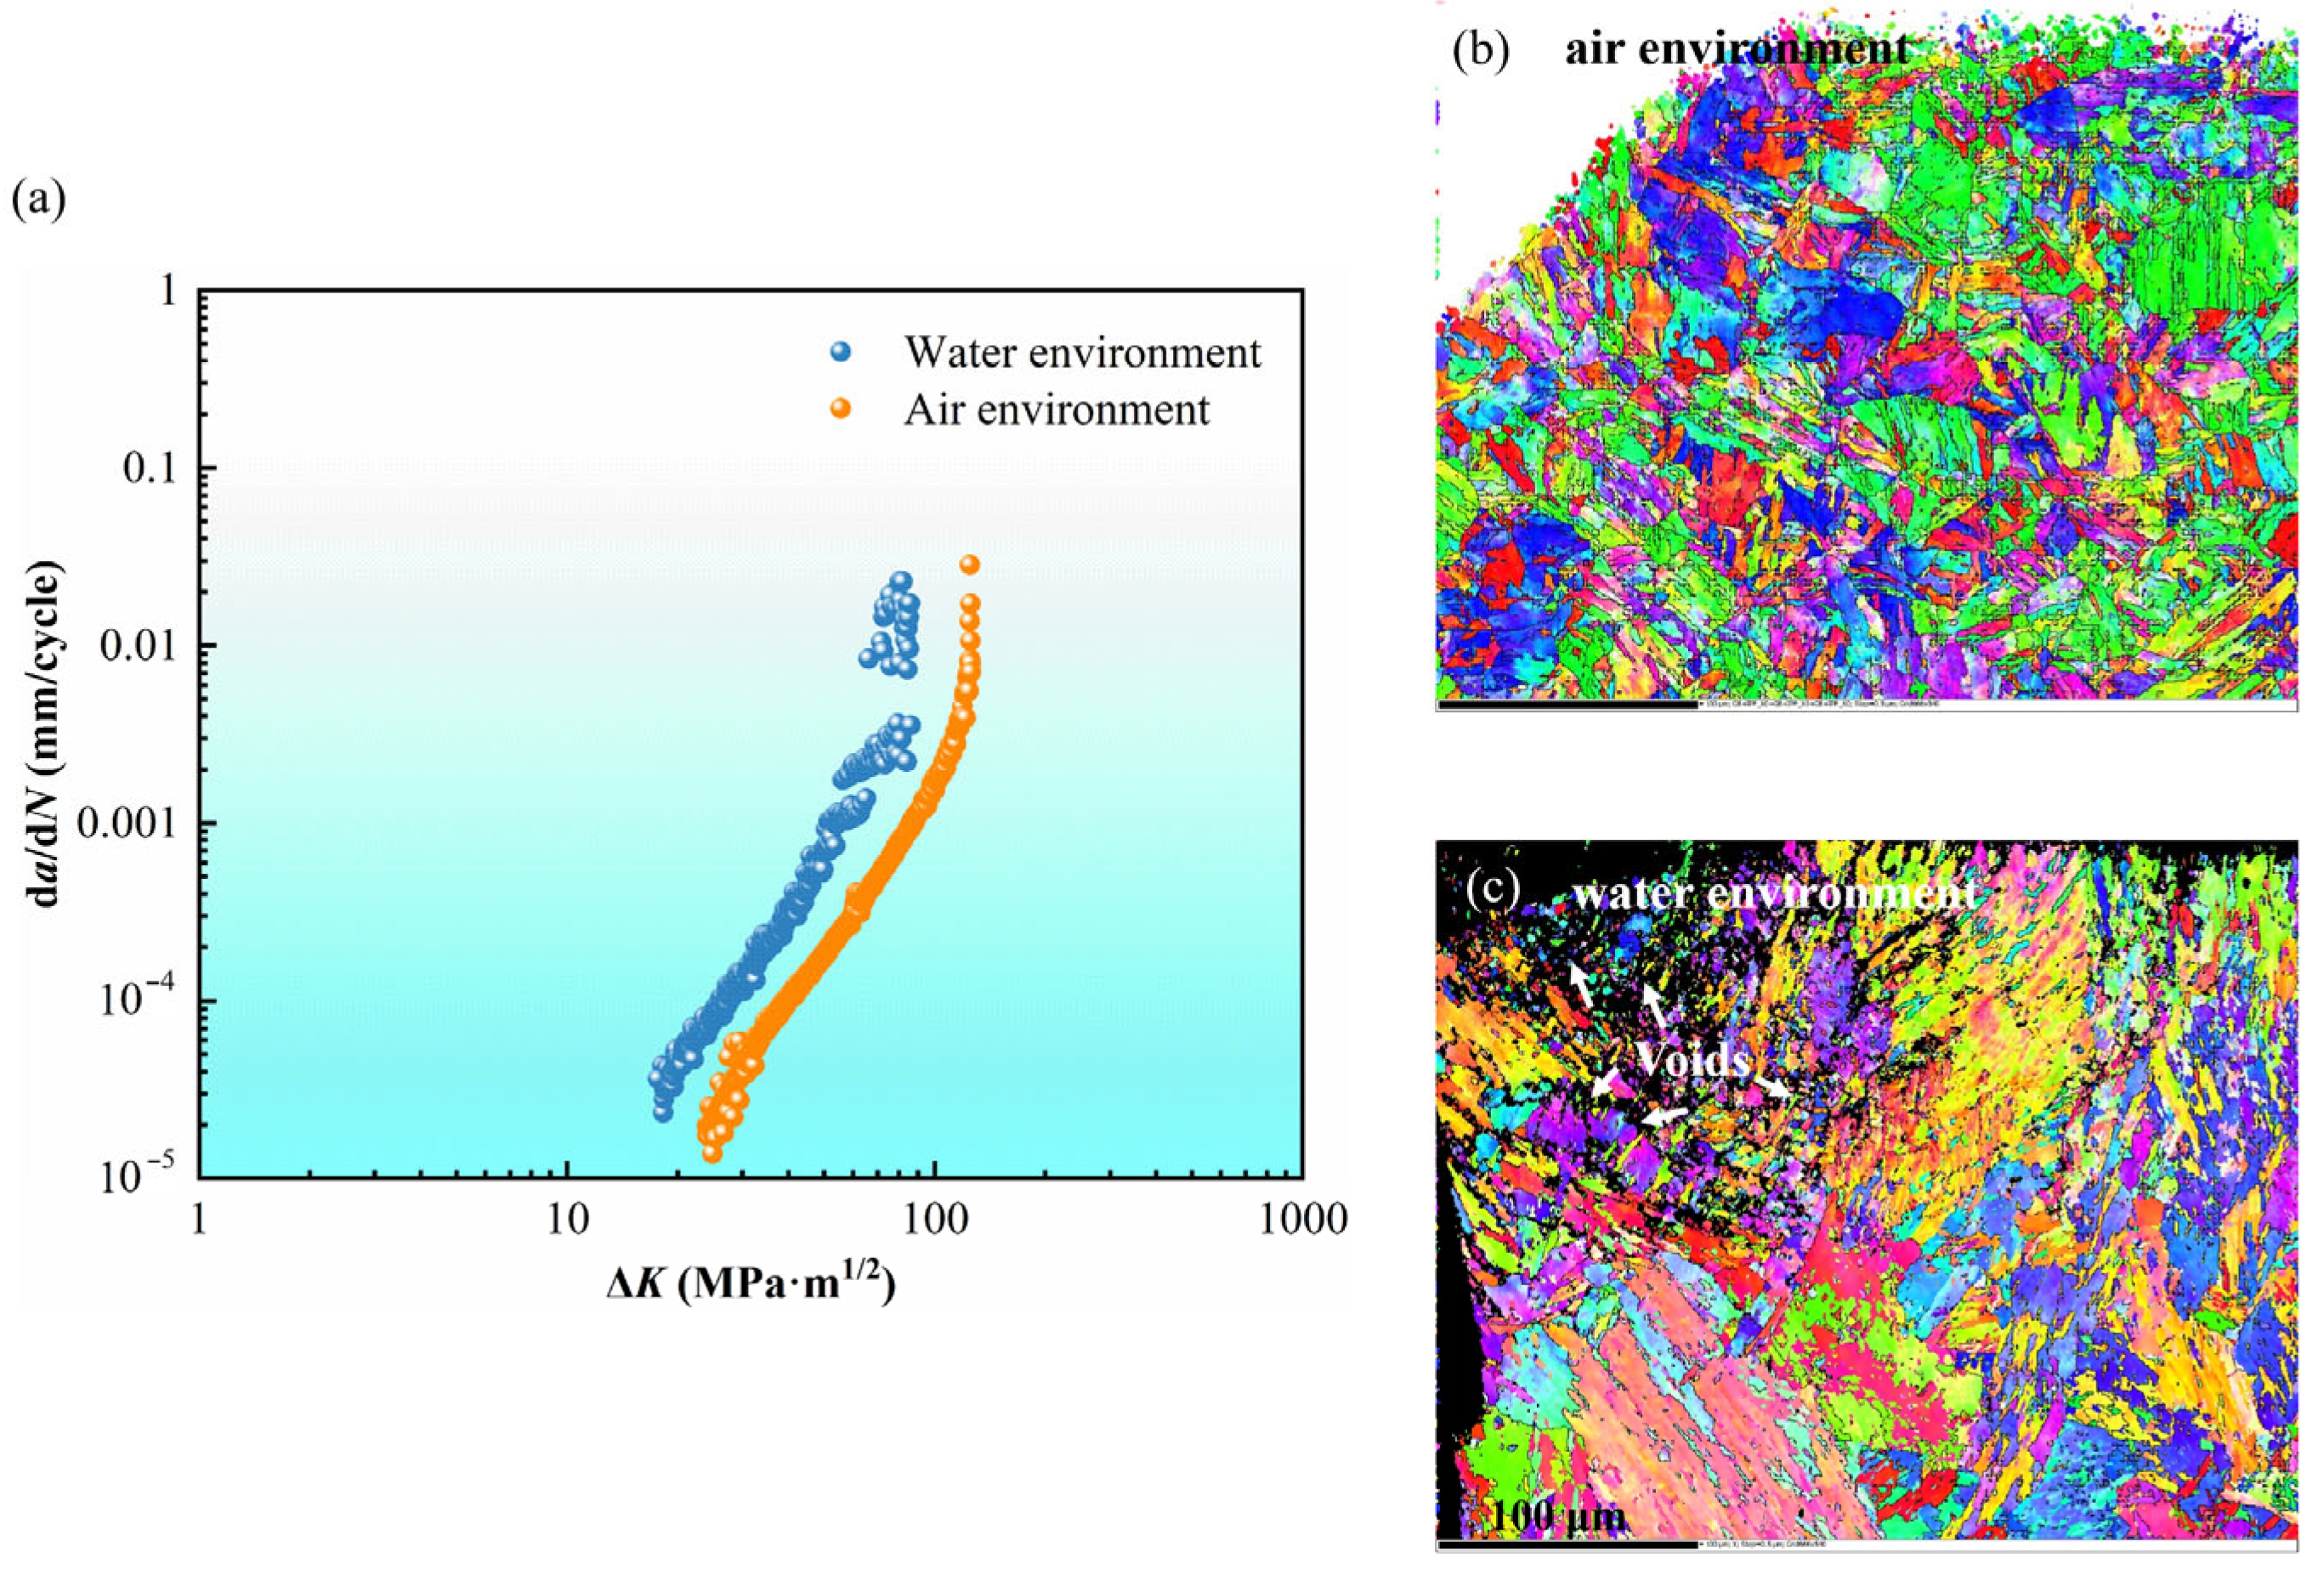
4.3. Crack Propagation

To better elucidate the differences in crack propagation behavior of super martensitic stainless steel in air and water environments, crack propagation experiments were conducted. The results, including plots of the da/dN-ΔK relationship and EBSD analyses, are presented in Figure 11. Comparing the crack propagation rates in air and water (Figure 11a), it is evident that the crack propagation rate in water is significantly higher than in air. This indicates that the corrosive effects of the aqueous environment accelerate crack propagation under the same stress intensity factor. Importantly, at the same stress intensity factor level, a faster crack propagation rate corresponds to a shorter fatigue life, since the number of cycles required for a crack to grow to a critical size is reduced. This is consistent with the principles of fatigue crack growth behavior, where increased da/dN at constant ΔK leads directly to a decrease in the crack propagation stage of the fatigue life. Given that fatigue life typically comprises both crack initiation and crack propagation phases, in corrosion–fatigue scenarios dominated by crack propagation, the acceleration of da/dN results in a substantial reduction in overall fatigue life.
The faster crack propagation in water is likely attributed to the ingress of corrosive media, which makes the microstructure at the crack tip more susceptible to damage. This damage can result from mechanisms such as hydrogen embrittlement or anodic dissolution [34,35], which accelerate localized material degradation. Consequently, the material exhibits reduced fatigue resistance and increased sensitivity to changes in the stress intensity factor in aqueous environments, leading to faster and more aggressive crack propagation. In addition, EBSD scans (Figure 11b,c) reveal that crack initiation in both environments is primarily driven by mode II stresses, indicating that shear stress plays a dominant role in crack initiation regardless of the environment. However, in aqueous environments, the crack paths are more tortuous compared to those in air. This zigzag pattern may arise from the corrosive effects of the aqueous environment on the material’s microstructure, which increases the likelihood of cracks encountering obstacles as they propagate along or through the grains, thereby deviating from their original direction. Additionally, crack initiation in aqueous environments is significantly influenced by water corrosion. The corrosive medium penetrates into the crack tip and surrounding areas, causing localized dissolution and damage, and leading to the formation of numerous microvoids around the crack. These cavities further weaken the local strength of the material, accelerating crack propagation in the region [36].
This phenomenon indicates that the mechanisms of crack initiation and propagation in corrosive aqueous environments differ from those in air. Corrosion not only alters the crack path but also degrades the microstructure surrounding the cracks. The corrosive effects in aqueous environments significantly accelerate the rate of crack propagation, reduce the material’s fatigue resistance, and result in more tortuous crack paths accompanied by the formation of microvoids, which further exacerbate crack expansion. The intensification of crack propagation in aqueous environments is closely linked to the ingress of corrosive media, which adversely affects the material’s microstructure. These findings highlight the need for special attention to the impact of corrosion on fatigue life in engineering applications involving corrosive environments.

5. Conclusions

The following conclusions are drawn from the rotational bending fatigue experiments and crack propagation experiments conducted on 04Cr13Ni5Mo steel in air and water environments, especially focusing on the crack initiation mechanisms.
1.
Through a comprehensive evaluation of various related models, the Weibull three-parameter model was found to best describe the fatigue life data of super martensitic stainless steels of 04Cr13Ni5Mo. Also, such a model is effective for analyzing fatigue test data in both air and water environments.
2.
In air, cracks primarily propagate along the densest crystallographic planes, driven by the maximum shear stress. In contrast, in water, corrosion significantly exacerbates fatigue damage, with cracks more likely to initiate from corrosion-induced weak points, leading to more tortuous crack paths.
3.
In addition, the ingress of corrosive media in water could significantly accelerate the crack propagation rate and lead to the formation of microvoids at the crack tip, thereby depicting a reduction of the material’s fatigue resistance. These findings highlight the critical need to consider the impact of corrosion on fatigue performance in engineering applications involving aqueous environments to ensure structural safety.

Author Contributions

Conceptualization, B.X. and Y.L.; methodology, Y.L. and W.Y.; validation, Y.L., W.Y. and B.X.; investigation, W.L. and J.D.; resources, B.X. and W.Y.; writing—original draft preparation, W.L. and J.D.; writing—review and editing, Y.L., W.L. and J.D.; visualization, Y.L. and W.L.; supervision, B.X. and W.Y.; project administration, B.X., W.Y. and Y.L.; funding acquisition, J.D. All authors have read and agreed to the published version of the manuscript.

Funding

This research was funded by the China Yangtze Power Co., Ltd. (Contract No. Z152302026), and the Natural Science Foundation of Sichuan Province (No. 2024NSFSC0429).

Data Availability Statement

Data are available by request from the corresponding author.

Acknowledgments

During the preparation of this manuscript, the authors thank Youping Li, Bo Xu, Xincheng Tian, Min Zhan, Yuancong Liu, Yi Xu, and Jiali Xie, who made great efforts on the design of the specimens and contributed to the results for a high standard of research output.

Conflicts of Interest

Authors Bing Xue, Yongbo Li and Wanshuang Yi were employed by the company China Yangtze Power Co., Ltd. The remaining authors declare that the research was conducted in the absence of any commercial or financial relationships that could be construed as a potential conflict of interest.

References

  1. Haijun, L.; Lei, Z. Effect of oxyacetylene flame cutting method on the micro-structure and properties of ZG04Cr13Ni4Mo material. China Foundry Mach. Technol. 2015, 58, 89–91. (In Chinese) [Google Scholar]
  2. Liu, X.; Luo, Y.; Wang, Z. A review on fatigue damage mechanism in hydro turbines. Renew. Sustain. Energy Rev. 2016, 54, 1–14. [Google Scholar] [CrossRef]
  3. Georgievskaia, E. Justification of the hydraulic turbines lifetime from the standpoint of the fracture mechanics. Procardia Struct. Integr. 2018, 13, 971–975. [Google Scholar] [CrossRef]
  4. Flores, M.; Urquiza, G.; Rodríguez, J.M. A Fatigue Analysis of a Hydraulic Francis Turbine Runner. World J. Mech. 2012, 2, 28–34. [Google Scholar] [CrossRef]
  5. Zhang, H.; Liu, H.; Deng, Y.; Cao, Y.; He, Y.; Liu, Y.; Deng, Y. Fatigue behavior of high-strength steel wires considering coupled effect of multiple corrosion-pitting. Corros. Sci. 2025, 244, 112633. [Google Scholar] [CrossRef]
  6. Liu, Y.; Dong, J.; Yuan, S.; Li, K.; Hu, X.; Wang, Q. Variable fatigue loading effects on corrugated steel box girders with recycled concrete. J. Constr. Steel Res. 2024, 215, 108526. [Google Scholar] [CrossRef]
  7. Seidel, U.; Mende, C.; Hübner, B.; Weber, W.; Otto, A. Dynamic loads in Francis runners and their impact on fatigue life. IOP Conf. Ser. Earth Environ. Sci. 2014, 22, 032054. [Google Scholar] [CrossRef]
  8. Georgievskaia, E. Hydraulic turbines lifetime in terms of fracture mechanics. Eng. Fail. Anal. 2019, 105, 1296–1305. [Google Scholar] [CrossRef]
  9. Gagnon, M.; Tahan, A.; Bocher, P.; Thibault, D. A probabilistic model for the onset of High Cycle Fatigue (HCF) crack propagation: Application to hydroelectric turbine runner. Int. J. Fatigue 2013, 47, 300–307. [Google Scholar] [CrossRef]
  10. Romano, S.; Brandão, A.; Gumpinger, J.; Gschweitl, M.; Beretta, S. Qualification of AM parts: Extreme value statistics applied to tomographic measurements. Mater. Des. 2017, 131, 32–48. [Google Scholar] [CrossRef]
  11. D’Andrea, A.; Gagnon, M.; Beretta, S.; Bocher, P. Measurements and prediction of extreme defect distributions for fatigue assessment in multi-pass weld of 13%Cr–4%Ni alloy for hydraulic turbines. Int. J. Fatigue 2024, 188, 108501. [Google Scholar] [CrossRef]
  12. Atik, B.; Bozkurt, Y.B.; Kavasoğlu, Y.S.; Kocaci, H.; Celik, A. Pitting corrosion performance of plasma oxidized Cp-Ti and effects of fabrication methods. Surf. Coat. Technol. 2024, 478, 130384. [Google Scholar] [CrossRef]
  13. Ebara, R. Corrosion fatigue crack initiation behavior of stainless steels. Procedia Eng. 2010, 2, 1297–1306. [Google Scholar] [CrossRef]
  14. Li, X.; Liu, C.; Wang, X.; Dai, Y.; Zhan, M.; Liu, Y.; Yang, K.; He, C.; Wang, Q. Effect of microstructure on small fatigue crack initiation and early propagation behavior in super austenitic stainless steel 654SMO. Int. J. Fatigue 2024, 179, 108022. [Google Scholar] [CrossRef]
  15. Chai, G. The formation of subsurface non-defect fatigue crack origins. Int. J. Fatigue 2006, 28, 533–1539. [Google Scholar] [CrossRef]
  16. Chai, G.; Forsman, T.; Gustavsson, F.; Wang, C. Formation of fine grained area in martensitic steel during very high cycle fatigue. Fatigue Fract. Eng. Mater. Struct. 2015, 38, 1315–1323. [Google Scholar] [CrossRef]
  17. Gao, G.; Liu, R.; Fan, Y.; Qian, G.; Gui, X.; Misra, R.D.K.; Bai, B. Mechanism of subsurface microstructural fatigue crack initiation during high and very-high cycle fatigue of advanced bainitic steels. J. Mater. Sci. Technol. 2022, 108, 142–157. [Google Scholar] [CrossRef]
  18. Li, X.; Dai, Y.; Wang, X.; Liu, Y.; Chen, Y.; Wang, C.; Zhang, H.; Li, L.; Liu, H.; He, C.; et al. Effects of local microstructure on crack initiation in super martensitic stainless steel under very-high-cycle fatigue. Int. J. Fatigue 2022, 163, 107019. [Google Scholar] [CrossRef]
  19. Vasudevan, A.K.; Sadananda, K. Classification of environmentally assisted fatigue crack growth behavior. Int. J. Fatigue 2009, 31, 1696–1708. [Google Scholar] [CrossRef]
  20. Schönbauer, B.M.; Stanzl-Tschegg, S.E. Influence of environment on the fatigue crack growth behaviour of 12% Cr steel. Ultrasonics 2013, 53, 1399–1405. [Google Scholar] [CrossRef]
  21. ASTM E8/E8M-24; Standard Test Methods for Tension Testing of Metallic Materials. ASTM International: West Conshohocken, PA, USA, 2024.
  22. ASTM E647-23; Standard Test Method for Measurement of Fatigue Crack Growth Rates. ASTM International: West Conshohocken, PA, USA, 2023.
  23. Dai, Y.; Wang, S.; He, Q.; Liu, C.; Wang, X.; Li, X.; Li, L.; Liu, Y.; He, C.; Wang, Q. Effect of microstructure on slip-induced crack initiation and early propagation of martensitic steel during high cycle fatigue. Int. J. Fatigue 2023, 167, 107275. [Google Scholar] [CrossRef]
  24. Zhan, M.; Liu, C.; Dai, Y.; Wang, X.; Chen, Y.; Liu, Y.; Wang, C.; Li, L.; Wang, Q.; He, C. Effect of microstructure and local stress on small crack initiation and propagation paths in coarse-grained FeCrAl alloys. Fatigue Fract. Eng. Mater. Struct. 2023, 47, 728–744. [Google Scholar] [CrossRef]
  25. Zhan, M.; Dai, Y.; Liu, C.; Wang, X.; Li, L.; Liu, Y.; He, C.; Wang, Q. Effect of rolling on crack behavior of FeCrAl alloys in ultra-long life. Int. J. Struct. Integr. 2023, 14, 827–841. [Google Scholar] [CrossRef]
  26. Shimizu, S. Weibull distribution function application to static strength and fatigue life of materials. Tribol. Trans. 2012, 55, 267–277. [Google Scholar] [CrossRef]
  27. Hectors, K.; De Waele, W. Cumulative damage and life prediction models for high-cycle fatigue of metals: A review. Metals 2021, 11, 204. [Google Scholar] [CrossRef]
  28. Gope, P.C. Determination of sample size for estimation of fatigue life by using Weibull or log-normal distribution. Int. J. Fatigue 1999, 21, 745–752. [Google Scholar] [CrossRef]
  29. Stephens, R.I.; Fatemi, A.; Stephens, R.R.; Fuchs, H.O. Metal Fatigue in Engineering, 2nd ed.; John Wiley & Sons, INC.: New York, NY, USA, 2000; pp. 86–100. [Google Scholar]
  30. Blacha, Ł.; Karolczuk, A. Validation of the weakest link approach and the proposed Weibull based probability distribution of failure for fatigue design of steel welded joints. Eng. Fail. Anal. 2016, 67, 46–62. [Google Scholar] [CrossRef]
  31. Yang, K.; He, C.; Huang, Q.; Huang, Z.Y.; Wang, C.; Wang, Q.Y.; Liu, Y.J.; Zhong, B. Very high cycle fatigue behaviors of a turbine engine blade alloy at various stress ratios. Int. J. Fatigue 2022, 99, 35–43. [Google Scholar] [CrossRef]
  32. Newman, J.C. Fatigue of engineered metallic materials using small-crack theory under constant- and variable-amplitude loading. Fatigue Fract. Eng. Mater. Struct. 2021, 44, 2858–2870. [Google Scholar] [CrossRef]
  33. Palin-Luc, T.; Pérez-Mora, R.; Bathias, C.; Domínguez, G.; Paris, P.C.; Arana, J.L. Fatigue crack initiation and growth on a steel in the very high cycle regime with sea water corrosion. Eng. Fract. Mech. 2010, 77, 1953–1962. [Google Scholar] [CrossRef]
  34. Pedrosa, F.; Andrade, C. Corrosion induced cracking: Effect of different corrosion rates on crack width evolution. Constr. Build. Mater. 2017, 133, 525–533. [Google Scholar] [CrossRef]
  35. Woodtli, J.; Kieselbach, R. Damage due to hydrogen embrittlement and stress corrosion cracking. Eng. Fail. Anal. 2000, 7, 427–450. [Google Scholar] [CrossRef]
  36. Liu, Y.; Wang, Z.; Wei, Y. Influence of seawater on the carbon steel initial corrosion behavior. Int. J. Electrochem. Sci. 2019, 14, 1147–1162. [Google Scholar] [CrossRef]
Figure 1. Optical microscopic image of the steel in the test.
Metals 15 00783 g001
Figure 2. Stress–strain curve of the material used.
Metals 15 00783 g002
Figure 3. The size and dimensions of specimens under fatigue test.
Metals 15 00783 g003
Figure 4. Test setup for fatigue. (a) Test machine setup; (b) schematic of the specimens under fatigue.
Metals 15 00783 g004
Figure 5. Specimens in the fatigue test.
Metals 15 00783 g005
Figure 6. S-N results of 04Cr13Ni5Mo steel.
Metals 15 00783 g006
Figure 7. Fatigue fracture morphology in air environment. (a) Full view at σα = 690.2 MPa and Nf = 1.84 × 10⁴ cycles; (b) full view at σα = 563.3 MPa and Nf = 5.18 × 10⁵ cycles; (c) enlarged view of the crack at σα = 563.3 MPa and Nf = 5.18 × 10⁵ cycles.
Metals 15 00783 g007
Figure 8. Fatigue fracture morphology in water environment. (a) Full view at σα = 640.2 MPa and Nf = 1.07 × 10⁵ cycles; (b) enlarged view of the box in (a); (c) enlarged view of the box in (b); (d) full view at σα = 481.4 MPa and Nf = 1.27 × 10⁶ cycles; (e) enlarged view of the box in (d); (f) enlarged view of the box in (e).
Metals 15 00783 g008aMetals 15 00783 g008b
Figure 9. Three-dimensional morphology and section profile of the fracture. (a) Fatigue fracture in air conditions at σα = 563.3 MPa and Nf = 5.31 × 10⁵ cycles; (b) section profile of marked line A-B in (a); (c) fatigue fracture in water conditions at σα = 481.4 MPa and Nf = 1.27 × 10⁶ cycles; (d) section profile of marked line A-B in (c).
Metals 15 00783 g009
Figure 10. The EBSD results of typical failure specimens in air (σa = 563.3 MPa and Nf = 5.31 × 10⁵ cycles) and water environments (σα = 481.4 MPa and Nf = 1.27 × 10⁶ cycles). (a) SEM image of a typical specimen failed in air environment; (b) IPF mapping of the section profile marker line A-B in (a); (c) SEM images of a typical specimen failure in water environment and IPF images of the A-B section; (d) KAM mapping of the section profile of marked line A-B in (c).
Metals 15 00783 g010
Figure 11. The crack expansion and EBSD results investigations of crack sprouting. (a) da/dN-ΔK results in air environment and water environments; (b) EBSD results of crack sprouting flanks in air environment; (c) lateral EBSD results of crack sprouting in water environment.
Metals 15 00783 g011
Table 1. Key chemical components of 04Cr13Ni5Mo steel and corresponding standard ranges.
ComponentsCSiMnPSCrNiCuMoWV
Values (wt.%)0.040.801.450.010.0113.005.000.400.700.010.05
Standard Range (wt.%)≤0.05≤1.00≤1.50≤0.03≤0.0312.00–14.004.00–6.00≤0.500.30–1.00≤0.05≤0.20
Table 2. Parameters of the distribution model in different stress load levels in the air environment.
ModelParametersStress Load Level (MPa)
690.2613.5563.3488.0436.5
ND μ 34,554103,237365,6491,257,5162,014,203
σ 12,68836,754222,574540,972960,250
R20.98040.96210.94710.97150.9405
LND μ 4.51854.99595.51616.07096.2708
σ 0.16460.15850.24860.20360.2242
R20.98160.95860.97030.96470.9441
Weibull-2 η 38,720115,827421,3731,431,7522,313,912
β 3.17703.25132.03282.59682.3577
R20.97900.94210.93520.97270.9515
Weibull-3 γ 13,64760,345188,278248,464902,091
η 24,28849,761170,1601,169,9611,296,626
β 1.71881.04430.61001.96890.9463
R20.98490.94670.99410.97330.9590
Table 3. Parameters of the distribution model in different stress load levels in the water environment.
ModelParametersStress Load Level (MPa)
693.1640.2586.9534.5481.4
ND μ 53,016103,407135,767295,641585,703
σ 38,60679,379102,236176,176610,747
R20.93840.93370.96020.97770.9093
LND μ 4.65024.94025.04645.41625.6304
σ 0.32420.31880.35190.27540.4360
R20.96070.95590.97020.98620.9587
Weibull-2 η 61,463120,135157,145340,440659,939
β 1.59401.58201.47151.90511.1671
R20.94660.91930.95790.98680.9303
Weibull-3 γ 17,13345,03341,34434,73764,737
η 38,95050,82299,720302,116564,228
β 0.81940.52470.71131.59630.9877
R20.97730.99040.98150.98820.9450
Table 4. The parameter to evaluate the distribution model of ND, LND, Weibull-2, and 3.
EnvironmentNDLNDWeibull-2Weibull-3
Air−0.01320.0044−0.03440.0432
Water−0.01740.0049−0.00910.0216
Table 5. The fatigue life prediction of the specimens using the Weibull-3 model.
EnvironmentS (Mpa)Inefficient Parameter P
50%10%1%0.1%
Air690.233,27120,20515,31814,084
613.595,37766,11260,95260,411
563.3281,585192,531188,368188,280
488.01,219,705621,536361,570283,506
436.51,782,3491,022,331912,129902,968
Water693.142,03619,63217,27517,142
640.270,30945,73045,04145,033
586.9100,91145,55941,49941,350
534.5274,875108,51851,66738,727
481.4454,043122,53670,09165,255
Disclaimer/Publisher’s Note: The statements, opinions and data contained in all publications are solely those of the individual author(s) and contributor(s) and not of MDPI and/or the editor(s). MDPI and/or the editor(s) disclaim responsibility for any injury to people or property resulting from any ideas, methods, instructions or products referred to in the content.

