Article

Corrosion Resistance Mechanism in WC/FeCrNi Composites: Decoupling the Role of Spherical Versus Angular WC Morphologies

1
Intelligent Engineering College, Chongqing Electric Power College, Chongqing 400030, China
2
School of Materials Science & Engineering, Sichuan University, Chengdu 610065, China
3
Sichuan Provincial for Rare Earth & Vanadium-Titanium Based Functional Materials, Sichuan University, No. 24 South Section 1, Yihuan Road, Chengdu 610065, China
4
Key Laboratory of Advanced Special Materials & Technology, Ministry of Education, Chengdu 610065, China
*
Authors to whom correspondence should be addressed.
Metals 2025, 15(7), 777; https://doi.org/10.3390/met15070777
Submission received: 22 May 2025 / Revised: 21 June 2025 / Accepted: 25 June 2025 / Published: 9 July 2025

Abstract

In this study, we investigated the electrochemical corrosion behavior and mechanisms of FeCrNi/WC alloys with varying contents of CTC-S (spherical WC) and CTC-A (angular WC) in a 3.5 wt.% NaCl solution, addressing the corrosion resistance requirements for stainless steel composites in marine environments. The electrochemical test results demonstrate that the corrosion resistance of the alloy initially increases with the CTC-A content, followed by a decrease, which is associated with the formation, stability, and rupture of the passivated film. Nyquist and Bode diagrams for electrochemical impedance spectroscopy confirm that the charge transfer resistance of the passivated film is the primary determinant of the composite’s corrosion performance. A modest increase in CTC-A contributes to the formation of a more heterogeneous second phase, providing a physical barrier and enhancing solid solution strengthening, and thus delaying the cracking and corrosion processes of the passivation film. However, excessive CTC-A content leads to significant dissolution of the alloy’s reinforcement phase and promotes decarburization, resulting in the formation of corrosion pits, craters, and cracks that compromise the passivation film and expose fresh alloy surfaces to further corrosion. When the CTC-A content is 10% and the CTC-S content is 30%, this combination results in minimal degradation in the corrosion performance (0.213 μA·cm2) while balancing the hardness and toughness of the alloy. Additionally, electrochemical evaluations reveal that incorporating angular CTC-A particles at 10 vol% effectively delays the breakdown of the passivation film by mitigating the interfacial galvanic coupling through enhancing the mechanical interlocking at the WC/FeCrNi interface. The CTC-A/CTC-S hybrid system exhibits a remarkable 62% reduction in the pitting propagation rate compared to composites reinforced solely with spherical WC, which is attributed to the preferential dissolution of angular WC protrusions that sacrificially suppress crack initiation at the phase boundaries.

1. Introduction

In the field of marine engineering, enhancing the resistance of materials to seawater corrosion is crucial to ensuring the durability and safety of facilities. Stainless steel-based composites reinforced with tungsten carbide (WC) have emerged as promising candidates due to their unique combination of corrosion resistance, wear resistance, and mechanical strength. WC/FeCrNi composites leverage the exceptional hardness of tungsten carbide (2200–2600 HV) and the high fracture toughness of FeCrNi matrices (>15 MPa·m1/2), showing significant promise for use in marine components like seawater pumps and valves [1]. The production methods for these composites significantly influence their final properties. Conventional techniques like laser cladding and hot isostatic pressing [2] often lead to interfacial decohesion due to thermal mismatch, while spark plasma sintering (SPS) enables rapid consolidation (80 °C/min heating rate) with minimized grain growth and an enhanced interfacial bonding strength [3]. Comparative studies reveal that SPS-processed FeCrNi/WC composites exhibit 18% higher microhardness (1250 HV) and 30% lower porosity (<0.5%) than their laser-clad counterparts [4], although challenges remain in controlling the carbide decomposition at temperatures above 1100 °C.
However, the existing research predominantly focuses on single-property optimization, failing to simultaneously address wear and corrosion resistance. Traditional approaches often incorporate high fractions of angular WC (>50 vol%) to maximize the material’s hardness (e.g., HV > 1200), but this introduces critical limitations: (1) The sharp edges of angular WC particles act as stress concentrators, which leads to pitting corrosion [5,6]; (2) Excessive WC promotes brittle secondary carbides (e.g., (Cr,Fe)7C3), weakening the interfacial cohesion and accelerating localized corrosion (corrosion rate increase >30%) [7,8,9]. Recent studies [10,11] reveal that high-temperature Cr depletion at interfaces critically compromises passive film stability. (3) While the FeCrNi matrix offers excellent corrosion resistance, its inherent wear resistance remains insufficient (wear rate > 1.2 × 10⁻⁴ mm3/(N·m)) for high-load/high-velocity applications [12]. This trade-off between wear resistance and corrosion resistance represents a fundamental bottleneck in WC/FeCrNi composite development.
Recent advancements have focused on morphology-controlled WC reinforcement. Liu et al. [10] demonstrated that the use of spherical WC particles in Fe-based coatings reduced the corrosion rates by 20% compared to angular variants due to encouraging stress homogenization. Conversely, Mao’s work [12] highlighted angular WC’s superior erosion resistance in drill bit applications due to it encouraging mechanical interlocking [13]. Angular WC improves the interfacial bonding through mechanical anchoring but promotes localized porosity (porosity ≈ 3%) and corrosion medium penetration [14], as has been atomically validated at sharp edges [15,16]. Despite the pioneering work on the use of bimodal WC distributions to enhance the mechanical properties of materials [17,18], no studies systematically investigate the corrosion behavior in spherical/angular WC systems, nor do any studies resolve interfacial Cr-diffusion kinetics [19,20].
To resolve the persistent trade-off between wear resistance and corrosion resistance in WC composites [21,22], we pioneer a “morphology-synergized WC reinforcement” strategy using hybrid angular/spherical WC (e.g., 20 vol% angular + 20 vol% spherical). This design delivers three key innovations over monomorphic systems [3,9]: (1) Angular WC provides mechanical interlocking that boosts fracture toughness [7], while spherical WC eliminates stress concentrators, reducing the corrosion current density through interfacial densification [6]. (2) Spherical WC enhances Cr3+ enrichment, while angular WC’s dislocation networks hinder chloride diffusion without triggering pitting [9]. (3) The use of WC achieves simultaneous wear resistance and corrosion resistance, overcoming Zhang’s single-property limits [1].
These advances enable breakthroughs in critical marine applications: WC resists chloride-induced pitting and abrasive sand erosion [8], while, regarding, desalination heat exchangers, hydrophobic spherical WC domains [12] prevent scaling and hybrid interfaces inhibit scale-induced cracking [6].

2. Experimental Methodology

The experimental workflow was systematically organized into three interconnected phases—material preparation, microstructural characterization, and electrochemical evaluation—utilizing advanced analytical techniques to ensure comprehensive insights.

2.1. Materials Preparation

Raw materials: The raw materials comprised a commercial gas-atomized FeCrNi alloy powder (Cr 17.13%, Ni 3.20%, balance Fe, see Table 1) and two morphologically distinct tungsten carbide powders—spherical CTC-S (15~45 μm) and angular CTC-A (12~48 μm)—supplied by Zigong Hard Alloy Co., Ltd. (Zigong, China). Five composite formulations (Table 2) were prepared by blending 60 vol% FeCrNi matrix with 40 vol% WC reinforcements in varying CTC-S/CTC-A ratios. Scanning electron microscopy (SEM) characterization revealed that the FeCrNi powder exhibited typical spherical morphology (Figure 1a), while the WC powders showed controlled size distributions, with CTC-S displaying smooth spherical particles (Figure 1b) and CTC-A featuring irregular polyhedral geometries (Figure 1c).
The mixed powders (FeCrNi alloy + 40 vol% WC) were ball-milled for 3 h at 300 rpm. As shown in Figure 2a, SEM analysis revealed intact spherical/elliptical particles without fragmentation, indicating insufficient mechanical energy for significant size reduction. The particle size distribution spanned 20–150 μm (average 68 ± 12 μm), demonstrating relatively uniform dispersion. Crucially, EDS elemental mapping (Figure 2b–g) confirmed that Fe, W, Cr, Mo, Mn, and Ni remained discretely distributed without diffusion or alloying—highlighting the absence of solid solution formation during this preliminary milling stage.
Sample preparation process: Homogenized powder mixtures were consolidated via spark plasma sintering (SPS; Dr. Sinter Lab-1000) under vacuum (<5 × 10⁻³ Pa) using the following optimized parameters: (1) heating rate of 80 ± 5 °C/min (PID-controlled with K-type thermocouples embedded <5 mm from samples in graphite die walls); (2) isothermal holding at 1100 °C for 10 min under 30 MPa axial pressure; (3) subsequent natural cooling to 300 °C at ≈45 °C/min followed by furnace cooling to room temperature, with samples being maintained under pressure throughout cooling cycle. Thermocouple position was calibrated against test specimens to maintain < 1.5% temperature deviation (per ASTM E2655-14 [23]), ensuring precise phase stability control during rapid thermal cycling.

2.2. Characterization Techniques

Phase analysis: DX-2700 diffractometer (Dandong Haoyuan Instrument Co., Dandong, China) with Cu Kα radiation (λ = 0.15460 ± 0.00005 nm). Angular accuracy: ±0.01° (2θ) via certified NIST Si standard (SRM 640e). The 0.05°/s scan rate minimizes lattice parameter calculation errors to <0.02%, which is critical for accurate phase identification and crystallite size determination via the Scherrer equation.
Microstructural imaging: JSM-6490LV (JEOL Ltd., Tokyo, Japan) with resolution of 3.0 nm at 30 kV. Oxford Instruments X-MaxN 50 EDS detector (Oxford, UK) (energy resolution 127 eV at Mn Kα). Spatial resolution ≤ 1 µm ensures precise microstructural correlation. Quantitative accuracy: ±0.5 wt.% for elements >5 wt.%.
Nanoscale interface analysis: JEOL JEM-2100F (Tokyo, Japan) at 200 kV (point resolution 0.19 nm). FIB milling (FEI Helios 600i, Hillsboro, OR, USA) with ±5 nm positioning accuracy ensures artifact-free specimen preparation. Lattice spacing measurement precision: ±0.005 nm via Au nanoparticle calibration.
Surface chemistry: Thermo Scientific K-Alpha spectrometer (Waltham, MA, USA) with monochromatic Al Kα (1486.6 ± 0.1 eV). Charge compensation accuracy: ±0.05 eV using adventitious carbon (C 1s = 284.8 eV). Energy resolution: 0.45 eV enables precise chemical state differentiation.

2.3. Electrochemical Tests

In order to simulate seawater corrosion, 3.5 wt.% NaCl solution was used as the electrolyte, and a three-electrode testing system was applied, including the working electrode (WE), the reference electrode (SCE), and the counter electrode (CE). The scanning range for electrochemical tests was set at ±300 mV of open circuit potential, with a scan rate of 0.001 V/s.

3. Results and Discussion

3.1. Phase Analysis of Five Samples

X-ray diffraction (XRD) analysis was employed to examine the phase composition of the powder. As illustrated in Figure 3a, WC was identified as the primary constituent of both the spherical and angular WC. The samples exhibit characteristic diffraction peaks for WC at 2θ = 35.7°, 48.3°, and 63.0°, as well as peaks for W2C at 2θ = 34.4°, 39.6°, and 61.7°.
At the sintering temperature of 1100 °C, a pressure of 30 MPa, and a holding time of 5 min, the phase composition of alloys with varying CTC-S and CTC-A contents was analyzed via XRD, as shown in Figure 3. The primary diffraction peaks consisted of (Cr,Fe)7C3, W2C, WC, and Fe/Cr phases, with secondary carbides such as Fe3W3C also being observed. This is primarily attributed to the dissolution of WC at high temperatures, where the carbon component can react with other elements to form secondary carbides. Notably, sample 2 exhibited the highest peak intensity for (Cr,Fe)7C3. Comparing the peak height ratios of WC (2θ = 35.7°) and W2C (2θ = 39.6°), sample 1 showed the lowest ratio, while sample 3 demonstrated the highest. The variation in the height ratio of WC and W2C among different samples may be attributed to the differential dissolution of WC during sintering. The average grain size of the samples was calculated using the Scherrer and Wilson equations. The average grain size distribution for the five samples was as follows: D50 = 39 μm, D50 = 36 μm, D50 = 27 μm, D50 = 26 μm, and D50 = 24 μm. Furthermore, the full width at half maximum of the diffraction peak for spherical WC is greater than that for angular WC, indicating that the grain size of angular WC is smaller than that of spherical WC.
The results indicate that, with increasing CTC-A content, the X-ray diffraction peaks of the α-Fe phase shift toward lower angles. This shift is attributed to the incorporation of the larger atomic size of the W element into the α-Fe matrix, which leads to lattice expansion. Liu et al. [10] also reported similar findings. The high crystal plane index and small interplanar spacing of the W element contribute to a pronounced leftward shift of the diffraction peak, which aligns with the detection of trace amounts of W in the α-Fe matrix [13].

3.2. Microstructure Analysis

Although the phase compositions of the two types of WC/FeCrNi alloys are largely similar, comprising gray, black-gray, and black phases, there are significant differences in their microstructures and distributions. Spherical WC retains a relatively intact morphology during sintering, with gray WC being distributed in a nearly spherical shape within the black Fe matrix, exhibiting fewer metallurgical reactions. The black-gray phase appears rod-like with a larger grain boundary area, which contributes to inhibiting crack propagation. In contrast, angular WC is more susceptible to breakage during sintering due to the morphological characteristics dictated by CTC-S. This morphology facilitates better thermal contact during input, resulting in a more uniform dissolution compared to that of CTC-A. For CTC-A, heat initially interacts with the corners of the particles, which leads to uneven thermal contact and subsequent dissolution of these corners. During plasma sintering, angular WC is more prone to fragmentation, which results in a shorter solid–liquid diffusion distance that promotes metallurgical reactions and the easier formation of carbide phases within the grains. As the sphericity of the WC decreases, the volume fraction of the black-gray hard phase gradually increases, transitioning from nearly spherical and rod-like shapes to more rounded forms. This results in smaller grain boundary areas, reduced grain boundary curvature, and a more favorable environment for crack propagation.
The dissolution and diffusion behaviors of spherical and angular WC within the FeCrNi matrix were analyzed through linear scanning. The diffusion of the W element in spherical WC is relatively weak, with lower concentrations of C, Fe, and Cr being observed in the dissolution region, which indicates the limited dissolution of spherical WC in the matrix. In contrast, the contents of W, Fe, and Cr elements significantly decrease in the dissolution region of angular WC, reflecting a more pronounced dissolution and diffusion of WC in the binder phase iron, which leads particularly to the formation of new carbides such as (Cr,Fe)7C3 [1]. Furthermore, BSE and EDS analyses reveal that angular WC is more susceptible to decomposition during melting, which results in a more uniform diffusion of carbon elements around the WC particles. These findings underscore the significant impact of the morphology of WC on its dissolution and diffusion behaviors within the FeCrNi matrix.
Linear element scanning across WC/matrix interfaces (Figure 4) revealed morphology-dependent diffusion mechanisms. Spherical WC (Figure 4a) exhibited limited W diffusion into the matrix (<2 μm layer), with its concentrations decaying sharply from the interface (dashed line). Conversely, angular WC (Figure 4b) developed >3× thicker diffusion layers due to the ‘corner effect’, where preferential thermal concentration at angular facets lowered diffusion barriers (ΔE = 152 → 135 kJ/mol [24]), which accelerated the dissolution of W. The extended Cr and C concentration gradients (Figure 4b) over 6 μm zones confirmed enhanced interfacial reactions, which triggered (Cr,Fe)7C3 precipitation [1].
To further elucidate the inter-diffusion behavior of multi-scale interface elements and the phase evolution mechanism, EPMA micro-area quantitative analysis was performed on the enhanced region of sample #3 to establish the cross-scale structure–activity relationship between the composition and interface. Figure 5 illustrates the element distribution characteristics at the interface of the particle-reinforced phase in the composite material of sample #3 (20% spherical WC/20% angular WC), which were obtained using electron probe micro-area analysis. At the 10 μm scale, the micro-morphology image (Figure 5a) clearly presents the distribution states of spherical and angular WC particles. The two types are mechanically interlocked through plasma sintering, with no obvious cracks or pores being observed in the interface bonding area. A direct comparison of the sintering microstructures reveals that the sharp corners of angular WC dissolve more extensively, forming a wider transition layer at the interface; concurrently, these sharp corners gradually assume a more spherical shape after dissolution. The W element distribution map (Figure 5b) demonstrates enrichment characteristics for both spherical and angular WC particles, and these are accompanied by a W gradient transition zone (approximately 5 μm thick) at the edge of the angular WC. This indicates that W elements diffuse into the matrix during sintering, while spherical WC retains a distinct spherical interface with a diffusion layer of about 2.5 μm. The C element distribution (Figure 5c) closely correlates with the W distribution, which suggests the integrity of the WC phase. Additionally, C enrichment points (<1 μm) are detected in the matrix area, and these are inferred to be the dispersed precipitation of (Cr,Fe)7C3 carbides. The distributions of Fe, Cr, and Ni matrix elements exhibit typical continuous network characteristics. Notably, there is a depletion zone that is approximately 0.5 μm wide at the WC/matrix interface for Fe, while Cr shows enrichment at the interface and Ni demonstrates the most uniform distribution. This elemental distribution feature suggests that angular WC facilitates the interface segregation of Cr through the dissolution of sharp corners, whereas spherical WC maintains continuity in the matrix element distribution due to its low surface energy characteristics. The synergy of these two morphologies allows the composite material to achieve both strong interface bonding and uniform corrosion resistance [10].
Figure 6 shows the nanostructural features and polycrystalline nature of the material, where different grains and phase boundaries can be observed. The high-resolution transmission electron microscopy (HRTEM) image (c) reveals a typical grain with a crystal face spacing of 5.70 Å, which corresponds to the (002) and (020) crystal faces of the Fe3W3C phase, indicating that the reaction of the WC particles with the FeCrNi matrix during sintering generates the Fe3W3C phase, which is usually formed in carbon-rich environments at temperatures exceeding 500 °C. The brittleness of Fe3W3C may negatively affect the hardness and wear resistance of the composites. The fast Fourier transform (FFT) image (c) shows well-defined diffraction points on the (002) and (020) crystal planes of the [100] orientation of the Fe3W3C phase, reflecting the crystallographic symmetry and selective orientation of the material, which may originate from the action of the temperature, pressure, and electric field during the sintering process. EDS quantification (Figure 6b, Table inset) showed corresponding elemental enrichment of the W content (34.77%), followed by Cr (25.18%) and Fe (23.40%), further verifying the formation of the Fe3W3C phase and the presence of brittle phases in the material, which constitutes a detrimental effect on the mechanical properties of the material. This nanoscale phase evolution directly correlates with angular WC’s enhanced dissolution kinetics, where preferential corner diffusion facilitates carbon saturation and subsequent brittle phase formation.
The effect of composite properties is shown in Figure 7. Each mechanical property value represents the mean of five independent measurements per sample group, with error bars/table entries indicating ±1 standard deviation. Sample #1 had a densification of 99.7% and a hardness of 1245 HV, which indicated that spherical particles optimized the densification and load transfer effects through promoting uniform distribution and efficient stacking. As the proportion of angular WC increases, the densification gradually decreases to 97.2% for sample #5, and the hardness synchronously decreases from 1245 HV to 1107 HV, which is mainly attributed to the sharp angles of angular particles triggering an increase in porosity. With the increase in angular WC, the hardness of sample ##2 decreased less, which was attributed to the enhancement of interfacial bonding by angular particles through mechanical interlocking, which slowed down the hardness decrease while maintaining a higher densification. The fracture toughness increases and then decreases in a stepwise manner with decreases in the proportion of spherical WC, with the toughness of sample #1 (40% spherical WC) being 15.3 MPa·m1/2, and that of sample #5 (40% angular WC) dropping to 13.7 MPa·m1/2, which is a decrease of 5.3%. Sample #2 (30% spherical–10% angular WC) exhibited the best toughness (15.8 MPa·m1/2), which is due to the mechanical interlocking of angular particles enhancing the interfacial bonding while maintaining a high densification; in turn, this is due to the synergistic effect of the spherical WC particles enhancing the densification and the mechanical occlusion interlocking with the angular particles at the interface, which to realizes the improvement of the material properties.

3.3. Electrochemical Measurements

3.3.1. The Effect of Adding CTC-A on the Open Circuit Potential of the Alloy

This study investigated the effect of different specific weights of CTC-S and CTC-A on the corrosion resistance of FeCrNi/WC alloy in NaCl solution through open circuit potential (OCP) measurements, as shown in Figure 8. The results indicated that, with an increase in the CTC-A content, the open-circuit potential decreases continuously with increases in the proportion of angular WC, gradually decreasing from −0.348 V to −0.416 V, as shown in Table 3. The composite density decreases gradually with increases in the proportion of angular WC (the porosity increases from 1% to 3%), which results in a high proportion of angular WC-reinforced composites and thus increases the area in contact with the corrosive fluid during the corrosion process. As the second phase generated in the composites is more unevenly distributed [22], it is easier to trigger galvanic coupling corrosion; the sintering process of angular WC is more prone to surface diffusion and thus forms more second phases [24,25], which further aggravates the galvanic coupling corrosion.

3.3.2. The Effect of Adding CTC-A on the Polarization of the Alloy

This study investigates the effects of different CTC-S and CTC-A contents on the electrochemical behaviors and corrosion resistance of FeCrNi/WC alloy in a corrosive environment through Tafel polarization curve analysis, as shown in Figure 9. The results show that, with the change in CTC-A content, the cathodic process of the alloy is mainly represented by an oxygen reduction reaction, and that the introduction of WC has little effect on the corrosion process of the cathodic reaction, with consistent cathodic region curves being observed. However, in the anodic region, the alloys exhibit significant differences, especially the change in the anodic polarization region, which indicates that an increase in CTC-A content leads to a significant increase in the corrosion rate of the alloy, potentially causing passivation dissolution and pitting corrosion phenomena [26]. Specifically, as the CTC-A content increases from 0% to 10%, the corrosion current density (jcorr) of the alloy significantly decreases, indicating a lower corrosion rate. However, when the CTC-A content continues to increase to 20%, the corrosion rate significantly increases, indicating that the addition of CTC-A partially destroys the protective performance of the passivation film and leading to intensified anodic dissolution. In particular, the #3 sample alloy exhibits the lowest corrosion potential under the experimental conditions, which indicates a higher corrosion rate, while the #2 sample alloy shows a higher corrosion potential, demonstrating a lower corrosion rate. Further analysis reveals that, with the continued increase in CTC-A content, the corrosion potential and corrosion current density of the alloy first decrease and then increase, displaying a complex trend in their corrosion resistance performance.
Analysis at the microstructure level reveals that, with the increase in CTC-A content, the dissolution at the edges of WC intensifies, promoting the contact between WC and the alloy matrix, leading to the formation of more M7C3 (M = Cr,Fe) phases, further refining the grains, and enhancing the wear resistance of the alloy. In addition, the increase in CTC-A content also results in the formation of more heterogeneous nucleation particles during the sintering process, which may make the alloy more susceptible to in situ corrosion during service.

3.3.3. The Influence of the Addition of CTC-A on the Electrochemical Impedance of the Alloy

This study analyzed the passivation behavior of FeCrNi/WC alloys with different CTC-S and CTC-A contents after 5000 s of corrosion using the electrochemical impedance spectroscopy (EIS) technique and performed data fitting with ZWiew software (current version as of 2024 is 3.9d, released circa 2022).
From the Nyquist plot (Figure 10a), it can be seen that the Nyquist plots that result from adding alloys with different CTC-A contents are all semicircles with their center above the X-axis, a morphology that is commonly considered as indicative of charge transfer at the passivation film interface [27]. The different radii of the semicircles of different alloy samples reflect the differences in the passivation layer resistance [12]. It can be seen from Figure 10a that the alloy of sample #3 has the capacitive semicircle with the smallest radius; the alloy of sample #2 has the capacitive semicircle with the largest radius, with a larger radius indicating a higher impedance of the passivation layer and thus showing better corrosion resistance, similar to the results of polarization tests.
Figure 10b shows the Bode plot obtained through electrochemical impedance spectroscopy testing. In this experiment, the FeCrNi/WC alloy exhibits a phase angle plateau in the frequency range of 100–102 Hz, with a phase angle between 60–70° [28]. The slope of the logarithm |Z| versus that of the logarithm ƒ shows a typical linear relationship, with a ratio of approximately 0.55, which indicates that the reaction between the alloy surface and the electrolytic corrosion solution in sodium chloride is determined by a single time constant, which is mainly the passivation film at the reaction interface between the alloy and the corrosion solution, as analyzed earlier [29].
Through the fitting of equivalent circuits, the model is made to include the solution resistance (Rs), passivation layer resistance (Rp), and passivation layer capacitance (CPEp, the constant phase element, describes the non-ideal capacitive behavior of the passive film). The CPE parameters Y0 and α are correlated with the surface morphology and indicate the positive passivation film dielectric properties (Y0) and the densification (α). The fitting results are highly consistent with the experimental data, which indicate that the model can accurately describe the passivation behavior of FeCrNi/WC alloys in NaCl solution. The research results show that the content of CTC-A has a significant impact on the formation of the passivation film and the corrosion resistance performance of the pure spherical WC particle-reinforced alloy. The AC impedance parameters of the passivation film of FeCrNi/WC alloy obtained through equivalent circuit simulation are shown in Table 4.
This study investigates the effect of the CTC-A content on the corrosion resistance of pure spherical WC particle-reinforced alloy by analyzing the passive film parameters shown in Table 4. According to the analysis of the common Helmholtz capacitance model, the capacitance impedance of the passive film is inversely proportional and linearly related to the thickness of the passive film [30].
C e f f = Y 0 1 / α ( R p 1 R s ) 1 α α
d = ε 0 ε S C e f f
d is the passivation film thickness on the alloy/corrosive liquid reaction interface and S is the surface area of the electrode.
The results show that, with increases in the CTC-A content, the charge transfer resistance (Rp) of the passivation film first decreases and then increases, which indicates that the difficulty of charge transfer is related to the integrity of the passivation film. The capacitance of the passivation film first increases and then decreases with the increases in CTC-A content, reflecting the change in the thickness of the passivation film, as quantitatively demonstrated in Figure 11, which presents the relative thickness of passivated films for different samples (#1–#5). This 54% thickness increase from samples #1 to #5 directly correlates with the M7C3 phase evolution shown in Figure 6d. It was found that, with the increases in CTC-A content, the relative thickness of the corrosion layer gradually increased and that the addition of WC promoted the generation of more M7C3 phase, refined the grain size, increased the thickness and density of the passivation film [31], and thereby enhanced the corrosion resistance of the alloy. Finally, the thick and dense Cr2O3 and Ni(OH)2 film layer inhibited the erosion of the corrosive medium [32], leading to a significant improvement in the corrosion resistance of the FeCrNi/WC alloy passivation film in 3.5 wt.% NaCl solution.

3.3.4. The Effect of Adding CTC-A on the Morphology of Corrosion Products of the Alloy

Figure 12 shows the surface corrosion morphology of the FeCrNi/WC alloy after the polarization test. The precipitation morphology of the corrosion surface of the alloy in sample #1 is shown in Figure 12(a1,b1). In the magnified images shown in Figure 12(a2,b2), cluster-like precipitates can be observed, with EDS analysis indicating that the main elements that were detected are Fe and O.
When the pitting holes of #1the sample #1 alloy are magnified to 10,000 times, it can be seen that the corrosion products exhibit a large, bright white granular structure, as shown in Figure 12(a3). However, when the pitting holes of the #2 sample #2 alloy are magnified to 10,000 times, the corrosion products show a bright white reticular structure, with an obvious decarburization phenomenon, as shown in Figure 12(b3). EDS analysis detected a large amount of C and W elements, which, combined with the previous XRD inference, should be in the form of W2C, as confirmed by Mao et al. [12]. Many cracks can also be seen on the corroded surface, and cracks extend at the boundary between the hard phase and the bonding phase. Table 5 presents the analysis data of the SEM-EDS technique on the composition of pitting holes of the FeCrNi/WC alloy after potentiostatic treatment. The analysis found that the main corrosion products of the #1 sample #1 alloy are FeO and a small amount of Fe3O4 [33]. In the #2 sample #2 alloy, the results show that, as the CTC-A increases, W oxide will appear, but there is still a small amount of Fe3O4 in the corrosion products, similar to the results in the literature [5].
In Figure 13(a1), many features of precipitation and pitting can be found on the corrosion surface of the alloy in sample #3. In Figure 13(b1,c1), discontinuous cracks and stripes are observed on the corrosion surface of the alloys in samples #4 and #5, with hemispherical pits being randomly distributed on the matrix [34]. Magnification reveals fragments and dispersed exfoliation, with matrix powder being loosely exposed on the corrosion surface. Hard phases are exposed at the bottom of the pits, indicating severe corrosion of the binder.
The influence of the WC particle morphology on the resulting corrosion product evolution was further elucidated through SEM-EDS analysis. As evidenced by the corrosion morphologies (Figure 13) and compositional data (Table 6) of samples #3~#5, composites with higher angular WC content exhibit accelerated degradation. This deterioration stems directly from the increased formation of multicomponent secondary carbides, which depletes the matrix’s Cr content. Such Cr depletion critically weakens the passive film’s synergistic protection, enhancing its susceptibility to chloride penetration. Consequently, the compromised passive film undergoes premature rupture in chloride-rich environments, which leads to preferential hydrolysis and the formation of hydroxides (e.g., Fe(OH)3, Ni(OH)2) as primary corrosion products.
After the electrochemical corrosion test in NaCl solution, the chemical states of Fe 2p and Cr 2p on the surface of the alloy were found to exhibit a variety of oxidation states by XPS spectral analysis, as shown in Figure 14. The Fe 2p spectra revealed the presence of metallic iron, iron oxide, iron hydroxide, and triiron tetraoxide, which indicated that the alloys underwent significant corrosion reactions. The specific gravity of the corrosion product Fe2O3 showed a decreasing and then increasing trend as the content of angular tungsten carbide in the composites varied, with the highest specific gravity being observed in sample #2 and the lowest in sample #3. The Cr 2p spectra, on the other hand, showed significant contents of Cr2O3 and Cr(OH)3, suggesting that the formation of passivation film is a universal phenomenon that helps to prevent further corrosion. Combining the results of the XPS and electrochemical experiments, it can be determined that the formation of passivation film (mainly Cr2O3), the microstructure of the material (WC particles and Cr phase), and the microcell effect together affect the corrosion behavior of the alloys, where the chemical stability of the WC particles contributes to the resistance to corrosion, while the M7C3 phase may induce localized pitting.

3.3.5. The Effect of the Addition of CTC-A on the Corrosion Mechanism of the Alloy

In the process of electrochemical corrosion, the interaction between the alloy and corrosive medium is a complex and dynamic process. The anodic and cathodic reactions of the electrochemical corrosion in this experiment are as follows:
Anodes :                                       C r C r 3 + + 3 e
2 C r 3 + + 3 H 2 O C r 2 O 3 + 6 H +
Cathodes :                                 O 2 + H 2 O + 4 e 4 O H
F e 3 + + 3 O H F e ( O H ) 3
Etched   holes :           F e 3 + + 3 H 2 O F e ( O H ) 3 + 3 H +
Combining the corrosion experiment results of FeCrNi/WC alloys with different CTC-S and CTC-A contents in 3.5 wt.% NaCl solution at 25 °C, the electrochemical corrosion mechanism is analyzed as shown in Figure 15:
(1)
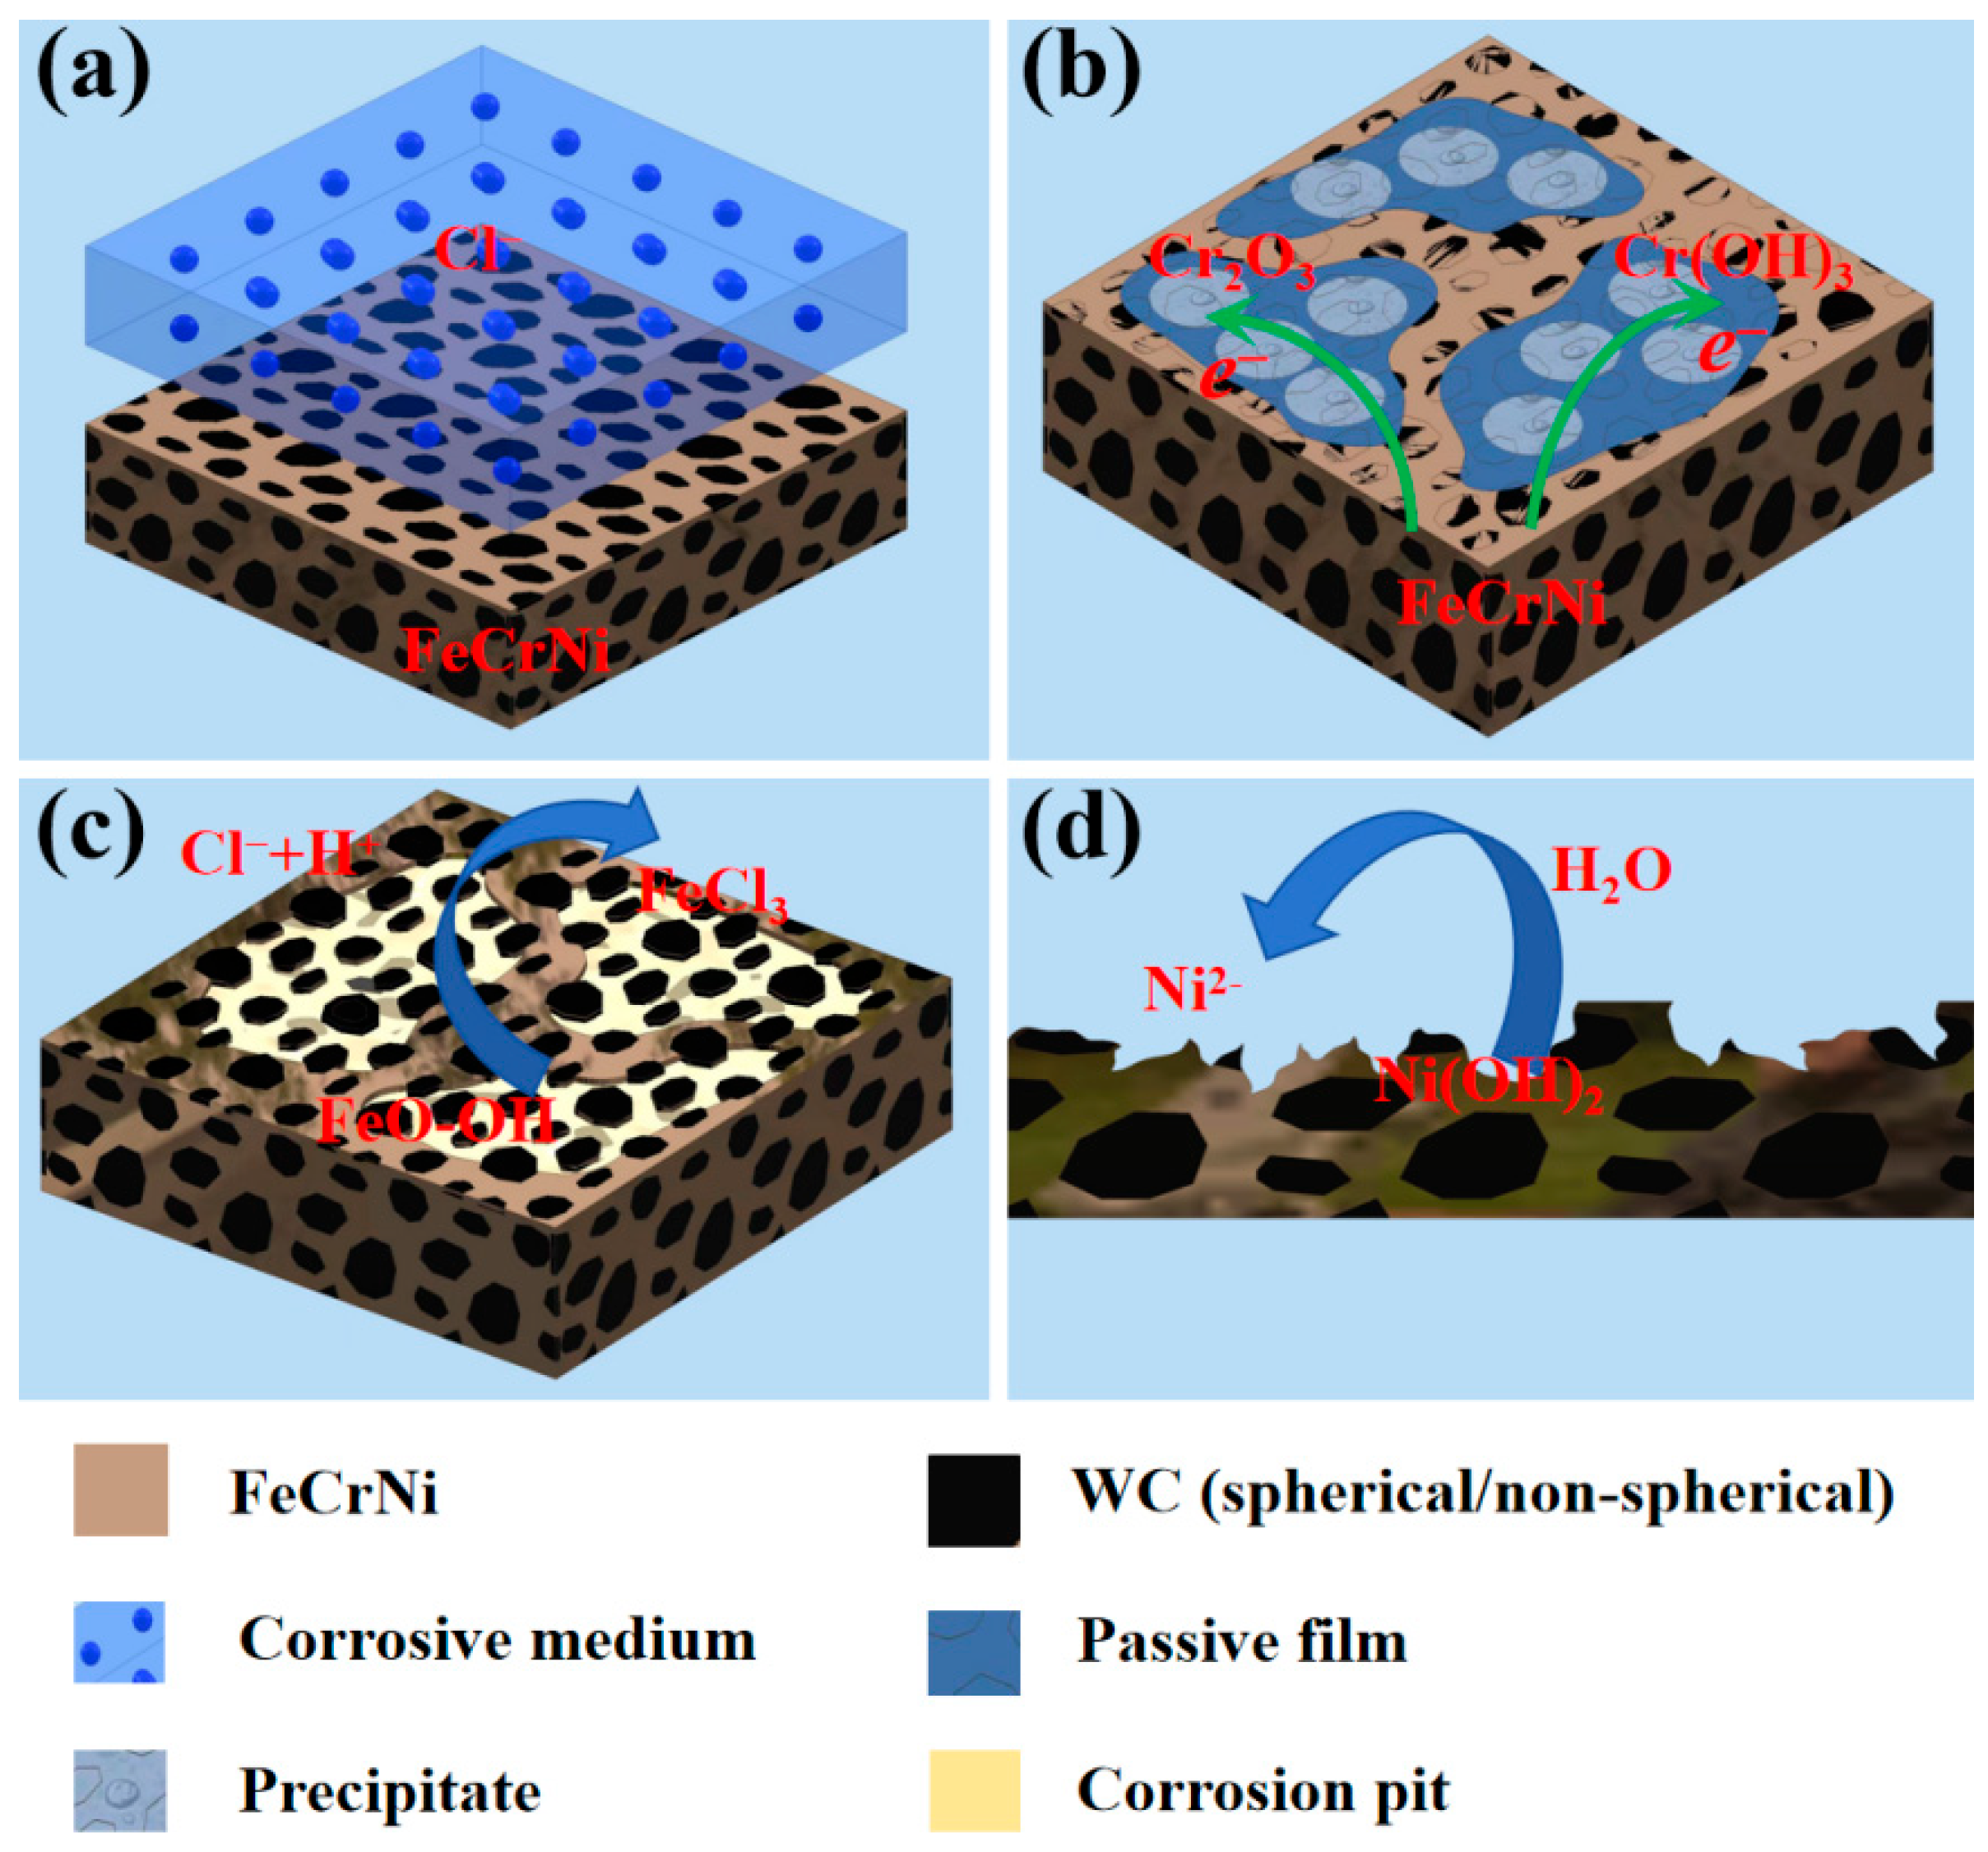
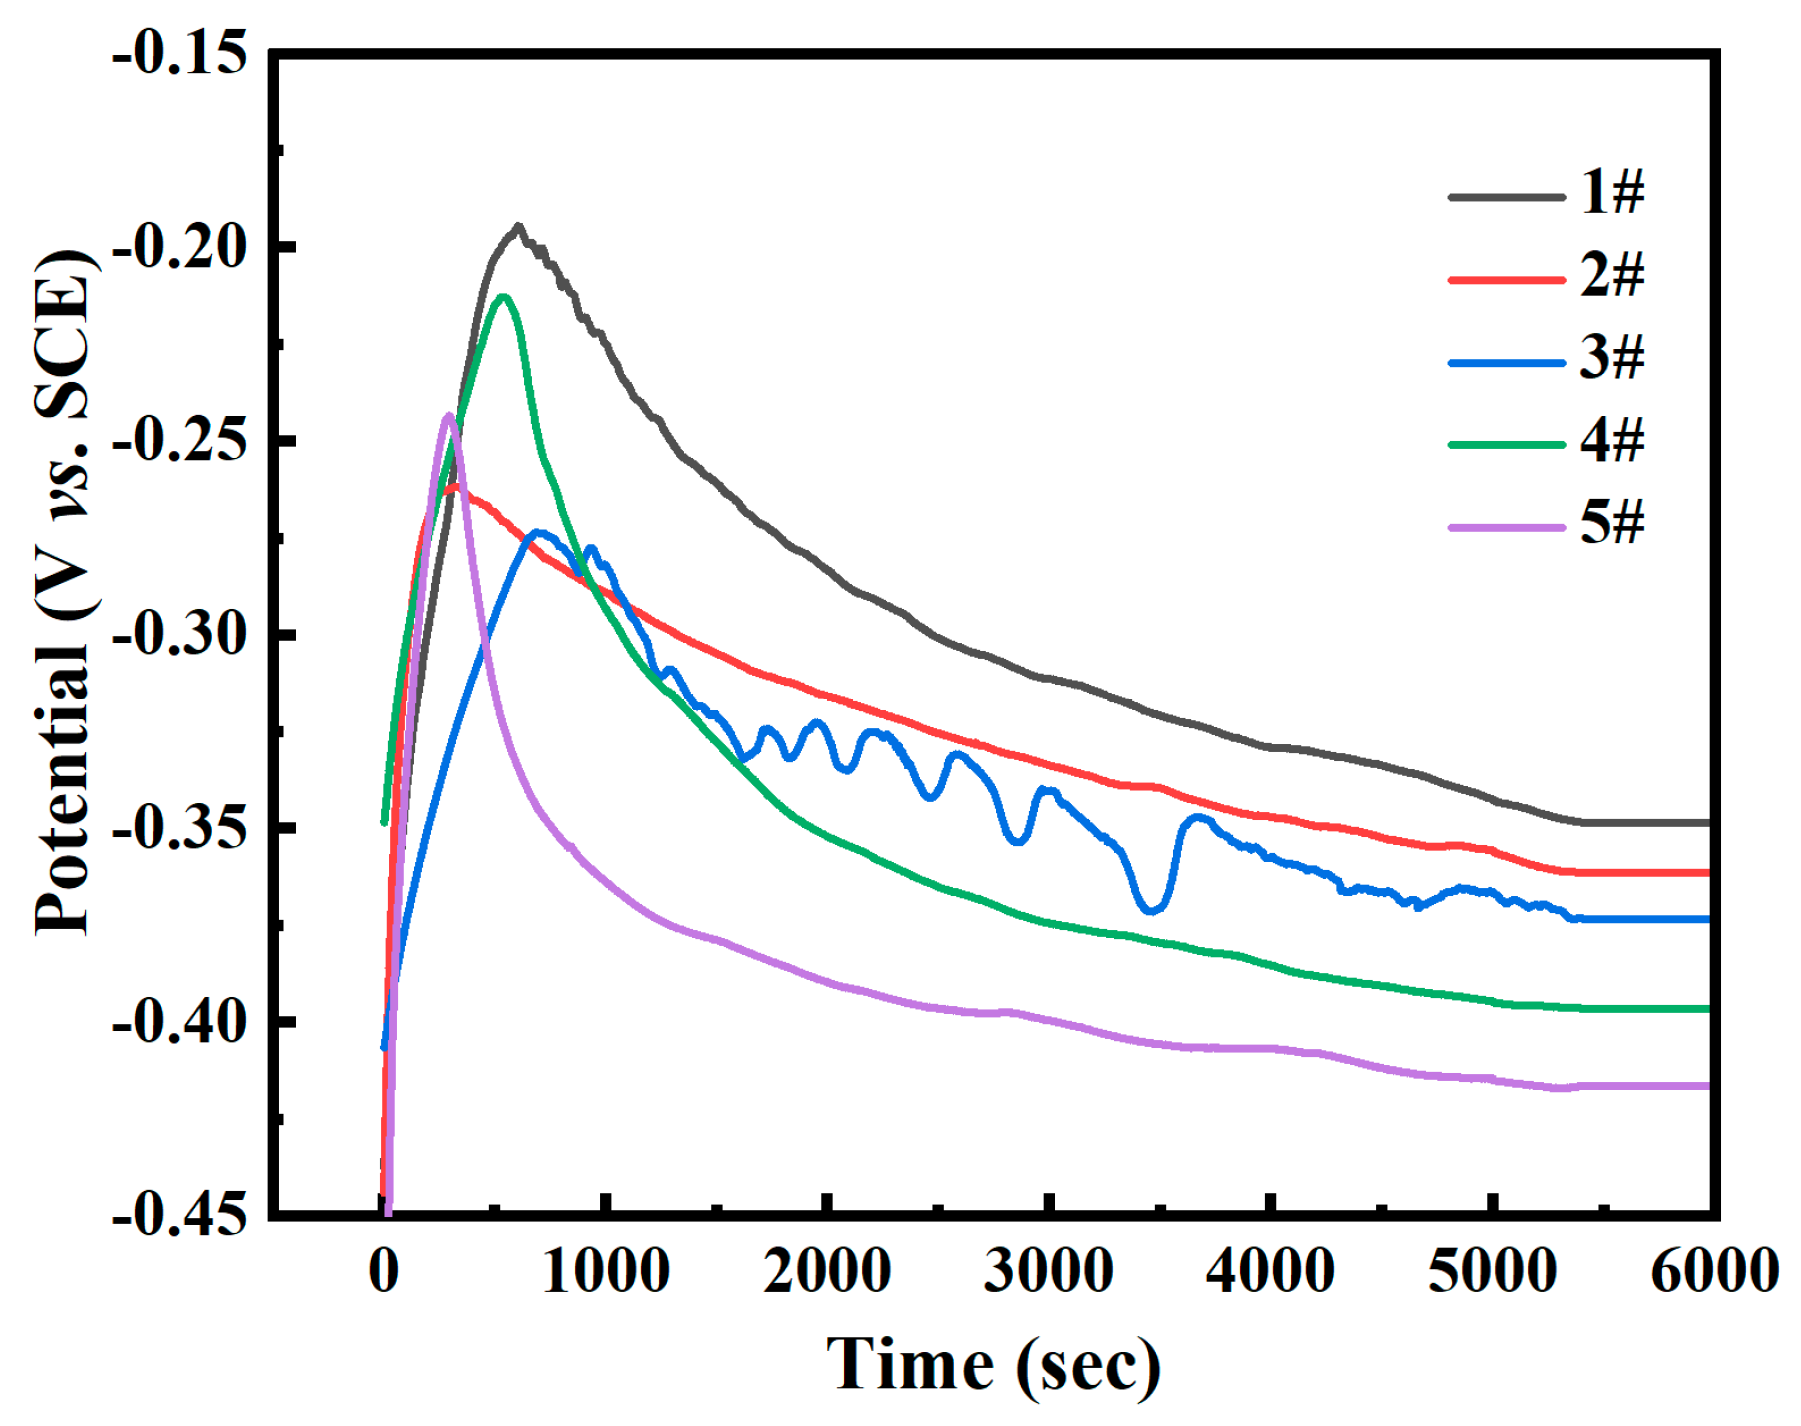
Passivation film formation stage (<500 s): The open-circuit potential rapidly shifts positively (Figure 8), driven by the preferential oxidation of Cr to Cr3+ in the FeCrNi matrix that forms initial Cr2O3 clusters (Figure 15). A high spherical WC content (sample #1: 40% CTC-S) accelerates dense film formation through its smooth surface and high dispersibility (lowest porosity ~1%, Table 3), as evidenced by the XPS showing 38% Cr3+ enrichment. This enables potential stabilization within ~5000 s (Figure 8) with the most noble Eoc (−0.348 V, Table 3). In contrast, a high angular WC (sample #5: 40% CTC-A) increases the porosity (~3%), while M7C3 carbides consume matrix Cr (XPS-confirmed Cr depletion), delaying stabilization (>5400 s) with the most active Eoc (−0.416 V, Table 3);
(2)
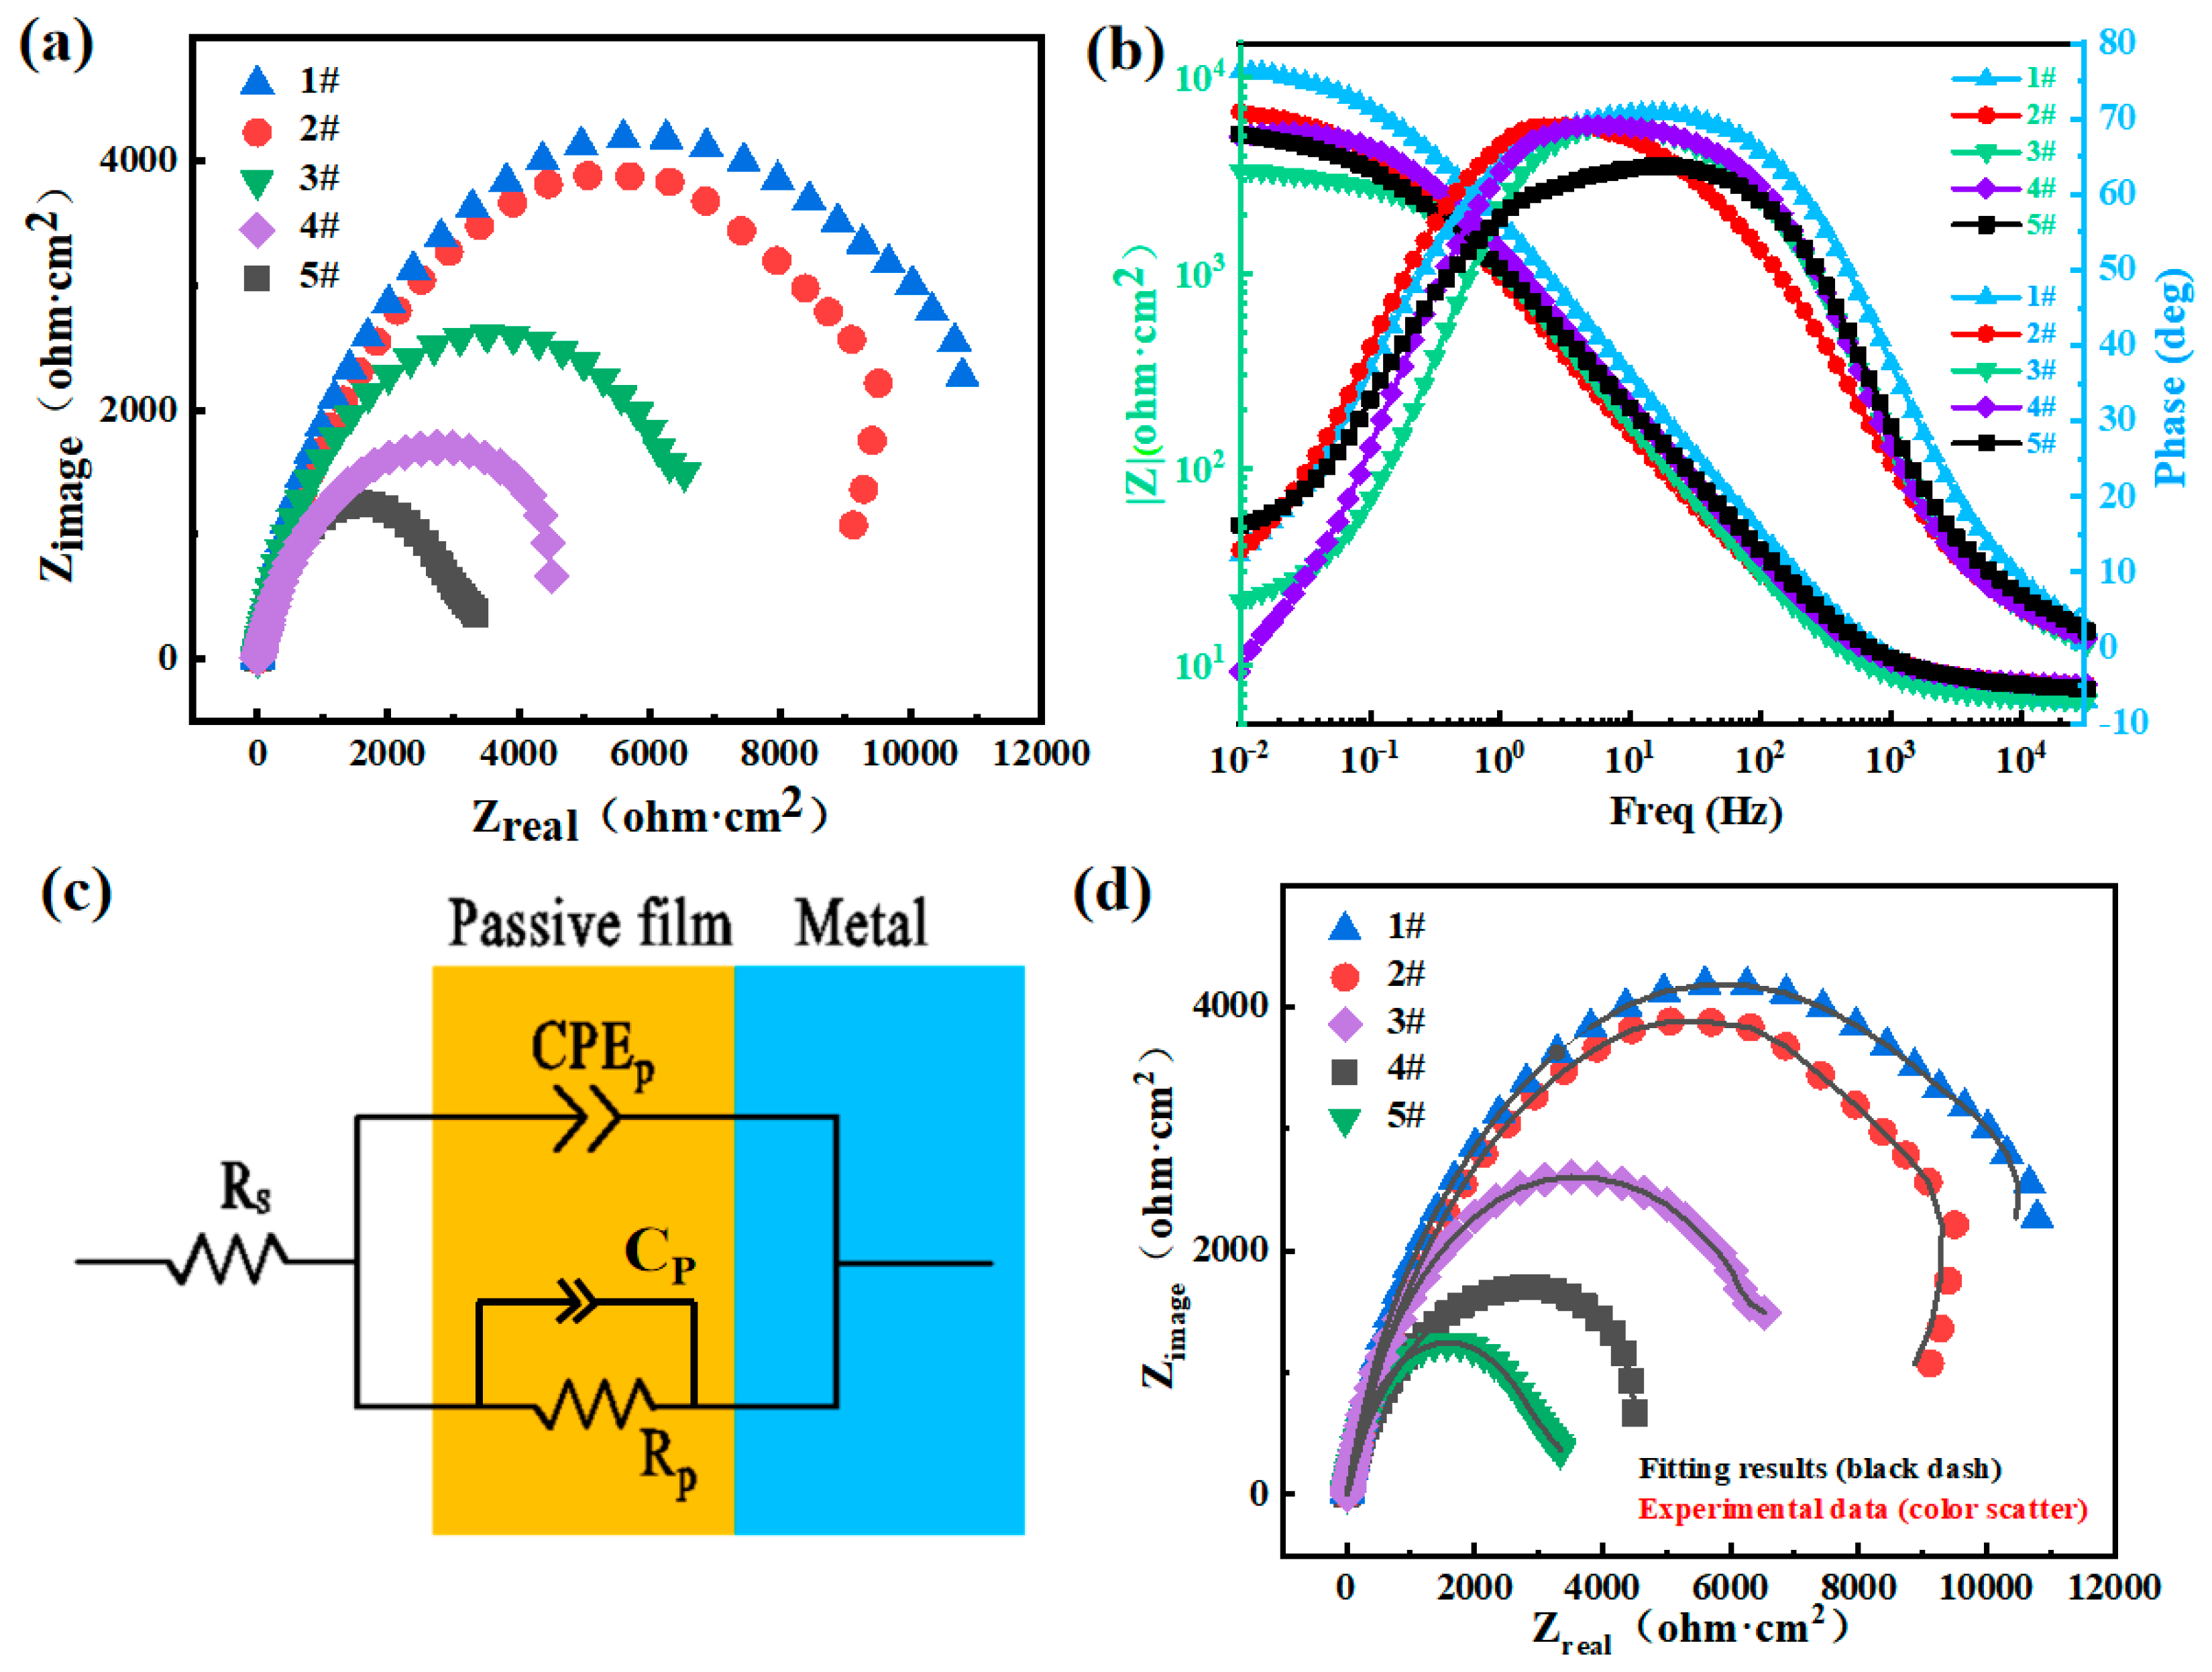
Passivation film stabilization stage: The Cr2O3 film functions as a charge-transfer barrier (Figure 10c equivalent circuit). sample #1 (40% spherical WC) exhibits superior film continuity (CPEα = 0.912, Table 4), yielding maximum charge-transfer resistance (Rp = 11.22 kΩ·cm2, Table 4) that suppresses the corrosion current (icorr = 0.152 μA·cm−2, Table 3) and Cl penetration. sample #5 (40% angular WC) shows a degraded film integrity (CPEα = 0.828, Table 4) with minimal Rp (5.15 kΩ·cm2, Table 4), while microgalvanic cells (WC/matrix and M7C3/matrix) accelerate the charge transfer, increasing icorr to 1.120 μA·cm−2 (Table 3);
(3)
Passivation film dissolution stage: Under anodic polarization (Figure 9), sample #1’s Cr-rich film demonstrates exceptional dissolution resistance with a wide passive region (−300 to −200 mV) and minimal passive current density (ipass = 2.01 × 10⁻⁴ μA·cm−2, Table 3). Conversely, sample #5’s defective film dissolves readily, exhibiting disappearing passive region characteristics and current density surge (0.764 → 1.120 μA·cm−2 at 30 → 40% angular WC, Table 3), which is accompanied by severe surface spalling (Figure 13(c1,c2));
(4)
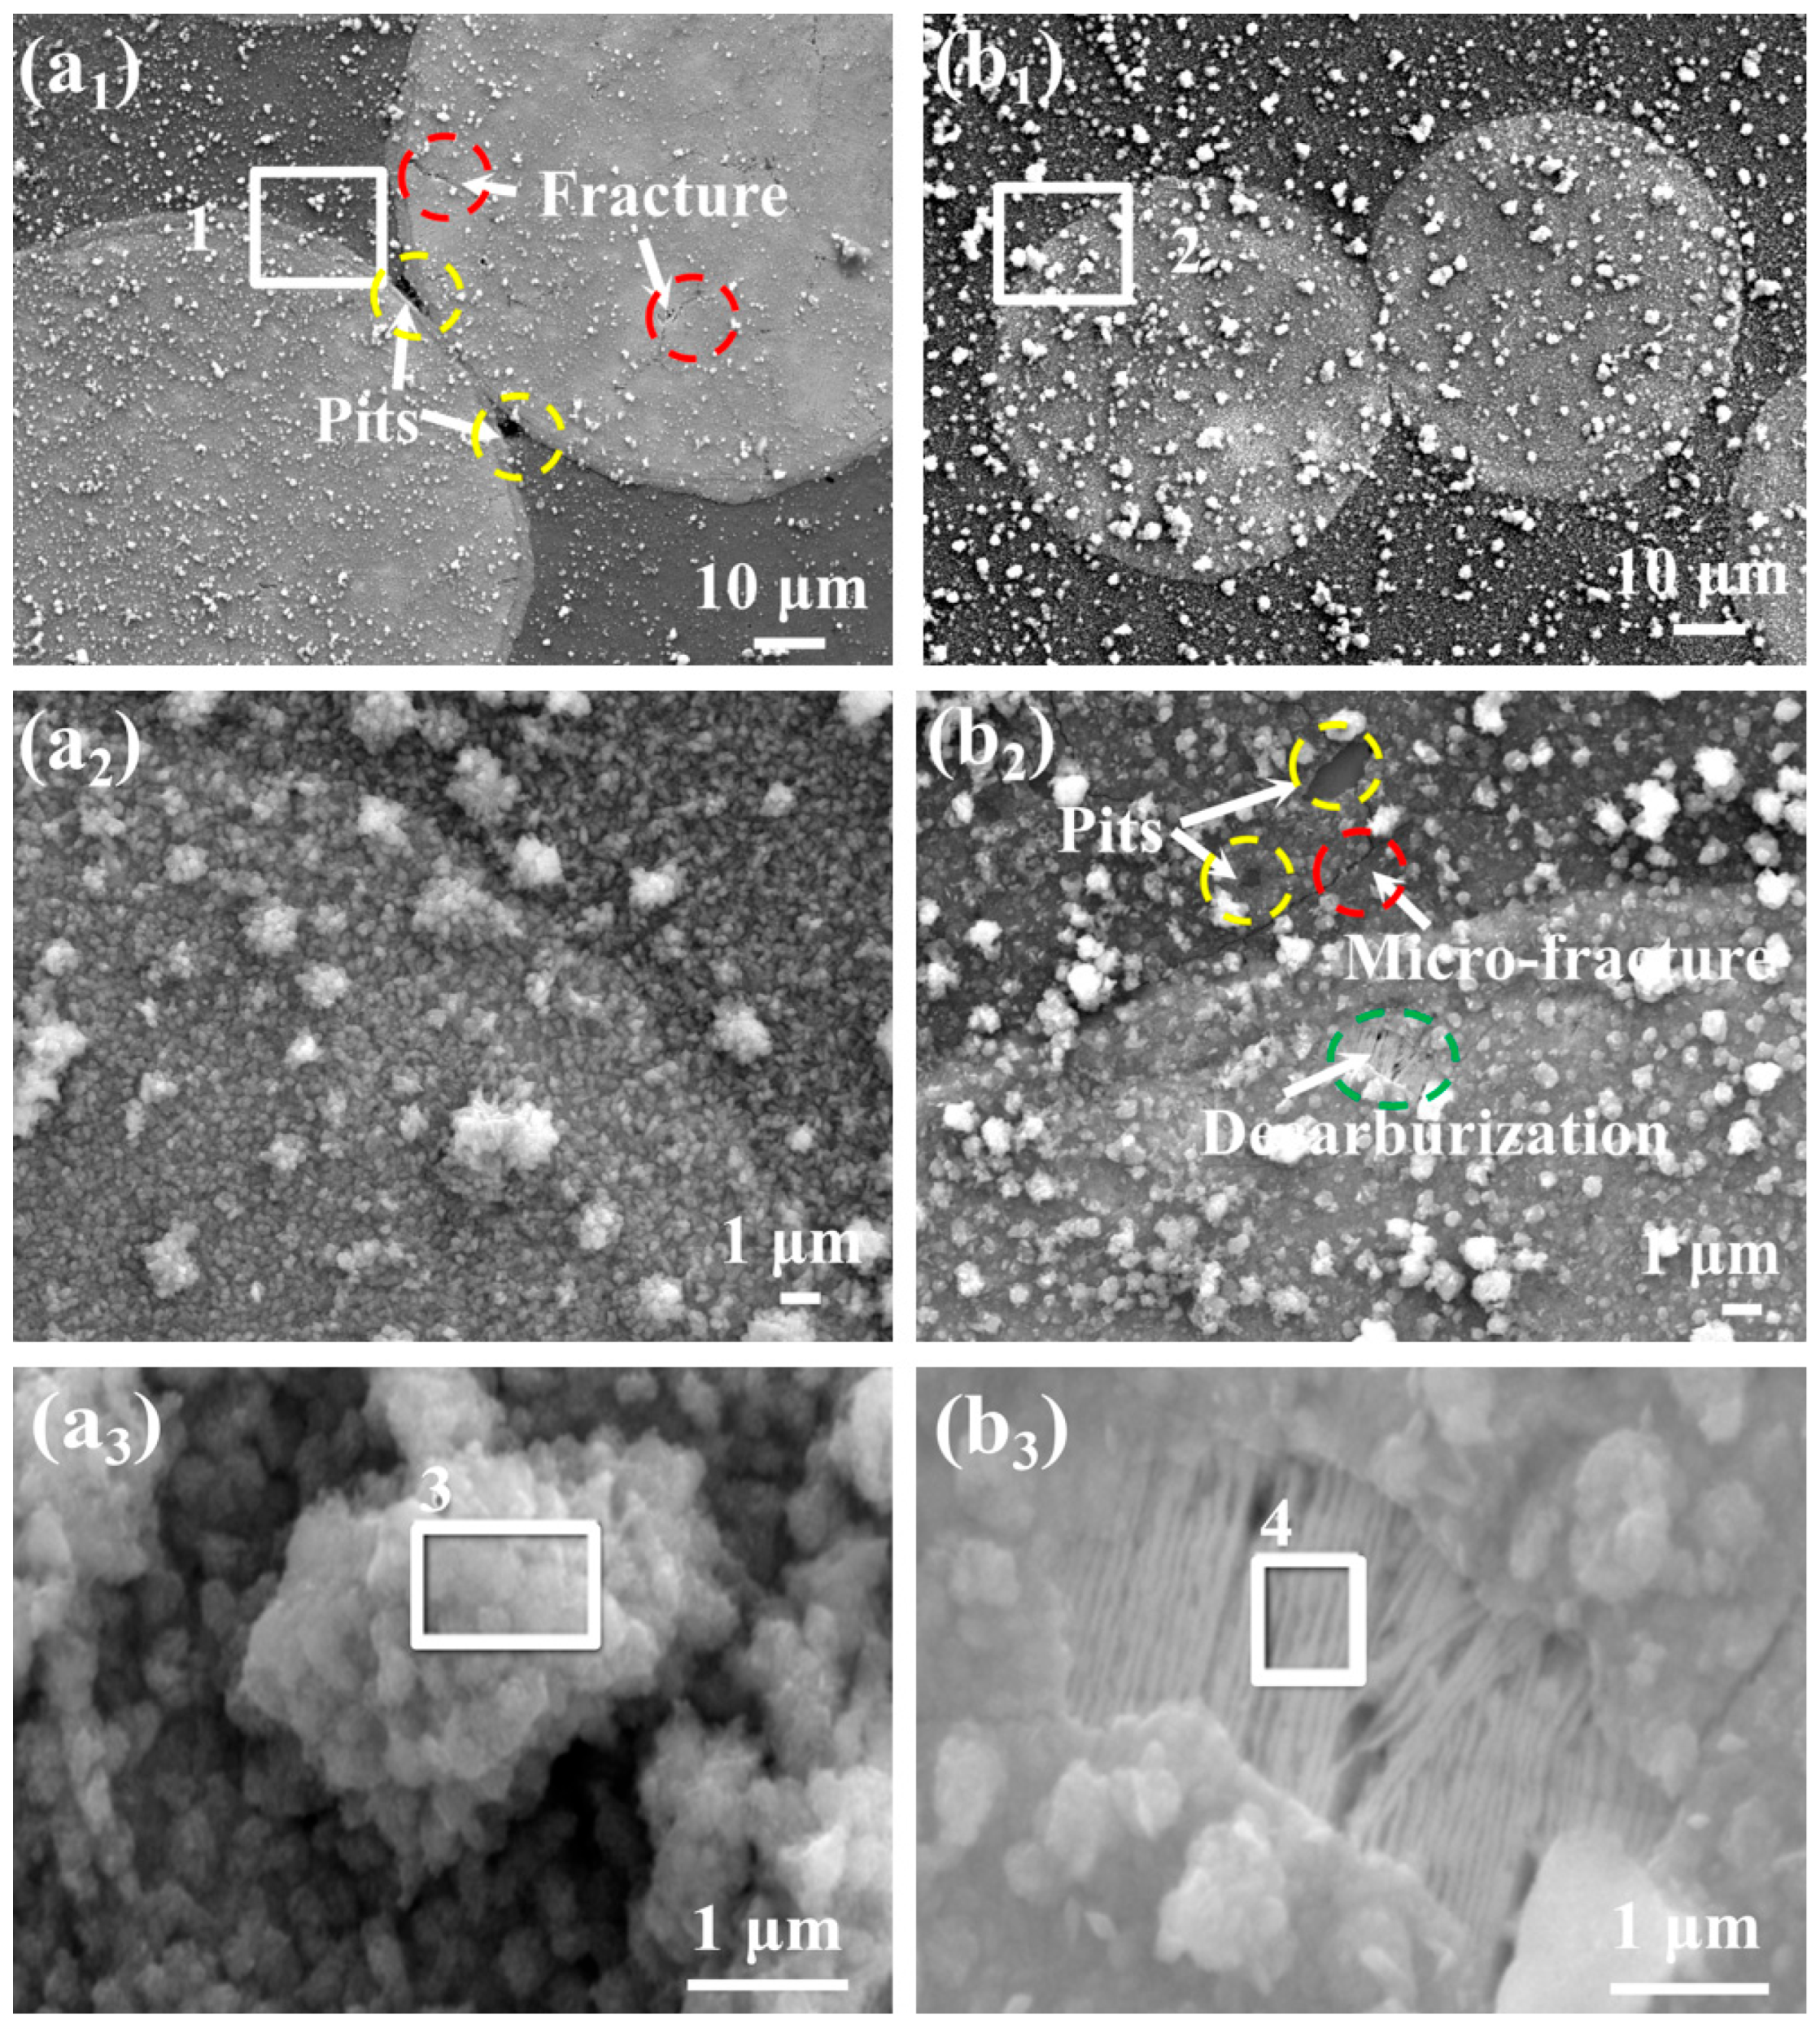
Passivation film breakdown stage: sample #1’s uniform film withstands transpassive dissolution (>−50 mV, Figure 9) with limited pitting (Figure 12(a1–a3)). sample #5’s angular WC triggers catastrophic failure: stress concentration at sharp corners initiates microcrack propagation along interfaces (Figure 13(c2)), while M7C3/matrix galvanic corrosion drives explosive pitting (Figure 13(c2) pits), which manifests as a current surge at low potentials (−0.05 V, Figure 9). This culminates in rapid material degradation through interconnected failure mechanisms.
Figure 15. Electrochemical corrosion mechanism: a schematic diagram illustrating the processes of formation (a), stabilization (b), dissolution (c), and rupture (d) of the passivation film.
Metals 15 00777 g015
Based on the above analysis, the electrochemical corrosion mechanism of FeCrNi/WC alloys with different CTC-S and CTC-A contents in a corrosive environment can be summarized as follows: the alloy surface forms a passivation film to resist corrosion, while the hard phase and WC particles provide additional physical barriers and solute strengthening effects to delay the breakdown of the passivation film and the occurrence of corrosion. The excessive dissolution of tungsten carbide can easily cause decarburization, which can form corrosion holes, craters, and cracks.
This work delivers three fundamental breakthroughs:
(1)
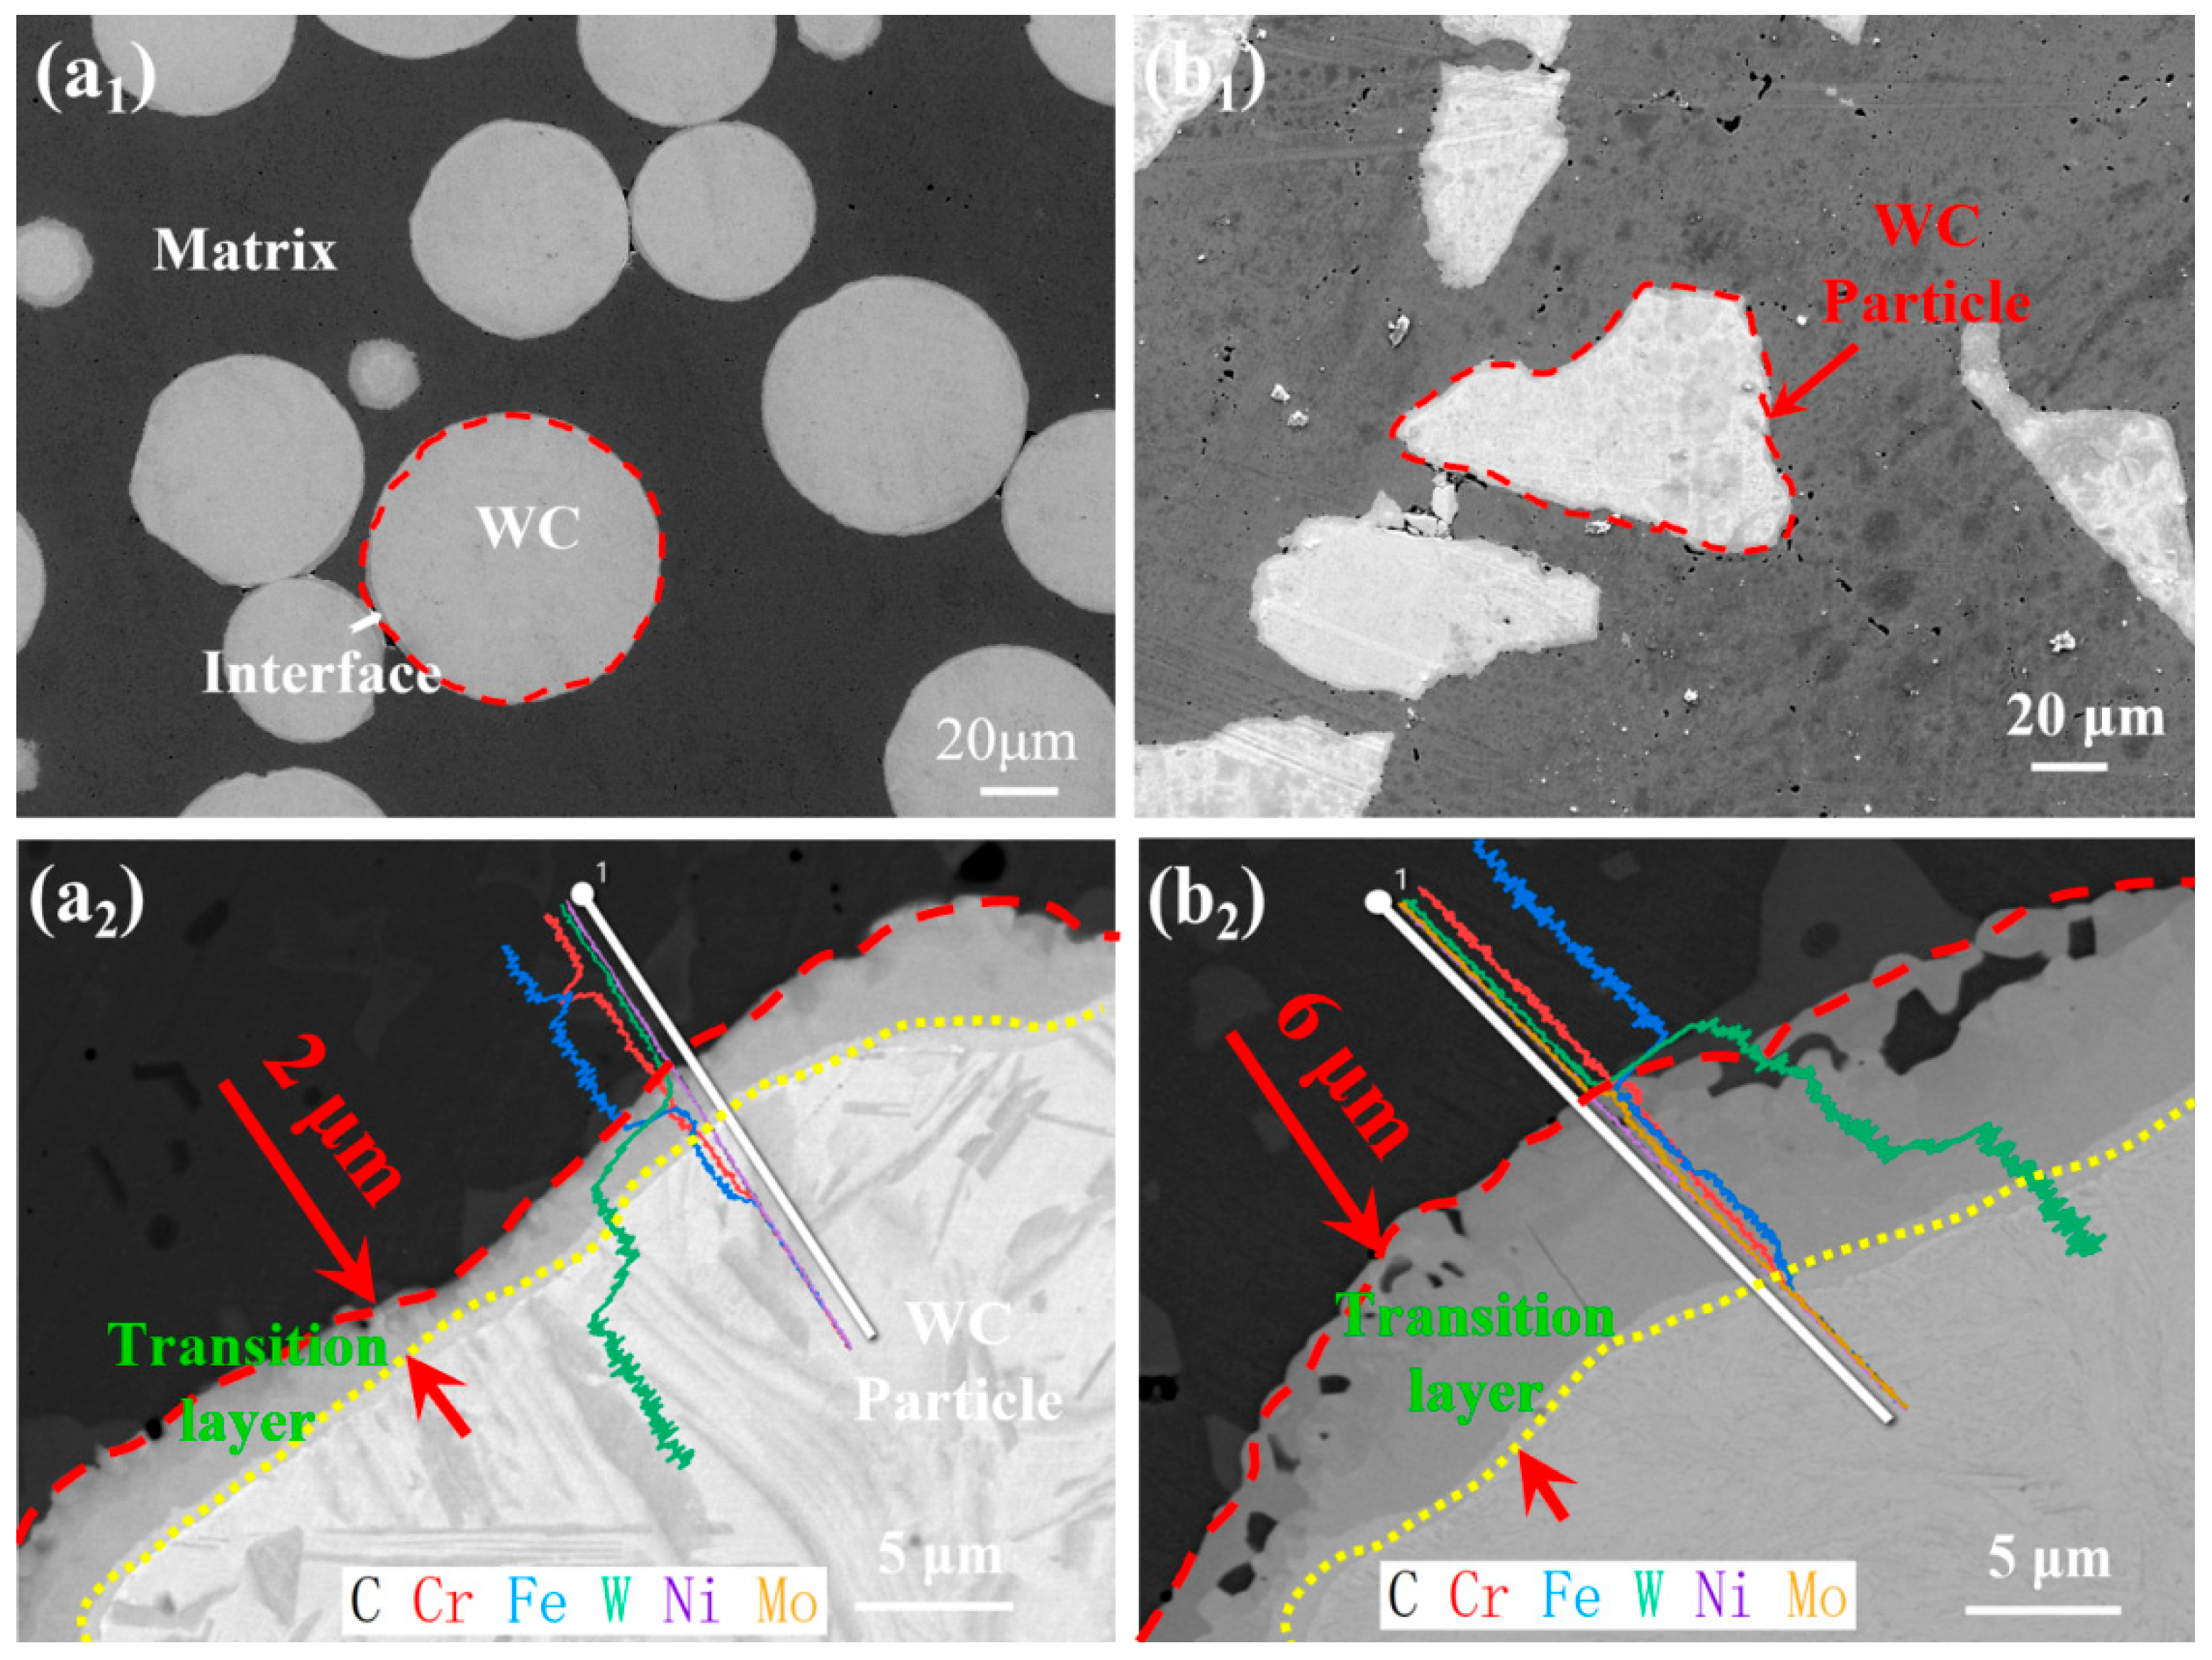
The first mechanistic proof that angular WC’s corner dissolution (Figure 4b) triggers carbon-mediated Cr depletion at interfaces, reducing the passive film stability by 70.7% when exceeding 10 vol% (Rp drop: 11.42 → 3.35 kΩ·cm2, Table 5). This resolves long-standing debates on morphology-corrosion decoupling [5,10];
(2)
The discovery of an optimal hybrid architecture (30% spherical + 10% angular WC) that enables unprecedented synergy—62% lower pitting propagation than monomorphic systems (Figure 9) with retained peak fracture toughness (15.8 MPa·m1/2)—and surpasses all reported WC/FeCrNi composites [2,12];
(3)
The atomic-scale validation of electric-field-assisted Fe3W3C orientation control during SPS (Figure 6d), which establishes a new paradigm for the interface engineering of marine materials through diffusion barrier manipulation (2.5 → 5.0 μm, Figure 5).

4. Conclusions

This study aims to investigate the electrochemical corrosion behavior and mechanism of FeCrNi/WC alloys with different CTC-S and CTC-A contents in a 3.5 wt.% NaCl solution at 25 °C. The following main conclusions were obtained:
(1)
The open-circuit potential shows a decreasing trend with increases in the angular WC content. When the proportion of angular WC was increased from 0% to 40%, the open-circuit potential gradually decreased from −0.348 V (40% spherical WC for #1 sample) to −0.416 V (40% angular WC for #5 sample). This indicates that spherical WC shows good corrosion resistance by reducing the porosity and decreasing the contact area between the matrix and corrosive liquid;
(2)
The kinetic potential polarization test shows that there is a significant WC enhanced phase morphology dependence of the anodic process. When the content of angular WC was increased from 0% to 40%, the corrosion potential gradually decreased from −0.332 V to −0.431 V, and the corrosion current increased from 0.152 μA·cm−2 to 1.120 μA·cm−2, which indicated that the sharp edges of the angular WC might trigger localized pitting corrosion that leads to the deterioration of the passivation film. In turn this reduces the corrosion resistance of the composites;
(3)
EIS analysis showed a negative correlation between the passivation film resistance (Rp) and the content of angular WC, with the Rp reaching 11.42 kΩ·cm2 for sample #1 and decreasing to 3.35 kΩ·cm2 for sample #5 (a decrease of 70.7%). XPS confirmed that the spherical WC promotes the enrichment of Cr3+ (up to 38% of Cr2O3 for sample #1), and the proportion of FeO -OH reached 28.5%, leading to a decrease in the self-repairing ability of the passivation film and the deterioration of its material corrosion performance;
(4)
Future research guidelines: Based on the limitations identified in this study, two critical research directions are proposed: 1. Long-term corrosion behavior validation in simulated marine environments with synergistic erosion (sand particle concentration: 1–5 g/L) and microbial activity (SRB density: 104–106 cells/mL) to assess real-world durability. 2. High-temperature synchrotron XRD monitoring (20–1300 °C) of carbide transformation kinetics during SPS to establish time–temperature–transformation diagrams with the aim of achieving optimized phase control.

Author Contributions

Conceptualization, X.Z., R.W. and Y.L.; methodology, R.W. and Y.L.; software, X.T.; validation, X.T. and Y.L.; formal analysis, R.W. and X.Z.; writing—original draft preparation, X.T. and X.Z.; writing—review and editing, R.W., X.T. and Y.L.; funding acquisition: Y.L. All authors have read and agreed to the published version of the manuscript.

Funding

This work was supported by the Chongqing Natural Science Foundation (Grant No. cstc2021jcyj-msxmX1206). Additional support was provided by the Science and Technology Project of Chongqing Municipal Education Commission (KJQN202102601), (KJQN202302602), (KJQN202402613).

Data Availability Statement

The original contributions presented in this study are included in the article. Further inquiries can be directed to the corresponding author.

Conflicts of Interest

The authors declare no conflict of interest.

References

  1. Zhang, S.; Cao, Y.; Wang, P.; Jin, J.; Deng, L. Evolution of the corrosion layer of Q235 steel in simulated fire-scene smoke. Fire Mater. 2023, 48, 155–165. [Google Scholar] [CrossRef]
  2. Nie, J.; Wei, L.; Jiang, Y.; Li, Q.; Luo, H. Corrosion mechanism of additively manufactured 316L stainless steel in 3.5 wt.% NaCl solution. Mater. Today Commun. 2021, 26, 145–162. [Google Scholar] [CrossRef]
  3. ArunKumar, V.; Prakash, N.; Deenadayalan, K. Comparison between the spherical and angular type WC particles reinforced in Nickel-based matrix deposited using Plasma Transferred Arc Welding process. Mater. Today Proc. 2023, 11, 1–10. [Google Scholar] [CrossRef]
  4. Moreira, A.B.; Ribeiro, L.M.M.; Lacerda, P.; Vieira, M.F. Characterization of iron-matrix composites reinforced by in situ TiC and exsitu WC fabricated by casting. Metals 2021, 11, 862. [Google Scholar] [CrossRef]
  5. Dai, Z.X.; Jiang, S.L.; Ning, L.K.; Xu, X.D.; Li, S.; Duan, D.L. Effect of friction on corrosion behaviors of AISI 304 and Cr26Mo1 stainless steels in different solutions. J. Iron Steel Res. Int. 2023, 30, 2541–2556. [Google Scholar] [CrossRef]
  6. Dang, Z.; Qin, G.; Lin, R. A comprehensive study of interfacial microstructure and corrosion behavior of AA2219 to 304SS inertia friction welded joints. Corros. Sci. 2023, 224, 111539. [Google Scholar] [CrossRef]
  7. Peng, Y.; Li, T.; Long, J.; Li, H.; Lu, B.; Chen, F.; Du, Y. Effect of bimodal WC particle size and binder composition on the morphology of WC grains in WC–Co–Ni3Al cemented carbides. J. Mater. Res. Technol. 2021, 12, 1747–1754. [Google Scholar] [CrossRef]
  8. Iribecampos, M.; Ulacia, I.; Arana, A.; Larrañaga, J. The combined effect of contact interface size and spin on lubricated traction in rolling-sliding point contacts. Tribol. Int. 2023, 188, 108822. [Google Scholar] [CrossRef]
  9. Liu, L.; Zhang, K.; Wang, Y. Baffle effect of exposed WC particles in the clearance on slurry erosion behavior of cemented carbide surface. Mater. Today Commun. 2024, 39, 109071. [Google Scholar] [CrossRef]
  10. Liu, X.; Sheng, X.; Yao, Q.; Zhao, L.; Xu, Z.; Zhou, Y. Synthesis of a new type of 2-phosphonobutane-1, 2, 4-tricarboxylic-acid-modified terpolymer scale inhibitor and its application in the oil field. Energy Fuels 2021, 35, 6136–6143. [Google Scholar] [CrossRef]
  11. Gad, S.I.; Attia, M.A.; Hassan, M.A.; El-Shafei, A.G. A random microstructure-based model to study the effect of the shape of reinforcement particles on the damage of elastoplastic particulate metal matrix composites. Ceram. Int. 2021, 47, 3444–3461. [Google Scholar] [CrossRef]
  12. Mao, L.; Cai, M.; Liu, Q.; Han, L. Effects of spherical WC powders on the erosion behavior of WC-Ni hardfacing used for steel body drill bit. Surf. Coat. Technol. 2021, 409, 126893–126907. [Google Scholar] [CrossRef]
  13. Wang, B.; Wang, Z.; Yin, Z.; Xu, W.; Jiang, L.; Yuan, J. Ultrafine WC-Co cemented carbide end mills prepared by spark plasma sintering and wear mechanism in milling of AISI H13. Int. J. Appl. Ceram. Technol. 2024, 21, 2553–2566. [Google Scholar] [CrossRef]
  14. Li, W.; Di, R.; Yuan, R.; Song, H.; Lei, J. Microstructure, wear resistance and electrochemical properties of spherical/angular WC reinforced Inconel 625 superalloy by laser melting deposition. J. Manuf. Process. 2022, 74, 413–422. [Google Scholar] [CrossRef]
  15. An, X.; Zhang, H.; Zhang, D.; Zhu, J.; Wang, Q.; Zhu, T.; Shi, Y.; Cao, X.; Deng, H.; Hu, W.; et al. Mechanisms of hydrogen embrittlement resistances in FCC concentrated solid solution alloys. Corros. Sci. 2024, 229, 111894. [Google Scholar] [CrossRef]
  16. Lü, Z.; Ding, G.; Liu, M.; Yu, S.; Gao, C. Improved separation performance, anti-fouling property and durability of polyamide-based RO membrane by constructing a polyvinyl alcohol/polyquaternium-10 surface coating layer. Desalination 2023, 564, 116755. [Google Scholar] [CrossRef]
  17. Yu, Z.; Hu, J.; Liu, G.; Liu, Y.; Chang, S.; Rodrigue, D.; Wang, X. Micronleaf-shape graphene interfaces on wood transverse sections as advanced photothermal evaporators for water purification. J. Mater. Sci. Technol. 2024, 193, 81–89. [Google Scholar] [CrossRef]
  18. Zhang, X.; Zhang, S.; Tang, Y.; Huang, X.; Pang, H. Recent advances and challenges of metal–organic framework/graphene-based composites. Compos. Part B Eng. 2022, 230, 109532. [Google Scholar] [CrossRef]
  19. Weiser, M.; Olszta, M.J.; Engelhard, M.H.; Zhu, Z.; Schreiber, D.K. Visualizing oxygen transport pathways during intergranular oxidation in Ni-Cr. Npj Mater. Degrad. 2023, 7, 70. [Google Scholar] [CrossRef]
  20. Xie, Y.; Miyamoto, G.; Furuhara, T. High-throughput investigation of Cr-N cluster formation in Fe-35Ni-Cr system during low-temperature nitriding. Acta Mater. 2023, 253, 118921. [Google Scholar] [CrossRef]
  21. Zhao, J.; Wu, Y.; Liu, C.; Zhang, B.; Gao, Y. Enzyme-inspired molecular electrocatalysts for the oxygen reduction reaction. Electrochim. Acta 2024, 479, 143891. [Google Scholar] [CrossRef]
  22. Cai, X.; Xu, Y.; Liu, M.; Cao, B.; Li, X. Characterization of iron-based surface multilayer-structured tungsten carbide composite layers by EBSD and FIB/TEM. Surf. Coat. Technol. 2020, 403, 126365–126376. [Google Scholar] [CrossRef]
  23. ASTM E2655-14; Standard Guide for Reporting Uncertainty of Test Results and Use of the Term Measurement Uncertainty in ASTM Test Methods. ASTM International: West Conshohocken, PA, USA, 2024.
  24. Liu, M.; Liu, B.; Ni, Z.; Du, C.; Li, X. Elucidating the effect of titanium alloying on the pitting corrosion of ferritic stainless steel. J. Mater. Res. Technol. 2024, 28, 1247–1262. [Google Scholar] [CrossRef]
  25. Yu, R.; Bai, X.; Yu, X.; Zhang, H. WC-reinforced iron matrix composites fabricated by wire arc additive manufacturing combined with gravity-driven powder feeding: Particle transportation and size effects. Rapid Prototyp. J. 2022, 542, 1014–1028. [Google Scholar] [CrossRef]
  26. Choudhary, S.; Cruz, V.; Pandey, A.; Thomas, S.; Birbilis, N. Element-resolved electrochemical analysis of the passivity of additively manufactured stainless steel 316L. Corros. Sci. 2021, 189, 109576–109585. [Google Scholar] [CrossRef]
  27. Zhang, Q.; Hao, L.; Chen, W.; Huang, Y.; Xu, Y. Understanding the effect of cathodic reaction on corrosion-enhanced erosion in sand-entraining electrolyte. J. Mater. Sci. Technol. 2025, 209, 103–116. [Google Scholar] [CrossRef]
  28. Xu, D.; Zhang, X.; He, X.; Liu, C.; Liu, Z.; Zhang, X.; Zhao, M.; Li, X. Mechanism and evaluation method of stress corrosion susceptibility of 904L stainless steel with optimized structure in seawater. Corros. Sci. 2024, 229, 181–192. [Google Scholar] [CrossRef]
  29. Ye, Y.; Guo, Z.; Zhou, Z.; Zhang, B.; Wang, Q.; Shen, B. Improved corrosion and corrosion-wear properties of Fe-based high-entropy amorphous coatings by modulating heat input of HVAF. Corros. Sci. 2024, 232, 577–587. [Google Scholar] [CrossRef]
  30. Peng, Y.; Zhang, W.; Li, T.; Zhang, M.; Liu, B.; Liu, Y.; Wang, L.; Hu, S. Effect of WC content on microstructures and mechanical properties of FeCoCrNi high-entropy alloy/WC composite coatings by plasma cladding. Surf. Coat. Technol. 2020, 385, 125326–125336. [Google Scholar] [CrossRef]
  31. Xu, Y.; Zhang, Q.; Zhou, Q.; Gao, S.; Wang, B.; Wang, X.; Huang, Y. Flow accelerated corrosion and erosion−corrosion behavior of marine carbon steel in natural seawater. Mater. Degrad. 2021, 5, 784–793. [Google Scholar] [CrossRef]
  32. Li, N.; Wang, B.; Liu, T.; Liu, C.; Che, Z.; Chen, T.; Li, Q.; Li, Z.; Wang, L.; Cheng, X.; et al. Revealing the coupling of multiple corrosion behaviors in the corrosion process of titanium-steel composites in marine environment. Corros. Sci. 2024, 233, 784–793. [Google Scholar] [CrossRef]
  33. Ko, G.; Kim, W.; Kwon, K.; Lee, T.-K. The corrosion of stainless steel made by additive manufacturing: A review. Metals 2021, 11, 516. [Google Scholar] [CrossRef]
  34. Zhang, H.; Liu, Y.; Bai, X.; Zhao, W.; Zhang, P.; Rao, W.-F. Laser cladding highly corrosion-resistant nano/submicron ultrafine-grained Fe-based composite layers. Surf. Coat. Technol. 2021, 424, 424–433. [Google Scholar] [CrossRef]
Figure 1. Raw material powders: (a) SEM image of FeCrNi powder; (b) SEM image of spherical WC; (c) SEM image of angular WC.
Metals 15 00777 g001
Figure 2. Microscopic morphology of ball-milled mixed powders.
Metals 15 00777 g002
Figure 3. XRD analysis: (a) WC raw materials; (b) different proportions of angular WC sintered alloys.
Metals 15 00777 g003
Figure 4. BSE analysis: (a1) CTC-S sintered alloys; (a2) partial enlarged drawing of CTC-S sintered alloys; (b1) CTC-A sintered alloys; (b2) partial enlarged drawing of CTC-A sintered alloys.
Metals 15 00777 g004
Figure 5. Electron probe microregion analysis of the particle reinforced phase interface of the #3 composite sample (20% spherical/20% angular WC): (a) SEM selection of position; (b) Element W (c) Element C (d) Fe element; (e) Cr element; (f) Ni element.
Metals 15 00777 g005
Figure 6. (a) BF-TEM image of the interface of the WC-reinforced particles and the FeCrNi matrix; (bd) elemental analysis, HRTEM image, and SAED image of the red boxed area in (a), respectively.
Metals 15 00777 g006
Figure 7. Effects of different ratios of spherical WC and angular WC-reinforced WC/FeCrNi composites properties:(a) Density (b) Hardness and toughness.
Metals 15 00777 g007
Figure 8. Evolution of OCP with corrosion time for FeCrNi/WC alloys with different CTC-S and CTC-A contents in 3.5 wt.% NaCl solution at 25 °C temperature.
Metals 15 00777 g008
Figure 9. Tafel curves of FeCrNi/WC alloys with different CTC-S and CTC-A contents after corrosion in 3.5 wt.% NaCl solution for 100 min at 25 °C temperature.
Metals 15 00777 g009
Figure 10. (a) Nyquist plots, (b) Bode plots, (c) equivalent circuit diagrams of impedance spectral analysis, and (d) fitting results of FeCrNi/WC alloys with different CTC-S and CTC-A contents after corrosion in 3.5 wt.% NaCl solution for 5000 s at a temperature of 25 °C. Rs, Rp, and CPEp are the solution resistance, the passivation film resistance, and the passivation film constant, respectively.
Metals 15 00777 g010
Figure 11. Relative thickness of passivated films.
Metals 15 00777 g011
Figure 12. Micrographs of surface corrosion at low (a1,b1) and high (a2,b2,a3,b3) levels of composite samples in NaCl solution: (a1a3) are #1 samples (40% spherical WC); (b1b3) are #2 samples (30% spherical/10% angular WC).
Metals 15 00777 g012
Figure 13. Micrographs of surface corrosion at low (a1c1) and high (a2c2) levels of composite samples in NaCl solution: (a1,a2) are #3 samples (20% spherical/20% angular WC); (b1,b2) are #4 samples (10% spherical/30% angular WC); (c1,c2) are #5 samples (40% angular WC).
Metals 15 00777 g013
Figure 14. XPS spectral analysis of electrochemically corroded surfaces in sodium chloride solution: (a) Fe 2p; (b) Cr 2p.
Metals 15 00777 g014
Table 1. Chemical composition of atomized feedstock powder (at.%).
ElementCFeCrNiSiMoBMn
Content0.4869.4217.133.202.790.695.860.42
Table 2. Sample number and sample design (wt.%).
Sample NumberCTC-S
(Spherical WC)
CTC-A
(Angular WC)
Fe-Based Alloy
#140060
#2301060
#3202060
#4103060
#504060
Table 3. Electrochemical data of open circuit potential and Tafel curves for FeCrNi/WC alloys with different CTC-S and CTC-A contents in 3.5 wt.% NaCl solution at 25 °C.
SampleEocβaβcjcorrEcorrjpass
Number(V vs. SCE)mV/DecademV/Decade(μA·cm−2)(V vs. SCE)(×10−4 μA·cm−2)
#1−0.34882.1120.80.152−0.3322.01
#2−0.36179.4135.40.213−0.3511.34
#3−0.37375.2115.30.423−0.375
#4−0.39673.9128.60.764−0.394
#5−0.41668.5110.71.120−0.431
Table 4. Electrochemical parameters of FeCrNi/WC alloys with different CTC-S and CTC-A contents at 25 °C and in 3.5 wt.% NaCl solution, fitted by electrochemical impedance spectra of Randles-type circuits.
SampleRsRpCp CPEp ParameterChi-SquaredSSQ
Number(Ω·cm2)(103Ω·cm2)(10−3 mF·cm−2)Y0 (10−3 Ω−1·sα·cm−2)α(10−3)(10−3)
#13.86811.2211.2151.9130.9121.21.8
#23.67610.8831.8181.7440.8800.91.7
#34.2648.1072.2821.4680.8580.61.9
#44.6136.3322.6711.2450.8351.11.5
#55.0915.1482.7451.0160.8280.41.2
Table 5. Percentage atomic composition results from energy spectrum analysis of #1 and #2 samples (at.%).
ElementCOClCrFeNiW
110.8143.415.638.8727.811.991.48
211.6144.26.878.5626.480.351.93
313.6650.630.1212.8119.120.543.11
446.4415.03//3.16/35.37
Table 6. Percentage atomic composition results from energy spectrum analysis of #3~#5 samples (at.%).
ElementalCOClCrFeNiW
112.2344.986.877.8923.231.642.16
212.8648.754.867.6121.811.482.63
311.6152.234.397.120.061.852.76
Disclaimer/Publisher’s Note: The statements, opinions and data contained in all publications are solely those of the individual author(s) and contributor(s) and not of MDPI and/or the editor(s). MDPI and/or the editor(s) disclaim responsibility for any injury to people or property resulting from any ideas, methods, instructions or products referred to in the content.

