Article

Mechanical Properties Regulation of Invar36 Alloy Metastructures Manufactured by Laser Powder Bed Fusion

by
Jianyu Feng
1,2,
Jialei Yan
2,3,
Xiaoqiang Peng
2,3,
Gening He
4 and
Ke Huang
2,3,*
1
College of Pittsburgh, Sichuan University, Chengdu 610200, China
2
College of Materials Science & Engineering, Sichuan University, Chengdu 610065, China
3
Key Laboratory of Advanced Special Materials & Technology, Ministry of Education, Chengdu 610065, China
4
Nuclear Power Additive Manufacturing Key Laboratory of Sichuan Province, Nuclear Power Institute of China, Chengdu 610213, China
*
Author to whom correspondence should be addressed.
Metals 2025, 15(7), 773; https://doi.org/10.3390/met15070773
Submission received: 16 June 2025 / Revised: 30 June 2025 / Accepted: 3 July 2025 / Published: 8 July 2025

Abstract

Invar36 alloy, renowned for its exceptionally low coefficient of thermal expansion and excellent mechanical properties, is widely used in precision instruments, high-accuracy molds, and related fields. Metastructures fabricated via laser powder bed fusion (LPBF) have significantly broadened the application scope of Invar36 alloy, owing to their unique advantages such as lightweight design, high specific strength, and high specific stiffness. However, the structure–property coupling relationship in Invar-based metallic lattice structures remains insufficiently understood, which poses a major obstacle to their further engineering utilization. In this study, 36 lattice structures with varying design parameters were fabricated and experimentally evaluated. The design variables included lattice architecture (body-centered cubic (BCC), diamond (DIA), face-centered cubic (FCC), and octet (OCT)), strut diameter (0.6 mm, 0.8 mm, and 1.0 mm), and inclination angle (35°, 45°, and 55°). The influence of these structural parameters on the mechanical performance was systematically investigated. The results indicate that lattice architecture has a significant impact on mechanical properties, with the OCT structure, characterized by stretch-dominated behavior, exhibiting the best overall performance. Under the conditions of a 35° inclination angle and a strut diameter of 1.0 mm, the elastic modulus, compressive strength, plateau stress, and energy absorption of the OCT structure reaches 2525.92 MPa, 110.65 MPa, 162.26 MPa, and 78.22 mJ/mm3, respectively. Furthermore, increasing the strut diameter substantially improves mechanical performance, while variations in inclination angle primarily influence the dominant deformation mode. These findings demonstrate that the mechanical properties of Invar36 alloy lattice structures fabricated via LPBF can be effectively tuned over a broad range, offering both theoretical insights and practical guidance for customized performance optimization.

1. Introduction

Invar36 alloy, a unique iron-nickel alloy discovered by the Swiss physicist Charles Édouard Guillaume, exhibits the lowest coefficient of thermal expansion when the nickel content reaches 36 wt.% [1,2]. Owing to its exceptional ability to maintain dimensional stability under significant temperature variations, Invar36 alloy has been extensively employed in high-precision applications such as aerospace components, balance wheels, and geodetic baselines, where thermal stability is critical [3,4,5]. However, despite the rapid advancements in aerospace, precision instruments, and related industries, where there is a growing demand for materials that are both lightweight and multifunctional, the potential of Invar36 alloy for such applications remains underexplored [6,7].
To meet the aerospace industry’s increasing need for lightweight and multifunctional components, lattice structures based on Invar36 alloy, which offer tunable mechanical properties, have emerged as a promising design strategy. Based on the mechanical performance prediction framework established by Ashby [8,9], lattice structures can be classified into stretch-dominated and bending-dominated types. These structures, characterized by periodically arranged struts or curved units, exhibit significant strengthening and toughening effects through topological optimization. Recent studies by Abdulhadi [10], Nan Li [11], Park [12], and Sun [13] have demonstrated that innovations in unit configurations (e.g., octahedral or cross-shaped units) and the regulation of geometric parameters (e.g., strut inclination angles and gradient distribution) can synergistically enhance structural stiffness, yield strength, and energy absorption efficiency. Notably, Peiyao Li et al. [14] revealed that the FCCZ/BCCZ composite configuration, which optimizes stress transfer through vertical struts, achieved a 41% improvement in specific strength compared to basic topologies, highlighting its potential for aerospace applications. Furthermore, research has expanded into the multi-physical field coupling characteristics of lattice structures. Kaur et al. [15] found that regular pore structures improved heat dissipation efficiency by 28% compared to random porous materials, while Wu et al. [16] observed that the vibration attenuation coefficient of a 3D Kagome topology could reach 1.7 times that of traditional structures. In the biomedical field, Ataee et al. [17] demonstrated that the anisotropic regulation of Gyroid structures enabled their elastic modulus to match bone tissue requirements with a precision of ±5%. Despite these advancements, the development of lattice structures still faces two major challenges: (1) the absence of quantitative models describing the structure–property relationships, leading to a reliance on empirical approaches for performance prediction; and (2) the limitations of traditional casting processes, which struggle to achieve feature size precision below 500 μm, thereby hindering the accurate fabrication of complex topologies. Overcoming these challenges requires the acquisition of high-quality structure–property datasets and the development of advanced fabrication technologies to lay the groundwork for the engineering application of Invar36 alloy lattice structures.
Laser powder bed fusion (LPBF), a representative additive manufacturing technology, stands out for its high precision and excellent surface quality. In this process, a high-power laser selectively melts and fuses metal powder layer by layer, enabling the fabrication of complex three-dimensional structures directly from digital 3D models [18,19]. This technology offers four key advantages for fabricating lattice structures: (1) the ability to accommodate complex geometries, enabling the production of intricate three-dimensional structures with minimal post-processing; (2) a short preparation cycle, allowing for rapid model establishment, sample printing, and testing; (3) high material utilization efficiency, with reusable powder; and (4) a high degree of design freedom and manufacturing precision [20,21,22,23]. LPBF not only enables the high-quality fabrication of lattice structures but also allows for the optimization of their mechanical properties and energy absorption capabilities through precise control of process parameters [24,25]. The LPBF-fabricated Invar36 alloy has been systematically investigated in our previous studies, including the relationships among processing parameters, microstructural characteristics, mechanical properties, superstructure, and the coefficient of thermal expansion, as well as the anisotropy in both microstructure and performance [26,27,28].
In this study, the intrinsic relationship between lattice structures and the mechanical properties of LPBFed Invar36 alloy metastructures were systematically investigated. Four lattice architectures with 36 variations were designed, fabricated, and evaluated, focusing on structural density, compressive properties and energy adsorption performance. Furthermore, the effects of lattice architecture, inclination angle, and strut diameter on the compressive strength and energy absorption properties of Invar36 alloy were analyzed. This study aims to provide guidance for performance regulation and optimal design of lattice structures.

2. Materials and Methods

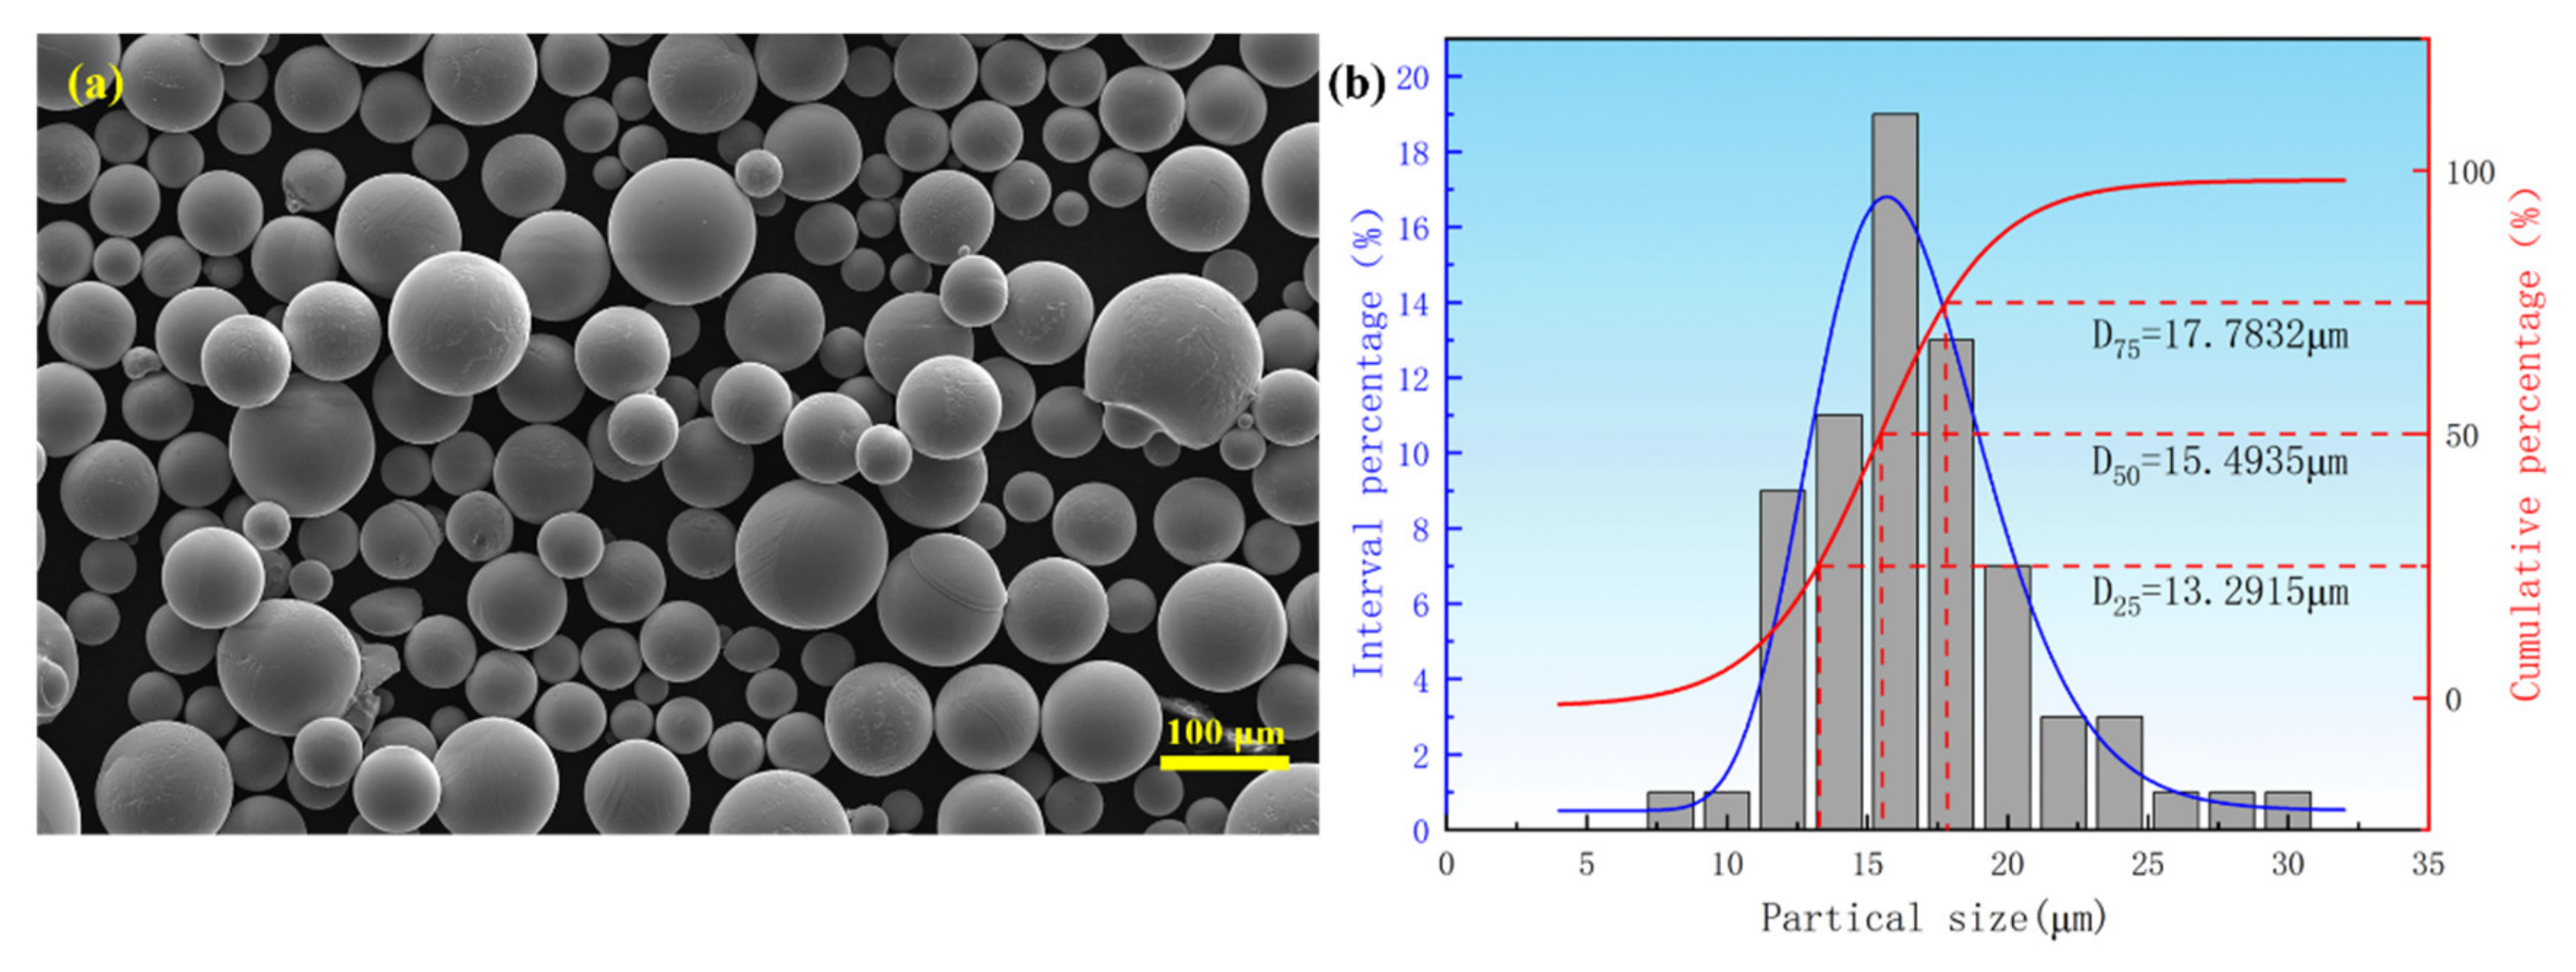
2.1. Invar36 Alloy Powder

Invar36 alloy powder (ASTM Grade 1, supplied by Hebei Jingye Additive Manufacturing Technology Co., Ltd., Shijiazhuang, China) was produced using the gas atomization method. The powder particles predominantly exhibit a regular spherical morphology, with a minor fraction displaying irregular shapes. Notably, many of the particles are free from satellite powder adhesion, as illustrated in Figure 1. The particle size distribution ranges between 5 and 35 μm, with a median particle size (D50) of 15.49 μm. The distribution follows a normal pattern, which aligns with the stringent requirements for powder used in laser powder bed fusion (LPBF).
Table 1 details the chemical composition of the Invar36 alloy powder, confirming that the concentrations of impurity elements, including C, O, P, and S, are all below 0.1 wt.%.

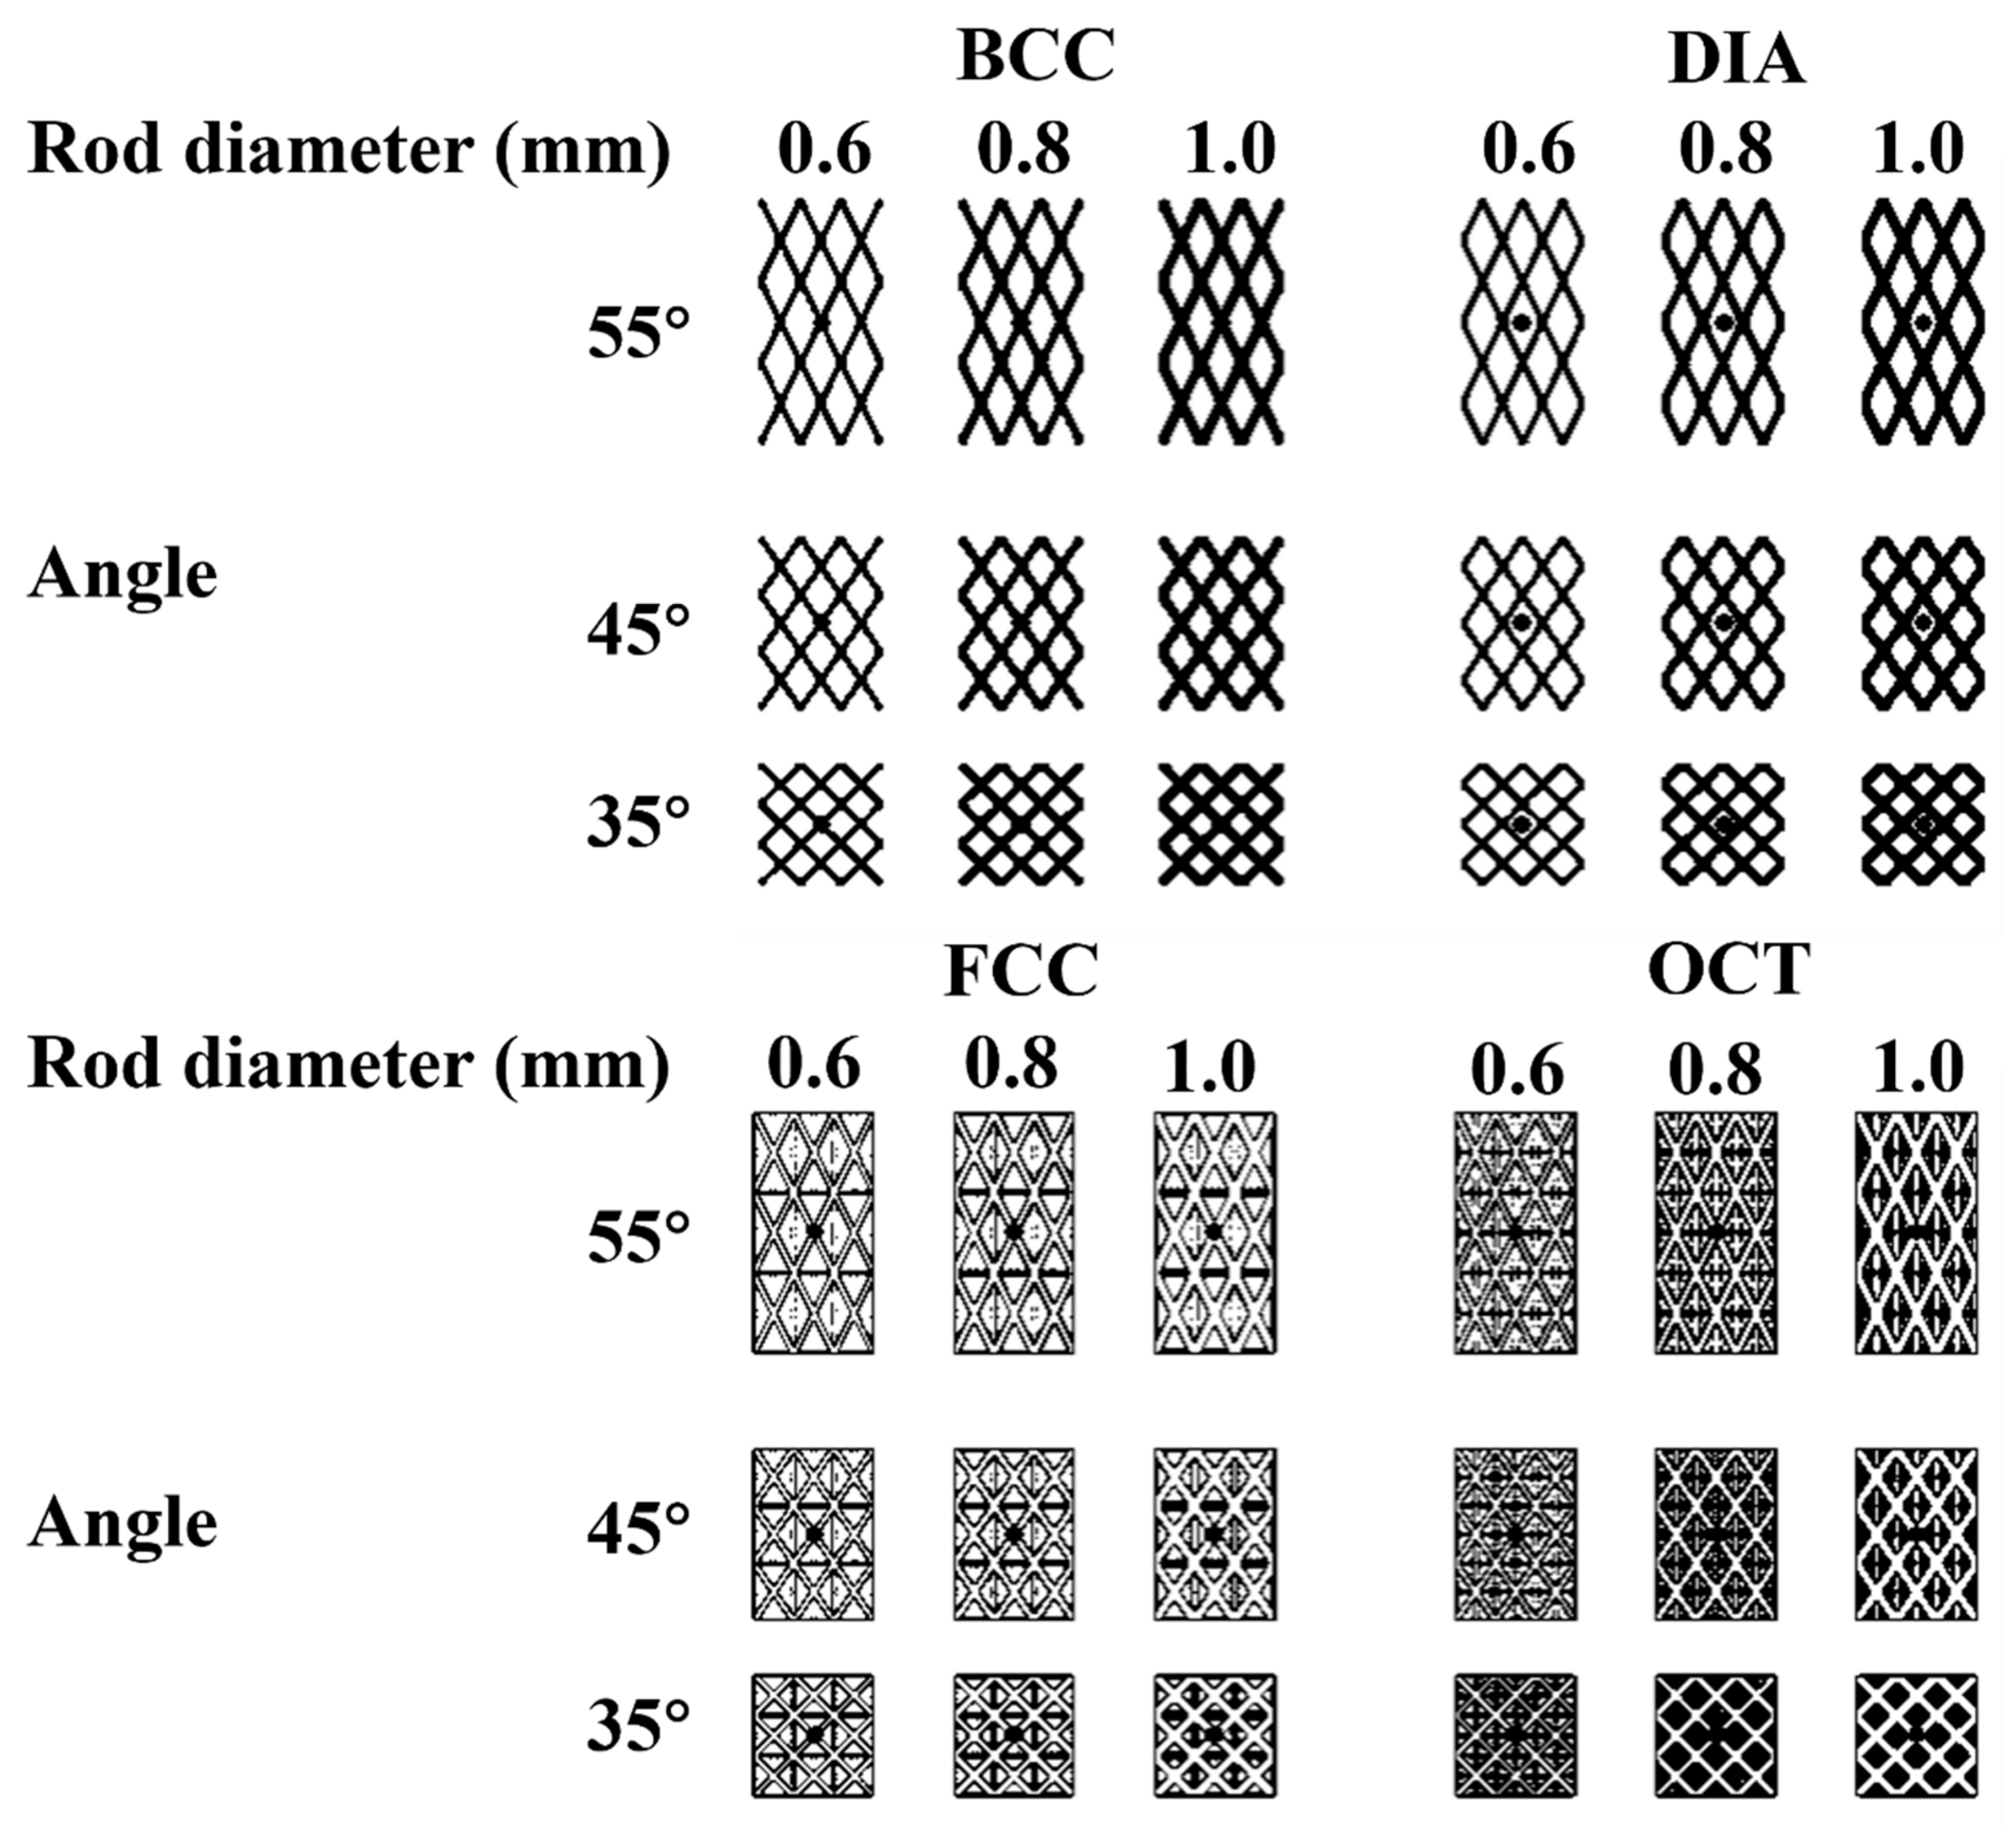
2.2. Lattice Structure Design

Using Materialise Magics software (version 21.0), a geometric model of the lattice structure was established, as illustrated in Figure 2. By considering LPFB process limitations, such as minimal feature size, lowest printing angles etc., four types of lattice structures were designed: body-centered cubic (BCC), diamond (DIA), face-centered cubic (FCC), and octet (OCT). Based on empirical formulas and previous studies, BCC and DIA are classified as bending-dominated lattices, while FCC and OCT are categorized as stretching-dominated lattices. Each lattice structure comprises a 2 × 2 × 2 arrangement of unit cells. All lattice struts are cylindrical in shape, with a base edge length of 12 mm. Three inclination angles (35°, 45°, and 55°) were designed along the z-direction, and the height-to-base edge length ratio of the models was maintained between 1 and 2, in accordance with ISO 13314:2011 for testing the compressive properties of porous and cellular metals [29]. Furthermore, three strut diameters (0.60 mm, 0.80 mm, and 1.00 mm) were designed for each structure. By combining unit cell type, inclination angle, and strut diameter, a total of 36 distinct lattice structures were designed.

2.3. Lattice Structure Preparation

The lattice structures were fabricated using a HBD-80 LPBF machine (Shanghai Hanbang United 3D Tech Co., Ltd., Shanghai, China) equipped with a 400 W single-mode fiber laser. The process parameters for LPBF were optimized as follows: laser power (P) 150 W, scanning speed (V) 800 mm/s, layer thickness (S) 30 μm, hatch spacing (H) 70 μm, and laser beam diameter (D) 60 μm. The entire fabrication process was carried out in a high-purity argon atmosphere to prevent oxidation and ensure the metallurgical integrity of the printed components. The as-built specimens were used for subsequent mechanical testing and characterization, without any additional stress relief annealing or hot isostatic pressing (HIP).

2.4. Testing and Characterization

In this study, the relative density of the samples was measured using the Archimedes method. Quasi-static compression tests were performed on the lattice structure specimens using INSTRON 5985 universal testing machines (Norwood, MA, USA). The compression tests adhered to the ISO 13314:2011 standard [29], with a constant compression rate of 1 mm/min applied along the z-direction. Strain was calculated as the ratio of the displacement in the z-direction to the original length of the specimen, while stress was determined as the ratio of the applied load to the apparent area of the top x–y surface of the specimen. The tests were terminated once the strain reached 80%. Following the ISO 13314:2011 standard [29], key mechanical properties were calculated, including compressive elastic modulus (derived from the slope of the stress–strain curve in the elastic phase), compressive strength (determined as the 0.2% offset yield strength), plateau stress (defined as the average stress within the 20–30% compression strain range), and the energy absorption per unit volume (calculated as the area under the stress–strain curve up to 50% strain). These properties were used to systematically evaluate the mechanical performance of the lattice structures.

3. Results

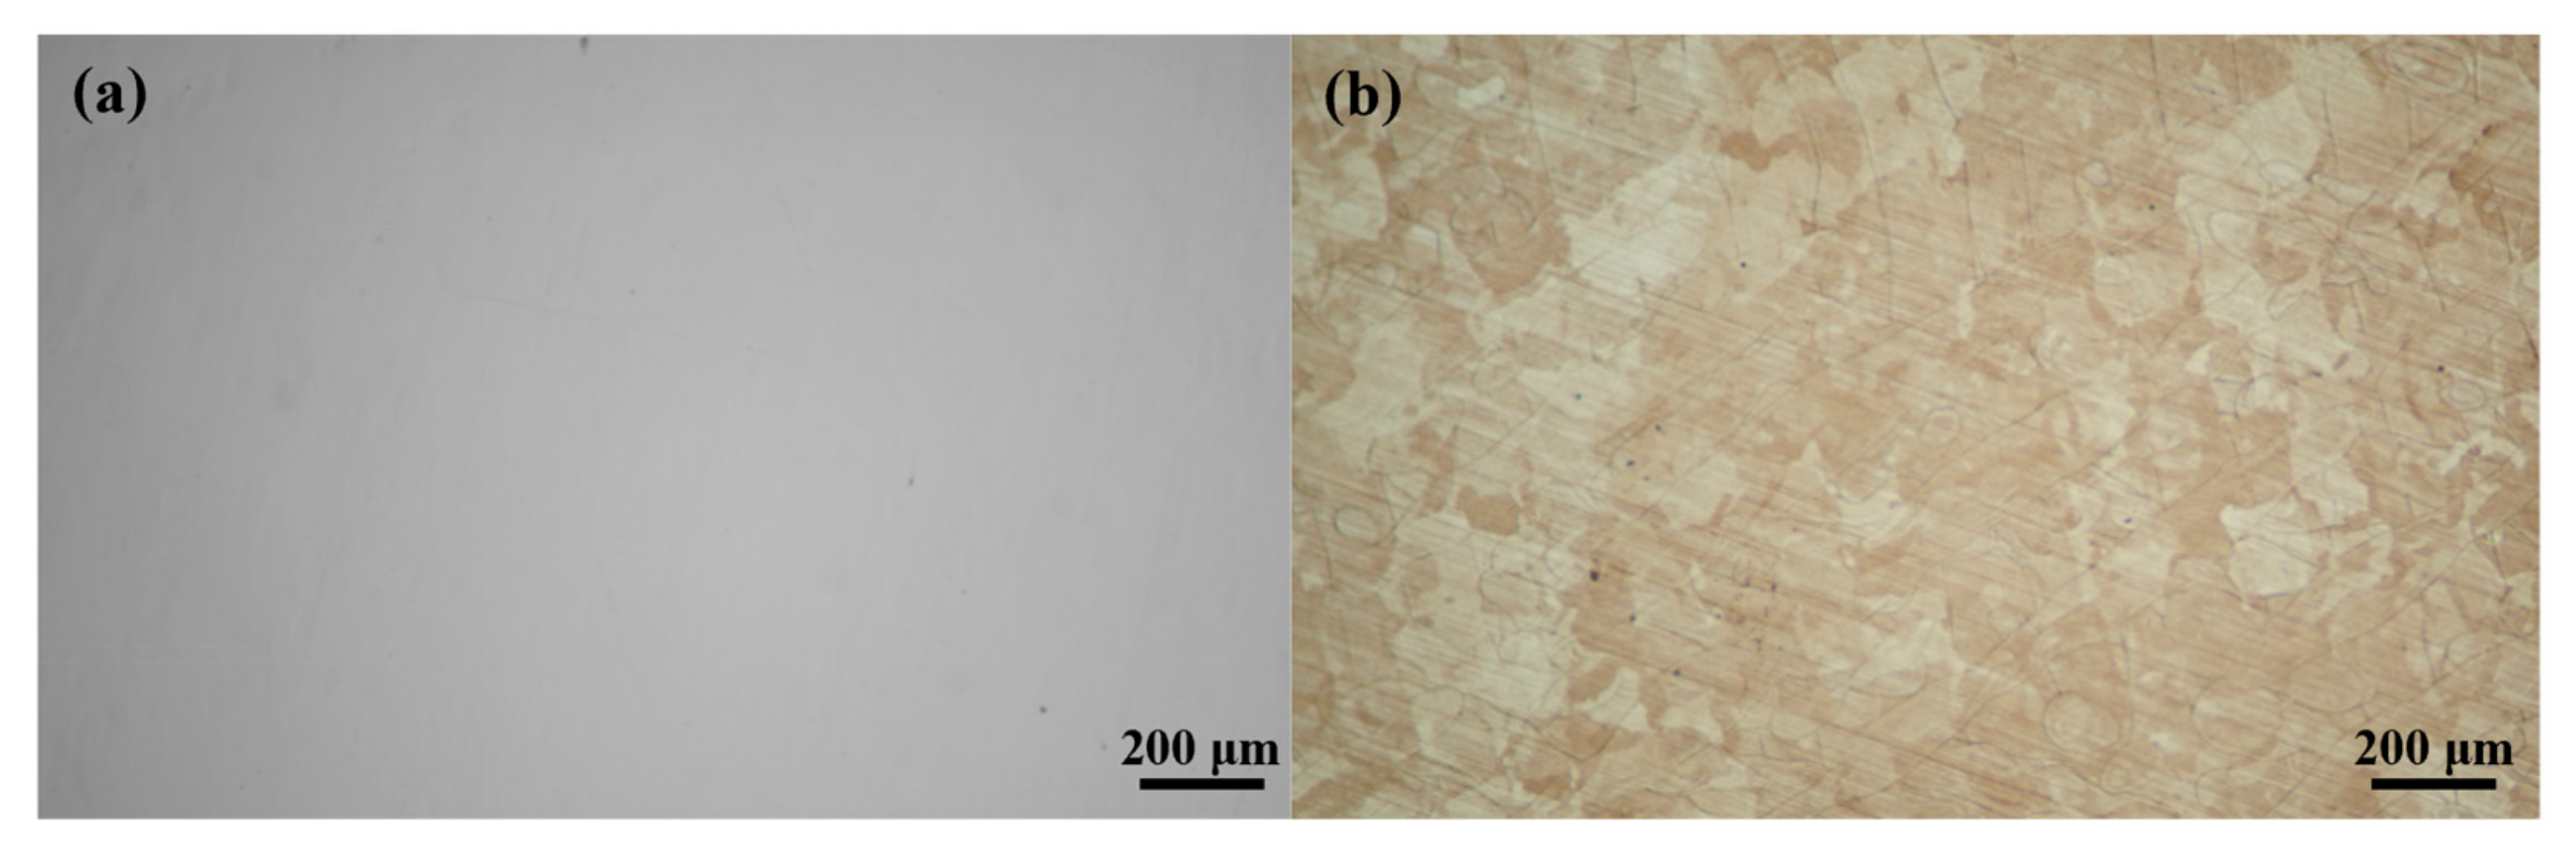
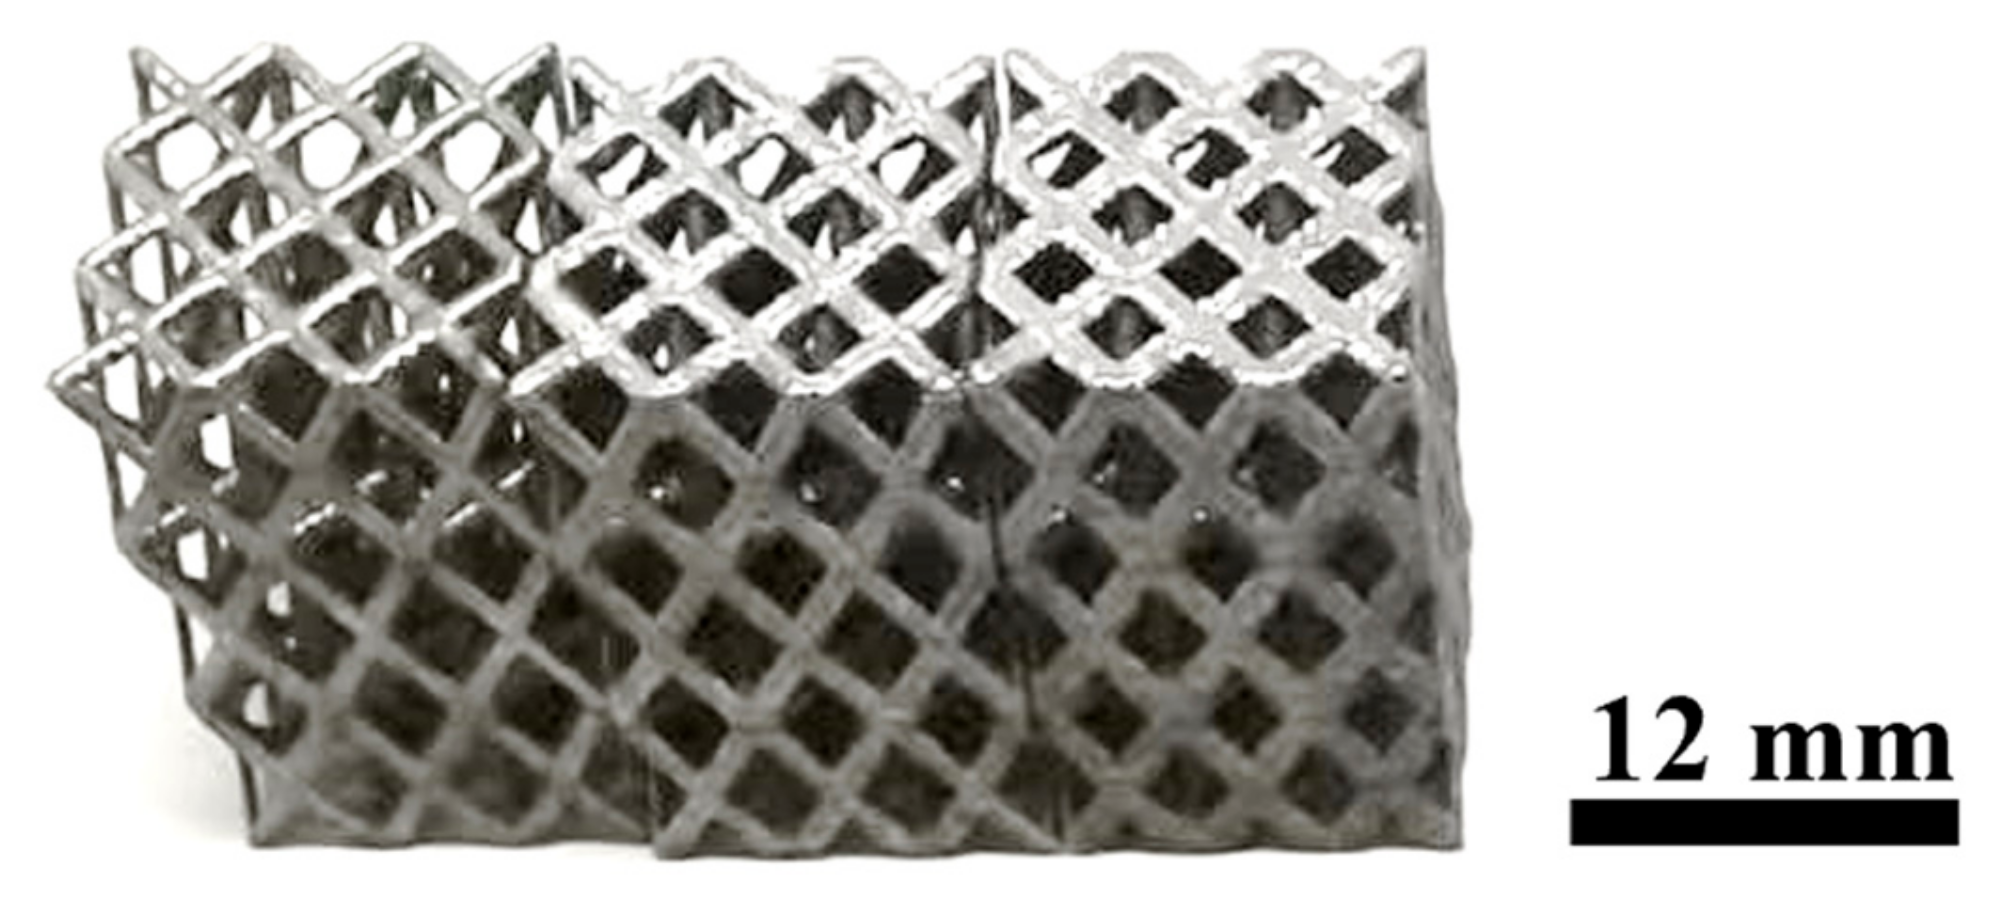
3.1. Formation Quality

All specimens were fabricated under identical process parameters and in the same batch, ensuring consistency in microstructure, density, and other physical properties across the printed specimens. Figure 3 presents the metallographic images of cube specimens from the same batch, revealing no obvious pores or cracks in the printed Invar36 alloy structures. A density of 99.8% and a uniform equiaxed grain structure were achieved, as confirmed by image analysis. Figure 4 showcases the printed specimens, demonstrating that the struts are intact and the overall structure is free from significant defects. These observations confirm that the selected printing parameters enable high-quality fabrication of Invar36 alloy lattice structure. Table 2 summarizes the relative density and apparent density of the printed specimens.

3.2. Mechanical Properties

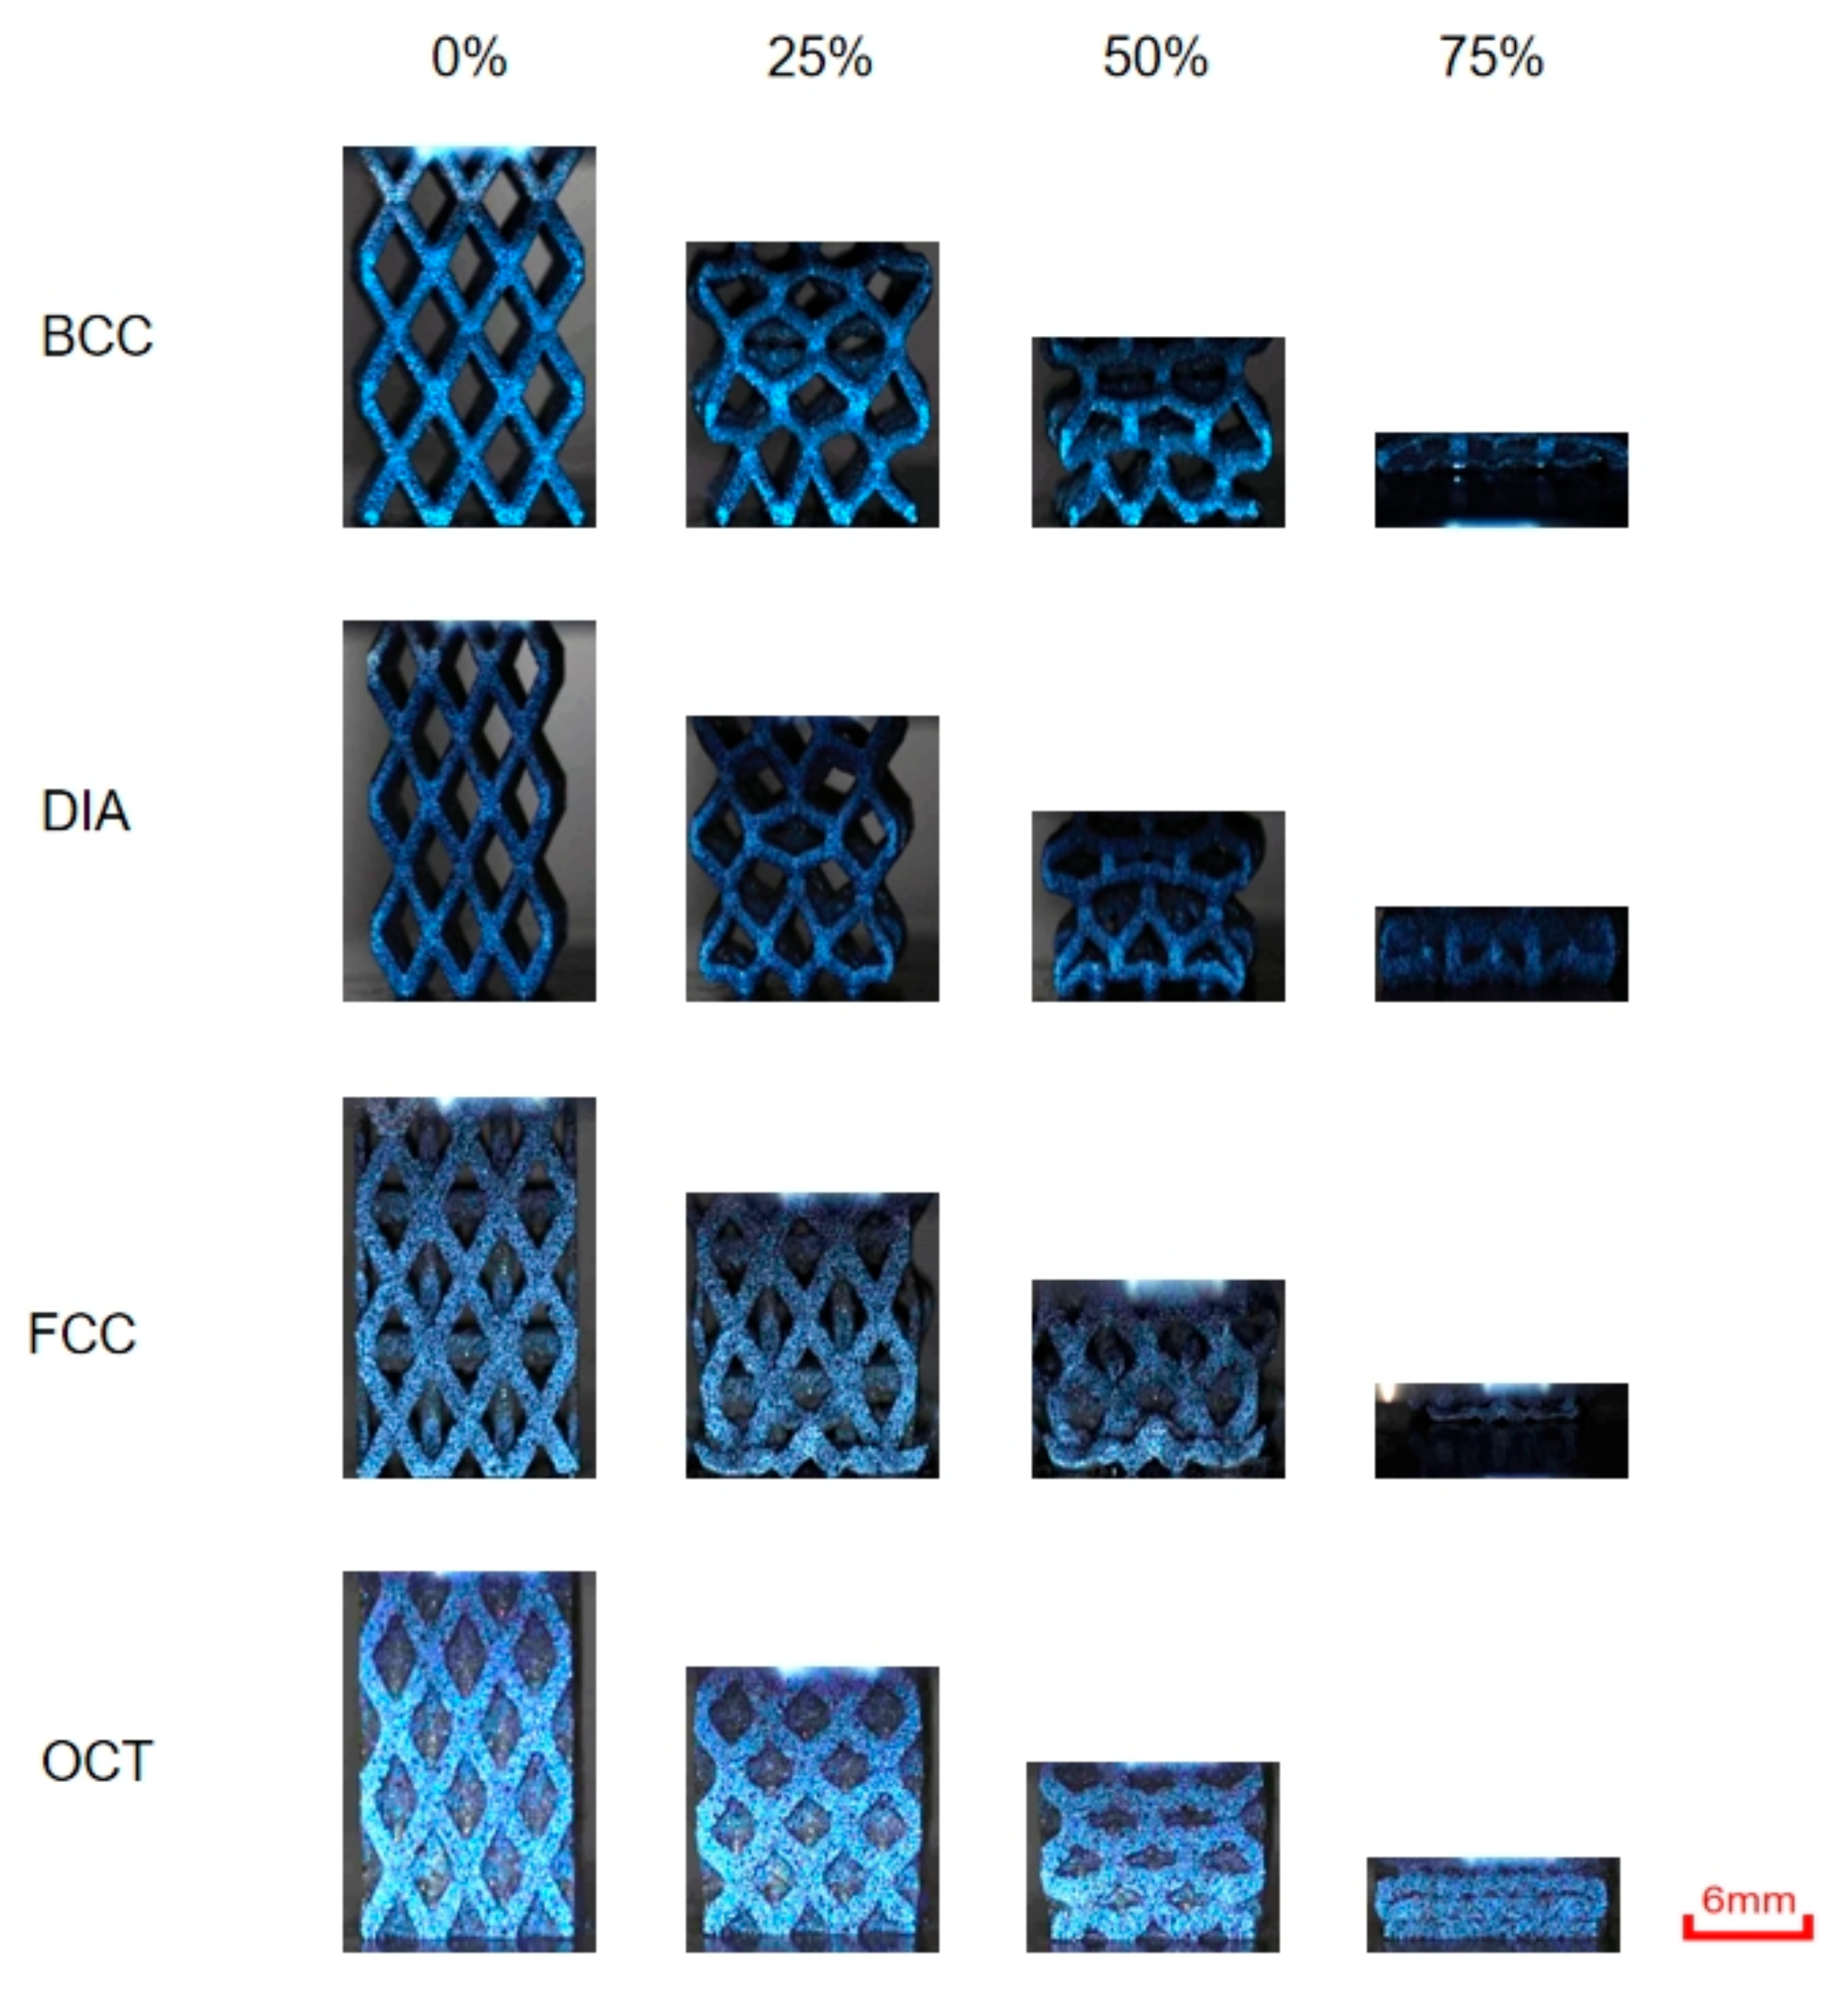
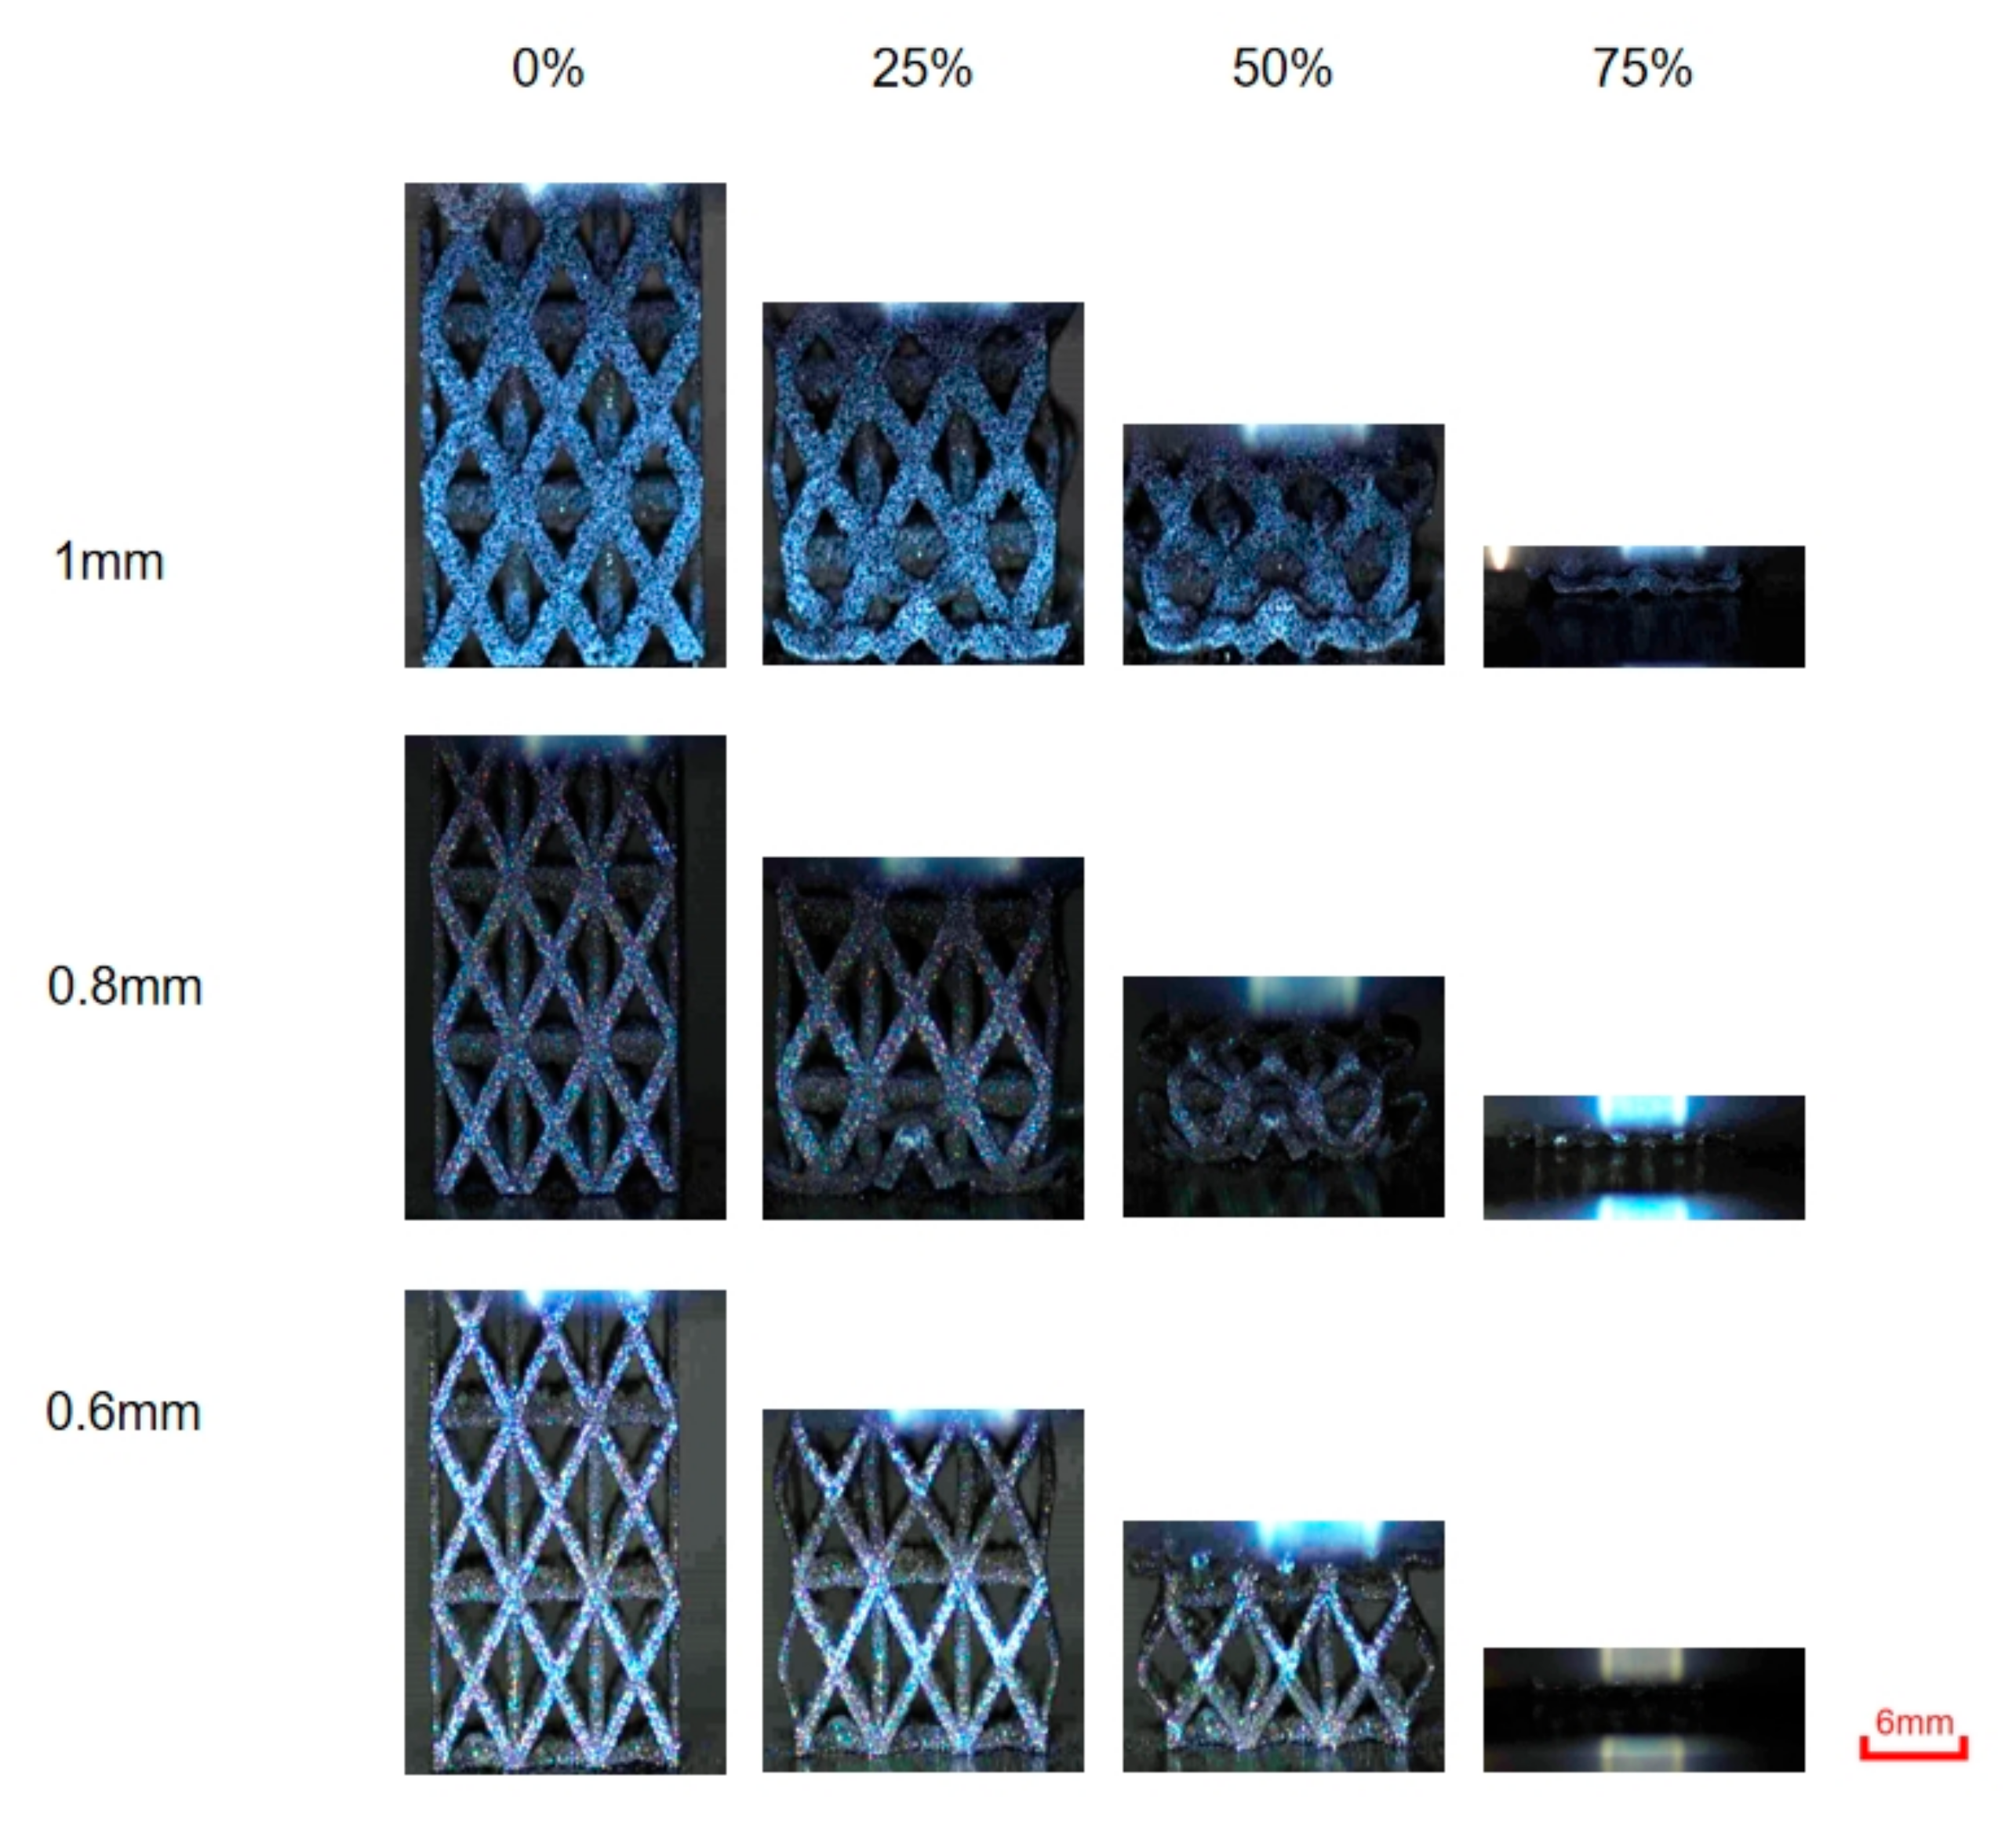
3.2.1. Macroscopic Deformation

Figure 5 illustrates the representative deformation behavior of the four lattice architectures. Bending-dominated structures (BCC and DIA) primarily exhibit uniform deformation under compressive loading, while stretching-dominated structures (FCC and OCT) tend to show distinct layered deformation in most cases. These deformation patterns are consistent with Maxwell’s rigidity criterion and the connectivity condition, which relate structural geometry to mechanical stability [30].
Lattice architecture is the most critical factor influencing deformation behavior, while strut diameter and inclination angle also play significant roles. A reduction in strut diameter or an increase in inclination angle tends to shift the deformation mode from uniform to layered. Specifically, BCC and DIA structures begin to exhibit noticeable layered deformation at an inclination angle of 55°. In contrast, FCC structures show layered deformation under all tested conditions, while OCT structures retain uniform deformation when the strut diameter exceeds 0.8 mm and the inclination angle is 35°.

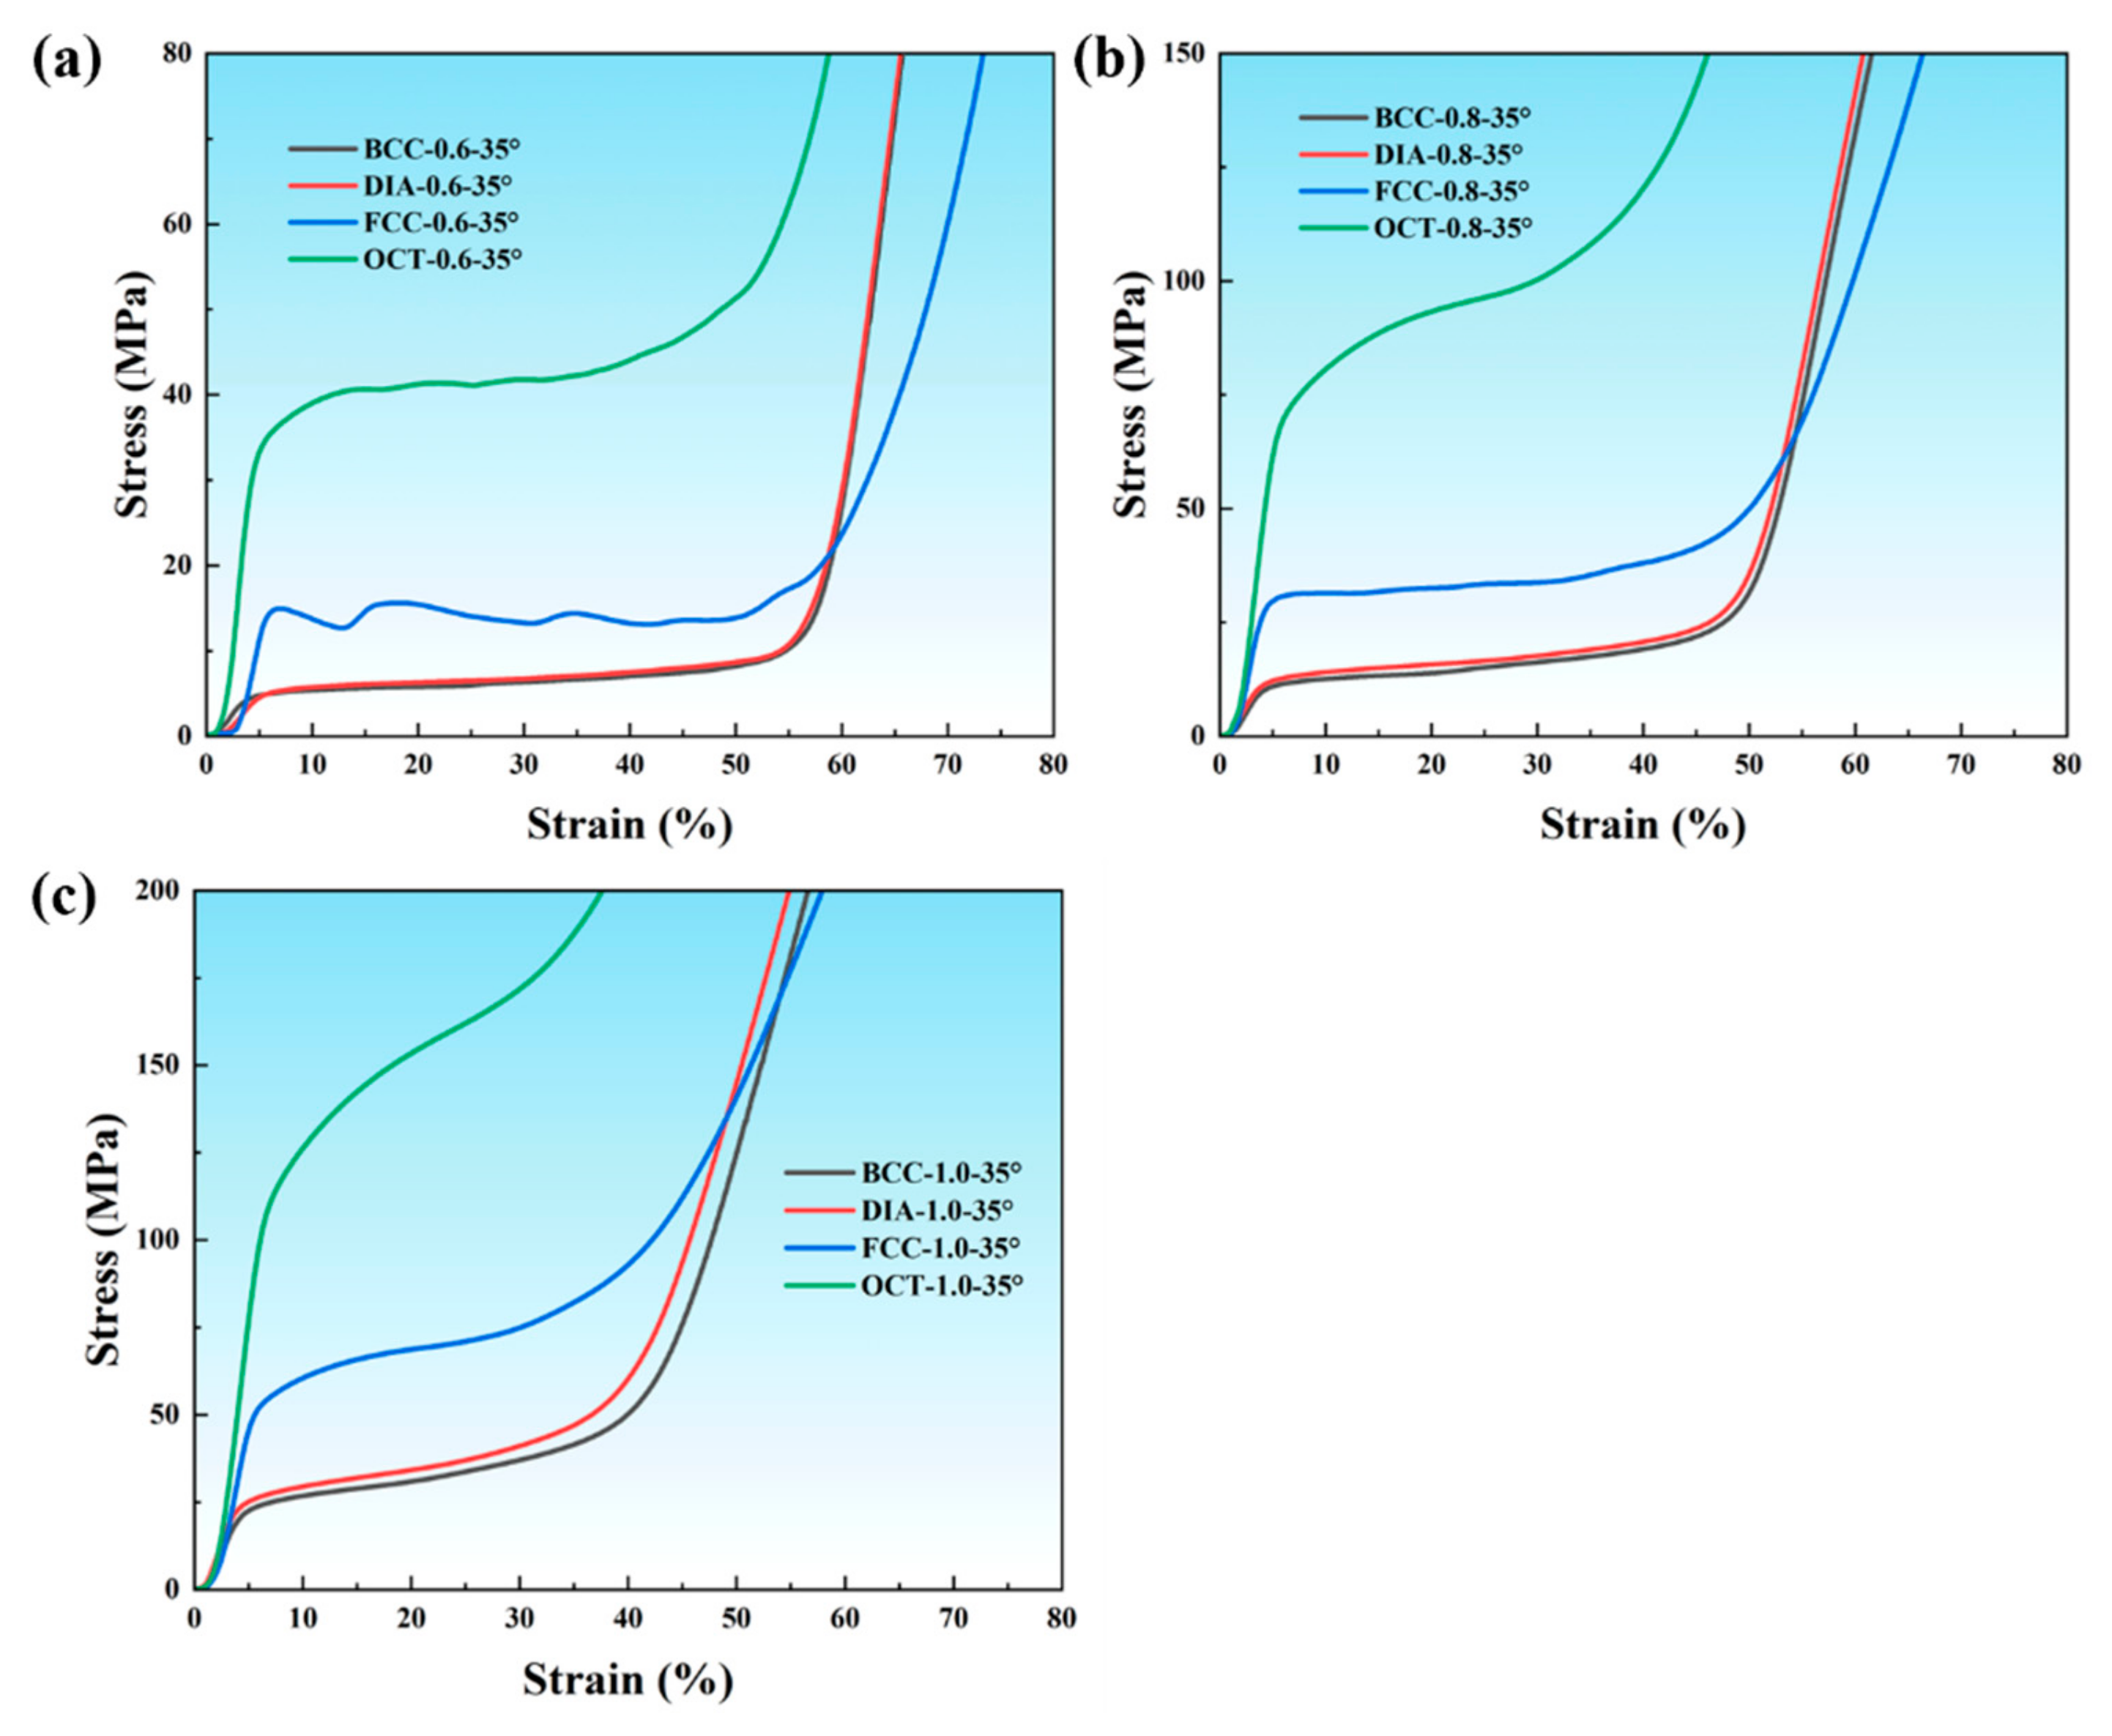
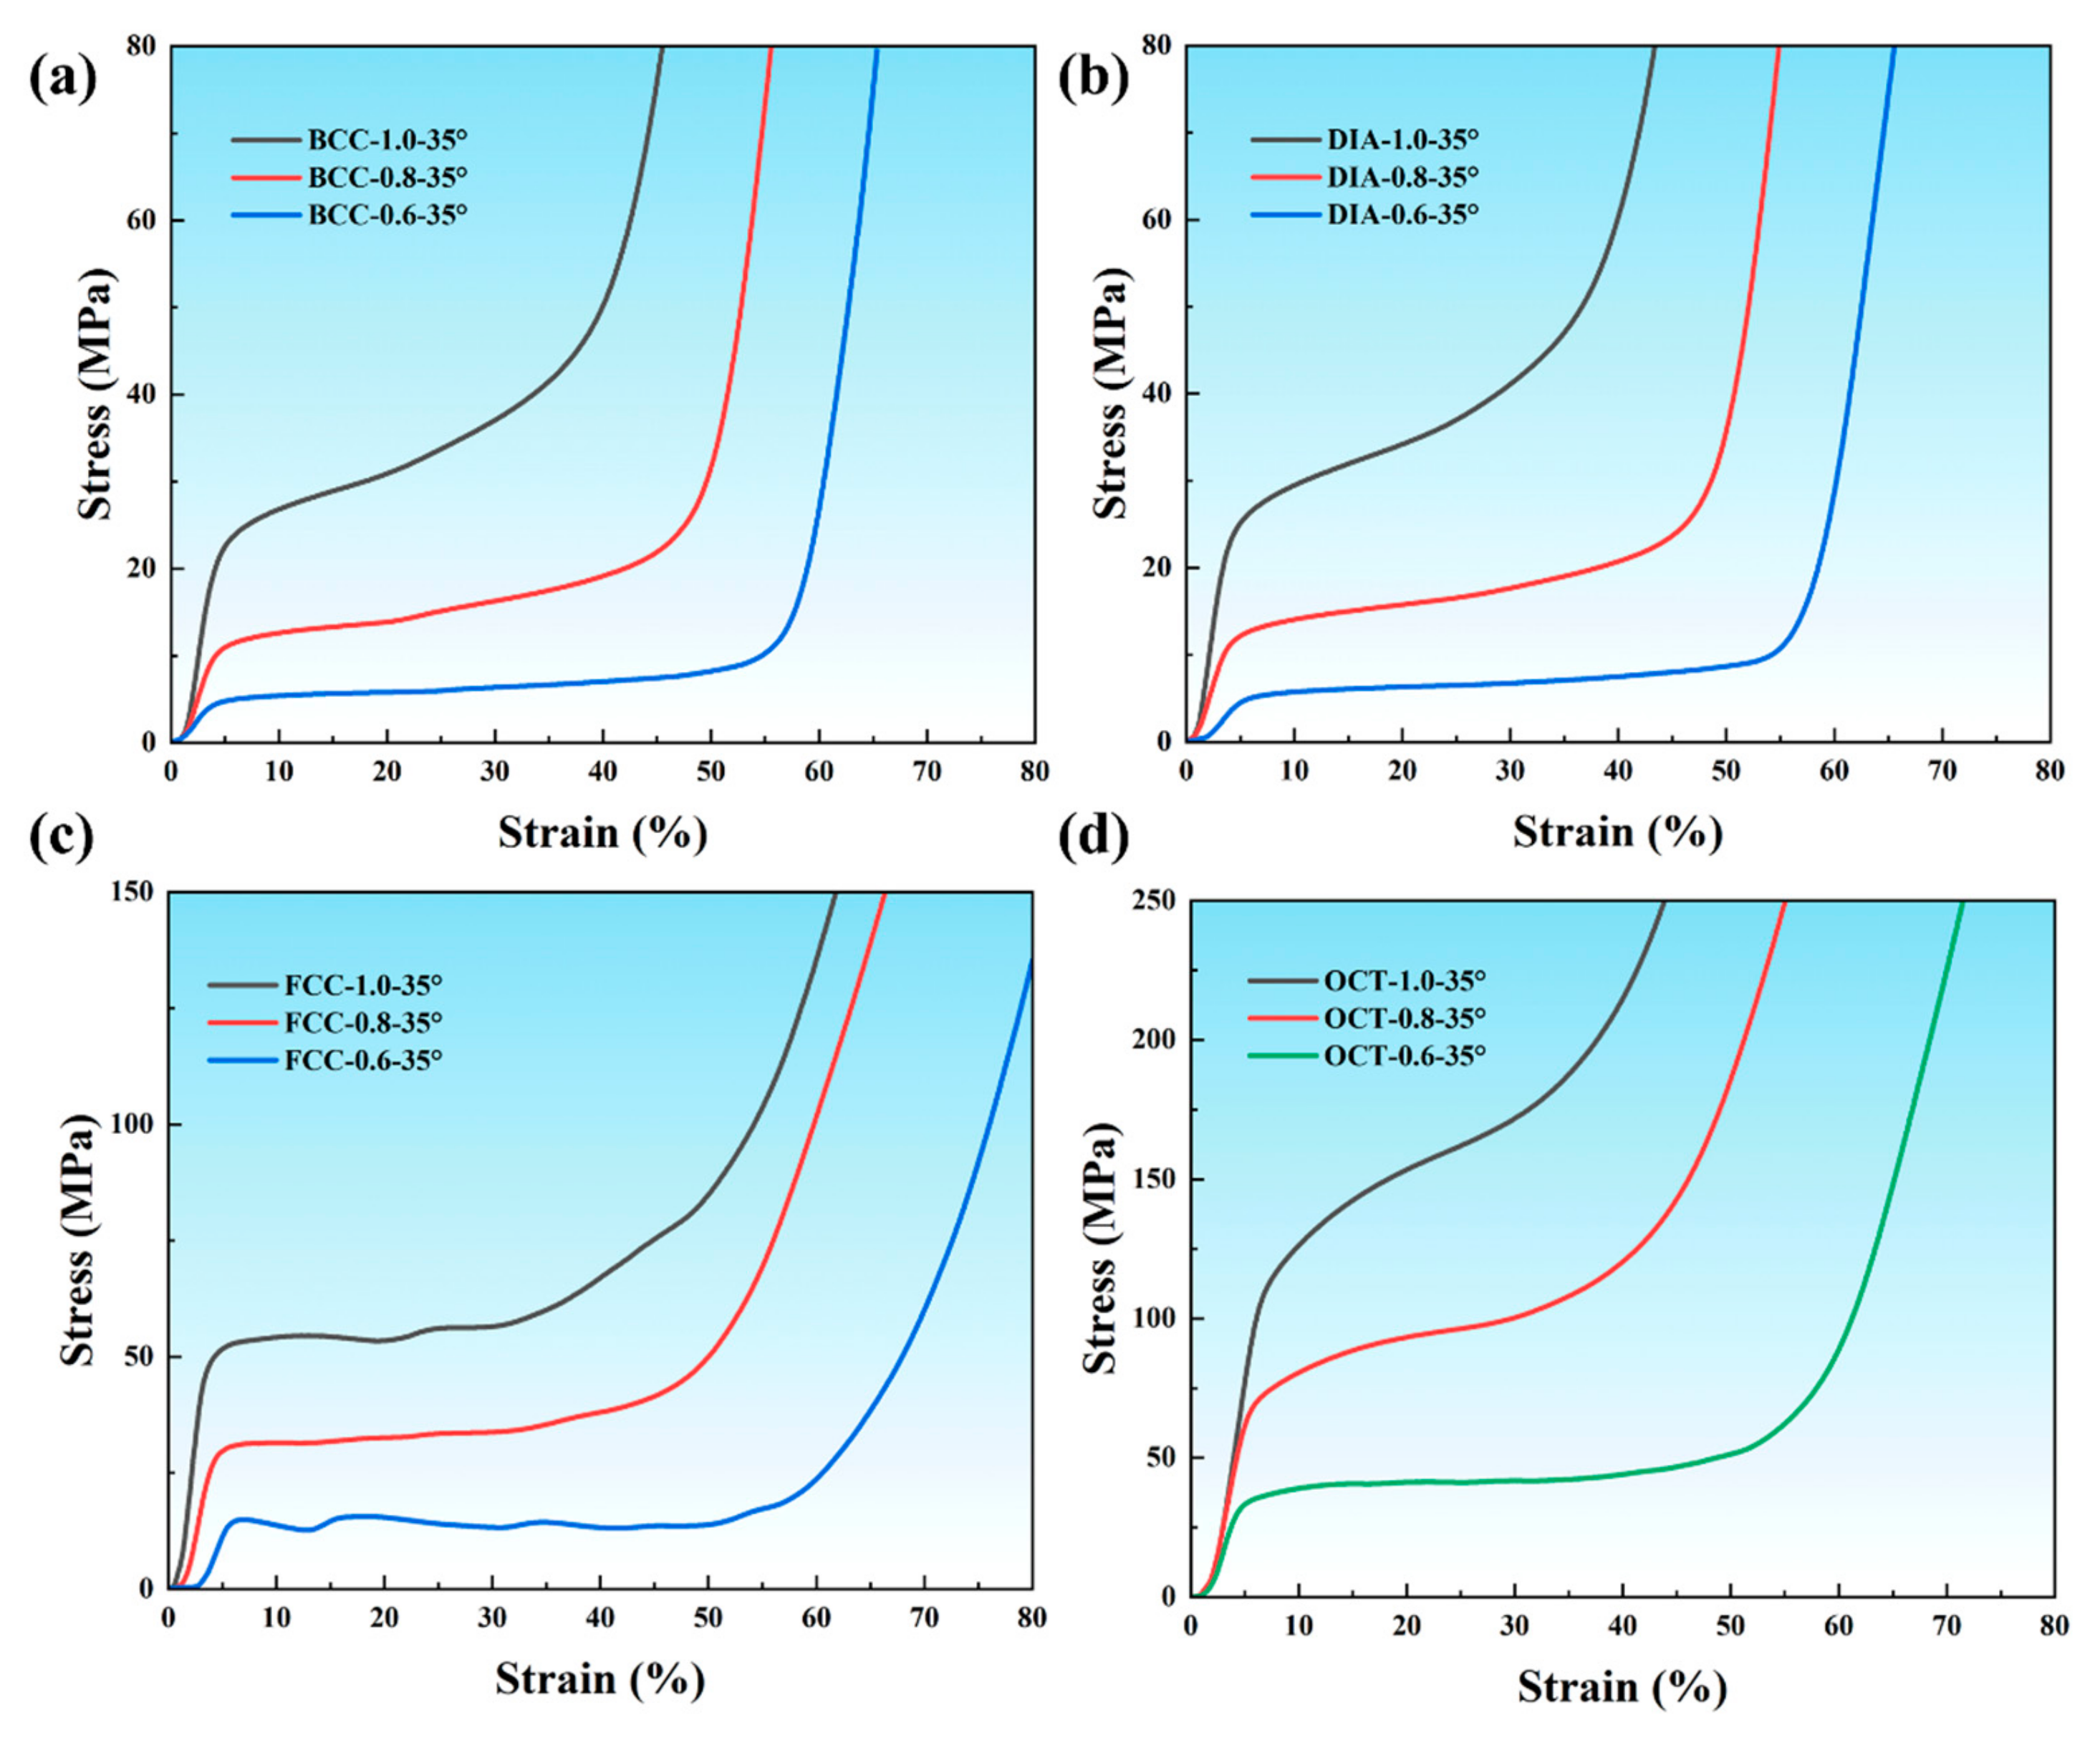
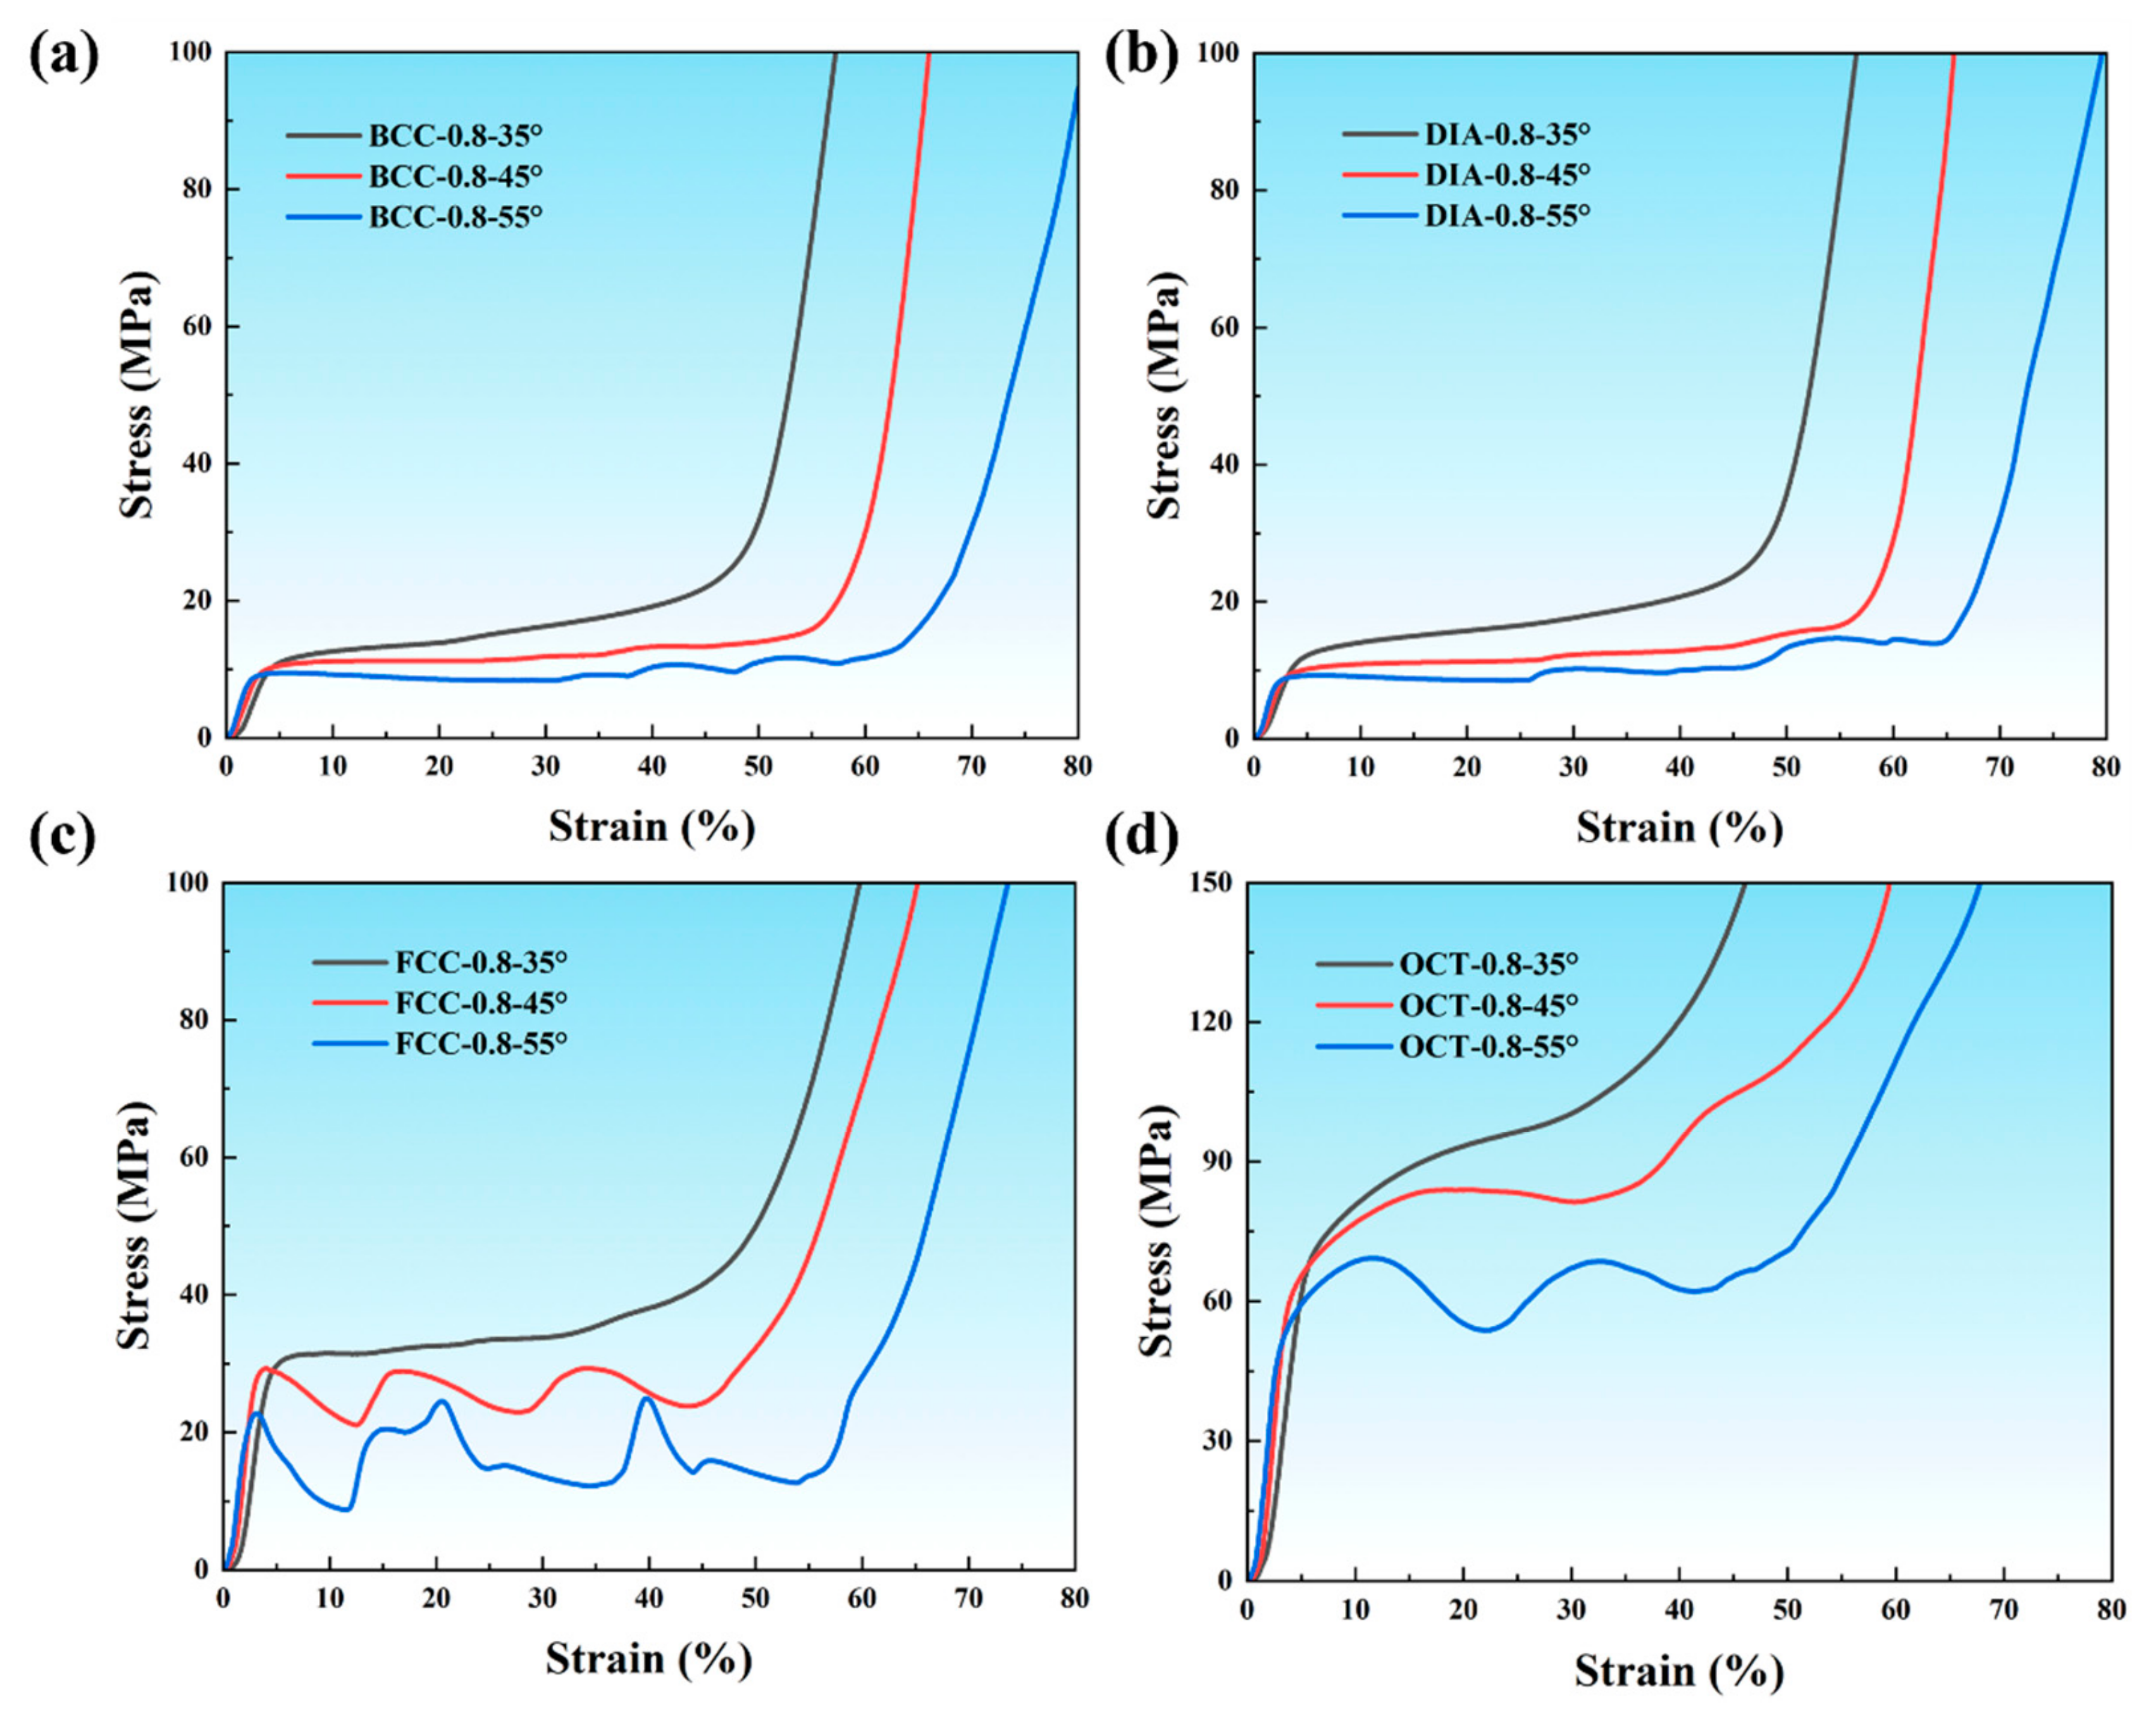
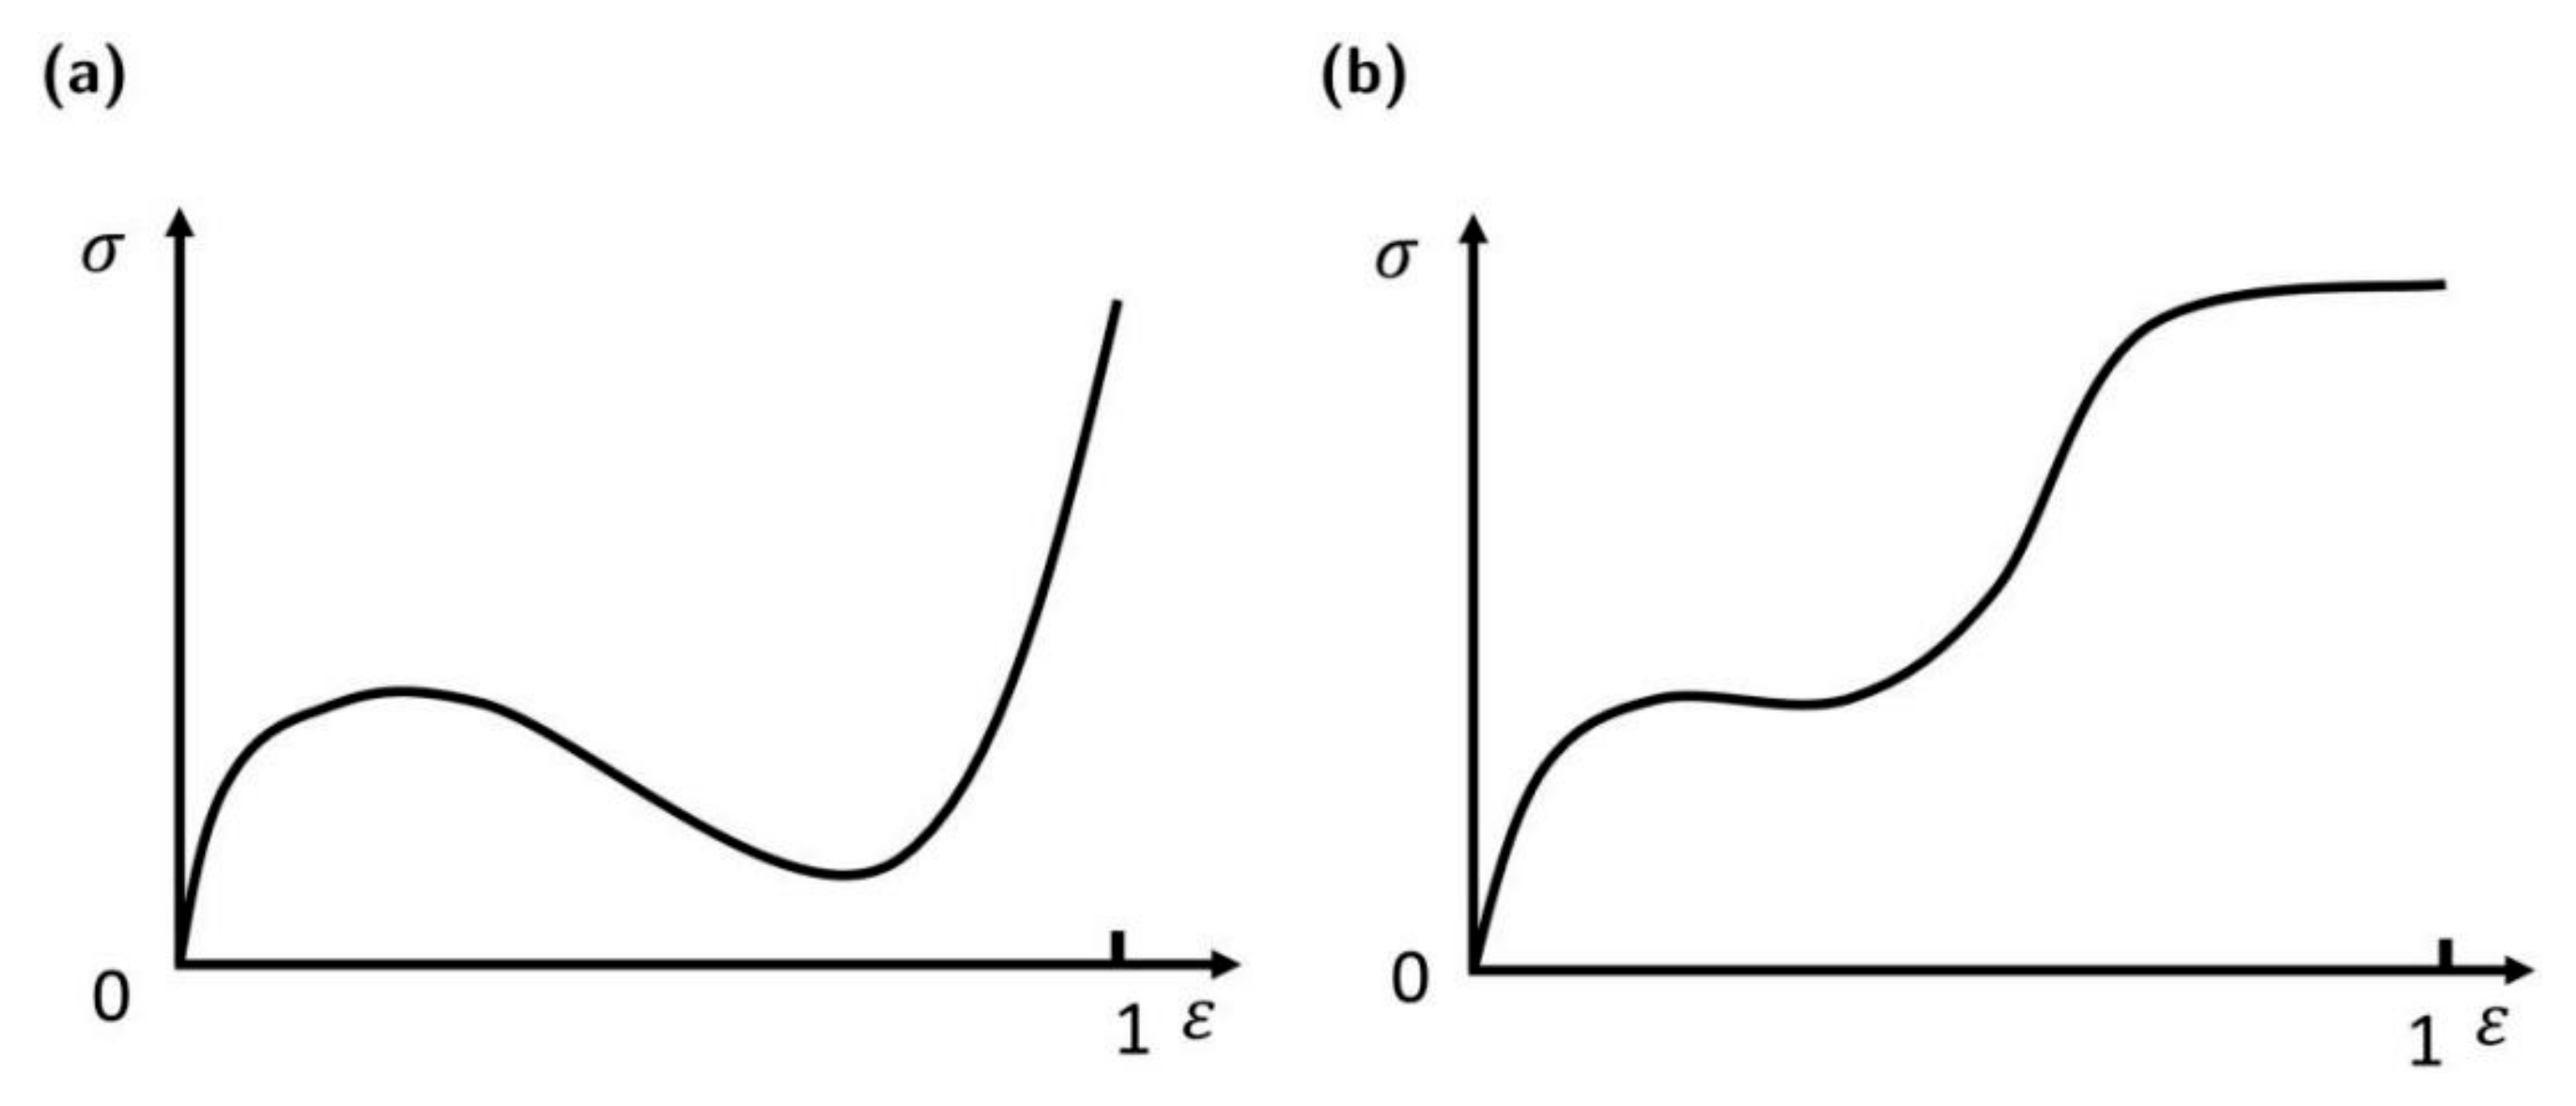
3.2.2. Stress–Strain Curve

Figure 6 presents the stress–strain curves for the four lattice structures. The stress–strain curves can be distinctly divided into three stages: the elastic stage, the plateau stress stage, and the densification stage. In the elastic stage, stress increases linearly with strain until reaching the compressive strength. During the plateau stress stage, stress remains relatively constant despite increasing strain, forming the characteristic plateau stress. This stage is marked by the onset of plastic bending deformation in the lattice structure, and the energy absorption performance is primarily exhibited here. In the densification stage, stress rises sharply with strain as the lattice structure becomes highly compacted along the z-axis, and macroscopic voids are nearly eliminated, causing the stress–strain curve to exhibit a nonlinear trend.
As illustrated in Figure 6, bending-dominated structures (BCC and DIA) exhibit a stress–strain response characterized by a strengthening trend, while stretching-dominated structures (FCC and OCT) show a decline in stress following the initial peak compressive strength, indicative of softening-like behavior. Fluctuations in the stress–strain curves during the unstable stress region are closely related to the phenomenon of layered deformation. During this stage, the lattice structure undergoes layered compression, leading to oscillations in the curves. This phenomenon is particularly observed in FCC structures and other structures with a 55° inclination angle and a 0.6 mm strut diameter.
Figure 7, Figure 8 and Figure 9 provide a clearer illustration of the effects of lattice architecture, strut diameter, and inclination angle on the stress–strain behavior. As shown in Figure 7, the OCT structure exhibits the highest compressive strength and the steepest slope in the elastic region, indicating the highest elastic modulus. The FCC structure ranks second in mechanical performance, though slight fluctuations appear in the curve, suggesting some degree of stress instability. The BCC and DIA structures demonstrate similar behaviors, with the most stable curves but relatively inferior mechanical properties.
From Figure 8, it is evident that for a given lattice architecture and inclination angle, increasing the strut diameter significantly enhances the maximum compressive strength and plateau stress while shortening the plateau stage. In contrast, increasing the inclination angle reduces structural stability, as reflected by the emergence of stress fluctuations in the stress–strain curves (e.g., Figure 9c,d), along with a transition from uniform to layered deformation. Moreover, a higher inclination angle leads to a reduction in both maximum compressive strength and plateau stress, accompanied by an extended plateau stage, as shown in Figure 9.

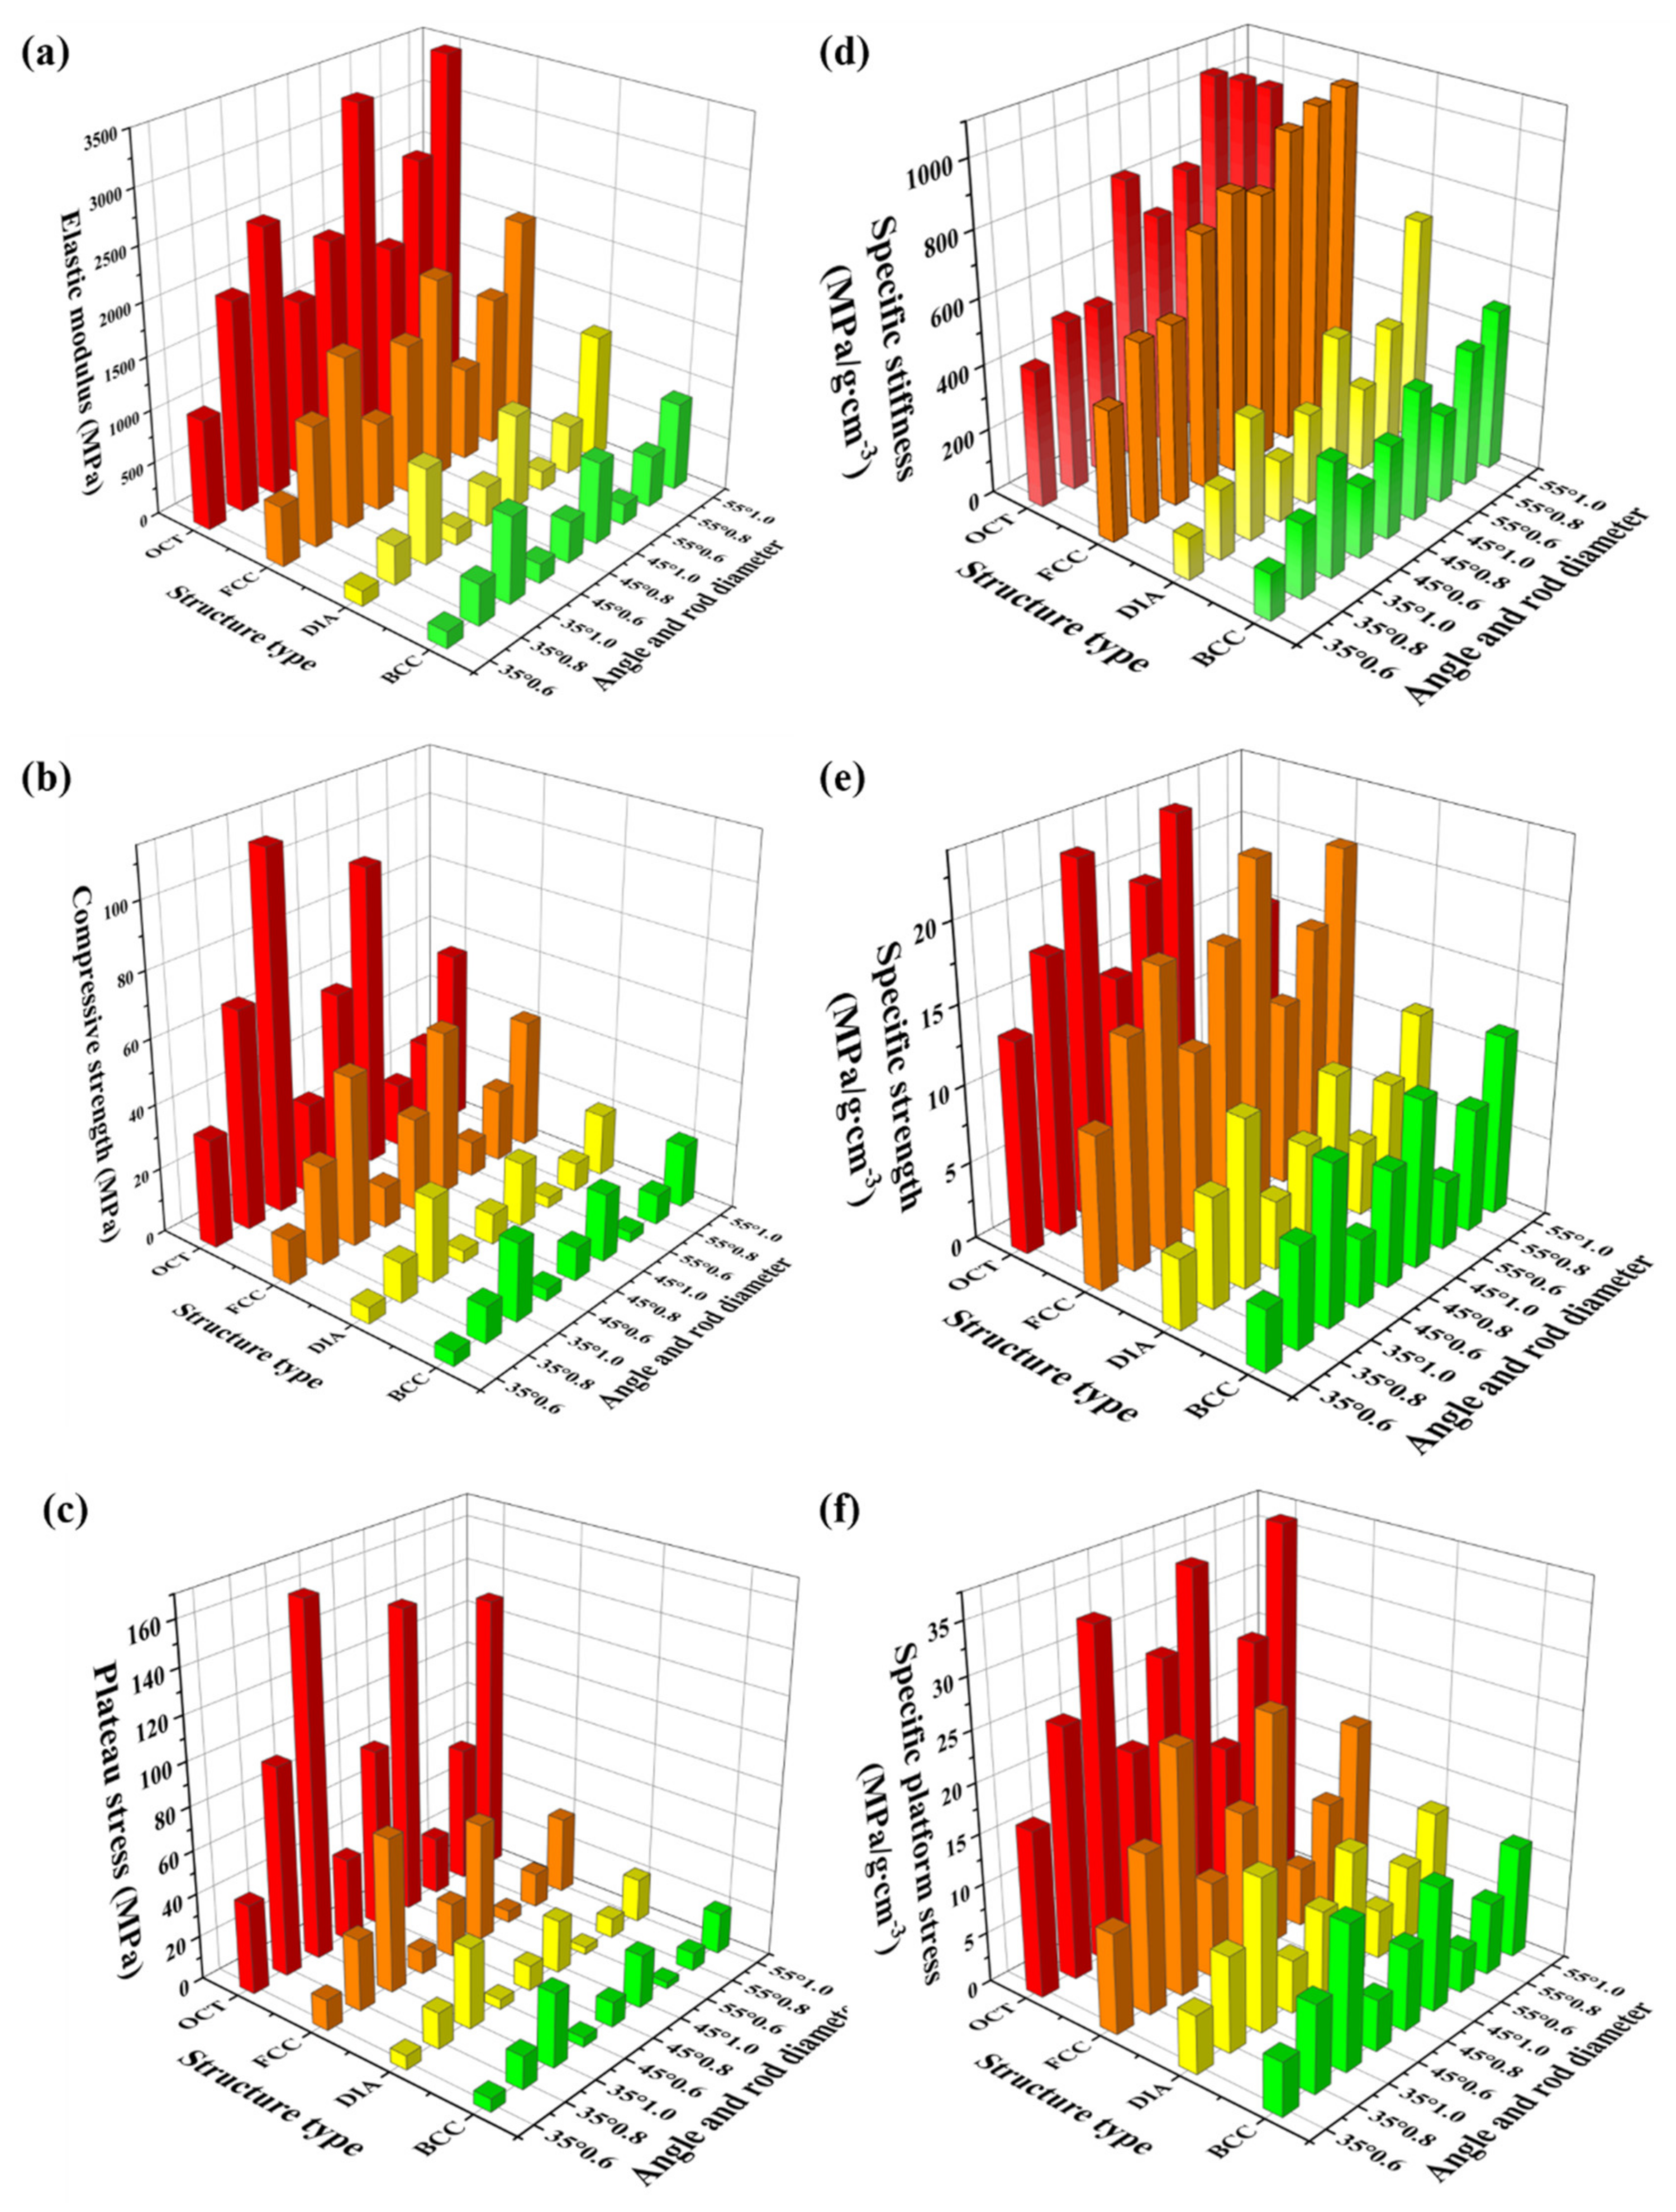
3.2.3. Specific Stiffness, Specific Compressive Stress, and Specific Plateau Stress

To quantitatively evaluate the mechanical efficiency of lattice structures under lightweight constraints, three key metrics are introduced: specific stiffness, specific compressive strength, and specific plateau stress. These parameters quantify mechanical performance per unit mass and are defined as the ratio of the corresponding property to the material’s density (ρ).
Table 3 presents the elastic modulus, compressive strength, and plateau stress of the tested samples, while Table 4 reports their specific stiffness, specific compressive strength, and specific plateau stress. Figure 10 illustrates the trends in elastic modulus, compressive strength, and plateau stress (Figure 10a–c), as well as specific stiffness, specific compressive strength, and specific plateau stress (Figure 10d–f). The accompanying bar charts clearly reveal the variation trends in mechanical performance across different lattice configurations.
For specific stiffness, the OCT structure demonstrates the best performance, followed by FCC, while DIA and BCC show relatively lower values. Increasing the strut diameter leads to a noticeable improvement in specific stiffness, whereas changes in inclination angle have a limited effect, especially for BCC and DIA structure.
Specific compressive strength and specific plateau stress exhibit similar trends. Structurally, the OCT lattice again outperforms the others, followed by FCC, while DIA and BCC remain inferior. As strut diameter increases, both specific compressive strength and specific plateau stress rise in a stepwise manner. In contrast, increasing the inclination angle results in a decline in both metrics.
Overall, the mechanical performance of lattice structures is strongly influenced by lattice architecture and strut diameter, while the effect of inclination angle is relatively minor.

3.3. Energy Absorption Performance

The stress–strain curve can also reflect the energy absorption capacity of lattice structures. The energy absorbed by the material is calculated as the area enclosed between the stress–strain curve and the horizontal axis (i.e., the strain axis). To standardize the measurement, the specific formula is provided according to the ISO 13314:2011 standard as follows [31]:
W v = 0 ε σ ε d ε
In the formula, Wv represents the energy absorption per unit volume, σ denotes the compressive stress, and ε signifies the compressive strain.
The specific energy absorption (SEA) is defined as the energy absorbed per unit mass, as expressed by the following equation [32]:
S E A = U m
In the formula, U represents the energy absorbed by the lattice structure, and m denotes the mass of the lattice structure.
Table 5 and Figure 11 present the energy absorption and specific energy absorption of the specimens, respectively. The overall trends in energy absorption are consistent with those observed for specific compressive strength and specific plateau stress. Among the different lattice architectures, the OCT structure exhibits the highest performance, followed by FCC, while DIA and BCC structures show comparatively lower values. Energy absorption increases with strut diameter but decreases as the inclination angle increases. Specific energy absorption shows a similar pattern to total energy absorption; however, due to normalization by relative density, its variation range is less pronounced.

4. Discussion

4.1. Layered Deformation Behavior in Lattice Structures

During compression, a distinct layer-wise collapse phenomenon is observed in FCC and OCT lattice structures, characterized by a non-uniform sequential instability or failure mode. Unlike uniform deformation or catastrophic global collapse, the structure forms a series of nearly parallel “layers” perpendicular to the loading direction, which buckle or yield progressively. As exemplified by the FCC structure in compression experiments (as shown in Figure 9c and Figure 12), the bottom layer, bearing the direct load from the platen and the self-weight of upper layers, first reaches its yield strength and undergoes plastic deformation. With continued compression, stress is transferred to the middle layer after compaction of the bottom layer, driving sequential yielding of the middle and top layers, culminating in the full densification of the structure. The corresponding stress–strain curve exhibits three distinct regimes: first is the elastic regime (initial linear rise, corresponding to global elastic deformation of the lattice), then the fluctuating plateau regime (stress plateauing briefly after bottom layer yielding, followed by repeated fluctuations induced by the sequential yielding of middle and top layers, reflecting inter-layer stress transfer and localized failure), and last is the densification regime (steep stress rise and reduced strain rate after full compaction).
To elucidate the fluctuating characteristics of this layer-wise collapse, Kavan’s hardening–softening theory [33] is invoked as shown in Figure 13. The softening tendency originates from stress concentration at nodes, leading to abrupt failure (e.g., early node-dominated collapse in FCC with small strut diameters, resulting in a very short or absent plateau and a sharp stress drop). Conversely, the hardening tendency arises from stress dispersion along struts, triggering progressive tangential bending and strut self-contact without sudden stress release (e.g., during densification). Experimentally, FCC structures often exhibit alternating softening and hardening (Figure 12). For small strut diameters, early node-governed failure (softening-dominant) is followed by stress dispersion during compaction (hardening-dominant), collectively causing the complex stress fluctuations.
Furthermore, the severity of layer-wise collapse is strongly geometry-dependent. The inherent “face-centered strut network” topology of FCC lattices naturally concentrates stress at nodes, accelerating layered deformation initiation. Increasing the strut diameter alleviates nodal stress concentration by providing more material, resulting in uniform deformation. Conversely, increasing the strut inclination angle (making struts more vertical) intensifies nodal stress concentration, leading to more pronounced layer-wise failure. These parameters govern the sequence and amplitude of fluctuations in layer-wise collapse by modulating the degree of nodal stress concentration, revealing the coupled “topology-parameter-mechanical response” relationship for FCC lattices.
The failure modes of the lattice structures is also closely related to the energy absorption behavior. For example, structures exhibiting progressive layer-by-layer collapse (e.g., FCC and OCT) demonstrate a relatively broad and fluctuating plateau region, which contributes to higher energy absorption. In contrast, structures that fail more abruptly show limited plateau behavior and thus lower energy absorption capacity as shown in Figure 6 and Figure 11.
In summary, the core mechanism underlying the observed layer-wise collapse and its associated fluctuations in the FCC structure is rooted in the evolution of nodal stress concentration during deformation, which manifests as alternating softening and hardening behavior. Importantly, different lattice topologies (e.g., FCC, BCC, DIA, OCT) possess intrinsic differences in nodal connectivity and strut spatial orientation. These architectural distinctions give rise to varying susceptibility to stress concentration, distinct load transfer pathways, and different modes of structural instability, ultimately leading to divergent deformation behaviors and mechanical responses. Moreover, geometric parameters such as strut diameter and inclination angle directly influence the severity of layer-wise deformation and the characteristics of the stress–strain response—such as plateau stress and fluctuation amplitude—by substantially modifying local nodal stress concentrations.

4.2. Impact of Structural Design on Performance

4.2.1. Impact of Lattice Architecture on Performance

In this study, four strut-based lattice structures were designed, featuring similar topological characteristics between BCC/DIA and FCC/OCT configurations. It was observed that increasing the complexity of the lattice architecture (e.g., FCC and OCT) leads to higher relative density and improved compactness. These structural enhancements, in turn, elevate the elastic modulus and compressive strength, reduce the extent of the unstable stress regime, and promote earlier onset of densification. Among the constituent struts, those connected to face-centered nodes have a more pronounced impact on mechanical properties, while struts linked to body-centered nodes are crucial for force transmission between adjacent unit cells.
As shown in Figure 7, OCT exhibits significant performance enhancements over FCC and its elastic modulus, compressive strength, plateau stress, and energy absorption increase by 84.76%, 142.47%, 191.55%, and 206.07%, respectively. Corresponding specific properties, specific stiffness, specific plateau stress, and specific energy absorption, increase by 5.01%, 37.82%, 65.72%, and 73.97%, respectively. The higher elastic modulus of OCT primarily stems from the eight additional half-struts per unit cell connected to face-centered nodes along the z-axis, providing substantially enhanced vertical support. Furthermore, the greater structural complexity of OCT results in higher relative density and compactness under identical parameters, further augmenting its mechanical performance.
The BCC and DIA structures exhibit nearly identical performance, owing to their similar geometric configurations. At 35° inclination and 0.6 mm strut diameter, FCC exhibits significantly higher specific properties than BCC, and specific stiffness, specific strength, and specific plateau stress are elevated by 186.40%, 148.40%, and 88.10%, respectively. The fundamental difference between FCC and BCC/DIA lies in their strut connectivity types. Consistent with the literature [34], struts connected to face-centered nodes provide far stronger z-axis support than those connected to body-centered nodes. This disparity arises because body-centered struts exhibit smaller inclination angles relative to the base plane and greater lengths (resulting in higher aspect ratios). Consequently, these struts experience larger bending moments at their ends under load, promoting premature buckling instability and compromising their ability to maintain vertical structural stability.

4.2.2. Impact of Rod Diameter on Performance

As illustrated in Figure 8, the increase in strut diameter leads to higher relative density and enhanced structural compactness. This, in turn, improves deformation stability and uniformity while reducing layered deformation tendency, an effect particularly pronounced in bending-dominated structures. This improvement primarily stems from the mitigation of local stress concentration due to the larger strut diameter. The shift in deformation mechanism (from stretching-dominated to bending-dominated) profoundly influences the macroscopic mechanical response, manifested as a distinct change in the characteristic features of the stress–strain curve, a transition from a softening tendency (often exhibiting a yield peak and stress drop [35]) to a hardening tendency (akin to a strengthening phase). Taking the BCC structure with a 35° inclination angle as an example, when the strut diameter increases from 0.6 mm to 0.8 mm, the elastic modulus, compressive strength, plateau stress, and energy absorption increase by 145.64%, 152.47%, 150.25%, and 160.94%, respectively. The corresponding specific properties—specific stiffness, specific strength, specific plateau stress, and specific energy absorption—increase by 60.40%, 64.86%, 63.41%, and 70.39%, respectively. Further increasing the strut diameter from 0.8 mm to 1.0 mm results in continued significant growth across all metrics, and elastic modulus, compressive strength, plateau stress, and energy absorption increase by 110.17%, 113.85%, 123.99%, and 161.29%, respectively; while the specific stiffness, specific strength, specific plateau stress, and specific energy absorption increase by 54.78%, 57.49%, 64.96%, and 92.43%, respectively.

4.2.3. Impact of Inclination Angles on Performance

As illustrated in Figure 9, variations in the inclination angle significantly influence the relative density, geometric configuration of struts, and mechanical response of the lattice structure. Increasing the inclination angle reduces the relative density of the structure. Concurrently, it elongates the diagonal struts (increasing their slenderness ratio) and aligns their spatial orientation closer to the loading direction (z-axis). This geometric alteration amplifies the axial load component within the struts and intensifies stress concentration at the nodes, thereby markedly increasing the propensity for layered deformation. Macroscopically, these changes manifest as an extended non-steady-state stress region, reduced plateau stress, and diminished energy absorption capacity [36].
With increasing inclination angle, the efficiency of vertical load transfer improves, leading to a monotonic increase in Young’s modulus and specific stiffness across all lattice structures. For BCC and DIA architectures, although compressive strength decreases with greater inclination angles, specific strength increases. For example, in the BCC structure with a strut diameter of 1.0 mm, increasing the inclination angle from 35° to 55° results in a strength reduction of 18.60%, while the specific strength increases by 13.13%. In contrast, plateau stress, energy absorption, specific plateau stress, and specific energy absorption all exhibit monotonic decreases with increasing inclination. When the angle increases from 35° to 55°, plateau stress decreases by 43.96%, energy absorption by 50.47%, specific plateau stress by 22.12%, and specific energy absorption by 31.16%.
For OCT and FCC structures, the trends are more complex. As the inclination angle increases, compressive strength, plateau stress, and energy absorption consistently decline. However, specific strength, specific plateau stress, and specific energy absorption generally exhibit a non-monotonic trend—increasing initially and then decreasing. Taking the OCT structure with a strut diameter of 0.6 mm as an example: as the inclination angle increases from 35° to 45°, compressive strength decreases by 13.95%, plateau stress by 5.60%, and energy absorption by 6.87%; meanwhile, specific strength, specific plateau stress, and specific energy absorption increase by 7.73%, 18.17%, and 16.59%, respectively. Further increasing the angle from 45° to 55° leads to more substantial reductions: compressive strength drops by 30.37%, plateau stress by 31.40%, and energy absorption by 26.45%; specific strength, specific plateau stress, and specific energy absorption decline by 19.09%, 20.28%, and 14.53%, respectively.
This aforementioned behavior likely indicates a competition between structural degradation and reduced apparent density in specific performance. The 45° inclination likely enhances mechanical performance by promoting diagonal load transfer and reducing stress concentration at vertical nodes. This orientation also balances axial and shear stress components, enabling more uniform deformation. At an inclination angle of 45°, these opposing effects reach an optimal balance, yielding the highest values for specific strength, specific plateau stress, and specific energy absorption.

5. Conclusions

This study, based on laser powder bed fusion (LPBF) technology, four types of lattice structures (FCC, OCT, BCC, and DIA) with 36 variations in strut diameter and inclination angles, categorizing their unit cells into stretch-dominated and bending-dominated configurations. By systematically investigating the effects of architecture, inclination angle, and strut diameter variations on the deformation behavior and mechanical properties of these lattice structures, the following conclusions are drawn:
  • The combination of LPBF technology and Invar36 alloy demonstrates excellent compatibility, enabling the precise fabrication of lattice structures. This synergy retains the unique mechanical properties of Invar36 alloy lattice structures, such as being lightweight (lowest apparent density 0.714 g·cm−3 at DIA architecture with 55° inclination angle, 0.6 mm strut diameter), high stiffness (highest stiffness 3429.89 MPa at OCT structure with 55° inclination angle, 1.0 mm strut diameter), and high strength (highest strength 110.65 MPa at OCT structure with 35° inclination angle, 1.0 mm strut diameter).
  • The stress–strain curves during compression exhibit two distinct behaviors: hardening and softening trends. The hardening trend is predominantly observed in bending-dominated structures (BCC, DIA), where stress gradually increases with strain, struts progressively converge to form self-contact, and the deformation process remains stable. Conversely, the softening trend is more common in stretch-dominated structures (FCC, OCT), characterized by a rapid decline in stress after reaching a peak, localized structural failure due to stress concentration at nodes, and an unstable deformation process.
  • The mechanical properties of lattice structures based on Invar36 alloys are strongly influenced by their architectural configuration, strut diameter, and inclination angle. In general, the OCT structure demonstrates the highest mechanical performance, followed by FCC, with BCC and DIA structures exhibiting comparatively lower strength. Additionally, increasing the strut diameter significantly enhances mechanical properties. As the inclination angle increases, the deformation mode gradually shifts from stretch-dominated to bending-dominated behavior.

Author Contributions

Conceptualization, J.F. and K.H.; methodology, J.F.; validation, J.F., J.Y. and X.P.; formal analysis, J.F. and X.P.; investigation, J.F., J.Y. and X.P.; resources, K.H.; data curation, J.Y. and X.P.; writing—original draft preparation, J.F.; writing—review and editing, K.H., X.P. and G.H.; visualization, J.F. and J.Y.; supervision, K.H. and G.H.; project administration, K.H. and G.H.; funding acquisition, K.H. and G.H. All authors have read and agreed to the published version of the manuscript.

Funding

The research was financially supported by the Nuclear Power Institute of China (No. HG2024212) and the Sichuan University Joint Innovation Fund (No. HG2022173).

Data Availability Statement

The original contributions presented in this study are included in the article. Further inquiries can be directed to the corresponding author.

Conflicts of Interest

The authors declare that they have no known competing financial interests or personal relationships that could have appeared to influence the work reported in this paper. Gening He is employee of Nuclear Power Additive Manufacturing Key Laboratory of Sichuan Province, Nuclear Power Institute of China, who provided funding and teachnical support for the work. The funder had no role in the design of the study; in the collection, analysis, or interpretation of data, in the writing of the manuscript, or in the decision to publish the results.

References

  1. Cahn, R.W. An Unusual Nobel Prize. Notes Rec. R. Soc. 2005, 59, 145–153. [Google Scholar]
  2. Harner, L.L. Invar at 100 years. Adv. Mater. Process. 1997, 151, 31–34. [Google Scholar]
  3. Huang, G.; He, G.; Gong, X.; He, Y.; Liu, Y.; Huang, K. Additive manufacturing of Invar 36 alloy. J. Mater. Res. Technol. 2024, 30, 1241–1268. [Google Scholar]
  4. Sahoo, A.; Medicherla, V.R.R. Fe-Ni Invar alloys: A review. Mater. Today Proc. 2021, 43, 2242–2244. [Google Scholar]
  5. Chen, Y.; Wang, W.; Yang, Z.; Yan, J.; Chen, X.; Wang, R.; Ran, M. Microstructure and mechanical properties of B4C reinforced Invar 36 composites fabricated by laser powder bed fusion. Compos. Commun. 2025, 53, 102202. [Google Scholar]
  6. Bekir, A.; Mehmet, K.; Fuat, E. The puzzling thermal expansion behavior of invar alloys: A review on process-structure-property relationship. Crit. Rev. Solid State Mater. Sci. 2024, 49, 254–307. [Google Scholar]
  7. Chinchanikar, S.; Shaikh, A.A. A Review on Machine Learning, Big Data Analytics, and Design for Additive Manufacturing for Aerospace Applications. J. Mater. Eng. Perform. 2022, 31, 6112–6130. [Google Scholar]
  8. Ashby, M.F.; Evans, A.; Fleck, N.A.; Gibson, L.J.; Hutchinson, J.W.; Wadley, H.N.G.; Delale, F. Metal Foams: A Design Guide. Appl. Mech. Rev. 2001, 54, B105–B106. [Google Scholar]
  9. Ashby, M.F. The properties of foams and lattices, Philos. Trans. Ser. A Math. Phys. Eng. Sci. 2006, 364, 15–30. [Google Scholar]
  10. Abdulhadi, H.S.; Fadeel, A.; Alwattar, T.A.; Mian, A. Developing scaling laws to predict compressive mechanical properties and determine geometrical parameters of modified BCC lattice structures. Eng. Rep. 2022, 5, e12566. [Google Scholar]
  11. Li, N.; Pang, S.; Chen, S.; Liu, Y.; Aiyiti, W.; Chen, Z. Design and application of hybrid lattice metamaterial structures with high energy absorption and compressive resistance. J. Mater. Res. Technol. 2024, 33, 7100–7112. [Google Scholar]
  12. Park, S.J.; Lee, J.H.; Yang, J.; Heogh, W.; Kang, D.; Yeon, S.M.; Kim, S.H.; Hong, S.; Son, Y.; Park, J. Lightweight injection mold using additively manufactured Ti-6Al-4V lattice structures. J. Manuf. Process. 2022, 79, 759–766. [Google Scholar]
  13. Sun, Z.; Gong, Y.; Tian, Y.; Lang, J.; Zhang, J.; Zhao, L.; Hu, N. Design and mechanical properties of layered gradient lattice structures based on additive manufacturing. Addit. Manuf. Front. 2025, 4, 200188. [Google Scholar]
  14. Li, P.Y.; Ma, Y.E.; Sun, W.B.; Qian, X.; Zhang, W.; Wang, Z.H. Fracture and failure behavior of additive manufactured Ti6Al4V lattice structures under compressive load. Eng. Fract. Mech. 2021, 244, 107537. [Google Scholar]
  15. Kaur, M.; Yun, T.G.; Han, S.M.; Thomas, E.L.; Kim, W.S. 3D printed stretching-dominated micro-trusses. Mater. Des. 2017, 134, 272–280. [Google Scholar]
  16. Wu, Z.-J.; Li, F.-M.; Zhang, C. Vibration band-gap properties of three-dimensional Kagome lattices using the spectral element method. J. Sound Vib. 2015, 341, 162–173. [Google Scholar]
  17. Ataee, A.; Li, Y.; Fraser, D.; Song, G.; Wen, C. Anisotropic Ti-6Al-4V gyroid scaffolds manufactured by electron beam melting (EBM) for bone implant applications. Mater. Des. 2018, 137, 345–354. [Google Scholar]
  18. Campanelli, S.L.; Casalino, G.; Contuzzi, N.; Ludovico, A.D. Taguchi Optimization of the Surface Finish Obtained by Laser Ablation on Selective Laser Molten Steel Parts. Procedia CIRP 2013, 12, 462–467. [Google Scholar] [CrossRef]
  19. Wang, X.W.; Ho, J.Y.; Leong, K.C. An experimental investigation of single droplet impact cooling on hot enhanced surfaces fabricated by selective laser melting. Int. J. Heat Mass Transf. 2018, 120, 652–670. [Google Scholar]
  20. Huang, S.; Liu, H.; Du, L.; Gong, L.; Xie, Y.; Kong, Q.; Yao, Z. Effects of different post-processing temperatures on the microstructure and mechanical properties of TiC-Ni cermets fabricated by selective laser melting. Int. J. Refract. Met. Hard Mater. 2025, 128, 107097. [Google Scholar]
  21. Fu, J.; Li, H.; Song, X.; Fu, M.W. Multi-scale defects in powder-based additively manufactured metals and alloys. J. Mater. Sci. Technol. 2022, 122, 165–199. [Google Scholar]
  22. Chen, W.; Yang, J.; Kong, H.; Helou, M.; Zhang, D.; Zhao, J.; Jia, W.; Liu, Q.; He, P.; Li, X. Fatigue behaviour and biocompatibility of additively manufactured bioactive tantalum graded lattice structures for load-bearing orthopaedic applications. Mater. Sci. Eng. C 2021, 130, 112461. [Google Scholar]
  23. Xiao, Z.; Yu, W.; Fu, H.; Deng, Y.; Wu, Y.; Zheng, H. Recent progress on microstructure manipulation of aluminium alloys manufactured via laser powder bed fusion. Virtual Phys. Prototyp. 2023, 18, e2125880. [Google Scholar] [CrossRef]
  24. Jing, C.; Zhu, Y.; Wang, J.; Wang, F.; Lu, J.; Liu, C. Investigation on Morphology and Mechanical Properties of Rod Units in Lattice Structures Fabricated by Selective Laser Melting. Materials 2021, 14, 3994. [Google Scholar] [CrossRef]
  25. Han, Z.; Guo, F.; Zhang, Q.; Wen, W.; Yu, G. Numerical Simulation and Experimental Analysis of Compressive Mechanical Properties of Metal Material Lattice for Additive Manufacturing. In Proceedings of the IEEE 18th Conference on Industrial Electronics and Applications (ICIEA), Ningbo, China, 18–22 August 2023; pp. 733–738. [Google Scholar]
  26. He, G.; Peng, X.; Zhou, H.; Huang, G.; Xie, Y.; He, Y.; Liu, H.; Huang, K. Superior Mechanical Properties of Invar36 Alloy Lattices Structures Manufactured by Laser Powder Bed Fusion. Materials 2023, 16, 4433. [Google Scholar] [CrossRef]
  27. Huang, G.; He, G.; Peng, X.; He, Y.; Chen, H.; Huang, K.; Liu, Y. Effect of processing parameters on the microstructure, mechanical properties and thermal expansion behavior of Invar 36 alloy manufactured by laser powder bed fusion. Mater. Sci. Eng. A 2024, 897, 146329. [Google Scholar] [CrossRef]
  28. Huang, G.; He, G.; Liu, Y.; Huang, K. Anisotropy of microstructure, mechanical properties and thermal expansion in Invar 36 alloy fabricated via laser powder bed fusion. Addit. Manuf. 2024, 82, 104025. [Google Scholar]
  29. ISO 13314:2011; Mechanical Testing of Metals. Ductility Testing. Compression Test for Porous and Cellular Metals. ISO: Geneva, Switzerland, 2012.
  30. Deshpande, V.S.; Ashby, M.F.; Fleck, N.A. Foam topology: Bending versus stretching dominated architectures. Acta Mater. 2001, 49, 1035–1040. [Google Scholar]
  31. Miltz, J.; Gruenbaum, G. Evaluation of Cushioning Properties of Plastic Foams from Compressive Measurements. Polym. Eng. Sci. 1981, 21, 1010–1014. [Google Scholar]
  32. Chen, W.; Nardhi, D. Experimental study of crush behaviour of sheet aluminium foam-filled sections. Int. J. Crashworthiness 2000, 5, 447–468. [Google Scholar] [CrossRef]
  33. Hazeli, K.; Babamiri, B.B.; Indeck, J.; Minor, A.; Askari, H. Microstructure-topology relationship effects on the quasi-static and dynamic behavior of additively manufactured lattice structures. Mater. Des. 2019, 176, 107826. [Google Scholar]
  34. Hairi, Z.; Hao, Z.; Zuoxin, Z.; Huizhong, Z.; Xiaoyu, Z.; Jianzhong, Y.; Hongshuai, L.; Fusheng, H. Energy absorption diagram characteristic of metallic self-supporting 3D lattices fabricated by additive manufacturing and design method of energy absorption structure. Int. J. Solids Struct. 2021, 226–227, 111082. [Google Scholar]
  35. Geng, X.; Lu, Y.; Liu, C.; Li, W.; Yue, Z. Fracture characteristic analysis of cellular lattice structures under tensile load. Int. J. Solids Struct. 2019, 163, 170–177. [Google Scholar] [CrossRef]
  36. Huang, Y.; Xue, Y.; Wang, X.; Han, F. Mechanical behavior of three-dimensional pyramidal aluminum lattice materials. Mater. Sci. Eng. A 2017, 696, 520–528. [Google Scholar] [CrossRef]
Figure 1. (a) Morphology of Invar36 powder, (b) particle size distribution.
Metals 15 00773 g001
Figure 2. Thirty-six designs of lattice structure.
Metals 15 00773 g002
Figure 3. Metallographic images of the sample pillar and macro photographs of the lattice structural sample in different directions: (a) before etching, (b) after etching.
Metals 15 00773 g003
Figure 4. Actual FCC lattice structure specimens with 0.6 mm, 0.8 mm, and 1.0 mm strut diameter.
Metals 15 00773 g004
Figure 5. The deformation process of four structures (BCC, DIA, FCC, and OCT) under a rod diameter of 1.0 mm and an inclination angle of 55°.
Metals 15 00773 g005
Figure 6. Stress–strain curves of different structures: (a) BCC, (b) DIA, (c) FCC, (d) OCT.
Metals 15 00773 g006
Figure 7. Stress–strain curves of structures with the same 35° inclination angle at different strut diameter condition: (a) 0.6 mm, (b) 0.8 mm, (c) 1.0 mm.
Metals 15 00773 g007
Figure 8. Stress–strain curves of structures with the same inclination angle 35°at different rod diameters: (a) BCC, (b) DIA, (c) FCC, (d) OCT.
Metals 15 00773 g008
Figure 9. Stress–strain curves of structures with the same strut diameter at different inclination angles: (a) BCC, (b) OCT, (c) FCC, (d) DIA.
Metals 15 00773 g009
Figure 10. Performance parameters of lattice structures: (a) elastic modulus, (b) compressive strength, (c) plateau stress, (d) specific stiffness, (e) specific strength, (f) specific plateau stress.
Metals 15 00773 g010
Figure 11. (a) Energy absorption, (b) and specific energy absorption of lattice structures.
Metals 15 00773 g011
Figure 12. Deformation of FCC structures at a 55° inclination under different rod diameters.
Metals 15 00773 g012
Figure 13. Different stress–strain curve trends: (a) represents a softening trend; (b) represents a hardening trend. Reprinted from Ref. [33].
Metals 15 00773 g013
Table 1. Chemical composition of Invar36 alloy powder.
ElementsCSiMnPNiSCrCoO
wt.%0.0110.130.290.00435.80.0020.0050.030.000284
Table 2. The apparent density and relative density of the sample.
StructureDip AngleStem Diameter (mm)Apparent Density (g·cm−3)Relative Density
BCC35°0.61.124 19.28%
0.81.722 30.96%
1.02.338 46.17%
45°0.60.848 13.89%
0.81.377 24.51%
1.01.946 38.81%
55°0.60.715 11.57%
0.81.158 19.97%
1.01.682 32.41%
DIA35°0.61.121 19.28%
0.81.731 30.96%
1.02.420 45.56%
45°0.60.852 14.30%
0.81.368 24.92%
1.01.934 35.95%
55°0.60.714 11.57%
0.81.169 19.39%
1.01.727 27.49%
FCC35°0.61.408 26.87%
0.82.068 38.53%
1.02.903 51.34%
45°0.61.077 20.83%
0.81.663 31.45%
1.02.342 42.48%
55°0.60.925 16.49%
0.81.428 24.88%
1.02.002 32.41%
OCT35°0.62.477 42.64%
0.83.832 59.58%
1.04.863 70.68%
45°0.61.978 35.13%
0.83.010 49.02%
1.04.049 60.87%
55°0.61.703 31.54%
0.82.504 44.56%
1.03.575 56.08%
Table 3. Elastic modulus, compressive strength, and plateau stress of the lattice structures.
StructureDip AngleRod Diameter (mm)Elastic Modulus (MPa)Compressive Strength (MPa)Plateau Stress (MPa)
BCC35°0.6157.854.466.03
0.8387.7511.2615.09
1.0814.9224.0833.80
45°0.6182.893.704.35
0.8394.2610.2911.41
1.0773.6720.9924.32
55°0.6194.933.163.06
0.8487.259.218.42
1.0834.2419.6018.94
DIA35°0.6144.505.106.52
0.8372.1612.3316.62
1.0907.3826.2237.24
45°0.6161.183.804.56
0.8382.979.4611.56
1.0899.4619.9224.53
55°0.6183.843.393.50
0.8467.538.929.06
1.01193.2619.4020.30
FCC35°0.6565.9913.8714.20
0.81141.0430.4433.28
1.01615.8352.4071.26
45°0.6836.9712.7410.47
0.81420.4229.0525.09
1.01900.6651.3355.16
55°0.6888.1911.015.58
0.81430.4022.7216.07
1.02049.9240.6535.87
OCT35°0.61045.7033.6341.40
0.81994.1668.0596.52
1.02525.92110.65162.26
45°0.61697.7828.9439.08
0.82139.0859.0083.20
1.03285.6594.07142.03
55°0.61803.1820.1526.81
0.82536.1428.9663.63
1.03429.8954.01129.12
Table 4. Specific stiffness, specific compressive stress, and specific plateau stress of lattice structures.
StructureDip AngleRod Diameter (mm)Specific Stiffness (MPa/g·cm−3)Specific Compressive Stress (MPa/g·cm−3)Specific Plateau Stress (MPa/g·cm−3)
BCC35°0.6140.38 3.97 5.36
0.8225.18 6.54 8.76
1.0348.52 10.30 14.46
45°0.6215.77 4.37 5.13
0.8286.22 7.47 8.28
1.0397.64 10.79 12.50
55°0.6272.74 4.42 4.28
0.8420.67 7.95 7.27
1.0495.89 11.65 11.26
DIA35°0.6128.85 4.55 5.81
0.8214.96 7.12 9.60
1.0374.95 10.83 15.39
45°0.6189.15 4.46 5.35
0.8280.02 6.92 8.45
1.0465.02 10.30 12.68
55°0.6257.33 4.75 4.90
0.8399.95 7.63 7.75
1.0690.77 11.23 11.75
FCC35°0.6402.06 9.85 10.09
0.8551.67 14.72 16.09
1.0556.60 18.05 24.55
45°0.6776.98 11.83 9.72
0.8854.14 17.47 15.09
1.0811.44 21.91 23.55
55°0.6960.06 11.90 6.03
0.81001.39 15.91 11.25
1.01023.92 20.30 17.92
OCT35°0.6422.23 13.58 16.72
0.8520.43 17.76 25.19
1.0519.44 22.75 33.37
45°0.6858.18 14.63 19.75
0.8710.70 19.60 27.64
1.0811.55 23.24 35.08
55°0.61059.11 11.84 15.75
0.81012.69 11.56 25.41
1.0959.43 15.11 36.12
Table 5. Energy adsorption and specific energy adsorption of lattice structures.
StructureDip AngleStem Diameter (mm)Energy Absorption
(mJ/mm3)
Specific Energy Adsorption (J/g)
BCC35°0.62.972.64
0.87.754.50
1.020.258.66
45°0.62.192.58
0.85.724.15
1.012.086.21
55°0.61.622.27
0.84.493.88
1.010.035.96
DIA35°0.63.132.79
0.88.554.94
1.023.439.68
45°0.62.242.63
0.85.764.21
1.012.416.42
55°0.61.772.48
0.84.663.99
1.010.626.15
FCC35°0.66.424.56
0.816.507.98
1.036.8212.68
45°0.64.444.12
0.812.517.52
1.028.0111.96
55°0.62.813.04
0.87.955.57
1.017.578.78
OCT35°0.619.657.93
0.848.7512.72
1.078.2216.09
45°0.618.309.25
0.839.8913.25
1.070.3717.38
55°0.613.467.91
0.830.5112.18
1.058.6616.41
Disclaimer/Publisher’s Note: The statements, opinions and data contained in all publications are solely those of the individual author(s) and contributor(s) and not of MDPI and/or the editor(s). MDPI and/or the editor(s) disclaim responsibility for any injury to people or property resulting from any ideas, methods, instructions or products referred to in the content.

